GuideStar Nonprofit Compensation Report · GuideStar Nonprofit Compensation Report | Page 2 of 4893...
32
GuideStar Nonprofit Compensation Report 19th edition | September 2019
Transcript of GuideStar Nonprofit Compensation Report · GuideStar Nonprofit Compensation Report | Page 2 of 4893...
GuideStar Nonprofit Compensation Report19th edition | September 2019
GuideStar Nonprofit Compensation Report | Page 2 of 4893
Foreword In February 2019, GuideStar and Foundation Center joined forces to form a new organization, Candid. Candid’s mission is to get people the information they need to do good. You can learn more at candid.org.
GuideStar’s database, website, and tools are now services of Candid. Visitors still access information on more than 2.8 million U.S. nonprofit organizations at guidestar.org. They still use free and fee-based products to get the nonprofit data they need. And they can use this new edition of the GuideStar Nonprofit Compensation Report to benchmark and research nonprofit executive compensation.
The 2019 GuideStar Nonprofit Compensation Report reviews key employee compensation at more than 113,000 nonprofit organizations. It relies exclusively upon data derived from the GuideStar database of digitized IRS Form 990 and 990-EZ information.
© 2019 by Candid
All rights reserved. No part of this report may be reproduced in any form without written
permission of Candid.
Candid
32 Old Slip 24th Floor
New York, NY 10005 USA
candid.org
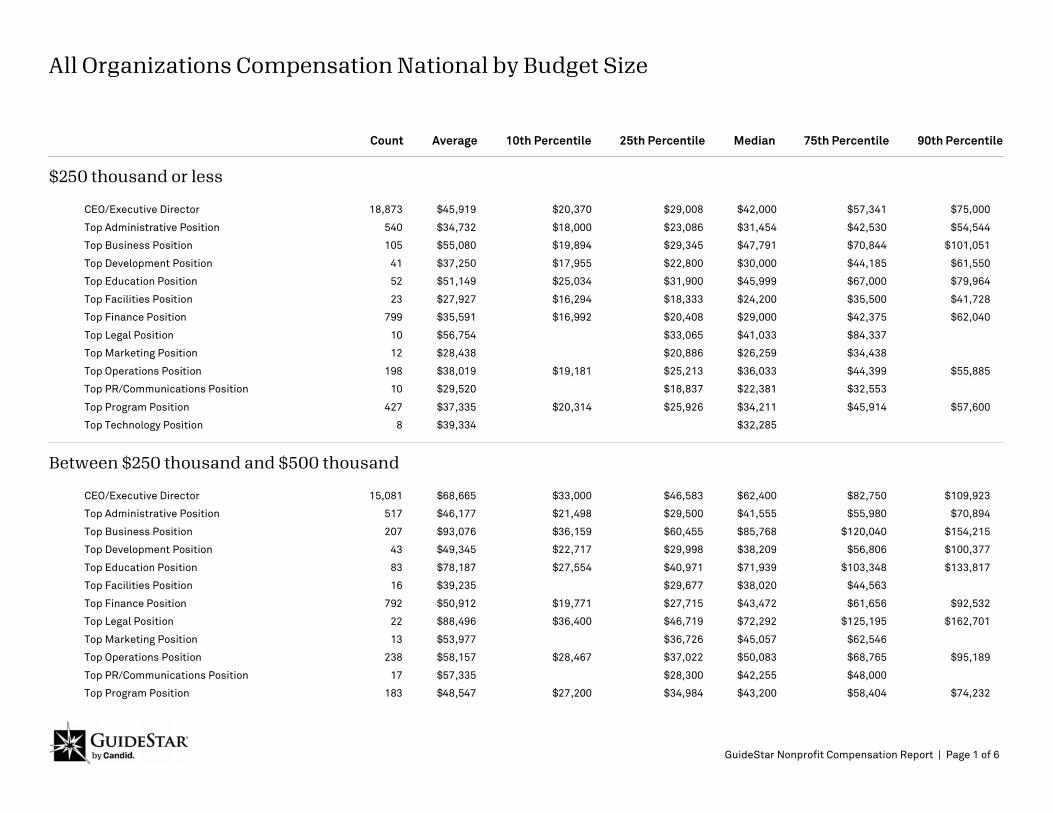
Count Average 10th Percentile 25th Percentile Median 75th Percentile 90th Percentile
All Organizations Compensation National by Budget Size
$250 thousand or less
18,873 $45,919 $20,370 $29,008 $42,000 $57,341 $75,000CEO/Executive Director
540 $34,732 $18,000 $23,086 $31,454 $42,530 $54,544Top Administrative Position
105 $55,080 $19,894 $29,345 $47,791 $70,844 $101,051Top Business Position
41 $37,250 $17,955 $22,800 $30,000 $44,185 $61,550Top Development Position
52 $51,149 $25,034 $31,900 $45,999 $67,000 $79,964Top Education Position
23 $27,927 $16,294 $18,333 $24,200 $35,500 $41,728Top Facilities Position
799 $35,591 $16,992 $20,408 $29,000 $42,375 $62,040Top Finance Position
10 $56,754 $33,065 $41,033 $84,337Top Legal Position
12 $28,438 $20,886 $26,259 $34,438Top Marketing Position
198 $38,019 $19,181 $25,213 $36,033 $44,399 $55,885Top Operations Position
10 $29,520 $18,837 $22,381 $32,553Top PR/Communications Position
427 $37,335 $20,314 $25,926 $34,211 $45,914 $57,600Top Program Position
8 $39,334 $32,285Top Technology Position
Between $250 thousand and $500 thousand
15,081 $68,665 $33,000 $46,583 $62,400 $82,750 $109,923CEO/Executive Director
517 $46,177 $21,498 $29,500 $41,555 $55,980 $70,894Top Administrative Position
207 $93,076 $36,159 $60,455 $85,768 $120,040 $154,215Top Business Position
43 $49,345 $22,717 $29,998 $38,209 $56,806 $100,377Top Development Position
83 $78,187 $27,554 $40,971 $71,939 $103,348 $133,817Top Education Position
16 $39,235 $29,677 $38,020 $44,563Top Facilities Position
792 $50,912 $19,771 $27,715 $43,472 $61,656 $92,532Top Finance Position
22 $88,496 $36,400 $46,719 $72,292 $125,195 $162,701Top Legal Position
13 $53,977 $36,726 $45,057 $62,546Top Marketing Position
238 $58,157 $28,467 $37,022 $50,083 $68,765 $95,189Top Operations Position
17 $57,335 $28,300 $42,255 $48,000Top PR/Communications Position
183 $48,547 $27,200 $34,984 $43,200 $58,404 $74,232Top Program Position
GuideStar Nonprofit Compensation Report | Page 1 of 6
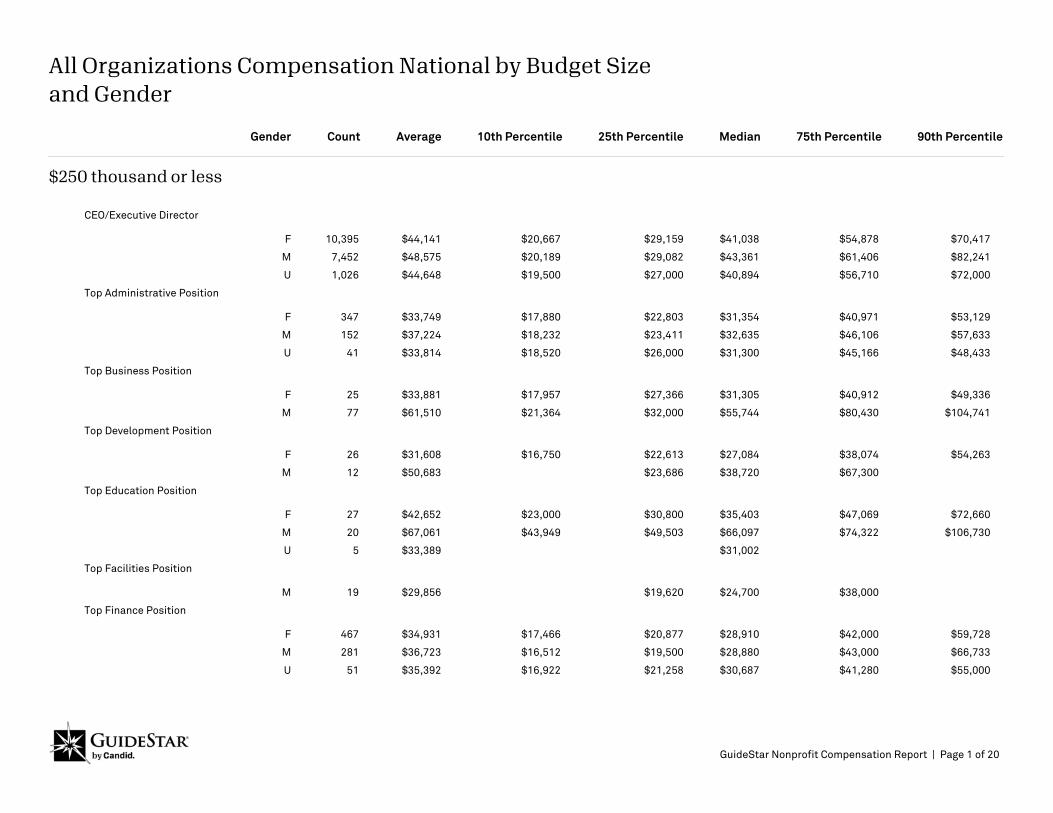
Count Average 10th Percentile 25th Percentile Median 75th Percentile 90th Percentile
All Organizations Compensation National by Budget Size and Gender
Gender
$250 thousand or less
CEO/Executive Director
10,395 $44,141 $20,667 $29,159 $41,038 $54,878 $70,417F
7,452 $48,575 $20,189 $29,082 $43,361 $61,406 $82,241M
1,026 $44,648 $19,500 $27,000 $40,894 $56,710 $72,000U
Top Administrative Position
347 $33,749 $17,880 $22,803 $31,354 $40,971 $53,129F
152 $37,224 $18,232 $23,411 $32,635 $46,106 $57,633M
41 $33,814 $18,520 $26,000 $31,300 $45,166 $48,433U
Top Business Position
25 $33,881 $17,957 $27,366 $31,305 $40,912 $49,336F
77 $61,510 $21,364 $32,000 $55,744 $80,430 $104,741M
Top Development Position
26 $31,608 $16,750 $22,613 $27,084 $38,074 $54,263F
12 $50,683 $23,686 $38,720 $67,300M
Top Education Position
27 $42,652 $23,000 $30,800 $35,403 $47,069 $72,660F
20 $67,061 $43,949 $49,503 $66,097 $74,322 $106,730M
5 $33,389 $31,002U
Top Facilities Position
19 $29,856 $19,620 $24,700 $38,000M
Top Finance Position
467 $34,931 $17,466 $20,877 $28,910 $42,000 $59,728F
281 $36,723 $16,512 $19,500 $28,880 $43,000 $66,733M
51 $35,392 $16,922 $21,258 $30,687 $41,280 $55,000U
GuideStar Nonprofit Compensation Report | Page 1 of 20
Count Average 10th Percentile 25th Percentile Median 90th Percentile
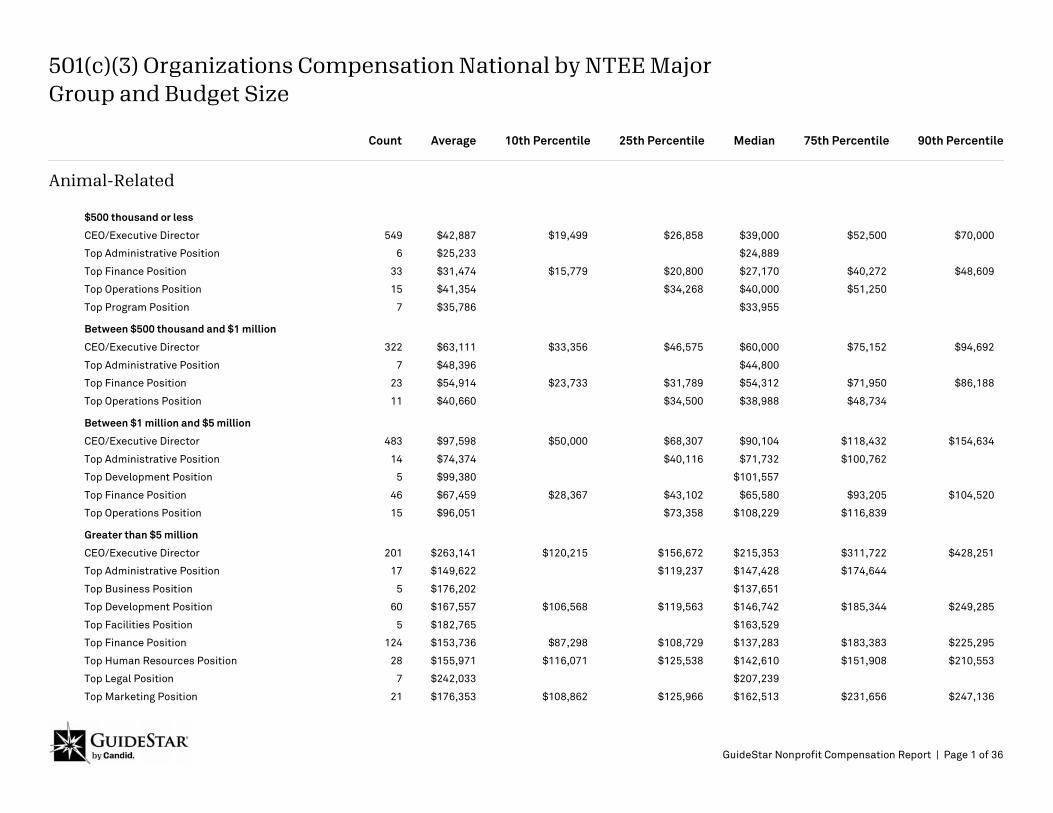
501(c)(3) Organizations Compensation National by NTEE Major Group and Budget Size
75th Percentile
Animal-Related
$500 thousand or less
549 $42,887 $19,499 $26,858 $39,000 $70,000CEO/Executive Director $52,500
6 $25,233 $24,889Top Administrative Position
33 $31,474 $15,779 $20,800 $27,170 $48,609Top Finance Position $40,272
15 $41,354 $34,268 $40,000Top Operations Position $51,250
7 $35,786 $33,955Top Program Position
Between $500 thousand and $1 million
322 $63,111 $33,356 $46,575 $60,000 $94,692CEO/Executive Director $75,152
7 $48,396 $44,800Top Administrative Position
23 $54,914 $23,733 $31,789 $54,312 $86,188Top Finance Position $71,950
11 $40,660 $34,500 $38,988Top Operations Position $48,734
Between $1 million and $5 million
483 $97,598 $50,000 $68,307 $90,104 $154,634CEO/Executive Director $118,432
14 $74,374 $40,116 $71,732Top Administrative Position $100,762
5 $99,380 $101,557Top Development Position
46 $67,459 $28,367 $43,102 $65,580 $104,520Top Finance Position $93,205
15 $96,051 $73,358 $108,229Top Operations Position $116,839
Greater than $5 million
201 $263,141 $120,215 $156,672 $215,353 $428,251CEO/Executive Director $311,722
17 $149,622 $119,237 $147,428Top Administrative Position $174,644
5 $176,202 $137,651Top Business Position
60 $167,557 $106,568 $119,563 $146,742 $249,285Top Development Position $185,344
5 $182,765 $163,529Top Facilities Position
124 $153,736 $87,298 $108,729 $137,283 $225,295Top Finance Position $183,383
28 $155,971 $116,071 $125,538 $142,610 $210,553Top Human Resources Position $151,908
7 $242,033 $207,239Top Legal Position
21 $176,353 $108,862 $125,966 $162,513 $247,136Top Marketing Position $231,656
GuideStar Nonprofit Compensation Report | Page 1 of 36
Count Average 10th Percentile 25th Percentile Median 75th Percentile 90th Percentile
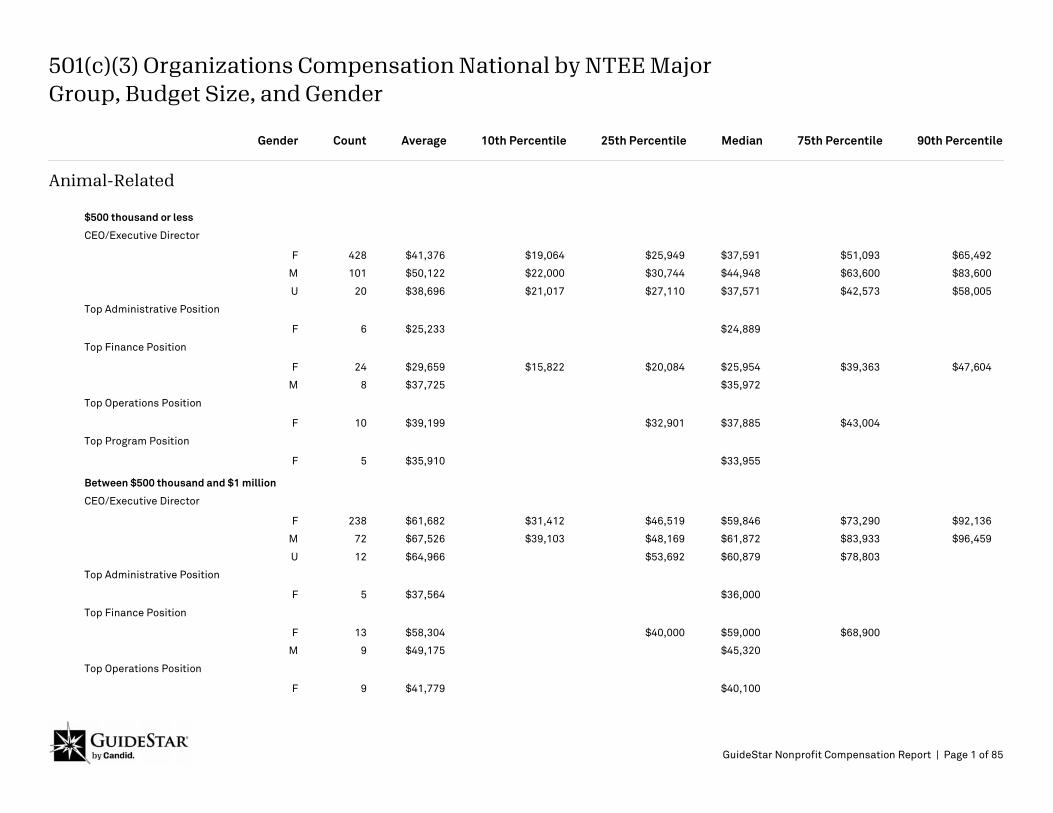
501(c)(3) Organizations Compensation National by NTEE Major Group, Budget Size, and Gender
Gender
Animal-Related
$500 thousand or less
CEO/Executive Director
428 $41,376 $19,064 $25,949 $37,591 $51,093 $65,492F
101 $50,122 $22,000 $30,744 $44,948 $63,600 $83,600M
20 $38,696 $21,017 $27,110 $37,571 $42,573 $58,005U
Top Administrative Position
6 $25,233 $24,889F
Top Finance Position
24 $29,659 $15,822 $20,084 $25,954 $39,363 $47,604F
8 $37,725 $35,972M
Top Operations Position
10 $39,199 $32,901 $37,885 $43,004F
Top Program Position
5 $35,910 $33,955F
Between $500 thousand and $1 million
CEO/Executive Director
238 $61,682 $31,412 $46,519 $59,846 $73,290 $92,136F
72 $67,526 $39,103 $48,169 $61,872 $83,933 $96,459M
12 $64,966 $53,692 $60,879 $78,803U
Top Administrative Position
5 $37,564 $36,000F
Top Finance Position
13 $58,304 $40,000 $59,000 $68,900F
9 $49,175 $45,320M
Top Operations Position
9 $41,779 $40,100F
GuideStar Nonprofit Compensation Report | Page 1 of 85
Count Average 10th Percentile 25th Percentile Median 75th Percentile 90th Percentile
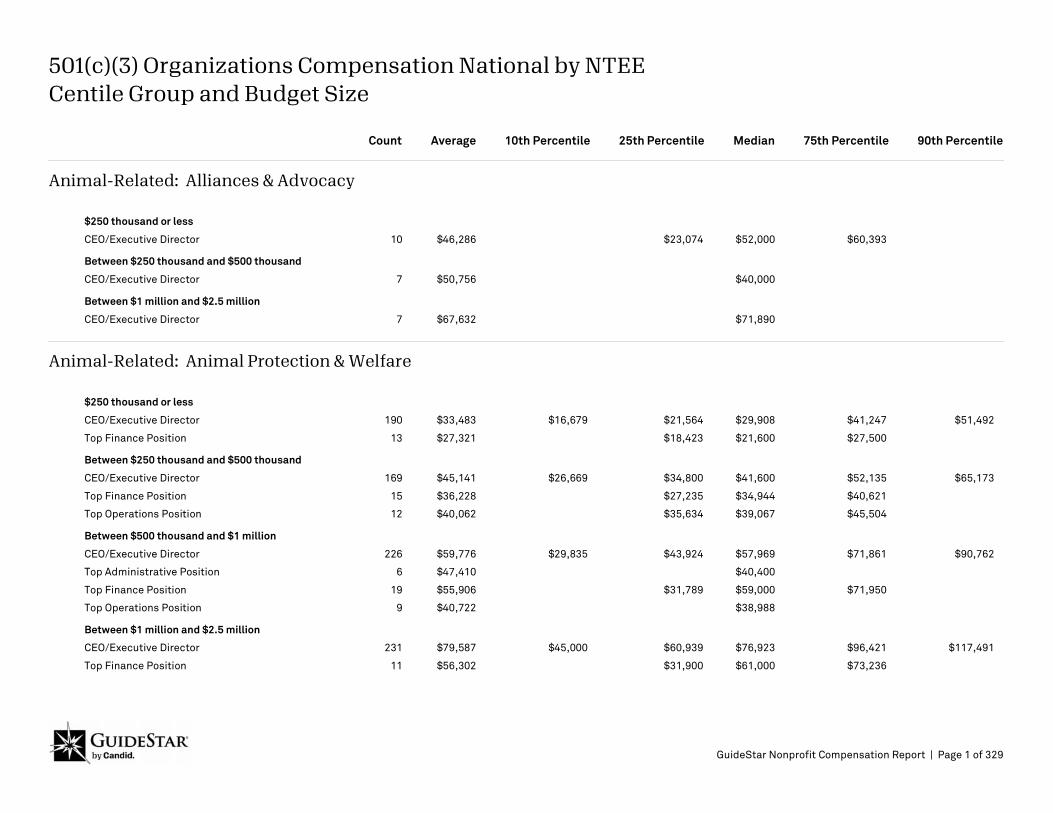
501(c)(3) Organizations Compensation National by NTEE Centile Group and Budget Size
Animal-Related: Alliances & Advocacy
$250 thousand or less
10 $46,286 $23,074 $52,000 $60,393CEO/Executive Director
Between $250 thousand and $500 thousand
7 $50,756 $40,000CEO/Executive Director
Between $1 million and $2.5 million
7 $67,632 $71,890CEO/Executive Director
Animal-Related: Animal Protection & Welfare
$250 thousand or less
190 $33,483 $16,679 $21,564 $29,908 $41,247 $51,492CEO/Executive Director
13 $27,321 $18,423 $21,600 $27,500Top Finance Position
Between $250 thousand and $500 thousand
169 $45,141 $26,669 $34,800 $41,600 $52,135 $65,173CEO/Executive Director
15 $36,228 $27,235 $34,944 $40,621Top Finance Position
12 $40,062 $35,634 $39,067 $45,504Top Operations Position
Between $500 thousand and $1 million
226 $59,776 $29,835 $43,924 $57,969 $71,861 $90,762CEO/Executive Director
6 $47,410 $40,400Top Administrative Position
19 $55,906 $31,789 $59,000 $71,950Top Finance Position
9 $40,722 $38,988Top Operations Position
Between $1 million and $2.5 million
231 $79,587 $45,000 $60,939 $76,923 $96,421 $117,491CEO/Executive Director
11 $56,302 $31,900 $61,000 $73,236Top Finance Position
GuideStar Nonprofit Compensation Report | Page 1 of 329
Count Average 25th Percentile Median 75th Percentile 90th Percentile
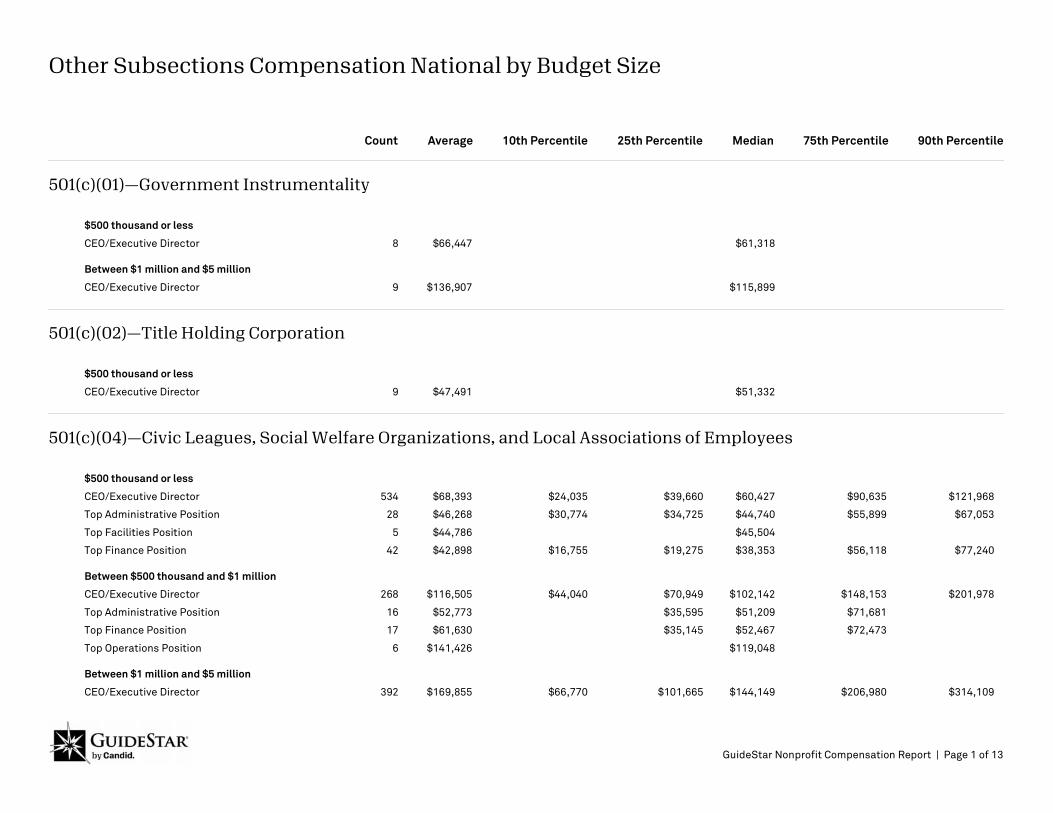
Other Subsections Compensation National by Budget Size
10th Percentile
501(c)(01)—Government Instrumentality
$500 thousand or less
8 $66,447 $61,318CEO/Executive Director
Between $1 million and $5 million
9 $136,907 $115,899CEO/Executive Director
501(c)(02)—Title Holding Corporation
$500 thousand or less
9 $47,491 $51,332CEO/Executive Director
501(c)(04)—Civic Leagues, Social Welfare Organizations, and Local Associations of Employees
$500 thousand or less
534 $68,393 $39,660 $60,427 $90,635 $121,968CEO/Executive Director $24,035
28 $46,268 $34,725 $44,740 $55,899 $67,053Top Administrative Position $30,774
5 $44,786 $45,504Top Facilities Position
42 $42,898 $19,275 $38,353 $56,118 $77,240Top Finance Position $16,755
Between $500 thousand and $1 million
268 $116,505 $70,949 $102,142 $148,153 $201,978CEO/Executive Director $44,040
16 $52,773 $35,595 $51,209 $71,681Top Administrative Position
17 $61,630 $35,145 $52,467 $72,473Top Finance Position
6 $141,426 $119,048Top Operations Position
Between $1 million and $5 million
392 $169,855 $101,665 $144,149 $206,980 $314,109CEO/Executive Director $66,770
GuideStar Nonprofit Compensation Report | Page 1 of 13
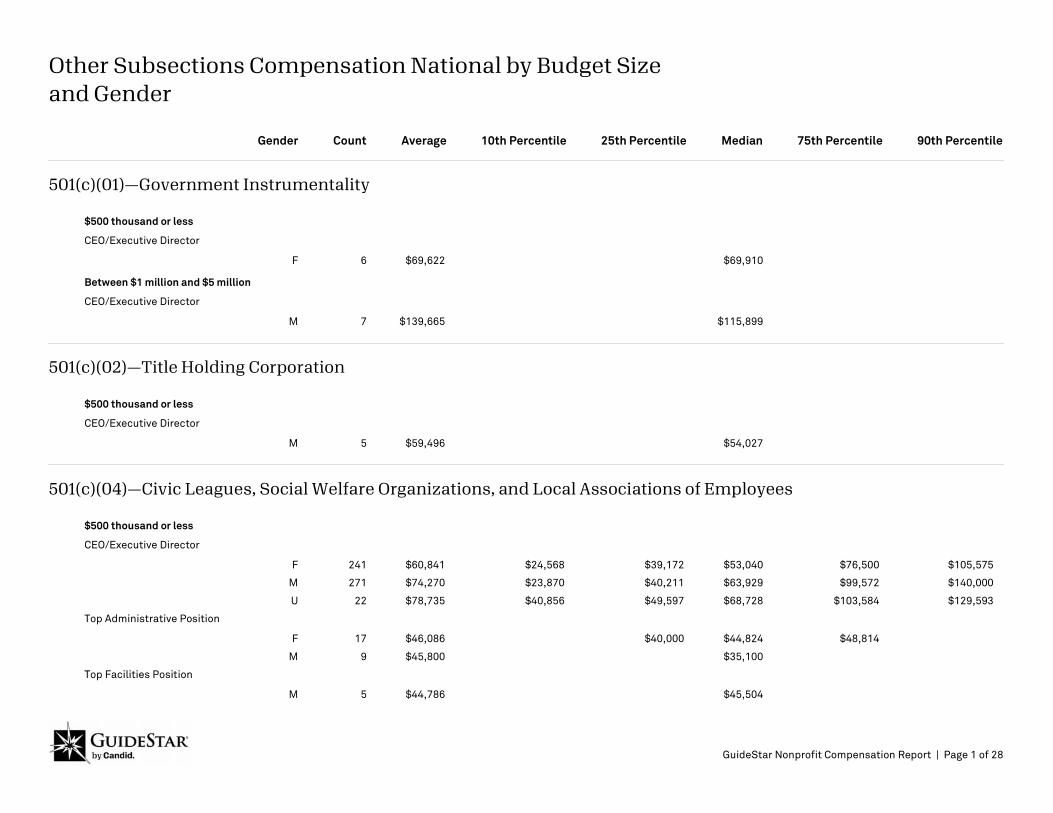
Count Average 10th Percentile 25th Percentile Median 75th Percentile 90th Percentile
Other Subsections Compensation National by Budget Size and Gender
Gender
501(c)(01)—Government Instrumentality
$500 thousand or less
CEO/Executive Director
6 $69,622 $69,910F
Between $1 million and $5 million
CEO/Executive Director
7 $139,665 $115,899M
501(c)(02)—Title Holding Corporation
$500 thousand or less
CEO/Executive Director
5 $59,496 $54,027M
501(c)(04)—Civic Leagues, Social Welfare Organizations, and Local Associations of Employees
$500 thousand or less
CEO/Executive Director
241 $60,841 $24,568 $39,172 $53,040 $76,500 $105,575F
271 $74,270 $23,870 $40,211 $63,929 $99,572 $140,000M
22 $78,735 $40,856 $49,597 $68,728 $103,584 $129,593U
Top Administrative Position
17 $46,086 $40,000 $44,824 $48,814F
9 $45,800 $35,100M
Top Facilities Position
5 $44,786 $45,504M
GuideStar Nonprofit Compensation Report | Page 1 of 28
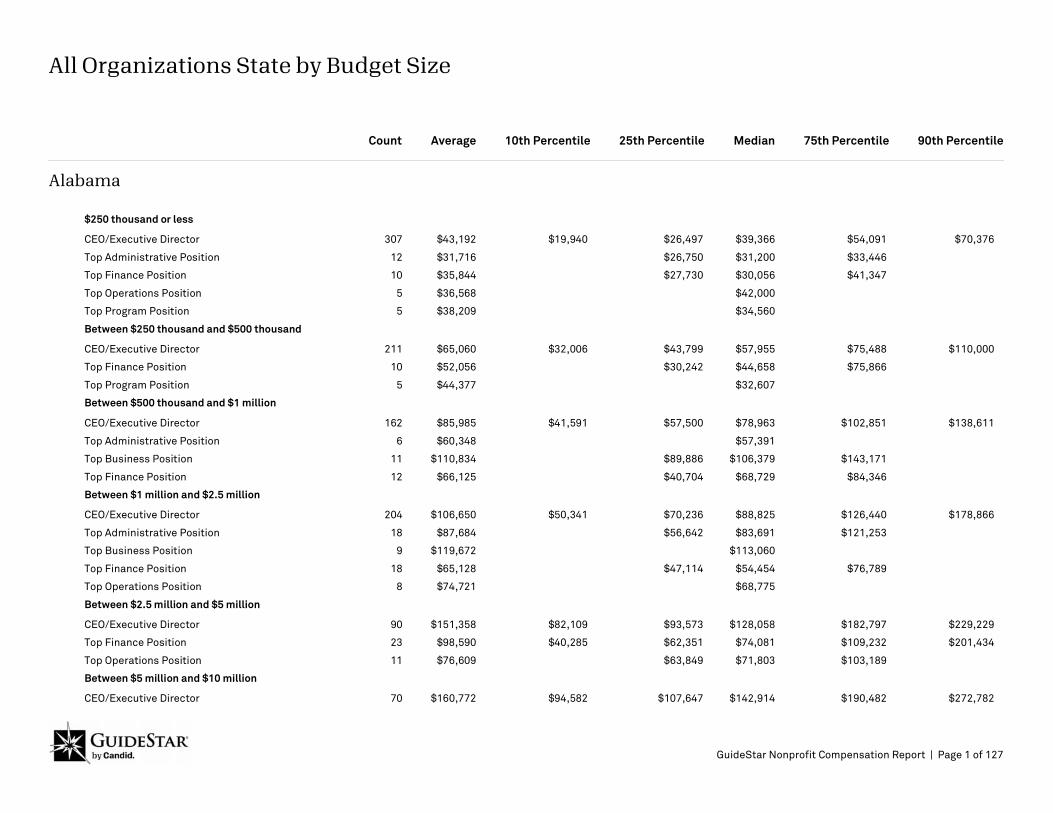
Count Average 10th Percentile 25th Percentile Median 75th Percentile 90th Percentile
All Organizations State by Budget Size
Alabama
$250 thousand or less
307 $43,192 $19,940 $26,497 $39,366 $54,091 $70,376CEO/Executive Director
12 $31,716 $26,750 $31,200 $33,446Top Administrative Position
10 $35,844 $27,730 $30,056 $41,347Top Finance Position
5 $36,568 $42,000Top Operations Position
5 $38,209 $34,560Top Program Position
Between $250 thousand and $500 thousand
211 $65,060 $32,006 $43,799 $57,955 $75,488 $110,000CEO/Executive Director
10 $52,056 $30,242 $44,658 $75,866Top Finance Position
5 $44,377 $32,607Top Program Position
Between $500 thousand and $1 million
162 $85,985 $41,591 $57,500 $78,963 $102,851 $138,611CEO/Executive Director
6 $60,348 $57,391Top Administrative Position
11 $110,834 $89,886 $106,379 $143,171Top Business Position
12 $66,125 $40,704 $68,729 $84,346Top Finance Position
Between $1 million and $2.5 million
204 $106,650 $50,341 $70,236 $88,825 $126,440 $178,866CEO/Executive Director
18 $87,684 $56,642 $83,691 $121,253Top Administrative Position
9 $119,672 $113,060Top Business Position
18 $65,128 $47,114 $54,454 $76,789Top Finance Position
8 $74,721 $68,775Top Operations Position
Between $2.5 million and $5 million
90 $151,358 $82,109 $93,573 $128,058 $182,797 $229,229CEO/Executive Director
23 $98,590 $40,285 $62,351 $74,081 $109,232 $201,434Top Finance Position
11 $76,609 $63,849 $71,803 $103,189Top Operations Position
Between $5 million and $10 million
70 $160,772 $94,582 $107,647 $142,914 $190,482 $272,782CEO/Executive Director
GuideStar Nonprofit Compensation Report | Page 1 of 127
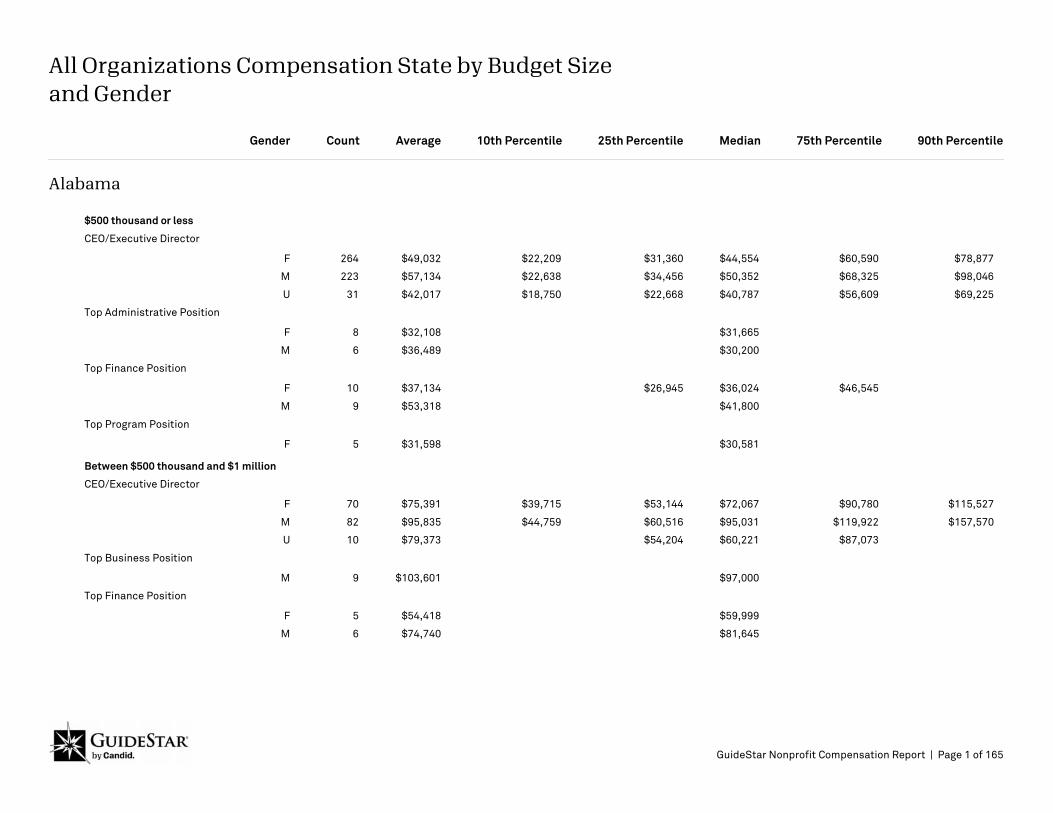
Count Average 10th Percentile 25th Percentile Median 75th Percentile 90th Percentile
All Organizations Compensation State by Budget Size and Gender
Gender
Alabama
$500 thousand or less
CEO/Executive Director
264 $49,032 $22,209 $31,360 $44,554 $60,590 $78,877F
223 $57,134 $22,638 $34,456 $50,352 $68,325 $98,046M
31 $42,017 $18,750 $22,668 $40,787 $56,609 $69,225U
Top Administrative Position
8 $32,108 $31,665F
6 $36,489 $30,200M
Top Finance Position
10 $37,134 $26,945 $36,024 $46,545F
9 $53,318 $41,800M
Top Program Position
5 $31,598 $30,581F
Between $500 thousand and $1 million
CEO/Executive Director
70 $75,391 $39,715 $53,144 $72,067 $90,780 $115,527F
82 $95,835 $44,759 $60,516 $95,031 $119,922 $157,570M
10 $79,373 $54,204 $60,221 $87,073U
Top Business Position
9 $103,601 $97,000M
Top Finance Position
5 $54,418 $59,999F
6 $74,740 $81,645M
GuideStar Nonprofit Compensation Report | Page 1 of 165
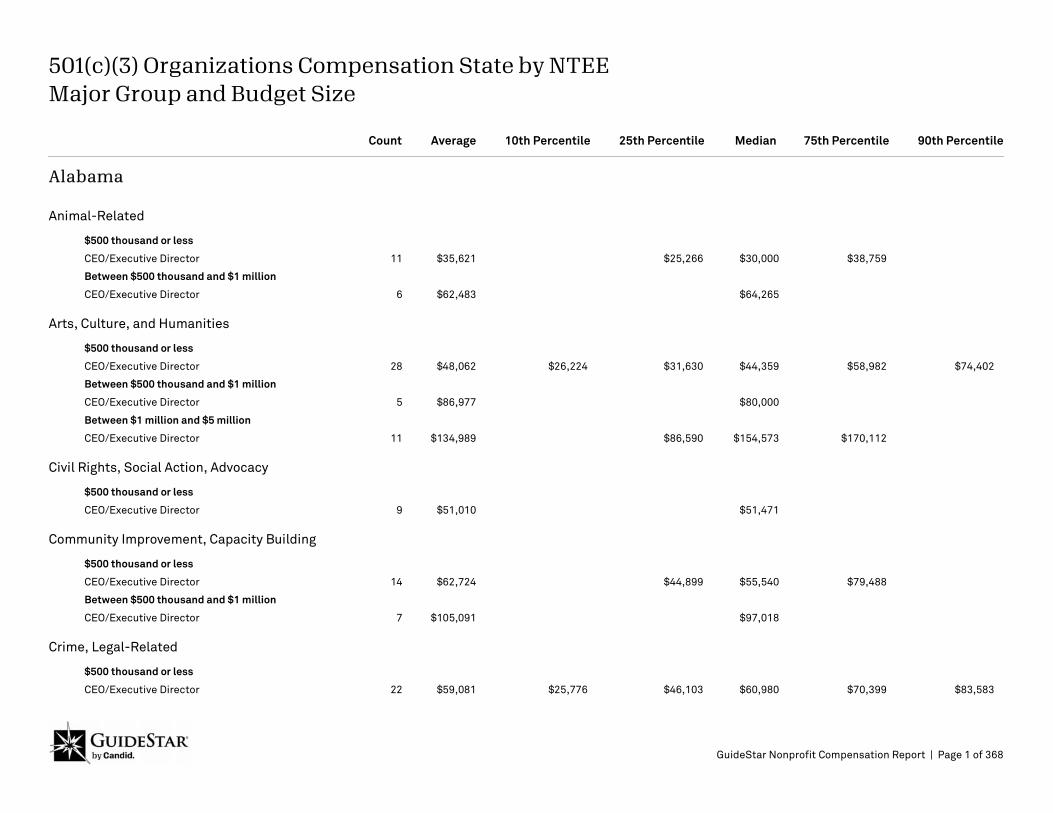
Count Average 10th Percentile 25th Percentile Median 75th Percentile 90th Percentile
501(c)(3) Organizations Compensation State by NTEE Major Group and Budget Size
Alabama
Animal-Related
$500 thousand or less
CEO/Executive Director 11 $35,621 $25,266 $30,000 $38,759
Between $500 thousand and $1 million
CEO/Executive Director 6 $62,483 $64,265
Arts, Culture, and Humanities
$500 thousand or less
CEO/Executive Director 28 $48,062 $26,224 $31,630 $44,359 $58,982 $74,402
Between $500 thousand and $1 million
CEO/Executive Director 5 $86,977 $80,000
Between $1 million and $5 million
CEO/Executive Director 11 $134,989 $86,590 $154,573 $170,112
Civil Rights, Social Action, Advocacy
$500 thousand or less
CEO/Executive Director 9 $51,010 $51,471
Community Improvement, Capacity Building
$500 thousand or less
CEO/Executive Director 14 $62,724 $44,899 $55,540 $79,488
Between $500 thousand and $1 million
CEO/Executive Director 7 $105,091 $97,018
Crime, Legal-Related
$500 thousand or less
CEO/Executive Director 22 $59,081 $25,776 $46,103 $60,980 $70,399 $83,583
GuideStar Nonprofit Compensation Report | Page 1 of 368
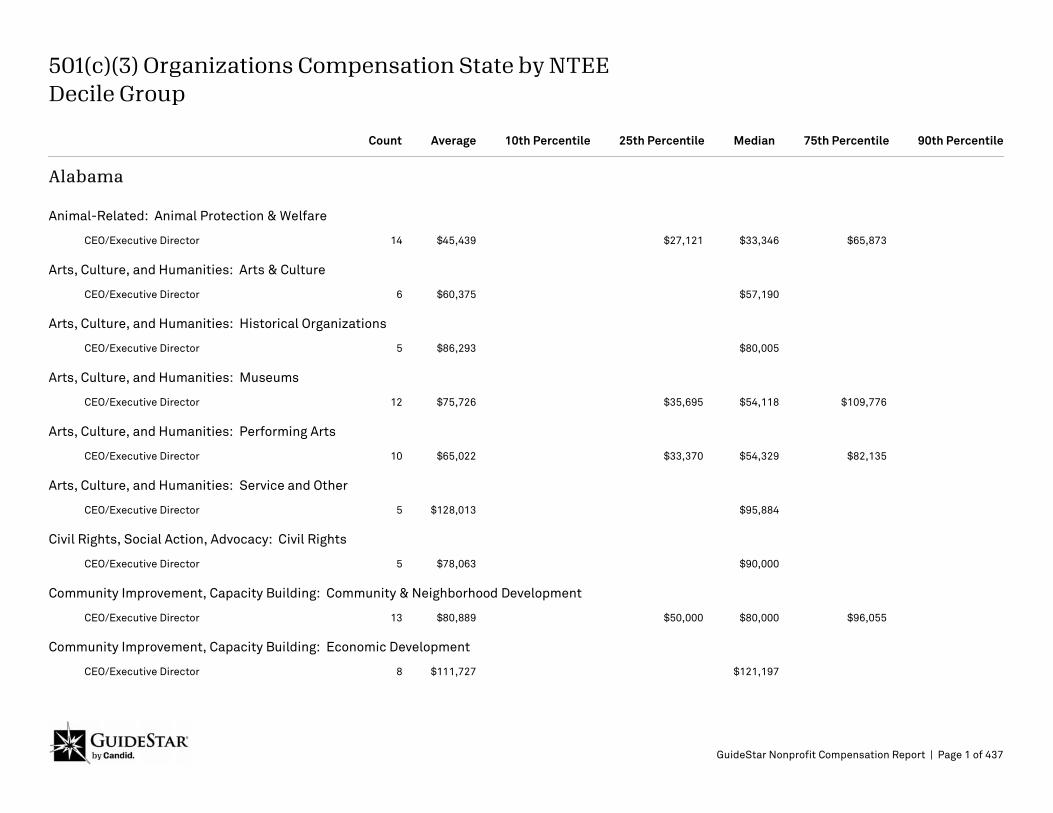
Count Average 10th Percentile 25th Percentile Median 75th Percentile 90th Percentile
501(c)(3) Organizations Compensation State by NTEE Decile Group
Alabama
Animal-Related: Animal Protection & Welfare
CEO/Executive Director 14 $45,439 $27,121 $33,346 $65,873
Arts, Culture, and Humanities: Arts & Culture
CEO/Executive Director 6 $60,375 $57,190
Arts, Culture, and Humanities: Historical Organizations
CEO/Executive Director 5 $86,293 $80,005
Arts, Culture, and Humanities: Museums
CEO/Executive Director 12 $75,726 $35,695 $54,118 $109,776
Arts, Culture, and Humanities: Performing Arts
CEO/Executive Director 10 $65,022 $33,370 $54,329 $82,135
Arts, Culture, and Humanities: Service and Other
CEO/Executive Director 5 $128,013 $95,884
Civil Rights, Social Action, Advocacy: Civil Rights
CEO/Executive Director 5 $78,063 $90,000
Community Improvement, Capacity Building: Community & Neighborhood Development
CEO/Executive Director 13 $80,889 $50,000 $80,000 $96,055
Community Improvement, Capacity Building: Economic Development
CEO/Executive Director 8 $111,727 $121,197
GuideStar Nonprofit Compensation Report | Page 1 of 437
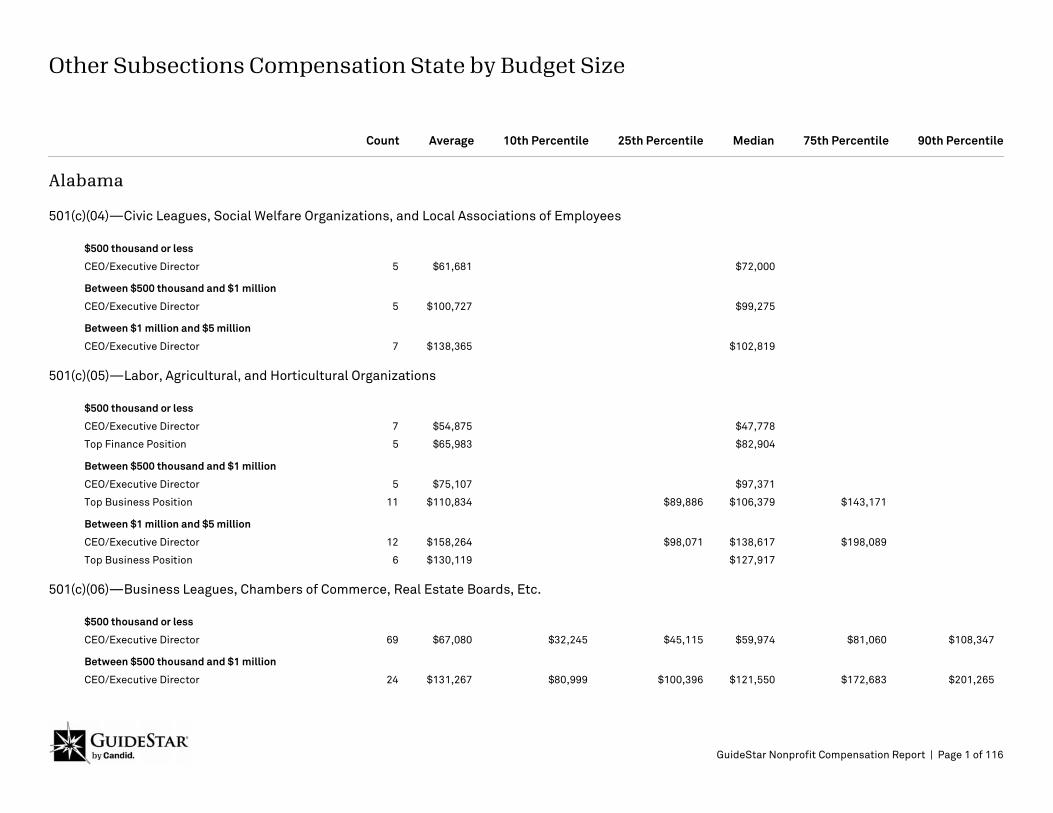
Count Average 10th Percentile 25th Percentile Median 75th Percentile 90th Percentile
Other Subsections Compensation State by Budget Size
Alabama
501(c)(04)—Civic Leagues, Social Welfare Organizations, and Local Associations of Employees
$500 thousand or less
CEO/Executive Director 5 $61,681 $72,000
Between $500 thousand and $1 million
CEO/Executive Director 5 $100,727 $99,275
Between $1 million and $5 million
CEO/Executive Director 7 $138,365 $102,819
501(c)(05)—Labor, Agricultural, and Horticultural Organizations
$500 thousand or less
CEO/Executive Director 7 $54,875 $47,778
Top Finance Position 5 $65,983 $82,904
Between $500 thousand and $1 million
CEO/Executive Director 5 $75,107 $97,371
Top Business Position 11 $110,834 $89,886 $106,379 $143,171
Between $1 million and $5 million
CEO/Executive Director 12 $158,264 $98,071 $138,617 $198,089
Top Business Position 6 $130,119 $127,917
501(c)(06)—Business Leagues, Chambers of Commerce, Real Estate Boards, Etc.
$500 thousand or less
CEO/Executive Director 69 $67,080 $32,245 $45,115 $59,974 $81,060 $108,347
Between $500 thousand and $1 million
CEO/Executive Director 24 $131,267 $80,999 $100,396 $121,550 $172,683 $201,265
GuideStar Nonprofit Compensation Report | Page 1 of 116
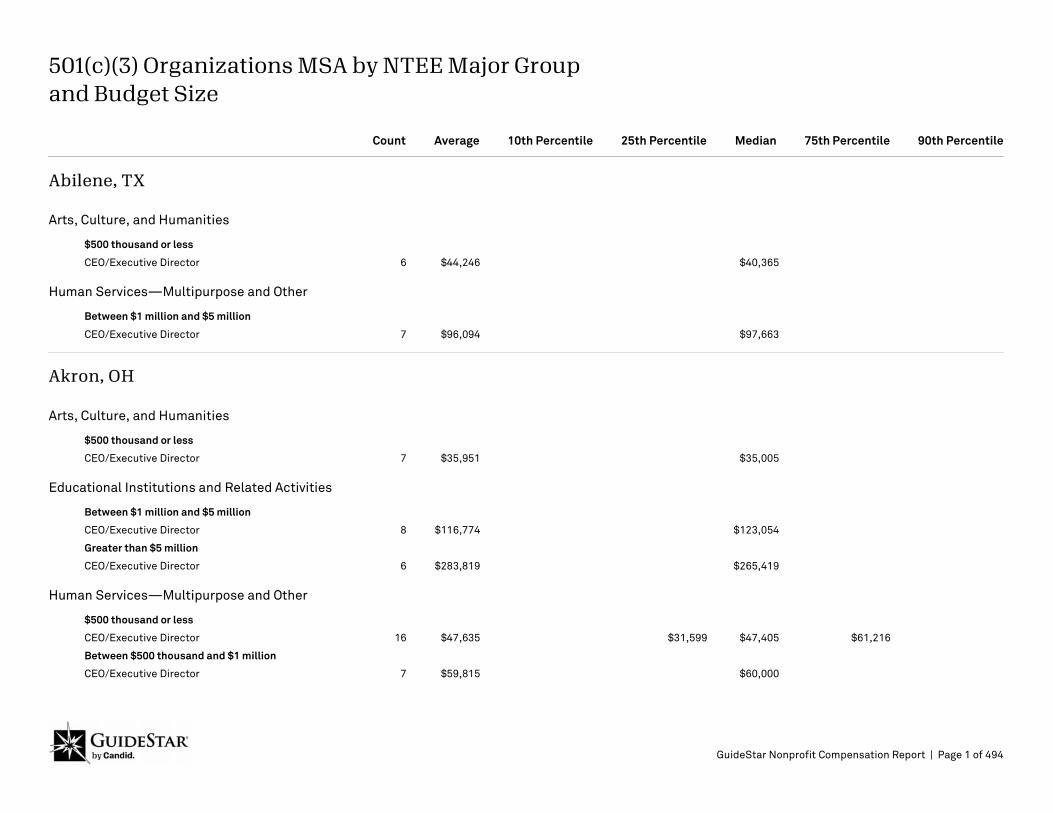
Count Average 10th Percentile 25th Percentile Median 75th Percentile 90th Percentile
501(c)(3) Organizations MSA by NTEE Major Group and Budget Size
Abilene, TX
Arts, Culture, and Humanities
$500 thousand or less
6 $44,246 $40,365CEO/Executive Director
Human Services—Multipurpose and Other
Between $1 million and $5 million
7 $96,094 $97,663CEO/Executive Director
Akron, OH
Arts, Culture, and Humanities
$500 thousand or less
7 $35,951 $35,005CEO/Executive Director
Educational Institutions and Related Activities
Between $1 million and $5 million
8 $116,774 $123,054CEO/Executive Director
Greater than $5 million
6 $283,819 $265,419CEO/Executive Director
Human Services—Multipurpose and Other
$500 thousand or less
16 $47,635 $31,599 $47,405 $61,216CEO/Executive Director
Between $500 thousand and $1 million
7 $59,815 $60,000CEO/Executive Director
GuideStar Nonprofit Compensation Report | Page 1 of 494
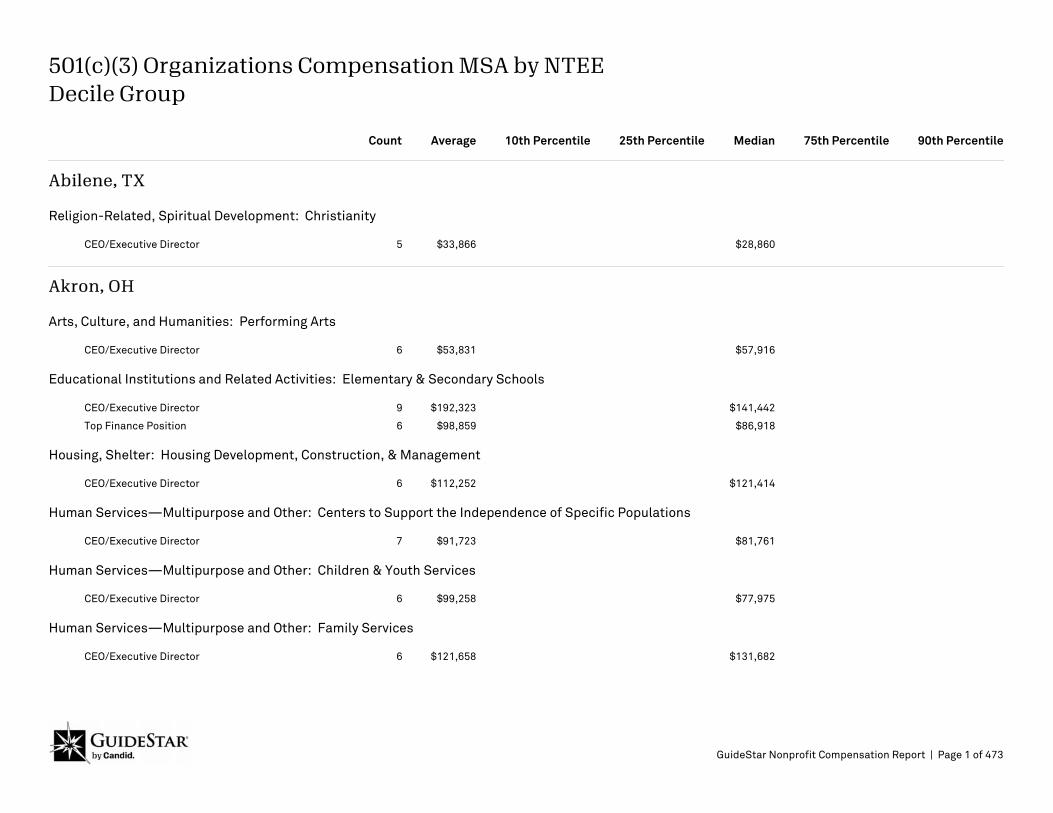
Count Average 10th Percentile Median 75th Percentile 90th Percentile
501(c)(3) Organizations Compensation MSA by NTEE Decile Group
25th Percentile
Abilene, TX
Religion-Related, Spiritual Development: Christianity
CEO/Executive Director 5 $33,866 $28,860
Akron, OH
Arts, Culture, and Humanities: Performing Arts
CEO/Executive Director 6 $53,831 $57,916
Educational Institutions and Related Activities: Elementary & Secondary Schools
CEO/Executive Director 9 $192,323 $141,442
Top Finance Position 6 $98,859 $86,918
Housing, Shelter: Housing Development, Construction, & Management
CEO/Executive Director 6 $112,252 $121,414
Human Services—Multipurpose and Other: Centers to Support the Independence of Specific Populations
CEO/Executive Director 7 $91,723 $81,761
Human Services—Multipurpose and Other: Children & Youth Services
CEO/Executive Director 6 $99,258 $77,975
Human Services—Multipurpose and Other: Family Services
CEO/Executive Director 6 $121,658 $131,682
GuideStar Nonprofit Compensation Report | Page 1 of 473
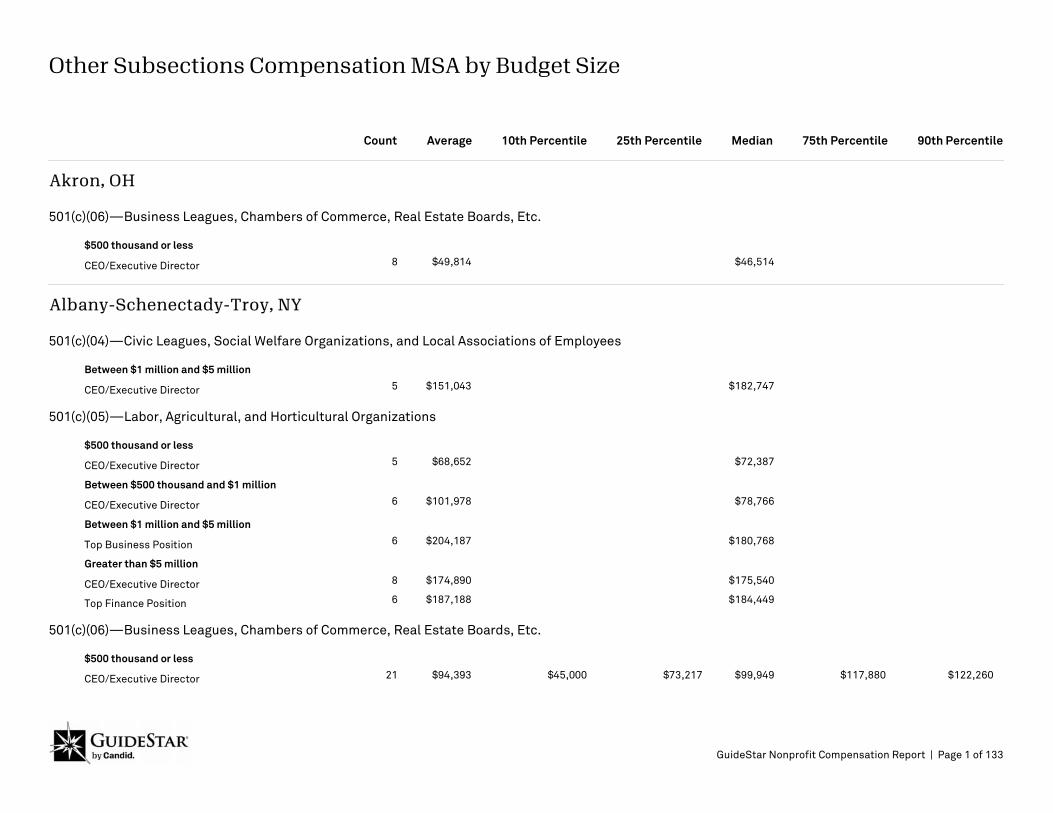
Other Subsections Compensation MSA by Budget Size
90th Percentile75th PercentileMedian25th Percentile10th PercentileAverageCount
Akron, OH
501(c)(06)—Business Leagues, Chambers of Commerce, Real Estate Boards, Etc.
$500 thousand or less
CEO/Executive Director 8 $49,814 $46,514
Albany-Schenectady-Troy, NY
501(c)(04)—Civic Leagues, Social Welfare Organizations, and Local Associations of Employees
Between $1 million and $5 million
CEO/Executive Director 5 $151,043 $182,747
501(c)(05)—Labor, Agricultural, and Horticultural Organizations
$500 thousand or less
CEO/Executive Director 5 $68,652 $72,387
Between $500 thousand and $1 million
CEO/Executive Director 6 $101,978 $78,766
Between $1 million and $5 million
Top Business Position 6 $204,187 $180,768
Greater than $5 million
CEO/Executive Director 8 $174,890 $175,540
Top Finance Position 6 $187,188 $184,449
501(c)(06)—Business Leagues, Chambers of Commerce, Real Estate Boards, Etc.
$500 thousand or less
CEO/Executive Director 21 $94,393 $45,000 $73,217 $99,949 $117,880 $122,260
GuideStar Nonprofit Compensation Report | Page 1 of 133
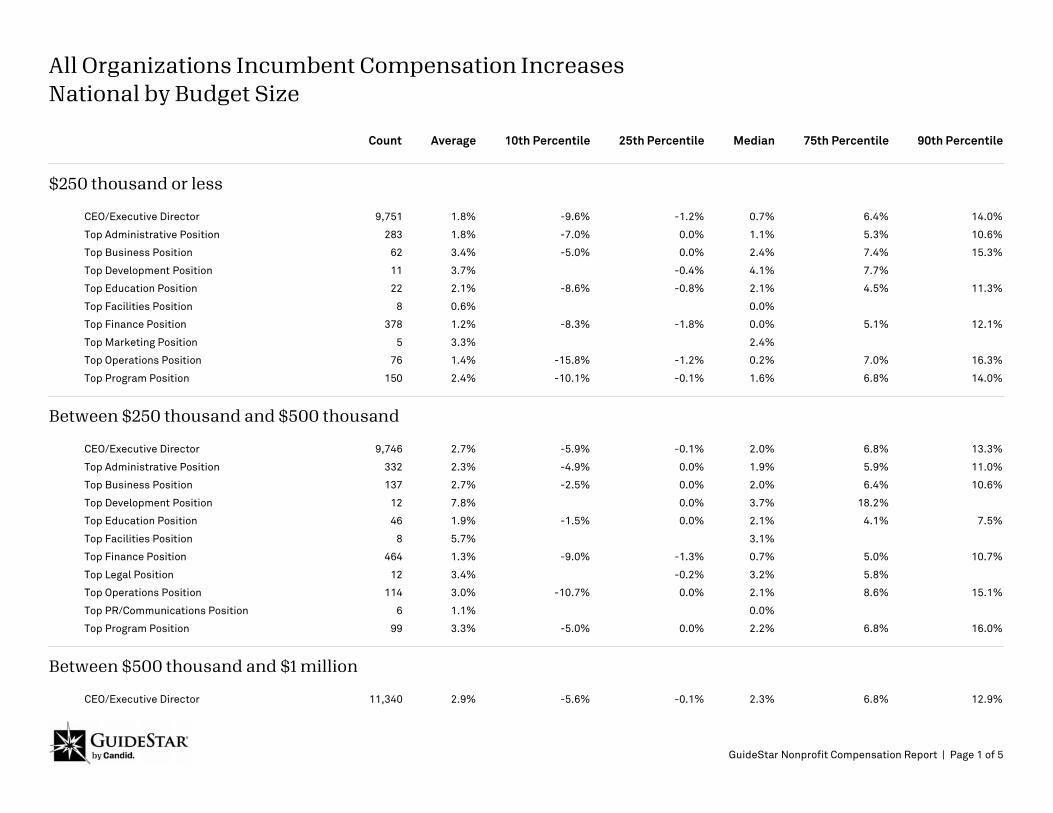
Count Average 10th Percentile 25th Percentile Median 75th Percentile 90th Percentile
All Organizations Incumbent Compensation Increases National by Budget Size
$250 thousand or less
9,751 1.8% -9.6% -1.2% 0.7% 6.4% 14.0%CEO/Executive Director
283 1.8% -7.0% 0.0% 1.1% 5.3% 10.6%Top Administrative Position
62 3.4% -5.0% 0.0% 2.4% 7.4% 15.3%Top Business Position
11 3.7% -0.4% 4.1% 7.7%Top Development Position
22 2.1% -8.6% -0.8% 2.1% 4.5% 11.3%Top Education Position
8 0.6% 0.0%Top Facilities Position
378 1.2% -8.3% -1.8% 0.0% 5.1% 12.1%Top Finance Position
5 3.3% 2.4%Top Marketing Position
76 1.4% -15.8% -1.2% 0.2% 7.0% 16.3%Top Operations Position
150 2.4% -10.1% -0.1% 1.6% 6.8% 14.0%Top Program Position
Between $250 thousand and $500 thousand
9,746 2.7% -5.9% -0.1% 2.0% 6.8% 13.3%CEO/Executive Director
332 2.3% -4.9% 0.0% 1.9% 5.9% 11.0%Top Administrative Position
137 2.7% -2.5% 0.0% 2.0% 6.4% 10.6%Top Business Position
12 7.8% 0.0% 3.7% 18.2%Top Development Position
46 1.9% -1.5% 0.0% 2.1% 4.1% 7.5%Top Education Position
8 5.7% 3.1%Top Facilities Position
464 1.3% -9.0% -1.3% 0.7% 5.0% 10.7%Top Finance Position
12 3.4% -0.2% 3.2% 5.8%Top Legal Position
114 3.0% -10.7% 0.0% 2.1% 8.6% 15.1%Top Operations Position
6 1.1% 0.0%Top PR/Communications Position
99 3.3% -5.0% 0.0% 2.2% 6.8% 16.0%Top Program Position
Between $500 thousand and $1 million
11,340 2.9% -5.6% -0.1% 2.3% 6.8% 12.9%CEO/Executive Director
GuideStar Nonprofit Compensation Report | Page 1 of 5
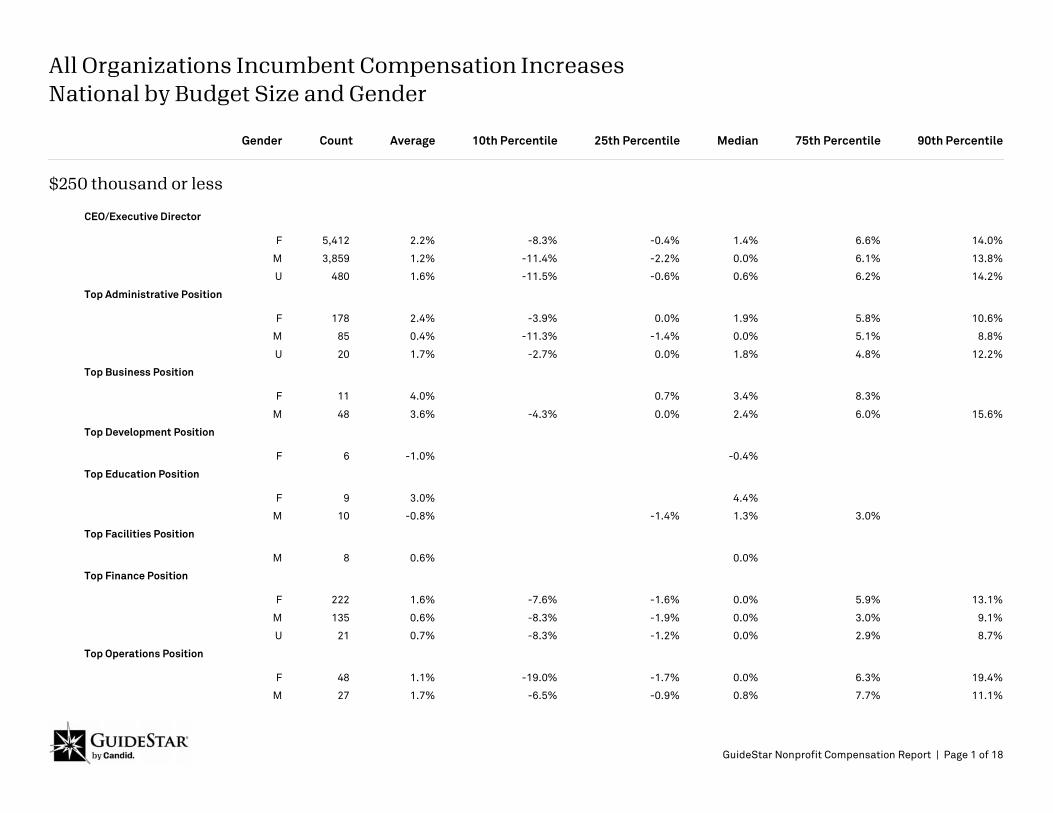
Count Average 10th Percentile 25th Percentile Median 75th Percentile 90th Percentile
All Organizations Incumbent Compensation Increases National by Budget Size and Gender
Gender
$250 thousand or less
CEO/Executive Director
5,412 2.2% -8.3% -0.4% 1.4% 6.6% 14.0%F
3,859 1.2% -11.4% -2.2% 0.0% 6.1% 13.8%M
480 1.6% -11.5% -0.6% 0.6% 6.2% 14.2%U
Top Administrative Position
178 2.4% -3.9% 0.0% 1.9% 5.8% 10.6%F
85 0.4% -11.3% -1.4% 0.0% 5.1% 8.8%M
20 1.7% -2.7% 0.0% 1.8% 4.8% 12.2%U
Top Business Position
11 4.0% 0.7% 3.4% 8.3%F
48 3.6% -4.3% 0.0% 2.4% 6.0% 15.6%M
Top Development Position
6 -1.0% -0.4%F
Top Education Position
9 3.0% 4.4%F
10 -0.8% -1.4% 1.3% 3.0%M
Top Facilities Position
8 0.6% 0.0%M
Top Finance Position
222 1.6% -7.6% -1.6% 0.0% 5.9% 13.1%F
135 0.6% -8.3% -1.9% 0.0% 3.0% 9.1%M
21 0.7% -8.3% -1.2% 0.0% 2.9% 8.7%U
Top Operations Position
48 1.1% -19.0% -1.7% 0.0% 6.3% 19.4%F
27 1.7% -6.5% -0.9% 0.8% 7.7% 11.1%M
GuideStar Nonprofit Compensation Report | Page 1 of 18
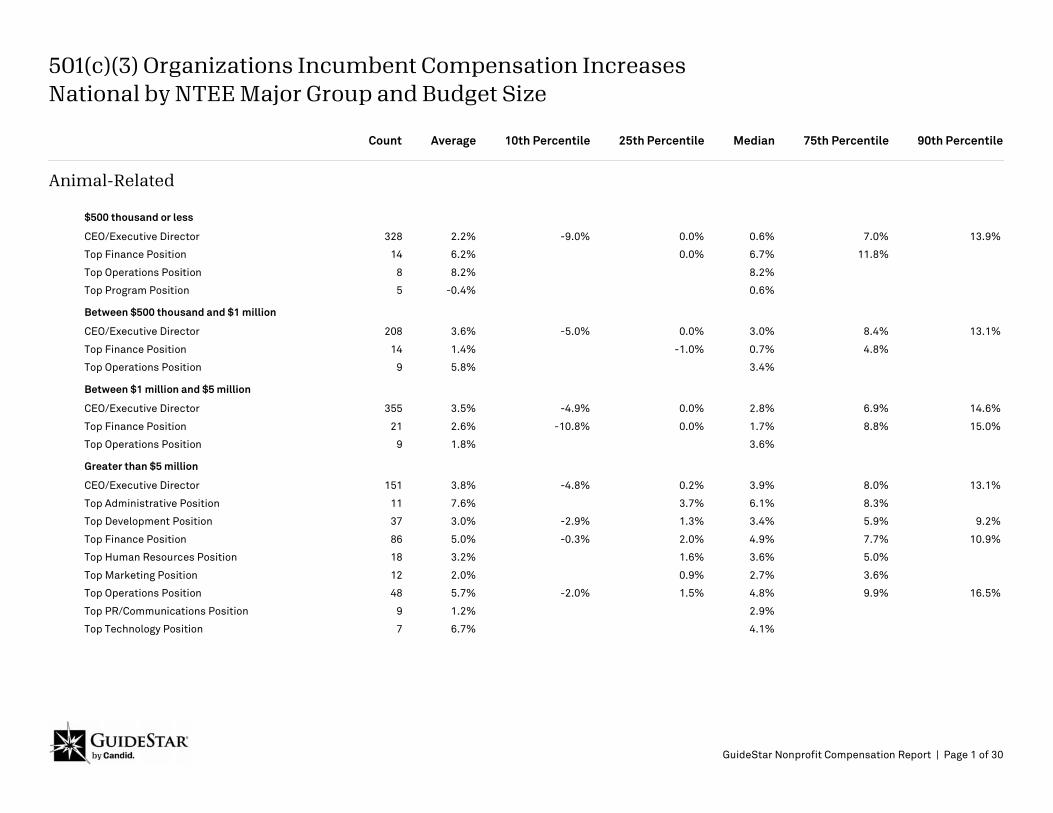
Count Average 10th Percentile 25th Percentile Median 75th Percentile 90th Percentile
501(c)(3) Organizations Incumbent Compensation Increases National by NTEE Major Group and Budget Size
Animal-Related
$500 thousand or less
328 2.2% -9.0% 0.0% 0.6% 7.0% 13.9%CEO/Executive Director
14 6.2% 0.0% 6.7% 11.8%Top Finance Position
8 8.2% 8.2%Top Operations Position
5 -0.4% 0.6%Top Program Position
Between $500 thousand and $1 million
208 3.6% -5.0% 0.0% 3.0% 8.4% 13.1%CEO/Executive Director
14 1.4% -1.0% 0.7% 4.8%Top Finance Position
9 5.8% 3.4%Top Operations Position
Between $1 million and $5 million
355 3.5% -4.9% 0.0% 2.8% 6.9% 14.6%CEO/Executive Director
21 2.6% -10.8% 0.0% 1.7% 8.8% 15.0%Top Finance Position
9 1.8% 3.6%Top Operations Position
Greater than $5 million
151 3.8% -4.8% 0.2% 3.9% 8.0% 13.1%CEO/Executive Director
11 7.6% 3.7% 6.1% 8.3%Top Administrative Position
37 3.0% -2.9% 1.3% 3.4% 5.9% 9.2%Top Development Position
86 5.0% -0.3% 2.0% 4.9% 7.7% 10.9%Top Finance Position
18 3.2% 1.6% 3.6% 5.0%Top Human Resources Position
12 2.0% 0.9% 2.7% 3.6%Top Marketing Position
48 5.7% -2.0% 1.5% 4.8% 9.9% 16.5%Top Operations Position
9 1.2% 2.9%Top PR/Communications Position
7 6.7% 4.1%Top Technology Position
GuideStar Nonprofit Compensation Report | Page 1 of 30
Count Average 10th Percentile 25th Percentile Median 75th Percentile 90th Percentile
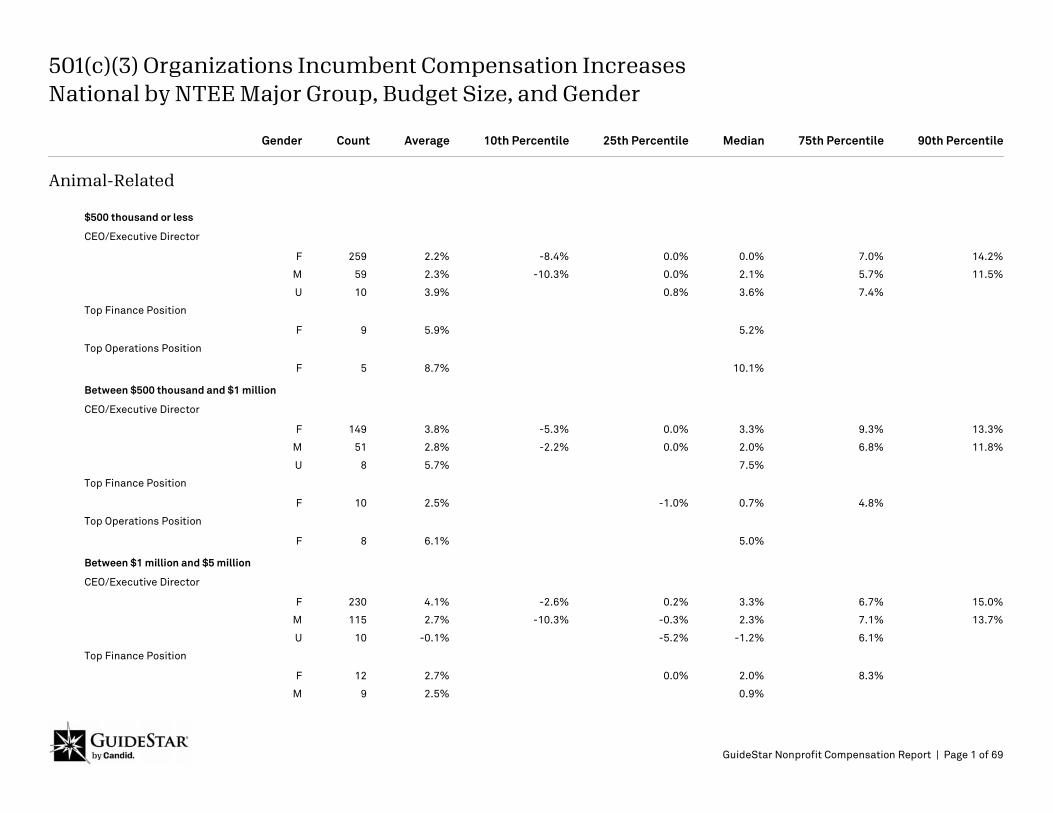
501(c)(3) Organizations Incumbent Compensation Increases National by NTEE Major Group, Budget Size, and Gender
Gender
Animal-Related
$500 thousand or less
CEO/Executive Director
259 2.2% -8.4% 0.0% 0.0% 7.0% 14.2%F
59 2.3% -10.3% 0.0% 2.1% 5.7% 11.5%M
10 3.9% 0.8% 3.6% 7.4%U
Top Finance Position
9 5.9% 5.2%F
Top Operations Position
5 8.7% 10.1%F
Between $500 thousand and $1 million
CEO/Executive Director
149 3.8% -5.3% 0.0% 3.3% 9.3% 13.3%F
51 2.8% -2.2% 0.0% 2.0% 6.8% 11.8%M
8 5.7% 7.5%U
Top Finance Position
10 2.5% -1.0% 0.7% 4.8%F
Top Operations Position
8 6.1% 5.0%F
Between $1 million and $5 million
CEO/Executive Director
230 4.1% -2.6% 0.2% 3.3% 6.7% 15.0%F
115 2.7% -10.3% -0.3% 2.3% 7.1% 13.7%M
10 -0.1% -5.2% -1.2% 6.1%U
Top Finance Position
12 2.7% 0.0% 2.0% 8.3%F
9 2.5% 0.9%M
GuideStar Nonprofit Compensation Report | Page 1 of 69
Count Average 10th Percentile 25th Percentile Median 75th Percentile 90th Percentile
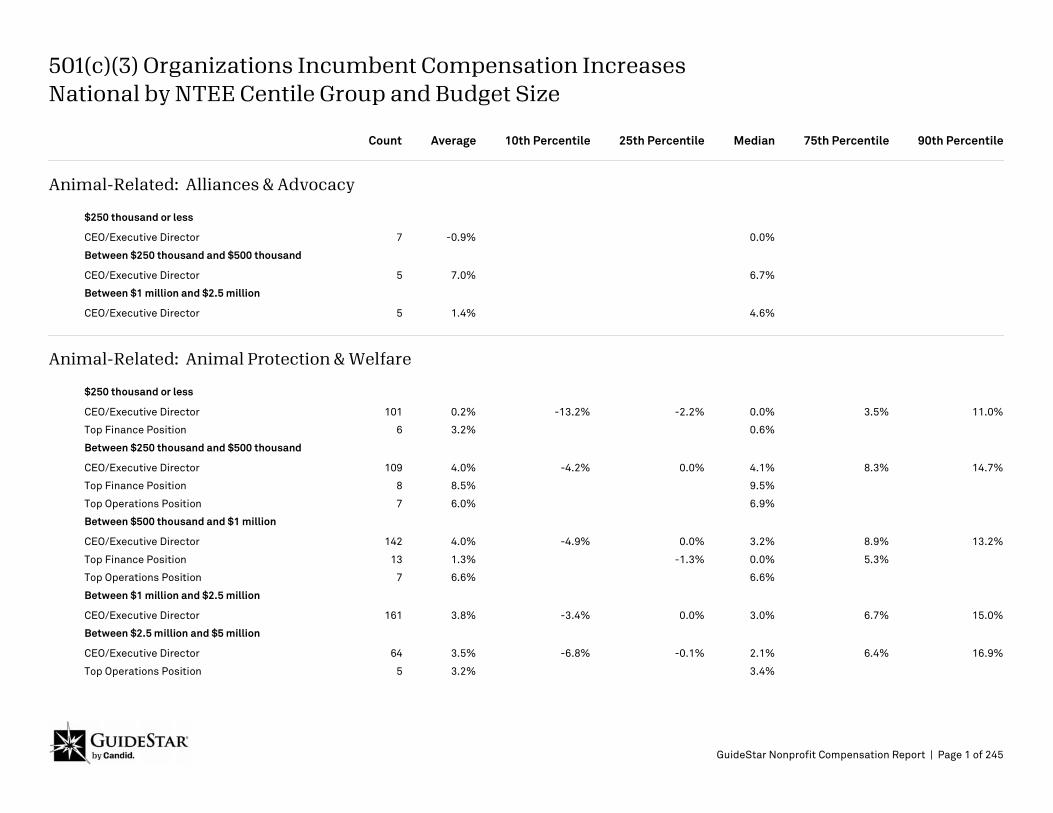
501(c)(3) Organizations Incumbent Compensation Increases National by NTEE Centile Group and Budget Size
Animal-Related: Alliances & Advocacy
$250 thousand or less
7 -0.9% 0.0%CEO/Executive Director
Between $250 thousand and $500 thousand
5 7.0% 6.7%CEO/Executive Director
Between $1 million and $2.5 million
5 1.4% 4.6%CEO/Executive Director
Animal-Related: Animal Protection & Welfare
$250 thousand or less
101 0.2% -13.2% -2.2% 0.0% 3.5% 11.0%CEO/Executive Director
6 3.2% 0.6%Top Finance Position
Between $250 thousand and $500 thousand
109 4.0% -4.2% 0.0% 4.1% 8.3% 14.7%CEO/Executive Director
8 8.5% 9.5%Top Finance Position
7 6.0% 6.9%Top Operations Position
Between $500 thousand and $1 million
142 4.0% -4.9% 0.0% 3.2% 8.9% 13.2%CEO/Executive Director
13 1.3% -1.3% 0.0% 5.3%Top Finance Position
7 6.6% 6.6%Top Operations Position
Between $1 million and $2.5 million
161 3.8% -3.4% 0.0% 3.0% 6.7% 15.0%CEO/Executive Director
Between $2.5 million and $5 million
64 3.5% -6.8% -0.1% 2.1% 6.4% 16.9%CEO/Executive Director
5 3.2% 3.4%Top Operations Position
GuideStar Nonprofit Compensation Report | Page 1 of 245
Count Average 10th Percentile 25th Percentile Median 75th Percentile 90th Percentile
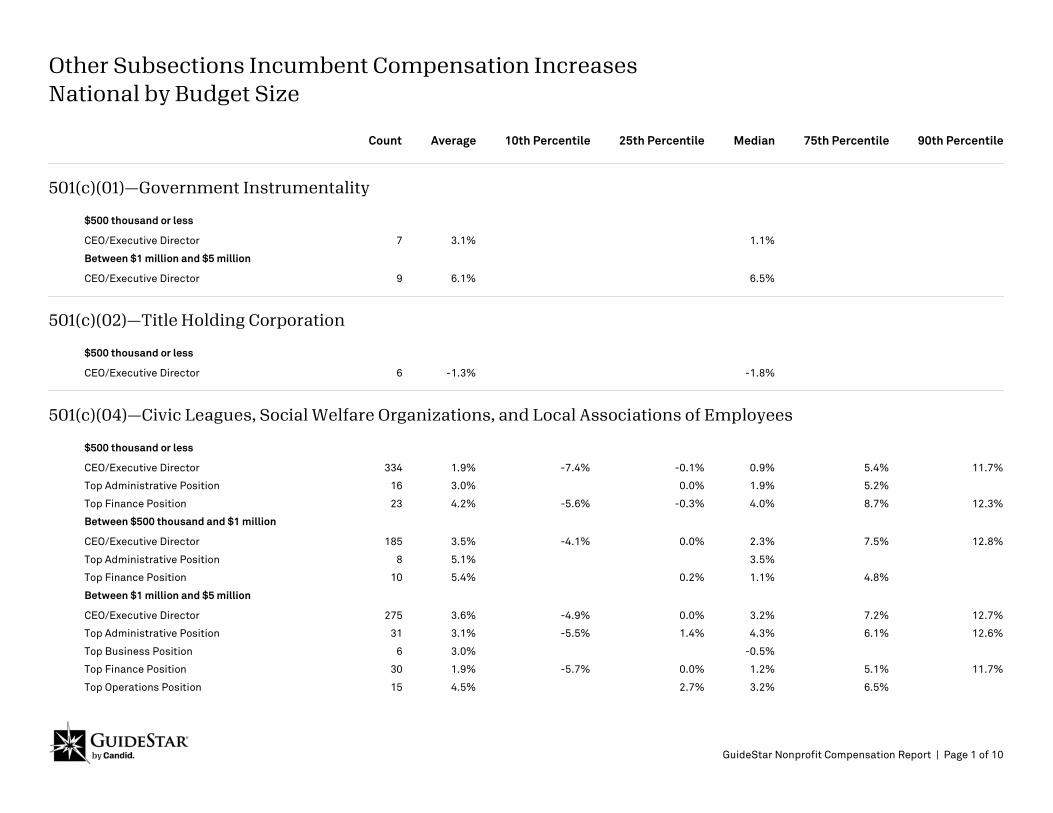
Other Subsections Incumbent Compensation Increases National by Budget Size
501(c)(01)—Government Instrumentality
$500 thousand or less
7 3.1% 1.1%CEO/Executive Director
Between $1 million and $5 million
9 6.1% 6.5%CEO/Executive Director
501(c)(02)—Title Holding Corporation
$500 thousand or less
6 -1.3% -1.8%CEO/Executive Director
501(c)(04)—Civic Leagues, Social Welfare Organizations, and Local Associations of Employees
$500 thousand or less
334 1.9% -7.4% -0.1% 0.9% 5.4% 11.7%CEO/Executive Director
16 3.0% 0.0% 1.9% 5.2%Top Administrative Position
23 4.2% -5.6% -0.3% 4.0% 8.7% 12.3%Top Finance Position
Between $500 thousand and $1 million
185 3.5% -4.1% 0.0% 2.3% 7.5% 12.8%CEO/Executive Director
8 5.1% 3.5%Top Administrative Position
10 5.4% 0.2% 1.1% 4.8%Top Finance Position
Between $1 million and $5 million
275 3.6% -4.9% 0.0% 3.2% 7.2% 12.7%CEO/Executive Director
31 3.1% -5.5% 1.4% 4.3% 6.1% 12.6%Top Administrative Position
6 3.0% -0.5%Top Business Position
30 1.9% -5.7% 0.0% 1.2% 5.1% 11.7%Top Finance Position
15 4.5% 2.7% 3.2% 6.5%Top Operations Position
GuideStar Nonprofit Compensation Report | Page 1 of 10
Count Average 10th Percentile 25th Percentile Median 75th Percentile 90th Percentile
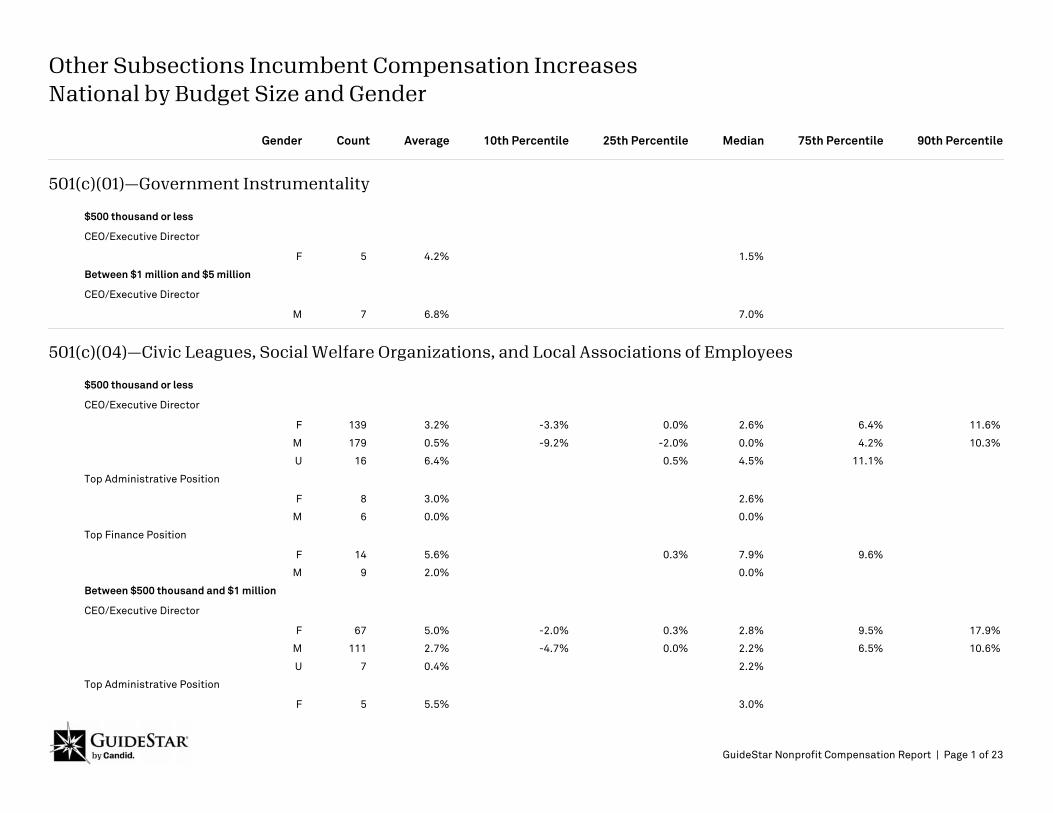
Other Subsections Incumbent Compensation Increases National by Budget Size and Gender
Gender
501(c)(01)—Government Instrumentality
$500 thousand or less
CEO/Executive Director
5 4.2% 1.5%F
Between $1 million and $5 million
CEO/Executive Director
7 6.8% 7.0%M
501(c)(04)—Civic Leagues, Social Welfare Organizations, and Local Associations of Employees
$500 thousand or less
CEO/Executive Director
139 3.2% -3.3% 0.0% 2.6% 6.4% 11.6%F
179 0.5% -9.2% -2.0% 0.0% 4.2% 10.3%M
16 6.4% 0.5% 4.5% 11.1%U
Top Administrative Position
8 3.0% 2.6%F
6 0.0% 0.0%M
Top Finance Position
14 5.6% 0.3% 7.9% 9.6%F
9 2.0% 0.0%M
Between $500 thousand and $1 million
CEO/Executive Director
67 5.0% -2.0% 0.3% 2.8% 9.5% 17.9%F
111 2.7% -4.7% 0.0% 2.2% 6.5% 10.6%M
7 0.4% 2.2%U
Top Administrative Position
5 5.5% 3.0%F
GuideStar Nonprofit Compensation Report | Page 1 of 23
Count Average 10th Percentile 25th Percentile Median 75th Percentile 90th Percentile
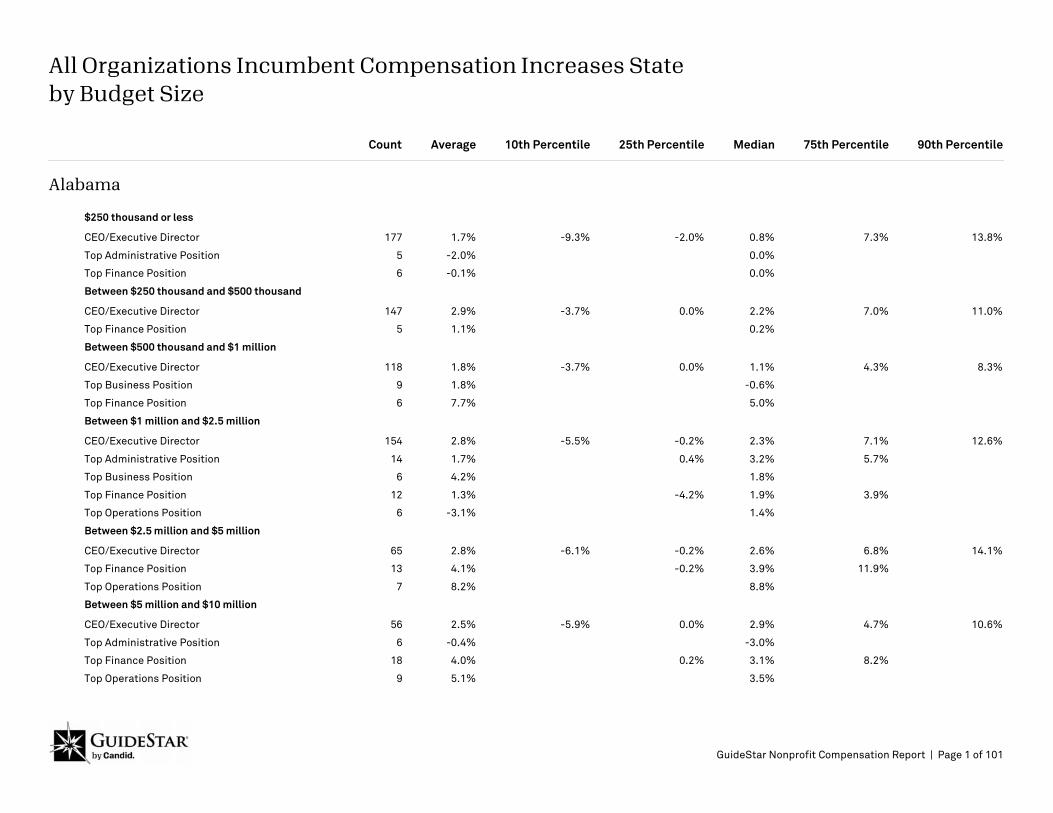
All Organizations Incumbent Compensation Increases Stateby Budget Size
Alabama
$250 thousand or less
177 1.7% -9.3% -2.0% 0.8% 7.3% 13.8%CEO/Executive Director
5 -2.0% 0.0%Top Administrative Position
6 -0.1% 0.0%Top Finance Position
Between $250 thousand and $500 thousand
147 2.9% -3.7% 0.0% 2.2% 7.0% 11.0%CEO/Executive Director
5 1.1% 0.2%Top Finance Position
Between $500 thousand and $1 million
118 1.8% -3.7% 0.0% 1.1% 4.3% 8.3%CEO/Executive Director
9 1.8% -0.6%Top Business Position
6 7.7% 5.0%Top Finance Position
Between $1 million and $2.5 million
154 2.8% -5.5% -0.2% 2.3% 7.1% 12.6%CEO/Executive Director
14 1.7% 0.4% 3.2% 5.7%Top Administrative Position
6 4.2% 1.8%Top Business Position
12 1.3% -4.2% 1.9% 3.9%Top Finance Position
6 -3.1% 1.4%Top Operations Position
Between $2.5 million and $5 million
65 2.8% -6.1% -0.2% 2.6% 6.8% 14.1%CEO/Executive Director
13 4.1% -0.2% 3.9% 11.9%Top Finance Position
7 8.2% 8.8%Top Operations Position
Between $5 million and $10 million
56 2.5% -5.9% 0.0% 2.9% 4.7% 10.6%CEO/Executive Director
6 -0.4% -3.0%Top Administrative Position
18 4.0% 0.2% 3.1% 8.2%Top Finance Position
9 5.1% 3.5%Top Operations Position
GuideStar Nonprofit Compensation Report | Page 1 of 101
Count Average 10th Percentile 25th Percentile Median 75th Percentile 90th Percentile
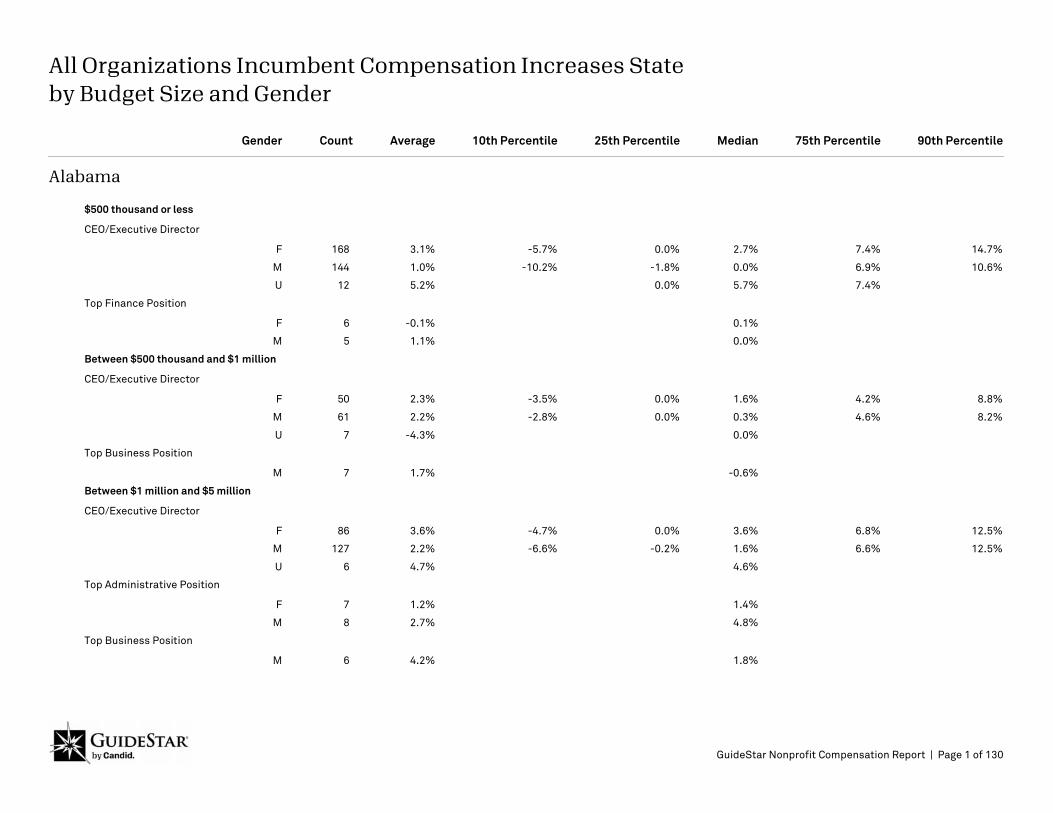
All Organizations Incumbent Compensation Increases Stateby Budget Size and Gender
Gender
Alabama
$500 thousand or less
CEO/Executive Director
168 3.1% -5.7% 0.0% 2.7% 7.4% 14.7%F
144 1.0% -10.2% -1.8% 0.0% 6.9% 10.6%M
12 5.2% 0.0% 5.7% 7.4%U
Top Finance Position
6 -0.1% 0.1%F
5 1.1% 0.0%M
Between $500 thousand and $1 million
CEO/Executive Director
50 2.3% -3.5% 0.0% 1.6% 4.2% 8.8%F
61 2.2% -2.8% 0.0% 0.3% 4.6% 8.2%M
7 -4.3% 0.0%U
Top Business Position
7 1.7% -0.6%M
Between $1 million and $5 million
CEO/Executive Director
86 3.6% -4.7% 0.0% 3.6% 6.8% 12.5%F
127 2.2% -6.6% -0.2% 1.6% 6.6% 12.5%M
6 4.7% 4.6%U
Top Administrative Position
7 1.2% 1.4%F
8 2.7% 4.8%M
Top Business Position
6 4.2% 1.8%M
GuideStar Nonprofit Compensation Report | Page 1 of 130
Count Average 10th Percentile 25th Percentile Median 75th Percentile 90th Percentile
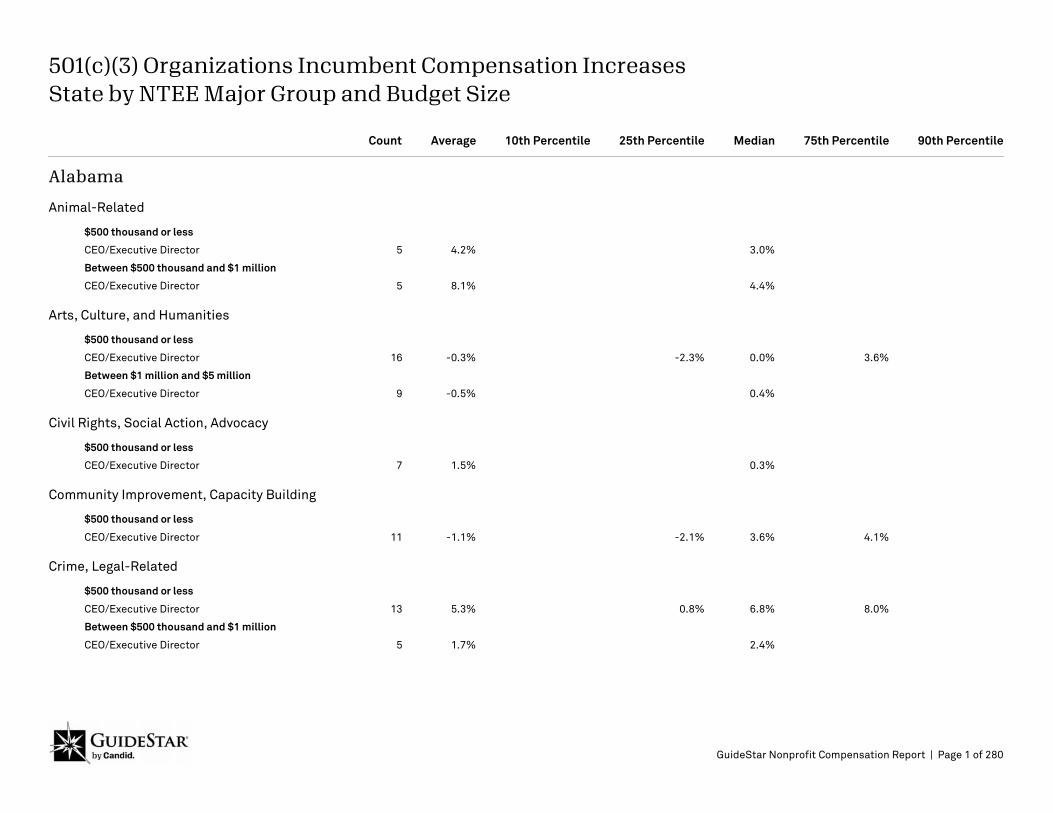
501(c)(3) Organizations Incumbent Compensation Increases State by NTEE Major Group and Budget Size
Alabama
Animal-Related
$500 thousand or less
CEO/Executive Director 5 4.2% 3.0%
Between $500 thousand and $1 million
CEO/Executive Director 5 8.1% 4.4%
Arts, Culture, and Humanities
$500 thousand or less
CEO/Executive Director 16 -0.3% -2.3% 0.0% 3.6%
Between $1 million and $5 million
CEO/Executive Director 9 -0.5% 0.4%
Civil Rights, Social Action, Advocacy
$500 thousand or less
CEO/Executive Director 7 1.5% 0.3%
Community Improvement, Capacity Building
$500 thousand or less
CEO/Executive Director 11 -1.1% -2.1% 3.6% 4.1%
Crime, Legal-Related
$500 thousand or less
CEO/Executive Director 13 5.3% 0.8% 6.8% 8.0%
Between $500 thousand and $1 million
CEO/Executive Director 5 1.7% 2.4%
GuideStar Nonprofit Compensation Report | Page 1 of 280
Count Average 10th Percentile 25th Percentile Median 75th Percentile 90th Percentile
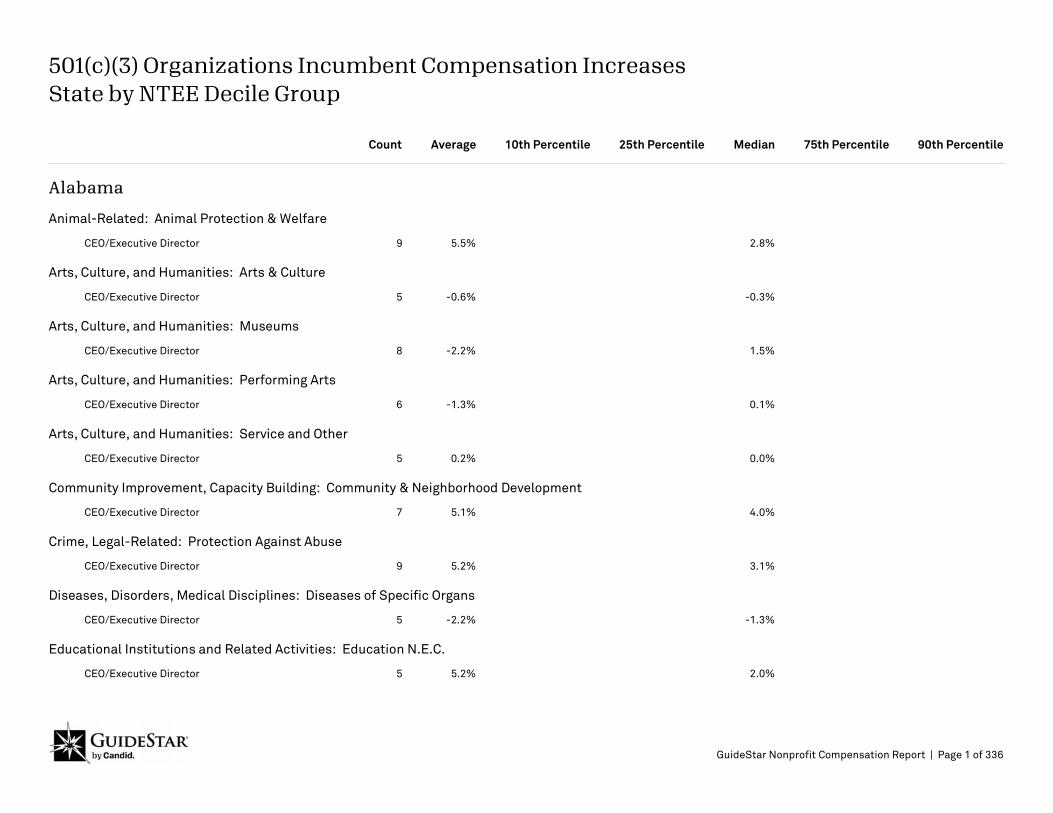
501(c)(3) Organizations Incumbent Compensation Increases State by NTEE Decile Group
Alabama
Animal-Related: Animal Protection & Welfare
CEO/Executive Director 9 5.5% 2.8%
Arts, Culture, and Humanities: Arts & Culture
CEO/Executive Director 5 -0.6% -0.3%
Arts, Culture, and Humanities: Museums
CEO/Executive Director 8 -2.2% 1.5%
Arts, Culture, and Humanities: Performing Arts
CEO/Executive Director 6 -1.3% 0.1%
Arts, Culture, and Humanities: Service and Other
CEO/Executive Director 5 0.2% 0.0%
Community Improvement, Capacity Building: Community & Neighborhood Development
CEO/Executive Director 7 5.1% 4.0%
Crime, Legal-Related: Protection Against Abuse
CEO/Executive Director 9 5.2% 3.1%
Diseases, Disorders, Medical Disciplines: Diseases of Specific Organs
CEO/Executive Director 5 -2.2% -1.3%
Educational Institutions and Related Activities: Education N.E.C.
CEO/Executive Director 5 5.2% 2.0%
GuideStar Nonprofit Compensation Report | Page 1 of 336
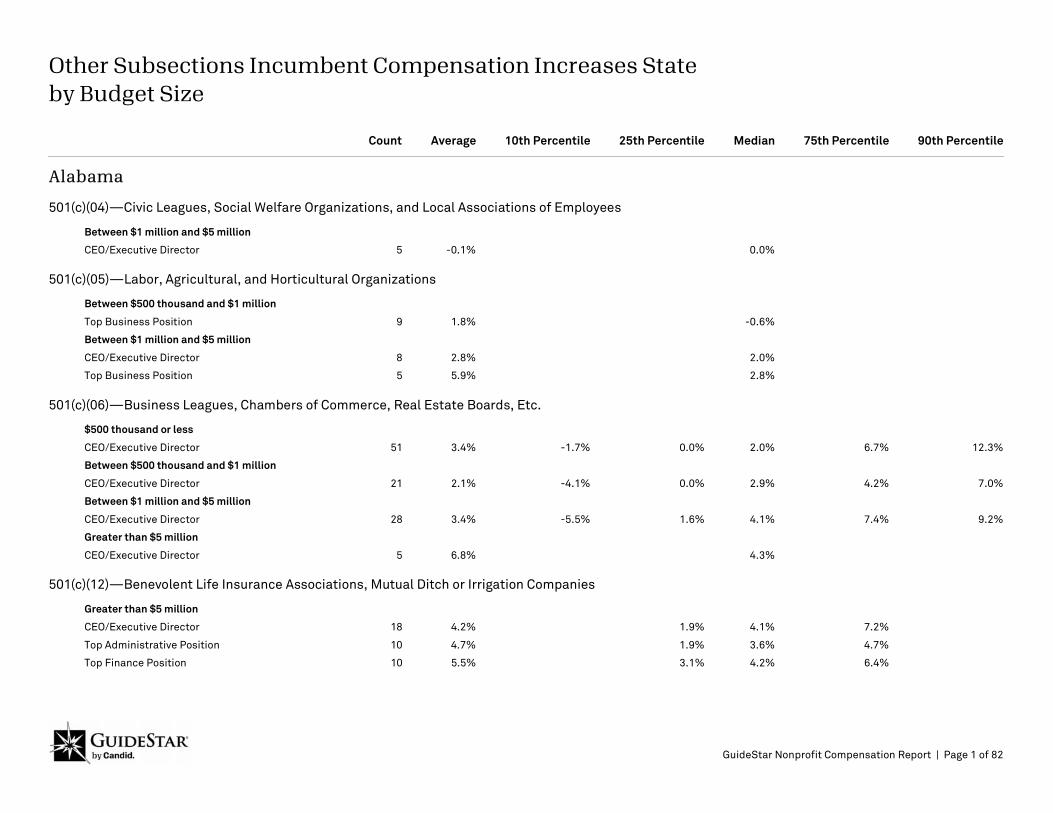
Count Average 10th Percentile 25th Percentile Median 75th Percentile 90th Percentile
Other Subsections Incumbent Compensation Increases State by Budget Size
Alabama
501(c)(04)—Civic Leagues, Social Welfare Organizations, and Local Associations of Employees
Between $1 million and $5 million
CEO/Executive Director 5 -0.1% 0.0%
501(c)(05)—Labor, Agricultural, and Horticultural Organizations
Between $500 thousand and $1 million
Top Business Position 9 1.8% -0.6%
Between $1 million and $5 million
CEO/Executive Director 8 2.8% 2.0%
Top Business Position 5 5.9% 2.8%
501(c)(06)—Business Leagues, Chambers of Commerce, Real Estate Boards, Etc.
$500 thousand or less
CEO/Executive Director 51 3.4% -1.7% 0.0% 2.0% 6.7% 12.3%
Between $500 thousand and $1 million
CEO/Executive Director 21 2.1% -4.1% 0.0% 2.9% 4.2% 7.0%
Between $1 million and $5 million
CEO/Executive Director 28 3.4% -5.5% 1.6% 4.1% 7.4% 9.2%
Greater than $5 million
CEO/Executive Director 5 6.8% 4.3%
501(c)(12)—Benevolent Life Insurance Associations, Mutual Ditch or Irrigation Companies
Greater than $5 million
CEO/Executive Director 18 4.2% 1.9% 4.1% 7.2%
Top Administrative Position 10 4.7% 1.9% 3.6% 4.7%
Top Finance Position 10 5.5% 3.1% 4.2% 6.4%
GuideStar Nonprofit Compensation Report | Page 1 of 82
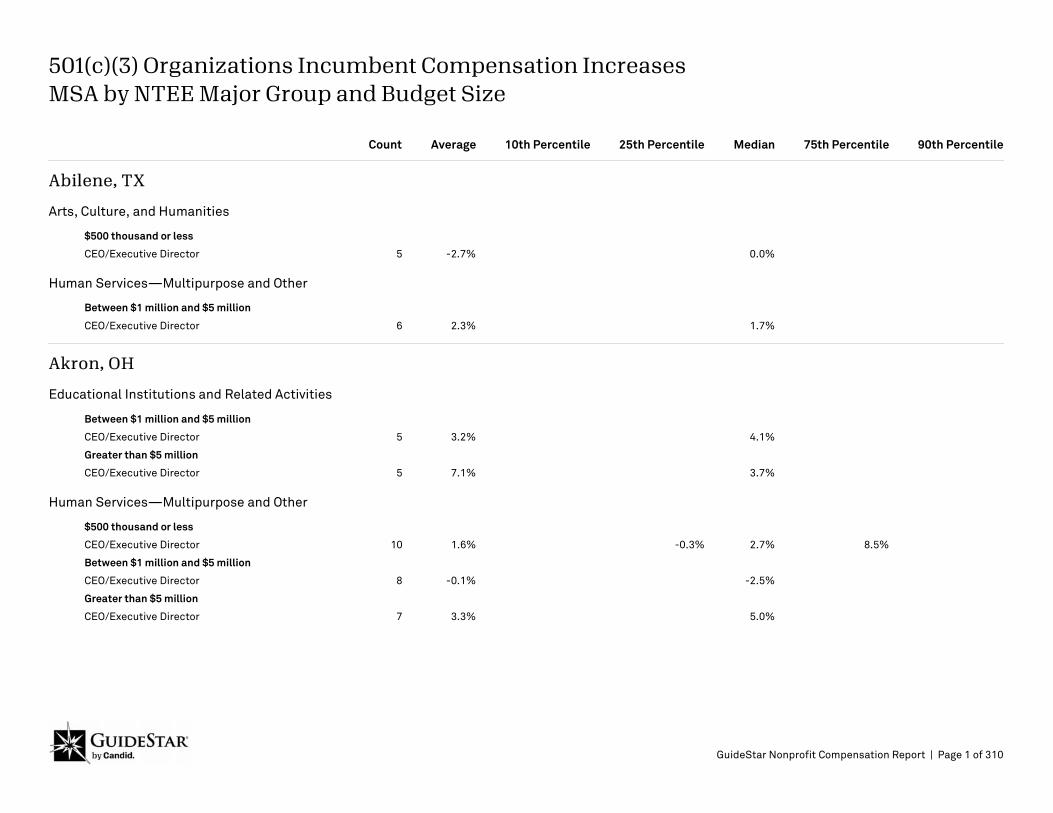
Count Average 10th Percentile 25th Percentile Median 75th Percentile 90th Percentile
501(c)(3) Organizations Incumbent Compensation Increases MSA by NTEE Major Group and Budget Size
Abilene, TX
Arts, Culture, and Humanities
$500 thousand or less
CEO/Executive Director 5 -2.7% 0.0%
Human Services—Multipurpose and Other
Between $1 million and $5 million
CEO/Executive Director 6 2.3% 1.7%
Akron, OH
Educational Institutions and Related Activities
Between $1 million and $5 million
CEO/Executive Director 5 3.2% 4.1%
Greater than $5 million
CEO/Executive Director 5 7.1% 3.7%
Human Services—Multipurpose and Other
$500 thousand or less
CEO/Executive Director 10 1.6% -0.3% 2.7% 8.5%
Between $1 million and $5 million
CEO/Executive Director 8 -0.1% -2.5%
Greater than $5 million
CEO/Executive Director 7 3.3% 5.0%
GuideStar Nonprofit Compensation Report | Page 1 of 310
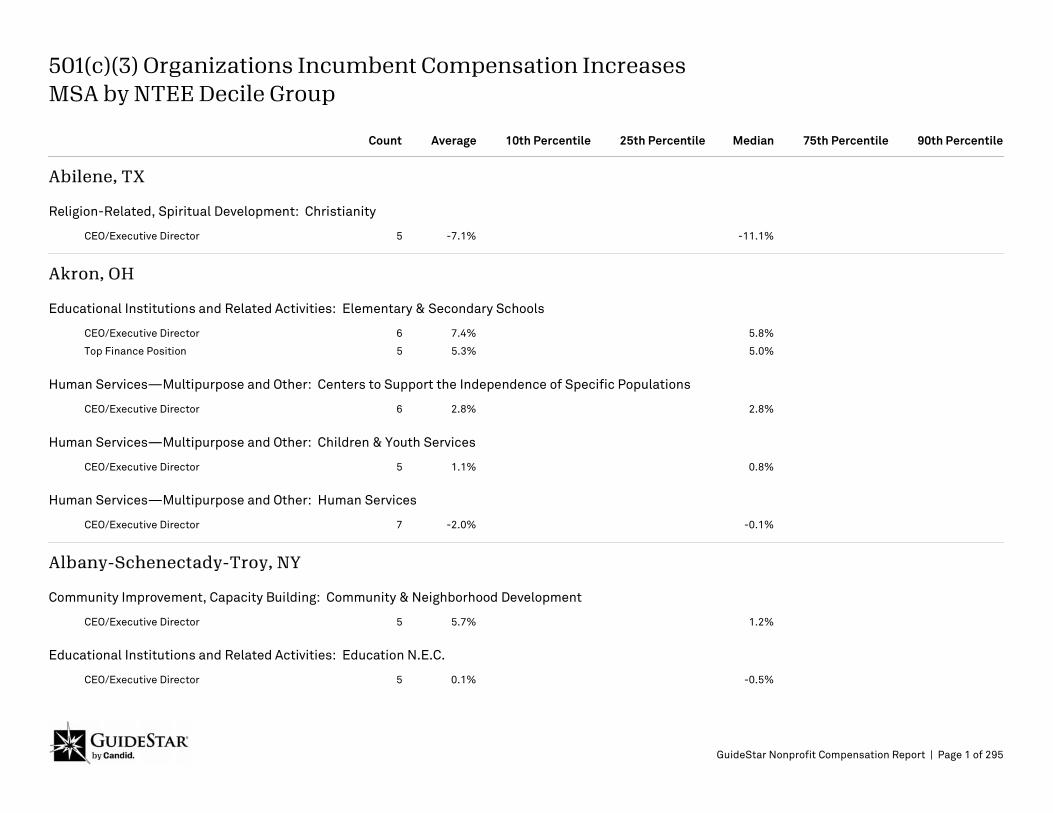
Count Average 10th Percentile 25th Percentile Median 75th Percentile 90th Percentile
501(c)(3) Organizations Incumbent Compensation Increases MSA by NTEE Decile Group
Abilene, TX
Religion-Related, Spiritual Development: Christianity
CEO/Executive Director 5 -7.1% -11.1%
Akron, OH
Educational Institutions and Related Activities: Elementary & Secondary Schools
CEO/Executive Director 6 7.4% 5.8%
Top Finance Position 5 5.3% 5.0%
Human Services—Multipurpose and Other: Centers to Support the Independence of Specific Populations
CEO/Executive Director 6 2.8% 2.8%
Human Services—Multipurpose and Other: Children & Youth Services
CEO/Executive Director 5 1.1% 0.8%
Human Services—Multipurpose and Other: Human Services
CEO/Executive Director 7 -2.0% -0.1%
Albany-Schenectady-Troy, NY
Community Improvement, Capacity Building: Community & Neighborhood Development
CEO/Executive Director 5 5.7% 1.2%
Educational Institutions and Related Activities: Education N.E.C.
CEO/Executive Director 5 0.1% -0.5%
GuideStar Nonprofit Compensation Report | Page 1 of 295
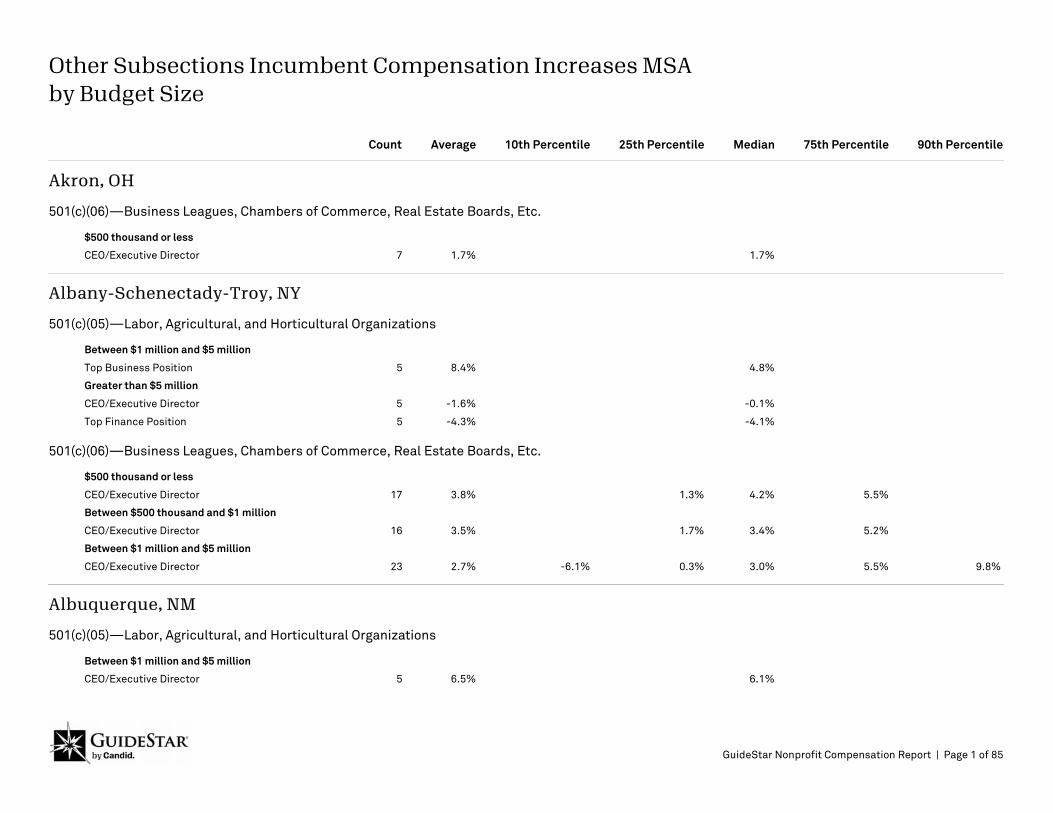
Count Average 10th Percentile 25th Percentile Median 75th Percentile 90th Percentile
Other Subsections Incumbent Compensation Increases MSA by Budget Size
Akron, OH
501(c)(06)—Business Leagues, Chambers of Commerce, Real Estate Boards, Etc.
$500 thousand or less
CEO/Executive Director 7 1.7% 1.7%
Albany-Schenectady-Troy, NY
501(c)(05)—Labor, Agricultural, and Horticultural Organizations
Between $1 million and $5 million
Top Business Position 5 8.4% 4.8%
Greater than $5 million
CEO/Executive Director 5 -1.6% -0.1%
Top Finance Position 5 -4.3% -4.1%
501(c)(06)—Business Leagues, Chambers of Commerce, Real Estate Boards, Etc.
$500 thousand or less
CEO/Executive Director 17 3.8% 1.3% 4.2% 5.5%
Between $500 thousand and $1 million
CEO/Executive Director 16 3.5% 1.7% 3.4% 5.2%
Between $1 million and $5 million
CEO/Executive Director 23 2.7% -6.1% 0.3% 3.0% 5.5% 9.8%
Albuquerque, NM
501(c)(05)—Labor, Agricultural, and Horticultural Organizations
Between $1 million and $5 million
CEO/Executive Director 5 6.5% 6.1%
GuideStar Nonprofit Compensation Report | Page 1 of 85