Growing Annual Report 2008 Partnerships Worldwide
88
Annual Report 2008 Growing Partnerships Worldwide
Transcript of Growing Annual Report 2008 Partnerships Worldwide

A n n u a l R e p o r t 2 0 0 8G r o w i n gP a r t n e r s h i p sW o r l d w i d e
Fenner is a world leader in reinforced polymer technology.
Our strategy is to increase market share and target newvalue added product areas.
We will continue to concentrate on growing thosebusinesses where we already demonstrate leadershipthrough our skills in applications, design, materialstechnology and dedication to customer service as well asby carefully planned acquisitions.
G r o w i n gP a r t n e r s h i p sW o r l d w i d e
Contents
1 Financial Highlights
2 Chairman’s Statement
5 Business Review - ChiefExecutive Officer’s Review
1 3 Business Review - GroupFinance Director’s Review
1 6 Business Review - Definition ofKey Performance Indicators Used
1 7 The Board
1 8 Corporate Governance
2 3 Corporate Responsibility Report
2 7 Board Remuneration Report
3 4 Directors’ Report
3 8 Independent Auditors’ Report
3 9 Group Financial Statements
7 6 Independent Auditors’ Report- Company
7 7 Company Financial Statements
8 2 Five Year Summary of the Group
8 3 Annual General MeetingAdvisorsFinancial Calendar

F i n a n c i a l H i g h l i g h t s
F e n n e r P L C 1
2008 % increase£m on 2007
Revenue 437.8 +15%
Operating profit before amortisation of intangible assets acquired and exceptional items 49.3 +26%
Operating profit 43.8 +15%
Profit before taxation 36.3 +8%
Adjusted earnings per share before amortisation of intangible assets acquired and exceptional items 17.5p +16%
Basic earnings per share 15.5p +3%
Dividend per share 6.6p +6%

A y e a r o f s t r o n go r g a n i c a n da c q u i s i t i v e g r o w t h
C h a i r m a n ’ s S t a t e m e n t
FINANCIAL HIGHLIGHTSRevenue increased to £437.8m (2007£380.8m), driven by robust activity levels inboth divisions and acquisitive growth of£18.5m. The Conveyor Belting ("CB")Division experienced high levels of demandin its major markets against a backdrop ofbuoyant global coal markets. In theAdvanced Engineered Products ("AEP")Division, overall high activity levels andstrong performances from the acquiredbusinesses were marginally tempered bysome softer markets in our PrecisionPolymers businesses.
Operating profit before amortisation ofintangible assets acquired and exceptionalitems increased to £49.3m (2007 £39.0m),with the contribution from acquisitionsamounting to £4.1m.
Exceptional items of £3.4m (2007 £0.2m)principally related to the costs associatedwith the expansion of the heavyweightconveyor belting business in North Americaand the profit on disposal of its non-corelightweight PVC conveyor belting operation.
Operating profit was £43.8m (2007 £38.2m).Net finance costs increased to £7.5m (2007£4.6m) as a result of higher borrowingsrelating to the Group’s strategic expansion.
The headline and underlying tax rates were29% and 30% respectively. Adjustedearnings per share before amortisation ofintangible assets acquired and exceptionalitems was 17.5p per share (2007 15.1p).Basic earnings per share amounted to 15.5pper share (2007 15.0p).
Net cash from operations generated £45.7m(2007 £53.3m) and included an investmentin working capital of £8.2m associated withgrowth, with working capital ratiosmaintained at prior year levels. Investingactivities amounted to £104.2m (2007£35.4m), in accordance with our strategicexpansion plans. In part, this expansion wasfunded by £35.4m of equity raised in March2008 through the placing of 15.7m ordinaryshares. Net debt was £97.6m (2007£36.3m), in line with expectations despite anincrease of £10.9m relating to the translationof foreign currency borrowings. Interestcover was 6.8 times (2007 8.9 times).
The Board is recommending a final dividendof 4.4p per share which gives a totaldistribution for the year of 6.6p per share(2007 6.225p), a 6% increase on 2007.
ACQUISITIONS AND INVESTMENTIt is most encouraging to report on the majorgrowth initiatives around the Group. Theimplementation of our strategic plan hasbeen successful with seven businessesacquired during the year and one disposal.After the year end, two further acquisitionswere completed. This reflects our plansindicated in our share placing which wasannounced in March 2008.
In November 2007, B-LOC in the US wasacquired by AEP for an initial considerationof £4.4m with future contingent deferredconsideration estimated at £0.6m at the yearend. Its products extend and complementour existing range of high value added,proprietary drive solutions.
I am delighted to report on a year of strong organic and acquisitive growth. The
number of new businesses acquired has been unprecedented. These have performed
well in the period from acquisition and their contribution, when combined with
excellent results from our existing operations, has led to a 26% increase in operating
profit before amortisation of intangible assets acquired and exceptional items.
2 F e n n e r P L C

In December 2007, Spliceline in Australiawas acquired by CB, expanding our servicecoverage in the Northern Territory. The initialconsideration was £0.7m with £0.2mdeferred to a later period.
In February 2008, Prodesco, Inc in the USwas acquired by AEP for an initialconsideration of £24.2m and estimatedcontingent deferred consideration at the yearend of £8.1m, over a five year period.Prodesco, Inc comprises two businesses;Prodesco and Secant Medical. Prodescoproduces a range of highly specialisedwoven, knitted and braided fabrics which areused in the industrial, aerospace andchemical sectors. Secant Medicalspecialises in the design, development andmanufacture of complex implantable fabricsfor the medical device industry. Theacquisition enhances our core expertise intextile engineering and provides an excitingopportunity to expand our product portfoliointo a growth segment of the medical market.
In March 2008, Winfield Industries in the USwas acquired by AEP for £6.9m. Winfield is aleading supplier of performance criticalrollers for digital imaging applications and isa natural fit with our Precision business.
Also in March, our geographical coverage inSouth Australia was enhanced whenNorthern Belting Specialists Pty Ltd wasacquired by CB for £2.3m. The businessspecialises in belt splicing, rubber lining,mechanical and technical servicing andbelting sales.
In April 2008, the business of King EnergyServices in New Mexico, US was acquiredby CB for £2.9m followed in August 2008 bythe acquisition of the business of KingEnergy Services in Colorado, US for £3.5m.These businesses, which are now integratedinto Fenner Dunlop Conveyor Services,enable us to offer a full service capability inthe south west mining region of the US.
Our non-core lightweight PVC conveyorbelting business in the US was divested inJuly 2008 for £5.0m excluding costs.
Post year end, in October 2008, the Groupacquired the businesses of the Conveyor
Services Corporation group of companies,including Loadout Services, principallylocated across the US, with a majorityinterest in Conveyor Services, SA in Chile,and Solid Systems Engineering, LLC inWyoming. The total initial consideration was£31.0m with estimated contingent anddeferred consideration payable of £22.0m(based on the exchange rates at the dates ofcompletion). These acquisitions extend therange and scope of services offered to ourcustomers and represents an importantfurther step towards our goal of building aworld class mining service operation whichmakes Fenner Dunlop Conveyor Services theleader in its field in the Americas.
Our organic capital investment programmesadvanced during the year. The integration ofour seals business in Houston onto a singlesite was completed ahead of schedule whilstour major projects in the CB Divisioncontinued to progress and will contribute tooperational performance in 2009.
OPERATIONSThe CB Division’s result was strong asdemand levels benefited from buoyantmining conditions in its major markets. InAsia Pacific, the continuing expansion andwider geographical coverage enabled us tofurther develop our product and serviceofferings. In Europe, the focus on developingnew markets and leveraging our strongDunlop brands was rewarded with highervolumes. In North America, demandremained high while some anticipatedmargin decline was evident in the lattermonths of the year as raw material costsincreased significantly. The growth of ourservice businesses through the acquisitionscompleted to date has enhanced ourcapability to offer a complete engineeredsolution to our customers.
The AEP Division traded well, overcominguncertainty and some softer markets in thePrecision Polymers businesses. Our newlyacquired businesses performed strongly andassisted in the penetration of growthmarkets. The Advanced SealingTechnologies businesses made solidprogress with continuing strength in the oiland gas and mining sectors.
F e n n e r P L C 3

PEOPLEThe success of the Group is due to the talentand dedication of colleagues around theworld. On behalf of the Board, I would like toextend my gratitude and appreciation fortheir continuing support.
OUTLOOKWe enter the new year with healthy orderbooks for our CB businesses. Despite thetemporary disruption from Hurricane Ike, ourAEP businesses started with similar saleslevels to the end of last year.
There has been a limited initial impact on usfrom the global financial crisis but we are ofcourse alert to the wider economic effectsthat are generally expected. These are morelikely to be seen in industrial marketsalthough the niche nature of our businessesand the diversity of our markets provideadditional strength and resilience. Theenergy markets remain buoyant with apositive outlook, particularly for coal,notwithstanding the recent reduction in theprices of commodities. The majority of ourproducts and services are consumablesupplies and are therefore driven by usagerather than the price of commodities.Accordingly the output for these remainsrobust.
Despite the inevitable challenges, we believewe are very strongly placed to out-perform.For the longer term, our business driversremain highly positive.
Colin CookeChairman
4 F e n n e r P L C
C h a i r m a n ’ s S t a t e m e n t c o n t i n u e d

INTRODUCTIONThis Business Review sets out the strategicobjectives of the Group and its businesses,as well as a review of progress in 2008, theoutlook for 2009 and beyond and anassessment of the key risks anduncertainties.
During the past year Fenner hasstrengthened its position as a world leaderin reinforced polymer technology throughboth acquisition and organic investment.The aim of the Fenner businesses is todeliver high quality, value added productsand services to our customers. Whereverpossible we operate in niche markets whichenable the operations to avoid the highlycompetitive, low margin commodity end ofthe markets in which we operate. Thiscommon aim enables Fenner to deliver asolid basis for long term growth, stabilityand shareholder value. Fenner is proud tobe a world class global manufactureroperating in key territories in establishedand emerging markets.
The Fenner Group consists of two Divisions,the Conveyor Belting (“CB”) Division and theAdvanced Engineered Products (“AEP”)Division.
The CB Division is a recognised worldleader in the global conveyor belting market,concentrating on heavyweight ply, solidwoven and steel cord conveyor belting formining, power generation and industrialapplications. During the year, it has beenexpanding its service offering throughorganic growth and acquisitions to satisfy itscustomers' requirements from belt order toinstallation and maintenance. Thelightweight non-rubber conveyor beltingoperation, based in Charlotte, NorthCarolina, was sold to Forbo Seigling, Inc (amajor force in that market) and, although wedivested manufacturing capability, strongstrategic links remain.
The AEP Division is divided into five productgroup based businesses which aremanaged on a global basis. Thesebusinesses are as follows:• Fenner Precision, which is a leading
supplier of performance critical polymercomponents to the office automationindustry;
• Fenner Drives, which designs,manufactures and sells an extensiverange of bespoke solutions for mechanicalpower transmission and motion transferapplications;
• The supply of silicone and EPDMspeciality hoses for the diesel engine,truck, bus and off-road equipment OEMmarket, trading as James Dawson;
• Fenner Advanced Sealing Technologies("FAST") comprising hydraulic andpneumatic seals for the global fluid powerindustry, trading as Hallite and bespokesealing products for process applicationsincluding oil and gas, electronics, pumps,valves, compressors and aerospaceapplications, trading as CDI/EGC; and
• Technical textiles, trading as Prodescoand Secant Medical.
Prodesco, Inc together with its subsidiarySecant Medical, LLC, acquired in February2008, not only brought a complementaryindustrial textile business but also satisfied along term goal of entering into niche medicalapplications which provide further excitingopportunities for AEP.
Both CB and AEP provide high quality,comprehensive, whole life value products fortheir customers, and both have a strongbrand and reputation in their chosenmarkets. These characteristics areconsidered to be key to the success of theGroup over its long history. Customersatisfaction is of importance to all businessunits, who ensure they are meeting theircustomer expectations which are specific toeach market. Performance measurements
“After a year of strategic investment the Group is strongly positioned to face the
challenges of economic circumstances.”
Mark Abrahams - Chief Executive Officer
R o b u s t a n dr e s i l i e n t
B u s i n e s s R e v i e wC h i e f E x e c u t i v e O f f i c e r ’ s R e v i e w
F e n n e r P L C 5

B u s i n e s s R e v i e wC h i e f E x e c u t i v e O f f i c e r ’ s R e v i e w c o n t i n u e d
include customer surveys and “on time infull” performance.
STRATEGIC OBJECTIVESIt has been a very exciting year for theGroup with organic investment andacquisition activity in both Divisions whichexpand the product ranges, geographiccoverage, routes to market, service offeringand market shares. The investments andacquisitions ensure Fenner continues togrow its reputation as a specialist polymerengineering company and help it maintainprofitability throughout the economic cycle.
The acquired Secant Medical business isthe ideal custom manufacturing partner forthe most demanding medical deviceengineering challenges. Working withpartners, both large and small, itsexperience with specialised biocompatiblemedical textile structures is aimed to helpbring new biomedical device ideas tomarket. Prodesco produces highlyspecialised technical fabrics forperformance critical applications inindustrial, aerospace and chemicalequipment markets. The Prodesco andSecant Medical businesses will remainautonomous operations within the Group.
The other acquisitions for AEP were B-LOCand Winfield Industries. B-LOC, which hasbeen fully integrated into the Fenner Drivesbusiness of AEP in Manheim, is a leadingsupplier of multi-screw keyless bushings andcomplements the existing Fenner Drivesrange. It has opened up channels to marketfor both the historical Fenner Drives andB-LOC products. Winfield Industries isrecognised as a leading supplier ofperformance critical rollers for digital imagingapplications and allows Fenner Precision togain access to the rapidly growing market fordigital printing presses. With a significantmarket share in the mature inkjet market, thisacquisition enables Fenner Precision to offeran unrivalled range of technical capability,products and experience to the global officeautomation market.
The seals manufacturing operation inHouston completed the major factoryexpansion ahead of schedule. Not only did itsuccessfully integrate the EGC business intothe new facility on budget but also out-performed the plan throughout the process.The improved layout and investment inequipment has seen efficiencies and marginsimprove at the combined facility, which is nowstate of the art, and provides the springboardfor further growth and market diversification
from this dynamic business with strongadvanced materials capabilities.
The FAST operations in China continue to dowell and additional manufacturing lines havebeen relocated from the Hampton site toChina ahead of plan. The Hampton sealsoperation was highly successful in securingnew and additional business which enabledit to grow, notwithstanding the transfer ofbusiness to China. Other strategic initiativesprogressed well during the year. Theseincluded the geographical expansion ofmarkets serviced with sales, technical andcustomer service teams recruited in Chinaand Brazil and strengthened service teamsacross the globe.
The CB operations in Australia havereceived both major organic and acquisitioninvestment. A planned investment in a newsteel cord facility is now underway in Perth,Western Australia. This facility is located toservice the fast growing iron ore sector ofthe Australian economy which, together withcoal, are the main trading and exportsectors for Australia. There have also beenstrategic acquisitions of service businessesin Darwin and Whyalla which service theNorthern Territories and the multi-mineral orebodies in South Australia respectively. Thesehave added to the successful FennerDunlop Conveyor Services business alreadyoperating in Australia. Leading with a focuson safety, the expertise and strength of theservice team and management continuesthe strategy to maintain the broadestnational coverage in Australia and to ensurethat the operation is well placed to takeadvantage of opportunities in the regionswith significant mining growth.
The success of the service model inAustralia is being leveraged in the Americaswith the acquisitions of King EnergyServices in Colorado, King Energy Servicesin New Mexico, the Conveyor ServicesCorporation group of companies and SolidSystems Engineering. These businesses willform the backbone of the Fenner DunlopConveyor Services business for NorthAmerica. Work is underway to integratethese businesses into the Group. Not only isFenner Dunlop Conveyor Services thelargest belt servicing business focused onthe mining industry but the locations of ourbranches also align with those of ourcustomers. The strength of the servicebusiness will support the wider productoffering from the expanded Fenner DunlopAmericas manufacturing operation. Further,experience suggests the service business is
6 F e n n e r P L C

counter cyclical to belt sales, helping toensure that the CB operation has someprotection from market cycles.
CB has also invested in a significant numberof manufacturing plants with the continuationof the investment in the North Americanplants in Port Clinton and Toledo togetherwith the construction of a purpose built,bespoke weaving operation in Hart County,Georgia. These new facilities will improveflexibility and efficiencies in both productionand energy consumption and reduce waste.As well as extending the product range,capacity constraints of prior years,particularly for steel cord belting, will also beeased. Coupled with our new plant, theservice business acquisitions mean thatFenner Dunlop Americas not onlymanufactures the full range of productsrequired by our customers but also haslocations close by, offering comprehensiveservice and support.
Investment in the South African operationwas also completed in the year with theinstallation of a steel cord line to enable it tosupply both the domestic and exportmarkets. Following investment in theprevious year, China saw the introduction ofa range of Dunlop branded belts,successfully targeted at broadening thecustomer base.
As a diversified Group, Fenner uses a widerange of materials, from traditional cottonyarns to the latest perfluoroelastomers. Notonly do we use significant volumes of somematerials, we also work closely with selectedsuppliers to ensure that our customersbenefit from the latest technicaldevelopments in materials and processes.Most of these relationships are in the normalcourse of business, ensuring quality,continuity of supply and reasonablecommercial terms. Where appropriate, andusually relating to technical developments,relationships are formally documented.
CONVEYOR BELTINGMost of the CB operations experiencedpositive trading conditions through the yearunder review although all faced a variety ofchallenges including the effects of volatile rawmaterial prices and availability, competitivethreats and availability of skilled labour.Capacity constraints of prior years have beenaddressed and, where new constraints havearisen, are being addressed with the resultthat the operations are well placed to defendtheir position in the markets.
The global demand for bulk commoditiesincluding iron ore, copper, potash and thedemand for power, in the form of coal,helped to ensure that the global CBoperations had a strong year with increaseddemand and improved return on sales,particularly in Europe, Australia and China.North American operations had strong orderbooks through the year but were impactedsomewhat by pricing constraints and rawmaterial price volatility. Price increases arebeing implemented where possible and theoperations work closely with suppliers andcustomers to help facilitate and build on thestrong relationships in the supply chain.
Volume constraints have driveninternationally traded coal prices to an alltime high, as shown in the McCloskey graphbelow. Over the last three years coal priceshave remained comfortably over the“trigger” value at which coal companies buybelt. The volume of coal being minedcontinues to increase as demand for energyin China, India and South East Asia remainsstrong, together with a desire in the US to beindependent from energy suppliers,particularly for oil. Globally, coal resourcesare located in less politically fragile markets.Whilst prices have probably peaked, thevolume demand for coal remains bullish andthe long term outlook remains good.
With the additional steel cord capacity, otherminerals, particularly iron ore, become moreimportant to Fenner and, almost withoutexception, volumes and prices have beenstrong throughout the year.
ADVANCED ENGINEERED PRODUCTSAll operations within AEP aim to providehigh value added solutions to theircustomers’ needs using advancedpolymeric materials, expertise in applicationdesign, effective manufacturing design skillsand timely delivery.
F e n n e r P L C 7
NW Europe - Steam Coal Marker
Monthly Average
B u s i n e s s R e v i e wC h i e f E x e c u t i v e O f f i c e r ’ s R e v i e w c o n t i n u e d
Raw material price increases and the risingcost of energy were a feature of tradingthroughout the year, driven by the increasein commodity prices. Flexible pricingstrategies with customers enabled many ofthese costs to be recovered. The focusremains on performance critical productswhich are not selected on price alone butthe value they add to the customer.
FAST continued with its recent strongperformance and achieved yet anotherrecord year of growth. Continuing demandfor seals used in oil, gas and miningapplications remains robust but there hasalso been an increase in demand forproducts used in general hydraulic andaerospace applications. The roll out of theSix Sigma continuous improvementprogramme continued across all locationswith the result that lead times and availabilityimproved significantly during the year. FASTremains committed to its geographicalexpansion of markets served to include Asiaand South America. Some product areas areexpected to be impacted by the slowdownin the economy, principally seals used in thesemiconductor industry, processingequipment and seals for hydraulicequipment used in the construction industry.Any weakening of demand is expected tobe compensated for by the initiatives thathave been put in place to grow the businessoverall.
The James Dawson hose business finishedthe year well despite some unforeseenadverse impacts of VAT changes in China.Demand levels were good for the first threequarters of the year but slowed in the finalquarter as the effects of the downturn in theconstruction industry impacted on theoff-road equipment market. The outlook forthe construction industry is not expected toimprove in 2008/09. The operation in Chinacontinues to grow in strength and capabilityas domestic Chinese manufacturers seek toredesign engines and vehicles to complywith emissions legislation which wasenacted in China in the summer of 2008.
Fenner Precision completed the acquisitionof Winfield Industries in March 2008 andquickly integrated the global sales andmarketing activities of both businesses sothat the consolidated sales force is focusedon cross selling products. This has resultedin new opportunities for growth beingidentified. Fenner Precision enjoyed strongdemand from the ATM sector as well as thecommercial digital printing market but therewas some shortfall from the consumer
related office automation sector. Growth isexpected to resume in 2008/09, led by thedigital printer market demand.
Fenner Drives integrated the acquiredB-LOC business and produced excellentresults with synergies from the acquisitionbeing achieved during the year. Salesincreased rapidly in targeted markets as aresult of the investments made during theprior two years. The business continues todevelop and market a growing range ofinnovative, proprietary products which solveproblems in the motion control, powertransmission and unit handling markets. Thegeneral industrial markets are feeling theeffects of the economic slowdown,particularly in the latter stages of the yearunder review, and this trend is expected tocontinue into the first half of the newfinancial year.
The Prodesco and Secant Medicalbusinesses have yet to complete a full yearwithin the Fenner Group but early indicationsare very positive and the cultural fit with AEPis excellent. They produced encouragingresults in the half year they have beenowned by Fenner. A strategic review of thebusiness was carried out during the year tohelp identify future growth and development.Secant Medical is believed to be cushionedfrom the effects of the slowing economybecause its growth is largely driven by thedemographics of an ageing population. TheProdesco business is exposed to theindustrial and aerospace markets.
The AEP division will continue to look forgrowth opportunities and to build upon itsconsiderable strengths and overall ismaking good progress against the currentstrategic plan.
OUTLOOKGiven the global financial crisis, we continueto monitor very closely all relevant aspectsof our business including credit, customerand supplier stability and raw material pricevolatility. Although commodity prices areweakening, the volume demand remainsstrong and it is volume rather than pricewhich leads to consumption of our products.The niche nature of our businesses providessignificant additional strength in times ofuncertainty.
EMPLOYEESFenner continues to benefit from a stable,skilled and committed workforce in both ouracquired and existing businesses and weacknowledge the importance of our
8 F e n n e r P L C
employees’ contribution to the performanceof the Group. All businesses have processesthat require high levels of skill and technicalexpertise. Many of the end products areused in safety critical applications, perhapsepitomised by the Secant Medicalsubstrates, and therefore a skilled andmotivated workforce is essential to maintainproduct safety, reliability and quality.
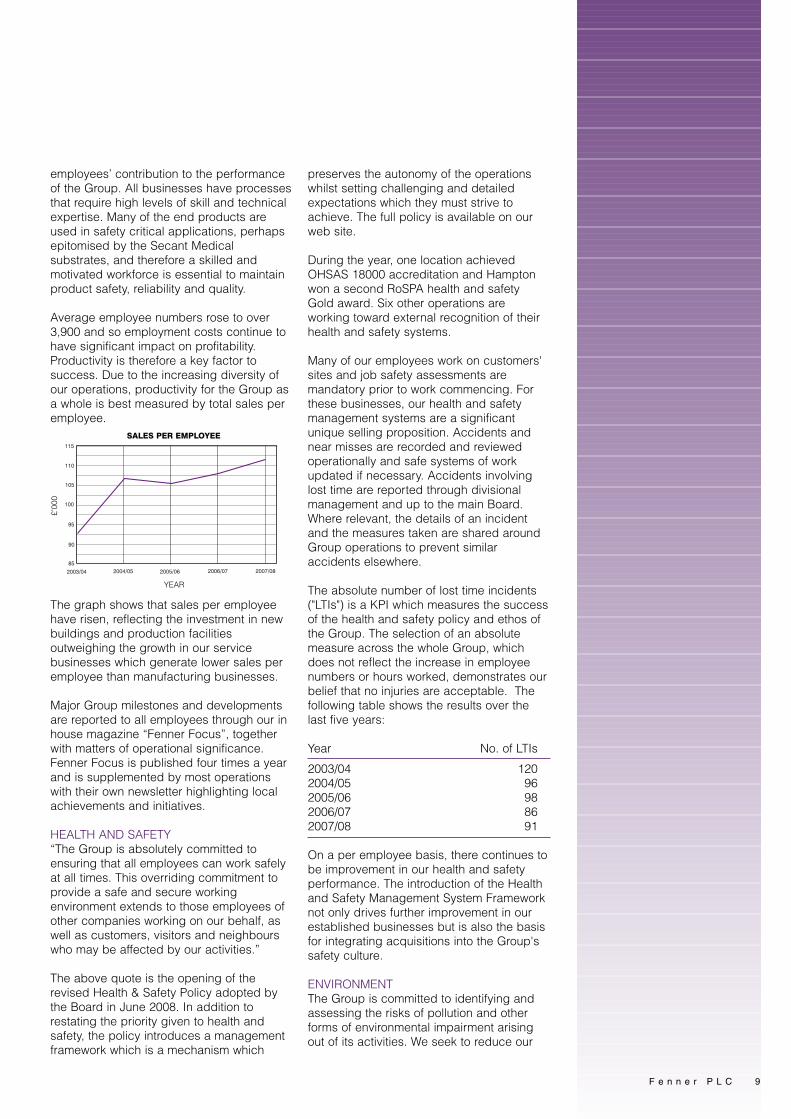
Average employee numbers rose to over3,900 and so employment costs continue tohave significant impact on profitability.Productivity is therefore a key factor tosuccess. Due to the increasing diversity ofour operations, productivity for the Group asa whole is best measured by total sales peremployee.
The graph shows that sales per employeehave risen, reflecting the investment in newbuildings and production facilitiesoutweighing the growth in our servicebusinesses which generate lower sales peremployee than manufacturing businesses.
Major Group milestones and developmentsare reported to all employees through our inhouse magazine “Fenner Focus”, togetherwith matters of operational significance.Fenner Focus is published four times a yearand is supplemented by most operationswith their own newsletter highlighting localachievements and initiatives.
HEALTH AND SAFETY“The Group is absolutely committed toensuring that all employees can work safelyat all times. This overriding commitment toprovide a safe and secure workingenvironment extends to those employees ofother companies working on our behalf, aswell as customers, visitors and neighbourswho may be affected by our activities.”
The above quote is the opening of therevised Health & Safety Policy adopted bythe Board in June 2008. In addition torestating the priority given to health andsafety, the policy introduces a managementframework which is a mechanism which
preserves the autonomy of the operationswhilst setting challenging and detailedexpectations which they must strive toachieve. The full policy is available on ourweb site.
During the year, one location achievedOHSAS 18000 accreditation and Hamptonwon a second RoSPA health and safetyGold award. Six other operations areworking toward external recognition of theirhealth and safety systems.
Many of our employees work on customers'sites and job safety assessments aremandatory prior to work commencing. Forthese businesses, our health and safetymanagement systems are a significantunique selling proposition. Accidents andnear misses are recorded and reviewedoperationally and safe systems of workupdated if necessary. Accidents involvinglost time are reported through divisionalmanagement and up to the main Board.Where relevant, the details of an incidentand the measures taken are shared aroundGroup operations to prevent similaraccidents elsewhere.
The absolute number of lost time incidents("LTIs") is a KPI which measures the successof the health and safety policy and ethos ofthe Group. The selection of an absolutemeasure across the whole Group, whichdoes not reflect the increase in employeenumbers or hours worked, demonstrates ourbelief that no injuries are acceptable. Thefollowing table shows the results over thelast five years:
Year No. of LTIs
2003/04 1202004/05 962005/06 982006/07 862007/08 91
On a per employee basis, there continues tobe improvement in our health and safetyperformance. The introduction of the Healthand Safety Management System Frameworknot only drives further improvement in ourestablished businesses but is also the basisfor integrating acquisitions into the Group'ssafety culture.
ENVIRONMENTThe Group is committed to identifying andassessing the risks of pollution and otherforms of environmental impairment arisingout of its activities. We seek to reduce our
SALES PER EMPLOYEE
YEAR
£’00
0
F e n n e r P L C 9
B u s i n e s s R e v i e wC h i e f E x e c u t i v e O f f i c e r ’ s R e v i e w c o n t i n u e d
impact on the environment to the lowestpractical levels and with each newinvestment ensure that we exemplify thebest contemporary practice in respect of theenvironment. At Board level, the ChiefExecutive Officer has specific responsibilityfor the development of policy andmanagement systems. Responsibility forenvironmental matters in each operatingdivision is designated to the DivisionalManaging Director and, at a local level, to asenior manager on each site. EachDivisional Managing Director is required toreport to the Board on a regular basis and toadvise the Board immediately of anyenvironmental risks or other incidents likelyto be significant to the business. No newrisks or incidents were reported to the Boardin the last year.
All acquisitions are subject to appropriateenvironmental due diligence which isspecifically extended to includeenvironmental management systems andoperational compliance. Compliance withapplicable regulatory standards is aminimum which is subject to official audit;other larger facilities validate theirmanagement systems by independent audit.Significant progress is being made onenvironmental management systems withone site achieving ISO 14000 and six otherlocations actively progressing towardsaccreditation in 2008 or 2009.
We are exploring suitable environmentalKPIs for the Group as a whole which canthen be reported in future years. Areasbeing looked at include energy consumptionand waste management, both of whichpotentially have a direct environmental andbusiness impact. A small number ofoperations have assessed their carbonfootprint with a view to seeing if somemeaningful actions can result from suchmeasures and to prepare for a localcompliance requirement. To date the view isthat, whilst progress is being made, carbonfootprint estimates are not yet a validconsistent measure comparable across thewide range of sizes, technologies andlocations of the Group’s units.
In addition to our environmentalresponsibilities, there are sound commercialreasons to minimise and recycle waste. As amanufacturing Group, the obvious focus ison raw materials as the reductionopportunities are well known and, for theresidual waste, recycling well understood.However, in a number of locations there issubstantial water usage. This can be a
significant local issue, for example inAustralia, where our conveyor belting plantin Melbourne voluntarily reducedconsumption by over 60%.
Air quality can be adversely affected bysome of our processes and significantinvestment and maintenance costs areincurred to ensure this does not happen.A number of locations use processes whichinvolve a range of chemicals which aregenerically referred to as volatile organiccompounds (“VOCs”). These chemicals aresubject to strict regulation with their storageand use carefully controlled. In addition tominimising any emissions to air of VOCs,potential substitutes are assessed as soonas they become commercially available.
The majority of the Group’s businesses haveoccupied their sites for many years, somefor over 100 years. The Group thereforerecognises and manages risk of exposure toenvironmental legacy issues.
Fenner continues to be committed toundertaking regular reviews of its activitiesand the workings of the environmental policyto ensure that it is comprehensive andeffective, identifying objectives and standardsthat will enable a demonstrable continuousimprovement in environmental matters.
PRINCIPAL RISKS AND UNCERTAINTIES Fenner considers the following to be themost significant risk factors for Fenner toconsider, but the risk factors listed do notnecessarily comprise all those associatedwith Fenner and are not set out in anyparticular order of priority.
Additional risks and uncertainties notpresently known to Fenner or that Fennercurrently deems immaterial may also havean adverse effect on its business.
Strength of key marketsThe impact of the recent unprecedentedfinancial market movements andsubsequent government interventions onFenner’s key markets are uncertain.However, Fenner is well positioned to benefitfrom the underlying volume growth in energymarkets, particularly oil and coal, andrecovery in industrial markets. AlthoughFenner has successfully traded throughprevious cycles, a substantial downturn inone or more of these key markets couldhave a material adverse impact on thebusiness. Fenner continues to look foropportunities that are counter cyclical tohelp balance out any market downturn.
1 0 F e n n e r P L C

Fluctuations in raw material costsVolatility in raw material costs continues tobe a key risk for the Group as there is adirect impact on the costs of production andmanaging customer expectation. The Groupcontinues to try to manage raw materialcosts. For example, where materials are asignificant cost of sale, we have long termsupply agreements and arrangements whichare driven by the constraints of the marketsinto which we sell. However, increases insuch costs could have a material adverseimpact upon the Group’s profitability andcash flow if such increases cannot berecovered through increased sales prices.
Climate changeIncreasing media attention is being given toclimate change and the political will to actappears to be responding to that coverage.Fenner takes full account of the substantivepublicised research in evaluating itsstrategic projects. The adoption of non-fossilfuel generation substantially in excess of theIEA Advanced Technology Scenario wouldhave a material adverse effect on thebusiness.
Fluctuations in foreign currencyDue to the global nature of the Group,Fenner derives a large proportion of itsrevenues from overseas and hence has anexposure to foreign currency fluctuations.Whilst the Group seeks to reduce this riskthrough formal contracts and borrowings,adverse movements in foreign currencies,particularly the US dollar relative to sterling,could lead to material adverse movementsin reported earnings.
CompetitionProducts are available which competedirectly or indirectly with the Group’sproducts. New technology, changingcommercial circumstances and new entrantsto the markets in which the Group operatesmay adversely affect the Group’s business.One source of competition comes from thelow cost economies but whilst these cancompete on price, they cannot alwayscompete on quality or service. Aggressive orpredatory pricing from competitors couldlead to a reduction in margin or volume.
Dependence on key personnelThe future success of Fenner is dependenton the continued services of key personnel.Although the Group has succession plansand seeks to develop and promote fromwithin, the loss of the services of theexecutive officers of the Group and other
key employees could have a materialadverse effect on the business.
Fluctuations of revenues, expenses andoperating resultsFenner’s revenues, expenses and operatingresults could vary from period to period as aresult of a variety of factors, some of whichare outside Fenner’s control. These factors,which are actively monitored andconsidered in all relevant managementdecisions, include general economicconditions, adverse movements in interestrates, conditions specific to the energymarkets, seasonal trends in revenues,capital expenditure, other costs and theintroduction of new products by Fenner or itscompetitors.
In response to a changing competitiveenvironment, Fenner may elect from time totime to make certain pricing, service ormarketing decisions or acquisitions thatcould have a material adverse effect on theGroup’s revenues, results of operations andfinancial condition. Despite the currentstrength of Fenner’s order book and orderpipeline, there is no guarantee that theseorders and expected orders will beconverted into sales, which could have amaterial adverse effect upon continuingprofitability and cash flow.
Employee benefit schemesThe Group has a number of employeebenefit schemes, including defined benefitpension schemes and US healthcareprogrammes. These schemes expose theGroup to changes in interest rates, otherinvestment returns and inflation as well asthe longevity of scheme members.Developments in medical science andchanges in healthcare management cansignificantly increase the cost of maintainingbenefits in the future. Appropriate financialand legal advice is taken on the rules andfunding of all such schemes.
Major projectsThe successful completion of major projects,such as significant capital expenditureprojects or acquisitions, is important to bothsustain and grow the business. All majorprojects have clearly identified resourcesand management responsibilitiesestablished during the approval process.However, failure to deliver on major projectscould have a material adverse impact onFenner’s ability to maximise both profitabilityand cash flow.
F e n n e r P L C 1 1

LitigationSubsidiaries of the Group are currentlyinvolved in certain disputes, actual andthreatened, and regulatory investigations.These disputes are actively managed inconjunction with our lawyers, other advisorsand insurers, with appropriate Boardreporting and oversight. If such disputesand investigations are not resolved inaccordance with the directors’ expectationsor in favour of the relevant subsidiary of theGroup or if a subsidiary incurs significantand unexpected costs or is required todevote significant additional resources,including management time, in the pursuit,defence or investigation of these matters,such disputes and investigations may havea material adverse impact on the business,financial resources, results and/or futureoperations of the Group.
FORWARD-LOOKING STATEMENTSCertain statements contained in thisdocument including those under thecaptions “Outlook” and “Principal Risks andUncertainties”, constitute forward-lookingstatements. Such forward-lookingstatements involve risks, uncertainties andother factors which may cause the actualresults, performance or achievements ofFenner, or industry results, to be materiallydifferent from any future results,performance or achievements expressed orimplied by such statements. Such risks,uncertainties and other factors include,among others: growth in the energy markets,general economic conditions and thebusiness environment, especially followingthe recent unprecedented financial marketmovements and subsequent governmentinterventions.
Mark AbrahamsChief Executive Officer
1 2 F e n n e r P L C
B u s i n e s s R e v i e wC h i e f E x e c u t i v e O f f i c e r ’ s R e v i e w c o n t i n u e d

B u s i n e s s R e v i e wG r o u p F i n a n c e D i r e c t o r ’ s R e v i e w
REVENUE AND OPERATING PROFITReported Group revenue increased by 15%to £437.8m (2007 £380.8m). Of thisincrease, 10% was generated by existingbusinesses and 5% by businesses acquiredduring the year.
In the CB Division, revenue increased to£292.2m (2007 £255.8m), with growth in allterritories as demand for its products andservices remained strong in the principalterritories in which it operates.
In the AEP Division, revenue increased to£145.6m (2007 £125.0m) from acquisitionactivity and strong growth from the sealsbusinesses.
Group operating profit before amortisation ofintangible assets acquired and exceptionalitems increased by 26% to £49.3m (2007£39.0m). Divisional profits contributed were£29.1m (2007 £24.2m) from the CB Divisionand £26.1m (2007 £20.0m) from the AEPDivision.
Exceptional items incurred of £3.4m (2007£0.2m) related to costs associated with theexpansion of the conveyor belting businessin North America of £3.7m (2007 £1.9m),acquisition integration costs of £0.4m (2007£0.8m) and a £0.7m profit on disposal of thelightweight PVC conveyor belting businessin the US.
Amortisation of intangible assets acquiredincreased to £2.1m (2007 £0.6m), reflectingacquisitions completed in the year.
Group operating profit increased by 15% to£43.8m (2007 £38.2m).
INTERESTThe net finance cost was £7.5m (2007£4.6m) and included £0.3m (2007 £0.2m) offinance costs on both discounted provisionsand contingent deferred consideration onacquisitions. The increase largely reflectedthe growth of net debt in the year as a resultof the planned acquisitions and capitalexpenditure. Interest cover was 6.8 times(2007 8.9 times).
TAXATIONThe taxation rate for the year was 29%(2007 29%). The underlying taxation ratebefore amortisation of intangible assetsacquired and exceptional items was 30%(2007 30%). Although the overall rate didnot change, the mix of the taxation chargereflected relatively high taxation ratesincurred on North American profits and an
additional deferred tax charge in the UKcaused by the phasing out of industrialbuildings allowances. These were offset bylower rates elsewhere, which included theutilisation of tax losses and tax assets notpreviously recognised for deferred taxation,particularly in the UK and continentalEurope, and the benefit of a tax holiday inChina.
EARNINGS PER SHARE AND DIVIDENDSBasic earnings per share was 15.5p (200715.0p) and, adjusted for amortisation ofintangible assets acquired and exceptionalitems, was 17.5p (2007 15.1p).
The interim dividend of 2.2p (2007 2.075p)was paid on 8 September 2008. The Boardis recommending a final dividend of 4.4p(2007 4.15p) to make a total dividend for theyear of 6.6p (2007 6.225p).
ACQUISITIONS AND DISPOSALSThe Group has completed sevenacquisitions during the year and two afterthe year end. One business was divestedduring the year.
The acquisitions completed during the yearare disclosed in note 33 to the Groupfinancial statements. The total cashpayments made in respect of theseamounted to £45.9m. The present value ofcontingent and deferred considerationpayable in future periods is estimated at£8.9m at the year end, with a maximumpresent value amount payable of £10.1m.The provisional fair value of net assetsacquired, including intangible amounts, was£41.0m and goodwill of £13.7m wascapitalised.
In October 2008, after the year end, £31.0mwas paid for the businesses of the ConveyorServices Corporation group of companies,including Loadout Services, and SolidSystems Engineering, LLC. The presentvalue of contingent and deferredconsideration payable is estimated at£22.0m (based on exchange rates at thedates of completion), with a maximumpresent value of £25.0m and excluding anyadjustment relating to the final value ofworking capital acquired.
In July 2008, substantially all of the assetsand liabilities of our non-core lightweightPVC conveyor belting operation held withinFenner Dunlop (Charlotte), Inc wasdisposed of for £5.0m, excluding costs, andresulted in an exceptional profit on disposalof £0.7m.
F e n n e r P L C 1 3

B u s i n e s s R e v i e wG r o u p F i n a n c e D i r e c t o r ’ s R e v i e w c o n t i n u e d
1 4 F e n n e r P L C
CASH FLOW, NET DEBT AND FINANCINGStronger profits generated a £53.9m (2007£42.5m) operating cash flow beforemovements in working capital. Toaccommodate growth in the business andmaintain an effective pipeline of inventoryholding while our order book increased inthe final quarter, an investment in workingcapital of £8.2m (2007 decrease of £10.8m)was made. The resultant net cash fromoperations was £45.7m (2007 £53.3m). Afterpayment of interest of £6.3m (2007 £4.3m)and taxation of £11.2m (2007 £10.2m), thenet cash from operating activities was£28.2m (2007 £38.8m). Capital expenditureincreased to £63.7m (2007 £32.0m) inaccordance with our strategic expansionplans. This compares to a depreciationcharge of £10.1m (2007 £8.0m). Afterfunding these expansion programmes anddisposing of assets of £0.5m (2007 £0.2m)the free cash outflow was £35.0m (2007inflow of £7.0m).
The net outflow on acquisition and disposalactivity was £41.0m (2007 £3.6m).Dividends paid of £9.9m (2007 £9.5m) andan inflow from other financing activities of£35.5m (2007 £0.4m), principally relating tothe share placing outlined below, gave anincrease in net debt before the effects ofexchange rate movements of £50.4m (2007£5.7m). The translation effect of strongerexchange rates increased this amount by£10.9m (2007 decrease of £2.5m) whichresulted in an increase in net debt of £61.3mto £97.6m (2007 £36.3m).
Gross debt at the year end amounted to£141.2m (2007 £102.4m). Cash and cashequivalents at the year end were £43.6m(2007 £66.1m).
The Group is financed principally by a mixof equity, retained earnings, US dollarprivate placement loan notes and committedbank facilities. The principal loan facilitiesare raised centrally whilst operatingcompanies supplement this funding withlocal overdraft and working capital facilities.
To support the Group’s growth, a mix ofadditional sources of funding was securedduring the year.
In November 2007, the committed revolvingcredit bank facility with three leading UKbanks was increased from £75m to £100mon the same terms as previously agreed inJune 2007. In May 2008, an Australian $35m(£16.5m) committed five year bank facility
maturing in May 2013 was secured to assistin the funding of our Australian operations’expansion. This was achieved on covenantterms which were aligned with the UKcommitted facility. At 31 August 2008,£65.2m (2007 £33.5m) of these facilitieswere drawn down leaving £51.3m (2007£41.5m) available.
In March 2008, a placing of 15.7m newordinary shares with institutional investors at233p per share raised £35.4m after costs.
The Group’s other principal source of fundsremained two US dollar private placements;$90m of Senior Notes repayable in June2017 carry a fixed interest coupon of 5.78%;and $27.2m (2007 $34.1m) of Senior Notes,repayable between 2009 and 2012 carry afixed interest coupon of 7.29%.
The committed bank facilities and the 2017private placement have net debt to EBITDAratio and interest cover covenants. At 31August 2008, the Group’s net debt toEBITDA ratio was 1.7 times (2007 0.8 times).The increase reflects the plannedexpenditure in the year and remainscomfortably within the Board’s parameters.For compliance with loan covenants, theEBITDA reported in the financial statementsis adjusted for, inter alia, acquisitions anddisposals, which makes the net debt toEBITDA ratio significantly lower.
The Group is well placed, notwithstandingthe current disruption of financial markets, tofund and support its operations, withcontinuing access to medium and long termdebt finance, cash resources and, wherenecessary, shorter term facilities.
ACCOUNTING POLICIESThe Group financial statements have beenprepared in accordance with the accountingpolicies described in note 1 to the Groupfinancial statements, in accordance withIFRS as adopted by the European Union.
The Company financial statements havebeen prepared in accordance with theaccounting policies described in note 1 tothe Company financial statements, inaccordance with UK GAAP.
FINANCIAL RISK MANAGEMENTIn the normal course of business, the Groupis exposed to certain financial risks,principally foreign exchange risk, interestrate risk, liquidity risk and credit risk. Theserisks are managed by the central treasury

. F e n n e r P L C 1 5
function in conjunction with the operatingunits, in accordance with risk managementpolicies that are designed to minimise thepotential adverse effects of these risks onfinancial performance. The policies arereviewed and approved by the Board.
The exposures are managed through theuse of foreign currency and sterlingborrowings, derivatives and creditmanagement procedures. The use ofderivatives is undertaken only where theunderlying interest or currency risk arisesfrom the Group’s operations or sources offinance. No speculative trading inderivatives is permitted.
In the normal course of business, derivativeshave been used to hedge future non-functional currency cash flows arising fromtrading transactions relating to the sale andpurchase of goods and services. The Grouphas chosen not to hedge account for suchtransactions under the requirements of IAS39 ‘Financial Instruments: Recognition andMeasurement’, recognising that cash flowsthrough to the maturity of the derivative areunaffected. In compliance with IAS 39, allfinancial instruments have been measuredat their fair value as at the balance sheetdate. A charge or credit to the incomestatement has been recognised for the lossor gain on these instruments. In addition, inaccordance with IAS 21 ‘The Effects ofChanges in Foreign Exchange Rates’, allforeign currency monetary items have beenre-translated at the closing rate, withchanges in value charged or credited to theincome statement.
The interest rate swap entered into in 2006to hedge interest rate cash flows continuedduring the year. This instrument fixes theinterest rate on $40m of floating rate bankborrowings until 2011. At 31 August 2008,the fair value of this instrument was a liabilityof £1.5m (2007 £0.7m). In 2007, the Groupalso swapped $27.2m of the 2017 privateplacement into €20.0m, with cash flowsmirroring the private placement at a fixedrate of 5.05%. This swap matures in June2017 when the private placement isrepayable. At 31 August 2008, the fair valueof this instrument was a liability of £0.3m(2007 £nil).
These swaps have been accounted for ashedges in accordance with IAS 39, with thecharge or credit recognised directly inequity.
POST-RETIREMENT BENEFITSThe Group operates a number of definedbenefit post-retirement schemes for qualifyingemployees in operations around the world.
The principal scheme is the Fenner PensionScheme which is based in the UK. The mostrecent funding valuation of the FennerPension Scheme was carried out with aneffective date of 31 March 2008. Whilst thishas yet to be formally completed, theTrustees and the Group have agreed tocontinue funding the Scheme in broadly thesame way going forward. This arrangementreflects the strong covenant provided by theGroup and a commitment to fund theScheme over the long term.
The total defined benefit post-retirementliability as calculated by the schemes'actuaries in accordance with IAS 19'Employee Benefits' and recorded on thebalance sheet increased to £19.1m (2007£14.1m). Of this amount, the Fenner PensionScheme represents £15.5m (2007 £13.1m)and the overseas schemes totalled £3.6m(2007 £1.0m). During the year, the fair valueof assets in the schemes has reduced due tofalling equity markets whilst the present valueof obligations has also reduced as corporatebond yields increased.
KEY FINANCIAL PERFORMANCEINDICATORS
Richard PerryGroup Finance Director
2008 2007
Adjusted earnings per share 17.5p 15.1p
Interest cover (times) 6.8 8.9
Net debt to EBITDA (ratio) 1.7 0.8
Return on gross capital employed 18% 20%

1 6 F e n n e r P L C
B u s i n e s s R e v i e wD e f i n i t i o n o f K e y P e r f o r m a n c e I n d i c a t o r s U s e d
INTERNATIONALLY TRADED COAL PRICESAs published by, and used with thepermission of, the McCloskey GroupLimited, the coal industry recognised marketanalysis and trade reporting company.These bi-weekly prices reflect the deliveredto port price of coal for the two major coalimporting markets.
SALES PER EMPLOYEETotal annual third party revenue at constantexchange rates divided by the averagenumber of employees derived from a simpletotal head count with no distinction betweenfull time, part time, temporary or casualemployees. Where employees are employedfor part of a year, the average number iscalculated on a pro-rata basis.
LOST TIME INCIDENTSThe number of incidents connected withwork which result in an injured person beingaway from work or unable to do the fullrange of their normal duties, not includingthe day of the incident.
ADJUSTED EARNINGS PER SHAREThis is a measure of performance andgrowth. It is calculated by dividing the profitfor the year before amortisation of intangibleassets acquired and exceptional items bythe weighted average number of shares inissue and ranking for dividend.
INTEREST COVERThis measure provides an indication ofwhether the Group’s profit is sufficient tocover its interest obligations. It is calculatedby dividing the operating profit beforeamortisation of intangible assets acquiredand exceptional items by net interestpayable on bank overdrafts and loans, otherloans and bank interest receivable.
NET DEBT TO EBITDAThis is a measure of the Group’s ability toservice its debt obligations. It is calculatedby dividing net debt, defined as short andlong term borrowings less cash and cashequivalents, by the profit for the year afteradding back net finance costs, taxation,depreciation, amortisation and exceptionalitems.
RETURN ON GROSS CAPITAL EMPLOYEDThis is a measure of performance relative toamounts invested. It is calculated bydividing operating profit before amortisationof intangible assets acquired andexceptional items by gross capitalemployed. Gross capital employed isdefined as the average of the opening andclosing non-current assets (excludingdeferred tax), inventories, trade and otherreceivables and trade and other payables.

T h e B o a r d
Appointed in May 1993 as executive Chairmanand became non-executive Chairman in May1994. He is also non-executive Chairman ofAltitude plc and non-executive Chairman ofEnergybuild Group Plc.
Appointed to the Board as Group FinanceDirector in 1990 and became Chief ExecutiveOfficer in May 1994. He is also non-executiveChairman of Inditherm plc.
Appointed to the Board in September 1994.He is also a non-executive director of ScapaGroup plc.
Appointed to the Board in January 2003, hewas formerly an executive director ofD S Smith Plc.
Appointed to the Board in November 2005,he was formerly Chief Executive of BritishVita plc and is a non-executive director ofZotefoams Plc.
Joined the Company in 2001 and wasappointed Company Secretary in July 2002.
COLIN COOKE (68)* r n
Chairman
MARK ABRAHAMS (53) n
Chief Executive Officer
RICHARD PERRY (58)Group Finance Director
DAVID BUTTFIELD (62)* a r n
Senior Independent Director
DAVID CAMPBELL (58)* a r n
DEBRA BRADBURY (43)Company Secretary
* Non-executive a Audit Committeer Remuneration Committeen Nomination Committee
F e n n e r P L C 1 7

1 8 F e n n e r P L C
The Group remains committed to maintaining high standards of corporate governance as set out in the Combined Code onCorporate Governance (“Combined Code”), revised in June 2006.
Compliance with the Combined CodeThe Group has complied with the main provisions of the Combined Code during the year ended 31 August 2008 and this statementexplains how the Principles of Corporate Governance are applied within the Group. It should be read in conjunction with theBusiness Review and the Board Remuneration Report on pages 5 to 16 and pages 27 to 33 respectively.
The BoardAs at 31 August 2008, the Board comprised a non-executive Chairman, two executive directors and two non-executive directorsand is collectively responsible to shareholders for the proper management of the Group. Biographical details of the directors areset out on page 17.
The roles of the Chairman and Chief Executive Officer are separate and distinct from one another.
The Board is satisfied that it has met the Combined Code’s requirements for its effective operation. Specific matters are reserved forthe Board’s consideration under a formal schedule. These include developing Group strategy, reviewing trading performance,considering senior management appointments, formulating policy on key issues (including the approval of significant capitalexpenditure, acquisitions and disposals) and reporting to shareholders. The schedule is reviewed at least annually. Various othermatters are delegated to duly authorised sub-committees of the Board consisting of directors and senior executives. Details of theircomposition and purpose are outlined below. In addition, the Chairman and non-executive directors meet every year without theexecutive directors being present.
All directors are subject to election by shareholders at the first Annual General Meeting ("AGM") following their appointment and tore-election thereafter at intervals of no more than three years. Due to his length of tenure, the Chairman seeks annual re-election inaccordance with best practice.
The Group holds appropriate Director’s and Officer’s liability insurance.
Board balance and independenceThe Board is satisfied that the current balance of skills and experience is appropriate for the requirements of the business. Overhalf of the Board comprises non-executive directors, inclusive of the Chairman, and they are deemed by the Board to beindependent of management and do not have any business relationships which could interfere with the exercise of their judgement.
The Senior Independent Director is David Buttfield.
Information and professional developmentPrior to each Board, Committee or General Meeting, the Board is provided with timely, appropriate and sufficient information toenable it to discharge its duties proficiently.
Non-executive directors receive an induction to the Group and its operations when they are appointed to the Board. They are alsoencouraged to visit the Group’s offices and factories whenever the opportunity presents itself where they meet management andare briefed on local business operations. At least one Board meeting during the year is held at an operational site outside of theUK. In 2008, this took place at the conveyor belting factory in South Africa.
All directors have access to the Company Secretary, who is responsible for ensuring that Board procedures are followed and thatthe Group complies with all applicable rules, regulations and obligations governing its operations. A procedure exists for directorsto take independent professional advice, at the Group’s expense, if necessary, in the furtherance of their duties.
Performance evaluationA Board performance evaluation was carried out in the year which comprised of a questionnaire and individual meetings with theChairman. The review looked at the effectiveness of the Board overall, its structure, composition, Board processes and Committees.The Chairman also evaluated the performance of the individual directors as part of the review. It was concluded that thecomposition, experience and effectiveness of the Board was appropriate and robust.
Audit CommitteeThe Audit Committee comprises the two non-executive directors and is chaired by David Buttfield, who has recent and relevantfinancial experience. The Company Secretary acts as a secretary to the Committee. In undertaking its duties, the Committee hasaccess to the services of the Group Finance Director and the Company Secretary as well as access to external professionaladvice. The Committee has the power to request the attendance at meetings of any director, external auditor or Group employee asconsidered appropriate. The Committee also meets external auditors without the executive directors being present.
Corporate Governance

The principal duties of the Committee are to monitor the integrity of the financial statements, to review the internal controls and riskmanagement systems, to review the work of internal audit and to consider all aspects of the relationship with the external auditors.The Committee has the authority to obtain external legal or other professional advice on any matter within its terms of reference.
The work of the Audit CommitteeDuring the year, the Committee carried out the following work:
- review, prior to Board approval, of the Preliminary and Interim Results, the Annual Report and the Interim Report; - consideration of the Group’s key business risks, including the arrangements for the identification and management of risk;- overseeing the implementation of a Group-wide risk management system;- receive the reports on internal control and review the effectiveness of the internal control function, monitor progress and
evaluate the internal control reports at least twice a year.- meet with the external auditors, both with and without the executive management being present, to discuss audit issues;- approve the external auditors' terms of engagement and associated fees;- monitor the level of non-audit work of the external auditors;- review the terms of reference of the Audit Committee and the Whistleblowing Policy.
No non-routine matters of concern were drawn to the Committee’s attention by either the external or internal auditors through theyear. Matters of material concern would be immediately drawn to the Committee’s attention if and when they arise.
There is a policy on the provision of non-audit services by the external auditors. Certain services such as due diligence in relationto acquisitions and disposals, taxation services and actuarial advice are permitted but others, for example, internal audit,information technology and HR consultancy are generally considered inappropriate. Non-audit fees are reported to the Committee.
The Committee has received and reviewed written confirmation from the external auditors on all relationships that, in theirjudgement, may bear on their independence. The external auditors have also confirmed that they consider themselves independentwithin the meaning of UK regulatory and professional requirements.
Audit Committee and internal controlThe Audit Committee reviews the effectiveness of the Group’s system of internal control and receives a report on internal control atleast twice a year. This review covers all controls, including operational, financial, compliance and risk management.
In accordance with the requirements of the Combined Code and the recommendations of the Turnbull Guidance on internal control,the directors have reviewed the effectiveness of the internal control system. During the period under review, no significant changesto the material risks were identified and no control failings or weaknesses were identified that resulted in unforeseen material losses.
The directors are responsible for the Group’s system of internal control which, like any system of internal control, can only providereasonable and not absolute assurance against material misstatement or loss.
The key procedures within the control structure are: - the identification of major business and insurance risks faced by the Group’s operations, by both the Board and senior
management, and the determination of the most appropriate course of action to deal with these risks; - central review and approval procedures in respect of major areas of risk such as acquisitions and disposals, litigation,
treasury management, taxation and environmental issues; - a clear management structure with well defined lines of responsibility and the appropriate levels of delegation; - regular review of the Group’s business units by operational and executive management; - a structured process for appraising and authorising capital projects. This process includes clearly defined authorisation
levels. Projects are subject to post-investment appraisals; - well established consolidation and reporting systems for both the statutory and monthly management accounts, with all
Board members receiving a monthly statement of the financial results; - comprehensive budgeting systems with an annual budget approved by the Board. Monthly results are reported against
budget and revised forecasts for the year are prepared regularly; - an internal programme of monitoring visits by the internal audit team, as agreed with the Audit Committee, reviews the
compliance of each business unit with the Group's standard internal financial control procedures; - competition compliance programmes are in place in several jurisdictions and the Group-wide Whistleblowing Policy
continues to be applied; and - a programme of business risk reviews with operational management focusing on non-financial controls and risk
management.
F e n n e r P L C 1 9

Corporate Governance continued
2 0 F e n n e r P L C
Remuneration CommitteeThe Remuneration Committee comprises the Chairman and the non-executive directors and is chaired by David Campbell. TheChief Executive Officer also attends the meetings by invitation but does not participate in any decision in relation to his ownremuneration. The Committee has the power to request the attendance at meetings of any director or Group employee asconsidered appropriate.
The Committee is responsible to the Board for determining the remuneration packages of the executive directors and other seniorexecutives and advises on executive remuneration policy issues. The Committee administers the long term Performance Share Plan(“PSP”) and the outgoing Long Term Share Incentive Plan (“LTIP”). It also approves the granting to employees of a long termShadow Performance Share Plan which is a cash incentive scheme with performance criteria which are the same as the PSP.The Remuneration Committee received advice during the year from Hewitt New Bridge Street Consultants LLP (“HNBSC”), whoadvised the Committee in relation to director and senior executive remuneration and the PSP. MM&K Ltd assisted the Committee inconsideration of matters in relation to the outgoing LTIP.
Nomination CommitteeThe Nomination Committee comprises the Chairman, the non-executive directors and the Chief Executive Officer. The Committee ischaired by the Chairman and meets at least annually. The Committee has the power to request the attendance at meetings of anydirector or Group employee as considered appropriate.
Terms of reference set out the Committee’s role and duties which include reviewing the composition of the Board, havingresponsibility for the identification and nomination of candidates to fill Board vacancies and considering succession planning for allBoard positions and senior executives.
Candidates for appointment to the Board are considered by the Committee, taking advice from external consultants whereappropriate.
Meetings of the BoardThe attendance of each director at Board, Audit, Remuneration and Nomination Committee meetings is set out below.
Terms of referenceThe terms of reference of the Audit, Remuneration and Nomination Committees are reviewed at least annually and are available toview on the Group’s website at www.fenner.com or upon request to the Company Secretary.
Executive CommitteeThe Executive Committee is chaired by the Chief Executive Officer and consists of the two executive directors, the CompanySecretary and five members of the Group’s senior management. The Executive Committee meets at least six times a year and dealswith the daily management of the Group through powers delegated to it by the Board.
Directors' remunerationPolicy and procedure are set out in the Board Remuneration Report on pages 27 to 33.
Number of meetings during the year
Chairman C I Cooke
Executive directorsM S Abrahams
R J Perry
Non-executive directorsD F Buttfield
D A Campbell
* By invitation
6
6
6
6
6
6
Board
3
3*
3*
3*
3
3
Audit Committee
RemunerationCommittee
3
3
2*
0
3
3
1
1
1
1*
1
1
NominationCommittee

Relations with shareholdersThe Company encourages regular dialogue with its institutional shareholders and also with private investors at the AGM. The ChiefExecutive Officer and Group Finance Director hold update meetings with institutional shareholders following the announcement ofPreliminary and Interim Results and as requested throughout the year. Similar meetings are held with private client brokers so thatthe same information can be disseminated to private investors. The Chairman and non-executive directors are offered theopportunity to attend meetings with major shareholders and attend if requested.
The Board is provided with broker reports and feedback from shareholder meetings on a regular basis.
The Group’s website provides comprehensive investor relations information for shareholders to view. The website includes analystpresentations, the current share price, regulatory announcements, financial performance information, shareholder information andan investor relations contact address.
Annual General MeetingIn relation to the Company’s AGM:
- proxy forms allow for voting either for a resolution, against a resolution or for a vote to be withheld;- a separate resolution is proposed for each substantially separate issue, including the receipt of the Annual Report;- the proxy count in respect of each resolution is announced after it has been dealt with on a show of hands;- all executive and non-executive Board members normally attend the meeting;- the Notice of Meeting, the Annual Report and any other related papers are normally sent to shareholders more than one
month before the meeting; and- shareholders are invited to ask questions during the AGM and have an opportunity to meet the Board directors before and
after the formal meeting.
Statement of directors’ responsibilities in respect of the Annual Report, the Board Remuneration Report and thefinancial statements The directors are responsible for preparing the Annual Report, the Board Remuneration Report and the Group and Companyfinancial statements in accordance with applicable law and regulations.
Company law requires the directors to prepare financial statements for each financial year. Under that law, the directors haveprepared the Group financial statements in accordance with International Financial Reporting Standards (“IFRS”) as adopted by theEuropean Union and the Company financial statements and the Board Remuneration Report in accordance with applicable law andUnited Kingdom Accounting Standards (United Kingdom Generally Accepted Accounting Practice). The Company and Groupfinancial statements are required by law to give a true and fair view of the state of affairs of the Company and the Group and of theprofit or loss of the Group for that period.
In preparing those financial statements, the directors are required to:- select suitable accounting policies and then apply them consistently;- make judgements and estimates that are reasonable and prudent ;- state that the Group financial statements comply with IFRS as adopted by the European Union and with regard to the
Company financial statements that applicable UK Accounting Standards have been followed, subject to any materialdepartures disclosed and explained in the financial statements; and
- prepare the Group and Company financial statements on the going concern basis unless it is inappropriate to presume thatthe Group will continue in business, in which case there should be supporting assumptions or qualifications as necessary.
The directors confirm that they have complied with the above requirements in preparing the financial statements.
The directors are also required by the Disclosure and Transparency Rules of the Financial Services Authority to include amanagement report containing a fair review of the business and a description of the principal risks and uncertainties facing theGroup and Company.
The directors are responsible for keeping proper accounting records that disclose with reasonable accuracy at any time thefinancial position of the Company and the Group and to enable them to ensure that the Group financial statements comply with theCompanies Act 1985 and Article 4 of the IAS Regulation and the Company financial statements and the Board RemunerationReport comply with the Companies Act 1985. They are also responsible for safeguarding the assets of the Company and the Groupand hence for taking reasonable steps for the prevention and detection of fraud and other irregularities.
The directors are responsible for the maintenance and integrity of the Company’s website. Legislation in the United Kingdomgoverning the preparation and dissemination of financial statements may differ from legislation in other jurisdictions.
F e n n e r P L C 2 1

Directors’ statement pursuant to the Disclosure and Transparency RulesEach of the directors, whose names and functions are listed in The Board on page 17 confirm that, to the best of each person’sknowledge and belief:
- the Group financial statements, prepared in accordance with IFRS as adopted by the European Union, and the Companyfinancial statements, prepared in accordance with applicable law and United Kingdom Generally Accepted AccountingPractice, give a true and fair view of the assets, liabilities and financial position of the Group and Company and of the profitof the Group; and
- the Business Review on pages 5 to 16 includes a fair review of the development and performance of the business and theposition of the Company and Group, together with a description of the principal risks and uncertainties that they face.
Going concernAfter making enquiries, the directors have formed a judgment at the time of approving the financial statements that there is areasonable expectation that the Company and Group have adequate resources to continue in operational existence for theforeseeable future. For this reason, the directors continue to adopt the going concern basis in preparing the financial statements.
C I Cooke Chairman12 November 2008
2 2 F e n n e r P L C
Corporate Governance continued
F e n n e r P L C 2 3
Fenner is aware of and takes seriously its responsibilities towards customers, employees, suppliers and the local communities inwhich it works. The Group has identified that health and safety, its people, how it does business, reducing environmental impactand involvement within the community are all important to contributing to its overall business performance. As such, these issuesare embedded into the business decision making process and the Group believes that this proactive attitude and approachenhances its reputation, profitability and shareholder return.
The risks associated with the non-financial aspects of the Group’s business are managed within the Group’s risk managementframework and are continuously monitored and assessed, with necessary controls put in place in order to reduce the potentialimpact.
The Chief Executive Officer has overall responsibility for the development and monitoring of the Group’s policies relating toCorporate Responsibility. The task of ensuring these policies are communicated and applied at a divisional and operational unitlevel is delegated through the divisional managing directors to each unit’s senior management. The policies and associatedmanagement systems are reviewed at least annually and at any time when significant changes in the business, legislation orindustry standard demand.
The Group’s Health & Safety Policy and Environmental Policy are available to view on the Company’s website at www.fenner.com orby contacting the Company Secretary.
The Company is proud to continue to be a member of the FTSE4Good UK Index which measures the performance of companiesthat meet globally recognised Corporate Responsibility standards and facilitates investment into those companies.
Health and safetyThe Group acknowledges the absolute necessity of providing a safe and secure working environment for all people involved in orimpacted by the activities associated with its business. Health and safety ("H&S") also remains a critical component to the solutionsprovided to customers. H&S and its management is therefore an integral part of the Group’s business strategy.
The Group endeavours to set the highest practical standards. As a minimum, each operational unit will always comply fully with itslocal statutory obligations and all employees are trained to recognise that the health and safety of themselves and others is theirfirst priority.
All operational units have a H&S committee which meets regularly to discuss H&S topics and concerns, make recommendationsand implement and monitor any improvements or initiatives. H&S issues and key measurements are also routinely reviewed anddiscussed at management meetings, with accidents, serious incidents and near misses reported and escalated to the ExecutiveCommittee and Board where appropriate.
The dissemination of information on a Group-wide basis is also important to ensure continual improvement in all H&S matters. Thefindings of H&S investigations are communicated across locations and a general exchange of information and resources betweenoperations is actively encouraged. During the year, the inaugural Fenner North America Health, Safety and Environment ("HSE")Network Meeting took place in Anaheim, California which provided a forum for all Group HSE managers in the region to shareknowledge, experience and form collective approaches and initiatives.
Group Health and Safety Management System FrameworkA significant development in the year occurred with a set of Group Expectations being established within a newly created GroupHealth and Safety Management System Framework ("HSMSF").
The HSMSF covers those areas key to ensuring a robust, all encompassing and continually improving H&S culture within the Group:- Accountability & Leadership;- Risk Assessment & Management;- Training & Behaviours;- Operations and Maintenance;- Information & Documentation;- Customers & Products;- Incident Analysis & Prevention;- Monitoring, Assurance and Improvement;- Crisis Management and Business Continuity Planning;- Management of Change;- Working with Third Parties;- Design and Construction of Facilities; and- Community & Stakeholder Awareness.
Corporate Responsibility Report

2 4 F e n n e r P L C
It is intended that the HSMSF will be embedded into existing divisional and operational unit level management systems over the nextyear. During this period, a review of the measurements recorded and used to analyse H&S across the Group will also take place.
A Group HSE Coordinator was appointed during the year to assist in the continued development, implementation and monitoring ofthe Group’s H&S management systems.
Health and safety awardsA number of the Group’s operations have received external recognition and awards during the year for their performance in H&S. These included:
- the US operations at Port Clinton were presented with a Bureau of Workers Compensation award in recognition of the 25% reduction to their injury rate during 2007
- the FAST manufacturing site in Hampton secured the prestigious RoSPA Gold Award for the second successive year, highlighting the site’s continued excellence in the management and control of H&S
- the US plant at Toledo received two awards from the Safety Council of North West Ohio recognising their achievement of one year with no Lost Time Incidents and also for the 25% decrease to the incident rate at the plant.
2008 also saw the inaugural Group Health and Safety Improvement Award presented to Drachten.
Our peopleThe Group’s success in consistently delivering reliable and superior solutions to customers is founded upon a stable, technicallyskilled, innovative and committed workforce around the globe. On average the Group employed 3,924 people during the financialyear, up from 3,663 in 2006/07. 31% of employees are in Europe, 42% in the Americas, 4% in Africa and 23% in Asia Pacific.
The Group is an equal opportunities employer in terms of recruitment, training and promotion regardless of sex, race, religion,sexual orientation, age or disability. Harassment is not tolerated in any form. As a global employer, the Group is aware of andcomplies with local labour rights and employment practices.
The ‘Fenner Focus’ magazine is distributed to all employees and is an effective route to communicate matters of Group andoperational significance. The magazine informs employees of any major Group developments and provides an opportunity tohighlight and congratulate units and individuals on their work in the community, health and safety initiatives and long serviceawards. The annual results are also summarised in the publication enabling all employees to be kept informed of the Group’sprogress.
Recruitment and retentionThe recruitment and retention of a skilled workforce is essential to the Group. Each operational unit employs recruitment practiceswhich identify the best available candidate for each position. All employees are actively encouraged to apply for roles, includingcross divisional opportunities where applicable.
Generally, the businesses within the Group have positive histories of high employee retention and the majority of operations have along service recognition programme in place.
Training and developmentHealth and safety training is an integral part of all employee induction programmes. All operations continuously monitor and plantraining to meet both the business and employees' development needs.
In 2008, Fenner Dunlop Australia was presented with the Leading Training Processes and Practices of the Year Award (RegisteredTraining Organisation) by the Mining Industry Skills Centre, acknowledging Fenner’s achievements and ongoing commitment to thedevelopment and delivery of training within the Australian Industry. What began as an internally generated training course focusingon health and safety (covering aspects such as risk management, safe storage, the handling of dangerous goods, understandingand identifying heat stress and incident reporting) has become an externally recognised certification course and ensures thatsplicers from both Fenner and other third parties carry out their work in a consistent, professional and safe manner and promotessafety in the workplace.
Annual employee appraisal processes have been locally developed in the majority of the Group’s operations. Employees take partin a formal annual appraisal to discuss performance, achievements and potential areas for development and progression. Theprocess also ensures that a continuing communication between management and employees takes place.
The risks associated with inadequate succession planning are recognised at Group level. These risks are continuously monitoredand, where possible, the Group aims to identify high potential employees and, through a process of training and development,prepare them for potential senior management.
Corporate Responsibility Report continued

F e n n e r P L C 2 5
How we do businessThe Group recognises that both its corporate conduct and relationship building are key elements to its business strategysucceeding. By having a high standard of ethical conduct, partnerships can be formed with third parties throughout the Group’ssupply chain which create value on both sides of the relationship.
Business conductThe Group’s culture is one of openness, integrity and accountability. These are enshrined within the Group’s Ethics Policy, which isapplied to all business activities and relationships and sets out the behavioural standards expected from all employees – fairness,honesty and integrity.
The Group operates a confidential whistleblowing procedure which enables all employees to raise any concerns they have.
Competition and anti-trust procedures are co-ordinated at Group level and training is provided to all relevant employees.
Third party partnershipsThe Group seeks to identify and develop appropriate and long term strategic partnerships with suppliers and customers to createmutual value, access to new markets and to mitigate resource and commercial risks. These strategic partnerships are especiallyrelevant to the number of highly technical niche markets where joint development agreements can expedite research whilstprotecting intellectual property rights.
All operational units have or are working towards ISO 9001 or equivalent status and each undertakes rigorous customer satisfactionassessments, including senior face to face meetings and customer surveys. Performance and the timing and handling of anycomplaints are routinely discussed at management meetings and are used as key measurements in determining the success of theoperational unit.
The environmentConcern for the Group’s impact on the environment is a fundamental part of the Group’s corporate business strategy as itendeavours to contribute towards a sustainable future.
The Group is committed to identifying and assessing the risks of pollution and other forms of environmental impairment arising outof its activities and actively seeks to reduce its impact on the environment to the lowest practical level by ensuring that alloperations and activities of the Group exemplify best contemporary practice in respect of the environment.
During the year, the Group’s Environmental Policy was reviewed and a new enhanced version was published. The policy encouragesGroup-wide communication and support to assist in reducing the Group’s overall environmental impact. This includes, wherepossible, the use of video conferencing technology to mitigate the impact caused through inter-continental and domestic air travel.
In line with the HSMSF, a set of Group Environmental Expectations were agreed during 2008 and the alignment of existing divisionaland operational unit level policies and management systems to them will occur over the next year. The establishment of a formalprocess of identification and management of environmental risks has also taken place.
Waste minimisation and energy efficiency The minimisation of manufacturing waste and the maximisation of energy efficiency are both recognised as beneficial to the Groupfrom an environmental and commercial viewpoint.
Waste minimisation is driven and managed at the operational unit level. All major manufacturing operations monitor their wasteemissions and all units comply with local environment legislation. General waste management programmes and initiatives areencouraged and the recycling of materials takes place where practical, either internally or through external programmes withsuppliers or other third parties. Examples include:
- water waste minimisation in China, South Africa, Australia and UK- recycled product usage in China, UK and US- recycled process oil in China and US - minimising packaging and paper waste to landfill in US, Australia, China and Europe.

During the year, the Group’s global energy sources were analysed and are shown on the chart below.
With this and other information provided by the operational units, the Group is undertaking a review of the measurements used tomonitor its environmental impact across the Group as a whole.
CommunityThe Group continues to actively support local communities and charities. The Group’s ‘community agenda’ is driven at a localrather than corporate level with the aim to utilise the Group’s resources to enable the enhancement of employee efforts.
In addition to the time given to community projects and for charitable purposes by all the Group’s employees, the Company madedonations to UK charities of £10,000 during the year. Donations included £4,000 to employee run sports clubs and a total of £2,000split between local cancer, homeless, disabled and hospice charities.
Employees and operational units give their time and help raise funds for a variety of charities and projects. Examples include:- during the year, a new scholarship fund was created in the US with the intention of presenting up to three $3,000
scholarships annually to students who wish to pursue a degree in Mechanical, Mining, Chemical or Textile Engineering- the Prodesco and Secant Medical operations continue to be involved with their local MS Society and for the last nine years
took part and raised funds in the annual MS Walk- employees and their families at the Manheim facility continue to support ‘Earth Day’ by volunteering their time to clean up
local parkland areas and plant trees (over 400 in 2008) with the aim of reducing soil erosion- the operation in India continued its annual celebration of World Environment Day in 2008 with a mix of activities including
tree planting, poster competitions, recycling and clean up campaigns. The aim of World Environment Day is to promoteunderstanding and encourage people and communities to change their attitude towards environmental issues and Fenner iskeen to work in partnership with local communities and government to focus attention on this issue.
2 6 F e n n e r P L C
Corporate Responsibility Report continued

Board Remuneration Report
The Board submits its report on directors’ remuneration. A resolution will be put to shareholders at the Company’s AGM inviting themto approve this Report. Details of the Remuneration Committee’s responsibilities are given on page 20.
Members of the Remuneration CommitteeThe members of the Remuneration Committee during the year were David Campbell (Chairman), Colin Cooke and David Buttfield.
During the year, the Remuneration Committee took advice from independent external sources, as noted on page 20.
Remuneration policyExecutive directorsThe Company’s policy on remuneration is to attract, retain and incentivise executives with the experience and skills necessary tooperate and develop the Company’s businesses to their maximum potential. It is also designed to align the interests of theexecutives with those of the shareholders by rewarding them for enhancing shareholder value and promoting the growth andstability of the Company.
Consistent with this policy, benefit packages awarded to executives are intended to be competitive and comprise a mix ofperformance related and non-performance related remuneration designed to incentivise them, but not to detract from the goals ofcorporate governance.
It is the Committee’s current intention to continue to reward the executive directors with an annual performance related bonus plan,linked to earnings per share ("EPS") and a PSP, details of which are given on page 29. The shares allocated under the final cycle ofthe outgoing LTIP will be awarded to executives after the three year plan cycle expires in November 2008. The award will bedependent on the comparative performance of the Company’s total shareholder return (“TSR”) against the TSR of companiescomprising the FTSE All Share Industrial Engineering Sector (“LTIP Peer Group”) over the period from the provisional allocation dateto the final award date. The PSP has a bespoke peer group comprising companies from the FTSE All Share Industrial EngineeringSector and comparative companies from the General Industrials and Electronic & Electrical Equipment Sectors (“PSP Peer Group”).The Committee considers that TSR, which comprises of, inter alia, dividend yield and share price movement in comparison withboth the LTIP Peer Group and the PSP Peer Group, is the best measure of long term performance as it aligns the interests ofexecutives with shareholders and recognises market conditions in the Group’s industrial sector.
The targeted composition of each executive director’s remuneration is as follows:
Non-performance related Performance related
Mark Abrahams 60% 40%Richard Perry 60% 40%
Chairman and non-executive directorsThe Chairman and non-executive directors are usually appointed for a fixed three year term.
The remuneration of the non-executive directors is determined by the Board as a whole, having regard to the packages awardedby other UK listed companies of similar size and complexity. The fees paid to the Chairman and non-executive directors have beenbrought into line with the bespoke comparator group with effect from 1 September 2008 following the results of the HNBSC report,as detailed on page 28.
The non-executive directors do not participate in any of the Group’s bonus, share option or incentive schemes, nor do they accrueany pension entitlement.
Directors’ service contractsThe executive directors have rolling 12 month contracts. In addition, the Company has agreed to the payment of a prescribed sumequivalent to 12 months salary and contractual benefits if there is a change of control or termination of their contracts by theCompany other than for cause.
The service contracts do not contain any provision for compensation on early termination other than the notice period and theprovision noted above, however the Committee will seek to mitigate cost to the Company whilst dealing fairly with each individualcase.
F e n n e r P L C 2 7

The details of the service contracts in relation to the executive directors and letters of appointment in relation to the Chairman andnon-executive directors who served as directors during the year are as follows:
Unexpired term at Notice31 August 2008 period
Executive directorsMark Abrahams - 1 yearRichard Perry - 1 yearNon-executive directorsColin Cooke* 28 months 1 yearDavid Buttfield** 28 months 1 yearDavid Campbell*** 38 months 1 year
* Colin Cooke’s services are provided by way of an agreement between the Company, Steels Management Limited and ColinCooke. His service agreement was extended in September 2008 until the AGM 2011.** David Buttfield has agreed to serve a further term of two years from the AGM 2009 until the AGM 2011.*** David Campbell will serve for a second three year term from 1 November 2008.
External appointmentsThe Company recognises that its executive directors are likely to be invited to become non-executive directors of other companiesand that such appointments can broaden experience and knowledge which may benefit the Company. Therefore, executivedirectors may, subject to approval by the Board and providing there is no conflict of interest, be allowed to accept appointments asa non-executive director of another company and are normally allowed to retain the fees paid from such appointments. In normalcircumstances, they may not accept more than one appointment. Currently the Chief Executive Officer, Mark Abrahams, is thenon-executive Chairman of Inditherm plc and retained fees of £35,000 in relation to Inditherm plc’s year ended 31 December 2007.The Group Finance Director, Richard Perry, is a non-executive director of Scapa Group plc and retained fees of £35,500 in relationto Scapa Group plc’s year ended 31 March 2008.
Remuneration components for executive directorsThe major components of the executive directors’ remuneration are as follows:
Basic annual salary and benefitsThe basic annual salary is subject to an annual review which takes into account the performance of the Group and the individualand salary trends in comparable companies. In addition, a car allowance, healthcare insurance and other benefits are available inline with normal corporate practice.
During the year, HNBSC were commissioned to produce a report on comparative pay for chairmen, non-executive directors,executive directors and senior executives of companies similar to Fenner, benchmarked against two comparator groups; (1) abespoke group of 20 companies comprising the majority of the companies used in the PSP Peer Group and (2) a number of othercompanies with median market capitalisation and turnover similar to Fenner, comprising 26 companies from all industries excludingfinancial services, property and real estate. All companies in these groups had a market cap and turnover within 50% - 200% of theCompany and at least 25% of their turnover outside the UK.
In light of the report recommendations, the salaries of the executive directors were increased with effect from 1 September 2008 toraise them above the lower quartile.
The Remuneration Committee takes account of the pay levels of senior management of the Fenner Group when establishing theexecutive directors’ remuneration and has adjusted salaries in the light of the HNBSC report.
Annual performance related bonusPerformance related cash bonuses are reviewed annually. Demanding performance targets are set which must be achieved beforethe maximum bonus is payable. The confirmed criteria for the year under review include targets linked to the Group’s performancein terms of operating profit, EPS and working capital. The target bonus for achievement of the annual budget for these measures is35% of basic annual salary and the maximum potential payment for the annual bonus is 60% of basic annual salary, excludingbenefits in kind and pension contributions.
The Remuneration Committee has introduced a new bonus scheme for 2008/09 wherein the executive directors will receive a bonusbased on EPS targets aligned to shareholder expectations. If expected EPS returns are achieved for the year, the executive directorwill receive 45% of salary as a bonus with a linear EPS progression to cap bonuses at 60% of basic salary.
2 8 F e n n e r P L C
Board Remuneration Report continued

F e n n e r P L C 2 9
Performance Share PlanThe PSP, which was approved by shareholders at the AGM on 10 January 2007 and which replaced the outgoing LTIP, is designedto encourage its participants to deliver sustained long term above market returns to shareholders.
Rewards under the PSP are linked to the Company's performance against demanding targets over three year periods(“Performance Periods”). A conditional award of ordinary shares is based on a percentage (maximum 150%) of the participant'sannual basic salary and the value of the Company's ordinary shares on grant. In exceptional circumstances, such as recruitment orretention of key participants, the Remuneration Committee can make awards of shares worth up to 300% of annual basic salary.
The performance measurement for each of the Performance Periods is the Company's TSR which is compared with the TSR of thePSP Peer Group. The PSP Peer Group is described on page 27. The Remuneration Committee selected the PSP Peer Group as itbelieved it to be the most appropriate group against which the TSR of the Company should be measured because it is a group ofbusinesses similar in nature to the Company and which represents alternative investment options for our shareholders.
100% of the award may vest only if the Company's performance places it within the top 10% of the companies in the PSP PeerGroup. 25% of the award vests at the median. No awards vest if the Company's ranking is below the median. Between the medianand the top 10%, awards will vest on a straight-line basis (with interpolation between rankings). In addition, no award will vestunless the Committee is satisfied that the Company’s TSR performance reflects its underlying financial performance.
There have been no departures from the Company's policy on awarding benefits under the PSP since it was adopted at the AGMon 10 January 2007 other than to align the Performance Period with the financial year of the Group and to roll up dividends into theconditional award until the date of vesting.
The performance chart below illustrates the Company’s TSR over the past five years compared to the TSR performance of the FTSEAll Share Industrial Engineering Index. In addition to the statutory requirement to plot data over five financial year ends, the graphand table below reflect data for each of the three year periods (“Plan Cycles”) for the LTIP and PSP Performance Periods. The PlanCycles and Performance Periods for the LTIP and the 1st issue of the PSP are aligned with the release of the Group’s PreliminaryResults. The 2nd and subsequent PSP Plan Cycles will remain aligned with the release of the Group's Preliminary Results but thePerformance Periods will be aligned to the financial year of the Group. The Remuneration Committee believes that moving thePerformance Period to correspond with the financial year of the Group more closely aligns the PSP performance with shareholderexpectations and shareholder value. The Plan Cycles remain tied with the release of the Preliminary Results to ensure Plans are notissued during a close period and that they are only issued once there is full disclosure of price sensitive information into the marketas a whole.
The outgoing LTIP expired in 2007 having reached the end of its 10 year life and the PSP was introduced as the sole long termincentive vehicle for participants, subject to the final Plan Cycles of the LTIP reaching their natural ends.
The Committee believes that the PSP provides a real incentive for key executives and will result in appropriate rewards fordelivering sustained out-performance against comparator companies and revenue growth. The form of the PSP takes due accountof changes in market practice and standards of good governance.
FTSE All ShareIndustrial
Engineering Index
94100102114134139172189228234231
Fenner
97100137155195203289283338375334
Date
31 August 2003 6 November 2003
31 August 200410 November 2004
31 August 20059 November 2005
31 August 20068 November 2006
31 August 20077 November 2007
31 August 2008
Fenner FTSE All Share Industrial Engineering Index
Total Shareholder Return

PensionsThe executive directors participate in the defined benefits section of the Fenner Pension Scheme, an Inland Revenue approved mixedbenefits scheme, on the same terms as other senior executives. The Scheme provides for a maximum pension of two-thirds ofremuneration at or near retirement age of 62. For both executive directors, pensionable salary and benefits from the Fenner PensionScheme had been restricted to the Scheme's permitted maximum which had been aligned to the Inland Revenue earnings cap untilthe implementation of the Finance Act 2004, which was effective from 6 April 2006. Payments up to that date had also been made tofunded unapproved retirement benefit schemes (“FURBS”) to provide top-up pension benefits in excess of the Inland Revenue limits.Since 6 April 2006, the FURBS payments to the executive directors have converted to a Pension Allowance under the terms of theirService Agreements. The total amount of the payments post 5 April 2006 does not exceed the amounts that would have been paid asFURBS. The executive directors have full discretion in how they choose to invest these payments post 5 April 2006.
The following sections of the Board Remuneration Report are audited.
Directors’ detailed emoluments
Annual salary, Annual fees or performance Total Total
consultancy Benefits in related emoluments emolumentsservices kind* bonus 2008 2007
£ £ £ £ £
Executive directorsMark Abrahams 325,000 22,994 195,000 542,994 496,606Richard Perry 195,000 20,012 117,000 332,012 307,193Non-executive directorsColin Cooke** 90,100 - - 90,100 90,100David Buttfield 37,597 - - 37,597 36,127David Campbell 34,114 - - 34,114 32,780
681,811 43,006 312,000 1,036,817 962,806
*Benefits in kind include the provision of a car allowance and healthcare insurance for both executive directors.**By an agreement between the Company, Steels Management Limited and Colin Cooke dated 24 June 1993, as amended bysubsequent supplemental agreements between the same parties, the last one being dated 24 September 2008, Steels ManagementLimited agreed to provide the services of Colin Cooke as a non-executive director and Chairman of the Company until the 2011 AGM.Steels Management Limited may at any time terminate the agreement by giving 12 months notice in writing to the Company.During the year ended 31 August 2008, £90,100 (2007 £90,100), including a £5,100 car allowance, was payable under this agreement.No remuneration was paid directly to Colin Cooke, nor were any pension contributions paid on his account.
The non-executive directors do not participate in any Company pension scheme, nor do they receive any benefits in kind.
No directors waived emoluments in respect of the year ended 31 August 2008.
PensionsDirectors’ pension entitlementDetails of the pension benefits to which each of the executive directors is entitled are as follows:
Accrued Increase in Accrued Transfer Transfer Increase inentitlement accrued entitlement value at value at transfer value31 August entitlement 31 August 31 August 31 August less directors’
2007 over the year 2008 2007 2008 contributions£ £ £ £ £ £
Mark Abrahams 48,300 5,000 53,300 533,800 693,300 159,500Richard Perry 48,900 6,000 54,900 677,200 872,800 186,400
Board Remuneration Report continued
3 0 F e n n e r P L C

F e n n e r P L C 3 1
Additional information as required by the Listing Rules:Transfer value of additional accrued benefits
Additional accrued benefits earned in year earned in year less directors’ contributions£ £
Mark Abrahams 3,000 33,600Richard Perry 3,900 45,800
The accrued pension entitlement is the amount that the director would be paid annually on retirement based on service to 31August 2008. The Listing Rules require the increase in this amount to be disclosed excluding inflation. The benefits do notallow for any retained benefits which the directors may have relating to previous employment. The pension benefits excludeany additional pension purchased by additional voluntary contributions.
The increase in the accrued entitlement is the difference between the accrued entitlement at 31 August 2008 and the accruedentitlement at 31 August 2007.
The pension benefits are based on the directors’ pensionable salaries which are limited to the Scheme’s permitted maximum(currently £117,600 per annum).
All transfer values have been calculated on the basis of actuarial advice in accordance with Actuarial Guidance Note GN11,which remained in force until 30 September 2008. The transfer values of the accrued entitlement represent the value of assetsthat the pension scheme would need to transfer to another pension provider on transferring the Scheme’s liability in respect ofthe directors’ pension benefits. They do not represent sums payable to individual directors and, therefore, cannot be addedmeaningfully to annual remuneration.
The transfer value of the increase in accrued benefits, required by the Listing Rules, discloses the current value of the increasein accrued benefits that the director has earned in the period whereas the change in his transfer value, required by theCompanies Act 1985, discloses the absolute increase or decrease in his transfer value and includes the change in value of theaccrued benefits that results from market volatility affecting the transfer value at the beginning of the period, as well as theadditional value earned in the year.
Until 5 April 2006, the Company made contributions to FURBS in respect of the executive directors. From 6 April 2006,payments to the executive directors have been converted to a Pension Allowance under the terms of their ServiceAgreements. The total amounts paid by the Company were as follows:
2008 2007£ £
Mark Abrahams 219,375 202,500 Richard Perry 129,675 121,030

3 2 F e n n e r P L C
Board Remuneration Report continued
Interests in shares The interests of the directors in the 25p ordinary shares of the Company were as follows:
31 August 2008 1 September 2007 Number Number
Mark Abrahams 590,099 549,044Richard Perry 452,269 426,446Colin Cooke 210,408 210,408David Buttfield - -David Campbell 3,150 3,150
All directors’ interests are beneficially held. David Buttfield acquired 6,535 shares on 10 September 2008. There have been no otherchanges in the interests set out above between 31 August 2008 and 12 November 2008.
Share schemesNone of the directors held any share options during the year.
Awards to executive directors under long term incentive schemes were as follows:
LTIP
Provisional Provisionalallocation Provisional allocation End of Plan Cycle
1 September allocation Shares Shares 31 August Value & Award2007 in the year awarded lapsed 2008 awarded Determination
Allocation Date Number Number Number Number Number £ Date
Mark Abrahams10 November 2004 155,046 - 69,584 85,462 - 173,271* 14 November 20079 November 2005 133,236 - - - 133,236 - 13 November 2008
Richard Perry10 November 2004 97,524 - 43,768 53,756 - 108,986* 14 November 20079 November 2005 82,364 - - - 82,364 - 13 November 2008
Total of awards in year 113,352 282,257
* Mark Abrahams and Richard Perry received a cash equivalent dividend on the shares of £3,670 and £2,308 respectively.
PSP
Conditional Conditional End of award Conditional award Performance
1 September award Shares Shares 31 August Value Period & Award2007 in the year awarded lapsed 2008 awarded Determination
Allocation Date Number Number Number Number Number £ Date
Mark Abrahams20 February 2007 97,720 - - - 97,720 - 19 February 201012 February 2008 - 93,238 - - 93,238 - 11 February 2011*
Richard Perry20 February 2007 59,284 - - - 59,284 - 19 February 201012 February 2008 - 55,943 - - 55,943 - 11 February 2011*
Total of awards in year - -
* Performance Period ends 31 August 2010 but the award will not vest before 11 February 2011.

F e n n e r P L C 3 3
The performance criteria attached to the conditional award of shares made on 12 February 2008 relate to the Company’s TSRwhich is compared with the TSR of the PSP Peer Group.
There have been no variations in the terms and conditions of scheme interests during the year other than to align the PerformancePeriod with the financial year of the Company. All awards under the LTIP were in respect of qualifying services.
The Plan Cycle that ended on 14 November 2007 was independently evaluated and an award of shares made representing 44.88%of the original award of shares was made on 13 February 2008. The market value (as defined in the Rules of the Plan) of anordinary share of the Company at the beginning of the Plan Cycle was 127.70p (125.16p after adjustment for the Share Placing andOpen Offer in May 2005), at the end of the Plan Cycle was 255.50p, on the day the shares were awarded was 249.01p and at 12February 2008 for the 2nd PSP was 244.00p.
The performance chart on page 29, which shows the relative TSR of the Company and the FTSE All Share Industrial EngineeringIndex, gives an indication of whether each LTIP Plan Cycle and PSP Performance Period will achieve the performance criteria,based upon the share price at 31 August 2008.
Given the nature of the performance calculation, it could be misleading to indicate a likely outcome for future share awards.
Movements in share price during the yearThe market price of the Company’s shares at the end of the financial year was 228.00p and the range of market prices during theyear was between 215.00p and 283.75p.
Signed on behalf of the Board of Directors
D A CampbellChairman of the Remuneration Committee12 November 2008

Directors’ Report
The directors submit their report and the audited Group financial statements for the financial year ended 31 August 2008.
Principal activitiesFenner PLC is a global manufacturer and distributor of conveyor belting and reinforced precision polymer products.
Business reviewThe Business Review, incorporating the Chief Executive Officer’s Review and the Group Finance Director’s Review, can be found onpages 5 to 16.
Results and dividends2008 2007
£m £m
Group profit for the year 25.9 23.9
Dividends:Interim 2.2p per share (2007 2.075p) – payable 3.8 3.3Final 4.4p per share (2007 4.15p) – proposed 7.7 6.6
11.5 9.9
DonationsDuring the year, the Group contributed £10,000 (2007 £5,000) to United Kingdom charitable organisations. No donations are made topolitical parties.
Substantial shareholdingsAs of 12 November 2008, the following interest in shares have been notified to the Company:
Number of % of issuedInterested party shares share capital
HSBC Holdings Plc 14,860,061 8.50Invesco plc 9,030,847 5.17Legal & General Investment Management Limited 7,691,470 4.40Lloyds TSB Group Plc 9,582,497 5.48Rathbone Brothers Plc 6,918,413 3.96
Directors and their interestsThe directors of the Company who served during any part of the year are shown in the Board Remuneration Report on page 28.
Details of the directors’ beneficial interests in the ordinary shares of the Company, in share options over the ordinary share capital ofthe Company and in the LTIP and PSP are given in the Board Remuneration Report on pages 27 to 33.
Save as disclosed in the Board Remuneration Report:- no director has any interest (beneficial or non-beneficial) in any share or loan capital of the Company or any of its
subsidiaries;- no change in the interests of directors has occurred between the end of the financial year and 12 November 2008; and- there were no contracts of significance subsisting during or at the end of the financial year in which a director of the
Company was materially interested.
David Buttfield and David Campbell will be retiring by rotation at the forthcoming AGM and being eligible, offer themselves up forre-election. Both directors' performances continue to be effective and they continue to demonstrate commitment to their roles.
Given the length of his tenure, Colin Cooke will also retire by rotation and offer himself up for re-election in accordance with bestpractice.
3 4 F e n n e r P L C

F e n n e r P L C 3 5
Supplier payment policyGiven the international nature of the Group’s operations, the Group does not operate a standard code in respect of payments tosuppliers. Individual operating businesses are responsible for agreeing the terms and conditions under which transactions with theirsuppliers are conducted, including the terms of payment. It is the Group’s policy that payments to suppliers are made in accordancewith these terms. The average creditor days for the Group during the year ended 31 August 2008 was 55 days (2007 51 days). TheCompany does not have any trade creditors.
Employment policyThe Group operates worldwide and its employment policies are designed to meet local conditions and requirements but areestablished on the basis of the best practices in each country. Wherever the Group operates, it encourages the provision of equalemployment opportunities.
The Group’s policy is to secure good relations between management and all employees, to promote a better understanding of all theissues, both internal and external, that influence the Group’s business performance and to improve performance and productivity.Formal and informal meetings are used to consult employees and to keep them informed about the performance of the Group. Thepractices of consultation and involvement vary from country to country according to local customs, legal considerations and the sizeof the operation. The regular worldwide issue of a Group magazine assists the process of communication, as do briefing meetings,information bulletins and meetings with employee representatives.
The Group continues to recognise its social and statutory duty to employ disabled persons and does all that is practicable to meetthis responsibility. Full and fair consideration is given to the recruitment, training, career development and promotion of disabledpersons bearing in mind the aptitude and ability of the individual concerned.
If an employee becomes disabled while employed by the Group, wherever possible, he or she will continue to be employed in thesame job. If this action is not practicable or possible then every effort will be made to find suitable alternative employment. Inthese circumstances, retraining would be made available using Group resources as well as by contact with the local disabilitiesemployment adviser.
Further details of the Company’s employment policy are given in the Business Review on pages 8 and 9 and the CorporateResponsibility Report on page 24.
Environmental policyThe Group recognises and accepts that concern for the environment is an integral and fundamental part of the Group’scorporate business strategy.
Details of the Company’s environmental policy are given in the Business Review on pages 9 and 10 and Corporate ResponsibilityReport on pages 25 and 26.
Other statutory informationSet out below is a summary of certain provisions of the Company’s current Articles of Association (the “Articles”) and the CompaniesAct 2006 (“Companies Act”). If further information is required, the relevant provisions of the Articles and the Companies Act should beconsulted.
Share capitalThe Company’s authorised and issued share capital as at 31 August 2008, together with details of shares issued during the year, is setout in note 9 to the Company financial statements on page 81. Each ordinary share of the Company carries one vote. The Companyhas a single class of share capital which is divided into ordinary shares of 25p each.
Dividends and distributionsSubject to the provisions of the Companies Act, the Company may, by ordinary resolution, from time to time declare dividends notexceeding the amount recommended by the Board. The Board may pay interim dividends, including fixed rate dividends, wheneverthe financial position of the Company, in the opinion of the Board, justifies such payment. Dividends will be paid pro rata to theamounts paid up on the shares. In specie and scrip dividends can be authorised at a General Meeting at the Board’srecommendation.
Voting rightsSubject to any rights or restrictions attaching to any shares by or in accordance with the Articles, at a General Meeting, every memberwho is present in person or by proxy shall have one vote and on a poll every member present in person or by proxy shall have onevote for each share. In the case of joint holders of a share, the vote of the senior who tenders a vote, whether in person or by proxy,shall be accepted to the exclusion of the votes of the other joint holders. For this purpose, seniority shall be determined by the order inwhich the names of the holders stand in the register.

Restrictions on votingUnless the Board determine otherwise, no member shall be entitled to vote at a General Meeting, either in person or by proxy, inrespect of any share held unless all moneys are fully paid up on that share. In addition, no member shall be entitled to vote if he hasbeen served with a notice after failure to provide the Company with information concerning interests in those shares required to beprovided under the Companies Act.
Deadline for exercising voting rightsVoting rights may be exercised in person, by proxy, or by a Corporate Representative. The deadline for submission of proxy forms isnot less than 48 hours before the time appointed for holding the meeting or adjourned meeting.
Variation of rightsSubject to the provisions of legislation, the Articles specify that rights attaching to any class of shares may be varied or abrogated,either with the consent in writing of the holders of three-quarters in nominal value of the issued shares of the class being varied or withthe sanction of an extraordinary resolution passed at a separate General Meeting of the holders of the shares of that class.
Transfer of sharesAll transfers of certificated shares may be in any usual form or in any other form which the Board may approve. The instrument oftransfer shall be signed by or on behalf of the transferor and, unless the share is fully paid, by or on behalf of the transferee. Aninstrument of transfer need not be under seal. Transfers of shares which are in uncertificated form are effected by means of the CRESTsystem.
The Board may refuse to register the transfer of a share which is not fully paid, provided that the refusal does not prevent dealings inshares in the Company from taking place on an open and proper basis. In the case of uncertificated shares, the Board may exerciseits discretion to refuse to register a transfer of a share to the extent permitted by the regulations and the facilities and requirements ofthe relevant system.
The Board may also refuse to register the transfer of a certificated share unless the instrument of transfer is lodged, duly stamped (ifstampable) at the office or at another place appointed by the Board, accompanied by the certificate for the share to which it relatesand such other evidence as the Board may reasonably require to show the right of the transferor to make the transfer (and, if theinstrument of transfer is executed by some other person on his behalf, the authority of that person to do so); is in respect of only oneclass of shares; and is in favour of not more than four transferees.
If the Board refuses to register a transfer of a share, it shall send the transferee notice of its refusal together with reasons for the refusalwithin two months after the date on which the instrument of transfer was lodged with the Company.
The registration of transfers of shares or of transfers of any class of shares may be suspended at such times and for such periods (notexceeding 30 business days in any one year) as the Board may determine, except that the Board may not suspend the registration oftransfers of any participating security without the consent of CREST.
Restriction of transfer rightsThe former owners of King Energy Services in New Mexico and King Energy Services in Colorado have had part of the considerationfor the purchase of their businesses paid in Fenner shares. Both vendors have a contractual obligation to hold the shares for aspecified period before they are to dispose of them unless they seek the consent of the Company to vary the obligation. The Companyensure compliance with the provisions of the UKLA Model Code, including the rules on dealing in shares during a prohibited period.
Appointment and replacement of directorsUnless varied by ordinary resolution, the number of directors (other than alternate directors) shall be not less than two nor more thanfifteen in number. Directors are not required to hold any shares in the Company by way of qualification.
At each AGM, all those directors who have been in office for three years or more since their last re-appointment shall retire from officeand be eligible for re-appointment. A director who has held office for a continuous period of nine years or more at the date of the AGMshall retire from office and be eligible for re-appointment. The Company abides by best corporate practice and requires that directorswith nine years or more service seek annual re-election.
The Company is seeking to adopt new Articles at the forthcoming AGM and, if the new Articles are adopted, the current requirement tohave one-third of the directors, or the nearest number thereto, retire at each AGM will be dropped.
The Board may appoint a director either to fill a casual vacancy or as an additional director provided that the appointment does notcause the number of directors to exceed the maximum prescribed by the Articles. A director so appointed shall hold office only untilthe next following AGM. If not re-appointed at such AGM, he shall vacate office at its conclusion.
3 6 F e n n e r P L C
Directors’ Report continued

Powers of directorsSubject to the provisions of the Companies Act and Articles and to any directions given by special resolution, the business of theCompany shall be managed by the Board which may exercise all the powers of the Company.
The Board may exercise all the powers of the Company to borrow money, to mortgage or charge all or any part of its undertaking,property, assets (present or future) and uncalled capital and to issue debentures and other securities whether outright or as collateralsecurity for any debt, liability or obligation of the Company or of any third party.
Subject to the provisions of the Companies Act and Articles, at a General Meeting, the Board may request the power to allot therelevant securities including for cash and to buy the Company's own ordinary shares in the market. Currently the Board request suchconsent at each AGM. The details of requested authorities in connection with the AGM to be held on 14 January 2009 are set out inthe Notice of the Annual General Meeting.
Significant agreements: change of controlAll of the Company’s current share plans contain provisions relating to a change of control. Outstanding awards and options wouldnormally vest and become exercisable on a change of control, subject to the satisfaction of any performance conditions at that time.
Amendment to articles of associationAny amendments to the Articles may be made in accordance with the provisions of the Companies Act by way of special resolution.The adoption of a new set of Articles is proposed at the AGM to be held on 14 January 2009 and, should the proposal be passed, willbe effective from that date. Further details are set out in the Notice of the Annual General Meeting.
Independent auditorsA resolution to re-appoint PricewaterhouseCoopers LLP as independent auditors to the Company will be proposed at the AGM.
As far as each director is aware, there is no relevant audit information of which the Company’s auditors are unaware. Each director hastaken all the steps that they ought to have taken as a director in order to make themselves aware of any relevant audit information andto establish that the Company’s auditors are aware of that information.
Annual General MeetingAs special business at the forthcoming AGM, resolutions will be proposed to renew the directors’ authority to allot relevant securities,to disapply the statutory pre-emption rights to a limited extent, to make market purchases of ordinary shares in the Companysubject to defined limits and adopt an updated set of Articles of Association. The proposed resolutions and further detailsregarding these proposals are set out in the Chairman’s explanatory letter accompanying the Notice of the Annual General Meeting.
Signed on behalf of the Board of Directors
C I CookeChairman12 November 2008
F e n n e r P L C 3 7

3 8 F e n n e r P L C
Independent Auditors' Report to the members of Fenner PLC
We have audited the Group financial statements of Fenner PLC for the year ended 31 August 2008 which comprise theConsolidated income statement, the Consolidated balance sheet, the Consolidated cash flow statement, the Consolidatedstatement of recognised income and expense and the related notes. These Group financial statements have been prepared underthe accounting policies set out therein.
We have reported separately on the parent company financial statements of Fenner PLC for the year ended 31 August 2008 and onthe information in the Board Remuneration Report that is described as having been audited.
Respective responsibilities of directors and auditorsThe directors’ responsibilities for preparing the Annual Report and the Group financial statements in accordance with applicablelaw and International Financial Reporting Standards (“IFRS”) as adopted by the European Union are set out in the CorporateGovernance statement on page 21.
Our responsibility is to audit the Group financial statements in accordance with relevant legal and regulatory requirements andInternational Standards on Auditing (UK and Ireland). This Report, including the opinion, has been prepared for and only for theCompany’s members as a body in accordance with Section 235 of the Companies Act 1985 and for no other purpose. We do not,in giving this opinion, accept or assume responsibility for any other purpose or to any other person to whom this report is shown orinto whose hands it may come save where expressly agreed by our prior consent in writing.
We report to you our opinion as to whether the Group financial statements give a true and fair view and whether the Group financialstatements have been properly prepared in accordance with the Companies Act 1985 and Article 4 of the IAS Regulation. Wereport to you whether, in our opinion, the information given in the Directors’ Report is consistent with the Group financial statements.
In addition, we report to you if, in our opinion, we have not received all the information and explanations we require for our audit, orif information specified by law regarding directors' remuneration and other transactions is not disclosed.
We review whether the Corporate Governance statement reflects the Company’s compliance with the nine provisions of theCombined Code 2006 specified for our review by the Listing Rules of the Financial Services Authority, and we report if it does not.We are not required to consider whether the Board’s statements on internal control cover all risks and controls, or form an opinionon the effectiveness of the Group’s corporate governance procedures or its risk and control procedures.
We read other information contained in the Annual Report and consider whether it is consistent with the audited Group financialstatements. The other information comprises only the Directors’ Report, the Financial Highlights, the Chairman’s Statement, theBusiness Review, the Corporate Governance statement, the Corporate Responsibility Report and the unaudited part of the BoardRemuneration Report. We consider the implications for our report if we become aware of any apparent misstatements or materialinconsistencies with the Group financial statements. Our responsibilities do not extend to any other information.
Basis of audit opinionWe conducted our audit in accordance with International Standards on Auditing (UK and Ireland) issued by the Auditing PracticesBoard. An audit includes examination, on a test basis, of evidence relevant to the amounts and disclosures in the Group financialstatements. It also includes an assessment of the significant estimates and judgments made by the directors in the preparation ofthe Group financial statements, and of whether the accounting policies are appropriate to the Group’s circumstances, consistentlyapplied and adequately disclosed.
We planned and performed our audit so as to obtain all the information and explanations which we considered necessary in orderto provide us with sufficient evidence to give reasonable assurance that the Group financial statements are free from materialmisstatement, whether caused by fraud or other irregularity or error. In forming our opinion we also evaluated the overall adequacyof the presentation of information in the Group financial statements.
OpinionIn our opinion:
- the Group financial statements give a true and fair view, in accordance with IFRS as adopted by the European Union, of thestate of the Group’s affairs as at 31 August 2008 and of its profit and cash flows for the year then ended;
- the Group financial statements have been properly prepared in accordance with the Companies Act 1985 and Article 4 ofthe IAS Regulation; and
- the information given in the Directors’ Report is consistent with the Group financial statements.
PricewaterhouseCoopers LLPChartered Accountants and Registered Auditors, Hull12 November 2008

F e n n e r P L C 3 9
Consolidated income statementfor the year ended 31 August 2008
3,4
6
3,5
8
8
9
11
11
11
RevenueCost of sales
Gross profitDistribution costs
Administrative expenses
Operating profit before amortisation of intangible assets acquired and exceptional itemsAmortisation of intangible assets acquired
Exceptional items
Operating profitFinance income
Finance costs
Profit before taxationTaxation
Profit for the year
Attributable to:Equity holders of the parent
Minority interests
Earnings per shareAdjusted - before amortisation of intangible assets acquired and exceptional items
Basic
Diluted
The result for the year derives from continuing operations.
2007£mNotes
380.8(268.4)
112.4(36.9)(37.3)
39.0(0.6)(0.2)
38.21.4
(6.0)
33.6(9.7)
23.9
23.70.2
23.9
15.1p15.0p14.9p
437.8(307.2)
130.6(42.5)(44.3)
49.3(2.1)(3.4)
43.81.8
(9.3)
36.3(10.4)
25.9
25.70.2
25.9
17.5p15.5p15.4p
2008£m

4 0 F e n n e r P L C
Notes
159.1116.8
0.517.9
294.3
74.884.7
1.643.6
-
204.7
499.0
(13.7)(99.8)
(6.4)(2.6)(4.9)
(127.4)
(127.5)(0.5)
(19.1)(11.1)
(7.5)
(165.7)
(293.1)
205.9
43.783.964.014.0(1.8)1.1
204.91.0
205.9
90.266.5
0.612.5
169.8
54.561.5
0.766.1
0.2
183.0
352.8
(10.2)(75.1)
(5.4)(0.7)(0.6)
(92.0)
(92.2)-
(14.1)(6.3)(5.5)
(118.1)
(210.1)
142.7
39.651.754.0(4.9)0.41.1
141.90.8
142.7
12
13
14
15
16
17
18
23
22
24
23
27
22
24
25
27
15
28, 29
29
29
29
29
29
29
Consolidated balance sheetat 31 August 2008
Non-current assetsProperty, plant and equipment
Intangible assets
Other investments
Deferred tax assets
Current assetsInventories
Trade and other receivables
Current tax assets
Cash and cash equivalents
Derivative financial assets
Total assets
Current liabilitiesBorrowings
Trade and other payables
Current tax liabilities
Derivative financial liabilities
Provisions
Non-current liabilitiesBorrowings
Trade and other payables
Retirement benefit obligations
Provisions
Deferred tax liabilities
Total liabilities
Net assets
EquityShare capital
Share premium
Retained earnings
Exchange reserve
Hedging reserve
Other reserve
Shareholders' equityMinority interests
Total equity
The financial statements were approved by the Board of Directors on 12 November 2008 and signed on its behalf by:
C I Cooke R J Perry
Chairman Group Finance Director
2008£m
2007£m

F e n n e r P L C 4 1
Consolidated cash flow statementfor the year ended 31 August 2008
33
34
18
36.3
12.20.8
(2.7)(0.2)(1.8)9.3
(0.7)-
0.7
53.9(8.2)
45.71.8
(8.1)(11.2)
28.2
(63.4)0.5
(0.3)0.1
(45.9)4.8
-
(104.2)
(9.9)(0.1)35.6
-(47.0)70.9
49.5
(26.5)66.0
4.1
43.6
33.6
8.6-
(2.7)0.2
(1.4)6.0
-(2.5)0.7
42.510.8
53.31.6
(5.9)(10.2)
38.8
(31.5)0.2
(0.5)-
(8.8)-
5.2
(35.4)
(9.5)(0.1)0.7
(0.3)(34.1)66.3
23.0
26.441.0(1.4)
66.0
Profit before taxation
Adjustments for:
Depreciation of property, plant and equipment and amortisation of intangible assets
Impairment loss on property, plant and equipment
Movement in retirement benefit obligations
Movement in provisions
Finance income
Finance costs
Profit on disposal of business
Profit on disposal of joint venture
Other non-cash movements
Operating cash flow before movement in working capital
Movement in working capital
Net cash from operations
Interest received
Interest paid
Taxation paid
Net cash from operating activities
Investing activities:Purchase of property, plant and equipment
Disposal of property, plant and equipment
Purchase of intangible assets
Repayment of investments
Acquisition of businesses
Disposal of businesses
Disposal of joint venture
Net cash used in investing activities
Financing activities:Equity dividends paid
Dividends paid to minority shareholders
Issue of ordinary share capital
Repayment of finance leases
Repayment of borrowings
New borrowings
Net cash from financing activities
Net (decrease)/increase in cash and cash equivalentsCash and cash equivalents at start of year
Exchange movements
Cash and cash equivalents at end of year
2008£mNotes
2007£m

4 2 F e n n e r P L C
Consolidated statement of recognised income and expensefor the year ended 31 August 2008
25.9
19.0(1.4)(1.1)(7.4)1.8
10.9
36.8
36.50.3
36.8
23.9
(2.8)0.5
(0.1)12.0(4.3)
5.3
29.2
29.00.2
29.2
Profit for the year
Items recognised directly in equity:
Currency translation differences
Hedge of net investments in foreign currencies
Interest rate and currency swaps
Actuarial (losses)/gains on defined benefit pension schemes
Taxation on items taken directly to equity
Net income recognised directly in equity
Total recognised income and expense for the year
Attributable to:Equity holders of the parent
Minority interests
Total recognised income and expense for the year
2008£m
2007£m
9
Notes

F e n n e r P L C 4 3
1. Significant accounting policies
Basis of preparationThe Group financial statements have been prepared in accordance with International Financial Reporting Standards (“IFRS”) adopted by the
European Union and with IFRIC interpretations and those parts of the Companies Act 1985 applicable to companies reporting under IFRS. The
Company has elected to prepare its Company financial statements in accordance with UK Generally Accepted Accounting Practice
(“UK GAAP”). The Group financial statements are prepared on the historical cost basis, except for derivative financial instruments,
share-based payments and assets of post-retirement benefit schemes which are measured at fair value.
The following standards or interpretations to existing standards have been adopted for the first time during the year:
• Amendment to IAS 1 ‘Presentation of Financial Statements - Capital Disclosures’.
• IFRS 7 ‘Financial Instruments: Disclosures’.
• IFRIC 10 ‘Interim Financial Reporting and Impairment’.
• IFRIC 11 ‘IFRS 2 - Group and Treasury Share Transactions’.
The adoption of IFRS 7 has resulted in additional disclosure in the financial statements in respect of the Group's financial instruments and financial
risk management. The adoption of the amendment to IAS 1 has resulted in additional disclosure about the Group's capital structure. They have had
no impact on the results or net assets of the Group.
The following standards or interpretations to existing standards have been published but are not mandatory for the year ended 31 August 2008 and
consequently have not been adopted by the Group in the year:
• IAS 1 (Revised) ‘Presentation of Financial Statements’
• IAS 23 (Revised) ‘Borrowing Costs’
• IAS 27 (Revised) ‘Consolidated and Separate Financial Statements’
• Amendment to IAS 32 ‘Financial Instruments: Presentation’ and IAS 1 ‘Presentation of Financial Statements – Puttable Financial Instruments
and Obligations Arising on Liquidation’
• Amendment to IAS 39 ‘ Financial Instruments: Recognition and Measurement’
• Amendment to IAS 39 ‘ Financial Instruments: Recognition and Measurement’ and IFRS 7 ‘Financial Instruments: Disclosures – Reclassification
of Financial Assets’
• Amendment to IFRS 1 ‘First-time Adoption of International Financial Reporting Standards’
• Amendment to IFRS 2 ‘Share-based Payment – Vesting Conditions and Cancellations’
• IFRS 3 (Revised) ‘Business Combinations’
• IFRS 8 ‘Operating Segments’
• IFRIC 12 ‘Service Concession Arrangements’
• IFRIC 13 ‘Customer Loyalty Programmes’
• IFRIC 14 ‘IAS 19 – The Limit on a Defined Benefit Asset, Minimum Funding Requirements and their Interaction’
• IFRIC 15 ‘Agreements for the Construction of Real Estate’
• IFRIC 16 ‘Hedges of a Net Investment in a Foreign Operation’
None of the above standards or interpretations are expected to have a significant impact on the results or net assets of the Group.
The principal accounting policies adopted for the year ended 31 August 2008, which have been consistently applied, are set out below.
Basis of consolidationThe Group financial statements comprise the financial statements of Fenner PLC and subsidiaries controlled by the Group as at 31 August each
year, together with the Group’s share of the results of associates and joint ventures, as detailed below.
All intra-group transactions, balances, income and expenses are eliminated on consolidation.
(a) Subsidiaries
A subsidiary is an entity over which the Group has the power to control the financial and operating policy decisions of the entity so as to obtain
benefits from its activities. The acquisition of subsidiaries is accounted for using the purchase method. The cost of the acquisition is measured at
the aggregate of the fair values of assets given, liabilities incurred or assumed and equity instruments issued by the Group at the date of
completion, plus any costs directly attributable to the acquisition. The subsidiary’s identifiable assets and liabilities are initially recognised at their
fair values at the date of acquisition. Subsidiaries acquired or disposed of during the year are consolidated from the effective date of acquisition or
up to the effective date of disposal, as appropriate. Where necessary the accounting policies of acquired subsidiaries are adjusted to bring them
into line with those used by the Group.
Minority interests in subsidiaries are identified separately from the Group’s equity. Minority interests consist of the amount of those interests at the
date of acquisition and the minority’s share of changes in equity since the date of acquisition.
Notes to the Group financial statements

4 4 F e n n e r P L C
1. Significant accounting policies continued
(b) Interests in joint ventures
A joint venture is a contractual arrangement whereby the Group undertakes an economic activity that is subject to joint control with third parties,
where the financial and operating policy decisions relating to the activity requires the unanimous consent of the parties sharing control. The Group’s
interest in joint ventures is incorporated in the financial statements using the proportionate consolidation method. The Group’s share of the assets,
liabilities, income and expenses of joint ventures are combined with the equivalent items in the Group financial statements on a line-by-line basis.
Where a Group entity transacts with a joint venture, profits and losses are eliminated to the extent of the Group’s interest in that entity.
Foreign currencies(a) Functional and presentation currency
The individual financial statements of each entity in the Group are presented in the currency of the primary economic environment in which it operates
(the functional currency). The Group financial statements are presented in pounds sterling, which is the presentation currency of the Group.
(b) Transactions and balances
Transactions in currencies other than an entity’s functional currency are recorded at the rates of exchange prevailing on the dates of the
transactions. At each balance sheet date, monetary assets and liabilities are retranslated at the rates prevailing on the balance sheet date.
Non-monetary items measured at historical cost are not retranslated. Exchange differences arising on the settlement and retranslation of monetary
items are recognised in the income statement in the period.
(c) Net investment in foreign operations
For the consolidation of operations where the functional currency is different to the Group’s presentation currency, the assets and liabilities are
translated at exchange rates prevailing on the balance sheet date and income and expenses are translated at the average exchange rates for the
period. Exchange differences arising are recognised directly in equity in the exchange reserve. On disposal of such operations, the cumulative
exchange differences are included in the profit or loss on disposal.
The Group has adopted the transitional provisions of IFRS 1 'First-time Adoption of International Financial Reporting Standards' to reset to zero the
cumulative exchange differences in equity at 1 September 2004, the date of transition to IFRS.
Goodwill and fair value adjustments arising on the acquisition of foreign operations are treated as assets and liabilities of that operation and are
retranslated at the closing rate at each balance sheet date. The Group has adopted the transitional provisions of IFRS 1 to not apply this to goodwill
arising on acquisitions prior to 1 September 2004, the date of transition to IFRS.
Revenue recognitionRevenue is measured at the fair value of the consideration receivable and represents amounts receivable for goods and services provided in the
normal course of business, net of discounts, VAT and other sales related taxes. Revenue from the sale of goods is recognised when the significant
risks and rewards of ownership have passed to the buyer. Revenue from short term service contracts is recognised in the period in which the
services are completed.
Interest income is recognised on an accruals basis using the effective interest method. Royalty income is recognised on an accruals basis in
accordance with the substance of the relevant agreement. Dividend income from investments is recognised when the right to receive payment is
established.
LeasesLeases are classified as finance leases whenever the terms of the lease transfer substantially all the risks and rewards of ownership to the lessee.
All other leases are classified as operating leases.
Assets held under finance leases are included in property, plant and equipment at the lower of their fair value at the inception of the lease and the
present value of the minimum lease payments. The corresponding liability is included in the balance sheet as a finance lease obligation. Lease
payments are apportioned between finance charges and reduction of the lease obligation so as to achieve a constant rate of interest on the
remaining balance of the liability. Finance charges are recognised in the income statement.
Rentals payable under operating leases are recognised in the income statement on a straight-line basis over the term of the relevant lease.
Government grantsGovernment grants in respect of property, plant and equipment are treated as deferred income in the balance sheet and are recognised in the
income statement over the expected useful life of the relevant asset. Government grants in respect of revenue expenditure are recognised in the
income statement in the period in which the related expenditure is incurred.
Notes to the Group financial statements continued

F e n n e r P L C 4 5
Share-based paymentsThe Group operates equity-settled and cash-settled share schemes for certain employees.
The cost of equity-settled share-based payments is measured at fair value at the date of grant, excluding the effect of non market-based vesting
conditions. The cost is recognised in the income statement on a straight-line basis over the vesting period with the corresponding amount credited
to equity, based on an estimate of the number of shares that will eventually vest. The fair values are measured using the Binomial option-pricing
model and the Monte Carlo simulation approach.
The cost of cash-settled share-based payments is measured as per the equity-settled payments, except that it is recalculated at each subsequent
reporting date. In addition, the corresponding amount is credited to trade and other payables instead of equity.
The Group has adopted the transitional provisions of IFRS 1 to apply IFRS 2 ‘Share-based Payment’ only to equity-settled awards granted after
7 November 2002 that had not vested at 1 January 2005.
Post-retirement benefitsThe Group operates both defined contribution and defined benefit pension schemes.
For defined contribution pension schemes, payments are recognised in the income statement as they are incurred.
For defined benefit pension schemes, the cost is determined using the projected unit credit method, with actuarial valuations being carried out at
each balance sheet date. Service costs are recognised in the income statement to spread the cost over the expected lives of the employees. Net
finance costs or income are recognised in the income statement in the period in which they are incurred. Actuarial gains and losses are recognised
in full in the statement of recognised income and expense in the period in which they are incurred. The retirement benefit obligation recognised in
the balance sheet represents the excess of the present value of scheme liabilities over the fair value of scheme assets.
The cost of providing other post-retirement benefits, principally private healthcare, is determined from actuarial valuations carried out at each
balance sheet date using the same principles as defined benefit pension schemes.
The Group has adopted the transitional provisions of IFRS 1 to recognise in full the cumulative actuarial gains and losses at 1 September 2004, the
date of transition to IFRS. The Group has also adopted the Amendment to IAS 19 ‘Employee Benefits’ permitting the recognition of actuarial gains
and losses in the statement of recognised income and expense.
Exceptional itemsExceptional items are items of income and expense that are material and relevant to an understanding of the Group’s financial performance and may
be operating or non-operating in nature. In accordance with IAS 1 ‘Presentation of Financial Statements’, such items are presented separately on the
face of the income statement and analysed in the notes to the financial statements.
TaxationTaxation expense represents the sum of the current tax payable and deferred tax.
Current tax is the tax expected to be payable on taxable profit for the period using tax rates that have been enacted or substantively enacted by the
balance sheet date, together with any adjustments in respect of previous years. Taxable profit differs from profit as reported in the income statement
because it excludes items of income or expense that are not taxable or deductible or are taxable or deductible in other years.
Deferred tax is recognised, using the liability method, for temporary differences between the carrying amounts of assets and liabilities in the financial
statements and the corresponding tax bases used in the computation of taxable profit, unless specifically exempt. Deferred tax assets are
recognised only to the extent that it is probable that future taxable profits will be available against which the temporary differences can be utilised.
Deferred tax is calculated using tax rates that are expected to apply in the period when the liability is settled or the asset realised. The resulting
charge or credit is recognised in the income statement except when it relates to items recognised directly in equity, in which case the charge or
credit is also recognised directly in equity.
DividendsDividends proposed by the Board are recognised in the financial statements when they have been approved by shareholders at the Annual General
Meeting. Interim dividends are recognised when they are paid.
Segmental reportingA segment is a distinguishable component of the Group that is engaged either in providing products or services (business segment) or in providing
products and services within a particular economic environment (geographical segment), which is subject to risks and rewards that are different
from those of other segments. The Group reports separate information on its material operations for each of the Group’s segments. The Group’s
primary segment is the business sector and its secondary segment is the geographical area.

Notes to the Group financial statements continued
4 6 F e n n e r P L C
1. Significant accounting policies continued
Property, plant and equipmentProperty, plant and equipment is stated at historical cost or deemed cost, less accumulated depreciation and any accumulated impairment losses.
The Group has adopted the transitional provisions of IFRS 1 to record the previously revalued freehold land and buildings as deemed cost at
1 September 2004, the date of transition to IFRS.
Freehold land is not depreciated. Depreciation on other assets is recognised in the income statement to write down the value of the asset to its
residual value on a straight-line basis over the estimated useful life of the asset from the date it is brought into use. Estimated useful lives most
widely applied are as follows:
Freehold buildings 40 years
Leasehold buildings Unexpired term of lease
Plant, machinery and equipment 3-10 years
Assets held under finance leases are depreciated over their expected useful lives on the same basis as owned assets or, where shorter, the term of
the relevant lease.
The gain or loss arising on the disposal or retirement of an asset is determined as the difference between the sales proceeds and the carrying
amount of the asset, and is recognised in the income statement.
GoodwillGoodwill arising on consolidation represents the excess of the cost of acquisition over the Group’s interest in the fair value of the identifiable assets
and liabilities of a subsidiary, associate or joint venture at the date of acquisition. Goodwill is initially recognised as an asset at cost and is
subsequently measured at cost less any accumulated impairment losses. The carrying amount of goodwill is reviewed for impairment annually, or
more frequently when events or changes in circumstances indicate that the carrying amount may be impaired. Any impairment is recognised in the
income statement and is not subsequently reversed. Any excess of the Group’s interest in the fair value of the identifiable assets and liabilities of the
acquired entity over cost is recognised immediately in the income statement. Goodwill arising on the acquisition of an associate is included within
the carrying amount of the investment.
On disposal of a subsidiary, associate or joint venture, the attributable amount of goodwill is included in the profit or loss on disposal.
Goodwill arising on acquisitions prior to 1 September 2004, the date of transition to IFRS, has been recorded at the previous UK GAAP carrying
amount at that date, subject to any impairment required at that date. Goodwill written off to reserves under UK GAAP prior to 1998 continues to be
included in reserves and is not included in any subsequent profit or loss on disposal.
Other intangible assetsIntangible assets acquired in a business combination are initially recognised at their fair value. Other intangible assets are initially recognised at
cost. Intangible assets are subsequently stated at fair value or cost less accumulated amortisation and any accumulated impairment losses.
Amortisation is recognised in the income statement on a straight-line basis over the estimated useful life of the asset. Estimated useful lives most
widely applied are as follows:
Computer software 3-5 years
Brands 20 years
Trademarks 5-20 years
Customer relationships 10-16 years
Technology based assets 5 years
Impairment The carrying amounts of goodwill and other intangible assets with indefinite useful lives are reviewed for impairment annually, or more frequently
when events or changes in circumstances indicate that the carrying amount may be impaired. The carrying amount of property, plant and equipment
and intangible assets with finite useful lives are reviewed for impairment when events or changes in circumstances indicate that the carrying amount
may be impaired. If any such indication exists, the recoverable amount of the asset is estimated in order to determine the extent of any impairment
loss. Where the asset does not generate cash flows that are independent from other assets, the Group estimates the recoverable amount of the
cash-generating unit to which the asset belongs.
The recoverable amount is the higher of fair value less costs to sell and value in use. In assessing value in use, the estimated future cash flows are
discounted to their present value using an appropriate pre-tax discount rate. If the recoverable amount of an asset or cash-generating unit is
estimated to be less than its carrying amount, the carrying amount of the asset or cash-generating unit is reduced to its recoverable amount. Any
impairment loss is recognised in the income statement.

F e n n e r P L C 4 7
Where an impairment loss subsequently reverses, the carrying amount of the asset or cash-generating unit is increased to the revised estimate of its
recoverable amount, but so that the increased carrying amount does not exceed the carrying amount that would have been determined had no
impairment loss previously been recognised for the asset or cash-generating unit. Any reversal of an impairment loss is recognised in the income
statement. Impairment losses on goodwill are not subsequently reversed.
Non-current assets held for saleNon-current assets classified as held for sale are measured at the lower of their carrying amount and fair value less costs to sell.
Non-current assets are classified as held for sale if their carrying amount will be recovered through a sale transaction rather than through continuing
use. This condition is regarded as met only when the sale is highly probable and the asset is available for immediate sale in its present condition.
Management must be committed to the sale, which should be expected to qualify for recognition as a completed sale within one year from the date
of classification.
InventoriesInventories are stated at the lower of cost and net realisable value. Cost comprises direct materials and, where applicable, direct labour costs and
those overheads that have been incurred in bringing inventories to their present location and condition. Net realisable value represents the
estimated selling price less all estimated costs of completion and costs to be incurred in marketing, selling and distribution.
Financial assetsFinancial assets and financial liabilities are recognised in the balance sheet when the Group becomes a party to the contractual provisions of the
instrument.
(a) Trade receivables
Trade receivables are measured at amortised cost less provision for impairment.
(b) Cash and cash equivalents
Cash and cash equivalents comprise cash in hand, deposits available on demand and other short-term highly liquid investments that are readily
convertible to a known amount of cash and are subject to an insignificant risk of changes in value. For the purposes of the cash flow statement,
cash and cash equivalents also includes bank overdrafts as they are an integral part of the Group’s cash management.
Financial liabilities and equity instrumentsFinancial liabilities and equity instruments are classified according to the substance of the contractual arrangements entered into. An equity
instrument is any contract that evidences a residual interest in the assets of the Group after deducting all of its liabilities.
(a) Trade payables
Trade payables are measured at amortised cost.
(b) Borrowings
Bank loans and overdrafts and other loans are initially measured at fair value less direct arrangement fees and subsequently measured at amortised
cost.
(c) Equity instruments
Equity instruments issued by the Group are recorded at the proceeds received net of direct issue costs.
Derivative financial instruments and hedge accountingThe Group uses derivative financial instruments, including forward foreign currency contracts, options, interest rate and currency swaps and non-
derivative cash instruments, including foreign currency borrowings, to hedge its exposure to the financial risks of changes in foreign exchange rates
or interest rates. The Group does not use derivative financial instruments for speculative purposes.
Derivative financial instruments are initially measured at fair value on the contract date and are subsequently measured at fair value at each balance
sheet date.

4 8 F e n n e r P L C
Notes to the Group financial statements continued
1. Significant accounting policies continued
Changes in the fair value of derivative financial instruments that are designated and effective as hedges of future cash flows are recognised directly
in equity. Amounts deferred in equity are recognised in the income statement in the same period in which the hedged item affects the income
statement.
Changes in the fair value of derivative financial instruments that do not qualify for hedge accounting or the ineffective portion of financial instruments
that are designated and effective as hedges are recognised in the income statement as they are incurred.
Hedge accounting is discontinued when the hedging instrument expires or is sold, terminated, exercised or no longer qualifies for hedge
accounting. Any cumulative gain or loss on the hedging instrument in equity at that time is retained in equity until the forecast transaction occurs. If a
hedged transaction is no longer expected to occur, the cumulative gain or loss in equity is transferred to the income statement in the period.
ProvisionsProvisions are recognised when the Group has a present obligation as a result of a past event and it is probable that the Group will be required to
settle that obligation. Provisions are measured at the directors’ best estimate of the expenditure required to settle the obligation at the balance sheet
date and are discounted to present value where the effect is material.
2. Critical accounting estimates and judgementsThe preparation of financial statements in accordance with IFRS requires management to make certain assumptions, estimates and judgements that
may affect the reported amounts of assets, liabilities, income and expenses. These are based on historical experience and any other factors,
including expectations of future events, that are considered appropriate, and these are continually reviewed. Subsequent actual results may however
differ from these estimates and judgements. Areas where assumptions, estimates and judgements may give rise to risk of material adjustments to
the carrying values of assets and liabilities in the next financial year are as follows:
• Taxation (notes 9 and 15)
• Impairment of goodwill (note 13)
• Inventory provisions (note 16)
• Provisions for impairment of trade receivables (note 17)
• Retirement benefit obligations (note 25)
• Share-based payments (note 26)
• Provisions (note 27)
• Contingencies (note 30)
• Acquisitions (note 33)
3. Segment information Segment information is presented in respect of the Group’s business and geographical segments. The primary format, business segments, is based
on the Group’s management reporting structure.
Segment results, assets and liabilities comprise items directly attributable to a segment. Unallocated costs, assets and liabilities are corporate items
that cannot be reasonably allocated to a segment.
Business segmentsThe Group is organised into the following main business segments:
Conveyor Belting Manufacture of rubber, PVC and steel cord conveyor belts. Applications include mining (underground and
surface), aggregates and various industrial uses such as package handling and process industries. This is
supported by a network of service branches around the world.
Advanced Engineered Products Manufacture of precision polymer products including:
- precision drives for computer peripherals, copiers and ATMs
- problem-solving power transmission and motion transfer components
- silicone and complex hoses for heavy duty trucks, buses and off-road vehicles
- seals and sealing solutions for the fluid power and oil and gas industries
- technical textiles for medical and industrial applications
- rollers for digital image processing and medical diagnostics
- fluropolymer components for fluid and gas handling

F e n n e r P L C 4 9
Segment information for the years ended 31 August 2008 and 31 August 2007 is as follows:
Segment resultTotal segment revenue
Inter-segment revenue
Revenue
Operating profit before amortisation of intangible
assets acquired and exceptional items
Amortisation of intangible assets acquired
Exceptional items
Operating profit
Net finance costs
Taxation
Profit for the year
Segment assets and liabilitiesTotal assets
Total liabilities
Net assets
Other segment informationCapital expenditure
Depreciation and amortisation
Capital expenditure relates to property, plant and equipment and intangible assets. Amortisation excludes amortisation of intangible assets acquired.
Geographical segmentsThe Group operates in four main geographical areas; Europe, Americas, Asia Pacific and Africa.
Segment information for the years ended 31 August 2008 and 31 August 2007 is as follows:
Europe
Americas
Asia Pacific
Africa
Unallocated
Revenue is based on the region in which the customer is located. Total assets and capital expenditure are based on the region in which the assets
are located.
440.6(2.8)
437.8
49.3(2.1)(3.4)
43.8
(7.5)(10.4)
25.9
499.0(293.1)
205.9
63.710.1
382.1(1.3)
380.8
39.0(0.6)(0.2)
38.2
(4.6)(9.7)
23.9
352.8(210.1)
142.7
32.08.0
--
-
(5.2)--
(5.2)
51.0(114.4)
(63.4)
0.2-
--
-
(5.9)--
(5.9)
31.4(141.7)
(110.3)
0.20.1
148.4(2.8)
145.6
26.1(2.0)(0.4)
23.7
186.5(36.2)
150.3
9.63.4
126.3(1.3)
125.0
20.0(0.6)1.7
21.1
120.5(30.0)
90.5
7.42.8
292.2-
292.2
29.1(0.1)(3.0)
26.0
281.1(115.2)
165.9
53.96.6
255.8-
255.8
24.2-
(1.9)
22.3
181.3(65.7)
115.6
24.45.2
2007£m
2008£m
2007£m
2008£m
2007£m
2008£m
2007£m
2008£m
TotalUnallocatedAdvanced
Engineered Products
4.739.917.8
1.3-
63.7
3.420.0
4.93.7
-
32.0
141.1245.5101.8
10.40.2
499.0
140.3142.6
61.98.3
(0.3)
352.8
102.2201.7113.2
20.7-
437.8
89.5183.0
88.320.0
-
380.8
2007£m
2008£m
2007£m
2008£m
2007£m
2008£m
Capital ExpenditureTotal AssetsRevenue
Conveyor Belting

Notes to the Group financial statements continued
5 0 F e n n e r P L C
4. Revenue Revenue is analysed as follows:
Sales of goods
Service contracts
RevenueFinance income
Other income
Total revenue
Other income is classified within administrative expenses in the consolidated income statement.
5. Operating profitOperating profit has been arrived at after charging/(crediting):
Depreciation of property, plant and equipment
Impairment loss on property, plant and equipment
Amortisation of intangible assets acquired
Amortisation of other intangible assets
(Profit)/loss on disposal of property, plant and equipment
Foreign exchange loss
Research and development costs
Government grants
Operating lease charges
Exceptional items*
Auditors’ remuneration for audit services
Auditors’ remuneration for non-audit services:
- UK
- Overseas
Amortisation of intangible assets acquired is classified within administrative expenses in the consolidated income statement.
Non-audit services comprise due diligence of £0.1m (2007: £nil), taxation services of £0.1m (2007: £nil) and other services of £0.1m (2007:
£0.1m). In addition, fees for actuarial and audit services of £0.1m (2007: £0.1m) were borne by the Fenner Pension Scheme.
*Exceptional items excludes net costs in respect of exceptional depreciation, impairment loss and profit on disposal of property, plant and
equipment totalling £1.5m (2007: £0.3m) that are already included within their respective disclosures.
6. Exceptional itemsExceptional items comprise £3.7m (2007: £1.9m) of restructuring costs and an impairment loss on assets associated with the expansion of the
conveyor belting business in North America, £0.4m (2007: £0.8m) of integration costs following the acquisitions of EGC, B-LOC and Winfield
Industries and a £0.7m profit on disposal of the lightweight PVC conveyor belting business. Prior year exceptional items also included a £2.5m
profit on disposal of joint venture.
412.225.6
437.81.81.0
440.6
363.217.6
380.81.40.7
382.9
2007£m
2008£m
9.70.82.10.4
(0.3)0.21.8
(0.1)4.11.90.6
-0.3
7.6-
0.60.40.20.11.7
(0.1)3.1
(0.1)0.5
0.1-
2007£m
2008£m

F e n n e r P L C 5 1
7. Employees
Aggregate employment costs are as follows:
Wages and salaries
Social security costs
Pension costs - defined contribution schemes
Pension costs - defined benefit schemes
Share-based payments
The average monthly number of employees during the year is as follows:
Production
Selling and distribution
Administration
Information on directors’ remuneration is included in the audited part of the Board Remuneration Report on pages 30 to 33.
8. Net finance costs
Interest payable on bank overdrafts and loans
Interest payable on other loans
Unwinding of discount on provisions (note 27)
Bank interest receivable
Net finance costs
Net finance costs
Unwinding of discount on provisions
Net interest payable on bank overdrafts and loans, other loans and bank interest receivable
5.04.00.3
9.3(1.8)
7.5
3.52.30.2
6.0(1.4)
4.6
2007£m
2008£m
7.5(0.3)
7.2
4.6(0.2)
4.4
2007£m
2008£m
2,959503462
3,924
2,738480445
3,663
2008 2007
104.210.7
4.10.20.6
119.8
90.59.13.50.80.5
104.4
2007£m
2008£m

Notes to the Group financial statements continued
5 2 F e n n e r P L C
9. Taxation
Current taxationUK corporation tax:
- current year
- double taxation relief
Overseas tax:
- current year
- adjustments in respect of prior years
Deferred taxationOrigination and reversal of temporary differences:
- UK
- Overseas
Total taxation
UK corporation tax is calculated at an average rate of 29.2% (2007: 30.0%) of the estimated assessable profit for the year. Overseas tax is
calculated at the rates prevailing in the respective jurisdictions.
The charge for the year and effective tax rate can be reconciled to profit per the income statement as follows:
Profit before taxation
Taxation at the average UK corporation tax rate of 29.2% (2007: 30.0%)
Income not taxable in determining taxable profit
Adjustments in respect of prior years
Effect of overseas tax rates
Other temporary differences not previously provided for
Taxation recognised directly in equity amounts to a deferred taxation credit of £1.8m (2007: charge of £4.3m), comprising origination and reversal of
temporary differences.
4.3(3.8)
0.5
10.20.3
10.5
11.0
0.8(1.4)
(0.6)
10.4
4.6(4.6)
-
9.9-
9.9
9.9
0.6(0.8)
(0.2)
9.7
2007£m
2008£m
2007%
2007£m
29(1)14
(4)
29
36.3
10.6(0.3)0.31.3
(1.5)
10.4
30--2
(3)
29
33.6
10.1(0.1)
-0.6
(0.9)
9.7
2008%
2008£m

F e n n e r P L C 5 3
10. Dividends
Dividends paid or approved in the yearInterim dividend for the year ended 31 August 2007 of 2.075p (2006: 1.975p) per share
Final dividend for the year ended 31 August 2007 of 4.15p (2006: 4.025p) per share
Dividends neither paid nor approved in the yearInterim dividend for the year ended 31 August 2008 of 2.2p (2007: 2.075p) per share
Final dividend for the year ended 31 August 2008 of 4.4p (2007: 4.15p) per share
The interim dividend for the year ended 31 August 2008 was paid on 8 September 2008. The proposed final dividend for the year ended
31 August 2008 is subject to approval by shareholders at the AGM. Consequently, neither have been recognised as liabilities at 31 August 2008.
If approved, the final dividend will be paid on 19 January 2009 to shareholders on the register on 19 December 2008.
11. Earnings per share
EarningsProfit for the year attributable to equity holders of the parent
Amortisation of intangible assets acquired and exceptional items
Taxation attributable to amortisation of intangible assets acquired and exceptional items
Profit for the year before amortisation of intangible assets acquired and exceptional items
Average number of sharesWeighted average number of shares in issue
Weighted average number of shares held by the Employee Share Ownership Plan Trust
Weighted average number of shares in issue – basic
Effect of share options and contingent long term incentive plans
Weighted average number of shares in issue – diluted
Earnings per shareAdjusted – before amortisation of intangible assets acquired and exceptional items
Basic
Diluted
Adjusted earnings per share has been presented to provide a clearer understanding of the underlying performance of the Group.
3.36.6
9.9
3.87.7
11.5
3.16.4
9.5
3.36.6
9.9
2007£m
2008£m
25.75.5
(2.1)
29.1
Number
166,091,438(112,767)
165,978,671888,357
166,867,028
Pence
23.70.8
(0.6)
23.9
Number
158,073,110(131,859)
157,941,251766,733
158,707,984
Pence
2007£m
2008£m
17.515.515.4
15.115.014.9

12. Property, plant and equipment
Cost:At start of prior year
Additions
Acquisition of businesses
Disposals
Disposal of joint venture
Reclassifications
Exchange differences
At start of year
Additions
Acquisition of businesses
Disposals
Disposal of business
Reclassifications
Exchange differences
At end of year
Accumulated depreciation:At start of prior year
Charge for the year
Disposals
Disposal of joint venture
Reclassifications
Exchange differences
At start of year
Charge for the year
Impairment loss
Disposals
Disposal of business
Exchange differences
At end of year
Net book value:At end of year
At start of year
At start of prior year
The net book value of plant, machinery and equipment includes an amount of £0.4m (2007: £0.5m) in respect of assets held under finance leases
and £69.8m (2007: £19.6m) in respect of assets under construction. The assets under construction have not yet been brought into use and therefore
no depreciation has been charged on these items during the year.
Borrowings are secured on freehold property for the value of £0.8m (2007: £0.5m).
At 31 August 2008, the Group had entered into contractual commitments for the purchase of property, plant and equipment amounting to £20.5m
(2007: £11.1m).
148.6
31.5
0.9
(3.4)
(1.8)
-
(4.2)
171.6
63.4
3.6
(1.1)
(4.3)
-
26.7
259.9
79.9
7.6
(3.0)
(1.0)
-
(2.1)
81.4
9.7
0.8
(0.9)
(2.6)
12.4
100.8
159.1
90.2
68.7
112.9
27.9
0.9
(3.4)
(1.3)
(1.1)
(3.5)
132.4
34.2
1.8
(1.1)
(2.9)
(1.6)
19.7
182.5
71.9
6.6
(3.0)
(0.9)
(0.8)
(1.9)
71.9
8.5
0.8
(0.9)
(2.2)
11.0
89.1
93.4
60.5
41.0
31.0
2.6
-
-
(0.5)
-
(0.6)
32.5
25.3
-
-
(1.4)
1.5
6.0
63.9
7.8
0.7
-
(0.1)
-
(0.1)
8.3
0.7
-
-
(0.4)
1.2
9.8
54.1
24.2
23.2
Total£m
Plant,machinery &
equipment£m
Leaseholdproperty
£m
Freeholdproperty
£m
4.7
1.0
-
-
-
1.1
(0.1)
6.7
3.9
1.8
-
-
0.1
1.0
13.5
0.2
0.3
-
-
0.8
(0.1)
1.2
0.5
-
-
-
0.2
1.9
11.6
5.5
4.5
5 4 F e n n e r P L C
Notes to the Group financial statements continued

F e n n e r P L C 5 5
13. Intangible assets
Cost:At start of prior year
Additions
Acquisition of businesses
Disposal of joint venture
Exchange differences
At start of year
Additions
Acquisition of businesses
Exchange differences
At end of year
Accumulated amortisation and impairment losses:At start of prior year
Amortisation charge for the year
Disposal of joint venture
At start of year
Amortisation charge for the year
Exchange differences
At end of year
Net book value:At end of year
At start of year
At start of prior year
The net book value of intangibles acquired comprises brands, trademarks, customer relationships and technology based assets.
All intangible assets have finite useful lives except for goodwill.
Impairment testing for goodwillGoodwill acquired through business combinations is allocated at acquisition to the Group’s cash-generating units that are expected to benefit from
that business combination. The carrying amount of goodwill is allocated to cash-generating units as follows:
Conveyor BeltingFenner Dunlop (Americas, Europe and Australia)
Conveyor Belting (India)
Fenner Dunlop Conveyor Services
Northern Belting Specialists (Australia)
Advanced Engineered ProductsFenner Advanced Sealing Technologies (Process)
Fenner Advanced Sealing Technologies (Fluid Power)
Dawson Hose (UK)
Fenner Drives (US)
Prodesco
Fenner Precision (Buffalo)
72.4
0.5
2.6
(0.1)
(1.4)
74.0
0.3
44.1
9.1
127.5
6.6
1.0
(0.1)
7.5
2.5
0.7
10.7
116.8
66.5
65.8
0.2
-
-
-
-
0.2
-
-
-
0.2
0.2
-
-
0.2
-
-
0.2
-
-
-
3.2
0.5
-
(0.1)
(0.1)
3.5
0.3
-
0.4
4.2
2.4
0.4
(0.1)
2.7
0.4
0.3
3.4
0.8
0.8
0.8
Total£m
Other£m
14.92.01.82.0
14.125.3
2.23.26.92.5
74.9
14.12.0
--
12.823.1
2.22.1
--
56.3
2007£m
2008£m
Computer software
£m
Intangiblesacquired
£mGoodwill
£m
59.4
-
0.5
-
(1.0)
58.9
-
13.7
4.9
77.5
2.6
-
-
2.6
-
-
2.6
74.9
56.3
56.8
9.6
-
2.1
-
(0.3)
11.4
-
30.4
3.8
45.6
1.4
0.6
-
2.0
2.1
0.4
4.5
41.1
9.4
8.2
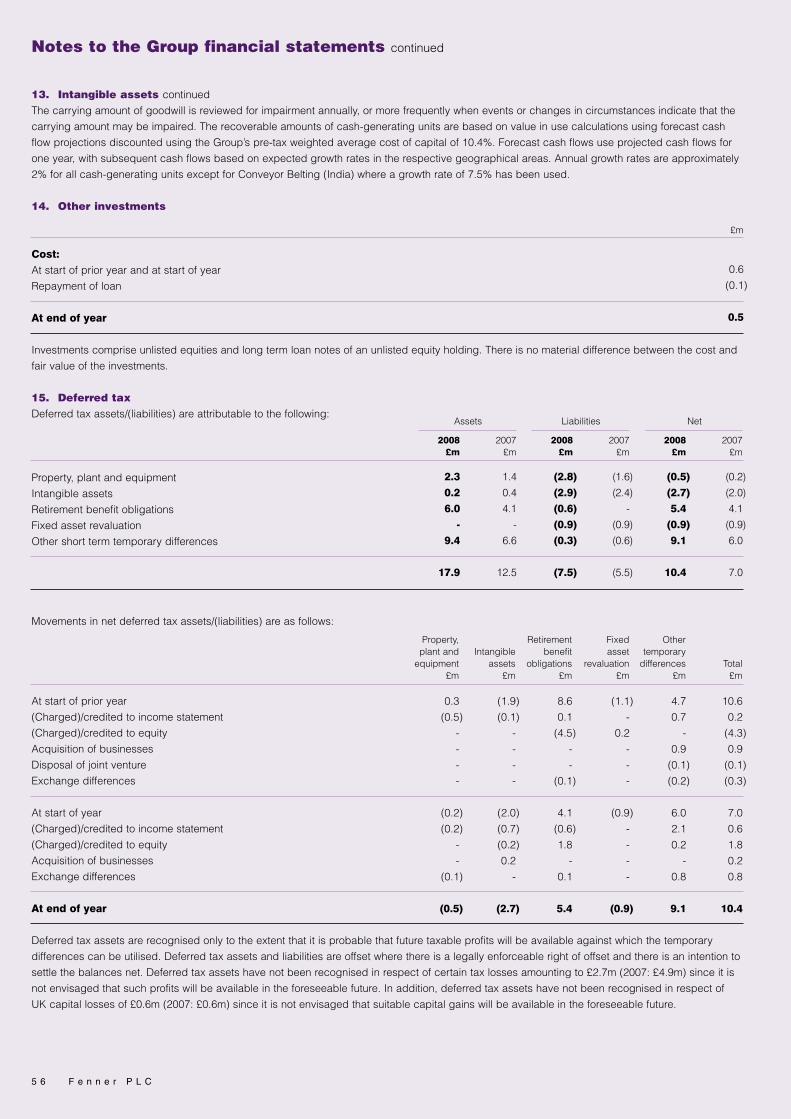
5 6 F e n n e r P L C
13. Intangible assets continued
The carrying amount of goodwill is reviewed for impairment annually, or more frequently when events or changes in circumstances indicate that the
carrying amount may be impaired. The recoverable amounts of cash-generating units are based on value in use calculations using forecast cash
flow projections discounted using the Group’s pre-tax weighted average cost of capital of 10.4%. Forecast cash flows use projected cash flows for
one year, with subsequent cash flows based on expected growth rates in the respective geographical areas. Annual growth rates are approximately
2% for all cash-generating units except for Conveyor Belting (India) where a growth rate of 7.5% has been used.
14. Other investments
Cost:At start of prior year and at start of year
Repayment of loan
At end of year
Investments comprise unlisted equities and long term loan notes of an unlisted equity holding. There is no material difference between the cost and
fair value of the investments.
15. Deferred taxDeferred tax assets/(liabilities) are attributable to the following:
Property, plant and equipment
Intangible assets
Retirement benefit obligations
Fixed asset revaluation
Other short term temporary differences
Movements in net deferred tax assets/(liabilities) are as follows:
At start of prior year
(Charged)/credited to income statement
(Charged)/credited to equity
Acquisition of businesses
Disposal of joint venture
Exchange differences
At start of year
(Charged)/credited to income statement
(Charged)/credited to equity
Acquisition of businesses
Exchange differences
At end of year
Deferred tax assets are recognised only to the extent that it is probable that future taxable profits will be available against which the temporary
differences can be utilised. Deferred tax assets and liabilities are offset where there is a legally enforceable right of offset and there is an intention to
settle the balances net. Deferred tax assets have not been recognised in respect of certain tax losses amounting to £2.7m (2007: £4.9m) since it is
not envisaged that such profits will be available in the foreseeable future. In addition, deferred tax assets have not been recognised in respect of
UK capital losses of £0.6m (2007: £0.6m) since it is not envisaged that suitable capital gains will be available in the foreseeable future.
0.6
(0.1)
0.5
£m
Notes to the Group financial statements continued
(0.5)(2.7)5.4
(0.9)9.1
10.4
(0.2)(2.0)4.1
(0.9)6.0
7.0
(2.8)(2.9)(0.6)(0.9)(0.3)
(7.5)
(1.6)(2.4)
-(0.9)(0.6)
(5.5)
2.30.26.0
-9.4
17.9
1.40.44.1
-6.6
12.5
2007£m
2008£m
2007£m
2008£m
2007£m
2008£m
NetLiabilitiesAssets
10.6
0.2
(4.3)
0.9
(0.1)
(0.3)
7.0
0.6
1.8
0.2
0.8
10.4
4.7
0.7
-
0.9
(0.1)
(0.2)
6.0
2.1
0.2
-
0.8
9.1
(1.1)
-
0.2
-
-
-
(0.9)
-
-
-
-
(0.9)
8.6
0.1
(4.5)
-
-
(0.1)
4.1
(0.6)
1.8
-
0.1
5.4
(1.9)
(0.1)
-
-
-
-
(2.0)
(0.7)
(0.2)
0.2
-
(2.7)
0.3
(0.5)
-
-
-
-
(0.2)
(0.2)
-
-
(0.1)
(0.5)
Total£m
Other temporary
differences£m
Fixedasset
revaluation£m
Retirementbenefit
obligations£m
Intangibleassets
£m
Property,plant and
equipment£m

Deferred tax liabilities have not been recognised on the undistributed earnings of subsidiaries because the Group is in a position to control the
timing of reversal of the temporary differences and it is probable that such differences will not reverse in the foreseeable future. The aggregate of
temporary differences in respect of this is £0.1m (2007: £0.1m).
16. Inventories
Raw materials
Work in progress
Finished goods
Inventories are presented net of provision for inventory write downs, based on management’s estimate of the net realisable value of inventories. The
amount charged to the income statement in the year in respect of write downs of inventories is £2.2m (2007: £1.7m). The amount credited to the
income statement in the year in respect of reversals of write downs of inventories is £0.4m (2007: £0.9m). The cost of inventories recognised as an
expense in the year is £300.7m (2007: £258.9m).
17. Trade and other receivables
Trade receivables
Other receivables
Prepayments and accrued income
Trade receivables are presented net of provision for impairment of trade receivables of £1.2m (2007: £1.1m), estimated by management based on
past default experience and other factors as considered appropriate.
Movements in the provision for impairment of trade receivables are as follows:
At start of year
New provisions charged to income statement during the year
Provisions not required credited to income statement during the year
Provisions utilised during the year
Acquisition of businesses
Disposal of joint ventures
Other movements
Exchange differences
At end of year
The ageing analysis of trade receivables not impaired, based on the due date, is as follows:
Not overdue
Less than one month
Between one and two months
Between two and three months
Between three and six months
Trade and other receivables are non-interest bearing. There is no material difference between the carrying amount and the fair value of trade and
other receivables.
F e n n e r P L C 5 7
57.32.12.1
61.5
78.92.63.2
84.7
2007£m
2008£m
0.80.6
(0.2)(0.1)0.2
(0.1)(0.1)
-
1.1
1.10.5
(0.2)(0.3)
---
0.1
1.2
2007£m
2008£m
30.911.832.1
74.8
19.98.5
26.1
54.5
2007£m
2008£m
37.313.8
5.10.60.5
57.3
50.216.8
9.31.90.7
78.9
2007£m
2008£m

5 8 F e n n e r P L C
18. Cash and cash equivalents
Cash at bank and in hand and short term deposits
Cash at bank and short term bank deposits earn interest at floating rates based on bank deposit rates. Short term deposits have an original
maturity of three months or less. There is no material difference between the carrying amount and fair value of cash and cash equivalents.
For the purpose of the cash flow statement, cash and cash equivalents comprises:
Cash and cash equivalents
Bank overdrafts
19. Reconciliation of net cash flow to movement in net debt
Net (decrease)/increase in cash and cash equivalents
Increase in borrowings and finance leases resulting from cash flows
Movement in net debt resulting from cash flows
New finance leases
Exchange movements
Movement in net debt in the yearNet debt at start of year
Net debt at end of year
Net debt is defined as cash and cash equivalents and current and non-current borrowings.
66.1(0.1)
66.0
43.6-
43.6
2007£m
2008£m
66.143.6
2007£m
2008£m
26.4(31.9)
(5.5)(0.2)2.5
(3.2)(33.1)
(36.3)
(26.5)(23.9)
(50.4)-
(10.9)
(61.3)(36.3)
(97.6)
2007£m
2008£m
Notes to the Group financial statements continued

F e n n e r P L C 5 9
20. Financial risk managementIn the normal course of business, the Group is exposed to certain financial risks, principally foreign exchange risk, interest rate risk, liquidity risk
and credit risk. These risks are managed by the central treasury function in conjunction with the operating units, in accordance with risk
management policies that are designed to minimise the potential adverse effects of these risks on financial performance. The policies are reviewed
and approved by the Board.
Foreign exchange riskThe Group has operations around the world and is therefore exposed to foreign exchange risk arising from net investments in foreign operations.
Where cost effective, the exposures arising from the translation of the net assets of the Group’s foreign operations are managed through the use of
borrowings in the relevant foreign currency.
Some Group operations also enter into commercial transactions in currencies other than their functional currencies. Exposures arising from the
translation of foreign currency transactions are continually monitored and material exposures are managed through the use of forward contracts or
options once cash flows can be identified with sufficient certainty. Exposures arising from the translation of intra-group lending are managed
through the use of borrowings in the relevant foreign currency.
The following table shows the impact (due to the retranslation of non-functional currency monetary assets and liabilities in the Group's operations)
of a 10% movement in the Group’s principal foreign currency exchange rates at the year end date.
31 August 2008US dollar
Euro
Australian dollar
31 August 2007US dollar
Euro
Australian dollar
The effect on profit before taxation is due to the retranslation of trade receivables, cash, borrowings, trade payables and derivative financial assets
and liabilities denominated in non-functional currencies. The effect on shareholders’ equity is due to the hedge of net investments in foreign
currencies.
Interest rate riskThe Group’s exposure to interest rate risk arises on floating rate borrowings and short term cash deposits. This is reviewed regularly and is
managed through the use of an appropriate mix of fixed rate and floating rate instruments, including the use of interest rate swaps, in response to
market conditions.
The impact of interest rate risk on the Group's result is due to changes in interest rates on net floating rate cash and borrowings. At 31 August 2008,
if interest rates on the Group's net floating rate cash and borrowings had been 100 basis points higher, with all other variables held constant, the
effect on profit before taxation in the year would have been a charge of £0.1m (2007: £nil). A reduction of 100 basis points would have the equal
and opposite effect. There is no impact on shareholders' equity.
Liquidity riskThe Group’s objective is to ensure that sufficient resources are available to fund short term working capital and longer term strategic requirements.
This is achieved through an appropriate mix of long and short term borrowings.
It is the Group's policy that there should be sufficient long term committed debt facilities available such that the major part of the Group's total
borrowings would not mature for at least one year. The Group regularly reviews expected cash flows against availability of financing.
-(0.9)(0.6)
-
(0.7)
(0.1)
0.2--
-
0.2
-
(0.2)--
-
(0.2)
-
Effect onshareholders'
equity
Effect onprofit before
taxation
-0.70.5
-
0.6
0.1
Effect onshareholders'
equity
Effect onprofit before
taxation
10% increase 10% decrease

6 0 F e n n e r P L C
Notes to the Group financial statements continued
20. Financial risk management continued
Credit riskCredit risk principally arises on short term cash deposits, derivative financial instruments and trade receivables.
The credit risk arising on short term cash deposits and derivative financial instruments is managed through the use of counterparties with high
credit ratings assigned by international credit rating agencies.
The Group only trades with recognised, creditworthy third parties. It is the Group's policy that all customers who wish to take on credit terms are
subject to credit verification procedures. Receivable balances are monitored on an ongoing basis and the Group's exposure to bad debts is not
significant. The credit risk arising on trade receivables is spread across a large number of customers and across many countries. There are no
significant concentrations of credit risk.
The Group's maximum exposure to credit risk is equal to the carrying value of these instruments.
21. Capital managementThe primary objective of the Group's capital management is to ensure that it maintains healthy capital ratios in order to support its business and
maximise shareholder value. The Group manages its capital structure and makes adjustments to it in light of changes in economic conditions. To
maintain or adjust the capital structure, the Group may adjust the dividend payment to shareholders, return capital to shareholders or issue new
shares. The Group monitors capital using the following indicators:
Gearing ratio
Net debt (£m)
Total equity (£m)
Gearing ratio (%)
Gearing comprises net debt divided by total equity.
Net debt to EBITDA ratio
Net debt (£m)
Operating profit (£m)
Exceptional items (excluding exceptional depreciation) (£m)
Depreciation and amortisation (£m)
EBITDA (£m)
Net debt to EBITDA ratio
Net debt to EBITDA comprises net debt divided by operating profit before depreciation, amortisation and exceptional items.
For compliance with loan covenants, the EBITDA reported above is adjusted for, inter alia, acquisitions and disposals, which makes the net debt to
EBITDA ratio significantly lower.
Interest cover
Operating profit before amortisation of intangible assets acquired and exceptional items (£m)
Net interest payable on bank overdrafts and loans, other loans and bank interest receivable (£m)
Interest cover (times)
Interest cover comprises operating profit before amortisation of intangible assets acquired and exceptional items divided by net interest payable on
bank overdrafts and loans, other loans and bank interest receivable.
36.3142.7
25.4
97.6205.9
47.4
20072008
39.04.48.9
49.37.26.8
20072008
36.338.2(0.1)8.6
46.70.8
97.643.8
2.312.258.3
1.7
20072008

F e n n e r P L C 6 1
22. Borrowings
CurrentBank overdrafts
Bank loans
Other loans
Obligations under finance leases
Non-currentBank loans
Other loans
Obligations under finance leases
Total borrowings
Bank loans include £49.6m (2007: £33.5m) drawn down under a committed revolving bank credit facility maturing in June 2012. During the year, an
additional £15.6m was drawn down under a committed facility maturing in May 2013. Other loans principally relate to two US dollar private
placements as detailed below.
$27.2m (2007: $34.1m) of Senior Notes bear interest at 7.29% per annum, with an amount of $6.8m repayable annually on 1 June each year until 2012.
$90.0m (2007: $90.0m) of Senior Notes bear interest at 5.78% per annum and are repayable on 1 June 2017. $27.2m (£14.9m) of this amount has
been swapped into Euros. This results in an underlying Euro borrowing of €20.0m at a fixed interest rate of 5.05%. The swap matures on 1 June
2017 when the private placement is repayable. Arrangement fees of £0.3m are being amortised over the life of the loan.¤
Bank balances are stated net where a legal right of offset exists.¤
The maturity profile of borrowings is as follows:
31 August 2008Within one year or on demand
Between one and two years
Between two and five years
More than five years
31 August 2007Within one year or on demand
Between one and two years
Between two and five years
More than five years
13.73.9
72.950.7
141.2
10.2
3.6
43.9
44.7
102.4
0.1---
0.1
0.1
0.1
-
-
0.2
Total£m
Financeleases
£m
3.93.97.7
50.7
66.2
3.5
3.5
10.3
44.7
62.0
9.7-
65.2-
74.9
6.5
-
33.6
-
40.1
Other loans
£m
Bankloans
£m
----
-
0.1
-
-
-
0.1
Bankoverdrafts
£m
0.16.53.50.1
10.2
33.658.5
0.1
92.2
102.4
-9.73.90.1
13.7
65.262.3
-
127.5
141.2
2007£m
2008£m

Notes to the Group financial statements continued
22. Borrowings continued
The interest rate and currency profile of borrowings is as follows:
31 August 2008US dollar
Euro
Australian dollar
Other currencies
31 August 2007US dollar
Euro
Australian dollar
Other currencies
The fixed rate borrowings principally relate to the US dollar private placements detailed above and $40.0m of bank borrowings, where the floating
rate has been swapped to fixed rate using an interest rate swap. This is detailed in note 23. The interest rates on floating rate borrowings are
principally linked to LIBOR or similar local currency rates.
The carrying amount and fair value of borrowings is as follows:
Current borrowings
Non-current borrowings
The fair value of fixed rate borrowings represents the value of replacing the existing fixed rate liabilities at the balance sheet date with borrowings
with similar terms to the remaining life of the loans. The fair value of all other floating rate borrowings approximates to their carrying amounts where
rates are reset to market rates at intervals of less than one year.
At 31 August 2008, the Group had available £51.3m (2007: £41.5m) of undrawn committed borrowing facilities which expire between June 2012
and May 2013.
Current borrowings of £0.1m (2007: £0.1m) and non-current borrowings of £0.7m (2007: £0.4m) are secured on specific freehold property.
23. Derivative financial instruments
Forward foreign currency contracts and options
Currency swaps
Interest rate swaps
The fair value of derivative financial instruments is equal to the carrying value. The fair value of forward foreign currency contracts represents the gain or
loss resulting from translation of the contracts using forward rates at the balance sheet date compared to actual contract rates. The fair value of interest
rate swaps, currency swaps and forward foreign currency options represents the market value of a comparable instrument at the balance sheet date.
Forward foreign currency contracts and optionsThe loss on forward foreign currency contracts and options of £1.0m (2007: £0.3m) has been recognised in the income statement.
0.2-
(0.7)
(0.5)
(0.8)(0.3)(1.5)
(2.6)
2007£m
2008£m
--
(0.7)
(0.7)
2007£m
2008£m
2008£m
2007£m
Assets Liabilities Net
(0.8)(0.3)(1.5)
(2.6)
---
-
0.2--
0.2
10.293.4
103.6
10.292.2
102.4
Fair value
£m
Carryingamount
£m
13.7125.2
138.9
13.7127.5
141.2
Fair value
£m
Carryingamount
£m
2008 2007
81.419.229.511.1
141.2
70.0
19.8
7.7
4.9
102.4
71.216.1
--
87.3
67.8
13.5
-
-
81.3
Total£m
Fixedrate£m
10.23.1
29.511.1
53.9
2.2
6.3
7.7
4.9
21.1
Floatingrate£m
6 2 F e n n e r P L C

F e n n e r P L C 6 3
Currency swapsThe currency swap is in respect of US dollars that have been swapped into Euros, as detailed in note 22. The post-tax loss of £0.2m (2007: £nil) is
recognised in the hedging reserve in shareholders' equity.
Interest rate swapsThe interest on US bank loans of $40.0m has been fixed by means of a US dollar denominated interest rate swap at an effective rate of 6.37%
(including variable bank margin) and designated as a hedge. The post-tax loss of £0.6m (2007: £0.1m) is recognised in the hedging reserve in
shareholders’ equity.
Hedge of net investments in foreign currenciesGroup financial instruments denominated in Euros of £8.1m (2007: £6.8m) and Australian dollars of £5.2m (2007: £0.4m) are designated as hedges
of the net investment in overseas subsidiaries. The loss on translation to sterling at the year end of £1.4m (2007: gain of £0.5m) is recognised in the
hedging reserve in shareholders’ equity.
24. Trade and other payables
CurrentTrade payables
Other taxes and social security
Other payables
Accruals and deferred income
Non-currentAccruals and deferred income
Trade and other payables are non-interest bearing. There is no material difference between the carrying amount and fair value of trade and other payables.
25. Post-retirement benefitsThe Group operates a number of defined benefit post-retirement schemes for qualifying employees in operations around the world. The assets of
the schemes are held in separate trustee administered funds. The cost of the schemes are assessed in accordance with the advice of independent
qualified actuaries using the projected unit method.
The principal scheme is the Fenner Pension Scheme which is based in the UK. The most recent triennial valuation of the Fenner Pension Scheme,
whilst yet to be formally completed, was carried out with an effective date of 31 March 2008. The actuarial valuations for all schemes were updated
as at 31 August 2008 by independent qualified actuaries.
The principal assumptions used to determine the assets and liabilities of the schemes are as follows:
Discount rate
Inflation rate
Rate of increase in salaries
Rate of increase in pensions in payment subject to Limited Price Indexation increases:
- capped at 5.0%
- capped at 2.5%
Rate of increase for deferred pensioners subject to statutory revaluation
Expected rate of return on assets of the scheme:
- Equities
- Bonds
- Cash
The principal assumptions of the schemes are determined using appropriate expert advice and available market data. The assumptions of the
overseas schemes are given as a range of values in respect of the individual schemes. The range of values is a consequence of the diversity of
territories in which the Group operates defined benefit schemes.
5.1% - 6.0%2.0% - 2.5%3.0% - 4.5%
---
7.0% - 8.0%5.4% - 7.0%
-
5.7%3.1%4.1%
3.0%2.2%3.1%
7.9%4.9%5.8%
6.3%3.7%4.7%
3.4%2.3%3.7%
7.9%5.0%5.0%
Overseasschemes
UKscheme
5.5% - 6.4%2.3% - 2.5%2.3% - 4.5%
---
7.0% - 8.0%6.4% - 7.0%
-
Overseasschemes
UKscheme
2008 2007
45.41.85.8
22.1
75.1
-
61.42.59.0
26.9
99.8
0.5
2007£m
2008£m

Notes to the Group financial statements continued
25. Post-retirement benefits continued
The assumptions relating to longevity underlying the pension liabilities at the balance sheet date are based on standard actuarial mortality tables,
with adjustments to reflect the schemes' actual mortality experience. For the Fenner Pension Scheme, an increased allowance for future
improvement in longevity has also been made. The assumptions used for the remaining life expectancy are as follows:
Current pensioner at age 65:
- men
- women
Future pensioner at age 65:
- men
- women
The fair value of assets of the schemes are as follows:
Equity
Bonds
Cash
Amounts charged/(credited) to the income statement are as follows:
Current service cost
Interest on obligations
Expected return on assets of the schemes
The charge for the year is classified within administrative expenses in the consolidated income statement.
The actual return on assets of the schemes is a loss of £8.2m (2007: gain of £8.9m).
Actuarial gains and losses are recognised in full in the statement of recognised income and expense in the period in which they are incurred. These
amounted to a loss of £7.4m (2007: gain of £12.0m).
Amounts recognised as retirement benefit obligations in the balance sheet are as follows:
Present value of obligations
Fair value of assets of the schemes
The present value of obligations includes £1.5m (2007: £1.5m) in respect of schemes that are wholly unfunded.
1.47.2
(7.8)
0.8
0.40.8
(0.7)
0.5
Total£m
Overseasschemes
£m
1.06.4
(7.1)
0.3
UKscheme
£m
2007
(138.9)124.8
(14.1)
(17.2)16.2
(1.0)
(135.3)116.2
(19.1)
Total£m
Overseasschemes
£m
(121.7)108.6
(13.1)
UKscheme
£mTotal
£m
(116.5)101.0
(15.5)
(18.8)15.2
(3.6)
Overseasschemes
£m
UKscheme
£m
2008 2007
1.27.7
(8.7)
0.2
Total£m
0.96.7
(7.8)
(0.2)
0.31.0
(0.9)
0.4
Overseasschemes
£m
UKscheme
£m
2008
85.928.310.6
124.8
3.412.8
-
16.2
74.828.313.1
116.2
Total£m
Overseasschemes
£m
82.515.510.6
108.6
UKscheme
£mTotal
£m
71.716.213.1
101.0
3.112.1
-
15.2
Overseasschemes
£m
UKscheme
£m
2008 2007
16 - 18 years20 - 21 years
16 - 18 years20 - 21 years
19 years22 years
20 years23 years
19 years23 years
20 years24 years
Overseasschemes
UKscheme
17 - 18 years21 years
17 - 18 years21 years
Overseasschemes
UKscheme
2008 2007
6 4 F e n n e r P L C

F e n n e r P L C 6 5
Movements in the present value of obligations are as follows:
At start of prior year
Current service cost
Interest on obligations
Actuarial (gains)/losses
Employee contributions
Benefits paid
Disposal of joint venture
Exchange differences
At start of year
Current service cost
Interest on obligations
Actuarial gains
Employee contributions
Benefits paid
Exchange differences
At end of year
Movements in the fair value of assets of the schemes are as follows:
At start of prior year
Expected return on assets of the schemes
Actuarial gains
Employer contributions
Employee contributions
Benefits paid
Disposal of joint venture
At start of year
Expected return on assets of the schemes
Actuarial losses
Employer contributions
Employee contributions
Benefits paid
Exchange differences
At end of year
Experience adjustments are as follows:
Present value of obligations
Fair value of assets of the schemes
Deficit in the schemes
Experience gains/(losses) on liabilities of the schemes
Experience (losses)/gains on assets of the schemes
The Group expects to contribute approximately £4.1m to its defined benefit schemes in the year ending 31 August 2009.
117.8
7.8
1.1
3.5
0.7
(5.1)
(1.0)
124.8
8.7
(16.9)
2.9
0.7
(6.5)
2.5
116.2
15.3
0.7
-
1.6
0.3
(0.7)
(1.0)
16.2
0.9
(4.7)
1.0
0.3
(1.0)
2.5
15.2
Total£m
Overseasschemes
£m
102.5
7.1
1.1
1.9
0.4
(4.4)
-
108.6
7.8
(12.2)
1.9
0.4
(5.5)
-
101.0
UKscheme
£m
(146.3)105.7
(40.6)
(0.3)11.4
2005£m
(146.9)117.8
(29.1)
1.56.0
2006£m
(138.9)124.8
(14.1)
(0.7)1.1
2007£m
(135.3)116.2
(19.1)
3.6(16.9)
2008£m
146.9
1.4
7.2
(10.9)
0.7
(5.1)
(1.2)
(0.1)
138.9
1.2
7.7
(9.5)
0.7
(6.5)
2.8
135.3
17.5
0.4
0.8
0.2
0.3
(0.7)
(1.2)
(0.1)
17.2
0.3
1.0
(1.8)
0.3
(1.0)
2.8
18.8
Total£m
Overseasschemes
£m
129.4
1.0
6.4
(11.1)
0.4
(4.4)
-
-
121.7
0.9
6.7
(7.7)
0.4
(5.5)
-
116.5
UKscheme
£m
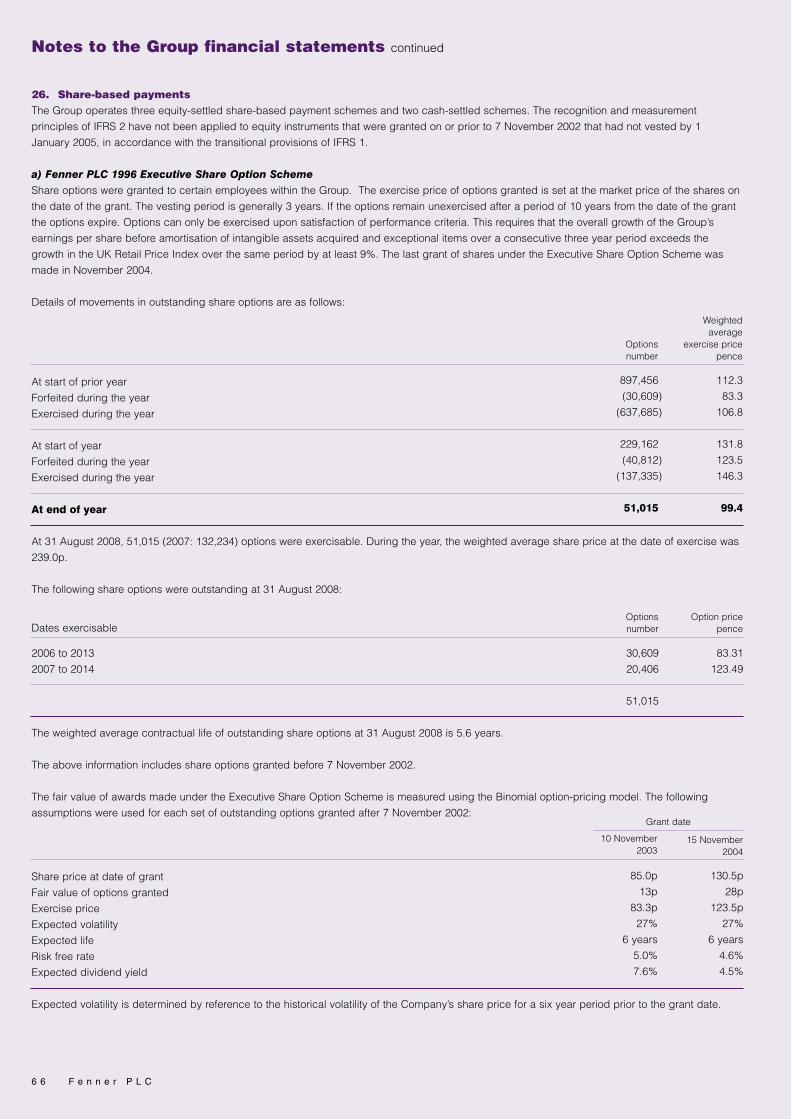
Notes to the Group financial statements continued
26. Share-based paymentsThe Group operates three equity-settled share-based payment schemes and two cash-settled schemes. The recognition and measurement
principles of IFRS 2 have not been applied to equity instruments that were granted on or prior to 7 November 2002 that had not vested by 1
January 2005, in accordance with the transitional provisions of IFRS 1.
a) Fenner PLC 1996 Executive Share Option SchemeShare options were granted to certain employees within the Group. The exercise price of options granted is set at the market price of the shares on
the date of the grant. The vesting period is generally 3 years. If the options remain unexercised after a period of 10 years from the date of the grant
the options expire. Options can only be exercised upon satisfaction of performance criteria. This requires that the overall growth of the Group’s
earnings per share before amortisation of intangible assets acquired and exceptional items over a consecutive three year period exceeds the
growth in the UK Retail Price Index over the same period by at least 9%. The last grant of shares under the Executive Share Option Scheme was
made in November 2004.
Details of movements in outstanding share options are as follows:
At start of prior year
Forfeited during the year
Exercised during the year
At start of year
Forfeited during the year
Exercised during the year
At end of year
At 31 August 2008, 51,015 (2007: 132,234) options were exercisable. During the year, the weighted average share price at the date of exercise was
239.0p.
The following share options were outstanding at 31 August 2008:
Dates exercisable
2006 to 2013
2007 to 2014
The weighted average contractual life of outstanding share options at 31 August 2008 is 5.6 years.
The above information includes share options granted before 7 November 2002.
The fair value of awards made under the Executive Share Option Scheme is measured using the Binomial option-pricing model. The following
assumptions were used for each set of outstanding options granted after 7 November 2002:
Share price at date of grant
Fair value of options granted
Exercise price
Expected volatility
Expected life
Risk free rate
Expected dividend yield
Expected volatility is determined by reference to the historical volatility of the Company’s share price for a six year period prior to the grant date.
112.3
83.3
106.8
131.8
123.5
146.3
99.4
897,456
(30,609)
(637,685)
229,162
(40,812)
(137,335)
51,015
Weightedaverage
exercise pricepence
Optionsnumber
130.5p
28p
123.5p
27%
6 years
4.6%
4.5%
85.0p
13p
83.3p
27%
6 years
5.0%
7.6%
15 November2004
10 November2003
Grant date
83.31
123.49
30,609
20,406
51,015
Option pricepence
Optionsnumber
6 6 F e n n e r P L C

F e n n e r P L C 6 7
b) Long Term Share Incentive Plan Provisional allocations of shares were made to certain employees within the Group. The provisional allocation was made to each employee at the
start of a three year plan cycle and was based on a percentage of the basic annual salary of each employee. The awards are subject to the
satisfaction of performance criteria. The proportion of the provisional allocation of shares that is awarded is based on the Group’s total shareholder
return ("TSR") over the plan cycle compared to the TSR of the comparator group. The last provisional allocation of shares under the Long Term
Share Incentive Plan was made in November 2005.
Details of movements in provisional allocations under the Long Term Share Incentive Plan are as follows:
At start of prior year
Awarded during the year
Lapsed during the year
At start of year
Awarded during the year
Lapsed during the year
Forfeited during the year
At end of year
Shares awarded during the year included 34,670 of ordinary shares issued from shares held by the Employee Share Ownership Plan Trust.
The following provisional allocations were outstanding at 31 August 2008:
Date of provisional allocations
9 November 2005
The fair value of awards made under the Long Term Share Incentive Plan is measured using the Monte Carlo simulation approach. The following
assumptions were used for the provisional allocation made on 9 November 2005:
Share price at date of provisional allocations
Fair value of shares awarded
Expected volatility
Expected life
Risk free rate
Expected dividend yield
Expected volatility is determined by calculating the historical volatility of the Company’s share price for a three year period from the date of
provisional allocation.
Further details of the Long Term Share Incentive Plan can be found in the Board Remuneration Report on pages 27 to 33.
2,168,524
(915,033)
(5,061)
1,248,430
(269,411)
(356,639)
(92,444)
529,936
Sharesnumber
529,936
Sharesnumber
151.0p
52p
26%
3 years
4.8%
3.9%

26. Share-based payments continued
c) Performance Share PlanConditional awards of shares were made to certain employees within the Group. The conditional award is made to each employee at the start of a
three year performance period and is based on a percentage of the basic annual salary of each employee. The awards are subject to the
satisfaction of performance criteria. The proportion of the conditional awards of shares that are awarded is based on the Group’s TSR over the
performance period compared to the TSR of the comparator group.
Details of movements in conditional awards under the Performance Share Plan are as follows:
At start of prior year
Conditional awards during the year
At start of year
Conditional awards during the year
At end of year
The following conditional awards were outstanding at 31 August 2008:
Date of conditional awards
20 February 2007
12 February 2008
The fair value of awards made under the Performance Share Plan is measured using the Monte Carlo simulation approach. The following
assumptions were used for each set of conditional awards:
Share price at date of conditional awards
Fair value of shares awarded
Expected volatility
Expected life
Risk free rate
Expected dividend yield
Expected volatility is determined by calculating the historical volatility of the Company’s share price for a three year period from the conditional award date.
Further details of the Performance Share Plan can be found in the Board Remuneration Report on pages 27 to 33.
d) Long Term Shadow Incentive PlanProvisional allocations of notional shares were made to certain employees within the Group. The rules and performance criteria are the same as the
Long Term Share Incentive Plan above. Awards are settled in the form of cash. The last provisional allocation of notional shares under the Long
Term Shadow Incentive Plan was made in November 2005.
Details of movements in provisional allocations under the Long Term Shadow Incentive Plan are as follows:
At start of prior year
Forfeited during the year
At start of year
Forfeited during the year
At end of year
252,000
(20,000)
232,000
(8,000)
224,000
Notionalshares
number
-
427,864
427,864
417,802
845,666
Sharesnumber
427,864
417,802
845,666
Sharesnumber
246.0p
179p
28%
3 years
4.3%
2.5%
226.75p
101p
25%
3 years
5.3%
2.7%
12 February2008
20 February2007
6 8 F e n n e r P L C
Notes to the Group financial statements continued

F e n n e r P L C 6 9
The following provisional allocations were outstanding at 31 August 2008:
Date of provisional allocations
9 November 2005
The fair value of awards made under the Long Term Shadow Incentive Plan is measured using the Monte Carlo simulation approach. The following
assumptions were used for the provisional allocations of notional shares on 9 November 2005:
Share price at valuation date
Fair value of shares awarded
Expected volatility
Expected life
Risk free rate
Expected dividend yield
Expected volatility is determined by calculating the historical volatility of the Company’s share price for a three year period from the date of
provisional allocation.
e) Shadow Performance Share PlanConditional awards of notional shares were made to certain employees within the Group. The rules and performance criteria are the same as the
Performance Share Plan above. Awards are settled in the form of cash.
Details of movements in conditional awards under the Shadow Performance Share Plan are as follows:
At start of prior year
Conditional awards during the year
At start of year
Conditional awards during the year
Forfeited during the year
At end of year
The following conditional awards were outstanding at 31 August 2008:
Date of conditional awards
20 February 2007
12 February 2008
The fair value of awards made under the Shadow Performance Share Plan is measured using the Monte Carlo simulation approach. The following
assumptions were used for each set of conditional awards of notional shares:
Share price at valuation date
Fair value of shares awarded
Expected volatility
Expected life
Risk free rate
Expected dividend yield
Expected volatility is determined by calculating the historical volatility of the Company’s share price for a three year period from the award date.
-
319,000
319,000
330,000
(24,000)
625,000
Notionalshares
number
224,000
Notionalshares
number
228.0p
112p
29%
3 years
4.5%
2.8%
303,000
322,000
625,000
Notionalshares
number
228.0p
125p
29%
3 years
4.5%
2.8%
228.0p
102p
29%
3 years
4.5%
2.8%
12 February2008
20 February2007

Notes to the Group financial statements continued
26. Share-based payments continued
Liabilities included within trade and other payables in the balance sheet amounted to £0.2m (2007: £0.1m) in respect of the Long Term Shadow
Incentive Plan and £0.3m (2007: £0.1m) in respect of the Shadow Performance Share Plan. There are no liabilities in the balance sheet in respect of
the Fenner PLC 1996 Executive Share Option Scheme, the Long Term Share Incentive Plan or the Performance Share Plan.
27. ProvisionsMovements in provisions are as follows:
At start of year
New provisions charged to income statement during the year
Provisions not required credited to income statement during the year
Provisions utilised during the year
Acquisition of businesses
Unwinding of discount
Exchange differences
At end of year
Provisions are analysed as follows:
Current
Non-current
Provisions represent the best estimate of obligations at the balance sheet date. The majority of the property and environmental provision relates to
onerous leases. Where the effect of the time value of money is material, pre-tax discount rates between 3.2% and 4.5%, which reflects the risks
associated with future cash flows, have been used. All provisions are expected to be utilised within 10 years.
28. Share capital
At start of prior year
Shares authorised/issued in the year
At start of year
Shares authorised/issued in the year
At end of year
During the year, 234,741 ordinary shares of 25p were issued to the trustees of the Fenner PLC 1992 Employee Share Ownership Plan Trust under
the Fenner Long Term Share Incentive Plan for a total consideration of £0.2m and 137,335 ordinary shares of 25p were issued under the Fenner
PLC 1996 Executive Share Option Scheme for a total consideration of £0.2m.
On 14 March 2008, the Group announced the placing of 15,657,910 new ordinary shares of 25p with institutional investors at 233p per share for a
consideration of £36.5m less costs of £1.1m.
On 7 April 2008, 217,000 ordinary shares of 25p were issued in connection with the acquisition of King Energy Services, Inc, representing a
consideration of £0.5m.
The Company has one class of ordinary shares which carry no right to fixed income.
6.9
0.9
(0.1)
(1.0)
8.1
0.3
0.9
16.0
-
-
-
-
8.1
0.1
0.7
8.9
Total£m
Contingent and deferredconsideration
on acquisitions£m
5.4
0.1
-
(0.7)
-
0.2
-
5.0
Property and environmental
£m
1.5
0.8
(0.1)
(0.3)
-
-
0.2
2.1
Restructuringcosts
£m
39.2
0.4
39.6
4.1
43.7
156,970,325
1,552,718
158,523,043
16,246,986
174,770,029
£mNumber
55.0
-
55.0
-
55.0
£m
220,000,000
-
220,000,000
-
220,000,000
Number
AuthorisedAllotted, called up
and fully paid
7 0 F e n n e r P L C
4.911.1
16.0
0.66.3
6.9
2007£m
2008£m

F e n n e r P L C 7 1
29. Equity
At start of prior year
Total recognised income and expense for the year
Equity dividends paid
Dividends paid to minority shareholders
Shares issued in the year
Share-based payments
At start of year
Total recognised income and expense for the year
Equity dividends paid
Dividends paid to minority shareholders
Shares issued in the year
Share-based payments
At end of year
Included within retained earnings is a reserve for the Company’s own shares held by the Employee Share Ownership Plan Trust (ESOP) of £0.1m
(2007: £0.1m). The shares held by the ESOP may subsequently be awarded to employees under the Group’s share incentives schemes. At
31 August 2008, the ESOP held 97,189 (2007: 131,859) of the Company’s shares.
The exchange reserve comprises foreign exchange differences arising from the translation of the financial statements of foreign operations.
The hedging reserve comprises gains and losses on changes in the valuation of assets and liabilities designated as hedges.
The other reserve relates to merger relief on the issue of shares in connection with the acquisition of Wellington Holdings plc on 20 May 2005.
Distributable reserves relate to amounts in the retained earnings reserve to the extent that profits are realised.
30. Contingent liabilities In the normal course of business the Group has given guarantees and counter indemnities in respect of commercial transactions.
The Group is involved as defendant in a number of potential and actual litigation cases in connection with its business, primarily in North America.
The directors believe that the likelihood of a material liability arising from these cases is remote.
In October 2004, the conveyor belting operations in Charlotte and Atlanta, USA received notification from the Anti Trust Division of the US
Department of Justice of their intention to enquire into possible anti trust violations by Fenner. Every co-operation has been given to date and will be
given as and when required in order to help expedite the process.
31. Operating lease commitmentsOutstanding commitments for future minimum lease payments under non-cancellable operating leases fall due as follows:
Within one year
In the second to fifth years inclusive
After five years
Operating lease charges recognised in the income statement are shown in note 5.
1.41.5
-
2.9
1.82.2
-
4.0
2007£m
2008£m
2.08.1
26.5
36.6
3.110.127.6
40.8
2007£m
2008£m
OtherLand and Buildings
122.0
29.2
(9.5)
(0.1)
0.7
0.4
142.7
36.8
(9.9)
(0.1)
36.1
0.3
205.9
0.7
0.2
-
(0.1)
-
-
0.8
0.3
-
(0.1)
-
-
1.0
Totalequity
£m
Minorityinterests
£m
1.1
-
-
-
-
-
1.1
-
-
-
-
-
1.1
Otherreserve
£m
-
0.4
-
-
-
-
0.4
(2.2)
-
-
-
-
(1.8)
Hedgingreserve
£m
(2.1)
(2.8)
-
-
-
-
(4.9)
18.9
-
-
-
-
14.0
Exchangereserve
£m
33.5
31.4
(9.5)
-
(1.8)
0.4
54.0
19.8
(9.9)
-
(0.2)
0.3
64.0
Retainedearnings
£m
49.6
-
-
-
2.1
-
51.7
-
-
-
32.2
-
83.9
Sharepremium
£m
39.2
-
-
-
0.4
-
39.6
-
-
-
4.1
-
43.7
Sharecapital
£m

Notes to the Group financial statements continued
32. Related party transactionsRelated parties to the Group comprise key management personnel and joint ventures, prior to the disposal of the Group's entire interest in joint
ventures in 2007.
Key management personnel Key management personnel comprise the Group’s executive and non-executive directors. Remuneration of executive and non-executive directors is
detailed in the Board Remuneration Report on pages 27 to 33. There were no other transactions with key management personnel.
Joint venturesThere were no material transactions with joint ventures during the year (2007: £nil) and there were no amounts due to or from joint ventures at
31 August 2008 (2007: £nil).
33. AcquisitionsThe Group completed the following acquisitions during the year:
Date Details
9 November 2007 Substantially all of the operating assets and liabilities of B-LOC for an initial cash consideration of £4.4m.
14 December 2007 Substantially all of the operating assets and liabilities of Spliceline for an initial cash consideration of £0.7m.
5 February 2008 The entire share capital of Prodesco, Inc and its subsidiary, Secant Medical, LLC, for an initial cash consideration of
£24.2m.
3 March 2008 Substantially all of the operating assets and liabilities of Winfield Industries, Inc for an initial cash consideration of £6.9m.
6 March 2008 The entire share capital of Northern Belting Specialists Pty Ltd for an initial cash consideration of £2.3m.
1 April 2008 Substantially all of the operating assets and liabilities of King Energy Services, Inc for an initial consideration of £2.9m.
This comprised cash of £2.4m and £0.5m satisfied by the issue of 217,000 ordinary shares of Fenner PLC, based on the
market price of Fenner PLC shares at the date of issue.
1 August 2008 Substantially all of the operating assets and liabilities of King Energy Services of Colorado, Inc for an initial cash
consideration of £3.5m.
From the respective dates of acquisition, these businesses contributed £18.5m to Group revenue and £2.4m to Group operating profit, after
deducting amortisation of intangible assets acquired and exceptional items of £1.7m.
If the acquisitions had occurred on 1 September 2007, it is estimated that Group revenue would have been £454.4m and Group operating profit
would have been £46.4m, after deducting amortisation of intangible assets acquired and exceptional items of £6.6m. These amounts have been
calculated by adjusting the results of the acquired businesses to reflect the effect of the Group’s accounting policies as if they had been in effect
from 1 September 2007.
7 2 F e n n e r P L C

F e n n e r P L C 7 3
Details of the aggregate assets and liabilities acquired are given below.
Intangible assets
Property, plant and equipment
Inventories
Cash and cash equivalents
Trade and other receivables
Trade and other payables
Current taxation
Deferred taxation
Total net assets acquired
Intangible assets acquired
Goodwill on acquisition
Total consideration
Contingent and deferred consideration
Share capital issued
Cash consideration paid
Cash and cash equivalents acquired
Cash paid per cash flow statement
The information above has been presented in aggregate because the individual acquisitions are not material.
Cash paid per the cash flow statement includes acquisition expenses of £1.7m.
The fair value adjustments for accounting policy alignment reflect the provisional restatement of assets and liabilities in accordance with the Group’s
accounting policies.
Goodwill arising on acquisition principally represents the speed to market, workforce and anticipated synergies gained through the acquisitions.
34. DisposalsOn 11 July 2008, the Group disposed of substantially all of the operating assets and liabilities of its lightweight PVC conveyor belting operation held
within Fenner Dunlop (Charlotte), Inc.
Details of the assets and liabilities disposed of are given below.
Property, plant and equipment
Inventories
Total net assets disposed
Consideration received
Disposal costs
Profit on disposal per income statement
Cash received per the cash flow statement comprises consideration received of £5.0m less £0.2m of disposal costs.
(1.7)
(2.4)
(4.1)
5.0
(0.2)
0.7
£m
-3.63.80.25.0
(2.1)(0.1)0.2
10.630.413.7
54.7(8.1)(0.5)
46.1(0.2)
45.9
Provisionalfair value
£m
-------
0.2
0.2
Otheritems
£m
(1.6)(0.2)(0.5)
--
(0.1)--
(2.4)
Accountingpolicy
alignment£m
1.63.84.30.25.0
(2.0)(0.1)
-
12.8
Bookvalue
£m

35. Principal subsidiary undertakingsThe principal subsidiary undertakings at 31 August 2008 were as follows:
Company
J H Fenner & Co Limited
Fenner International Limited
James Dawson & Son Limited
Hallite Seals International Limited
Hallite (France) Limited
FAST Group Houston, Inc (formerly known as CDI Seals, Inc)
Hallite Seals Americas, Inc
Fenner, Inc
Prodesco, Inc
Secant Medical, LLC
Fenner Precision, Inc
Fenner Dunlop Conveyor Systems and Services, Inc
Fenner Dunlop (Atlanta), Inc
Fenner Dunlop (Port Clinton), Inc
Fenner Dunlop (Toledo), LLC
Fenner Dunlop (Bracebridge), Inc
Hallite Seals (Canada) Limited
Enerka Apex Belting Pty Limited
Fenner (Australia) Pty Limited
rEscan International Pty Limited
Hallite Seals Australia Pty Limited
Northern Belting Specialists Pty Ltd
Fenner Conveyor Belting (South Africa) (Pty) Limited
Shanghai Fenner Conveyor Belting Co. Limited
Dawson Polymer Products (Shanghai) Co. Limited
Fenner Sealing Technologies (Shanghai) Co. Limited
Dunlop Conveyor Belting (Shanghai) Co. Limited
Fenner Dunlop BV
Fenner Conveyor Belting Private Limited
Dichtelemente Hallite GmbH
Hallite Italia Srl
*Held directly by Fenner PLC
The above undertakings are engaged in manufacturing and distribution with the exception of Fenner International Limited which is an investment company.
All subsidiary undertakings are consolidated within the Group financial statements.
A full list of Group companies is filed with the annual return to the Registrar of Companies.
36. Interest in joint venturesThe Group held a 50% interest in the ordinary shares of KSB Pumps (SA) (Pty) Limited, incorporated in South Africa, until the entire interest was sold
on 2 January 2007. The interest was recognised in the Group financial statements using the proportionate consolidation method.
Amounts included in the Group’s consolidated income statement are as follows:
Revenue
Cost of sales
Distribution costs
Administrative expenses
Taxation
Profit for the year
2.9(1.7)(0.5)(0.3)(0.1)
0.3
-----
-
2007£m
2008£m
Notes to the Group financial statements continued
*100
*100
*100
*100
100
100
100
100
100
100
100
100
100
100
100
100
100
100
100
100
100
100
75
85
100
100
100
100
100
100
100
United Kingdom
United Kingdom
United Kingdom
United Kingdom
United Kingdom
USA
USA
USA
USA
USA
USA
USA
USA
USA
USA
Canada
Canada
Australia
Australia
Australia
Australia
Australia
South Africa
China
China
China
China
Netherlands
India
Germany
Italy
Proportion of issuedordinary shares held
Country ofincorporation
7 4 F e n n e r P L C

F e n n e r P L C 7 5
37. Post balance sheet eventsOn 1 October 2008, the Group completed the acquisition of substantially all of the operating assets and liabilities of the Conveyor Services
Corporation group of companies, including Classic Conveyor Components Corporation and Loadout Services, together with a majority interest in the
share capital of Conveyor Services, SA, registered in Chile. The initial cash consideration was £25.8m with subsequent contingent and deferred
consideration estimated at £20.8m, before any adjustments relating to working capital. On 31 October 2008, the Group completed the acquisition of
the entire share capital of Solid Systems Engineering, LLC. The initial cash consideration was £5.2m with subsequent contingent deferred
consideration estimated at £1.2m, before any adjustments relating to working capital.
The book value of assets and liabilities acquired are subject to the working capital adjustments, which are currently being evaluated. Consequently,
the book values acquired are not currently available. The identification of the accounting policy alignment adjustments and the valuation of intangible
assets acquired are also currently being undertaken.

Independent Auditors' Report to the members of Fenner PLC
We have audited the parent company financial statements of Fenner PLC for the year ended 31 August 2008 which comprise the Company balance
sheet and the related notes. These parent company financial statements have been prepared under the accounting policies set out therein. We
have also audited the information in the Board Remuneration Report that is described as having been audited.
We have reported separately on the Group financial statements of Fenner PLC for the year ended 31 August 2008.
Respective responsibilities of directors and auditorsThe directors’ responsibilities for preparing the Annual Report, the Board Remuneration Report and the parent company financial statements in
accordance with applicable law and United Kingdom Accounting Standards (United Kingdom Generally Accepted Accounting Practice) are set out
in the Corporate Governance statement on page 21.
Our responsibility is to audit the parent company financial statements and the part of the Board Remuneration Report to be audited in accordance
with relevant legal and regulatory requirements and International Standards on Auditing (UK and Ireland). This Report, including the opinion, has
been prepared for and only for the Company’s members as a body in accordance with Section 235 of the Companies Act 1985 and for no other
purpose. We do not, in giving this opinion, accept or assume responsibility for any other purpose or to any other person to whom this report is
shown or into whose hands it may come save where expressly agreed by our prior consent in writing.
We report to you our opinion as to whether the parent company financial statements give a true and fair view and whether the parent company
financial statements and the part of the Board Remuneration Report to be audited have been properly prepared in accordance with the Companies
Act 1985. We report to you whether, in our opinion, the information given in the Directors’ Report is consistent with the parent company financial
statements.
In addition, we report to you if, in our opinion, the Company has not kept proper accounting records, if we have not received all the information and
explanations we require for our audit, or if information specified by law regarding directors’ remuneration and other transactions is not disclosed.
We read other information contained in the Annual Report and consider whether it is consistent with the audited parent company financial
statements. The other information comprises only the Directors’ Report, the Financial Highlights, the Chairman’s Statement, the Business Review, the
Corporate Governance statement, the Corporate Responsibility Report and the unaudited part of the Board Remuneration Report. We consider the
implications for our report if we become aware of any apparent misstatements or material inconsistencies with the parent company financial
statements. Our responsibilities do not extend to any other information.
Basis of audit opinionWe conducted our audit in accordance with International Standards on Auditing (UK and Ireland) issued by the Auditing Practices Board. An audit
includes examination, on a test basis, of evidence relevant to the amounts and disclosures in the parent company financial statements and the part
of the Board Remuneration Report to be audited. It also includes an assessment of the significant estimates and judgments made by the directors
in the preparation of the parent company financial statements, and of whether the accounting policies are appropriate to the Company’s
circumstances, consistently applied and adequately disclosed.
We planned and performed our audit so as to obtain all the information and explanations which we considered necessary in order to provide us
with sufficient evidence to give reasonable assurance that the parent company financial statements and the part of the Board Remuneration Report
to be audited are free from material misstatement, whether caused by fraud or other irregularity or error. In forming our opinion we also evaluated
the overall adequacy of the presentation of information in the parent company financial statements and the part of the Board Remuneration Report
to be audited.
OpinionIn our opinion:
- the parent company financial statements give a true and fair view, in accordance with United Kingdom Generally Accepted Accounting
Practice, of the state of the Company’s affairs as at 31 August 2008;
- the parent company financial statements and the part of the Board Remuneration Report to be audited have been properly prepared in
accordance with the Companies Act 1985; and
- the information given in the Directors’ Report is consistent with the parent company financial statements.
PricewaterhouseCoopers LLP
Chartered Accountants and Registered Auditors, Hull
12 November 2008
7 6 F e n n e r P L C

F e n n e r P L C 7 7
Company balance sheetat 31 August 2008
Fixed assetsTangible fixed assets
Investments
Current assetsDebtors
Cash at bank and in hand
Creditors: amounts falling due within one year
Net current assets
Total assets less current liabilitiesProvisions for liabilities
Net assets
Capital and reservesCalled up share capital
Share premium
Revaluation reserve
Other reserve
Profit and loss account
Shareholders' funds
The financial statements were approved by the Board of Directors on 12 November 2008 and signed on its behalf by:
C I Cooke R J Perry
Chairman Group Finance Director
3.977.1
81.0
77.612.6
90.2(20.5)
69.7
150.7(0.4)
150.3
39.651.7
1.411.546.1
150.3
4
5
6
7
8
9
10
10
10
10
11
3.977.1
81.0
105.013.2
118.2(13.9)
104.3
185.3(0.3)
185.0
43.783.9
1.411.544.5
185.0
2007£m
2008£mNotes

Notes to the Company financial statements
1. Significant accounting policies
Basis of preparationThe Company financial statements have been prepared in accordance with applicable accounting standards in the United Kingdom and under the
historical cost convention, as modified by the revaluation of certain fixed assets.
In accordance with the exemptions allowed by Section 230 of the Companies Act 1985, the Company has not presented its own profit and loss
account.
In accordance with the exemptions allowed by FRS 1 ‘Cash Flow Statements’, the Company has not presented a cash flow statement.
The Company has taken advantage of the exemptions in FRS8 ‘Related Party Transactions’ not to disclose related party transactions with other
members of the Fenner PLC Group.
The principal accounting policies adopted for the year ended 31 August 2008, which have been consistently applied, are set out below.
Foreign currenciesTransactions in foreign currencies are recorded at the rates of exchange prevailing on the dates of the transactions. At each balance sheet date,
monetary assets and liabilities are retranslated at the rates prevailing on the balance sheet date. Non-monetary items measured at historical cost
are not retranslated. Exchange differences arising on the settlement and retranslation of monetary items are recognised in the profit and loss
account in the period.
Share-based paymentsThe Company operates equity-settled share schemes for certain employees across the Fenner PLC Group. The cost of share-based payments is
measured at fair value at the date of grant, excluding the effect of non market-based vesting conditions. The cost is recognised in the profit and
loss account on a straight-line basis over the vesting period with the corresponding amount credited to equity, based on an estimate of the number
of shares that will eventually vest. The fair values are measured using the Binomial option-pricing model and the Monte Carlo simulation approach.
TaxationTaxation expense represents the sum of the current tax payable and deferred tax.
Current tax is the tax expected to be payable on taxable profit for the period using tax rates that have been enacted or substantively enacted by the
balance sheet date, together with any adjustments in respect of previous years. Taxable profit differs from profit as reported in the profit and loss
account because it excludes items of income or expense that are not taxable or deductible or are taxable or deductible in other years.
Deferred tax is recognised in respect of all timing differences that have originated but not reversed at the balance sheet date. It is determined using
the average tax rates that are expected to apply in the periods in which the timing differences are expected to reverse. Timing differences are
differences between taxable profits and results as stated in the financial statements that arise from the inclusion of gains and losses in tax
assessments in periods different from those in which they are recognised in the financial statements. Deferred tax assets are recognised only when
it can be regarded as more likely than not that there will be suitable taxable profits from which the future reversal of the underlying timing differences
can be deducted. Deferred tax is not recognised when fixed assets are revalued unless by the balance sheet date there is a binding agreement to
sell the revalued asset. Deferred tax is measured on a non-discounted basis.
DividendsDividends proposed by the Board are recognised in the financial statements when they have been approved by shareholders at the Annual General
Meeting. Interim dividends are recognised when they are paid.
7 8 F e n n e r P L C

F e n n e r P L C 7 9
Tangible fixed assetsTangible fixed assets are stated at cost or valuation less accumulated depreciation and any accumulated impairment losses. In prior years certain
freehold and leasehold properties have been revalued by independent qualified professional valuers on the basis of open market value for their
existing use. As permitted by FRS 15 ‘Tangible Fixed Assets’ these valuations have been frozen.
Freehold land is not depreciated. Depreciation on other assets is recognised in the profit and loss account on a straight-line basis over the
estimated useful life of the asset. Estimated useful lives most widely applied are as follows:
Freehold buildings 40 years
Leasehold buildings Unexpired term of lease
Plant, machinery and equipment 3-10 years
InvestmentsInvestments are stated at cost or valuation less accumulated impairment losses.
ProvisionsProvisions are recognised when the Company has a present obligation as a result of a past event, and it is probable that the Company will be
required to settle that obligation. Provisions are measured at the directors’ best estimate of the expenditure required to settle the obligation at the
balance sheet date, and are discounted to present value where the effect is material.
2. Auditors’ remunerationThere was no auditors' remuneration in the year (2007: £nil) as their costs have been borne by other Group undertakings.
3. EmployeesThe average number of employees during the year is 3 (2007: 3). This comprises the Chairman and non-executive directors. Details of employee
costs are included in the Board Remuneration Report on pages 27 to 33.
4. Tangible fixed assets
Cost or valuation:At start of year
Additions
At end of year
Accumulated depreciation:At start of year
Charge for the year
At end of year
Net book value:At end of year
At start of year
Cost or valuation comprises:Cost
Valuation:
- 1997
- 1998
- 1999
The historical cost of tangible fixed assets is £4.4m (2007: £4.4m) with accumulated depreciation of £1.9m (2007: £1.9m).
Freehold land and buildings includes land at a cost or valuation of £1.7m (2007: £1.7m) which is not subject to depreciation.
5.0
0.1
5.1
1.1
0.1
1.2
3.9
3.9
1.0
0.4
1.2
2.5
5.1
Freeholdproperty
£m

5. Investments
Cost:At start of year and at end of year
Accumulated impairment losses:At start of year and at end of year
Net book value:At start of year and at end of year
The carrying value of investments is reviewed annually. Forecast cash flows are discounted using the Group’s pre-tax weighted average cost of
capital of 10.4%. Cash flows are projected for one year using appropriate annual growth rates.
Details of the principal subsidiary undertakings can be found in note 35 of the Notes to the Group financial statements.
6. Debtors
Amounts due from Group undertakings
Other debtors
7. Creditors: amounts falling due within one year
Amounts due to Group undertakings
Current taxation
Group relief
Accruals and deferred income
8. Provisions for liabilities
At start of year
Credited to profit and loss account
At end of year
Deferred tax liabilities are all in respect of accelerated tax depreciation.
192.7
115.6
77.1
Subsidiaryundertakings
£m
77.30.3
77.6
104.70.3
105.0
2007£m
2008£m
19.00.31.10.1
20.5
12.00.70.80.4
13.9
2007£m
2008£m
0.4
(0.1)
0.3
Deferred taxation
£m
8 0 F e n n e r P L C
Notes to the Company financial statements continued

F e n n e r P L C 8 1
9. Share capital
At start of year
Shares authorised/issued in the year
At end of year
During the year, 234,741 ordinary shares of 25p were issued to the trustees of the Fenner PLC 1992 Employee Share Ownership Plan Trust under
the Fenner Long Term Share Incentive Plan for a total consideration of £0.2m and 137,335 ordinary shares of 25p were issued under the Fenner
PLC 1996 Executive Share Option Scheme for a total consideration of £0.2m.
On 14 March 2008, the Group announced the placing of 15,657,910 new ordinary shares of 25p with institutional investors at 233p per share for a
consideration of £36.5m less costs of £1.1m.
On 7 April 2008, 217,000 ordinary shares of 25p were issued in connection with the Group's acquisition of King Energy Services, Inc, representing a
consideration of £0.5m.
The Company has one class of ordinary shares which carry no right to fixed income.
10. Reserves
At start of year
Profit for the year
Equity dividends paid
Shares issued in the year
Share-based payments
At end of year
Included within retained earnings is a reserve for the Company’s own shares held by the Employee Share Ownership Plan Trust (ESOP) of £0.1m
(2007: £0.1m). The shares held by the ESOP may subsequently be awarded to employees under the Group’s share incentives schemes. At
31 August 2008, the ESOP held 97,189 (2007: 131,859) of the Company’s shares.
11. Reconciliation of movement in shareholders’ funds
Profit for the year attributable to equity shareholders
Equity dividends paid
Shares issued in the year
Share-based payments
Movement in shareholders’ funds in the yearShareholders’ funds at start of year
Shareholders’ funds at end of year
12. Contingent liabilitiesThe Company has guaranteed the borrowings of certain subsidiary undertakings. At 31 August 2008, these borrowings amounted to £140.1m
(2007: £102.0m).
13. Share-based payments The Company operates three equity-settled share-based payment schemes across the Fenner PLC Group. The recognition and measurement
principles of FRS 20 ‘Share-based Payment’ have not been applied to equity instruments that were granted on or prior to 7 November 2002 that had
not vested by 1 January 2005, in accordance with the transitional provisions of that standard.
Details of the Company’s share-based payments can be found in note 26 of the Notes to the Group financial statements.
39.6
4.1
43.7
£m
158,523,043
16,246,986
174,770,029
Number
55.0
-
55.0
£m
220,000,000
-
220,000,000
Number
46.1
8.2
(9.9)
(0.2)
0.3
44.5
Profit andloss account
£m
11.5
-
-
-
-
11.5
Other reserve
£m
1.4
-
-
-
-
1.4
Revaluationreserve
£m
51.7
-
-
32.2
-
83.9
Sharepremium
£m
AuthorisedAllotted, called up
and fully paid
8.1(9.5)2.30.4
1.3149.0
150.3
8.2(9.9)36.1
0.3
34.7150.3
185.0
2007£m
2008£m

8 2 F e n n e r P L C
Five year summary of the Group
Revenue
Operating profit before amortisation of intangible assets
acquired and exceptional items
Amortisation of intangible assets acquired
Exceptional items
Operating profit
Net finance costs
Share of result of associate
Profit on disposal or termination of operations
Profit before taxation
Taxation
Profit for the year
Earnings per share:
Adjusted – before amortisation of intangible assets
acquired and exceptional items
Basic
Equity dividends
Dividends per ordinary share*
Capital expenditure
Total equity
Net Debt
Gearing
Average number of employees (number)
*Dividends per ordinary share are stated in respect of the period to which the dividends relate. Under IFRS this is not the same as the period in
which the dividends are recognised in the financial statements.
Where applicable, 2004 has been restated following the adoption of UITF Abstract 28 ‘Accounting for ESOP Trusts’ and the discounted share
placement in 2004 and the placing and open offer in 2005.
260.6
16.1
(1.2)
(6.2)
8.7
(3.4)
0.4
0.7
6.4
(3.1)
3.3
7.7p
2.2p
6.3
5.825p
7.9
64.5
(39.4)
61.1%
2,662
2004£m
303.6
17.3
(1.0)
-
16.3
(3.8)
(0.1)
-
12.4
(4.0)
8.4
7.1p
6.6p
6.3
5.825p
8.1
107.5
(34.5)
32.1%
2,798
2005£m
379.0
34.1
(0.4)
-
33.7
(4.3)
(0.1)
-
29.3
(8.7)
20.6
13.1p
13.0p
8.2
6.0p
18.9
122.0
(33.1)
27.1%
3,473
2006£m
380.8
39.0(0.6)(0.2)
38.2(4.6)
--
33.6(9.7)
23.9
15.1p15.0p
9.56.225p
32.0
142.7
(36.3)
25.4%
3,663
2007£m
437.8
49.3(2.1)(3.4)
43.8(7.5)
--
36.3(10.4)
25.9
17.5p15.5p
9.96.6p
63.7
205.9
(97.6)
47.4%
3,924
2008£m
IFRSUK GAAP in IFRS format
F e n n e r P L C 8 3
Fenner, Fenner Drives, Hallite, BTL, Fenaplast and Powertwist are Registered Trademarks of the Fenner Group.
CDI, T-Max and SigmaSeal are trademarks of the Fenner Group.
KSB is a Registered Trademark of the KSB Group.
The McCloskey graph is reproduced with the permission of The McCloskey Group Limited.
Annual General Meeting
The 72nd Annual General Meeting of the Company will be held at Marlborough Room, Oxford & Cambridge Club, Pall Mall, London
SW1Y 5HD, on 14 January 2009 at 10.30 am when the following business will be proposed:
Ordinary Business
1 To receive the Directors’ Report and financial statements of the Group for the financial year ended 31 August 2008 together with the
Independent Auditors’ Report.
2 To approve the Board Remuneration Report contained in the Annual Report for 2008.
3 To declare a dividend.
4 To re-elect director.
5 To re-elect director.
6 To re-elect director.
7 To re-appoint the auditors.
8 To authorise the directors to determine the auditors’ remuneration.
Special Business
9 To authorise the directors to allot shares.
10 To empower the directors to allot shares for cash.
11 To authorise the Company to buy back its own shares.
12 To adopt new set of Articles of Association.
Note
This is a summary of the Notice of Meeting and shareholders should refer to the accompanying document which contains the full text of
the Notice of Meeting together with an explanatory letter from the Chairman of the Company.
Advisors
Registrars
Capita Registrars, Huddersfield
Principal Solicitors
Nabarro, London
Rollits, Hull
Shumaker, Loop & Kendrick, Toledo, USA
Independent Auditors
PricewaterhouseCoopers LLP, Hull
Brokers
RBS Hoare Govett, London
Principal Bankers
Barclays Bank PLC, Leeds
Lloyds TSB Bank plc, Leeds
Bank of Scotland plc, Manchester
Wachovia Bank NA, Charlotte, USA
National Australia Bank Limited, Melbourne, Australia
Investment Bankers
N.M. Rothschild & Sons Limited, Leeds
Financial Calendar
Annual General Meeting – 14 January 2009
Half Year End – 28 February 2009
Interim Results – April 2009
Year End – 31 August 2009
Preliminary Results – November 2009


Registered office:Hesslewood CountryOffice Park, Hessle,East Yorkshire, HU13 0PW,United KingdomTel: +44 (0)1482 626500Fax: +44 (0)1482 626512Registered Number:329377Website: www.fenner.com
USA
ATLANTATel: (1) 404 294 5272Fax: (1) 404 296 5165www.fennerdunlopamericas.com
PORT CLINTONTel: (1) 419 635 2191Fax: (1) 419 635 2552www.fennerdunlopamericas.com
TOLEDOTel: (1) 419 534 5300Fax: (1) 419 531 6284www.fennerdunlopamericas.com
MANHEIMTel: (1) 717 665 2421Fax: (1) 717 665 2649www.fennerdrives.com
Tel: (1) 800 327 2288Fax: (1) 717 664 8287www.fennerprecision.com
BUFFALOTel: (1) 716 833 6900Fax: (1) 716 833 9405www.fennerprecision.com
PERKASIETel: (1) 215 257 6566Fax: (1) 215 453 1584www.prodesco.com
Tel: (1) 215 257 8680Fax: (1) 215 257 8875www.secantmedical.com
DETROITTel: (1) 248 362 0170Fax: (1) 248 362 4246www.hallite.com
HOUSTON - CDITel: (1) 281 446 6662Fax: (1) 281 446 7034www.fast-houston.com
HOUSTON - EGCTel: (1) 281 774 6100Fax: (1) 281 774 6219 www.fast-houston.com
CANADA
BRACEBRIDGETel: (1) 705 645 4431Fax: (1) 705 645 3112www.scandura.net
TORONTOTel: (1) 416 675 2505Fax: (1) 416 675 4341www.hallite.com
BRAZIL
SAO PAULOTel: (55) 19 3523 1859Fax: (55) 19 3532 4805www.halliteseals.com.br
CHILE
ANTOFAGASTATel: (56) 55 236439Fax: (56) 55 297792www.fennerdunlopamericas.com
UNITED KINGDOM
HULLTel: (44) 1482 781234Fax: (44) 1482 785438www.fennerdunlopeurope.com
LINCOLNTel: (44) 1522 781800Fax: (44) 1522 510029www.james-dawson.com
Tel: (44) 1522 781800Fax: (44) 1522 510029www.fennerprecision.com
LEEDSTel: (44) 113 249 3486Fax: (44) 113 248 9656www.fennerdrives.com
HAMPTONTel: (44) 20 8941 2244Fax: (44) 20 8783 1669www.hallite.com
NETHERLANDS
DRACHTENTel: (31) 512 585 555Fax: (31) 512 585 511www.dunlopconveyorbelting.com
GERMANY
HAMBURGTel: (49) 40 73 47 480Fax: (49) 40 73 47 48 49www.hallite.com
FRANCE
PARISTel: (33) 1 3055 3903Fax: (33) 1 3054 6274www.dunlopconveyorbelting.com
Tel: (33) 1 4377 8550Fax: (33) 1 4377 9393www.hallite.com
SPAIN
BARCELONATel: (34) 9 3805 5446Fax: (34) 9 3805 4269www.dunlopconveyorbelting.com
POLAND
KATOWICETel: (48) 32 731 59 00Fax: (48) 32 731 5901www.fennerdunlopeurope.com
ITALY
LIVORNOTel: (39) 0586 428287Fax: (39) 0586 429845www.hallite.com
RUSSIA
MOSCOWTel: (7) 495 223 6718Fax: (7) 495 223 6719www.dunlopconveyorbelting.com
AUSTRALIA
MELBOURNETel: (61) 3 9680 4500Fax: (61) 3 9689 9191www.fennerdunlop.com.au
SYDNEYTel: (61) 2 9620 7300Fax: (61) 2 9620 7400www.hallite.com
CHINA
SHANGHAITel: (86) 21 599 369 89Fax: (86) 21 599 367 34www.fennerdunlop.com/shanghai
Tel: (86) 21 599 369 89Fax: (86) 21 599 367 34www.james-dawson.com
Tel: (86) 21 599 389 69Fax: (86) 21 599 367 34www.hallite.com
INDIA
MADURAITel: (91) 452 2464201Fax: (91) 452 2464204www.fennerdunlopindia.com
SOUTH AFRICA
JOHANNESBURGTel: (27) 11 974 1902Fax: (27) 11 974 1900www.fenner.co.za