Groundwater pollution risk mapping using modified DRASTIC ...
8
84 1. Introduction Management of water resources is a critical issue in arid countries like Saudi Arabia. Factors like limited rainfall, high evaporation and lack of surface water have adverse effect on groundwater resources. With time, groundwater resources get minimal replen- ishment and restricted into limited geological time and space. Due to increasing pace of urbanization and agricultural expansions, groundwater resources are being over-exploited resulting to an unsustainable declining trend. These factors can cause severe deg- radation to the quality and quantity of groundwater resources [1, 2]. Studies conducted in different parts of the Saq and overlying aquifers suggested that groundwater resources are quantitavely over-exploited [3, 4] and facing quality deterioration through in- creased human interaction and rock water interaction [5-8]. For sustainable solutions, groundwater resources need to be protected from over-exploitation and quality deterioration. This in turn would require detailed information of hydrogeological behavior of aquifer under consideration; which would come after assessment of various component of recharge, nature of vadose zone, aquifer parameters. The collective impact of these components would define an area in terms of its susceptibility to contamination from surface. The combined effect of selected hydrogeological parameters helps in determining pollution attenuation capacity of an area. The spatial variation of parameters further helps in determining relative sus- ceptibility in a way that the area either susceptible or relatively safer from pollution depending upon actual behavior of the parameters. The relationship of each parameter and pollution can be estimated through relative rating criteria. Many studies eval- uated the potential of a hydrogeological environment to pollution contamination using different models including DRASTIC [9], SEEPAGE [10], GOD [11], EPIK [12], and AVI [13]. These methods integrate various hydrological and hydrogeological parameters classified by unique ratings and weights. DRASTIC technique was developed by the US Environmental Protection Agency (EPA) as a technique for assessing groundwater pollution potential. The product of variable rating classes and constant weight assigned to each parameter generates weighted Environ. Eng. Res. 2018; 23(1): 84-91 pISSN 1226-1025 https://doi.org/10.4491/eer.2017.072 eISSN 2005-968X Groundwater pollution risk mapping using modified DRASTIC model in parts of Hail region of Saudi Arabia Izrar Ahmed 1 , Yousef Nazzal 2† , Faisal Zaidi 3 1 Environment Department, Dubai Municipality, Dubai, UAE 2 College of Natural & Health Sciences, Zayed University, P.O.Box 144534, Abu Dhabi, UAE 3 Department of Geology & Geophysics, King Saud University, Riyadh, Saudi Arabia ABSTRACT The present study deals with the management of groundwater resources of an important agriculture track of north-western part of Saudi Arabia. Due to strategic importance of the area efforts have been made to estimate aquifer proneness to attenuate contamination. This includes determining hydrodynamic behavior of the groundwater system. The important parameters of any vulnerability model are geological formations in the region, depth to water levels, soil, rainfall, topography, vadose zone, the drainage network and hydraulic conductivity, land use, hydrochemical data, water discharge, etc. All these parameters have greater control and helps determining response of groundwater system to a possible contaminant threat. A widely used DRASTIC model helps integrate these data layers to estimate vulnerability indices using GIS environment. DRASTIC parameters were assigned appropriate ratings depending upon existing data range and a constant weight factor. Further, land-use pattern map of study area was integrated with vulnerability map to produce pollution risk map. A comparison of DRASTIC model was done with GOD and AVI vulnerability models. Model validation was done with NO3, SO4 and Cl concentrations. These maps help to assess the zones of potential risk of contamination to the groundwater resources. Keywords: Al Hail, DRASTIC aquifer vulnerability, Groundwater resources, Landuse pattern, Risk map, Saudi Arabia This is an Open Access article distributed under the terms of the Creative Commons Attribution Non-Commercial License (http://creativecommons.org/licenses/by-nc/3.0/) which per- mits unrestricted non-commercial use, distribution, and reproduction in any medium, provided the original work is properly cited. Copyright © 2018 Korean Society of Environmental Engineers Received June 11, 2017 Accepted October 8, 2017 † Corresponding author Email: [email protected] Tel: +971-509620945
Transcript of Groundwater pollution risk mapping using modified DRASTIC ...

84
1. Introduction
Management of water resources is a critical issue in arid countries like Saudi Arabia. Factors like limited rainfall, high evaporation and lack of surface water have adverse effect on groundwater resources. With time, groundwater resources get minimal replen-ishment and restricted into limited geological time and space. Due to increasing pace of urbanization and agricultural expansions, groundwater resources are being over-exploited resulting to an unsustainable declining trend. These factors can cause severe deg-radation to the quality and quantity of groundwater resources [1, 2]. Studies conducted in different parts of the Saq and overlying aquifers suggested that groundwater resources are quantitavely over-exploited [3, 4] and facing quality deterioration through in-creased human interaction and rock water interaction [5-8]. For sustainable solutions, groundwater resources need to be protected from over-exploitation and quality deterioration. This in turn would require detailed information of hydrogeological behavior of aquifer under consideration; which would come after assessment of various
component of recharge, nature of vadose zone, aquifer parameters. The collective impact of these components would define an area in terms of its susceptibility to contamination from surface. The combined effect of selected hydrogeological parameters helps in determining pollution attenuation capacity of an area. The spatial variation of parameters further helps in determining relative sus-ceptibility in a way that the area either susceptible or relatively safer from pollution depending upon actual behavior of the parameters. The relationship of each parameter and pollution can be estimated through relative rating criteria. Many studies eval-uated the potential of a hydrogeological environment to pollution contamination using different models including DRASTIC [9], SEEPAGE [10], GOD [11], EPIK [12], and AVI [13]. These methods integrate various hydrological and hydrogeological parameters classified by unique ratings and weights.
DRASTIC technique was developed by the US Environmental Protection Agency (EPA) as a technique for assessing groundwater pollution potential. The product of variable rating classes and constant weight assigned to each parameter generates weighted
Environ. Eng. Res. 2018; 23(1): 84-91 pISSN 1226-1025https://doi.org/10.4491/eer.2017.072 eISSN 2005-968X
Groundwater pollution risk mapping using modified DRASTIC model in parts of Hail region of Saudi ArabiaIzrar Ahmed1, Yousef Nazzal2†, Faisal Zaidi3
1Environment Department, Dubai Municipality, Dubai, UAE2College of Natural & Health Sciences, Zayed University, P.O.Box 144534, Abu Dhabi, UAE 3Department of Geology & Geophysics, King Saud University, Riyadh, Saudi Arabia
ABSTRACTThe present study deals with the management of groundwater resources of an important agriculture track of north-western part of Saudi Arabia. Due to strategic importance of the area efforts have been made to estimate aquifer proneness to attenuate contamination. This includes determining hydrodynamic behavior of the groundwater system. The important parameters of any vulnerability model are geological formations in the region, depth to water levels, soil, rainfall, topography, vadose zone, the drainage network and hydraulic conductivity, land use, hydrochemical data, water discharge, etc. All these parameters have greater control and helps determining response of groundwater system to a possible contaminant threat. A widely used DRASTIC model helps integrate these data layers to estimate vulnerability indices using GIS environment. DRASTIC parameters were assigned appropriate ratings depending upon existing data range and a constant weight factor. Further, land-use pattern map of study area was integrated with vulnerability map to produce pollution risk map. A comparison of DRASTIC model was done with GOD and AVI vulnerability models. Model validation was done with NO3, SO4 and Cl concentrations. These maps help to assess the zones of potential risk of contamination to the groundwater resources.
Keywords: Al Hail, DRASTIC aquifer vulnerability, Groundwater resources, Landuse pattern, Risk map, Saudi Arabia
This is an Open Access article distributed under the terms of the Creative Commons Attribution Non-Commercial License (http://creativecommons.org/licenses/by-nc/3.0/) which per-
mits unrestricted non-commercial use, distribution, and reproduction in any medium, provided the original work is properly cited.
Copyright © 2018 Korean Society of Environmental Engineers
Received June 11, 2017 Accepted October 8, 2017
† Corresponding authorEmail: [email protected]: +971-509620945
Environmental Engineering Research 23(1) 84-91
85
index data layer. Several researchers have addressed the necessity to modify the DRASTIC method integrating landuse pattern [14, 15], sensitivity analysis [13], and to validate with groundwater quality parameter. Some worker modified DRASTIC by adding parameters like land use pattern [16-18].
The present study outcome would provide information which can be put together for decision making tool for groundwater re-source protection and management of Hail region.
2. Study Area
2.1. Location
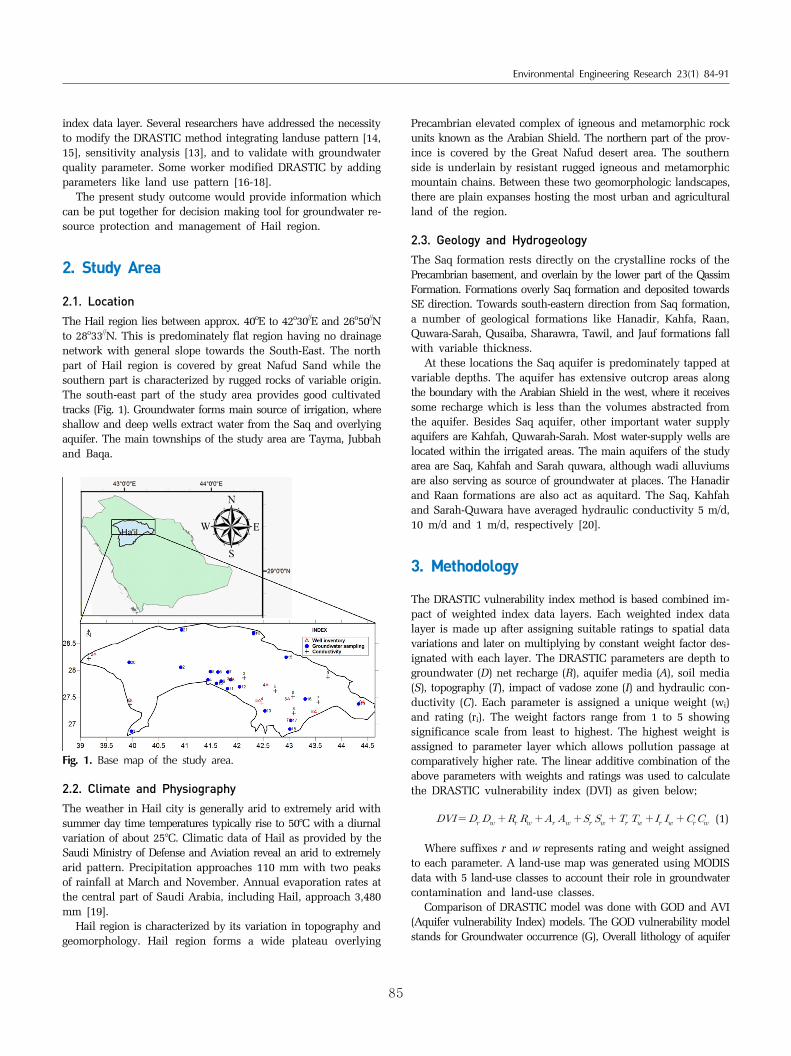
The Hail region lies between approx. 40oE to 42o30//E and 26o50//N to 28o33//N. This is predominately flat region having no drainage network with general slope towards the South-East. The north part of Hail region is covered by great Nafud Sand while the southern part is characterized by rugged rocks of variable origin. The south-east part of the study area provides good cultivated tracks (Fig. 1). Groundwater forms main source of irrigation, where shallow and deep wells extract water from the Saq and overlying aquifer. The main townships of the study area are Tayma, Jubbah and Baqa.
Fig. 1. Base map of the study area.
2.2. Climate and Physiography
The weather in Hail city is generally arid to extremely arid with summer day time temperatures typically rise to 50°C with a diurnal variation of about 25°C. Climatic data of Hail as provided by the Saudi Ministry of Defense and Aviation reveal an arid to extremely arid pattern. Precipitation approaches 110 mm with two peaks of rainfall at March and November. Annual evaporation rates at the central part of Saudi Arabia, including Hail, approach 3,480 mm [19].
Hail region is characterized by its variation in topography and geomorphology. Hail region forms a wide plateau overlying
Precambrian elevated complex of igneous and metamorphic rock units known as the Arabian Shield. The northern part of the prov-ince is covered by the Great Nafud desert area. The southern side is underlain by resistant rugged igneous and metamorphic mountain chains. Between these two geomorphologic landscapes, there are plain expanses hosting the most urban and agricultural land of the region.
2.3. Geology and Hydrogeology
The Saq formation rests directly on the crystalline rocks of the Precambrian basement, and overlain by the lower part of the Qassim Formation. Formations overly Saq formation and deposited towards SE direction. Towards south-eastern direction from Saq formation, a number of geological formations like Hanadir, Kahfa, Raan, Quwara-Sarah, Qusaiba, Sharawra, Tawil, and Jauf formations fall with variable thickness.
At these locations the Saq aquifer is predominately tapped at variable depths. The aquifer has extensive outcrop areas along the boundary with the Arabian Shield in the west, where it receives some recharge which is less than the volumes abstracted from the aquifer. Besides Saq aquifer, other important water supply aquifers are Kahfah, Quwarah-Sarah. Most water-supply wells are located within the irrigated areas. The main aquifers of the study area are Saq, Kahfah and Sarah quwara, although wadi alluviums are also serving as source of groundwater at places. The Hanadir and Raan formations are also act as aquitard. The Saq, Kahfah and Sarah-Quwara have averaged hydraulic conductivity 5 m/d, 10 m/d and 1 m/d, respectively [20].
3. Methodology
The DRASTIC vulnerability index method is based combined im-pact of weighted index data layers. Each weighted index data layer is made up after assigning suitable ratings to spatial data variations and later on multiplying by constant weight factor des-ignated with each layer. The DRASTIC parameters are depth to groundwater (D) net recharge (R), aquifer media (A), soil media (S), topography (T), impact of vadose zone (I) and hydraulic con-ductivity (C). Each parameter is assigned a unique weight (wi) and rating (ri). The weight factors range from 1 to 5 showing significance scale from least to highest. The highest weight is assigned to parameter layer which allows pollution passage at comparatively higher rate. The linear additive combination of the above parameters with weights and ratings was used to calculate the DRASTIC vulnerability index (DVI) as given below;
(1)
Where suffixes r and w represents rating and weight assigned to each parameter. A land-use map was generated using MODIS data with 5 land-use classes to account their role in groundwater contamination and land-use classes.
Comparison of DRASTIC model was done with GOD and AVI (Aquifer vulnerability Index) models. The GOD vulnerability model stands for Groundwater occurrence (G), Overall lithology of aquifer

Izrar Ahmed et al.
86
or aquitard (O) and Depth to groundwater (D) (Foster et al. 2006). Whilst, AVI model considers two key parameters i.e. thickness of each sedimentary unit above the uppermost aquifer and hydraul-ic conductivity of each of these layers. For comparison, vulner-ability maps were normalized to values from 0 to 1 corresponding to the ranges of vulnerability classes of the individual methods.
4. Results and Discussion
4.1. DRASTIC Model Input Parameters
Data used for various input parameters was procured from different techniques, field experiences and sources. DRASTIC model com-bines all data layers representing detailed hydrogeological behavior of the area of interest. All the data layers should have uniform grid size and geographical extents. The rating of each parameter depends on the data variation therefore the extents of variation of each parameter encountered in the study area were carefully accounted to obtain a unique range. In the present study, the DRASTIC model was further modified with unique rating classes of each parameter relevant to study area (Table 1). In the present study the DRASTIC methodology with few modifications is adopted and is described below.
4.2. Depth to Groundwater (D) and Net Recharge (R)
The depth to groundwater (D) was obtained measuring piezometers available in the study area. The depth to water levels ranges from 50 m to >150 m below ground level (bgl). The depth to water is assigned highest weight of 5. In general, the deeper water levels likely to be less vulnerable to contamination than the shallow water depths. This is due to longer time that the pollutants would take to reach the ground water table. A weighted index map depth to water level is shown in Fig. 2(a).
Groundwater recharge studies conducted in central Saudi Arabia show variable values ranging from 4 mm/y [20] to 20 mm/y [21]. At the scale of the entire Saq area, groundwater recharge most probably does not exceed 5 mm/y [20]. The potential recharge variable of R has been calculated from collective ratings of parame-ters, like geology, rainfall, drainage class, and slope, which con-verted to scale of 1 to 10. The variability of each of above parameters has been duly accounted to obtain relative potential recharge values (Table 2). In the present study, potential recharge is obtained which is subjective assessment and may not be same as calculated values but expected to follow similar aerial distribution. As a result, net recharge in the study area ranges from 3 to 9 dimension-less values. A weighted index map shows distribution of recharge zones (Fig. 2(b)).
4.3. Aquifer Media (A) and Soil Media (S)
Subsurface material or precisely the aquifer material consists of sandstone, shale, limestone, alluvium, sand and gravel in varied proportions. Aquifer media relates with aquifer vulnerability prin-ciple in a way that larger the gain size of material, the higher its permeability and lower its attenuation capacity. Using relative ratings and constant weight of 3, a weighted index map of aquifer
Table 1. DRASTIC Parameters
DRASTICparameters
Range Ratings Weight
Depth to water
0-25 10
5
25-50 9
50-100 7
100-150 5
>150 3
Recharge(potential)
3 to 9 4
Aquifer media
Shale 3
3
Wadi beds, mixed lithology 5
Mixed sandstone/limestone 6
Dolomite/sandstone/evaporite/clastics
7
Coarse sandstone 8
Sanddunes, alluviums 10
Soil media
Loamy 1
2
Loamy-sand 3
Loamy-rocky 5
Sandy clay 7
Sandy 10
Topography
<1 (degree) 10
1
1---2 9
2---4 8
4----6 7
6----12 5
12---18 3
>18 1
Impact ofvadose zone
Loam 1
5
Siltstone 2
Chert/shale/clay 3
Sandstone/6
Limestone
Dolomite 8
Sand 9
Conductivity
0-3 (m/d) 1
3
3-6 3
6-9 5
9-12 7
>12 10
media has been prepared (Fig. 2(c)). Soil type plays an important role providing first interaction of percolated water to an aquifer. The presence of material type, conductivity, water retention ca-

Environmental Engineering Research 23(1) 84-91
87
pacity etc. are likely to affect infiltration and also to pollution potential. The value of variable S (Soil type) was obtained from soil classification maps produced by the geological survey depart-ment of Saudi Arabia. The predominant soil types were assigned relative ratings and designated by constant weight of 2. The weighted index map of soil media shows the spatial distribution (Fig. 2(d)).
4.4. Topography (T) and Impact of Vadose Zone (I)
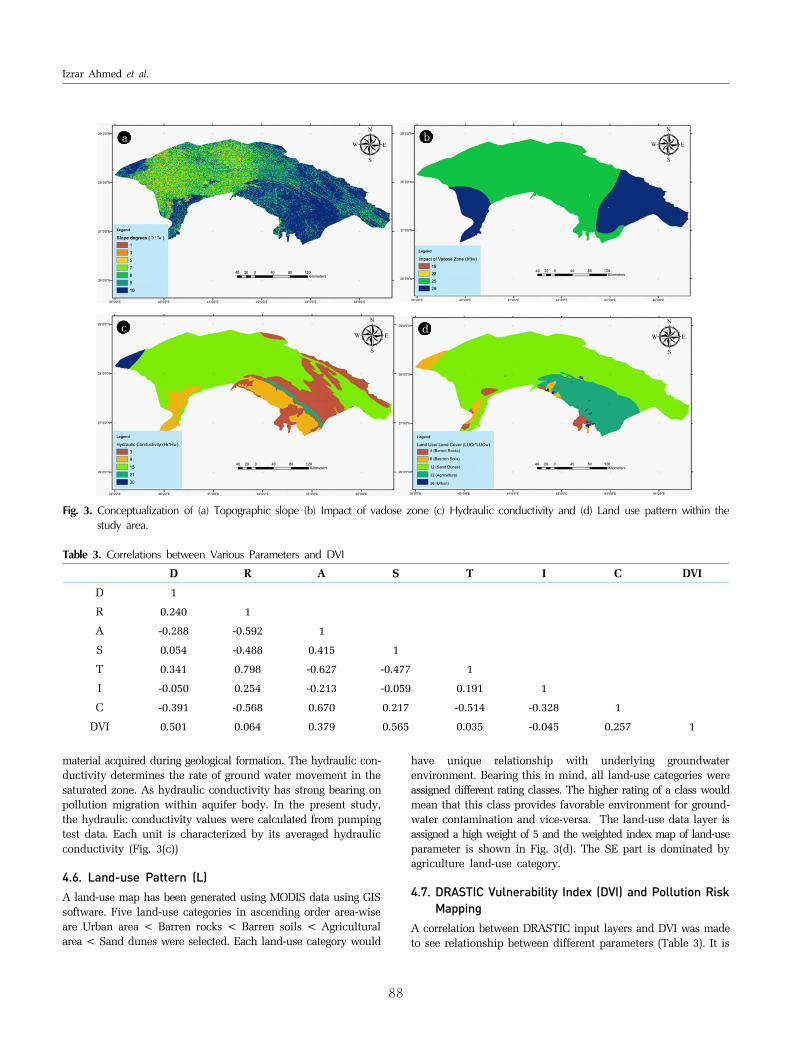
The variation in topography was obtained through elevation points using the triangulation method in the ARC/INFO system. The change in topography i.e. the slope controls the likelihood of a pollutant to be transported by runoff or to remain on the ground where it may infiltrate the surface. The topography of the study area in the form of slope degrees range < 1º to > 18º. The topographic
slope is assigned least weight of 1 implying that rating map would be same as that of weighted index map (Fig. 3(a)).
Vadose zone is the unsaturated zone, lying above the water table, which plays an important role in pollution attenuation and groundwater recharge. The vadose zone in the study area is com-posed of gravel, variable sand, coarse sandstone and clay materials. The impact of vadose zone has been evaluated through comparative analysis of material favoring to water percolation downwards using harmonic mean approach [22]. A relative rating data layer was obtained and multiplied by weight of 5 to produce weighted index vadose zone layer (Fig. 3(b)).
4.5. Hydraulic Conductivity (C)
Hydraulic conductivity is controlled by the properties of the aquifer
Table 2. Rating Class Criteria to Different Index Parameter Used to Estimate Groundwater Recharge Potential
Geology Index Drainage Index Slope Index Rainfall Index
Type Rating Type Rating Range Rating Range Rating
Aquifer 10 Large 10 <1 10 150-170 10
Aquiclude 5 Medium 5 1-2 9 130-150 9
Aquitard 1 Small 2 2-4 8 110-130 8
Sabkha 1 No 1 4-6 7 90-110 7
6-12 5 70-90 5
12-18 3 50-70 3
>18 1 0-50 1
a b
c d
Fig. 2. Conceptualization of (a) Depth to water level (b) Recharge potential (c) Aquifer media and (d) Soil media within the study area.
Izrar Ahmed et al.
88
material acquired during geological formation. The hydraulic con-ductivity determines the rate of ground water movement in the saturated zone. As hydraulic conductivity has strong bearing on pollution migration within aquifer body. In the present study, the hydraulic conductivity values were calculated from pumping test data. Each unit is characterized by its averaged hydraulic conductivity (Fig. 3(c))
4.6. Land-use Pattern (L)
A land-use map has been generated using MODIS data using GIS software. Five land-use categories in ascending order area-wise are Urban area < Barren rocks < Barren soils < Agricultural area < Sand dunes were selected. Each land-use category would
have unique relationship with underlying groundwater environment. Bearing this in mind, all land-use categories were assigned different rating classes. The higher rating of a class would mean that this class provides favorable environment for ground-water contamination and vice-versa. The land-use data layer is assigned a high weight of 5 and the weighted index map of land-use parameter is shown in Fig. 3(d). The SE part is dominated by agriculture land-use category.
4.7. DRASTIC Vulnerability Index (DVI) and Pollution Risk Mapping
A correlation between DRASTIC input layers and DVI was made to see relationship between different parameters (Table 3). It is
a b
c d
Fig. 3. Conceptualization of (a) Topographic slope (b) Impact of vadose zone (c) Hydraulic conductivity and (d) Land use pattern within thestudy area.
Table 3. Correlations between Various Parameters and DVI
D R A S T I C DVI
D 1
R 0.240 1
A -0.288 -0.592 1
S 0.054 -0.488 0.415 1
T 0.341 0.798 -0.627 -0.477 1
I -0.050 0.254 -0.213 -0.059 0.191 1
C -0.391 -0.568 0.670 0.217 -0.514 -0.328 1
DVI 0.501 0.064 0.379 0.565 0.035 -0.045 0.257 1

Environmental Engineering Research 23(1) 84-91
89
evident that the parameters do not correlate with each other except recharge potential and topographic slope. This implies that each parameter contributed to DVI scores. Although parameters such aquifer media and vadose zone show moderate correlation. The parameters like soil media, depth to water and aquifer media show moderate correlation with DVI, rest of the parameters are weakly or negatively correlated with DVI. DRASTIC vulnerability map was obtained by combining data layers in GIS environment using Eq. (1). Perusals of DVI map of the study area shows that the vulnerability index varies across the study area. Given that the DVI values range were arranged into different classes; low (100-122), medium (122-144), high (144-166) and very high (>166). The majority of the study area is characterized by medium and high vulnerability classes which are associated with high aquifer media and soil media values. These parameters carry high rating and weight itself which contributed to high magnitude of DVI in this part of study area. For this reason, a set of measures should be applied in order to protect ground water quality with priority to such areas. High DVI’s are located towards central and eastern parts of the study area. Low and medium classes of vulner-ability were present but limited to small areas thus remained un-mapped in present scale.
A comparison of 3 vulnerability maps was made using DRASTIC, GOD and AVI vulnerability models (Fig. 7). All the maps were normalized at a scale of 0 to 1. As a result of the application, the GOD and EVI models were used to better compare with DRASTIC vulnerability maps. GOD method is based on integration of 3 layers that is, GOD = Groundwater occurrence (G), Overall lithology of aquifer or aquitard (O) and Depth to groundwater
Fig. 4. Aquifer vulnerability map.
Fig. 5. Validation of aquifer vulnerability with pollution indicator.
Fig. 6. Groundwater pollution risk map.
Fig. 7. Comparison of DRASTIC, GOD and AVI vulnerability maps.
table (D) (Foster et al. 2006). The determination of the GOD vulner-ability index is normalized into 0-1 scale. It was observed, through the GOD method, that the area of the basin has mostly high or very high vulnerability, related to high depth of the groundwater level and also to the low degree of confinement. In AVI vulnerability model, hydraulic conductivity is the prominent feature determin-ing the vulnerability classes. Moreover, the results of the DRASTIC method indicate that most of the basin presents high to very high vulnerability, especially in areas of shallow water levels, soil types and aquifer media. The high to very high vulnerability classes are corresponding with sand-dunes, alluviums and sandstone region.
The concentrations of Nitrate (NO3), Chloride (Cl) and Sulphate (SO4) were measured in groundwater samples at 20 locations and
Izrar Ahmed et al.
90
were compared with DVI scores. These chemical parameters were used as pollution indicators and were compared with DVI zones to validate the model. The concentration of NO3, Cl, and SO4 increases from low to high vulnerability zones. However, very high vulnerability zone is designated by comparatively low concen-trations of pollution indicators. This could be due to reason that this region is unaffected by human activities. Nonetheless, the model zones comply with low, medium and high vulnerability zones. Land-use map has been integrated with DVI map to prepare pollution risk map (Fig. 4(b)). This map further prioritizes areas based on pollution risk present in the form of land-use pattern. The areas with high and very high index should be brought to the discussion for groundwater protection policy.
5. Conclusions and Recommendations
The groundwater in the study area is under great pressure from urbanization and agricultural expansion. This has resulted in groundwater over abstraction. All of these factors may also pollute the groundwater resources directly. In the present study the DRASTIC index was used to assess the degree of vulnerability to pollution of groundwater in the Hail area. DVI values range were arranged into different classes; low (100-122), medium (122-144), high (144-166) and very high (>166). The majority of the Hail region is characterized by the high and very high Vulnerability levels which are associated with shallow aquifer's with lesser depth of vadose zone. A comparison of different vulner-ability maps show DRASTIC vulnerability classes are more promis-ing as it address more parameters pertaining to aquifer vulnerability to contamination. Three parameters i.e. NO3, Cl and SO4 were selected as pollution indicators in the groundwater samples and were compared with DVI zones to validate the model. The concen-tration of NO3, Cl, and SO4 increases from low to high vulnerability zones. Nonetheless, the model zones comply with low, medium and high vulnerability zones. The vulnerability maps are useful in the implementation and prioritization of policies for aquifer protection, in particular, and water resources management, in general. The following remedial measures can be adopted to protect groundwater contamination in areas of known pollution threats:
1) Check and reduce chemical fertilizers and pesticides espe-cially within areas of very high DVI.
2) Aquifer outcrop area should be declared groundwater pro-tection zone abandoning use of chemical fertilizers, pesticides and other anthropogenic activity which could pollute the aquifer.
3) Regular monitoring of the groundwater quality should occur, especially in the areas corresponding high to very high vulnerability classes.
References
1. Civita M. Vulnerability maps of aquifers subjected to pollution: Theory and practice. Pitagora ditrice: Bologna (In Italian); 1994.
2. Polemio M, Dragone V, Limoni PP. Monitoring and methods to analyse the groundwater quality degradation risk in coastal
karstic aquifers (Apulia Souhern Italy). Environ. Geol. 2008;58:299-312.
3. Al-Salamah IS, Ghazaw YM, Ghumman AR. Groundwater modeling of Saq Aquifer Buraydah Al Qassim for better water management strategies. Environ. Monit. Assess. 2011;173:851-860.
4. MoWE. Investigations for updating the groundwater mathemat-ical models of the Saq and overlying aquifers. Ministry of Water and Electricity in Saudi Arabia; 2008.
5. Nazzal Y, Zaidi FK, Ahmed I, et al. The combination of principal component analysis and geostatistics as a technique in the assessment of groundwater hydrochemistry in arid environ-ment: A case study of central Saudi Arabia. Curr. Sci. 2015;108:1138-1145.
6. El Maghraby MMS, Ahmad KO, El Nasr A, Hamouda MSA. Quality assessment of groundwater at south Al Madinah Al Munawarah area, Saudi Arabia. Environ. Earth Sci. 2013;70: 1525-1538.
7. Nazzal Y, Ahmed I, Al Arifi NSN, et al. A pragmatic approach to study the groundwater quality suitability for domestic and agricultural usage, Saq aquifer, northwest of Saudi Arabia. Environ. Monit. Assess. 2014;186:4655-4667.
8. Zaidi FK, Nazzal Y, Ahmed I, et al. Hydrochemical processes governing groundwater quality of sedimentary aquifers in Central Saudi Arabia and its environmental implications. Environ. Earth Sci. 2015;74:1555-1568.
9. Aller L, Bennet T, Lehr JH, Petty RJ. DRASTIC: A standardized system for evaluating groundwater pollution potential using hydrogeologic settings. U.S. Environmental Protection Agency: Washington D.C., EPA/600/2-85/018; 2004.
10. Civita M, DeMiao M. Assessing and mapping groundwater vulnerability to contamination: The Italian combined approach. Geofísica Internacional 2004;43:513-532.
11. Foster SSD. Fundamental concepts in aquifer vulnerability, pollution risk and protection strategy. In: van Duijvenbooden W, HG van Waegeningh, eds. TNO committee on hydrological research, The Hague. Vulnerability of soil and groundwater to pollutants, Processing and Information. 1987;38:69-86.
12. Doerfliger N, Zwahlen F. EPIK: A new method for outling of protection areas in karstic environment. In: International symposium on karst waters and environmental impacts; 1997. p. 117-123.
13. Van Stempvoort D, Evert L, Wassenaar L. Aquifer vulnerability index: A GIS compactable method for groundwater vulner-ability mapping. Can. Water Resour. J. 1993;18:25-37.
14. Al Adamat RAN, Foster IDL, Baban SNJ. Groundwater vulner-ability and risk mapping for the Basaltic aquifer of the Azraq basin of Jordan using GIS, Remote sensing and DRASTIC. Appl. Geogr. 2003;23:303-324.
15. Panagopoulos G, Antonakos A, Lambrakis N. Optimization of the DRASTIC method for groundwater vulnerability assess-ment via the use of simple statistical methods and GIS. Hydrogeol. J. 2005;14:894-911.
16. Rahman A. A GIS based DRASTIC model for assessing ground-water vulnerability in shallow aquifer in Aligarh, India. Appl. Geogr. 2008;28:32-53.
17. Umar R, Ahmed I, Alam F. Mapping groundwater vulnerable zones using modified DRASTIC approach of an alluvial aquifer

Environmental Engineering Research 23(1) 84-91
91
in parts of Central Ganga Plain, Western Uttar Pradesh. J. Geol. Soc. India 2009;73:193-201.
18. Ahmed I, Nazzal Y, Zaidi FK, Al-Arifi NS, Ghrefat H, Naeem M. Hydrogeological vulnerability and pollution risk mapping of the Saq and overlying aquifers using the DRASTIC model and GIS techniques, NW Saudi Arabia. Environ. Earth Sci. 2015;74:1303-1318.
19. Edgell HS. Arabian deserts: Nature, origin and evolution. Dordrecht: Springer; 2006.
20. Subyani A, Zakai S. Study of recharge outcrop relation of
the Wasia Aquifer in Central Saudi Arabia. J. KAU Earth Sci. 1991;4:137-147.
21. Dincer T, Al Mugren A, Zimmerman V. Study of infiltration and recharge through the sand dunes in arid zones with special reference to the stable isotopes and thermos nuclear tritium. J. Hydrol. 1974;23:79-109.
22. Hussain MH, Singhal DC, Joshi H, Kumar S. Assessment of groundwater vulnerability in a tropical alluvial interfluves, India. Bhu-Jal News J. 2006;21:31-43.