Groundswell Final Agronomy Report
96
March 2011 CHRIS HOUGHTON AGRICULTURAL GROUNDSWELL PROJECT FINAL AGRONOMY REPORT
description
Agronomy Report for the Groundswell project written by Chris Houghton Agricultural.
Transcript of Groundswell Final Agronomy Report

March 2011
CHRIS
HOUGHTON
AGRICULTURAL
GROUNDSWELL PROJECT
FINAL AGRONOMY REPORT

GROUNDSWELL - Final Agronomy Report
CHRIS HOUGHTON AGRICULTURAL PO Box 18 Crookwell NSW 2583 (02) 48320803 Page 2
Table of Contents Page Research Qs
1 Summary of trial outcomes 4 A1
2 Background 5
3 Seasonal conditions 6
3.1 Goulburn Sites 2009 and 2010 6
3.2 Bungendore Site (2009) 8
3.3 Condobolin Site 2009 & 2010 9
4 Trial objectives 10
5 Compost specifications 11
5.1 Comparing compost nutrient analysis 11
5.2 Comparing compost as nutrient applied 12
6 Trial design and compost rates applied 13
7 Testing for Weeds and contaminants 14 A4,
8 Outcomes and observations 15
8.1 Grazing Trial Sites 15
8.1.1 Narrambulla trial 15
Site details 15
Trial design 16 A2
Trial results 17
Herbage yield 17 A5
Grazing trial results 18 A5
Herbage quality 19 A6
Soil biology 20 A10
Soil nutrients 22 A11, A12
Soil carbon 23 A9
Soil structure 23 A14
Soil water holding capacity 24 A7, A8
8.1.2 Strathmere trial 26
Site details 26
Trial design 27
Trial results 27
Herbage yield 27 A5
Grazing trial results 29 A5
Herbage quality 29 A6
Soil biology 31 A10
Soil nutrients 32 A11, A12
Soil carbon 33 A9
Soil structure 33 A14
Soil water holding capacity 34 A7, A8

GROUNDSWELL - Final Agronomy Report
CHRIS HOUGHTON AGRICULTURAL PO Box 18 Crookwell NSW 2583 (02) 48320803 Page 3
8.2 Cropping Trial Sites 36
8.2.1 Bungendore cropping trial 36
Site details 36
Trial design 37
Trial results 38
Herbage yield 38 A5
Tissue test results 39 A11, A12
Grain yield 39 A5
8.2.2 Forest Lodge Goulburn 41
Site details 41
Trial design 42
Trial results 43
Grain yield 43 A5
Grain protein 44
Herbage yield 45
Herbage quality 46 A6
Soil biology 47 A10
Soil nutrients 47 A11, A12
Soil carbon 48 A9
Soil structure 49 A14
Soil water holding capacity 50 A7, A8
8.2.3 Condobolin 51
Site details 51
Trial Design 52
Trial results 52
Grain yield 53 A5
Herbage quality 58 A6
Soil biology 59 A10
Soil nutrients 59 A11, A12
Soil carbon 60 A9
Soil structure 61 A14
Soil water holding capacity 62 A7, A8
9 Conclusion 63 A3, A4, A20
10 Appendixes 70

GROUNDSWELL - Final Agronomy Report
CHRIS HOUGHTON AGRICULTURAL PO Box 18 Crookwell NSW 2583 (02) 48320803 Page 4
1 SUMMARY OF TRIAL OUTCOMES
The following chart shows where the application of compost achieved a positive effect. Key: A – Noticeable response that should be repeatable. B – Possible response that may be repeatable. C – No noticeable response.
Goulburn Bungendore Condobolin
Narrambulla Strathmere Forest Lodge Landtasia Condo Res Stn
Years 2009 / 2010 2009 / 2010 2010 2009 2009 / 2010
Herbage yield A / A A / A B C A / A Grain Yield - - B B A Grain protein - - C - C Grazing yield C B - - - Herbage quality
Protein C B A - B ME B B A - B Digestibility B A A - B NDF (Fibre) B C A - C
Soil biology C C C - C Plant tissue tests - - - C - Soil nutrients
Nitrate C A C - - Phosphorus B A A - A Potassium A A A - C Sulphur A A B - C
Soil carbon A B B - C Structure
Dispersion C C C - C Slaking C C C - C
Soil water (WHC) B B B - B

GROUNDSWELL - Final Agronomy Report
CHRIS HOUGHTON AGRICULTURAL PO Box 18 Crookwell NSW 2583 (02) 48320803 Page 5
2 BACKGROUND
Groundswell builds on the successful City to Soil project run by the South East Office of
DECCW and Queanbeyan City Council in 2004, and seeks to prove the wider economic viability of the City to Soil collection system and establish composted urban organic waste as a cost effective, high quality agricultural input. The project aims to have farmers and Councils working together to pull urban organic waste out of the cities and back onto agricultural land, simultaneously reducing organic waste to landfill and used instead for the improvement of agricultural soils.
Between 40% and 70% of urban waste currently going to landfill is organic material. This project is demonstrating that the most logical and economically viable use for organic waste is, when properly composted, as a soil ameliorant or nutrient source in agriculture.
The project aims to quantify the agronomic and economic benefits to agriculture of returning quality compost to soil. In doing so the aim is to see if a market can be created for ongoing use of recycled urban organics in agriculture.
The Groundswell project targets 5 key needs:
to divert organic waste from the urban waste stream
to improve urban sustainability
to improve agricultural sustainability including increased soil health and productivity
to improve environmental sustainability
to establish economically viable models for the collection, processing and application of urban organic waste into agricultural land
Groundswell was developed in partnership with the Wiradjuri Condobolin Corporation (WCC), the Palerang Agricultural Society, Bettergrow, Zero Waste Australia and the South East office of the DECC Sustainability Programs Division.
Chris Houghton Agricultural provides agronomic services for the Groundswell project, conducting trials at various sites. They include a cropping trial east of Bungendore in 2009, one north of Goulburn in 2010, and another at Condobolin Ag Research Station in 2009 and 2010. Two grazing trials have been run east and west of Goulburn in 2009 and 2010 to evaluate the use of compost on pastures, and the subsequent livestock performance.
The agronomic component of the Groundswell program is critical to the marketing and subsequent use of the urban waste (UW) compost on farms. Before UW compost will be accepted as a regular farm input, landholders need to know the expected production and environmental outcomes as well as the cost benefits to be achieved.
Although the short duration of the trials does not allow enough time to be able to generate all of the information that is required, it should provide enough to give potential users the confidence needed to try UW compost for themselves. Another aim is to give the Councils involved information about the size of the broadacre UW compost market, and to provide feedback on general market acceptance.

GROUNDSWELL - Final Agronomy Report
CHRIS HOUGHTON AGRICULTURAL PO Box 18 Crookwell NSW 2583 (02) 48320803 Page 6
3 SEASONAL CONDITIONS
The trial outcomes were adversely impacted by poor rainfall through 2009, and in particular the late spring / summer period. The dry conditions reduced the benefits that could be measured. Soil moisture is critical when using compost and other organic products as soil organisms are needed to break the product down into plant available forms.
3.1 Goulburn Sites 2009 and 2010
Note: Sieler’s rainfall figures are taken to be the same as the Goulburn TAFE figures, and Divall’s figures are actuals from the property.
Strathmere trial site (Glbn TAFE weather station) Jan Feb Mar Apr May Jun Jul Aug Sep Oct Nov Dec TOTAL
2009 35 27.2 8.8 69 20.4 30.4 37.2 30.8 60.6 67.8 11.2 92.4 490.8
2010 52.4 162.4 54.2 19.6 74.8 22.6 48.8 68.6 44.2 27.4 110.8 228.4 914.2
NB: The long term average is 638.1 mm per annum.
Narrambulla Trial Site Jan Feb Mar Apr May Jun Jul Aug Sep Oct Nov Dec Total
2009 36.3 26 7.8 62 18 30.8 26.5 25 46.8 45.6 26.5 77.8 429
2010 101.0 168 42.5 13.5 51.0 7.5 39.0 67.5 56.5 13.5 104.8 239.5 904
NB: The long term average is 638 mm per annum.
0
50
100
150
200
250
Jan Feb Mar Apr May Jun Jul Aug Sep Oct Nov Dec
Rai
nfa
ll (m
m)
Strathmere site - Monthly rainfall
Sielers - 09
Sielers -10
0.0
50.0
100.0
150.0
200.0
250.0
300.0
Jan Feb Mar Apr May Jun Jul Aug Sep Oct Nov Dec
Rai
nfa
ll (m
m)
Narrambulla site - Monthly Rainfall
2009
2010

GROUNDSWELL - Final Agronomy Report
CHRIS HOUGHTON AGRICULTURAL PO Box 18 Crookwell NSW 2583 (02) 48320803 Page 7
Comments
2009 was characterised by a very dry period from May to September and a premature end to spring flush in October.
In 2009 Divall’s trial experienced less winter and spring rainfall than Goulburn resulting in a crash in pasture production in spring. This was further exacerbated by very hot and windy conditions.
2010 started and finished with well above average rainfall at both sites leading to an excellent season for pasture growth.

GROUNDSWELL - Final Agronomy Report
CHRIS HOUGHTON AGRICULTURAL PO Box 18 Crookwell NSW 2583 (02) 48320803 Page 8
3.2 Bungendore Site (2009) Bungendore Post Office and Landtasia rainfall (mm)
Jan Feb Mar Apr May Jun Jul Aug Sep Oct Nov Dec Total
B/dore 2009 39.6 7 11.4 60.6 10 26.1 34 45.4 87.4 73.4 29.6 80.4 505
Landtasia 09 36 13.5 10 47 12.5 18.5 36 22 43 60 4.5 64.5 367
NB: The long term average is 636 mm per annum.
Notes: The figures are from the Bungendore Post Office meteorological station. The Landtasia figures are for the Swamp, the part of the property where the crop was grown.
Comments
In 2009 there was a reduction in annual rainfall of approximately 131 mm from the long term average.
2009 was characterised by a very dry period from February/ March and another in May / June and a premature end to spring in October.
Landtasia rainfall figures were well below Bungendore.
The Landtasia spelt (wheat) crop went in with little moisture in the soil profile and experienced well below average rainfall right through the growing period.
Although some good rain fell in October, the yield potential had already been set at a very low level. The dry November when the grain was filling reduced any chance of a good harvest.
0
10
20
30
40
50
60
70
80
90
100
Jan Feb Mar Apr May Jun Jul Aug Sep Oct Nov Dec
Rai
nfa
ll (m
m)
Bungendore - Monthly rainfall
B-dore 09
L-tasia 09

GROUNDSWELL - Final Agronomy Report
CHRIS HOUGHTON AGRICULTURAL PO Box 18 Crookwell NSW 2583 (02) 48320803 Page 9
3.3 Condobolin Site 2009 & 2010 Condobolin Rainfall (Condo Research Station)
Jan Feb Mar Apr May Jun Jul Aug Sep Oct Nov Dec Total
2009 4.2 60.6 29 44.9 14.2 52.5 23.4 10.7 16.7 34.2 17.2 90.6 398.2
2010 16.6 158.6 55.4 33 38.3 26.4 48.9 26.3 36 76.9 80.9 50.6 647.9
NB: The long term average is 456 mm per annum.
Notes: 1. The Condobolin figures are from the Agricultural Research Station Meteorological
Station, which is only about 500 m from the trial site.
Comments
In 2009 there was a reduction in annual rainfall of approximately 55 mm from the long term average.
2009 characterised by good rains in February, April and June allowing crops to be sown a little late but into reasonable soil moisture.
In 2009 the growing season rainfall and follow-up rain in the spring was very poor, leading to a disappointing finish to the season.
Although 2009 December rainfall was good it was too late as the crops had well and truly finished by that stage.
February and March rainfall in 2010 was excellent and subsequent months adequate to get the crop in on time.
In 2010 the growing season rainfall was excellent but too much rain fell during the late October and November period, the traditional harvest time, reducing grain quality.
0
20
40
60
80
100
120
140
160
180
Jan Feb Mar Apr May Jun Jul Aug Sep Oct Nov Dec
Rai
nfa
ll (m
m)
Condobolin - Monthly rainfall
2009
2010

GROUNDSWELL - Final Agronomy Report
CHRIS HOUGHTON AGRICULTURAL PO Box 18 Crookwell NSW 2583 (02) 48320803 Page 10
4 TRIAL OBJECTIVES
The trial measurements across all of the sites have been designed to test the following assumptions:
1. Nutrients in Urban Waste (UW) compost are available in a suitable time frame to meet plant needs.
2. No toxicity risks to the environment or the end user exist from the use of UW compost.
3. Limited weed risks exist through the use of UW compost. 4. The application of nutrients to a cereal crop partly by synthetic fertiliser and partly
by UW compost is a cost effective method of improving crop returns. 5. UW compost has other properties such as the presence of beneficial microorganisms
that aid in improving plant performance. 6. Soil water holding capacity is enhanced through the application of UW compost to
soils. 7. Crop water use efficiency is enhanced through the application of UW compost to
soils. 8. UW compost application enhances soil carbon levels and is a practical means of
sequestering carbon. 9. The application of UW compost to crop or pasture soils has a positive impact on soil
structure.
Gerry Gillespie sampling the Condobolin compost in the completed form, in August 2009.

GROUNDSWELL - Final Agronomy Report
CHRIS HOUGHTON AGRICULTURAL PO Box 18 Crookwell NSW 2583 (02) 48320803 Page 11
5 COMPOST SPECIFICATIONS
5.1 Comparing composts used in the trials There were two sources of compost used in the trials, being prepared from urban waste at the Goulburn and Condobolin Waste Management centres. The tests conducted which are relevant to the agronomic assessment provided the following results:
Site
Glbn Pile 1
Glbn P- 2&3
Glbn Pile-4
Glbn Pile-4 Averages
Test date May-09 April-10 April-10 Sept-10
Analyte Unit Ref 090176521 100473359 100473360 100975593
pH CaCl2
7.7 7 6.9 7.2 7.2
Electrical conductivity uS/cm
3461 4420 4310 3241 3858
Total soluble salt ppm
11421 14586 14193 10695 12724
Nitrogen %
1.15 1.27 1.17 1.12 1.18
Phosphorus %
0.3 0.27 0.26 0.31 0.29
Potassium %
1.18 1.14 1.02 0.83 1.04
Sulphur %
0.19 0.18 0.16 0.16 0.17
Organic carbon %
14.3 12.6 11 12.9 12.7
C:N ratio#
9.5 9.9 9.4 11.5 10.1
CEC*
23.15 43.62 41.79 69.58 44.5 *Cation Exchange Capacity #Carbon to nitrogen ratio.
Site Condo Condo Condo Averages
Test date May-09 Feb-09 Dec-09
Analyte Unit Ref 090466878 090264916 191270754
pH CaCl2
7.2 7.3 6.5 7
Electrical conductivity uS/cm
3327 2775 4221 3441
Total soluble salt ppm
10979 9158 13929 11355
Nitrogen %
1.15 1.03 1.42 1.2
Phosphorus %
0.22 0.2 0.23 0.22
Potassium %
1 0.85 1.23 1.03
Sulphur %
0.14 0.11 0.15 0.13
Organic carbon %
10.6 8.18 13.5 10.8
C:N ratio#
9.2 8:01 9.5 8.90
CEC*
35.27 12.49 43.14 30.3
*Cation Exchange Capacity #Carbon to nitrogen ratio.
Compost from both sites was also tested for harmful microbes such as E.coli, Legionella, Listeria, Salmonella. They were also tested for heavy metal and pesticide contaminants.

GROUNDSWELL - Final Agronomy Report
CHRIS HOUGHTON AGRICULTURAL PO Box 18 Crookwell NSW 2583 (02) 48320803 Page 12
5.2 Comparing the composts on a nutrient basis.
The key nutrients applied in broadacre farming enterprises are nitrogen and phosphorus, and at times potassium and sulphur. Unfortunately sulphur levels are normally very low in compost and hence its’ contribution is usually disregarded in compost. There are also useful levels of magnesium in compost (Ref 1 & 6) but for this work they are disregarded. In other industries such as vegetable production where magnesium uptake is high, the magnesium contribution would have been considered. There are some micro nutrients but the quantities vary considerably depending on the source materials, so composts are not normally considered to be a reliable source of micro nutrients. In regard to nutrients levels, the average nitrogen content in compost from both sites was around 1.2% on a dry weight basis; fairly typical levels for compost. Based on the assumption that 20 to 30 per cent of compost nitrogen would be available to a crop following application (Ref 1 & 6), 20 cubic metres of compost is likely to contribute 22 to 32 kg of plant available nitrogen. This is equivalent to 50 to 69 kg of urea, a common nitrogen fertiliser. Phosphorus levels at both sites above averaged close to 0.25% of dry weight. Hence 20 cubic metres of the compost would contain 22.5 kg of phosphorus. Based on the assumption that 40% of the phosphorus would be available to a crop following application, this would mean 9 kg/available phosphorus per hectare. Equivalent to 100 kg of superphosphate.
Potassium levels at both sites above were very close to 1% of dry weight. Hence 20 cubic metres of the compost would contain 90 kg of potassium, which would be almost totally available. This would be equivalent to 180 kg of muriate of potash, a common potassium fertiliser.
Note: The above calculations assume 40 % moisture content and a density of 0.75 t/m3.
GROUNDSWELL - Final Agronomy Report
CHRIS HOUGHTON AGRICULTURAL PO Box 18 Crookwell NSW 2583 (02) 48320803 Page 13
6 TRIAL DESIGN AND COMPOST RATES APPLIED
The rates of compost used in the trials are relatively low compared to the rates commonly used in horticulture and land reclamation. As the main uses of compost in the past have been in amenity and production horticulture, the quantities of compost applied have commonly been very high. In horticulture the cost of the compost is relatively low in relation to potential financial returns, when the overall cost structure of those enterprises is considered. Financial returns are lower in agriculture, so if compost is to be used as a source of nutrients and possibly as a soil conditioner, the costs associated with its’ use need to be comparable to the cost of fertilisers used in agriculture. It needs also to be remembered that freight and spreading costs are higher with compost per kg of nutrients, than for manufactured fertilisers.
Rates of compost in the trials varied between 5 m³ and 20 m³ per hectare. It is not uncommon in horticulture for rates of up to 50 m³ per hectare to be applied. For compost to be a serious consideration in agriculture, it needs to be competitive on a cost/benefit basis. The agronomy trials have been designed with agricultural uses in mind. The potential quantities of compost that could be produced through extensive production of urban waste (UW) compost is potentially larger than can be used for home garden and other horticultural uses. Councils need to get an adequate financial return for the compost to cover their expenses incurred in collection, source separation, and composting. However the price of the end product will be determined by market forces. The compost must be competitively priced with other products if it is to be accepted in the market place. There is plenty of optimism, a degree of uncertainty, and a little scepticism about how UW compost will perform in the market place. The data generated from these trials will be instrumental in ensuring that:
1. UW compost can be used safely in horticulture and agriculture
2. UW compost can be used confidently as a source of nutrients
3. The additional benefits of UW compost such as soil carbon and soil water retention
improvements are appreciated.

GROUNDSWELL - Final Agronomy Report
CHRIS HOUGHTON AGRICULTURAL PO Box 18 Crookwell NSW 2583 (02) 48320803 Page 14
7 TESTING FOR WEEDS AND CONTAMINANTS
As part of the ongoing screening for weeds and contaminants, a small trial was conducted with mature compost samples which had been collected at various intervals from the two council composting sites. The trial was not designed to provide a guarantee that the compost was free of weeds and contaminants, but was conducted more as an initial screening. There is a possibility that such a trial design could be used by councils as part of their quality assurance (QA) program in the preparation, storage and handling of Groundswell compost. The purpose of the evaluation conducted with the Groundswell compost is to determine firstly whether the compost samples are contaminated with any chemical, substance or material that may restrict plant growth, and secondly whether there are any viable weed seeds or plant propagules in the compost and if so, what types of weeds. The idea for this evaluation comes from the Australian Standard for Composts, soil conditioners and Mulches (AS 4454 – 2003), Appendix M- Method of Determining Toxicity to Plants. Trail was conducted during over a 7 week period from late September to late November. Four 25cm pots were used for each lot of samples. For each lot of compost samples the 4 pots were filled with pure compost. Two were sown to radish, and two were left not sown. See Appendix D for results of the evaluation. Another part of the screening for weeds and contaminants was to observe the trials where compost was used. This was particularly important, as every effort was taken not to cause problems at the trial sites. There were no unusual weeds seen, and no evidence that any of the compost adversely affected plant growth. There were some common weeds of high fertility sites, and in particular fat hen (Chenopodium album), that was found where the compost was dumped at the two Goulburn grazing trial sites. No problem weeds were found. To determine whether the compost was suitable for on-farm use, the various mature compost piles were tested regularly for contaminants, heavy metals and harmful microbes such as E.coli and salmonella.

GROUNDSWELL - Final Agronomy Report
CHRIS HOUGHTON AGRICULTURAL PO Box 18 Crookwell NSW 2583 (02) 48320803 Page 15
8 OUTCOMES AND OBSERVATIONS
8.1 Grazing Trial Sites Two sheep and cattle pasture grazing sites were initially chosen for Goulburn in 2009, and continued in 2010. Another cropping trial was established near Goulburn in 2010.
Each of the two Goulburn pasture trials involves a small plot trial and a triple paddock comparison. A small plot trial has been established to ensure that scientifically valid data is generated, and for comparisons to be made with other conventional fertilisers and soil ameliorants. The aim of the 3 paddock trial was to test actual paddock performance. No pasture dry matter cuts were taken in the 3 paddock trial. Data was extrapolated from livestock grazing records from grazing charts.
8.1.1 Narrambulla trial
Site Details
Narrambulla belongs to the Divall family. The property is presently undergoing progressive pasture improvement but the paddock where the trial is located was not sown down to improved pasture at the time of trial commencement. It has since been sown to a perennial ryegrass base in April 2010. In 2009, at the commencement of the trial, the paddock was dominated by native species, annual grasses, broadleaf weeds and subterranean clover. Narrambulla is located approximately 20 km east of Goulburn.
The site soils are predominantly sandy loams, overlaying poorly decomposed and stony subsoils. The relief of the site chosen varies from gentle slope to ridgeline, and the soil depth varies accordingly, being shallower on the upper slope. The soil test results from the start of the trial show that the soils to have following features:
Topsoil (0 – 10 cm)
Analyte Result Unit Opt Range Comment pH (CaCl2) 5.1 5.2 - 6 OK for this soil type
Aluminium 2.2 % <5 OK Organic Carbon 2.4 % 2 – 5 Good
Divall’s trial
GROUNDSWELL - Final Agronomy Report
CHRIS HOUGHTON AGRICULTURAL PO Box 18 Crookwell NSW 2583 (02) 48320803 Page 16
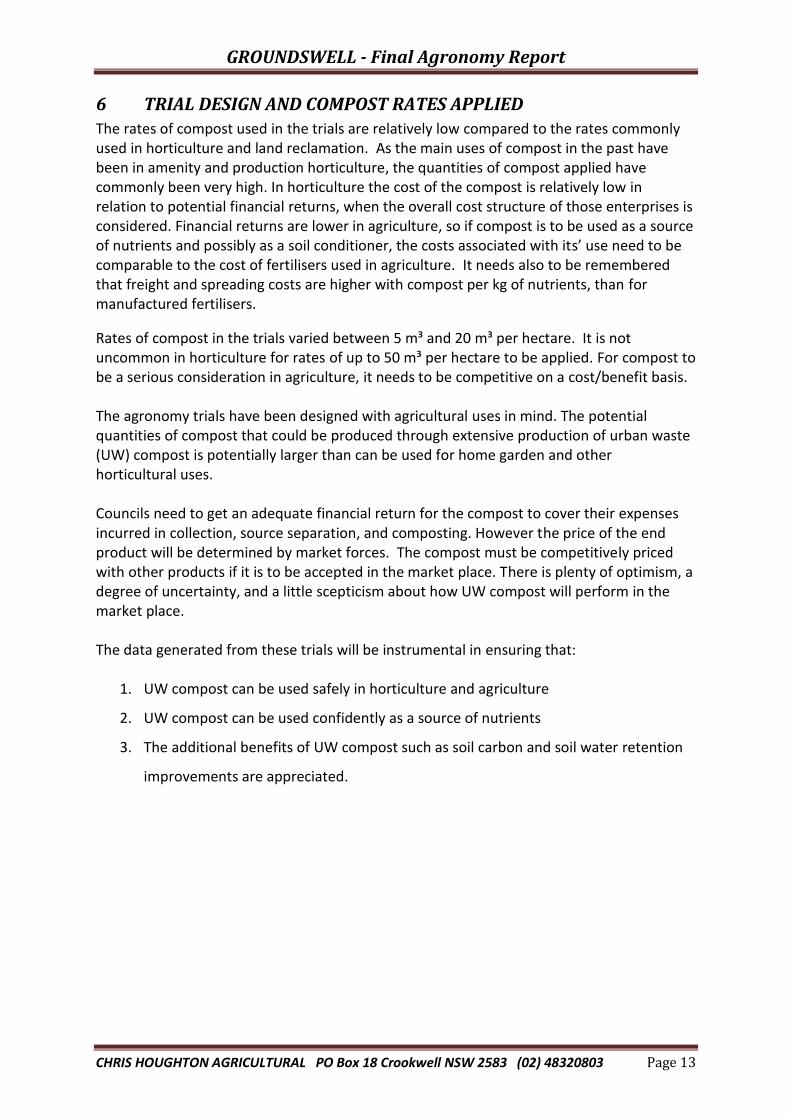
Phosphorus (Colwell) 13 mg/kg 25 - 35 Very low Potassium 0.23 meq/100g 0.5 – 0.9 Very low Sulphur (KCl 40) 5.2 mg/kg 10 - 25 Very low Sodium 0.074 meq/100g Low
Sodium % of cations (ESP) 1.6 % <2% OK
Elec conductivity 0.05 dS/m <0.11 OK
CEC* 4.58 5 - 10 Adequate
Note: CEC = Cation exchange capacity. Subsoil (10 – 20 cm)
Analyte Result Unit Opt Range Comment pH (CaCl2) 4.5 5.2 - 6 OK for this soil type
Aluminium 22 % <5 High. Will restrict root growth of sensitive plants.
Trial Design
NOTE: See Appendix A for replicated plot trial design details.
Treatments – Replicated trial 1 Compost at 5 m3/ha 5 Superphosphate at 250 g/ha 2 Compost at 10 m3/ha 6 Bio-phos at 125 kg/ha 3 Compost at 20 m3/ha 7 Bio-phos at 250 kg/ha 4 Superphosphate at 125 kg/ha 8 Control
Replicated trial site
N
GROUNDSWELL - Final Agronomy Report
CHRIS HOUGHTON AGRICULTURAL PO Box 18 Crookwell NSW 2583 (02) 48320803 Page 17
Trial Results
Herbage Yield
Small Plot Replicated Trial (See Appendix A for Trial Plan)
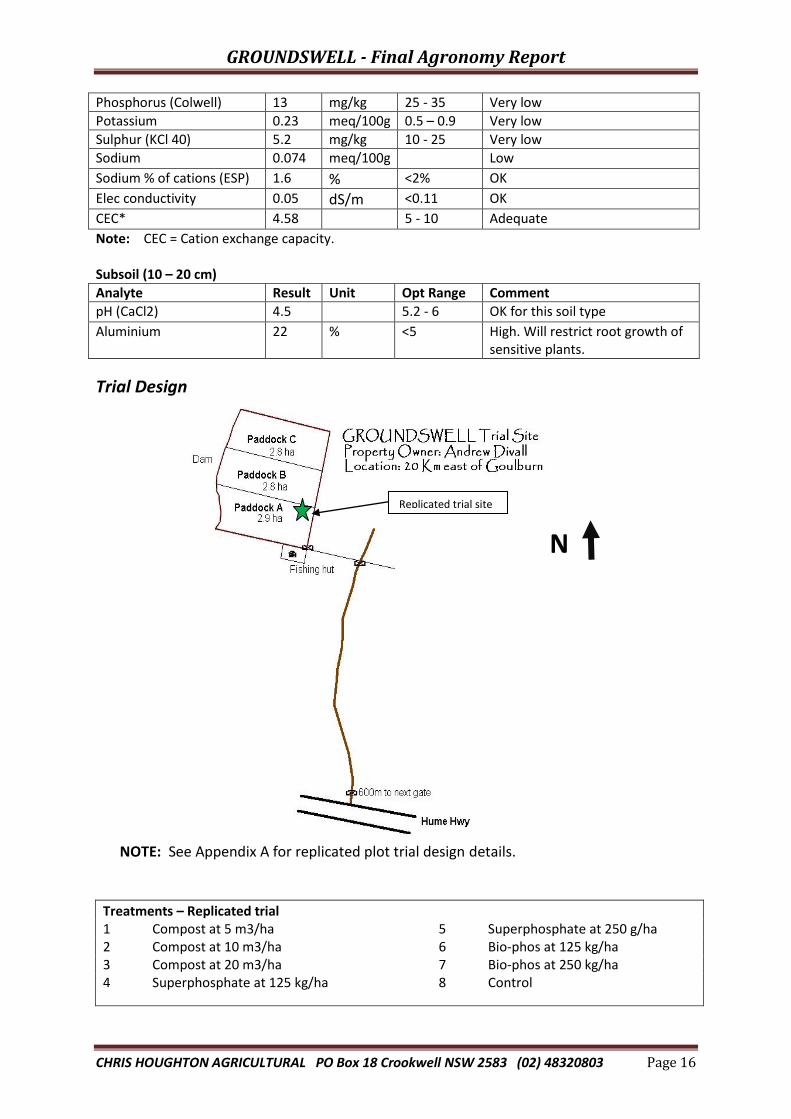
Herbage Dry Matter Cuts 2009 (One only taken in Nov 2009)
Treatments 1 2 3 4 5 6 7 8
Rep A 1590 2252 3683 1862 3918 4422 2098 1823
Rep B 2475 3945 3945 2717 3076 3091 2760 2475
Rep C 1162 2137 3055 2137 1633 1781 1633 2239
Average(kg/DM/ha) 1742 2778 3561 2239 2876 3098 2164 2179
Comments:
There was a linear response to the compost treatments (T1, T2, & T3). In interpreting this response, it needs to be acknowledged that Treatment 1, the low compost treatment, actually produced less than the control treatment. Even taking this into account there was a definite measurable response. The medium and high compost treatments (T2 & T3) were both in front of the superphosphate treatments (T4 & T5).
Herbage Dry Matter Cuts 2010
Treatment 1 2 3 4 5 6 7 8
Mar 2010 cut* 4734 4334 4833 3995 4285 4689 3325 4191
Aug 2010 cut* 171 326 882 257 317 123 108 134
Nov 2010 cut* 2459 3058 3870 2989 3261 2046 2031 1853
Total (Kg/DM/Ha) 7365 7718 9585 7242 7863 6857 5464 6178
0
500
1000
1500
2000
2500
3000
3500
4000
1 2 3 4 5 6 7 8
kg/D
M/h
a
Treatments
Narrambulla herbage 2009
Average

GROUNDSWELL - Final Agronomy Report
CHRIS HOUGHTON AGRICULTURAL PO Box 18 Crookwell NSW 2583 (02) 48320803 Page 18
Comments:
The key points are:
There is a linear response to the three different rates of compost (T1, T2, T3).
There is also a linear response to the two different rates of superphosphate (T4 & T5).
Although similar production was achieved from the low and medium rates, production from high rate of compost exceeded the high superphosphate application.
The initial application of VRM microbial activator solution
Grazing trial results
Due to the difficulties in keeping stock in the monitor paddocks, there was only one recorded grazing event. The paddocks looked to have the expected growth in line with the different treatments, as the compost and superphosphate treated paddocks were visually
0
2000
4000
6000
8000
10000
12000
1 2 3 4 5 6 7 8
kg/D
M/h
a
Treatments
Narrambulla herbage 2010
Total

GROUNDSWELL - Final Agronomy Report
CHRIS HOUGHTON AGRICULTURAL PO Box 18 Crookwell NSW 2583 (02) 48320803 Page 19
well ahead on the non-fertilised paddock. All three paddocks had been sown in April to Italian ryegrass which looked very impressive by the spring. The results from the one recorded grazing event were as follows: Paddock DSE/ha Comments A 2.7 Treatment history: No treatment in either 2009 or 2010.
Discussion: Visually had same number of ryegrass plants but lacked vigour and were poorly tillered.
B 3.72 Treatment history: 10m³ compost in both 2009 & 2010 (20 m³ in total). Discussion: Very vigorous well tillered plants with a dark green colour indicating good nitrogen levels.
C 3.72 Treatment history: 250kg/ha superphosphate in 2009 & 2010 (500 kg/ha total). Discussion: Appeared less vigorous than paddock B and lacked the same deep green colour.
Note: The compost (B)and superphosphate (C) plots appeared to have the potential to carry 10 – 12 DSE/ha. Visually it appeared that the carrying capacity in the no-fertiliser plot (A) would have been 30 – 40% less than this.
Herbage Quality
Herbage quality was not determined in 2009 due to the poor seasonal conditions and subsequent low pasture quality. The sowing of Italian ryegrass in 2010 was an attempt to improve the pasture quality potential, as well as to increase herbage yield. Where the higher rates of compost were applied (T2, T3), the ryegrass established quickly, hence there was a visual improvement in the quality of pasture grown on these plots. Feedtests were conducted in late October 2010 to explore this further. The results are shown below.
CP (% DM) ME (MJ/ kg/DM) DMD (% DM) NDF (% DM)
Treatment 1 8.9 10.5 70.3 46.2
Treatment 2 8.4 10.5 70.4 47.8
Treatment 3 6.5 10.7 71.7 47.3
Treatment 4 9.4 10.6 70.9 45.2
Treatment 5 10.8 10.5 70.5 44.1
Treatment 8 8.9 10.9 68.6 44.7 CP = Crude Protein % ME=Metabolisable energy in megajoules per kg dry matter DMD = Dry matter digestibility NDF=Neutral detergent fibre (measure of fibre)
8.9 8.46.5
9.410.8
8.9
0
2
4
6
8
10
12
T 1 T 2 T 3 T 4 T 5 T 8
% D
M
Crude Protein
10.5 10.5
10.710.6
10.5
10.9
10.3
10.4
10.5
10.6
10.7
10.8
10.9
11
T 1 T 2 T 3 T 4 T 5 T 8
MJ/
kg/D
M
Metabolisable Energy

GROUNDSWELL - Final Agronomy Report
CHRIS HOUGHTON AGRICULTURAL PO Box 18 Crookwell NSW 2583 (02) 48320803 Page 20
The differences in the protein are significant. Superphosphate (T4 & T5) appears to have caused increased clover growth leading to increased soil nitrogen and hence better herbage protein. There could have been some nitrogen drawdown associated with the highest rate of compost (T3). This could have led to lower available nitrogen and hence lower crude protein. It should be noted that all of the protein levels are relatively low compared to the Strathmere trial. This has more to do with the stage of growth at time of sampling than with pasture quality over the long term. It is still useful to compare results across the trial. The metabolisable energy levels are difficult to explain with the control (T8) being the highest. No conclusions should be drawn from this.
As there was more ryegrass in the high compost plot (T2 & T3), digestibility improved as it is a highly digestible species. There is some increase in fibre with the compost plots (T1 – T3), but the differences across all plots are negligible.
Treatments 1 Compost at 5 m3/ha 5 Superphosphate at 250 g/ha 2 Compost at 10 m3/ha 6 Bio-phos at 125 kg/ha 3 Compost at 20 m3/ha 7 Bio-phos at 250 kg/ha 4 Superphosphate at 125 kg/ha 8 Control
Note: Biophos was not evaluated for feed quality.
Soil Biology
Although soil biology is a key measure of productive soils, and a broad range of beneficial organisms should be present, it is less well understood how to reliably evaluate soil biology. The purpose of this trial work was to determine whether the application of urban waste compost was safe, feasible and cost effective. Extensive testing was done at the composting site to determine that the compost was safe and did not contain unacceptable levels of the bad microbes such as salmonella, faecal coliforms and E.coli. The testing that was done in these trials was quite general, and done with the aim of determining whether there was any
70.3 70.4
71.770.9
70.5
68.6
67
68
69
70
71
72
T 1 T 2 T 3 T 4 T 5 T 8
% D
M
Digestibility
46.2
47.8 47.3
45.244.1
44.7
42
43
44
45
46
47
48
49
T 1 T 2 T 3 T 4 T 5 T 8
% D
M
Neutral Detergent Fibre

GROUNDSWELL - Final Agronomy Report
CHRIS HOUGHTON AGRICULTURAL PO Box 18 Crookwell NSW 2583 (02) 48320803 Page 21
correlation between productivity changes due to compost, and changes in the levels of any microbes. No such correlations were found. The Soil Foodweb Laboratory in Lismore was used for the testing. Discussion on soil microbes from their literature is shown in Appendix B. There was no comparison made at the start of the trial against the end, as time of year and soil moisture would have differed, and hence so would the occurrence and activity of microbes. The soil biology test results are shown below.
Organisms Unit Optimum value T 1 T 2 T 3 T 4 T 5 T 8
Bacteria No. per field >500 >500 >500 >500 >500 25-500 25-500
Bacteria Rating Good + V Good V Good V Good V Good V Good V Good
Fungi % >20% 75% 55% 30% 40% 40% 30%
Fungi Rating Good + V Good V Good Good Good Good Good
Fungal Diameter Micron >2.5 2.0-5.0 2.0-5.0 2.0-3.0 2.5-4.0 2.0-5.0 2.0-5.0
Actinobacteria % NA 5% No 10% 5% 5% 15%
Protozoa - Flangellates H,M,L,No M,H No No No No No No
Protozoa - Amoebae H,M,L,No M,H No No No No No No
Protozoa - Ciliates H,M,L,No M,H No No No No No No
Nematodes Yes/No Yes * No No No No No No
Overall sample rating Poor Poor Poor Poor Poor Poor
H = high M=Medium L=Low No=Not observed * Depends to a large extent on the type T=Treatment
Any improvements in activity of the various organisms should be compared to the control (T8). There is a slight correlation between fungal activity and the compost treatments (T1 – T3), but nothing significant.
Preparing the compost pile after the first application of VRM microbial activator solution.

GROUNDSWELL - Final Agronomy Report
CHRIS HOUGHTON AGRICULTURAL PO Box 18 Crookwell NSW 2583 (02) 48320803 Page 22
Soil Nutrients
As discussed earlier there is a reasonable amount of nitrogen, phosphorus and potassium in compost, as well as small amounts of some micro nutrients. A sample of the test report showing the final soil nutrient tests can be seen in Appendix C. The key features are summarised as follows.
Nitrate nitrogen is evaluated in the trials, even though it is not recognised as a reliable means of quantifying soil nitrogen. It does however give a picture of what is happening with nitrogen across the trial, as nitrate is the main plant available form of nitrogen in soil.
It is interesting that there could have been a reduction in soil nitrogen as a result of compost application (T1 – T3). The opposite happened at the Strathmere site. No conclusion can be drawn from this.
There appears to have been an impact made on soil phosphorus levels due to both compost (T1 – T3) and superphosphate (T4 & T5)when compared to the control (T8). It makes sense that the high rate of superphosphate raised Colwell phosphorus levels the most. The Colwell phosphorus level was 13 when the soil was originally tested in November 2008, so the application of compost appears to have made a reasonable improvement to phosphorus levels.
As discussed previously, potassium in compost is available in reasonable quantities and is in a very soluble form. Supporting this, there appears to have been a significant contribution
2.72.3
1
1.6 1.5
2.1
0
0.5
1
1.5
2
2.5
3
T1 T2 T3 T4 T5 T8
mg/
kg
Narrambulla - Nitrate N
1518 17 18
25
11
0
5
10
15
20
25
30
T1 T2 T3 T4 T5 T8
mg/
kg
Narrambulla - Colwell P
120 110
150
85 78110
0
20
40
60
80
100
120
140
160
T1 T2 T3 T4 T5 T8
mg/
kg
Narrambulla - Available K
3.3 4.2 4.4
11
18
3.90
5
10
15
20
T1 T2 T3 T4 T5 T8
mg/
kg
Narrambulla - Sulphur

GROUNDSWELL - Final Agronomy Report
CHRIS HOUGHTON AGRICULTURAL PO Box 18 Crookwell NSW 2583 (02) 48320803 Page 23
made to soil potassium levels by the compost (T1 – T3). This was the case also at the Strathmere site. This is significant in that potassium is an expensive nutrient to increase through fertiliser application. If compost is able to make a significant difference to potassium levels, it may well play a special role on not only low potassium soils, while at the same time contributing to improvements in structure and organic carbon. As was expected the contribution of sulphur in compost (T1 – T3) was negligible, as is also the case with animal manures.
Soil Carbon
Soil carbon has many positive correlations with healthy soil. It is reported to significantly improve soil microbial activity, nutrient and water holding ability of soils, and is also connected to improvements to soil structure. The compost (T1 – T3) has appeared to make a difference to organic carbon levels, although it must be noted that the range on the graph is quite narrow. Considering this fact and that it is such a short term trial, not too much should be read into these results.
Soil Structure
Any changes to soil structure will be a long term consideration, especially when applying such low rates. It was decided that measurements of changes to slaking and dispersion should to taken determine the impact of compost on soil structure. Slaking and dispersion are useful indicators of aggregate stability which is essential for good soil structure.
2.7
2.9 2.9
2.7
2.8
2.6
2.45
2.5
2.55
2.6
2.65
2.7
2.75
2.8
2.85
2.9
2.95
T1 T2 T3 T4 T5 T8
%
Narranbulla - Organic Carbon
4 4 4 4 4 4
0
0.5
1
1.5
2
2.5
3
3.5
4
4.5
T1 T2 T3 T4 T5 T8
Dis
pe
rsio
n In
de
x
Narrambulla - Dispersion Index

GROUNDSWELL - Final Agronomy Report
CHRIS HOUGHTON AGRICULTURAL PO Box 18 Crookwell NSW 2583 (02) 48320803 Page 24
The soil at this site is very sandy, has a low clay content and weakly structured. For some reason it has a high incidence of dispersion. Improvements to levels of organic matter through compost or additional plant matter resulting from improved growth, will all help this situation. A longer time frame than has been used in this trial would be required to determine whether noticeable improvements to soil structure could occur at this site.
Slaking results
Treatment 1 Partial Slaking is directly linked to organic matter / organic carbon. Although not evident from this test, theory suggests that as with dispersion, organic matter can make a significant difference. The short time frame of the trial needs to be considered when interpreting such results.
Treatment 2 Partial
Treatment 3 Partial
Treatment 4 Partial
Treatment 5 Partial
Treatment 8 Water Stable
See Appendix D for information on slaking and dispersion.
Soil Water Holding Capacity
The test for soil WHC involved a point in time comparison at the end of the 2 year trial period. The soils were core sampled to 10 cm a day or so after a significant rainfall event, weighed, dried and re-weighed. Samples were taken from the replicated trials. There appears to be a correlation to high levels of nutrients, from compost (T1 – T3) and fertiliser(T4 & T5), to improved plant growth and improved WHC. If this a the correct assumption, pasture vigour and the corresponding increase in plant material associated with this may be equal to or exceed the contribution of the compost at the lower rates to improving soil water holding capacity.
Discussion
At first glance these soils appear very infertile and being sandy with what would appear to be low water and nutrient holding capacity. It would appear that a limited level of production could be achieved from them. However in 2010 with the excellent rainfall received, a very respectable level of production was achieved from both the compost and superphosphate treatments. There were also several other interesting outcomes.
16.0
15.5
16.616.7
16.5
15.8
14.815.015.215.415.615.816.016.216.416.616.817.0
T1 T2 T3 T4 T5 T8
%
Narrambulla Soil WHC

GROUNDSWELL - Final Agronomy Report
CHRIS HOUGHTON AGRICULTURAL PO Box 18 Crookwell NSW 2583 (02) 48320803 Page 25
A very good herbage yield response was achieved in 2010. In fact the high compost treatment produced 18% more herbage than the high superphosphate treatment, and 35% more than the control.
Sowing Italian ryegrass boosted pasture production in 2010. However the major contributor to pasture herbage at this site was the tremendous bulk of feed produced by summer growing annual grasses in December 2009 due to the good rainfall received at that time. This did not occur to the same extent at Strathmere.
Grazing outcomes indicated a response to both compost and fertiliser over the control, however the results was not conclusive as not all grazing events were recorded.
There was some increase in phosphorus levels at the high compost and superphosphate rates, over and above grazing removal. This is significant as phosphorus is a very expensive nutrient to increase in pasture systems.
There was a significant increase in potassium levels with compost application.
There was a significant increase in sulphur levels on the superphosphate treatments, but no response at all on the compost treatments as expected.
There was a noticeable increase in soil carbon with the medium and high compost applications, and with the high superphosphate. This provides weight to the thinking that additional growth due to extra nutrients, and the additional biomass in plant residues and roots, make a considerable contribution to organic carbon, possibly over and above the organic carbon actually applied in compost.
There appeared to be an increase in soil water holding capacity in treatments where increased herbage was produced.

GROUNDSWELL - Final Agronomy Report
CHRIS HOUGHTON AGRICULTURAL PO Box 18 Crookwell NSW 2583 (02) 48320803 Page 26
8.1.2 Strathmere Trial
Site Details
“Strathmere” is a grazing property owned by the Sieler family. It has a range of soil types from undulating ridges with shallow soils through to productive alluvial flats. The property is located approximately 10km south west of the Goulburn city limits.
The trial site is on the creek flats, and the pasture base is phalaris and sub-clover. The soils on the site are derived from a mixture of colluvial material that had washed down from the upper slopes, and alluvial material derived from sediment from the flooding of the creek. The soil tests results at the start of the trial showed that the soils to have following features: Topsoil (0 – 10 cm)
Analyte Result Unit Opt Range Comment pH (CaCl2) 4.8 5.2 - 6 OK for regional soils
Aluminium 1.2 % <5 Good Organic Carbon 3.8 % 2 – 5 Good Phosphorus (Colwell) 23 mg/kg 25 - 35 Very low Potassium 0.17 meq/100g 0.5 – 0.9 Very low Sulphur (KCl 40) 18 mg/kg 10 - 25 Good Sodium 0.44 meq/100g Mildly sodic
Sodium % of cations (ESP) 4.0 % <2% Mildly sodic
Elec conductivity 1.1 dS/m <1.2 OK
CEC* 11 5 - 10 Good
Note: CEC = Cation exchange capacity. Subsoil (0 – 10 cm)
Analyte Result Unit Opt Range Comment pH (CaCl2) 4.3 5.2 - 6 Good for regional soils
Aluminium 12 % <5 High. Will restrict root growth of sensitive plants.
“Strathmere” trial

GROUNDSWELL - Final Agronomy Report
CHRIS HOUGHTON AGRICULTURAL PO Box 18 Crookwell NSW 2583 (02) 48320803 Page 27
Trial Design
NOTE: See Appendix A for replicated plot trial design details.
Treatments – Replicated plot trial 1 Compost at 5 m3/ha 5 SSP at 250 g/ha 2 Compost at 10 m3/ha 6 Bio-phos at 125 kg/ha 3 Compost at 20 m3/ha 7 Bio-phos at 250 kg/ha 4 SSP at 125 kg/ha 8 Control
Trial Results
Herbage Yield - Small Plot Replicated Trial (See Appendix A for Trial Plan)
Herbage Dry Matter Cuts 2009 (One only taken in Nov 2009)
Treatment 1 2 3 4 5 6 7 8
Rep A 2660 4452 2586 2598 3278 2850 2374 2483
Rep B 3602 2910 3930 2108 3181 2475 2003 2790
Rep C 2912 3366 3730 4058 3240 2751 2419 3096
Ave(kg/DM/ha) 3058 3576 3415 2922 3233 2692 2266 2790
Replicated trial site
N

GROUNDSWELL - Final Agronomy Report
CHRIS HOUGHTON AGRICULTURAL PO Box 18 Crookwell NSW 2583 (02) 48320803 Page 28
(Average of 3 reps)
Comment:
A noticeable response to the three rates of compost, (T1 – T3), above the control
A noticeable response to the two rates of SSP, (T4 & T5), slightly less than the compost.
The results are similar to those from the Narrambulla trial. Herbage Dry Matter Cuts 2010
Treatment 1 2 3 4 5 6 7 8
Mar 2010 cut 2056 2089 2849 2054 2276 2365 1931 2126
Aug 2010 cut 509 506 638 472 671 479 433 631
Nov 2010 cut 2127 2261 3041 2315 3491 2033 1946 2402
Total (Kg/DM/ha) 4692 4855 6528 4841 6438 4876 4310 5159
0
500
1000
1500
2000
2500
3000
3500
4000
1 2 3 4 5 6 7 8
kg/D
M/h
a
Treatment
Strathmere herbage 2009
0
1000
2000
3000
4000
5000
6000
7000
1 2 3 4 5 6 7 8
kg/D
M/h
a
Treatment
Strathmere herbage 2010
Total
GROUNDSWELL - Final Agronomy Report
CHRIS HOUGHTON AGRICULTURAL PO Box 18 Crookwell NSW 2583 (02) 48320803 Page 29
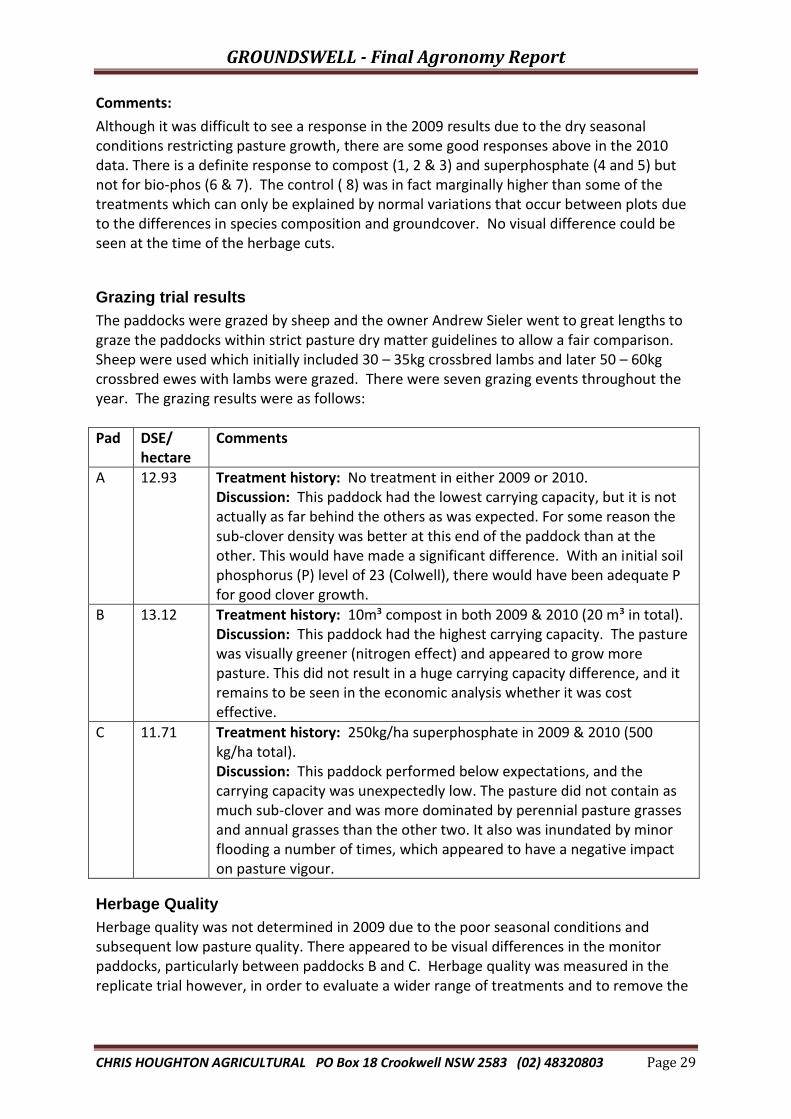
Comments:
Although it was difficult to see a response in the 2009 results due to the dry seasonal conditions restricting pasture growth, there are some good responses above in the 2010 data. There is a definite response to compost (1, 2 & 3) and superphosphate (4 and 5) but not for bio-phos (6 & 7). The control ( 8) was in fact marginally higher than some of the treatments which can only be explained by normal variations that occur between plots due to the differences in species composition and groundcover. No visual difference could be seen at the time of the herbage cuts.
Grazing trial results
The paddocks were grazed by sheep and the owner Andrew Sieler went to great lengths to graze the paddocks within strict pasture dry matter guidelines to allow a fair comparison. Sheep were used which initially included 30 – 35kg crossbred lambs and later 50 – 60kg crossbred ewes with lambs were grazed. There were seven grazing events throughout the year. The grazing results were as follows:
Pad DSE/ hectare
Comments
A 12.93 Treatment history: No treatment in either 2009 or 2010. Discussion: This paddock had the lowest carrying capacity, but it is not actually as far behind the others as was expected. For some reason the sub-clover density was better at this end of the paddock than at the other. This would have made a significant difference. With an initial soil phosphorus (P) level of 23 (Colwell), there would have been adequate P for good clover growth.
B 13.12 Treatment history: 10m³ compost in both 2009 & 2010 (20 m³ in total). Discussion: This paddock had the highest carrying capacity. The pasture was visually greener (nitrogen effect) and appeared to grow more pasture. This did not result in a huge carrying capacity difference, and it remains to be seen in the economic analysis whether it was cost effective.
C 11.71 Treatment history: 250kg/ha superphosphate in 2009 & 2010 (500 kg/ha total). Discussion: This paddock performed below expectations, and the carrying capacity was unexpectedly low. The pasture did not contain as much sub-clover and was more dominated by perennial pasture grasses and annual grasses than the other two. It also was inundated by minor flooding a number of times, which appeared to have a negative impact on pasture vigour.
Herbage Quality
Herbage quality was not determined in 2009 due to the poor seasonal conditions and subsequent low pasture quality. There appeared to be visual differences in the monitor paddocks, particularly between paddocks B and C. Herbage quality was measured in the replicate trial however, in order to evaluate a wider range of treatments and to remove the

GROUNDSWELL - Final Agronomy Report
CHRIS HOUGHTON AGRICULTURAL PO Box 18 Crookwell NSW 2583 (02) 48320803 Page 30
variations that can occur in paddock sampling. Feedtests were conducted in late October 2010. The results are shown below.
CP (% DM) ME (MJ/kg/DM) DMD (% DM) NDF (% DM)
Treatment 1 14.9 9.4 64.2 52
Treatment 2 13.8 9.5 64.3 56
Treatment 3 16 9.5 64.8 51.3
Treatment 4 15.6 9.5 64.4 51.5
Treatment 5 16.7 9.5 64.9 50.2
Treatment 8 14 9.3 63.5 52.3 CP = Crude Protein % ME=Metabolisable energy in megajoules per kg dry matter DMD = Dry matter digestibility NDF=Neutral detergent fibre (measure of fibre)
The differences in the protein are significant. Superphosphate (T4 & T5) appears to have caused increased clover growth leading to increased soil nitrogen and hence better protein. The suspected issue of nitrogen drawdown associated with the higher rates of compost (T2 & T3) at the Narrambulla site, has not occurred here. All treatments appear to have increased metabolisable energy over the control (T8).
The variations in digestibility are negligible as they are all too close to separate. No conclusion can be drawn from this. Regarding the NDF results, there is no appreciable
14.9 13.816 15.6 16.7
14
0
2
4
6
8
10
12
14
16
18
T1 T2 T3 T4 T5 T8
% D
M
Crude Protein
9.4
9.5 9.5 9.5 9.5
9.3
9.2
9.25
9.3
9.35
9.4
9.45
9.5
9.55
T1 T2 T3 T4 T5 T8
MJ/
kg/D
M
Metabolisable Energy (ME)
64.2 64.364.8
64.464.9
63.5
62.5
63
63.5
64
64.5
65
65.5
T1 T2 T3 T4 T5 T8
% D
M
Digestibility
52
56
51.3 51.550.2
52.3
46
48
50
52
54
56
58
T1 T2 T3 T4 T5 T8
% D
M
Neutral Detergent Fibre (NDF)

GROUNDSWELL - Final Agronomy Report
CHRIS HOUGHTON AGRICULTURAL PO Box 18 Crookwell NSW 2583 (02) 48320803 Page 31
difference between any treatments except for the medium compost treatment (T2). There is no obvious reason for this.
Soil Biology
The soil biology test results for Strathmere are shown below.
Organisms Unit Optimum value T 1 T 2 T 3 T 4 T 5 T 8
Bacteria No. per field >500 >500 >500 >500 >500 >500 >500
Bacteria Rating Good + V Good V Good V Good V Good V Good V Good
Fungi % >20% 70% 70% 50% 50% 65% 60%
Fungi Rating Good + V Good V Good V Good V Good V Good V Good
Fungal Diameter Micron >2.5 2.0-5.0 2.0-5.0 2.0-4.0 2.0-3.5 2.5-4.0 2.0-4.5
Actinobacteria % NA No 5% 5% 5% No No
Protozoa - Flangellates H,M,L,No M,H No No No No No No
Protozoa - Amoebae H,M,L,No M,H No No No No No No
Protozoa - Ciliates H,M,L,No M,H No No No No No No
Nematodes Yes/No Yes * No No No No No No
Overall sample rating Poor Poor Poor Poor Poor Poor
H = high M=Medium L=Low No=Not observed * Depends to a large extent on the type T=Treatment
Treatment 8 was the control, so any improvements in activity of the various organisms should be compared to this treatment. There is a possible correlation between fungal and actinobacteria activity and compost, but nothing significant. No conclusions can be drawn from this.
Compost being delivered to the Strathmere site.

GROUNDSWELL - Final Agronomy Report
CHRIS HOUGHTON AGRICULTURAL PO Box 18 Crookwell NSW 2583 (02) 48320803 Page 32
Soil Nutrients
The key features of the final Strathmere soil tests are summarised as below. A sample of the test report showing the final soil nutrient tests can be seen in Appendix C.
Nitrate is the main plant available form of nitrogen in soil. It is interesting that at this site there was an increase in soil nitrate as a result of compost application. Although this is what was expected the opposite happened at the Narrambulla site. These results represent what should be expected, albeit with the control (T8) being a bit high. Well matured compost with the C:N ratio below 20 should make a reasonable nitrogen contribution.
The colwell phosphorus results show a spike for the highest compost (T3) and superphosphate (T5) applications which is to be expected. No other conclusion can be drawn from this other than that as expected, applications of superphosphate will increase soil phosphorus, and it appears that compost too will do the same if applied in adequate quantities. It should be noted that the replicated trial site and the paddock have different soil phosphorus levels. The Colwell phosphorus in the test above of the paddock in late 2008 shows a reading of 23. However the replicated trial site has consistently been 11 for the control (T8). This demonstrates the spatial variations that can occur when soil testing, and in this case the two samples have only been taken 80m apart in the same paddock. When retested in late 2009 the phosphorus result for monitor paddock A, closest to the trial, was again 23, which confirms that the result was valid.
1
2.3
3.9
1.5
4.1
2
0
0.5
1
1.5
2
2.5
3
3.5
4
4.5
T1 T2 T3 T4 T5 T8
mg/
kg
Strathmere - Nitrate N
12 12
1815 16
13
0
5
10
15
20
T1 T2 T3 T4 T5 T8
mg/
kg
Strathmere - Colwell P
66 64
90
4862 58
0102030405060708090
100
T1 T2 T3 T4 T5 T8
mg/
kg
Strathmere - Avail Potassium
5.3 6.2 5.2
12
7.76.1
0
2
4
6
8
10
12
14
T1 T2 T3 T4 T5 T8
mg/
kg
Strathmere - Sulphur

GROUNDSWELL - Final Agronomy Report
CHRIS HOUGHTON AGRICULTURAL PO Box 18 Crookwell NSW 2583 (02) 48320803 Page 33
As discussed previously, potassium in compost is available in reasonable quantities and is in a very soluble form. Supporting this, there appears to have been a significant contribution made to soil potassium levels at the Strathmere site by the compost. This was the case also at the Narrambulla site. This reinforces the comments for Narrambulla that compost is a reliable source of potassium.
Treatments 1 Compost at 5 m3/ha 5 Superphosphate at 250 g/ha 2 Compost at 10 m3/ha 6 Bio-phos at 125 kg/ha 3 Compost at 20 m3/ha 7 Bio-phos at 250 kg/ha 4 Superphosphate at 125 kg/ha 8 Control
Soil Carbon
As with Narrambulla compost appears to make a difference to organic carbon levels, although again it must be noted that the range on the graph is quite narrow, and the results must be interpreted with caution. There is also a possibility that as with the Narrambulla trial that superphosphate application may have led to an increase in soil carbon levels. This raises the question, “Is it the added carbon in the compost or the additional plant material produced as a result of the compost and superphosphate application that has caused soil carbon to increase?”
Soil Structure
Measurements of changes to slaking and dispersion were undertaken to determine what impact the compost would make to soil structure. There is no evidence here to suggest that any of the treatments have contributed to the dispersion index ratings on this graph.
2.4
2.2
2.5
2.2
2.5
2.2
2.05
2.1
2.15
2.2
2.25
2.3
2.35
2.4
2.45
2.5
2.55
T1 T2 T3 T4 T5 T8
%
Strathmere - Organic Carbon
3
2
3
2 2
4
0
0.5
1
1.5
2
2.5
3
3.5
4
4.5
T1 T2 T3 T4 T5 T8
Dis
pe
rsio
n In
de
x
Strathmere - Dispersion Index

GROUNDSWELL - Final Agronomy Report
CHRIS HOUGHTON AGRICULTURAL PO Box 18 Crookwell NSW 2583 (02) 48320803 Page 34
A much longer period of continuous application would be required to bring about changes to soil structure through such small applications of compost.
Slaking results
Treatment 1 Partial No conclusions can be drawn from these results. The short time frame of the trial needs to be considered when interpreting such results. A much longer time frame than the period over which this trial was needed to prove or otherwise the influence of compost on slaking.
Treatment 2 Water Stable
Treatment 3 Partial
Treatment 4 Water Stable
Treatment 5 Water Stable
Treatment 8 Partial
See Appendix D for information on slaking and dispersion.
Soil Water Holding Capacity
No correlation can be drawn from this graph between high levels of compost and superphosphate, and improved WHC. A longer period of continuous application would be required to bring about changes to soil WHC through such small applications of compost.
Discussion
This site did not produce the quantity of herbage grown at the Narrambulla site, even though the rainfall received was similar. Initial consideration of the site along with the soil test results, indicated that the Strathmere site would be more productive than the Narrambula site. Strathmere had higher phosphorus, and sulphur levels, and higher CEC. Both sites had good soil pH and low available aluminium, however the herbage production achieved from the trials tells the real story, ie: what grows on the soils. The main difference between the sites is the slightly elevated sodium in the topsoil at Strathmere, which may have caused reduced growth. However the key features of the Strathmere site are:
Good herbage response to compost and superphosphate, especially in the 2nd year.
The results from the grazing trial supported the replicated plot trial outcomes.
There was a slight increase in pasture quality due to higher levels of nutrients through both compost and superphosphate.
17.317.8 18.0
18.4
19.1
18.2
16.0
16.5
17.0
17.5
18.0
18.5
19.0
19.5
T1 T2 T3 T4 T5 T8
%
Strathmere - Soil WHC

GROUNDSWELL - Final Agronomy Report
CHRIS HOUGHTON AGRICULTURAL PO Box 18 Crookwell NSW 2583 (02) 48320803 Page 35
There was a noticeable improvement in digestibility from both the compost and superphosphate treatments. This is possibly due to better clover growth, and more leafy grasses generally.
There was a very clear nitrate nitrogen response to both the compost and superphosphate, most likely due to better clover growth and nodulation, leading in an increase in nitrogen fixation.
There was a noticeable increase in phosphorus with both compost and superphosphate, increasing with higher rates.
There was a good increase in potassium levels by compost, increasing with higher rates.
Increased organic carbon levels appear to be linked to increased nutrients generally, rather than being attributed to either compost or superphosphate.
There were increases in soil water holding capacity for both compost and superphosphate at higher rates.

GROUNDSWELL - Final Agronomy Report
CHRIS HOUGHTON AGRICULTURAL PO Box 18 Crookwell NSW 2583 (02) 48320803 Page 36
8.2 CROPPING TRIAL SITES
Bungendore Cropping Trial A cropping trial was established in 2009 near Bungendore on the Southern Tablelands to determine what fit urban waste compost had in cropping in the high rainfall zone. The property known as ‘Landtasia’, owned by Richard Graham is a certified organic farm. It is situated to the east of Bungendore. Being an organic farm, care had to be taken with the trial to ensure that guidelines were adhered to as set by the organic farming accrediting body, the Biological Farmers of Australia (BFA). The crop grown was spelt, and ancient species of wheat. The compost used in the trial came from the Goulburn site.
Site Details
Trial location
Landtasia is approximately 20 km east of Bungendore and the trial is site about 800 m north of the Kings Highway on a part of the property known as “The Swamp”.
Soils The soil tests results showed the soils to have following features (See Appendix F for more details):
Topsoil (0 – 10 cm)
Analyte Result Unit Opt Range Comment pH (CaCl2) 6.1 5.2 - 6 V good for regional soils
Phosphorus (Colwell) 37 mg/kg 25 - 35 Very good Potassium 0.21 meq/100g 0.5 – 0.9 Very low Sulphur (KCl 40) 4.3 mg/kg 10 - 25 Very low Sodium 0.10 meq/100g Sodium % of cations (ESP) 1.5 % <2% OK Elec conductivity 0.09 dS/m <0.11 OK CEC* 6.5 5 - 10 OK
Notes: CEC = Cation exchange capacity. No aluminium was detected.
Landtasia trial
N

GROUNDSWELL - Final Agronomy Report
CHRIS HOUGHTON AGRICULTURAL PO Box 18 Crookwell NSW 2583 (02) 48320803 Page 37
This soil test shows that this soil has had lime applied recently and plentiful quantities of phosphorus fertiliser. Although sulphur and potassium are low, only small quantities of these nutrients are removed, so there are no real limitations that would adversely affect the growth of the trial.
Trial Design
The trial site is approximately 250 m out from the corner of a paddock (away from old headlands) and 80m north of the laneway fence.
Laneway
80 m
250m Trial
NW corner Paddock
Treatments
1 Compost – high rate (20 m3 /ha) 5 FCMP - med rate (250 kg /ha)
2 Compost medium rate (12.5 m3 /ha) 6 FCMP - high rate (400 kg /ha)
3 Compost low rate (5 m3 /ha) 7 Control (No fertiliser)
4 FCMP – standard rate (120 kg /ha)
Trial Plan
7 5 4 1.5 m buffer
6 3 2
5 1 7
4 2 3
3 7 6
2 4 1
1 6 5
Direction of sowing
The trial is replicated three times. There was no weed control after sowing. Seeding was
with a conventional combine (seed only). All fertiliser treatments are put out on the trial
plots by hand prior to seeding.
FCMP fertiliser used in this trial and on the spelt crop in the rest of the paddock, is a rock based magnesium phosphate fertilizer. It is accredited for organic production.
N
NW corner 2 m buffers

GROUNDSWELL - Final Agronomy Report
CHRIS HOUGHTON AGRICULTURAL PO Box 18 Crookwell NSW 2583 (02) 48320803 Page 38
Comparison of nutrient content FCMP with Superphosphate (SSP)
FCMP SSP
Phosphorous 8% 8.80%
Calcium 24% 20%
Sulphur 0.25% 11%
Magnesium 10% 0%
Trial Results
The first measurement taken at this site was a dry matter cut on 29th October 2009, just prior to stem elongation. The purpose of the dry matter cut was to determine whether the different treatments had shown up as differences in the vigour of plants. Additional vigour in a grain crop such as this can be a good or a bad thing depending on whether soil moisture is plentiful or limiting. More vigorous crops can exhaust soil moisture prior to grain filling, leading to poor yields. However an advantage of a vigorous crop in a low rainfall year is that it can often provide good returns if cut for hay in early spring. This dry matter cut is a measure of what would be available for a hay cut. Herbage yield (Kg/DM/Ha) at stem elongation
Treatment 1 2 3 4 5 6 7
Rep A 2375 3319 3133 3790 2893 3338 3846
Rep B 3749 3429 2989 3474 3858 3670 3031
Rep C 2637 4736 3088 2718 3595 2973 2977
Average 2920 3828 3070 3327 3449 3327 3285
Comment Although the spelt is not a forage variety it was decided to cut and measure forage dry matter as an early indicator of the vigour with different treatments. There are no appreciable trends. The lack of any result was attributed to the dry growing conditions and the subsequent poor crop vigour.
0
500
1000
1500
2000
2500
3000
3500
4000
4500
1 2 3 4 5 6 7
Kg/
DM
/Ha
Treatment
Spelt crop - Herbage yield
Average

GROUNDSWELL - Final Agronomy Report
CHRIS HOUGHTON AGRICULTURAL PO Box 18 Crookwell NSW 2583 (02) 48320803 Page 39
Tissue test results Tissue tests were done on the first replicate of the trial as a means of determining whether there was improved nutrient uptake from the plots that received the higher rate. They are shown below:
Sampling date: 2/11/09
Optimum
range
REP/PLOT
Analyte Unit Comment A1 A2 A3 A4 A5 A6 A7
Nitrogen (Kjeldahl) % 5.5 to 6.5 Very Low 1.9 2.1 2.1 1.6 1.8 1.8 2.1
Nitrate Nitrogen mg/kg NA Very Low 50 50 50 50 50 50 50
Phosphorus % 0.44 to 0.65 Low 0.33 0.38 0.4 0.37 0.4 0.32 0.34
Potassium % 2.5 to 4 Low - Mod 2.6 3 2.7 2.7 3.2 2.1 2.3
Sulphur % 0.2 to 0.4 Very low 0.16 0.17 0.16 0.16 0.18 0.16 0.16
Calcium % 0.25 to 0.8 Low 0.23 0.25 0.2 0.19 0.23 0.27 0.18
Magnesium % 0.13 to 0.4 Low 0.1 0.11 0.09 0.1 0.12 0.13 0.1
Sodium % 0 to 0.6 OK 0.02 0.02 0.01 0.01 0.02 0.02 0.01
Chloride % 0 to 2 OK 0.62 0.64 0.46 0.49 0.58 0.44 0.43
Manganese mg/kg 25 to 300 OK 76 66 56 51 34 42 40
Iron mg/kg 25 to 100 Mod - high 75 84 76 69 66 83 61
Copper mg/kg 5 to 50 Low 3.7 4.6 4.9 5.7 5.8 5.5 6
Zinc mg/kg 20 to 70 Low 16 23 20 20 18 19 21
Boron mg/kg 5 to 10 Low 3.7 3.7 2.8 4.9 5 4 3.8
Comment There were no apparent differences in the nutrient uptake of the crop that could be attributed to the treatments. Grain Harvest Results
Treatment Rep 1 Rep 2 Rep 3 Ave Plot Wt (kg) Ave Yield (T/ha) 1 2.15 2.05 2.45 2.22 0.62 2 3.20 3.40 1.90 2.83 0.79 3 3.20 2.40 1.65 2.42 0.67 4 2.20 2.25 2.05 2.17 0.60 5 2.40 2.50 1.90 2.27 0.63 6 1.95 2.65 1.70 2.10 0.58 7 3.10 1.75 1.75 2.20 0.61
GROUNDSWELL - Final Agronomy Report
CHRIS HOUGHTON AGRICULTURAL PO Box 18 Crookwell NSW 2583 (02) 48320803 Page 40
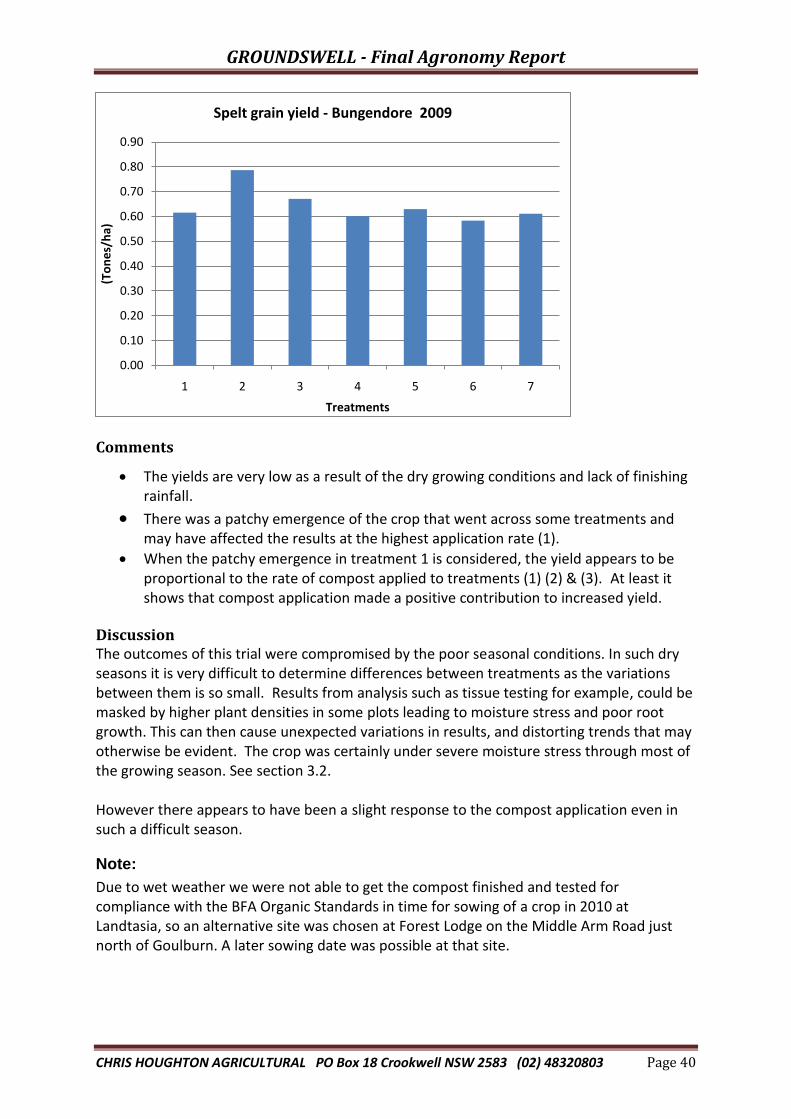
Comments
The yields are very low as a result of the dry growing conditions and lack of finishing rainfall.
There was a patchy emergence of the crop that went across some treatments and may have affected the results at the highest application rate (1).
When the patchy emergence in treatment 1 is considered, the yield appears to be proportional to the rate of compost applied to treatments (1) (2) & (3). At least it shows that compost application made a positive contribution to increased yield.
Discussion The outcomes of this trial were compromised by the poor seasonal conditions. In such dry seasons it is very difficult to determine differences between treatments as the variations between them is so small. Results from analysis such as tissue testing for example, could be masked by higher plant densities in some plots leading to moisture stress and poor root growth. This can then cause unexpected variations in results, and distorting trends that may otherwise be evident. The crop was certainly under severe moisture stress through most of the growing season. See section 3.2. However there appears to have been a slight response to the compost application even in such a difficult season.
Note:
Due to wet weather we were not able to get the compost finished and tested for compliance with the BFA Organic Standards in time for sowing of a crop in 2010 at Landtasia, so an alternative site was chosen at Forest Lodge on the Middle Arm Road just north of Goulburn. A later sowing date was possible at that site.
0.00
0.10
0.20
0.30
0.40
0.50
0.60
0.70
0.80
0.90
1 2 3 4 5 6 7
(To
ne
s/h
a)
Treatments
Spelt grain yield - Bungendore 2009

GROUNDSWELL - Final Agronomy Report
CHRIS HOUGHTON AGRICULTURAL PO Box 18 Crookwell NSW 2583 (02) 48320803 Page 41
8.2.2 Forest Lodge Trial
Site Details
In 2010 the Southern Tablelands cropping trial was established approximately 10km North of Goulburn on the Middle Arm Road on a property called “Forest Lodge”. The property is used for beef cattle and seed grain production, and is owned by Brian and Ian Ferguson.
The trial site is on a mid-slope location, and the paddock had a perennial grass based pasture prior to being ploughed for cropping. The soils on the site are duplex sandy loams. They are weakly structured and hence only suited to infrequent cultivation. The soil test results from a sample taken prior to the commencement of the trial showed the following: Topsoil (0 – 10 cm) Sampled 17th May 2010
Analyte Result Unit Opt Range Comment pH (CaCl2) 4.9 5.2 - 6 OK
Aluminium 30 % <5 Very high Organic Carbon Na % 2 – 5 Not tested Phosphorus (Colwell) 41 mg/kg 25 - 35 Good Potassium 0.4 meq/100g 0.5 – 0.9 Low Sulphur (KCl 40) 6.5 mg/kg 10 - 25 Low Sodium 0.08 meq/100g Very mildly sodic
Sodium % of cations (ESP) 2.7 % <2% Very mildly sodic
Elec conductivity 0.1 dS/m <1.2 OK
CEC* 3.08 5 - 10 Low
Note: CEC = Cation exchange capacity, Na = Not available.
“Forest Lodge” trial
N

GROUNDSWELL - Final Agronomy Report
CHRIS HOUGHTON AGRICULTURAL PO Box 18 Crookwell NSW 2583 (02) 48320803 Page 42
Trial Design
(Goulburn) Middle Arm Rd
23 m
NW corner
47m
46 ha paddock
Note: Oats variety is Blackbutt sown at 100kg/ha. All plots to have 20 kg/ha of DAP fertiliser at sowing with seed. Sown late May. Treatments 1 Compost – high rate (20 m3 /ha) 5 DAP – standard rate (100 kg /ha) 2 Compost medium rate (12.5 m3 /ha) 6 DAP - high rate (160 kg /ha) 3 Compost low rate (5 m3 /ha) 7 Control (No fert except the 20 kg/ha at sowing) 4 Compost medium rate (5 m3 /ha) + Gypsum (600 kg /ha)
Trial Plan Rep A B C
1 T6 T5 T4
1 m buffer
2 T7 T3 T2
3 T5 T1 T7
4 T4 T2 T3
5 T1 T7 T6
6 T3 T4 T1
7 T2 T6 T5
Direction of sowing
The trial is replicated (3 x) and randomised.
Sowing was with a conventional combine (seed only), sown in one direction. All
fertiliser treatments put out by hand.
Plot sizes are 2 m x 15 m with plots a 1m buffer between plots on all sides.
1 m buffer
N
Reference point NW corner
Row
N

GROUNDSWELL - Final Agronomy Report
CHRIS HOUGHTON AGRICULTURAL PO Box 18 Crookwell NSW 2583 (02) 48320803 Page 43
Trial Results
Grain Yield
Tment Rep 1 Rep 2 Rep 3 Ave Plot Wt Ave Yield (T/ha)
T1 9.86 12.42 13.04 11.77 3924
T2 7.02 10.5 11.54 9.69 3229
T3 7.62 12.04 9.74 9.80 3267
T4 7.62 8.62 12.09 9.44 3148
T5 6.32 11.98 12.36 10.22 3407
T6 9.4 8.04 12.36 9.93 3311
T7 7.62 10.5 10.86 9.66 3220
Comment The high rate of compost appears to have had a significant positive yield effect. The yield was 13% above the standard cropping fertiliser treatment (T5), and 18% above the control. This result will interest many grain farmers who have a source of compost nearby, but it remains to be seen through the economic evaluation whether it is cost effective.
Forest Lodge Trial, badly weather effected just prior to harvest.
0
500
1000
1500
2000
2500
3000
3500
4000
4500
T1 T2 T3 T4 T5 T6 T7
kg/h
a
Treatment
Grain Yield - Forest Lodge 2010

GROUNDSWELL - Final Agronomy Report
CHRIS HOUGHTON AGRICULTURAL PO Box 18 Crookwell NSW 2583 (02) 48320803 Page 44
Grain Protein
Protein levels in grain and forage are directly linked to soil nitrogen levels. Higher nitrogen levels in soil are desirable for cereal crop production, but within limits. Too much nitrogen will make the crop too vigorous and leafy, leaving it highly dependent on better than average rainfall to be able to effectively achieve grain fill. If farmers are able to grow grain with higher than average protein levels, they will usually receive a premium price (depending on other quality attributes such as volumetric weight and % screenings). When compost is used in crop production, it is difficult to determine the quantity of nitrogen that will be plant available in that season, hence making it difficult for farmers to plan fertiliser programs. The quantity of nitrogen in compost is dependent on the source of the raw material, and the availability of the nitrogen is dependent on the compost carbon level. Where there is a high carbon level in the compost, a phenomenon called nitrogen drawdown can occur when the compost is incorporated with soil. The carbon to nitrogen ratio (C:N) therefore is an important quality consideration. The best way to improve the consistency of nutrients in compost it is obtain the compost from a reputable supplier where there is consistency in: A The raw materials used B The composting process
The Groundswell compost should continue to meet both criteria as long as there is continued vigilance with the QA program involved with the raw material collection.
Unfortunately there is not a strong correlation to the application of compost and grain protein. Although two of the compost treatments (T1 & T3) had the highest protein, the range of differences across the treatments is quite narrow. The lowest protein result was medium compost (T)2; marginally lower than the control (T7). This trial really needs to be repeated over several seasons to determine the repeatable trends and the consistency of outcomes.
10.85
10.90
10.95
11.00
11.05
11.10
11.15
11.20
T1 T2 T3 T4 T5 T6 T7
%
2010 Grain protein - Forest Lodge

GROUNDSWELL - Final Agronomy Report
CHRIS HOUGHTON AGRICULTURAL PO Box 18 Crookwell NSW 2583 (02) 48320803 Page 45
Herbage Yield
Herbage yield at stem elongation
Treatment 1 2 3 4 5 6 7
Rep A 6868 6413 5259 6327 7048 6521 6554
Rep B 7720 6729 7748 6434 6564 6072 7815
Rep C 7521 6256 6927 3805 6880 7023 5891
Ave (kg/DM/ha) 7370 6466 6644 5522 6831 6539 6754
Comment:
Firstly there is little difference in the quantity of herbage cut over all treatments over the quantity cut on the control plot.
There appears to be a positive yield effect from applying the high rate of compost.
There is no logical explanation for the reduced herbage in treatment 4. It should have at least yielded as well as treatment 2.
Considering that 160 kg/ha of DAP on treatment 6, which provided 28.8 kg/ha of nitrogen above the base sowing fertiliser rate, there was no additional response over treatment 5, which received 100 kg/ha DAP.
Treatments 1 Compost – high rate (20 m3 /ha) 5 DAP – standard rate (100 kg /ha) 2 Compost medium rate (12.5 m3 /ha) 6 DAP - high rate (160 kg /ha) 3 Compost low rate (5 m3 /ha) 7 Control (No fert except the 20 kg/ha at sowing) 4 Compost medium rate (5 m3 /ha) + Gypsum (600 kg /ha)
0
1000
2000
3000
4000
5000
6000
7000
8000
1 2 3 4 5 6 7
Kg/
DM
/ha
Treatment
Forest Lodge - Herbage Cuts Oct 2010
Average

GROUNDSWELL - Final Agronomy Report
CHRIS HOUGHTON AGRICULTURAL PO Box 18 Crookwell NSW 2583 (02) 48320803 Page 46
Herbage Quality
CP (% DM) ME (MJ/kg/DM) DMD (% DM) NDF (% DM)
Treatment 1 20.5 10.3 69.5 52.3
Treatment 2 20.4 10.2 68.5 53.5
Treatment 3 20.3 10.7 71.7 50.1
Treatment 4 20.5 10.1 68.2 53
Treatment 5 18.1 9.6 65.4 56
Treatment 6 17.5 9.3 63.4 58.2
Treatment 7 16.2 9.4 64 56.1 CP = Crude Protein % ME=Metabolisable energy in megajoules per kg dry matter DMD = Dry matter digestibility NDF=Neutral detergent fibre (measure of fibre)
The protein levels are high as the leaves only were sampled, being the most nutritious parts of the plant. The graph shows that the compost plots (T1 – T4) all have the highest protein. As should be the case but is not always, the control (T8) plot is the lowest. All other plots including the compost have received significant quantities of nitrogen, in both the compost and DAP. Nitrogen is the source of protein in plants.
The ME is also higher in the compost than the DAP and the control treatments. Combined with the higher protein, the total feed value of the compost treated plots is very high.
From the above graphs it can be seen that there is a definite improvement in overall digestibility and a reduction in fibre where the compost was used. Less fibre (lower NDF)
20.5 20.4 20.3 20.518.1 17.5 16.2
0
5
10
15
20
25
T1 T2 T3 T4 T5 T6 T7
% D
M
Crude Protein
10.3 10.2
10.7
10.1
9.69.3 9.4
8.5
9
9.5
10
10.5
11
T1 T2 T3 T4 T5 T6 T7
MJ/
kg/D
M
Metabolisable Energy (ME)
69.5 68.571.7
68.265.4
63.4 64
58
60
62
64
66
68
70
72
74
T1 T2 T3 T4 T5 T6 T7
% D
M
Digestibility
52.3 53.5
50.153
5658.2
56.1
46
48
50
52
54
56
58
60
T1 T2 T3 T4 T5 T6 T7
% D
M
Neutral Detergent Fibre (NDF)

GROUNDSWELL - Final Agronomy Report
CHRIS HOUGHTON AGRICULTURAL PO Box 18 Crookwell NSW 2583 (02) 48320803 Page 47
normally equates to higher digestibility. Overall there has been a noticeable improvement in feed quality from the use of compost.
Treatments 1 Compost - high rate (20 m3 /ha) 5 DAP - standard rate (100 kg /ha) 2 Compost - medium rate (12.5 m3 /ha) 6 DAP - high rate (160 kg /ha) 3 Compost - low rate (5 m3 /ha) 7 Control (No fert except the 20 kg/ha at sowing) 4 Compost - medium rate (5 m3 /ha) + Gypsum (600 kg /ha)
Soil Biology
The soil biology test results for Forest Lodge are shown below.
Organisms Unit Opt value T1 T2 T3 T4 T5 T6 T7
Bacteria No. / field >500 >500 >500 >500 >500 >500 >500 >500
Bacteria Rating Good + V Good V Good V Good V Good V Good V Good V Good
Fungi % >20% 30% 50% 30% 20% 40% 45% 45%
Fungi Rating Good + Good V Good Good Good Good Good V Good
Fungal Diameter Micron >2.5 2.0-2.5 2.0-4.0 2.0-2.5 2.0-5.0 2.0-4.0 2.0-4.0 2 -10.0
Antinobacteria % NA No 5% No No 5% 5% 5%
Protozoa-Flangellates H,M,L,No H,M No No No No No No No
Protozoa - Amoebae H,M,L,No H,M No No No No No No No
Protozoa - Ciliates H,M,L,No H,M No No No No No No No
Nematodes Yes/No Yes * No No No No No No No
Overall sample rating Poor Poor Poor Poor Poor Poor Poor
H = high M=Medium L=Low No=Not observed * Depends to a large extent on the type T=Treatment
Treatment 7 was the control, so any improvements in activity of the various organisms should be compared to this treatment. There are no obvious correlations between the applications of total nutrients or just compost which should have contributed a range of microbes. No conclusions can be drawn from these results.
Soil Nutrients
The key features of the final Forest Lodge soil tests are summarised as below. A sample of the test report showing the final soil nutrient tests can be seen in Appendix C.
1.6 1.71.2
1.7 1.62
1
0
0.5
1
1.5
2
2.5
T1 T2 T3 T4 T5 T6 T7
mg/
kg
Forest Lodge - Nitrate N
42 39 37 33 36 38 34
0
10
20
30
40
50
T1 T2 T3 T4 T5 T6 T7
mg/
kg
Forest Lodge - Colwell P

GROUNDSWELL - Final Agronomy Report
CHRIS HOUGHTON AGRICULTURAL PO Box 18 Crookwell NSW 2583 (02) 48320803 Page 48
Nitrate is the main plant available form of nitrogen in soil. All treatments have contributed to an increase in nitrate nitrogen in the soil, over and above the control (T7). However there is no obvious trend emerging. No conclusions can be drawn from the data.
The colwell phosphorus results show a spike for the highest compost (T3) and DAP (T6) applications which is to be expected. The obvious conclusion that can be drawn from these results is that higher applications of compost and DAP will build soil phosphorus levels. It is not so clear from the data what rate of increase can be expected, but for these soils, a phosphorus level of about 30 – 35 should be considered as the target. The highest rate of compost has raised the phosphorus level very close to that. What is more interesting is that this appears to have been achieved in one year. Further investigation should now be conducted to determine if this outcome is repeatable over number of seasons.
There appears to have been no appreciable movement in potassium level at this site due to the application of compost. Even though the highest compost rate has resulted in the highest level of available potassium, there is inadequate evidence to suggest that this is a repeatable trend. Further investigation is required to validate this.
As expected there has been very little movement in sulphur levels, due to very low sulphur in either compost or DAP. As expected, there has been a significant movement where the 600 kg/ha of gypsum (14-16% S) was applied. There was no yield response resulting from this as oats has a low sulphur requirement, and hence is not a sulphur responsive plant.
Soil Carbon
87 7969
80 78 76 83
0
20
40
60
80
100
T1 T2 T3 T4 T5 T6 T7
mg/
kg
Forest Lodge - Available K
3.4 3.8 3.5
6.8
3.3 2.7 3
0
1
2
3
4
5
6
7
8
T1 T2 T3 T4 T5 T6 T7
mg/
kg
Forest Lodge - Sulphur
1.6 1.6
1.4
1.6
1.5
1.4 1.4
1.3
1.35
1.4
1.45
1.5
1.55
1.6
1.65
T1 T2 T3 T4 T5 T6 T7
%
Forest Lodge - Organic Carbon

GROUNDSWELL - Final Agronomy Report
CHRIS HOUGHTON AGRICULTURAL PO Box 18 Crookwell NSW 2583 (02) 48320803 Page 49
Apart from the lower T3 result, it appears that compost could make a difference to organic carbon. It must be remembered though that the range is very narrow, so all of the results are actually very close. Considering however that these are only one year results, it is interesting that the compost treatments have generally shown higher OC levels. This supports current knowledge that this correlation exists, but what is surprising is that such an outcome has shown in one year. However, no real conclusions can be drawn from this however until further investigation is carried out for validation.
Soil Structure
Measurements of changes to slaking and dispersion were undertaken to determine what impact the compost would make to soil structure.
There is no doubt that this soil is very poorly structured, having a very low clay content, almost no aggregate strength and low organic carbon %, as shown in the soil test chart above. It is well known that one factor that can be changed over time to improve soil structure is organic carbon. It would be interesting to continue with compost applications on these soils to evaluate the response to such treatments over a longer time frame, which should lead to improvements in soil structure. Unfortunately at this point in time no positive influence can be measured.
Slaking results
Treatment 1 Partial No conclusions can be drawn from these results
Treatment 2 Partial
Treatment 3 Partial
Treatment 4 Partial
Treatment 5 Partial
Treatment 6 Partial
Treatment 7 Partial
4 4 4 4 4 4 4
0
0.5
1
1.5
2
2.5
3
3.5
4
4.5
T1 T2 T3 T4 T5 T6 T7
Dis
pe
rsio
n In
de
x
Forest Lodge - Dispersion Index

GROUNDSWELL - Final Agronomy Report
CHRIS HOUGHTON AGRICULTURAL PO Box 18 Crookwell NSW 2583 (02) 48320803 Page 50
Soil Water Holding Capacity
If the highest rate of compost (T1) was not so low, these results would be more logical. No correlation can be drawn from this graph between high levels of compost and DAP, and improved WHC. Again the short time frame means that a long term outcome such as improved WHC has not yet had time to be expressed.
Discussion
There are some interesting outcomes from this trial that are worthy of comment.
There appears to be a yield advantage for the higher rates of compost, although it still needs to be determined whether the compost application is cost effective or not.
There appears to be a strong correlation between the application of compost and the nutritional value of the herbage. This is supported by anecdotal evidence from graziers who have used compost on pastures and have been impressed by good pasture growth and livestock performance.
The increase of phosphorus level due to compost application is very useful to know. This seems to have been the case in all trials. Since phosphorus availability in compost is only thought to be about 40% in the year of application, does this mean that with repeated applications a gradual increase in soil phosphorus reserves? This will depend on the rate applied, but it is useful to know that there has been an increase in soil P reserves (after plant removal), even at the low rates used in this trial.
It appears that compost application may have contributed to a slight increase in soil carbon levels.
12.2
13.413.1 13.1
12.7
13.5
12.6
11.5
12.0
12.5
13.0
13.5
14.0
T1 T2 T3 T4 T5 T6 T7
%
Forest Lodge - Soil WHC
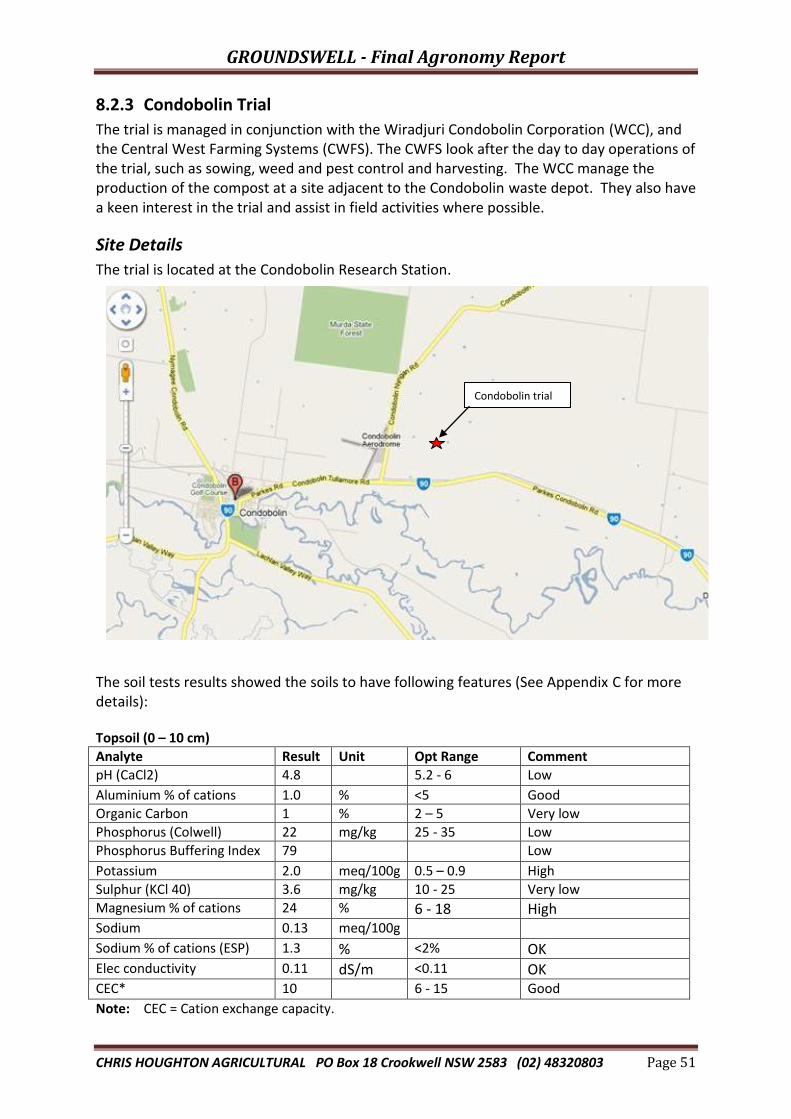
GROUNDSWELL - Final Agronomy Report
CHRIS HOUGHTON AGRICULTURAL PO Box 18 Crookwell NSW 2583 (02) 48320803 Page 51
8.2.3 Condobolin Trial
The trial is managed in conjunction with the Wiradjuri Condobolin Corporation (WCC), and the Central West Farming Systems (CWFS). The CWFS look after the day to day operations of the trial, such as sowing, weed and pest control and harvesting. The WCC manage the production of the compost at a site adjacent to the Condobolin waste depot. They also have a keen interest in the trial and assist in field activities where possible.
Site Details
The trial is located at the Condobolin Research Station.
The soil tests results showed the soils to have following features (See Appendix C for more details): Topsoil (0 – 10 cm)
Analyte Result Unit Opt Range Comment pH (CaCl2) 4.8 5.2 - 6 Low
Aluminium % of cations 1.0 % <5 Good Organic Carbon 1 % 2 – 5 Very low Phosphorus (Colwell) 22 mg/kg 25 - 35 Low Phosphorus Buffering Index 79 Low
Potassium 2.0 meq/100g 0.5 – 0.9 High Sulphur (KCl 40) 3.6 mg/kg 10 - 25 Very low Magnesium % of cations 24 % 6 - 18 High Sodium 0.13 meq/100g Sodium % of cations (ESP) 1.3 % <2% OK Elec conductivity 0.11 dS/m <0.11 OK CEC* 10 6 - 15 Good
Note: CEC = Cation exchange capacity.
Condobolin trial

GROUNDSWELL - Final Agronomy Report
CHRIS HOUGHTON AGRICULTURAL PO Box 18 Crookwell NSW 2583 (02) 48320803 Page 52
The soil test results show that the soil is typical of red duplex cropping soils in the district and there are no major limitations to production that may adversely affect the trial. Compared to the soils in the Goulburn district, the Condobolin soil has a higher CEC, and higher potassium and magnesium levels. It also has lower levels of available aluminium, and higher pH.
The trial site is the south east corner of the paddock directly south east of the main Condobolin Research Station office block, as shown below.
Co
nd
ob
olin
Nyn
gan
Ro
ad
Main office & sheds
Trial Design
There were a number of possible trial design scenarios discussed. Alternative trial designs included one in commercial vegetable production and another in nursery production. The broadacre grain production model was decided on. Although there would never be enough compost produced for use in grain growing this trial design would allow easy comparison with district grain yields and allow financial returns to be calculated. The trial will be conducted on the same land for two years to determine what cumulative benefits may be evident from compost use.
Chemical treated plots
2 Compost - high rate
4 Compost low rate
5 Control A (DAP @ 50/kg/ha)
The
chem
ical
fre
e tr
ial g
oes
on
fro
m t
his
en
d o
f th
e
chem
ical
tre
ate
d p
lots
. aft
er
a 1
5m
bu
ffer
.
3 Compost medium rate 1 DAP @ 30kg/ha + med compost
2 Compost - high rate
4 Compost low rate
5 Control A (DAP @ 50/kg/ha) 3 Compost medium rate
1 DAP @ 30kg/ha + medium compost
3 Compost medium rate 4 Compost low rate
5 Control A (DAP @ 50/kg/ha) 2 Compost - high rate 1 DAP @ 30kg/ha + med compost
N
Chemical free
Chemicals used

GROUNDSWELL - Final Agronomy Report
CHRIS HOUGHTON AGRICULTURAL PO Box 18 Crookwell NSW 2583 (02) 48320803 Page 53
Chemical free plots
1 DAP @ 30kg/ha + medium compost
3 Compost - medium rate
5 Control B (No chemical & no fertiliser)
2 Compost - high rated
4 Compost - low rate
1 DAP @ 30kg/ha + medium compost
3 Compost - medium rate
5 Control B (No chemical & no fertiliser)
2 Compost - high rated
4 Compost - low rate
2 Compost - high rated
3 Compost - medium rate
5 Control B (No chemical & no fertiliser)
1 DAP @ 30kg/ha + medium compost
4 Compost - low rate
As can be seen from the trial plan, the whole trial was repeated twice, once with pre-emergent and post –emergent herbicides, and the other without any use of any herbicide treatments. The two trials were placed end to end with a 15m buffer in between.
Note:
The shaded areas received DAP® (Di-ammonium phosphate) fertiliser at sowing. This is a common fertiliser used by farmers in the region when growing wheat.
The herbicide treated plots received an application of Glyphosate® pre-sowing and a broadleaf weed spray and a fungicide treatment later in the season.
Trial Results
Grain Yield
In 2010 the trial was established on the same trial plans as 2009. There is some risk associated with this, as the disease Take-All is known to cause a yield reduction where wheat is grown in consecutive years on the same land. However, compared to the 2009 results the yields were outstanding right across the trials. The rainfall received through the 2010 growing season was close to ideal.
The complete trial was repeated twice, once with chemical treatments (pre-emergent and post –emergent sprays), and the other without any use of any chemical treatments. The reason for this was that there is some evidence that many agricultural chemicals reduce soil micro-organism populations. Many of these soil micro-organism are important in the normal nutrient cycles responsible for the mineralisation of nutrients locked up in plant residues, and organic matter generally. More soluble fertilisers such as DAP were expected to be less affected, as the nutrients are more readily available. However for compost to be fairly compared to DAP it was decided that this possible variable would be removed by duplicating the trial without any chemicals.
2009 Results
Grain Yield - Chemical application
Tment Rep 1 Rep 2 Rep 3 Ave Plot Wt (kg) Ave Yield (kg/ha)
T1 0.445 0.05 0.385 0.293 0.121 T2 0.245 0.135 0.255 0.212 0.088 T3 0.09 0.435 0.08 0.202 0.085 T4 0.105 0.66 0.165 0.310 0.131 T5a 0.09 0.495 0.59 0.392 0.161
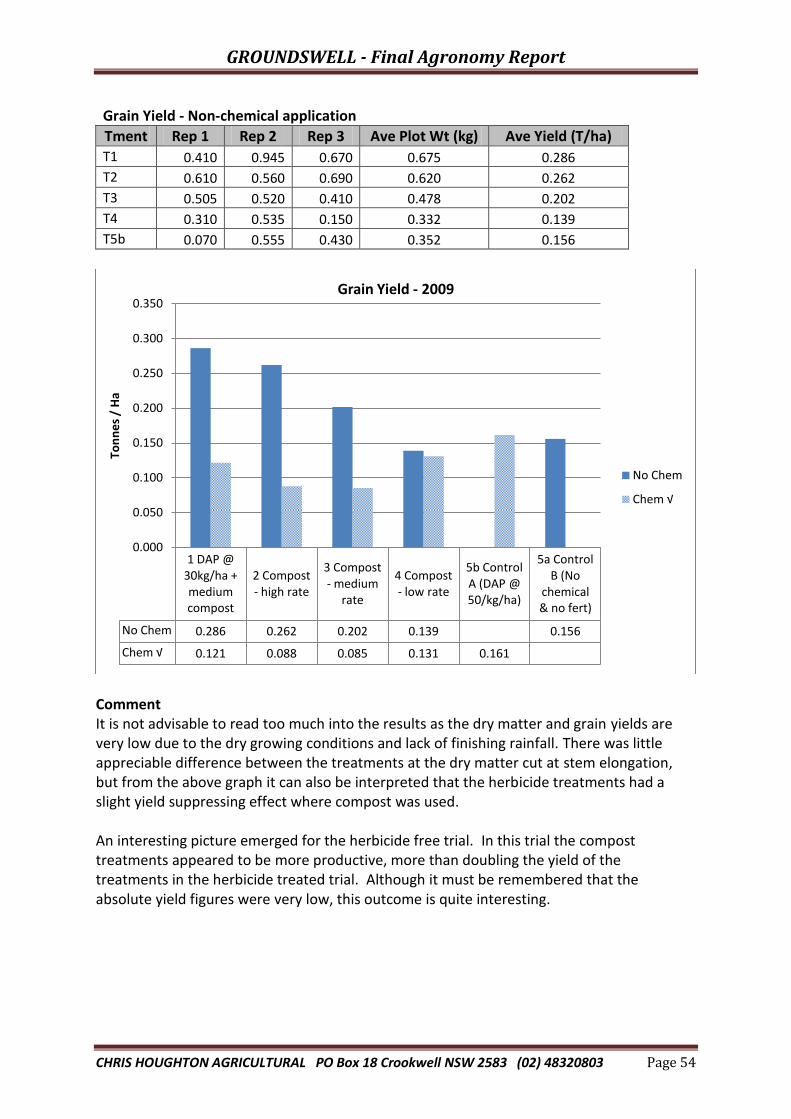
GROUNDSWELL - Final Agronomy Report
CHRIS HOUGHTON AGRICULTURAL PO Box 18 Crookwell NSW 2583 (02) 48320803 Page 54
Grain Yield - Non-chemical application
Tment Rep 1 Rep 2 Rep 3 Ave Plot Wt (kg) Ave Yield (T/ha) T1 0.410 0.945 0.670 0.675 0.286 T2 0.610 0.560 0.690 0.620 0.262 T3 0.505 0.520 0.410 0.478 0.202 T4 0.310 0.535 0.150 0.332 0.139 T5b 0.070 0.555 0.430 0.352 0.156
Comment It is not advisable to read too much into the results as the dry matter and grain yields are very low due to the dry growing conditions and lack of finishing rainfall. There was little appreciable difference between the treatments at the dry matter cut at stem elongation, but from the above graph it can also be interpreted that the herbicide treatments had a slight yield suppressing effect where compost was used. An interesting picture emerged for the herbicide free trial. In this trial the compost treatments appeared to be more productive, more than doubling the yield of the treatments in the herbicide treated trial. Although it must be remembered that the absolute yield figures were very low, this outcome is quite interesting.
1 DAP @ 30kg/ha + medium compost
2 Compost - high rate
3 Compost - medium
rate
4 Compost - low rate
5b Control A (DAP @ 50/kg/ha)
5a Control B (No
chemical & no fert)
No Chem 0.286 0.262 0.202 0.139 0.156
Chem √ 0.121 0.088 0.085 0.131 0.161
0.000
0.050
0.100
0.150
0.200
0.250
0.300
0.350
Ton
ne
s /
Ha
Grain Yield - 2009
No Chem
Chem √

GROUNDSWELL - Final Agronomy Report
CHRIS HOUGHTON AGRICULTURAL PO Box 18 Crookwell NSW 2583 (02) 48320803 Page 55
2010 Results
Grain Yield - Chemical application
Tment Rep 1 Rep 2 Rep 3 Ave Plot Wt (kg) Ave Yield (T/ha)
T1 8.42 8.13 7.67 8.1 3.55
T2 8.82 7.15 7.89 8.0 3.50
T3 8.91 6.74 7.03 7.6 3.32
T4 10.64 7.47 8.77 9.0 3.94
T5a 11.33 7.58 8.39 9.1 4.00
Grain Yield - Non-chemical application Tment Rep 1 Rep 2 Rep 3 Ave Plot Wt (kg) Ave Yield (T/ha)
T1 8.29 8.55 9.19 8.7 3.81
T2 8.77 7.64 8.28 8.2 3.62
T3 6.88 8.95 6.44 7.4 3.26
T4 6.59 8.11 6.57 7.1 3.12
T5b 6.23 7.72 7.88 7.3 3.20
Comment Without the limitation of moisture stress in 2010 it is interesting to see how close the grain yields are from the different treatments, even with considerable variations in nutrients. There is also only 20% yield difference between the highest and lowest plot yields. It is also interesting to note that the yield suppression effect of chemicals on compost treatments was not evident in 2010.
Grain Protein
Protein % was not determined in 2009 due to the poor yield and quality generally. The relationship between Protein level and quality is important because of the influence it has on end product performance. For example, when making a loaf of bread if the total protein is too high, there is too much resistance to the gas bubbles expanding during baking,
1 DAP @ 30kg/ha + medium compost
2 Compost -high rate
3 Compost -medium
rate
4 Compost -low rate
5a Control A (DAP @
50/kg/ha)
5b Control B (No
chemical & no fert
No Chem 3.12 3.81 3.62 3.26 0.00 3.20
Chem √ 3.94 3.55 3.50 3.32 4.00 0.00
0.00
0.50
1.00
1.50
2.00
2.50
3.00
3.50
4.00
4.50
Ton
ne
s/h
a
Grain Yield - 2010
No Chem
Chem √

GROUNDSWELL - Final Agronomy Report
CHRIS HOUGHTON AGRICULTURAL PO Box 18 Crookwell NSW 2583 (02) 48320803 Page 56
so the loaf does not rise properly. The protein targets for AWB grades such as AWB Prime Hard (13% min), AWB Hard (11.5%) and AWB Premium White (10%) are widely known. At the time of writing on March 17th, the prices for the above grades were:
AWB Prime Hard $400.00/Tonne (Toobeah, Qld)
AWB Hard $350.00/Tonne (Parkes, NSW)
AWB Premium White $300.00/Tonne (Coonamble, NSW) The main reason varieties are classified into different grades is based on their functionality or ability to make certain end products at specific protein levels. For example, 10 – 12% protein is required for Australian bread flours, while 7.5 – 8.5% protein is preferred for biscuit and cake flours (Ref 7).
Comments Although there is some variation between plots, there is just as much variation between trials. There do not appear to be any trends, other than that the chemical free trial does have slightly higher protein levels across all treatments, although the differences are quite small. Certainly there is little financial benefit according to the protein and price ranges for the three wheat grades discussed above.
0.00
2.00
4.00
6.00
8.00
10.00
12.00
1 DAP @ 30kg/ha + medium compost
2 Compost -high rate
3 Compost -medium rate
4 Compost -low rate
5a Control A (DAP @
50/kg/ha)
5b Control B (No chemical
& no fert
%
Grain Protein - 2010
No Chem
Chem √
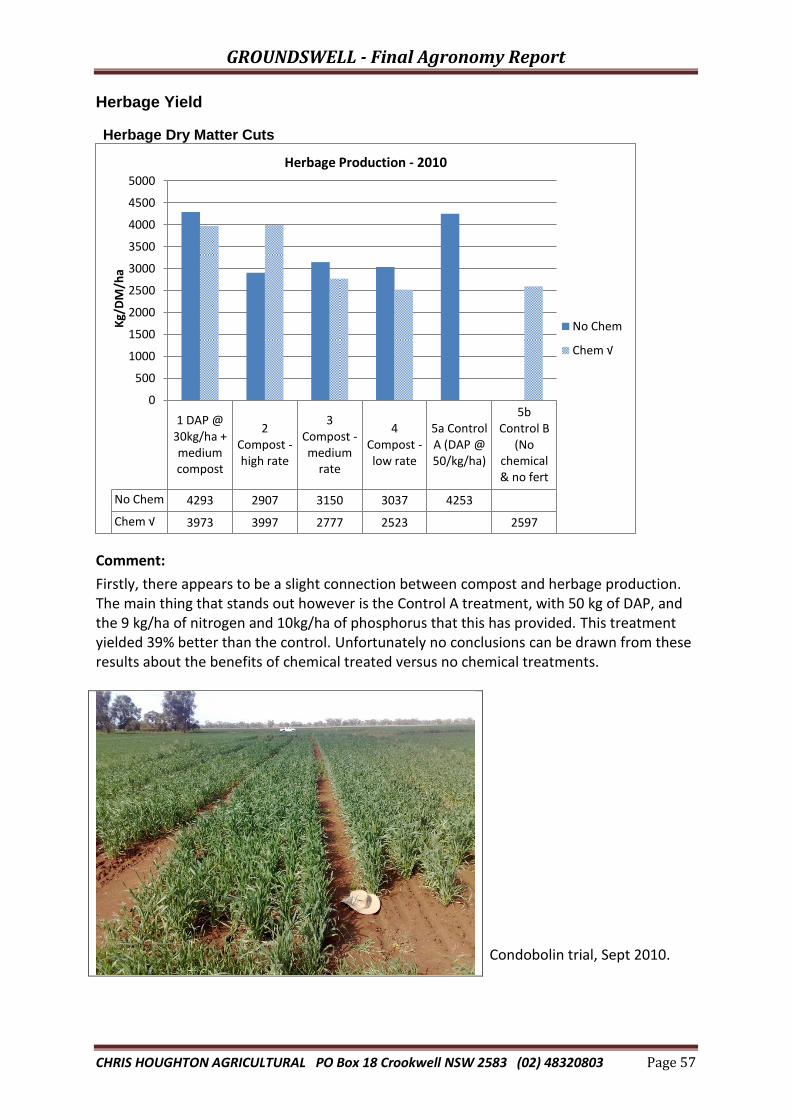
GROUNDSWELL - Final Agronomy Report
CHRIS HOUGHTON AGRICULTURAL PO Box 18 Crookwell NSW 2583 (02) 48320803 Page 57
Herbage Yield
Herbage Dry Matter Cuts
Comment:
Firstly, there appears to be a slight connection between compost and herbage production. The main thing that stands out however is the Control A treatment, with 50 kg of DAP, and the 9 kg/ha of nitrogen and 10kg/ha of phosphorus that this has provided. This treatment yielded 39% better than the control. Unfortunately no conclusions can be drawn from these results about the benefits of chemical treated versus no chemical treatments.
Condobolin trial, Sept 2010.
1 DAP @ 30kg/ha + medium compost
2 Compost -high rate
3 Compost -medium
rate
4 Compost -low rate
5a Control A (DAP @ 50/kg/ha)
5b Control B
(No chemical & no fert
No Chem 4293 2907 3150 3037 4253
Chem √ 3973 3997 2777 2523 2597
0
500
1000
1500
2000
2500
3000
3500
4000
4500
5000
Kg/
DM
/ha
Herbage Production - 2010
No Chem
Chem √

GROUNDSWELL - Final Agronomy Report
CHRIS HOUGHTON AGRICULTURAL PO Box 18 Crookwell NSW 2583 (02) 48320803 Page 58
Herbage Quality
CP (% DM) ME (MJ/kg/DM) DMD (% DM) NDF (% DM)
T-ment 1 26.8 11 73.1 41.2
T-ment 2 27.7 10.8 72.4 40.6
T-ment 3 27.3 11 73.1 40
T-ment 4 28 10.8 72.4 40.4
T-ment 5a 26.3 10.7 71.8 41.6 CP = Crude Protein % ME=Metabolisable energy in megajoules per kg dry matter DMD = Dry matter digestibility NDF=Neutral detergent fibre (measure of fibre)
The protein levels are very high as the leaves only were sampled, being the most nutritious parts of the plant. The graph shows that the compost plots (T2 – T4) all have the highest protein. Due to the small differences no conclusions can be drawn from this.
No conclusions can be drawn from the ME results.
No conclusions can be drawn from the above digestibility and NDF data.
Treatments 1 DAP @ 30kg/ha + medium compost 2 Compost - high rate 3 Compost - medium rate 4 Compost - low rate 5a Control A (DAP @ 50/kg/ha) 5b Control B (No chemical & no fert
26.8
27.727.3
28
26.3
25
25.5
26
26.5
27
27.5
28
28.5
T 1 T 2 T 3 T 4 T 5a
% D
M
Crude Protein
11
10.8
11
10.810.7
10.5
10.6
10.7
10.8
10.9
11
11.1
T 1 T 2 T 3 T 4 T 5a
MJ/
kg/D
M
Metabolisable Energy (ME)
73.1
72.4
73.1
72.4
71.8
71
71.5
72
72.5
73
73.5
T 1 T 2 T 3 T 4 T 5a
% D
M
Digestibility
41.2
40.6
4040.4
41.6
39
39.5
40
40.5
41
41.5
42
T 1 T 2 T 3 T 4 T 5a
% D
M
Neutral Detergent Fibre (NDF)

GROUNDSWELL - Final Agronomy Report
CHRIS HOUGHTON AGRICULTURAL PO Box 18 Crookwell NSW 2583 (02) 48320803 Page 59
Soil Biology
The soil biology test results for Forest Lodge are shown below.
Organisms Unit Optim value T1 T2 T3 T4 T5b T1 T2 T3 T4 T5a
No
Chem No
Chem No
Chem No
Chem No
Chem Chem Chem Chem Chem Chem
Bacteria No. per field >500 >500 >500 >500 >500 >500 >500
25-500 >500
25-500
25-500
Bacteria Rating Good +
V Good
V Good
V Good
V Good
V Good
V Good
Adeq uate
V Good
Adeq uate
Adeq uate
Fungi % >20% 5% 25% 15% 20% 25% 10% 15% 30% 5% 25%
Fungi Rating Good +
Adeq uate Good
Adeq uate Good Good
Adeq uate
Adeq uate Good
Adeq uate Good
Fungal Diameter Micron >2.5 3.00
2.0-3.0 2.50
2.0-3.0
2.0-3.0 2.50
2.5 -3.0
2.0-3.0 2.50
2.0-3.0
Antino bacteria % NA No No No No No No No No No 5%
Protozoa - Flangellates H,M,L,No H,M No No No No No No No No No No
Protozoa - Amoebae H,M,L,No H,M No 5% No No No No No No No No
Protozoa - Ciliates H,M,L,No H,M No No No No No No No No No No
Nematodes Yes/No Yes * No No No No No No No No No No
Overall sample rating Poor
Poor -Adeq uate Poor Poor Poor Poor Poor Poor Poor Poor
H = high M=Medium L=Low No=Not observed * Depends to a large extent on the type T=Treatment
Treatment 5b is the control, so any improvements in activity of the various organisms should be compared to this treatment. There does appear to be a noticeable reduction in bacteria on the chemical treated plot, which could support the theory that glyphosate has a negative impact on soil microbes. There are no similar variations to other microbes. No conclusions can be drawn from these results other than to suggest that the effect of chemicals on soil microbes could warrant further investigation.
Soil Nutrients
The key features of the final Condobolin trial soil tests are summarised below. A sample of the test report showing the final soil nutrient tests can be seen in Appendix C.
30 2823
2723
0
5
10
15
20
25
30
35
T 1 T 2 T 3 T 4 T 5a
mg/
kg
Condobolin - Colwell P
770
700680
750
700
620
640
660
680
700
720
740
760
780
T 1 T 2 T 3 T 4 T 5a
mg/
kg
Condobolin - Available K

GROUNDSWELL - Final Agronomy Report
CHRIS HOUGHTON AGRICULTURAL PO Box 18 Crookwell NSW 2583 (02) 48320803 Page 60
The Colwell phosphorus results appear to show a rise for the high and low compost (T2 & T4) and the most noticeable increase with the compost and fertiliser (T1). A shown at the beginning of this section the starting Colwell phosphorus levels were at 22 at the commencement of the trial in 2009. As phosphorus is an expensive component of fertilisers, it would be worthwhile to further explore how repeatable these results are. It can be concluded however that compost has increased soil phosphorus levels at all 4 sites as determined by final soil tests. For some reason there appears to be no relationship between compost rate and increased available potassium (K) at this site. It should be said however that the base line potassium levels are already very high, which would reduce the responsiveness of the soil to further applied potassium.
All of these sulphur levels would be considered very low for pastures and some crops such as canola, but for wheat they are only just adequate. Wheat has a fairly low sulphur requirement normally removes sulphur at about 1.4 kg/tonne of grain. Compost has a very low sulphur content, so no positive response was expected. For some reason though, T5a is very low which is difficult to explain. There appears to be no particular trend showing here, and no conclusions can be drawn from these results.
Soil Carbon
4.2 4.23.4
4
2.5
0
0.5
1
1.5
2
2.5
3
3.5
4
4.5
T 1 T 2 T 3 T 4 T 5a
mg/
kg
Condobolin - Sulphur
1.2
1.1 1.1 1.1
1.2
1.04
1.06
1.08
1.1
1.12
1.14
1.16
1.18
1.2
1.22
T 1 T 2 T 3 T 4 T 5a
%
Condobolin - Organic Carbon

GROUNDSWELL - Final Agronomy Report
CHRIS HOUGHTON AGRICULTURAL PO Box 18 Crookwell NSW 2583 (02) 48320803 Page 61
All of these organic carbon results are relatively low, but not untypical of cropping soils in this environment. Although minimum tillage is now practiced, in recent years these soils would have been cultivated frequently, depleting soil carbon levels. The graph shows the three compost only treatments being the lowest, and those that received DAP fertiliser, the highest. It must be noted though that the range of variation between treatments is very small. No conclusion can be drawn from these results.
Treatments 1 DAP @ 30kg/ha + medium compost 2 Compost - high rate
3 Compost - medium rate 4 Compost - low rate
5a Control A (DAP @ 50/kg/ha) 5b Control B (No chemical & no fert
Spreading compost by hand at Condobolin in May 2010.
Soil Structure
The graph below shows that there were variations in dispersion across the trials but that there is no direct correlation between compost application and dispersion. In fact the graph shows that the plots with least compost applied (T3 & T4) had the lowest rate of dispersion. No conclusion can be drawn from these results.
12 1311 10
13
0
2
4
6
8
10
12
14
T 1 T 2 T 3 T 4 T 5a
Dis
pe
rsio
n In
de
x
Condobolin - Dispersion Index

GROUNDSWELL - Final Agronomy Report
CHRIS HOUGHTON AGRICULTURAL PO Box 18 Crookwell NSW 2583 (02) 48320803 Page 62
Slaking results
Slaking results These results indicate that the compost treatments did not reduce soil slaking at all. One explanation for this may have been that the compost was surface applied prior to seeding through minimum tillage. Little mixing of the soil would have occurred through this process as only a narrow slot would have been made in the soil. Some compost would have fallen into the sowing slot, but most would have remained on the surface. Since soil samples
T-ment 1 Considerable
T-ment 2 Considerable
T-ment 3 Considerable
T-ment 4 Considerable
T-ment 5 Considerable
T-ment 1 Considerable
T-ment 2 Considerable
were taken to 100 mm, much of the soil would not have had contact with the compost
Soil Water Holding Capacity
Even though the range of results is quite narrow, and the fact that the medium rate of compost (T3) distorts any trend that might seem apparent, there does appear to be a link between higher rates of compost and improved WHC. However, once again due to the short time frame a long term outcome such as improved WHC has not yet had time to be expressed.
Discussion
The Condobolin trial was very interesting in that the application of compost to cropping soils in a district where such vast areas were sown to crops, and where little raw material is available to make compost. However current thinking would suggest that the introduction of organic material to such low carbon soils can only do good things. As the results indicate, some positive outcomes have been achieved.
A yield response was achieves in 2009 form the non-chemical trial, but this was not repeated in 2010. In 2010 the DAP (T5a) and DAP/compost (T1) fertiliser treatments were superior to the compost treatments (T2,T3,T4), and similar results were achieved in both the chemical and non-chemical trials.
There was little difference in grain protein levels across all treatments and both trials.
11.6 11.5
10.7
11.4
11.0
10.2
10.4
10.6
10.8
11.0
11.2
11.4
11.6
11.8
T 1 T 2 T 3 T 4 T 5a
%
Condobolin - Soil WHC

GROUNDSWELL - Final Agronomy Report
CHRIS HOUGHTON AGRICULTURAL PO Box 18 Crookwell NSW 2583 (02) 48320803 Page 63
There was some difference in herbage production across treatments and trials, and the DAP and DAP/compost once again were superior to the compost treatments. However herbage protein levels was marginally higher for the compost treatments (T2,T3,T4). There were no similar trends for the other forage quality attributes tested.
Compost appeared to contribute to a small degree to soil phosphorus (P) levels, achieving Colwell P levels between 23 and 30, above the base level tested in 2009 of 22. These increases are above crop P removal, which would have been significant in 2010.
No other effects or trends emerged from the trial attributes that were measured.

GROUNDSWELL - Final Agronomy Report
CHRIS HOUGHTON AGRICULTURAL PO Box 18 Crookwell NSW 2583 (02) 48320803 Page 64
9 CONCLUSION
The application of urban waste compost form the Goulburn Mulwaree and Condobolin Shires to agricultural land has been shown in all trials to increase productivity. Although the rates used in the trials are much lower than what are used in horticulture or land rehabilitation, the trials have demonstrated that the rates used are adequate to make a considerable difference. It also appears that the higher rate of 20m³/ha, while possibly being uneconomic in agricultural production systems, was higher than what is required to achieve reliable productivity increases. The higher rates of compost appeared to increase the quantity and quality of herbage across most sites, although the quality attributes measured are influenced by many outside factors. Factors such as whether the plants were actively growing actively or not at the time of testing (moisture, pests, disease), which parts of the plants were tested (leaves or whole plant), and for the pasture samples, which plants or weeds dominating the sward at the time of sampling. However there were some improvements in all four quality attributes that show that improvements in livestock production could be achieved through the application of compost. A small increase in grain yield due to compost application was achieved in the cropping trial at Condobolin, and to a smaller degree still at Forest Lodge and Landtasia. However there was little noticeable variation in grain protein across the different treatments. The yield differences although small, did correlate with the increases in compost applications. It now remains to be determined whether the application of compost is economically viable or not. This same question also relates to the previous question of herbage quantity/quality. The answer lies in:
The relative costs of the compost, freight to the paddock, and spreading.
The quality of the compost
The quantity and relative availability of nutrient in the compost. Soil biology testing did not show any improvements at all that could be attributed to the application of compost. It is not obvious from these trials whether there is an application threshold required to change the soil environment adequately to suit the various microbes. If this is the case, that threshold was not met at the rates used. The purpose of testing for soil microbes was simply to see if there were any noticeable changes to the main groups of due to the application of compost. None were evident. The most logical conclusion to be drawn from this is that soil microbe levels in the soils used for the trials were at adequate levels. Another possibility however could be that compost provides little in the way of the soil microbes capable of enhancing soil microbiology. An important question that needs to be asked is whether productivity improvements could be attributed to changes in soil microbes. Finally, could applications of compost or for that matter any other products that claim to enhance soil microbial activity, provide an economic response. Further research is required to answer these questions. It does appear though from these trials that testing for soil microbes is a quite imprecise science. There was no evidence from any of the soil testing laboratories that provide these services that the tests are calibrated to any practical, useful and repeatable outcomes.
GROUNDSWELL - Final Agronomy Report
CHRIS HOUGHTON AGRICULTURAL PO Box 18 Crookwell NSW 2583 (02) 48320803 Page 65
There was also a definite lack of any clear interpretation information to assist users with decision making, and subsequent follow on action as a result of the testing. Plant tissue tests were carried out at the Landtasia (Bungendore) trial in 2009. They were done as a means of determining whether there was improved nutrient uptake from the different treatments. Soil tissue testing shows exactly what nutrients plants are actually being taken up by the plants. The test results showed no trends, or any other information that could be used. The dry season in 2009 certainly restricted plant growth and subsequent nutrient uptake, but would also have slowed mineralisation of the compost required to make nutrients plant available. No further tissue testing was done on any of the trials. Of the soil nutrients tested, nitrogen was increased in one trial by the use of compost, but not in two other tested. The nitrogen content of compost is usually quite low, but it is also quite variable with availability being dependent on the carbon to nitrogen ratio (C:N) of the compost. Where carbon levels are too high, nitrogen drawdown negates any benefits of the nitrogen to plant growth. The trials have confirmed the theory that compost should not be considered to be a reliable source of nitrogen to plants. Phosphorus is a more stable nutrient in both compost and in soil after it is applied, that is unless it is applied in excessive quantities. As the quantities applied in compost are quite low at the rates commonly used in agriculture, phosphorus normally remains firmly held in the soil. One of the challenges in agriculture is to build phosphorus levels to a point where the soil phosphorus pool releases adequate quantities of the nutrient to meet plant needs. Building soil phosphorus to target levels is normally expensive and takes a considerable time. It is evident from the trial outcomes that compost makes a small but significant contribution to soil phosphorus levels when used in adequate quantities. The outcomes for potassium showed a reliable increase in all three Goulburn district sites, but not for Condobolin. It is evident from these results and work by Paulin (Refs 1 & 6) that compost is an excellent source of potassium, and is freely available in mature compost. Compost application should be considered as an excellent means of replenishing low soil potassium. Potassium deficiency is seldom a problem in cropping, but commonly a problem in pastures on poorly buffered soils where hay and silage production is commonly practiced. Just as compost is high in available potassium, so is the plant material removed in hay and silage due to the high proportion of potassium in plant cell walls. As hay/silage paddocks with such soils can quickly become potassium deficient, there is a potential role for compost in addressing such deficiencies. Another reason why compost is suited to such situations is that it also usually has similar proportions of nitrogen, phosphorus and magnesium to the material removed in hay/silage. Compost is an ideal source of replacement nutrients, however nutrient analysis of the soil and the compost should be conducted to determine correct rates. It appears that compost has considerable potential as a means of replenishing soil carbon. There appeared to be a noticeable improvement in soil carbon at the Narrambula and Strathmere sites near Goulburn, but similar improvements were seen from increased superphosphate application. This raises the question; “Is it the added carbon in the compost

GROUNDSWELL - Final Agronomy Report
CHRIS HOUGHTON AGRICULTURAL PO Box 18 Crookwell NSW 2583 (02) 48320803 Page 66
or the additional plant material produced as a result of the compost and superphosphate application that has caused soil carbon to increase?” Further research over a longer time frame would be required to determine the answer. The same can be said for improvements to soil structure, and to water holding capacity/water use efficiency. Although all of the results from this trial are inconclusive, improvements in these attributes are a known to occur where compost is applied in over a longer time frame. It appears then as has been mentioned several times in the report, that measurable improvements to soil structure, water holding capacity/water use efficiency are a long term consideration. As with soil carbon, it appears that further research over a longer time frame is required. The possibility of weeds and chemical contamination being introduced to agricultural land are a constant concern to both those making compost as well as those who are applying and using it. As has been discussed there are no guarantees that any compost will not be contaminated, when it is sourced from suppliers where the source of the material or the composting process used are unknown. It is a case of buyer beware. Compost should only be purchased from reputable suppliers where well established standards such as “AS 4454” (Ref 5) have been adhered to, and where a rigorous QA system is followed with the sourcing of material, processing and storage. The Groundswell urban waste compost used in these trials has met very high standards and ticked the boxes for high quality compost. This is no guarantee however that quality will remain high at new sites if the program is adopted by other Councils. They will all need to demonstrate due diligence to ensure a high level of management and QA, to ensure the consistency of quality of the end products. The issue of weeds in particular is an ongoing concern for the users of compost. There are always serious weed problems within Shire Council boundaries that landholders will not want on their properties. A few notable weeds that are well established across the Goulburn Shire are African lovegrass (Eragrostis curvula ), Chilean needle grass (Nassella neesiana), and Serrated tussock (Nassella trichotoma). Although there are many dense infestations, some or all of these weeds cannot be found in parts of the Shire, and it would be a shame if they were introduced through the use of compost. Effective pasteurisation and control of diseases, pests and weeds will occur if temperatures above 50-55°C are maintained for four to five days. The beneficial microbes that are responsible for the composting process can survive temperatures up to 70°C (Ref 6). Problems occur where the composting process is not carried out properly, and in particular where dry pockets of compost occur that are not adequately mixed through the process. Accordingly any weed seeds or propagules in these pockets will they will not be adequately pasteurised. In regard to weeds, another problem exists after the composting process is completed, and prior to removal for use. Even if no weeds have survived the composting process, seeds and propagules can enter the compost from wind, birds or from soil that is accidently picked up

GROUNDSWELL - Final Agronomy Report
CHRIS HOUGHTON AGRICULTURAL PO Box 18 Crookwell NSW 2583 (02) 48320803 Page 67
by the loader. To provide an assurance to users that weeds will not be introduced, mature compost should be tested prior to use. There do not appear to be any laboratories in Australia who routinely test compost for weeds, but the Eurofin laboratories in the UK provide a comprehensive compost testing service, the likes of which should be established by one of the reputable environmental laboratories in Australia. It includes testing for germinating of weed seeds and propagules re-growth (See Appendix H). One of the barriers to the use of compost by farmers is the complete lack of information, or the lack of relevance of the information that is provided. Suppliers of compost to farmers should provide a reliable nutrient analysis with the product, as well as information on the source of the material, and evidence that the compost does not contain pathogens, heavy metals or pesticide residues. However, farmers are interested primarily in the nutrients (N,P,K,Mg) in compost, and most will purchase it with the aim of replacing some of the fertiliser that they normally use. Bob Paulin has demonstrated the benefits of nutrient budgeting where compost is used in the vegetable industry (Ref 6). This work showed that to be able to calculate how much compost is required, and how much fertiliser can be replaced with it, they particularly need accurate nutrient analysis information. A test that was conducted 2 or 3 years ago is of little use. Regular testing is needed to demonstrate the reliability of the sellers claims. It appears from this rather broad research project, that more questions have been raised than answers provided. There are many challenges ahead for those who continue to use the Groundswell or any other composting process. The possibility of reversing the illogical situation that presently exists where most organic waste ends in landfill is very attractive. For farmers to be able to source high quality compost from their regional waste depots, to improve their soils while reducing their reliance on fertilisers makes perfect sense. Urgent action is required to remove present institutional and political barriers to urban waste composting. The Groundswell program provides a perfect model. DISCLAIMER This report has been prepared on behalf of and for the exclusive use of Groundswell stakeholders, and is subject to and issued in connection with the provisions of the agreement between Chris Houghton Agricultural and Groundswell stakeholders. Chris Houghton Agricultural accepts no liability or responsibility whatsoever for or in respect of any use of or reliance upon this report by any third party. The content of this report is based on the best available information at the time of preparation. It is based in part on various opinions, assumptions and predictions. Conclusions should be interpreted in the light of the latest information available.

GROUNDSWELL - Final Agronomy Report
CHRIS HOUGHTON AGRICULTURAL PO Box 18 Crookwell NSW 2583 (02) 48320803 Page 68
5 ACKNOWLEDGEMENTS I would like to acknowledge several individuals and organisations for their contribution to the Groundswell agronomy trials.
Andrew Sieler of “Strathmere”, and Andrew Divall of “Narrambulla”, Goulburn, for their cooperation and generous contributions of time and fencing materials.
Richard Graham and Dennis Northey from “Landtasia” for their generous assistance and cooperation.
Noel Trevaskis and Rohan Davies of IncitecPivot for arranging a contribution of fertiliser for the Goulburn trials over the past two years.
Brad Davis, James Mwendwa and Jodie Dean of the Central West Farming Systems for managing the Condobolin cropping trial.
Lisa Hibbert, Eugene Coe and Cecil Coe and the other staff at the Wiradjuri Condobolin
Corporation (WCC) for their assistance with the Condobolin trial work.
Andrew Galland and staff from Goulburn Mulwaree Council for their ongoing and enthusiastic cooperation.
Simone Dilkara our effervescent project officer and Gerry Gillespie of DECCW, undoubtedly the international champion of urban waste composting. Also for their enthusiastic leadership and determination to overcome the many obstacles along the Groundswell journey.

GROUNDSWELL - Final Agronomy Report
CHRIS HOUGHTON AGRICULTURAL PO Box 18 Crookwell NSW 2583 (02) 48320803 Page 69
REFERENCES
(1) Compost in horticulture. Filed in Organics n composting, Bob Paulin and Peter O’Malley, Department of Agriculture, Western Australia, 2008.
(2) Potential for Agri-Industry Wastes as Soil Ameliorants. Jay Maheswarana, et al. 1999.
(3) Increasing the opportunities for use of organic wastes in the Tasmanian vegetable industry. John McPhee, Tasmanian Department of Primary Industries, Water and Environment, 2002.
(4) Sustainable Recycled Organics Usage, On-farm factsheet series, Management – Weed seeds in recycled organics. Fact Sheet M 1.1. Condamine Alliance, 2007.
(5) Australian Standard (4454) Composts, soil conditioners and mulches, Standards Association of Australia, NSW. 1999.
(6) Identifying the benefits of composted soil amendments to vegetable production, Bob Paulin, Department of Agriculture, Western Australia, 2005.
(7) AWB Wheat Quality Fact Sheet, Protein Quality – Protein Level. http://www.awb.com.au/NR/rdonlyres/E09605EA-6950-4430-BB67-5427649318F3/0/Protein_factsheet.pdf
(8) Grappling with compost quality down under, Bob Paulin, Department of Agriculture, Western Australia, 2002.

GROUNDSWELL - Final Agronomy Report
CHRIS HOUGHTON AGRICULTURAL PO Box 18 Crookwell NSW 2583 (02) 48320803 Page 70
APPENDICES
APPENDIX A: Replicated Small Plot Trials for both Goulburn pasture trials
APPENDIX B: Compost biology
APPENDIX C: A summary of final soil test results
APPENDIX D: Screening for Weeds and Contaminants.
APPENDIX E: Understanding feedtest reports
APPENDIX F: Compost feedstocks - typical C:N, density and structure ratings
APPENDIX G: Slaking and Dispersion
Appendix H: Eurofins UK compost testing.

GROUNDSWELL - Final Agronomy Report
CHRIS HOUGHTON AGRICULTURAL PO Box 18 Crookwell NSW 2583 (02) 48320803 Page 71
APPENDIX A:
Replicated Small Plot Trials for both Goulburn pasture trials 1 2 3 4 5 6 7 8
A 1
2 6 5 8 4 3 7
B 2
3 6 4 8 7 5 1
C 1
4 2 6 3 8 5 7
Note: Reference Point is on SW corner of the Strathmere trial and NE corner of the Narrrambula trial. At the Strathmere trial Row A is on the southern side, however, for the Narrrambula trial Row A is on the northern side.
Replicated trial treatments:
1 Compost at 5 m3/ha 2 Compost at 10 m3/ha 3 Compost at 20 m3/ha 4 Superphosphate at 125 kg/ha 5 Superphosphate at 250 kg/ha 6 Bio-phos at 125 kg/ha 7 Bio-phos at 250 kg/ha 8 Control
Treatments for the 3 Paddock Grazing Trial
Paddock A - Small plot treatment 8 NB: Small plot trial is here.
Paddock B - Small plot treatment 2
Paddock C - Small plot treatment 5
Information to be recorded by the farmer in the three paddocks:
1 Grazing duration (dates in and out) 2 Stock details (type and class) 3 Numbers grazed and their average weights. 4 Metabolic condition,( ie: 4-6 months pregnant).
NOTE: The aim of the 3 paddock component is to determine the DSEs/ha carried each year on each paddock
Reference point
Plots sizes: 2 x 4m, with a 1m buffer
between each plot.
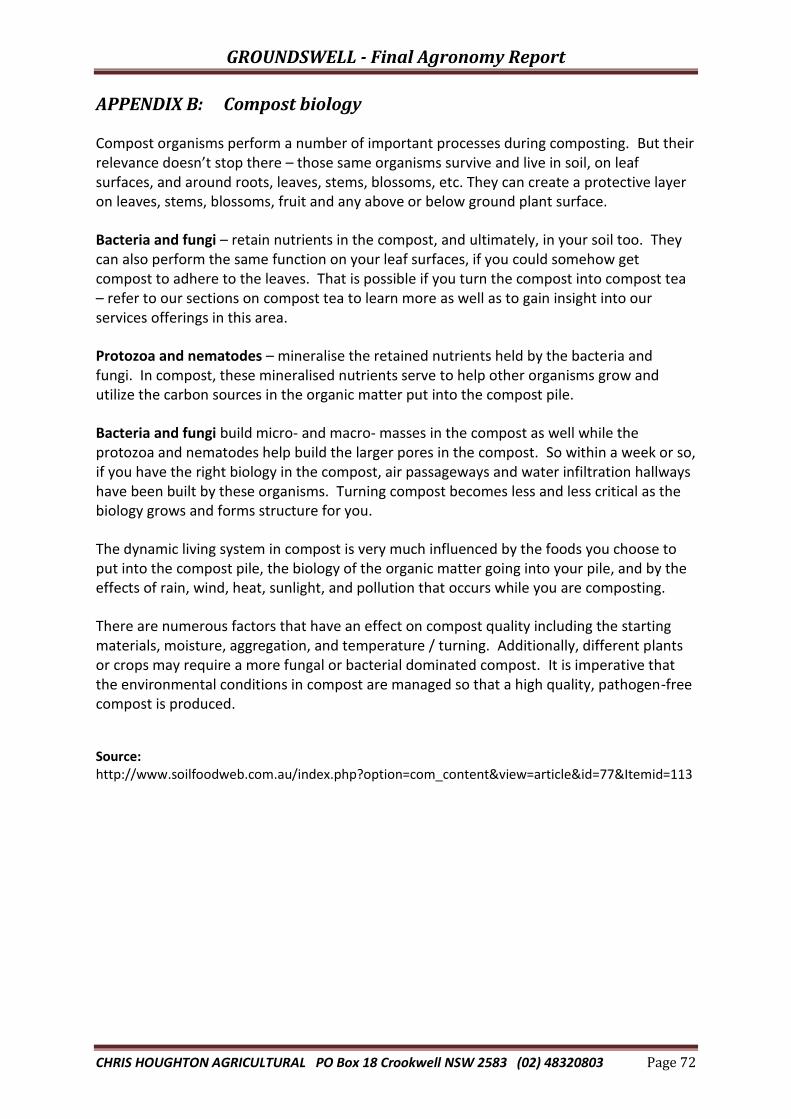
GROUNDSWELL - Final Agronomy Report
CHRIS HOUGHTON AGRICULTURAL PO Box 18 Crookwell NSW 2583 (02) 48320803 Page 72
APPENDIX B: Compost biology
Compost organisms perform a number of important processes during composting. But their relevance doesn’t stop there – those same organisms survive and live in soil, on leaf surfaces, and around roots, leaves, stems, blossoms, etc. They can create a protective layer on leaves, stems, blossoms, fruit and any above or below ground plant surface.
Bacteria and fungi – retain nutrients in the compost, and ultimately, in your soil too. They can also perform the same function on your leaf surfaces, if you could somehow get compost to adhere to the leaves. That is possible if you turn the compost into compost tea – refer to our sections on compost tea to learn more as well as to gain insight into our services offerings in this area.
Protozoa and nematodes – mineralise the retained nutrients held by the bacteria and fungi. In compost, these mineralised nutrients serve to help other organisms grow and utilize the carbon sources in the organic matter put into the compost pile.
Bacteria and fungi build micro- and macro- masses in the compost as well while the protozoa and nematodes help build the larger pores in the compost. So within a week or so, if you have the right biology in the compost, air passageways and water infiltration hallways have been built by these organisms. Turning compost becomes less and less critical as the biology grows and forms structure for you.
The dynamic living system in compost is very much influenced by the foods you choose to put into the compost pile, the biology of the organic matter going into your pile, and by the effects of rain, wind, heat, sunlight, and pollution that occurs while you are composting.
There are numerous factors that have an effect on compost quality including the starting materials, moisture, aggregation, and temperature / turning. Additionally, different plants or crops may require a more fungal or bacterial dominated compost. It is imperative that the environmental conditions in compost are managed so that a high quality, pathogen-free compost is produced.
Source: http://www.soilfoodweb.com.au/index.php?option=com_content&view=article&id=77&Itemid=113

GROUNDSWELL - Final Agronomy Report
CHRIS HOUGHTON AGRICULTURAL PO Box 18 Crookwell NSW 2583 (02) 48320803 Page 73
APPENDIX C: A summary of final soil test results

Nutrient Advantage®
Nutrient Advantage Advice® Summary Report
30/11/2010groundswell Gbn
NSW
Chris Houghton
02 4837 3342
Report Print Date:
Phone:
Advisor/Contact:
Agent/Dealer:
Unit ValueAnalyte / Assay
Treatment 1
021144893
Soil
Divalls Trial
021144894
Divalls Trial
Treatment 2
Soil
021144895
Divalls Trial
Treatment 3
Soil
021144896
Divalls Trial
Treatment 4
Soil
021144897
Divalls Trial
Treatment 5
Soil
021144898
Divalls Trial
Treatment 8
Soil
A14 A14 A14 A14 A14 A14
0 - 10 0 - 10 0 - 10 0 - 10 0 - 10 0 - 10Sample Depth (cm)
Test Code
Sample Name
Sample Type
Paddock Name
Sampling Date
Sample No
Lab Results Received Date 17/11/2010 17/11/2010 17/11/2010 17/11/2010 18/11/2010 18/11/2010
6.40 6.30 6.30 6.40 6.00 6.30pH (1:5 Water)
5.60 5.60 5.50 5.60 5.20 5.40pH (1:5 CaCl2)
1.9 1.7Aluminium Saturation %
2.70 2.90 2.90 2.70 2.80 2.60Organic Carbon (OC) %
2.7 2.3 <1.0 1.6 1.5 2.1Nitrate Nitrogen (NO3) mg/kg
3.1 2.8 3.6 3.0 3.3 3.0Ammonium Nitrogen (KCl) mg/kg
15 18 17 18 25 11Phosphorus (Colwell) mg/kg
50 50 61 56 63 60Phosphorus Buffer Index
(PBI-Col)
120 110 150 85 78 110Available Potassium mg/kg
3.3 4.2 4.4 11.0 18.0 3.9Sulphate Sulphur (KCl40) mg/kg
1.80 1.80 2.60 0.97 0.87 0.94Zinc (DTPA) mg/kg
0.25 0.24 0.28 0.23 0.23 0.26Copper (DTPA) mg/kg
140.0 130.0 170.0 160.0 210.0 170.0Iron (DTPA) mg/kg
13.00 13.00 15.00 12.00 11.00 11.00Manganese (DTPA) mg/kg
0.47 0.49 0.56 0.47 0.40 0.44Boron (Hot CaCl2) mg/kg
21.0 21.0 38.0 19.0 23.0 17.0Chloride mg/kg
0.06 0.06 0.07 0.07 0.08 0.06Electrical Conductivity dS/m
0.60 0.50 0.70 0.70 0.80 0.60Electrical Conductivity
(Saturated Extract)
dS/m
6.28 6.06 5.99 6.80Cation Exchange Capacity meq/100g
5.73 5.88Cation Exchange Capacity meq/100g
Analyses conducted by Nutrient Advantage Laboratory Services
NATA Accreditation No:
Certificate of Analysis is available upon request.
Tel:
Email:
11958 1800 803 453
8 South Road, Werribee VIC 3030
Page 1 of 2Sample No: 021144893 Version: 1

Nutrient Advantage®
Nutrient Advantage Advice® Summary Report
Unit ValueAnalyte / Assay
Treatment 1
021144893
Soil
Divalls Trial
021144894
Divalls Trial
Treatment 2
Soil
021144895
Divalls Trial
Treatment 3
Soil
021144896
Divalls Trial
Treatment 4
Soil
021144897
Divalls Trial
Treatment 5
Soil
021144898
Divalls Trial
Treatment 8
Soil
A14 A14 A14 A14 A14 A14
0 - 10 0 - 10 0 - 10 0 - 10 0 - 10 0 - 10Sample Depth (cm)
Test Code
Sample Name
Sample Type
Paddock Name
Sampling Date
Sample No
Lab Results Received Date 17/11/2010 17/11/2010 17/11/2010 17/11/2010 18/11/2010 18/11/2010
9.80 <9.00Aluminium (KCl) mg/kg
0.11 0.10Aluminium (KCl) meq/100g
80.000 76.000 75.000 81.000Calcium (Amm-acet.) %
5.000 4.600 4.500 5.500 4.300 4.400Calcium (Amm-acet.) meq/100g
75.000 75.000Calcium (Amm-acet.) %
14.000 18.000 17.000 15.000Magnesium (Amm-acet.) %
0.910 1.100 0.990 0.990 0.990 0.990Magnesium (Amm-acet.) meq/100g
17.000 17.000Magnesium (Amm-acet.) %
1.200 1.400 2.200 1.300Sodium (Amm-acet.) %
0.070 0.080 0.130 0.090 0.130 0.100Sodium (Amm-acet.) meq/100g
2.300 1.700Sodium % of Cations
(ESP)
%
4.800 4.600 6.200 3.200Potassium (Amm-acet.) %
0.300 0.280 0.370 0.220 0.200 0.290Potassium (Amm-acet.) meq/100g
3.500 4.900Potassium (Amm-acet.) %
5.5 4.2 4.5 5.6 4.3 4.4Calcium/Magnesium Ratio
0.3 0.3 0.4 0.2 0.2 0.3Potassium to Magnesium
Ratio
Sandy Loam Loam Sandy Loam Sandy Loam Sandy Loam Sandy LoamSoil Texture
Brown Brown Brown Brown Brown BrownSoil Colour
4 4 4 4 4 4Disp. Index Loveday/Pyle
Partial Partial Partial Partial Partial Water StableSlaking 2Hrs
The results reported pertain only to the samples submitted.
Analyses performed on soil dried at 40 degrees Celsius and ground to <2mm (excluding moisture assay)
Analyses performed on plant material dried at 70 degrees Celsius and ground to <2mm
Water analyses performed on an ‘as received’ basis
Analytical results reported by the laboratory as ‘less than’ the level of reporting, will be deemed by Nutrient Advantage Advice as being
equivalent to the level of reporting for both calculation and interpretive purposes
Disclaimer: Laboratory analyses and fertiliser recommendations are made in good faith, based on the best technical information
available as at the date of this report. Incitec Pivot Limited, its officers, employees, consultants, Agents and Dealers do not accept
any liability whatsoever arising from or in connection with the analytical results, interpretations and recommendations provided, and
the client takes the analytical results, interpretations and recommendations on these terms. In respect of liability which cannot be
excluded by law, Incitec Pivot's liability is restricted to the re-supply of the laboratory analysis or the cost of having the analysis
re-supplied.
Page 2 of 2Sample No: 021144893 Version: 1

Nutrient Advantage®
Nutrient Advantage Advice® Summary Report
30/11/2010groundswell Gbn
NSW
Chris Houghton
02 4837 3342
Report Print Date:
Phone:
Advisor/Contact:
Agent/Dealer:
Unit ValueAnalyte / Assay
Treatment 1
021144875
Soil
Sielers property
021144876
Sielers property
Treatment 2
Soil
021144877
Sielers property
Treatment 3
Soil
021144878
Sielers property
Treatment 4
Soil
021144879
Sielers property
Treatment 5
Soil
021144880
Sielers property
Treatment 8
Soil
A14 A14 A14 A14 A14 A14
0 - 10 0 - 10 0 - 10 0 - 10 0 - 10 0 - 10Sample Depth (cm)
Test Code
Sample Name
Sample Type
Paddock Name
Sampling Date
Sample No
Lab Results Received Date 18/11/2010 17/11/2010 17/11/2010 18/11/2010 18/11/2010 18/11/2010
6.10 6.30 6.30 6.00 6.10 6.10pH (1:5 Water)
5.30 5.60 5.60 5.20 5.30 5.30pH (1:5 CaCl2)
1.3 1.4 1.3 1.3Aluminium Saturation %
2.40 2.20 2.50 2.20 2.50 2.20Organic Carbon (OC) %
1.0 2.3 3.9 1.5 4.1 2.0Nitrate Nitrogen (NO3) mg/kg
2.2 3.7 4.8 2.1 3.2 2.6Ammonium Nitrogen (KCl) mg/kg
12 12 18 15 16 13Phosphorus (Colwell) mg/kg
56 51 57 50 51 50Phosphorus Buffer Index
(PBI-Col)
66 64 90 48 62 58Available Potassium mg/kg
5.3 6.2 5.2 12.0 7.7 6.1Sulphate Sulphur (KCl40) mg/kg
2.90 2.10 3.30 2.30 2.90 2.60Zinc (DTPA) mg/kg
0.80 0.70 0.77 0.83 0.80 0.89Copper (DTPA) mg/kg
100.0 110.0 96.0 100.0 97.0 96.0Iron (DTPA) mg/kg
38.00 30.00 37.00 44.00 46.00 45.00Manganese (DTPA) mg/kg
0.41 0.35 0.44 0.36 0.37 0.38Boron (Hot CaCl2) mg/kg
24.0 24.0 25.0 21.0 18.0 19.0Chloride mg/kg
0.05 0.06 0.06 0.07 0.06 0.06Electrical Conductivity dS/m
0.40 0.50 0.50 0.60 0.50 0.50Electrical Conductivity
(Saturated Extract)
dS/m
6.84 8.11Cation Exchange Capacity meq/100g
7.56 6.92 7.57 7.85Cation Exchange Capacity meq/100g
Analyses conducted by Nutrient Advantage Laboratory Services
NATA Accreditation No:
Certificate of Analysis is available upon request.
Tel:
Email:
11958 1800 803 453
8 South Road, Werribee VIC 3030
Page 1 of 2Sample No: 021144875 Version: 1

Nutrient Advantage®
Nutrient Advantage Advice® Summary Report
Unit ValueAnalyte / Assay
Treatment 1
021144875
Soil
Sielers property
021144876
Sielers property
Treatment 2
Soil
021144877
Sielers property
Treatment 3
Soil
021144878
Sielers property
Treatment 4
Soil
021144879
Sielers property
Treatment 5
Soil
021144880
Sielers property
Treatment 8
Soil
A14 A14 A14 A14 A14 A14
0 - 10 0 - 10 0 - 10 0 - 10 0 - 10 0 - 10Sample Depth (cm)
Test Code
Sample Name
Sample Type
Paddock Name
Sampling Date
Sample No
Lab Results Received Date 18/11/2010 17/11/2010 17/11/2010 18/11/2010 18/11/2010 18/11/2010
<9.00 <9.00 <9.00 <9.00Aluminium (KCl) mg/kg
0.10 0.10 0.10 0.10Aluminium (KCl) meq/100g
80.000 80.000Calcium (Amm-acet.) %
6.000 5.500 6.500 5.500 6.000 6.000Calcium (Amm-acet.) meq/100g
79.000 79.000 79.000 76.000Calcium (Amm-acet.) %
16.000 16.000Magnesium (Amm-acet.) %
1.200 1.100 1.300 1.100 1.200 1.500Magnesium (Amm-acet.) meq/100g
16.000 16.000 16.000 19.000Magnesium (Amm-acet.) %
1.200 1.000Sodium (Amm-acet.) %
0.090 0.080 0.080 0.100 0.110 0.100Sodium (Amm-acet.) meq/100g
1.200 1.400 1.500 1.200Sodium % of Cations
(ESP)
%
2.300 2.800Potassium (Amm-acet.) %
0.170 0.160 0.230 0.120 0.160 0.150Potassium (Amm-acet.) meq/100g
2.200 1.700 2.100 1.900Potassium (Amm-acet.) %
5.0 5.0 5.0 5.0 5.0 4.0Calcium/Magnesium Ratio
0.1 0.2 0.2 0.1 0.1 0.1Potassium to Magnesium
Ratio
Clay Clay Loam Clay Loam Clay Loam Clay Loam Clay LoamSoil Texture
Brown Brown Brown Brown Brown BrownSoil Colour
3 2 3 2 2 4Disp. Index Loveday/Pyle
Partial Water Stable Partial Water Stable Water Stable PartialSlaking 2Hrs
The results reported pertain only to the samples submitted.
Analyses performed on soil dried at 40 degrees Celsius and ground to <2mm (excluding moisture assay)
Analyses performed on plant material dried at 70 degrees Celsius and ground to <2mm
Water analyses performed on an ‘as received’ basis
Analytical results reported by the laboratory as ‘less than’ the level of reporting, will be deemed by Nutrient Advantage Advice as being
equivalent to the level of reporting for both calculation and interpretive purposes
Disclaimer: Laboratory analyses and fertiliser recommendations are made in good faith, based on the best technical information
available as at the date of this report. Incitec Pivot Limited, its officers, employees, consultants, Agents and Dealers do not accept
any liability whatsoever arising from or in connection with the analytical results, interpretations and recommendations provided, and
the client takes the analytical results, interpretations and recommendations on these terms. In respect of liability which cannot be
excluded by law, Incitec Pivot's liability is restricted to the re-supply of the laboratory analysis or the cost of having the analysis
re-supplied.
Page 2 of 2Sample No: 021144875 Version: 1

Nutrient Advantage®
Nutrient Advantage Advice® Summary Report
02/03/2011groundswell Gbn
NSW
Chris Houghton
02 4837 3342
Report Print Date:
Phone:
Advisor/Contact:
Agent/Dealer:
Unit ValueAnalyte / Assay
Treatment 6
021144889
Soil
Forest Lodge
Trial
021144890
Forest Lodge
Trial
Treatment 7
Soil
021144891
Forest Lodge
Trial
Treatment 5
Soil
021144892
Forest Lodge
Trial
Treatment 4
Soil
A14 A14 A14 A14
0 - 10 0 - 10 0 - 10 0 - 10Sample Depth (cm)
Test Code
Sample Name
Sample Type
Paddock Name
Sampling Date
Sample No
Lab Results Received Date 18/11/2010 18/11/2010 18/11/2010 18/11/2010
5.20 5.10 5.20 5.20pH (1:5 Water)
4.20 4.20 4.20 4.30pH (1:5 CaCl2)
15.0 17.0 12.0 12.0Aluminium Saturation %
1.40 1.40 1.50 1.60Organic Carbon (OC) %
2.0 <1.0 1.6 1.7Nitrate Nitrogen (NO3) mg/kg
2.6 2.3 2.2 2.9Ammonium Nitrogen (KCl) mg/kg
38 34 36 33Phosphorus (Colwell) mg/kg
38 36 36 37Phosphorus Buffer Index
(PBI-Col)
76 83 78 80Available Potassium mg/kg
2.7 3.0 3.3 6.8Sulphate Sulphur (KCl40) mg/kg
2.00 1.40 2.40 1.90Zinc (DTPA) mg/kg
0.68 0.44 0.62 0.47Copper (DTPA) mg/kg
150.0 130.0 150.0 130.0Iron (DTPA) mg/kg
46.00 40.00 47.00 36.00Manganese (DTPA) mg/kg
0.26 0.24 0.27 0.26Boron (Hot CaCl2) mg/kg
<10.0 <10.0 <10.0 <10.0Chloride mg/kg
0.03 0.03 0.03 0.03Electrical Conductivity dS/m
0.30 0.40 0.30 0.40Electrical Conductivity
(Saturated Extract)
dS/m
3.00 2.43 3.08 2.67Cation Exchange Capacity meq/100g
41.00 38.00 32.00 28.00Aluminium (KCl) mg/kg
Analyses conducted by Nutrient Advantage Laboratory Services
NATA Accreditation No:
Certificate of Analysis is available upon request.
Tel:
Email:
11958 1800 803 453
8 South Road, Werribee VIC 3030
Page 1 of 2Sample No: 021144889 Version: 1

Nutrient Advantage®
Nutrient Advantage Advice® Summary Report
Unit ValueAnalyte / Assay
Treatment 6
021144889
Soil
Forest Lodge
Trial
021144890
Forest Lodge
Trial
Treatment 7
Soil
021144891
Forest Lodge
Trial
Treatment 5
Soil
021144892
Forest Lodge
Trial
Treatment 4
Soil
A14 A14 A14 A14
0 - 10 0 - 10 0 - 10 0 - 10Sample Depth (cm)
Test Code
Sample Name
Sample Type
Paddock Name
Sampling Date
Sample No
Lab Results Received Date 18/11/2010 18/11/2010 18/11/2010 18/11/2010
0.46 0.42 0.36 0.31Aluminium (KCl) meq/100g
1.700 1.300 1.800 1.700Calcium (Amm-acet.) meq/100g
57.000 53.000 58.000 64.000Calcium (Amm-acet.) %
0.630 0.480 0.690 0.440Magnesium (Amm-acet.) meq/100g
21.000 20.000 22.000 16.000Magnesium (Amm-acet.) %
0.020 <0.020 0.030 <0.020Sodium (Amm-acet.) meq/100g
0.800 <0.910 1.000 <0.820Sodium % of Cations
(ESP)
%
0.190 0.210 0.200 0.200Potassium (Amm-acet.) meq/100g
6.300 8.600 6.500 7.500Potassium (Amm-acet.) %
2.7 2.7 2.6 3.9Calcium/Magnesium Ratio
0.3 0.4 0.3 0.5Potassium to Magnesium
Ratio
Sandy Loam Sandy Loam Sandy Loam Sandy LoamSoil Texture
Brown Brown Brown BrownSoil Colour
4 4 4 4Disp. Index Loveday/Pyle
Partial Partial Partial PartialSlaking 2Hrs
The results reported pertain only to the samples submitted.
Analyses performed on soil dried at 40 degrees Celsius and ground to <2mm (excluding moisture assay)
Analyses performed on plant material dried at 70 degrees Celsius and ground to <2mm
Water analyses performed on an ‘as received’ basis
Analytical results reported by the laboratory as ‘less than’ the level of reporting, will be deemed by Nutrient Advantage Advice as being
equivalent to the level of reporting for both calculation and interpretive purposes
Disclaimer: Laboratory analyses and fertiliser recommendations are made in good faith, based on the best technical information
available as at the date of this report. Incitec Pivot Limited, its officers, employees, consultants, Agents and Dealers do not accept
any liability whatsoever arising from or in connection with the analytical results, interpretations and recommendations provided, and
the client takes the analytical results, interpretations and recommendations on these terms. In respect of liability which cannot be
excluded by law, Incitec Pivot's liability is restricted to the re-supply of the laboratory analysis or the cost of having the analysis
re-supplied.
Page 2 of 2Sample No: 021144889 Version: 1
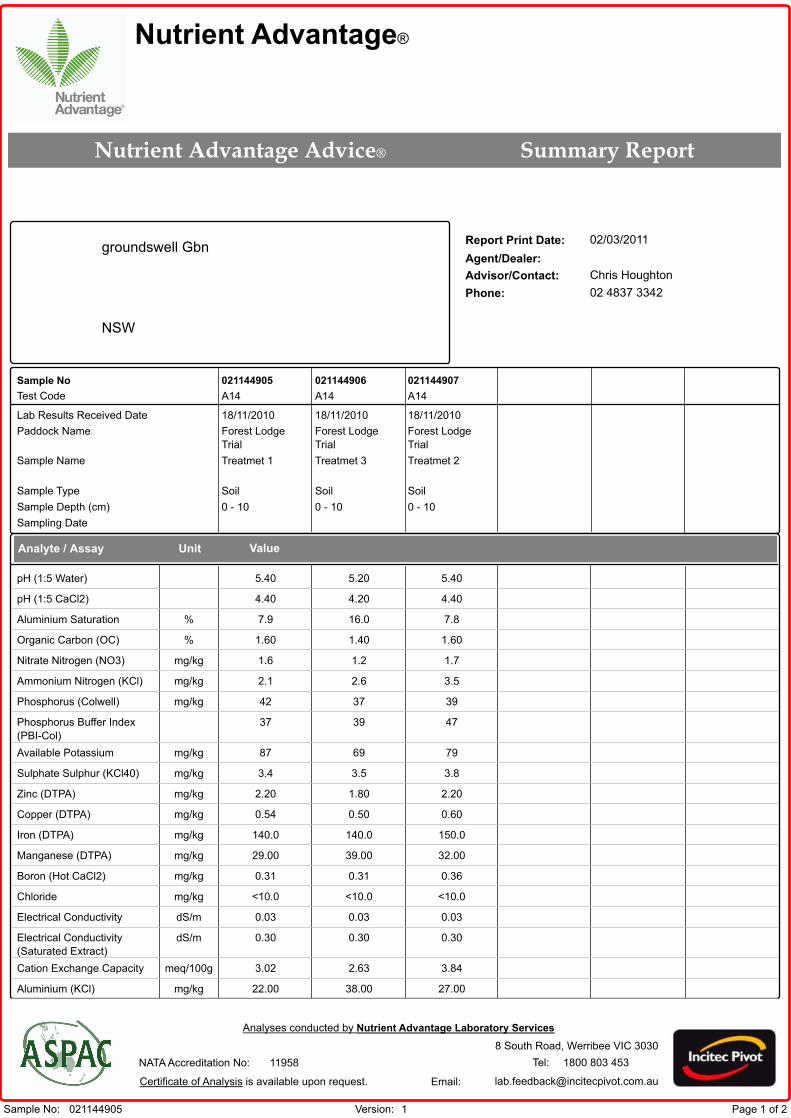
Nutrient Advantage®
Nutrient Advantage Advice® Summary Report
02/03/2011groundswell Gbn
NSW
Chris Houghton
02 4837 3342
Report Print Date:
Phone:
Advisor/Contact:
Agent/Dealer:
Unit ValueAnalyte / Assay
Treatmet 1
021144905
Soil
Forest Lodge
Trial
021144906
Forest Lodge
Trial
Treatmet 3
Soil
021144907
Forest Lodge
Trial
Treatmet 2
Soil
A14 A14 A14
0 - 10 0 - 10 0 - 10Sample Depth (cm)
Test Code
Sample Name
Sample Type
Paddock Name
Sampling Date
Sample No
Lab Results Received Date 18/11/2010 18/11/2010 18/11/2010
5.40 5.20 5.40pH (1:5 Water)
4.40 4.20 4.40pH (1:5 CaCl2)
7.9 16.0 7.8Aluminium Saturation %
1.60 1.40 1.60Organic Carbon (OC) %
1.6 1.2 1.7Nitrate Nitrogen (NO3) mg/kg
2.1 2.6 3.5Ammonium Nitrogen (KCl) mg/kg
42 37 39Phosphorus (Colwell) mg/kg
37 39 47Phosphorus Buffer Index
(PBI-Col)
87 69 79Available Potassium mg/kg
3.4 3.5 3.8Sulphate Sulphur (KCl40) mg/kg
2.20 1.80 2.20Zinc (DTPA) mg/kg
0.54 0.50 0.60Copper (DTPA) mg/kg
140.0 140.0 150.0Iron (DTPA) mg/kg
29.00 39.00 32.00Manganese (DTPA) mg/kg
0.31 0.31 0.36Boron (Hot CaCl2) mg/kg
<10.0 <10.0 <10.0Chloride mg/kg
0.03 0.03 0.03Electrical Conductivity dS/m
0.30 0.30 0.30Electrical Conductivity
(Saturated Extract)
dS/m
3.02 2.63 3.84Cation Exchange Capacity meq/100g
22.00 38.00 27.00Aluminium (KCl) mg/kg
Analyses conducted by Nutrient Advantage Laboratory Services
NATA Accreditation No:
Certificate of Analysis is available upon request.
Tel:
Email:
11958 1800 803 453
8 South Road, Werribee VIC 3030
Page 1 of 2Sample No: 021144905 Version: 1

Nutrient Advantage®
Nutrient Advantage Advice® Summary Report
Unit ValueAnalyte / Assay
Treatmet 1
021144905
Soil
Forest Lodge
Trial
021144906
Forest Lodge
Trial
Treatmet 3
Soil
021144907
Forest Lodge
Trial
Treatmet 2
Soil
A14 A14 A14
0 - 10 0 - 10 0 - 10Sample Depth (cm)
Test Code
Sample Name
Sample Type
Paddock Name
Sampling Date
Sample No
Lab Results Received Date 18/11/2010 18/11/2010 18/11/2010
0.24 0.42 0.30Aluminium (KCl) meq/100g
1.800 1.400 2.200Calcium (Amm-acet.) meq/100g
60.000 53.000 57.000Calcium (Amm-acet.) %
0.730 0.600 1.100Magnesium (Amm-acet.) meq/100g
24.000 23.000 29.000Magnesium (Amm-acet.) %
0.030 0.030 0.040Sodium (Amm-acet.) meq/100g
1.100 1.200 0.990Sodium % of Cations
(ESP)
%
0.220 0.180 0.200Potassium (Amm-acet.) meq/100g
7.300 6.800 5.200Potassium (Amm-acet.) %
2.5 2.3 2.0Calcium/Magnesium Ratio
0.3 0.3 0.2Potassium to Magnesium
Ratio
Sandy Loam Sandy Loam Sandy LoamSoil Texture
Brown Brown BrownSoil Colour
4 4 4Disp. Index Loveday/Pyle
Partial Partial PartialSlaking 2Hrs
The results reported pertain only to the samples submitted.
Analyses performed on soil dried at 40 degrees Celsius and ground to <2mm (excluding moisture assay)
Analyses performed on plant material dried at 70 degrees Celsius and ground to <2mm
Water analyses performed on an ‘as received’ basis
Analytical results reported by the laboratory as ‘less than’ the level of reporting, will be deemed by Nutrient Advantage Advice as being
equivalent to the level of reporting for both calculation and interpretive purposes
Disclaimer: Laboratory analyses and fertiliser recommendations are made in good faith, based on the best technical information
available as at the date of this report. Incitec Pivot Limited, its officers, employees, consultants, Agents and Dealers do not accept
any liability whatsoever arising from or in connection with the analytical results, interpretations and recommendations provided, and
the client takes the analytical results, interpretations and recommendations on these terms. In respect of liability which cannot be
excluded by law, Incitec Pivot's liability is restricted to the re-supply of the laboratory analysis or the cost of having the analysis
re-supplied.
Page 2 of 2Sample No: 021144905 Version: 1

Nutrient Advantage®
Nutrient Advantage Advice® Summary Report
02/03/2011groundswell Gbn
NSW
Chris Houghton
02 4837 3342
Report Print Date:
Phone:
Advisor/Contact:
Agent/Dealer:
Unit ValueAnalyte / Assay
Treatment 2
021144854
Soil
Condo trial
06/12/2010
021144853
Condobolin trial
Treatment 1
Soil
07/12/2010
021144855
Condobolin trial
Treatment 3
Soil
07/12/2010
021144856
Condobolin trial
Treatment 4
Soil
07/12/2010
021144857
Condobolin trial
Treatment 5
Soil
07/12/2010
2010-097 2010-097 2010-097 2010-097 2010-097
0 - 10 0 - 10 0 - 10 0 - 10 0 - 10Sample Depth (cm)
Test Code
Sample Name
Sample Type
Paddock Name
Sampling Date
Sample No
Lab Results Received Date 13/12/2010 13/12/2010 13/12/2010 13/12/2010 13/12/2010
6.00 6.00 5.90 5.90 5.90pH (1:5 Water)
4.90 4.90 4.80 4.90 4.90pH (1:5 CaCl2)
1.2 1.1 1.2 1.1 1.1Aluminium Saturation %
1.10 1.20 1.10 1.10 1.20Organic Carbon (OC) %
28 30 23 27 23Phosphorus (Colwell) mg/kg
700 770 680 750 700Available Potassium mg/kg
4.2 4.2 3.4 4.0 2.5Sulphate Sulphur (KCl40) mg/kg
0.05 0.06 0.05 0.06 0.04Electrical Conductivity dS/m
8.59 9.08 8.47 8.97 8.74Cation Exchange Capacity meq/100g
<9.00 <9.00 <9.00 <9.00 <9.00Aluminium (KCl) mg/kg
0.10 0.10 0.10 0.10 0.10Aluminium (KCl) meq/100g
4.600 4.800 4.600 4.800 4.700Calcium (Amm-acet.) meq/100g
54.000 53.000 54.000 54.000 54.000Calcium (Amm-acet.) %
2.000 2.100 2.000 2.100 2.100Magnesium (Amm-acet.) meq/100g
23.000 23.000 24.000 23.000 24.000Magnesium (Amm-acet.) %
0.090 0.080 0.070 0.070 0.040Sodium (Amm-acet.) meq/100g
1.000 0.860 0.830 0.780 0.500Sodium % of Cations
(ESP)
%
1.800 2.000 1.700 1.900 1.800Potassium (Amm-acet.) meq/100g
21.000 22.000 20.000 21.000 21.000Potassium (Amm-acet.) %
2.3 2.3 2.3 2.3 2.2Calcium/Magnesium Ratio
Analyses conducted by Nutrient Advantage Laboratory Services
NATA Accreditation No:
Certificate of Analysis is available upon request.
Tel:
Email:
11958 1800 803 453
8 South Road, Werribee VIC 3030
Page 1 of 2Sample No: 021144854 Version: 1

Nutrient Advantage®
Nutrient Advantage Advice® Summary Report
Unit ValueAnalyte / Assay
Treatment 2
021144854
Soil
Condo trial
06/12/2010
021144853
Condobolin trial
Treatment 1
Soil
07/12/2010
021144855
Condobolin trial
Treatment 3
Soil
07/12/2010
021144856
Condobolin trial
Treatment 4
Soil
07/12/2010
021144857
Condobolin trial
Treatment 5
Soil
07/12/2010
2010-097 2010-097 2010-097 2010-097 2010-097
0 - 10 0 - 10 0 - 10 0 - 10 0 - 10Sample Depth (cm)
Test Code
Sample Name
Sample Type
Paddock Name
Sampling Date
Sample No
Lab Results Received Date 13/12/2010 13/12/2010 13/12/2010 13/12/2010 13/12/2010
0.9 1.0 0.9 0.9 0.9Potassium to Magnesium
Ratio
13 12 11 10 13Disp. Index Loveday/Pyle
Considerable Considerable Considerable Considerable ConsiderableSlaking 2Hrs
1.9 2.1 1.9 1.9 2.1Organic Matter %
The results reported pertain only to the samples submitted.
Analyses performed on soil dried at 40 degrees Celsius and ground to <2mm (excluding moisture assay)
Analyses performed on plant material dried at 70 degrees Celsius and ground to <2mm
Water analyses performed on an ‘as received’ basis
Analytical results reported by the laboratory as ‘less than’ the level of reporting, will be deemed by Nutrient Advantage Advice as being
equivalent to the level of reporting for both calculation and interpretive purposes
Disclaimer: Laboratory analyses and fertiliser recommendations are made in good faith, based on the best technical information
available as at the date of this report. Incitec Pivot Limited, its officers, employees, consultants, Agents and Dealers do not accept
any liability whatsoever arising from or in connection with the analytical results, interpretations and recommendations provided, and
the client takes the analytical results, interpretations and recommendations on these terms. In respect of liability which cannot be
excluded by law, Incitec Pivot's liability is restricted to the re-supply of the laboratory analysis or the cost of having the analysis
re-supplied.
Page 2 of 2Sample No: 021144854 Version: 1

APPENDIX D: Screening for Weeds and Contaminants.
It should be noted that although the same number of seeds were sown, not all pots had exactly the same number of plants emerged. Hence some of the visual shoot effects may be due to competition
SAMPLE A: Condobolin sample collected May 2010.
Radish pots Root growth Root growth Weed pots
Radish growth details Leaves Roots Comments Excellent growth
Excellent growth
Very little N drawdown evident. Leaves a good colour - only the older leaves yellow with red extremities. Roots to 25cm length showing no signs of stunted growth. Roots were evenly distributed through the pots.
Weed growth details Species No. Comments
Fat hen (Chenopodium album)
2 Common weed of high fertility situations. Possibly from the composting site.
Burr medic (Medicago polymorpha)
1 Common weed of lawns. Could be from the composting site or the trial site.
Unknown 7 Very small broadleaf weeds. Still at cotyledon stage. Possibly clover.
SAMPLE B: Condobolin sample collected September 2010.
Radish pots Leaves Root growth Weed pots
Radish growth details Leaves Roots Comments Moderately restricted
Lacking density
Shoot growth is slightly stunted. Moderate yellowing and red leaf margins indicating possible macro nutrient (N,P,K,S) deficiencies. Root growth appears unaffected by toxicities as roots grew to 21cm length.
Weed growth details Species No. Comments Fat hen 14 Common weed of high fertility situations. Burr medic (Medicago sp.) 1 Common weed of lawns and pasture plant. Could be from the
composting site or the trial site. Summer grass (Digitaria sp) 1 Very common annual summer growing weed. Paddy melon (Cucumis myriocarpus)
1
Common weed of the Condobolin area.
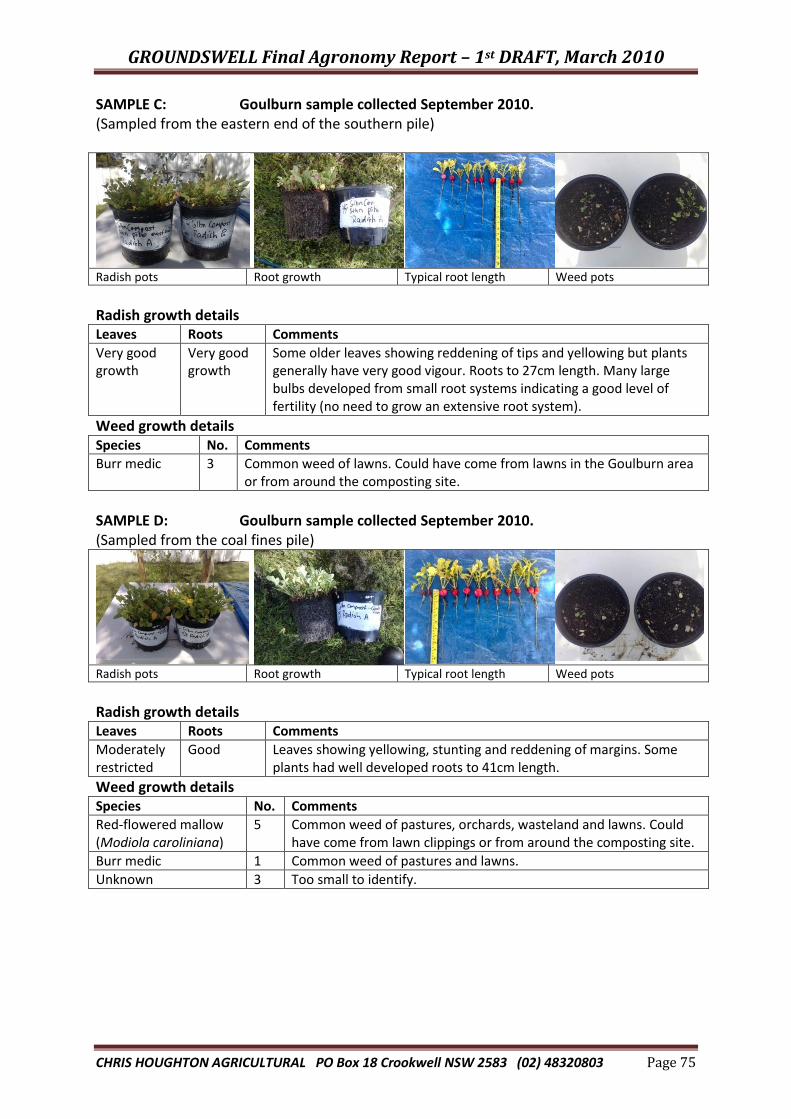
GROUNDSWELL Final Agronomy Report – 1st DRAFT, March 2010
CHRIS HOUGHTON AGRICULTURAL PO Box 18 Crookwell NSW 2583 (02) 48320803 Page 75
SAMPLE C: Goulburn sample collected September 2010. (Sampled from the eastern end of the southern pile)
Radish pots Root growth Typical root length Weed pots
Radish growth details Leaves Roots Comments Very good growth
Very good growth
Some older leaves showing reddening of tips and yellowing but plants generally have very good vigour. Roots to 27cm length. Many large bulbs developed from small root systems indicating a good level of fertility (no need to grow an extensive root system).
Weed growth details Species No. Comments Burr medic 3 Common weed of lawns. Could have come from lawns in the Goulburn area
or from around the composting site. SAMPLE D: Goulburn sample collected September 2010. (Sampled from the coal fines pile)
Radish pots Root growth Typical root length Weed pots
Radish growth details Leaves Roots Comments Moderately restricted
Good Leaves showing yellowing, stunting and reddening of margins. Some plants had well developed roots to 41cm length.
Weed growth details Species No. Comments Red-flowered mallow (Modiola caroliniana)
5 Common weed of pastures, orchards, wasteland and lawns. Could have come from lawn clippings or from around the composting site.
Burr medic 1 Common weed of pastures and lawns. Unknown 3 Too small to identify.

GROUNDSWELL Final Agronomy Report – 1st DRAFT, March 2010
CHRIS HOUGHTON AGRICULTURAL PO Box 18 Crookwell NSW 2583 (02) 48320803 Page 76
SAMPLE E: Goulburn sample collected September 2010. (Sampled from the western end of the northern pile)
Radish pots Root growth Typical root length Weed pots
Radish growth details Leaves Roots Comments Very good growth
Excellent growth
Vigorous growth showing no signs of nutrient deficiency. Root growth is dense throughout the pots.
Weed growth details Species No. Comments Burr medic 2 One well developed and the other just emerged and out of the
cotyledon stage.
SAMPLE F: Goulburn sample collected September 2010. (Sampled from the western end of the southern pile)
Radish pots Root growth Typical root length Weed pots
Radish growth details Leaves Roots Comments Excellent growth
Very good growth
Plants are a good green colour showing no sign of any nutrient deficiency. Red tips and paleness is only evident on older dying leaves. Some bulbs are poorly developed due to a high level of competition between plants. Roots have grown to 27cm. There are no restrictions due to toxicities.
Weed growth details Species No. Comments NA 0 None emerged.
Discussion
Weeds There were some noticeable differences in the growth weeds, both in the variety of weeds and the numbers. Sample B, collected from Condobolin in September, had the highest number of weeds at 17. It was interesting that none of the weeds found were major environmental weeds, and the weeds that germinated were opportunistic species. Fat hen for example is commonly found in recently disturbed soils with reasonably high fertility. Recently spread compost is an ideal place for this type of weed to thrive. Why then were all

GROUNDSWELL Final Agronomy Report – 1st DRAFT, March 2010
CHRIS HOUGHTON AGRICULTURAL PO Box 18 Crookwell NSW 2583 (02) 48320803 Page 77
weed seeds not destroyed in the composting process? There are a number of possible reasons:
1. The compost may not have reached the temperature required for pasteurisation and control of weeds, pests and pathogens. Effective pasteurisation requires that temperatures above 50-55°C are maintained for four to five days (Ref 4 & 6). It is quite likely that this was not the case with Sample B, or there may have been inadequate mixing of the material at the beginning of the composting process. This would have caused pockets in the compost piles not to have heated up as required. This latter issue is a common problem with composting.
2. The second possibility is that the surface on which the compost was prepared was contaminated. Weed seeds could have made their way into the compost from the surface material after the composting process was finished. There is a high likelihood that this has occurred. Both of the composting sites are surrounded by high nutrient loadings in runoff. Weed seeds could get into the compost piles from wind or in run-off water, or may have just been picked up by the loader in the hardstand soil during handling.
The weeds found also had the ability to germinate in the spring/summer period, which many winter growing annuals would not have been able to do. For this reason there may be weed seeds present in the compost that did not germinate now, but could do so if the trial was conducted at a different time of the year. Contaminants Apart from some differences in plant growth due to the varying amounts of nutrients in the compost samples or caused by differences in plant density, there were no plants with obviously retarded root growth that could be attributed to the presence of toxic contaminants. This supports the findings of the laboratory analysis of the compost, where testing was done for heavy metals and pesticides.

APPENDIX D: Screening for Weeds and Contaminants.
It should be noted that although the same number of seeds were sown, not all pots had exactly the same number of plants emerged. Hence some of the visual shoot effects may be due to competition
SAMPLE A: Condobolin sample collected May 2010.
Radish pots Root growth Root growth Weed pots
Radish growth details Leaves Roots Comments Excellent growth
Excellent growth
Very little N drawdown evident. Leaves a good colour - only the older leaves yellow with red extremities. Roots to 25cm length showing no signs of stunted growth. Roots were evenly distributed through the pots.
Weed growth details Species No. Comments
Fat hen (Chenopodium album)
2 Common weed of high fertility situations. Possibly from the composting site.
Burr medic (Medicago polymorpha)
1 Common weed of lawns. Could be from the composting site or the trial site.
Unknown 7 Very small broadleaf weeds. Still at cotyledon stage. Possibly clover.
SAMPLE B: Condobolin sample collected September 2010.
Radish pots Leaves Root growth Weed pots
Radish growth details Leaves Roots Comments Moderately restricted
Lacking density
Shoot growth is slightly stunted. Moderate yellowing and red leaf margins indicating possible macro nutrient (N,P,K,S) deficiencies. Root growth appears unaffected by toxicities as roots grew to 21cm length.
Weed growth details Species No. Comments Fat hen 14 Common weed of high fertility situations. Burr medic (Medicago sp.) 1 Common weed of lawns and pasture plant. Could be from the
composting site or the trial site. Summer grass (Digitaria sp) 1 Very common annual summer growing weed. Paddy melon (Cucumis myriocarpus)
1
Common weed of the Condobolin area.

GROUNDSWELL - Final Agronomy Report
CHRIS HOUGHTON AGRICULTURAL PO Box 18 Crookwell NSW 2583 (02) 48320803 Page 75
SAMPLE C: Goulburn sample collected September 2010. (Sampled from the eastern end of the southern pile)
Radish pots Root growth Typical root length Weed pots
Radish growth details Leaves Roots Comments Very good growth
Very good growth
Some older leaves showing reddening of tips and yellowing but plants generally have very good vigour. Roots to 27cm length. Many large bulbs developed from small root systems indicating a good level of fertility (no need to grow an extensive root system).
Weed growth details Species No. Comments Burr medic 3 Common weed of lawns. Could have come from lawns in the Goulburn area
or from around the composting site. SAMPLE D: Goulburn sample collected September 2010. (Sampled from the coal fines pile)
Radish pots Root growth Typical root length Weed pots
Radish growth details Leaves Roots Comments Moderately restricted
Good Leaves showing yellowing, stunting and reddening of margins. Some plants had well developed roots to 41cm length.
Weed growth details Species No. Comments Red-flowered mallow (Modiola caroliniana)
5 Common weed of pastures, orchards, wasteland and lawns. Could have come from lawn clippings or from around the composting site.
Burr medic 1 Common weed of pastures and lawns. Unknown 3 Too small to identify.

GROUNDSWELL - Final Agronomy Report
CHRIS HOUGHTON AGRICULTURAL PO Box 18 Crookwell NSW 2583 (02) 48320803 Page 76
SAMPLE E: Goulburn sample collected September 2010. (Sampled from the western end of the northern pile)
Radish pots Root growth Typical root length Weed pots
Radish growth details Leaves Roots Comments Very good growth
Excellent growth
Vigorous growth showing no signs of nutrient deficiency. Root growth is dense throughout the pots.
Weed growth details Species No. Comments Burr medic 2 One well developed and the other just emerged and out of the
cotyledon stage.
SAMPLE F: Goulburn sample collected September 2010. (Sampled from the western end of the southern pile)
Radish pots Root growth Typical root length Weed pots
Radish growth details Leaves Roots Comments Excellent growth
Very good growth
Plants are a good green colour showing no sign of any nutrient deficiency. Red tips and paleness is only evident on older dying leaves. Some bulbs are poorly developed due to a high level of competition between plants. Roots have grown to 27cm. There are no restrictions due to toxicities.
Weed growth details Species No. Comments NA 0 None emerged.
Discussion
Weeds There were some noticeable differences in the growth weeds, both in the variety of weeds and the numbers. Sample B, collected from Condobolin in September, had the highest number of weeds at 17. It was interesting that none of the weeds found were major environmental weeds, and the weeds that germinated were opportunistic species. Fat hen for example is commonly found in recently disturbed soils with reasonably high fertility. Recently spread compost is an ideal place for this type of weed to thrive. Why then were all

GROUNDSWELL - Final Agronomy Report
CHRIS HOUGHTON AGRICULTURAL PO Box 18 Crookwell NSW 2583 (02) 48320803 Page 77
weed seeds not destroyed in the composting process? There are a number of possible reasons:
1. The compost may not have reached the temperature required for pasteurisation and control of weeds, pests and pathogens. Effective pasteurisation requires that temperatures above 50-55°C are maintained for four to five days (Ref 4 & 6). It is quite likely that this was not the case with Sample B, or there may have been inadequate mixing of the material at the beginning of the composting process. This would have caused pockets in the compost piles not to have heated up as required. This latter issue is a common problem with composting.
2. The second possibility is that the surface on which the compost was prepared was contaminated. Weed seeds could have made their way into the compost from the surface material after the composting process was finished. There is a high likelihood that this has occurred. Both of the composting sites are surrounded by high nutrient loadings in runoff. Weed seeds could get into the compost piles from wind or in run-off water, or may have just been picked up by the loader in the hardstand soil during handling.
The weeds found also had the ability to germinate in the spring/summer period, which many winter growing annuals would not have been able to do. For this reason there may be weed seeds present in the compost that did not germinate now, but could do so if the trial was conducted at a different time of the year. Contaminants Apart from some differences in plant growth due to the varying amounts of nutrients in the compost samples or caused by differences in plant density, there were no plants with obviously retarded root growth that could be attributed to the presence of toxic contaminants. This supports the findings of the laboratory analysis of the compost, where testing was done for heavy metals and pesticides.

GROUNDSWELL - Final Agronomy Report
CHRIS HOUGHTON AGRICULTURAL PO Box 18 Crookwell NSW 2583 (02) 48320803 Page 78
APPENDIX E Understanding feedtest results
Moisture Is the amount of water in the feed, varying from about 10% in grains and to over 80% for fresh pasture. Dry Matter (DM) DM refers to the amount of feed remaining after the water has been removed. Because the water content of feeds can vary considerably, all analyses are expressed on a dry matter basis and expressed as a percentage. Crude Protein (CP) Protein is composed of nitrogen, carbon, hydrogen, oxygen and sometimes sulphur or phosphorus. As protein contains nitrogen this is used to estimate the protein content of feeds. It is assumed that true protein has 16% nitrogen, so to calculate protein the found nitrogen content is multiplied by 6.25. However some portion of the nitrogen found is non protein nitrogen (ie. Nitrates, ammonia and urea) so this value is referred to as crude protein rather than true protein. Expressed as a percentage. Neutral Detergent Fibre(NDF): So called after the method used to determine it, NDF describes the make up of the cell walls of a plant. It is the portion of fibre composed of hemicellulose, cellulose, lignin, silica, tannins and cutins. NDF is related to feed bulk and can be used in ration formulation to predict forage intake and quality. Forages lower in NDF are usually of high quality and have high levels of intake. NDF is reported as a percentage. Digestibility of Dry Matter (DMD): Is the percentage of the feed dry matter actually digested by the animal. It is estimated by using a laboratory method which is standardised against DDM values from feeding trials. High quality feeds have a DDM of over 65%, whilst feeds below 55%DDM are of poor quality and will not maintain liveweight even if stock have free access to it. Metabolisable Energy (ME) ME is the feed energy actually used by the animal and is expressed as megajoules per kilogram of dry matter (Mj/kg DM). It involves the measurement of energy excreted in faeces, urine and exhaled as methane. This requires very specialised and expensive equipment and is conducted at only a very few locations around the world. In Australia, ME cannot be measured by a laboratory and is instead predicted from other tests, most accurately from digestibility.

GROUNDSWELL - Final Agronomy Report
CHRIS HOUGHTON AGRICULTURAL PO Box 18 Crookwell NSW 2583 (02) 48320803 Page 79
APPENDIX F
Compost feedstocks - typical C:N, density and structure ratings
Source: Compost Production and Use in Horticulture, Bob Paulin and Peter O’Malley, 2008.

GROUNDSWELL - Final Agronomy Report
CHRIS HOUGHTON AGRICULTURAL PO Box 18 Crookwell NSW 2583 (02) 48320803 Page 80
APPENDIX H: Slaking and Dispersion Source: A - http://www.dpi.nsw.gov.au/__data/assets/pdf_file/0008/127277/Slaking-and-dispersion.pdf
B - Nutrient Advantage fact sheets.
C - Field Guide -Diagnosis of sodicity and related problems of soil and irrigation water in the sugar industry.
Slaking is the breakdown of a lump of soil into smaller fragments on wetting. It is caused when clay
swells and the trapped air bursts out. Organic matter reduces slaking by binding mineral particles and
by slowing the rate of wetting. Most cultivated soils in Australia are prone to slaking. The results can
be either good or bad, depending on the size of the fragments produced. Slaking is involved in the
process of self-mulching, which occurs in many cracking clays. Crusting or hardsetting soils slake
into very small fragments that run together and then set hard on drying. This condition is evident in
many red brown and transitional red brown earths.
Dispersion (the separation of soil into single particles) is governed by soil texture, clay type, soil
organic matter, soil salinity and exchangeable cations. A soil that disperses on wetting has a very
unstable structure. It can form a surface crust or hard clods on drying. Pores below the surface can
become blocked by dispersed soil particles. Dispersive soil is likely to swell strongly when wet,
further restricting water and air movement. Dispersion of soil slows down the intake of water to the
root zone following rainfall.

GROUNDSWELL - Final Agronomy Report
CHRIS HOUGHTON AGRICULTURAL PO Box 18 Crookwell NSW 2583 (02) 48320803 Page 81
APPENDIX H: Eurofins UK compost testing.
Welcome to Eurofins UK With about US$ 900 million annual sales and 8,000 employees across 150 sites in 29 countries, Eurofins Scientific is a leading international group of laboratories providing an unparalleled range of testing and support services to the pharmaceutical, food, environmental and consumer products industries and to governments. Eurofins has a network of 9 sites in the UK and Ireland through which our customers access a portfolio of over 25,000 analytical methods addressing the authenticity, origin, safety, identity, composition and purity of biological substances
Compost Testing to PAS 100 There has been significant growth in recycling materials for compost as part of increased environmental concerns and the costs of disposal. This resulted in ‘shred and spread’, the poorly managed application of green waste materials onto agricultural land.
What is PAS 100? PAS 100 (Publicly Available Specification 100) Specification for Composted Materials has been introduced as a minimum requirement for the process of composting to ensure reliable, safe and consistent product. Composters are currently required to meet the requirements of PAS 100 in order to market their product as a composted material. The requirements for the quality of composted materials specify upper limits for human pathogen indicator species, potentially toxic elements, physical contaminants and weed propagules. They also specify minimum performance in a plant germination and growth tests. PAS 100 is sponsored by the Waste and Resource Action Programme (WRAP) and monitored by the Association for organics Recycling (AfOR).
Testing Requirements Eurofins in Wolverhampton offers comprehensive and consistent testing, approved by AfOR. We request that the minimum sample size is 15 litres. The following tests constitute the minimum testing requirements required for a composter to gain PAS 100 approval:
PARAMETER UNIT UPPER LIMIT
Pathogens (Human and animal indicator species)
Salmonella 25g fresh mass Absent
Escherichia coli CFU g fresh mass 1000
Potentially toxic elements
Cadmium mg/kg dry matter 1.5
Chromium mg/kg dry matter 100
Copper mg/kg dry matter 200
Lead mg/kg dry matter 200
Mercury mg/kg dry matter 1.0
Nickel mg/kg dry matter 30
Zinc mg/kg dry matter 50
Stability / maturity
Microbial respiration rate Mg CO2/g organic matter/day 16

GROUNDSWELL - Final Agronomy Report
CHRIS HOUGHTON AGRICULTURAL PO Box 18 Crookwell NSW 2583 (02) 48320803 Page 82
Germination and growth test
Reduction in germination of plants in amended compost as % of germinated plants in peat control
20
Reduction in plant mass above surface in amended compost as % of plant mass above surface in peat control
20
Description of any visible abnormalities
No abnormalities
Weed seeds and propagules
Germinating weed seeds or propagules re-growth
Mean number per litre of compost 0
Physical contaminants
Total glass, metal, plastic and any “other” non-stone fragments > 2mm
% mass/mass of “air-dry” sample 0.5 (of which 0.25 is plastic)
Stones
Stones > 4mm in grades other than “mulch”
% mass/mass of “air-dry” sample 8
Stones > 4mm in “mulch” grade 16
Additional Parameters In addition to the above required tests, Eurofins are able to offer a number of additional parameters that relate to the nutritional status of the final product.
Source: http://www.eurofins.co.uk/our-services/agro-sciences/compost-testing-to-pas-100.aspx


![Groundswell : [brochure] constructing the contemporary ... · Groundswell : [brochure] constructing the contemporary landscape Date 2005 Publisher The Museum of Modern Art Exhibition](https://static.fdocuments.us/doc/165x107/5ae2dce87f8b9ae74a8cfdb8/groundswell-brochure-constructing-the-contemporary-brochure-constructing.jpg)