GROUNDNUT MARKET VALUE CHAIN PROFILE …webapps.daff.gov.za/AmisAdmin/upload/Groundnut Value Chain...
31
1 GROUNDNUT MARKET VALUE CHAIN PROFILE 2014 Department of Agriculture, Forestry and Fisheries Directorate Marketing Private Bag X 15 Arcadia 0007 Tel: 012 319 8455/6 Fax: 012 319 8131 Email: [email protected]
Transcript of GROUNDNUT MARKET VALUE CHAIN PROFILE …webapps.daff.gov.za/AmisAdmin/upload/Groundnut Value Chain...

1
GROUNDNUT MARKET VALUE CHAIN PROFILE
2014
Department of Agriculture Forestry and Fisheries
Directorate Marketing Private Bag X 15
Arcadia 0007
Tel 012 319 84556 Fax 012 319 8131
Email MogalaMdaffgovza
2
TABLE OF CONTENTS
1 DESCRIPTION OF THE INDUSTRY 3
11 Producing Areas 4
12 Production Trends 4
3 MARKET STRUCTURE 5
21 Domestic Market and Prices 5
22 Exports 7
23 Share Analysis 15
2 4 Imports 17
25 Processing 20
26 Market Value Chain 23
3 Market Intelligence 24
31 Tariffs 24
32 Performance of the groundnut industry 26
4 ACKNOWLEDGEMENTS 31
3
1 DESCRIPTION OF THE INDUSTRY Groundnuts contribute approximately 11 to the gross value of field crops production The average annual gross value of groundnuts production for the previous ten years up to 201213 season amounts to approximately R 411 256 million Groundnuts can be consumed in an unprocessed state but they also serve in the economy as raw materials for the manufacturing of various products These include but not limited to the manufacturing of such products as peanuts peanut butter sweets and cooking oil The production of groundnuts is highly affected by the costs of production inputs as well as the demand for groundnuts The contribution of the groundnut industry to the gross value of agricultural production is summarized in Figure 1
Source Statistics and Economic Analysis
The gross value of groundnut production as shown in Figure 1 above was relatively higher during 200304 season and this was followed by a slight decline in the gross value of groundnut production during 200405 season The contribution of the groundnut industry to the gross value of agricultural production was characterized by fluctuations throughout the period under analysis with some consistent increases between 200607 and 200809 seasons The gross value of production has reached the highest level during 200809 mainly as a result of relatively higher levels of production coupled with higher producer prices at the time The contribution of the groundnut industry to the GVP declined slightly between 200910 and 201011 seasons and this was followed by a slight increase during 201112 season The period under analysis closed with relatively lower gross value of groundnut production in 201213 season
0
100000
200000
300000
400000
500000
600000
700000
800000
R0
00
Years
Figure 1 Groundnut Gross Value of Production
4
11 Producing Areas
Figure 2 below shows the contribution of each province to the total groundnuts production in South Africa The figure clearly indicates that the groundnuts are produced mainly in three provinces namely the Free State (38) Northern Cape (33) and North West Province (24) Groundnuts are also produced in Limpopo KwaZulu-Natal and Gauteng provinces although the production is lower in these provinces
Source Statistics and Economic Analysis
Table 1 Groundnut production by provinces
PROVINCE Production (tons) 200708
Production (tons) 200809
Production (tons) 200910
Production (tons) 201011
Production (tons) 201112
Production (tons) 201213
Northern Cape
21500 31 000 27 120 18 950 16900 14000
Free State 35 700 33 690 35 000 20 700 21800 16200
Kwazulu-Natal
80 0 300 0 150 150
Limpopo 5 810 6 750 3 520 3 500 3350 1200
North West 25 650 28 000 22 000 20 900 16800 10000
Gauteng 60 60 60 0 0 0
Source Statistics and Economic Analysis
Table 1 indicates that during the past three years Free State Province has been the major producer of groundnuts even though groundnut production in this province has experienced considerable fluctuations during this period Northern Cape is the second largest producer of groundnuts after Free State However North West Province increased its production significantly during 200708 and surpassed Northern Capersquos production volumes Notably groundnut production in all the major producing regions has undergone a drastic decline during 201213 season leading to a slight decline in South Africarsquos total groundnuts production Gauteng Province has no recorded any groundnuts production volume from 201011 until 201213
Northern Cape 33
Free State 38
Kwazulu-Natal 0
Mpumalanga 2
Limpopo 3
Gauteng 0
North West 24
Figure 2 Groundnuts Production by Province 201213
5
Plantings and production trends of groundnuts from 200304 to 201213 production seasons are as depicted in Figure 3 below
Source Statistics and Economic Analysis
Figure 3 makes it clear that production volumes for groundnuts were at higher levels during the 200304 marketing season and this was followed by a slight decline in groundnuts production volumes during 200405 season During the 200506 season the production increased slightly followed by a slight decline in area planted for groundnuts during the 200607 season Despite only slight decrease in the area planted to groundnuts during 201011 season groundnuts production volumes declined significantly during that time indicating a slight decline in yields The period under analysis closed with relatively lower volumes of groundnut production despite a slight increase in area planted during 201213 season
3 MARKET STRUCTURE
21 Domestic Market and Prices
Figure 4 indicates the local production together with consumption of groundnut in South Africa Generally the production and consumption of groundnut fluctuated considerably throughout the period under analysis The figure indicates that the period under analysis opened with production of groundnuts being more than the consumption implying that there was enough groundnuts production and less consumption in South Africa in 200304 as indicated in the figure The figure further indicates that production and consumption of groundnuts in 200506 and 200607 was more or less the same
200304
200405
200506
200607
200708
200809
200910
201011
201112
201213
Total Area Planted
72000 40000 49000 41000 54000 55000 57000 55000 45000 47000
Production 128000 72000 84000 66000 100000 113000 100000 73000 67000 47000
0
20000
40000
60000
80000
100000
120000
140000
0
10000
20000
30000
40000
50000
60000
70000
80000
Pro
du
ctio
n (
Ton
)
Are
a P
lan
ted
(H
a)
Years
Figure 3 Production vs Total Area planted
Total Area Planted Production
6
The figure also indicates that between 200708 and 201112 production of groundnuts was more than the consumption of groundnuts The period under analysis closed with less production volume compared to consumption volumes in 201213 season
Source Statistics and Economic Analysis The average producer prices for groundnuts from 200304 to 201213 season are as indicated in Figure 5 below
Source Statistics and Economic Analysis
0
20000
40000
60000
80000
100000
120000
140000
To
n
Period (Years)
Figure 4 Local Groundnut Production vs Consumption
Production Consumption
200304
200405
200506
200607
200708
200809
200910
201011
201112
201213
Price (Rton) 287015 246421 289833 606916 584376 624881 444487 496227 832993 875851
0
1000
2000
3000
4000
5000
6000
7000
8000
9000
10000
Pri
ce(R
To
n)
Years
Figure5 Producer Prices for Groundnuts
7
Figure 5 shows that producer prices for groundnuts were very low during the opening season of the period under analysis (200304) The price declined significantly to the lowest level during 200405 season Generally the figure indicate fluctuating trend of groundnut producer price This was followed by gradual increase in groundnuts producer price between 200506 and 200809 The figure indicates that the period under analysis closed with higher producer prices for the product in 201213 season (R8 78551ton) Figure 6 shows the utilization of groundnuts in South Africa from 200304 to 201213 The figure shows that groundnuts in South Africa are utilized mainly for manufacturing peanut butter for sales as raw peanuts to the direct market for oil and oilcake and for seed The figure further indicates that groundnut is mainly used for peanut butter and direct market as compared to the use for oil amp oilcake and seed On average 2 550 tons of groundnuts are sold for crushing into oil and oilcake in the domestic market while 3 456 tons are directed to the animal feed and seed markets
Source Statistics and Economic Analysis
22 Exports
The volume and value of groundnuts exports from South Africa to the world are summarized in Figure 7 below Figure 7 indicates volume and value of groundnuts exports from 2004 to 2013 The figure indicates that throughout the period under analysis the quantity of groundnuts exports were consistent with the value of groundnuts exports The period under review opened with moderate volume of groundnuts exports On average 14 117 tons were exported at the value of 138 million The figure further indicates that exports of groundnuts fluctuated considerably over the period under analysis The highest volume of groundnuts exports were recorded in 2010 (24977 tons) and the lowest was recorded in 2013 (8 383 tons)
0
10000
20000
30000
40000
50000
60000
70000
Vo
lum
e (
Ton
s)
Marketing Years
Figure 6 Utilization of Groundnuts in the domestic market
Oil and oilcake Peanut butter and direct edible market Seed and unshelled
8
Source Statistics amp Economic Analysis and Quantec Easydata
South Africa imports its groundnuts from countries such as Mozambique Malawi Argentina China and India as shown in Figure 8
Source ITC Trade Map
Figure 8 below shows exporters of groundnuts to the Republic of South Africa during the year 2013 The figure indicates that Mozambique is the largest exporters of groundnuts into South African markets followed by Malawi India Argentina and China in 2013 During the same year Mozambique accounted for about 69 of the total groundnuts imported by South Africa followed by Malawi (16) and India
0
50000
100000
150000
200000
250000
0
5000
10000
15000
20000
25000
30000
2004 2005 2006 2007 2008 2009 2010 2011 2012 2013
Exp
ort
Valu
e (
R000)
Exp
ort
vo
lum
e (
To
ns)
Period (Years)
Figure 7 Volume and value of groundnuts exports - 2004 to 2013
Quantity Value
China 2
Malawi 16 Argentina
2
India 11
Mozambigue 69
Figure 8 Exporters of Groundnuts to RSA in 2013
9
with 11 Both China and Argentina contributed 2 each towards South Africarsquos total groundnut imports
Source Quantec Easy data
Figure 9 indicates volume of groundnuts exports to various regions in the world The figure indicates that South Africa exports mainly to Europe Asia and Africa The figure also indicates that volumes of groundnuts exports to America and Oceania are less than 400 tons of groundnuts per year Figure 9 shows that groundnut exports from South Africa are destined for the markets in Europe Asia Africa the Americas and Oceania The figure indicates that exports to Europe and Asia are more than those destined to neighboring countries to South Africa within the African continent which is not surprising as most countries in Africa are involved mostly in primary agricultural production than in processing Generally the volume of groundnuts exports to Europe started to decline from 2006 until 2007 followed by slight increases between 2008 and 2010 Exports to Asia fluctuated at moderate levels from the year 2004 until some increases were experienced in 2008 The period under review closed with larger volumes of groundnuts exports being destined to Europe followed by Asia Figure 10 indicates exports of groundnuts to European Union from 2004 to 2013 The exports of groundnuts to this region were fluctuating throughout the period under analysis The figure indicates that the South African groundnuts exports over the period under review were destined mainly to Netherlands United Kingdom and Germany Exports to Belgium and Finland remained minimal The period under analysis closed with Netherlands accumulating large volume of groundnuts originating from South Africa
2004 2005 2006 2007 2008 2009 2010 2011 2012 2013
Africa 26433 19157 13585 10703 19373 20326 39759 84493 28516 18393
Americas 0 0 0 60 0 186 181 3168 90 0
Asia 65362 9022 72082 4645 74967 4542 75236 48864 39399 25622
Europe 6715 92769 37215 27005 46637 46552 13298 73614 55142 38556
Oceania 108 39608 252 198 3864 216 162 324 144 144
0
2000
4000
6000
8000
10000
12000
14000
Exp
ort
s V
olu
me (
ton
s)
Period (years)
Figure 9 Volume of groundnuts exports to various regions
Africa Americas Asia Europe Oceania
10
Source Quantec Easy data
Figure 11 presents exports of groundnuts to Eastern Asia from 2004 to 2013 The figure indicates that in Eastern Asia South Africa exports groundnuts mainly to Japan The figure further indicates that exports of groundnuts to China and Hong Kong were very low and erratic during period under analysis As depicted in Figure 11 below exports of groundnuts from South Africa to Eastern Asia have generally been declining from 2005 until the year 2015 mainly because Japan who is the major importer of groundnuts from South Africa in Eastern Asia substituted imports from South Africa with those from Argentina and Brazil
Source Quantec Easy data
2004 2005 2006 2007 2008 2009 2010 2011 2012 2013
Belgium 380 540 360 00 1300 980 970 00 00 00
Germany 19310 33100 16300 8220 1340 3440 14468 7690 00 00
Finland 1799 580 00 00 4700 1140 2880 2344 1218 791
United Kingdom 9425 21439 4860 3480 7025 900 22056 5064 00 00
Netherlands 31336 35131 13855 12505 25132 34506 87495 53437 51590 34023
00 10000 20000 30000 40000 50000 60000 70000 80000 90000
100000
Ex
po
rt V
olu
me
(T
on
s)
Period (Years)
Figure 10 Volume of groundnuts exports to the European Union
Belgium Germany Finland United Kingdom Netherlands
2004 2005 2006 2007 2008 2009 2010 2011 2012 2013
China 0 0 0 0 18 0 0 0 0 0
Hong Kong 0 0 0 0 0 0 0 181 0 0
Japan 6536 9022 7120 4608 7478 4434 6048 4706 3904 2562
0 1000 2000 3000 4000 5000 6000 7000 8000 9000
10000
Exp
ort
Vo
lum
e (
To
ns)
Period (years)
Figure 11 Volume of groundnuts exports to Eastern Asia
China Hong Kong Japan
11
Figure 12 above indicates volumes of groundnuts exports to the SADC region from 2004 to 2013 The figure indicates that South Africa exports groundnuts more greatly to Mozambique and Zimbabwe Exports of groundnuts to Zambia were very lower during the period under analysis The figure further indicates that Angola is also an important market for South African groundnuts Exports groundnuts from South Africa to the SADC countries with the exception of Mozambique were very low between the years 2011 and 2013
Source Quantec Easy data
Figure 13 shows exports of groundnuts by province from 2004 to 2013
Source Quantec Easy data
0
500
1000
1500
2000
2500
3000
2004 2005 2006 2007 2008 2009 2010 2011 2012 2013
Ex
po
rt V
olu
me
(To
ns)
Period (Years)
Figure 12 Volume of groundnuts exports to the SADC region
Angola Mozambique Zambia Zimbabwe
0
20000000
40000000
60000000
80000000
100000000
120000000
140000000
160000000
2004 2005 2006 2007 2008 2009 2010 2011 2012 2013
Ex
po
rt V
alu
e (
Ra
nd
s)
Period (Years)
Figure 13 Value of groundnuts exports by Provinces
Western Cape Northern Cape Free State Kwazulu-Natal North West Gauteng Mpumalanga Limpopo
12
Figure 13 above indicates that Gauteng province is the greatest exporters of groundnuts produced in South Africa followed by Northern Cape and Kwazulu-Natal The figure further indicates that exports from the largest producer (Free State) were very low throughout the period under analysis and this mainly influenced by lack of necessary marketing infrastructure It is also clear that the values of exports from different provinces were fluctuating throughout the period under analysis with those from Western Cape being at the lowest level throughout the period under analysis Figure 14 presents the value of groundnuts exports in Gauteng province from 2004 to 2013 The figure indicates that City of Tshwane is the major exporters of groundnuts as compared to other district Generally exports of groundnuts from Gauteng province were highly volatile throughout the period under analysis The figure also indicates that Ekurhuleni and West Rand also contributes significantly towards Gauteng provincersquos total value of groundnuts exports The period under analysis closed with Ekurhuleni commanding the greatest share of Gautengrsquos value of groundnuts exports
Source Quantec Easy data
Figure 15 below shows value of groundnut exports from North West province during the period 2004 to 2013 Observable from the figure is very low and erratic trend with regard to exports of groundnuts from various districts in the province Bojanala District Municipality was the greatest exporter of groundnuts from North West province between 2004 and 2008 Exports of groundnuts from this district declined dramatically during the year 2009 and remained very low for the rest of the period under analysis Some lower export values were recorded during the year 2012 and 2013
0
10000000
20000000
30000000
40000000
50000000
60000000
70000000
2004 2005 2006 2007 2008 2009 2010 2011 2012 2013
Exp
ort
s V
alu
e (
Ran
ds)
Period (Years)
Figure 14 Value of groundnuts exports from Gauteng Province
West Rand District Municipality Ekurhuleni Metropolitan Municipality City of Johannesburg Metropolitan Municipality City of Tshwane Metropolitan Municipality
13
Source Quantec Easy data
Values of groundnut exports from KwaZulu-Natal Province for the period 2004 to 2013 are shown in Figure 16 below Figure 16 indicates value of groundnuts exports from Kwazulu-Natal during 2004 to 2013The figure indicates that the value of groundnuts export during the period of analysis was highly volatile The figure indicates that eThekwini commands the greatest value of groundnuts exports from the provinces followed by Umgungundlovu Umzinyathi The period under review closed with lower levels of groundnuts exports from KwaZulu-Natal Province
Source Quantec Easy data
0
5000000
10000000
15000000
20000000
25000000
30000000
35000000
40000000
2004 2005 2006 2007 2008 2009 2010 2011 2012 2013
Ex
po
rt V
alu
e (
Ra
nd
s)
Period (Years)
Figure 15 Value of groundnuts exports from North West Province
Bojanala District municipality Central District municipality Bophirima District municipality Southern District municipality
0
5000000
10000000
15000000
20000000
25000000
30000000
35000000
40000000
2004 2005 2006 2007 2008 2009 2010 2011 2012 2013
Exp
ort
Valu
e (
Ran
ds)
Period (Years)
Figure 16 Value of groundnuts exports from KwaZulu-Natal Province
UMgungundlovu District municipality Uthukela District municipality
iLembe District municipality eThekwini Metropolitan Municipality
14
Source Quantec Easy data
Figure 17 indicates value of groundnuts exports from Western Cape during 2004 to 2013The figure indicates that City of Cape Town was the major exporter of groundnuts in Western Cape for a better part of the period under analysis The figure further indicates that Cape Winelands exported only from 2010 until 2013 while Eden district exported only in 2012
Source Quantec Easy data
2004 2005 2006 2007 2008 2009 2010 2011 2012 2013
City of Cape Town 62 3246 11677 18446 5245 12712 18581 55298 974 1149
Cape Winelands 0 0 0 0 0 0 45420 6213 25250 677
Eden District municipality 0 0 0 0 0 0 0 0 23573 0
0
10000
20000
30000
40000
50000
60000
Ex
po
rts
va
lue
(R
an
ds
)
Period (Years)
Figure 17 Value of groundnuts exports from Western Cape Province
City of Cape Town Cape Winelands Eden District municipality
0
1000000
2000000
3000000
4000000
5000000
6000000
7000000
2004 2005 2006 2007 2008 2009 2010 2011 2012 2013
Ex
po
rt V
alu
e (
Ra
nd
s)
Period (Years)
Figure 18 Value of groundnuts exports from Free State
Lejweleputswa District municipality Northern Free State District municipality
15
Figure 18 shows value of groundnuts exports from Free State during 2004 to 2013The figure indicates that generally Free State is not major exporters of groundnuts Despite the facts that is the largest producer of groundnuts in South Africa Exports of groundnuts in Free State originate only from two districts Lejweleputswa and Northern Free State Lejweleputswa exported only in 2010 and 2013 while Northern Free State recorded exports only in 2004
Source Quantec Easy data
Figure 19 shows value of groundnuts exports from Northern Cape during 2004 to 2013The figure indicates that out of all the districts in Northern Cape only one district (Frances Baard) exports groundnuts The figure further indicates that Frances Baard recorded highest value of groundnuts exports during the year 2012
23 Share Analysis
Table 2 Contribution of various provinces to South Africarsquos total value of groundnuts export ()
Year 2004 2005 2006 2007 2008 2009 2010 2011 2012 2013 Province
Western Cape
000 000 002 003 000 001 003 003 003 003
Northern Cape
760 830 882 1176 1161 1421 2279 3155 3244 2511
Free State 049 019 000 019 000 000 283 000 045 470
Kwazulu-Natal
3669 2849 2950 1612 000 809 1075 1125 416 550
North West 2095 2276 2344 3258 000 000 000 001 423 303
Gauteng 3423 4025 3822 3933 6360 7769 6359 5652 5868 6107
Source Calculated from Quantec Easy data
0
10000000
20000000
30000000
40000000
50000000
60000000
70000000
2004 2005 2006 2007 2008 2009 2010 2011 2012 2013
Exp
ort
s V
alu
e(R
and
s)
Period(Years)
Figure19 Value of groundnuts exports from Nothern Cape Province
Frances Baard District municipality
16
Table 2 confirms the earlier observation that Gauteng province is the largest contributor towards South Africarsquos total value of groundnuts exports followed by Kwazulu-Natal and Northern Cape provinces The table further indicates that the share of groundnuts exports from other provinces remained minimal throughout the period under review Northern Cape Provincersquos share of groundnuts exports have been increasing since 2004 until 2012 followed by a slight decline in 2013 During the year 2004 Northern Capersquos contribution to South Africarsquos total groundnuts exports was 760 and this has increased to 3244 in 2012 This scenario is not surprising since Northern Cape Province has recently emerged to be one of the biggest producers of groundnuts having accounted for 33 of South Africarsquos total groundnuts production during 201213 season Table 3 Contribution of various districts to Gauteng Provincersquos total value of groundnut exports ()
Year 2004 2005 2006 2007 2008 2009 2010 2011 2012 2013 District
West Rand 106 803 1207 1081 4646 3301 4251 2656 424 1239
Ekurhuleni 1010 858 1830 1496 007 3692 3565 4473 6245 6385
City of Johannesburg
2792 1472 908 752 098 084 009 031 029 033
City of Tshwane
6092 6867 6055 6671 5249 2923 2175 2840 3301 2443
Source Calculated from Quantec Easy data
Table 3 shows that out of five districts in Gauteng province four districts are contributing to the total groundnuts exports of the province The table indicates that City of Tshwane commanded the greatest share of Gautengrsquos total groundnuts exports value between 2004 and 2008 The table further indicates that the Ekurhuleni district municipality has commanded the greatest share of the Provincersquos total value of groundnuts exports between 2009 and 2013 During the year 2013 Ekurhulenirsquos share of Gautengrsquos total groundnuts exports was 6385 followed by City of Tshwane and West Rand whose contributions to Gautengrsquos groundnuts exports were 2443 and 1239 respectively Table 4 Contribution of various districts to KwaZulu-Natal Provincersquos total value of groundnut exports ()
Year 2004 2005 2006 2007 2008 2009 2010 2011 2012 2013
Districts
UMgungundlovu 099 123 000 000 2677 000 386 007 000 000
UMzinyathi 000 000 000 000 000 000 000 000 000 450
ILembe 008 000 000 099 000 000 000 000 000 000
EThekwini 9893 9871 100 9900 7323 100 9614 9997 100 9550
Source Calculated from Quantec Easy data
Table 4 shows that out of 11 districts in Kwazulu-Natal only five districts are contributing to the total groundnuts exports by the province The figure further indicates that Kwazulu-Natal province has exports of groundnuts originating mainly from EThekwini district primarily due to the use of the Durban harbor as a viaduct of produce that are transported from the Randfontein grain market for export purposes The table indicates that UMgungundlovu UMzinyathi and ILembe Districts contributed
17
insignificantly towards the provincersquos value groundnuts exports During the year 2013 EThekwini commanded the greatest share of Kwazulu-Natal total groundnuts exports 9550 while Umzinyathi district contributed 450 Table 5 below demonstrates the contribution of various districts to the Northern Capersquos total value of groundnut exports The table shows that out of all districts in Northern Cape only one district is contributing to the total groundnuts exports by the province The province only started to export groundnuts from 2004 until 2013 through Frances Baard District which shows a very maximum performance in terms of exports contributing 100 to the Northern Capersquos total value groundnut exports Table 5 Contribution of various districts to the Northern Cape Provincersquos total value of groundnut exports ()
Year 2004 2005 2006 2007 2008 2009 2010 2011 2012 2013 Districts
Frances Baard
100 100 100 100 100 100 100 100 100 100
Source Calculated from Quantec Easydata
2 4 Imports
The quantities of groundnuts imported and import values from 2004 to 2013 pursue the pattern which is shown in Figure 20 below
Source Statistics amp Economic Analysis Quantec Easydata
0
50000
100000
150000
200000
250000
300000
0
5000
10000
15000
20000
25000
30000
2001 2002 2003 2004 2005 2006 2007 2008 2009 2010 2011 2012 2013
Imp
ort
s V
alu
e (
Ran
ds)
Imp
ort
s V
olu
me (
To
ns)
Period (Years)
Figure 20 Groundnuts imports for the period 2004 - 2013
Import Quantity (Ton) Import Value (Rand)
18
On average South Africa imports approximately 11 040 tons of groundnuts per annum to the value of about R92 million Figure 20 indicates that groundnut imports fluctuated considerably from the year 2004 until 2013 This occurred as a result of fluctuations in production volumes which were caused by inconsistent weather conditions over the period The highest quantities of ground were imported during the years 2006 while the lowest were imported in 2010 South Africa imports groundnuts from the following regions Europe Asia the Americas and Africa particularly from the SADC region Figure 21 indicates that over the past ten years South Africa has been importing groundnuts consistently from Africa the Americas Asia and Europe The major groundnuts import market for South Africa is Africa followed by Asia and the Americas On average South Africa imports about 6 728 tons of groundnuts annually from Africa while imports from Americas and Asia are about 2489 tons and 1815 tons per annum respectively
Source Quantec Easy Data
Figure 22 below indicates that on the African Continent South Africa imports groundnuts from the following Countries Malawi Mozambique Zimbabwe Tanzania and Zambia from the SADC region The figure indicates that over the past ten years South Africa has been importing groundnuts consistently from Malawi and Mozambique It is also clear from the figure that groundnut imports from the SADC countries fluctuated considerably over the period under review with the lowest import volumes originating from Zambia Zimbabwe Malawi and Tanzania
0
2000
4000
6000
8000
10000
12000
14000
16000
2004 2005 2006 2007 2008 2009 2010 2011 2012 2013
Imp
ort
s V
olu
me (
To
ns)
Period (Years)
Figure 21 Volume of groundnuts imports from various regions
Africa Americas Asia Europe
19
Source Quantec Easy Data
Source Quantec Easy Data
In Eastern Asia groundnut imports originate mainly from China with some fractional intermittent imports originating from other Eastern Asian countries such as Hong Kong and Japan Figure 23 below indicates that volume of groundnut imports from China were at the highest level in 2004 and thereafter declined rapidly to lower levels until the year 2013 The period under review closed with lower imports of groundnuts from Eastern Asia
2004 2005 2006 2007 2008 2009 2010 2011 2012 2013
Malawi 68378 1503 3107 3659 13677 653 674 55212 34041 2114
Mozambique 13472 30435 409 89769 1188 8333 0 9524 35739 91127
United Republic of Tanzania
1993 0 0 0 11458 0 0 483 27521 41635
Zambia 43642 0 10407 3695 0 0 0 0 18411 250
Zimbabwe 1544 0 12 0 6072 578 0 8648 319 30
0 1000 2000 3000 4000 5000 6000 7000 8000 9000
10000 E
xp
ort
s V
olu
me
(T
on
s)
Period (Years)
Figure 22 Volume of groundnuts imports from the SADC region
Malawi Mozambique United Republic of Tanzania Zambia Zimbabwe
2004 2005 2006 2007 2008 2009 2010 2011 2012 2013
China 18762 16971 17926 10411 48957 99795 95574 7454 66122 23214
Hong Kong 0 0 0024 0 0 0 0192 0 0 0
Japan 36 0 18 0 18 1795 35871 17919 18 36
0 200 400 600 800
1000 1200 1400 1600 1800 2000
Imp
ort
s V
olu
me (
To
ns)
Period (Years)
Figure 23 Volume of groundnuts imports from Eastern Asia
China Hong Kong Japan
20
Source Quantec Easy Data
Figure 26 indicates that South Africarsquos groundnut imports originate mainly from Argentina and Brazil The groundnuts imports volumes from South America were very low from 2004 until 2005 The highest imports of groundnuts from South America were experienced in 2006 from Argentina followed by a huge decline in 2007 The volume of groundnuts imports from Brazil improved marginally between 2006 and 2007 seasons The figure further indicates that the imports of groundnuts were lower between 2008 and 2013 South Africa imported lower volumes of groundnuts from South America during the year 2010 when less than 1000 tons of groundnuts were imported from both Argentina and Brazil combined The figure further shows that there were no imports of groundnuts from Brazil during closing the year (2013) while those from Argentina were also lower
25 Processing
Groundnuts are a high value crop that can be marketed with little processing but are extremely versatile and can be used in a wide range of products The oil made from them can be used for cooking and they can be used to make peanut butter In South Africa processing facilities mainly belong to various companies that produce a wide range of products These include companies that produce peanuts sweets peanut-butter and cooking oil just to mention few Oil contains high amounts of energy and fat-soluble vitamins (A D E and K) and essential fatty acids The oil content of the kernels is between 45 and 55 The peanuts are prepared for the oil extraction process by being shelled and cleaned Oil production requires some type of press with which to extract the oil from the groundnuts and filtering equipment The alternative uses of groundnuts are detailed in the following diagram (Figure 25)
2004 2005 2006 2007 2008 2009 2010 2011 2012 2013
Argentina 7484 3624 67175 10862 36829 10537 14384 0 003 29925
Brazil 90 0 27632 13344 144 0 0 0 006 0
0
1000
2000
3000
4000
5000
6000
7000
8000
Imp
ort
s V
olu
me (
To
ns)
Period (Years)
Figure 24 Volume of groundnuts imports from South America
Argentina Brazil
21
As indicated in Figure 25 groundnuts can be used in various ways at different levels within the industry They can be boiled or roasted for immediate consumption or used as raw material of various products in the industry Oil extracted from the groundnut can be used as raw material for manufacturing of soap massage oil for polio patients body shaving and hair creams and fluid diet which is used to physically strengthen patients and to sharpen their appetites before and after operations The oil cake which is by-product of oil extraction process is used to make glue for wood animal feed fertilizers and antibiotics
22
Figure 25 Groundnut Value Chain tree explaining its uses
Source Grain SA and African Groundnut Council
Oil extraction
Groundnut Oil Cooking oil
Massage oil
Body shave
and hair
creams
PetrolDiesel
Fluid diet
(For Patients)
Oil Cake
Animal
feed
Fertilizers
Antibiotics
Glue for
Wood
Groundnut
Shells
Fertilizers
Peanuts
Peanut -
Butter
Spread on
Bread Ice Cream
Products
Biscuits
Boiled and
Salted
Soap
23
26 Market Value Chain
Figure 26 Market value chain for groundnuts
Farmers produce groundnuts and after harvesting and drying they grade the groundnut pods at a prescribed moisture level in the kernels After grading the pods are packed in gunny bags The packed groundnuts are then sold to either the local market (processors) or foreign market or they may be stored for on-farm processing and future sales The processed groundnut products are sold in an acceptable form to the consumers
Research and
Biotechnology
Input suppliers
FarmersProducers
Silo Owners
Import and
Export Market
Traders and
Transport
Local Market
Peanut-making
Industry
Other
Processors
Oil industry
RetailWholesale
Consumer
24
3 Market Intelligence
31 Tariffs
The following Table 6 indicates the tariffs that are applied by South Africa to the imports of groundnuts from other countries during the year 2014 South Africa generally applies an import duty of 1000 Ad valorem on imports of groundnuts However imports of groundnuts from member-countries of the following regional structures may enter South Africa free of duty SACU European Union and SADC This is due to free trade agreements that exist between South Africa and abovementioned regional structures Table 6
Selected Product description
Tariff regime description Applied Tariff Total ad valorem equivalent tariff (estimated)
Groundnuts not roasted or otherwise cooked 120230
MFN duties (Applied) 1000 1000
Intra SACU rate 000 000
Preferential tariff for European Union Countries
000 000
Preferential tariff for SADC countries
000 000
Source ITC Market Access Map
The following Table 7 indicates the tariffs that are applied by various countries to the exports of groundnuts originating from South Africa in 2012 Table 7
Importers Selected product codes
Product description
Trade regime description
Applied tariffs Total ad valorem equivalent tariff
Netherlands 1202410000 Ground-nuts in shell (excl seed)
MFN duties (Applied)
000 000
Japan 1202 Ground-nuts not roasted
MFN duties (Applied)
6 02315$Ton 40932
Mozambique 12022090 Ground-nuts not roasted
MFN duties (Applied)
2000 2000
Preferential tariff for South Africa
000 000
Swaziland 12024200 Ground-nuts not roasted
MFN duties (Applied)
1000 1000
25
Importers Selected product codes
Product description
Trade regime description
Applied tariffs Total ad valorem equivalent tariff
Preferential tariff for SADC countries
000 000
Norway 12024210
Ground-nuts not roasted
MFN duties (Applied)
57014$Ton 3992
Preferential tariff for SACU countries
51162$Ton 3582
Source ITC Market Access Map
Table 7 above shows that South Africa does not face any tariff barriers when exporting groundnuts to countries such as Netherlands Mozambique and Swaziland This is mainly due to the fact that some of these countries do not charge any tariffs on imports of groundnuts originating from other countries South Africa enjoys a preferential tariff of 0 ad valorem when exporting groundnuts to Mozambique and Swaziland due to the existence of SADC Free Trade Agreement Norway and Japanrsquos groundnuts industries are heavily protected by higher import duties that are charged by these countries on imports of groundnuts from elsewhere Japan applies an import duty of 40932 Ad Valorem on imports of groundnuts originating from other countries while Norway applies tariffs ranging between 3582 and 3992 on imports of groundnuts originating from South Africa There is a preferential tariff of 3582 in Norway on groundnuts imports originating from SACU countries
26
32 Performance of the groundnut industry
Figure 27
Source ITC Trade Map
27
Figure 27 and Table 8 indicate that imports of groundnuts from India Mozambique and Malawi increased significantly between the years 2009 and 2013 Groundnuts imports from India increased by about 237 in quantity between the years 2009 and 2013 while those from Mozambique and Malawi increased by 82 and 70 respectively Table 8 List of supplying markets for the groundnut imported by South Africa in 2013
Exporters
Trade Indicators
Imported value 2013 (USD
thousand)
Share in
South Africas imports
()
Imported quantity
2013
Unit value (USDunit)
Imported growth in value between
2009-2013 (
pa)
Imported growth in quantity between
2009-2013 ( pa)
Imported growth in value between 2012-2013 ( pa)
World 20962 100 19642 1067 71 70 15
Mozambique 8731 417 9089 961 252 82 95
United States of America
4645 222 3488 1332 2234
Malawi 2223 106 2114 1052 59 49 -47
India 1860 89 1540 1208 657 237 -35
Nigeria 709 34 884 802 1409
China 691 33 232 2978 -12 -28 -52
Madagascar 375 18 325 1154 -51
Tanzania United Republic of
361 17 416 868 -90
Source ITC Trade Map
Table 8 and Figure 28 also show that Mozambique is the biggest supplier of groundnuts imported by South Africa in 2013 It is clear from the figure and the table that Mozambique accounted for about 417 of the total groundnuts imported by South Africa during the year 2013 The other major exporters of groundnuts to South Africa are United States of America and Malawi which account for 222 and 106 of South Africarsquos total groundnuts imports respectively South Africa also imports groundnuts from other countries such India Nigeria and China
28
Figure 28
Source ITC Trade Map
29
Table 9 List of Importing markets for the groundnut exported by South Africa in 2012
Importers
Trade Indicators
Exported value 2013
(USD thousand)
Share in South
Africas exports
()
Exported quantity
2013
Unit value
(USDunit)
Exported growth in
value between
2009-2013 ( pa)
Exported growth in quantity between
2009-2013 ( pa)
Exported growth in
value between 2012-2013 (
pa)
World 14821 100 9023 1643 -3 -13 -34
Netherlands 6157 415 3402 1810 8 -5 -44
Japan 5256 355 2562 2052 1 -14 -44
Mozambique 1353 91 1787 757 7 7 202
Swaziland 570 38 456 1250
Norway 527 36 266 1981 3 -12 -7
New Zealand 245 17 144 1701 13 3 -33
Switzerland 227 15 108 2102
Zambia 184 12 81 2272 196 6033
Finland 162 11 79 2051 -1 -15 -42
Source ITC Trade Map
It is clear from Table 9 and Figure 29 that the major export destinations for groundnuts originating from South Africa are Netherlands Japan Mozambique Swaziland and Norway with the greatest volumes being exported to Japan and Netherlands In 2013 Netherlands alone absorbed 415 of South Africarsquos total groundnut exports followed Japan and Mozambique with 355 and 91 respectively South Africarsquos value of groundnuts exports to the world declined by 3 in value terms between the years 2009 and 2013 The figure and the table further show that between the years 2012 and 2013 the value of the South African groundnut exports to the world declined by 34 while those towards Netherlands also declined by 44 over the same period Figure 29 further shows that South Africarsquos groundnuts exports to countries such as Netherlands Japan Norway New Zealand Zimbabwe and Finland have grown at a slow pace compared to these countriesrsquo imports growth from the rest of the world The growth rate of South Africarsquos groundnut exports to countries such as Mozambique and Swaziland is more than the growth in these countriesrsquo imports from the rest of the world The figure further shows that if South Africa wishes to expand its groundnut export base the prospective markets exist in countries such as Canada Germany Mexico Algeria Russian Federation and Indonesia
30
Figure 29 Prospects for market diversification for Groundnuts (1202) exported by South Africa in 2013
Source ITC Trade Map
31
4 ACKNOWLEDGEMENTS The following organizations are acknowledged Statistics and Economic Analysis Department of Agriculture Forestry and Fisheries Tel (012) 319 8453 Fax (012) 319 8031 wwwdaffgovza Grain South Africa wwwgrainsacoza African Groundnut Council wwwafgroundnutcouncilorg Quantec Easydata POBox 35466 Menlo Park Pretoria 0102 Tel 012 361 5154 Fax 012 348 5874 Website wwwquanteccoza ITC Trade Map Website httpwwwtrademaporg ITC Market Access Map wwwmacmaporg Disclaimer This document and its contents have been compiled by the Department of Agriculture Forestry and Fisheries for the purpose of detailing the groundnut industry Anyone who uses the information as contained in this document does so at hisher own risk The views expressed in this document are those of the Department with regard to the industry unless otherwise stated The Department therefore accepts no liability that can be incurred resulting from the use of this information

2
TABLE OF CONTENTS
1 DESCRIPTION OF THE INDUSTRY 3
11 Producing Areas 4
12 Production Trends 4
3 MARKET STRUCTURE 5
21 Domestic Market and Prices 5
22 Exports 7
23 Share Analysis 15
2 4 Imports 17
25 Processing 20
26 Market Value Chain 23
3 Market Intelligence 24
31 Tariffs 24
32 Performance of the groundnut industry 26
4 ACKNOWLEDGEMENTS 31
3
1 DESCRIPTION OF THE INDUSTRY Groundnuts contribute approximately 11 to the gross value of field crops production The average annual gross value of groundnuts production for the previous ten years up to 201213 season amounts to approximately R 411 256 million Groundnuts can be consumed in an unprocessed state but they also serve in the economy as raw materials for the manufacturing of various products These include but not limited to the manufacturing of such products as peanuts peanut butter sweets and cooking oil The production of groundnuts is highly affected by the costs of production inputs as well as the demand for groundnuts The contribution of the groundnut industry to the gross value of agricultural production is summarized in Figure 1
Source Statistics and Economic Analysis
The gross value of groundnut production as shown in Figure 1 above was relatively higher during 200304 season and this was followed by a slight decline in the gross value of groundnut production during 200405 season The contribution of the groundnut industry to the gross value of agricultural production was characterized by fluctuations throughout the period under analysis with some consistent increases between 200607 and 200809 seasons The gross value of production has reached the highest level during 200809 mainly as a result of relatively higher levels of production coupled with higher producer prices at the time The contribution of the groundnut industry to the GVP declined slightly between 200910 and 201011 seasons and this was followed by a slight increase during 201112 season The period under analysis closed with relatively lower gross value of groundnut production in 201213 season
0
100000
200000
300000
400000
500000
600000
700000
800000
R0
00
Years
Figure 1 Groundnut Gross Value of Production
4
11 Producing Areas
Figure 2 below shows the contribution of each province to the total groundnuts production in South Africa The figure clearly indicates that the groundnuts are produced mainly in three provinces namely the Free State (38) Northern Cape (33) and North West Province (24) Groundnuts are also produced in Limpopo KwaZulu-Natal and Gauteng provinces although the production is lower in these provinces
Source Statistics and Economic Analysis
Table 1 Groundnut production by provinces
PROVINCE Production (tons) 200708
Production (tons) 200809
Production (tons) 200910
Production (tons) 201011
Production (tons) 201112
Production (tons) 201213
Northern Cape
21500 31 000 27 120 18 950 16900 14000
Free State 35 700 33 690 35 000 20 700 21800 16200
Kwazulu-Natal
80 0 300 0 150 150
Limpopo 5 810 6 750 3 520 3 500 3350 1200
North West 25 650 28 000 22 000 20 900 16800 10000
Gauteng 60 60 60 0 0 0
Source Statistics and Economic Analysis
Table 1 indicates that during the past three years Free State Province has been the major producer of groundnuts even though groundnut production in this province has experienced considerable fluctuations during this period Northern Cape is the second largest producer of groundnuts after Free State However North West Province increased its production significantly during 200708 and surpassed Northern Capersquos production volumes Notably groundnut production in all the major producing regions has undergone a drastic decline during 201213 season leading to a slight decline in South Africarsquos total groundnuts production Gauteng Province has no recorded any groundnuts production volume from 201011 until 201213
Northern Cape 33
Free State 38
Kwazulu-Natal 0
Mpumalanga 2
Limpopo 3
Gauteng 0
North West 24
Figure 2 Groundnuts Production by Province 201213
5
Plantings and production trends of groundnuts from 200304 to 201213 production seasons are as depicted in Figure 3 below
Source Statistics and Economic Analysis
Figure 3 makes it clear that production volumes for groundnuts were at higher levels during the 200304 marketing season and this was followed by a slight decline in groundnuts production volumes during 200405 season During the 200506 season the production increased slightly followed by a slight decline in area planted for groundnuts during the 200607 season Despite only slight decrease in the area planted to groundnuts during 201011 season groundnuts production volumes declined significantly during that time indicating a slight decline in yields The period under analysis closed with relatively lower volumes of groundnut production despite a slight increase in area planted during 201213 season
3 MARKET STRUCTURE
21 Domestic Market and Prices
Figure 4 indicates the local production together with consumption of groundnut in South Africa Generally the production and consumption of groundnut fluctuated considerably throughout the period under analysis The figure indicates that the period under analysis opened with production of groundnuts being more than the consumption implying that there was enough groundnuts production and less consumption in South Africa in 200304 as indicated in the figure The figure further indicates that production and consumption of groundnuts in 200506 and 200607 was more or less the same
200304
200405
200506
200607
200708
200809
200910
201011
201112
201213
Total Area Planted
72000 40000 49000 41000 54000 55000 57000 55000 45000 47000
Production 128000 72000 84000 66000 100000 113000 100000 73000 67000 47000
0
20000
40000
60000
80000
100000
120000
140000
0
10000
20000
30000
40000
50000
60000
70000
80000
Pro
du
ctio
n (
Ton
)
Are
a P
lan
ted
(H
a)
Years
Figure 3 Production vs Total Area planted
Total Area Planted Production
6
The figure also indicates that between 200708 and 201112 production of groundnuts was more than the consumption of groundnuts The period under analysis closed with less production volume compared to consumption volumes in 201213 season
Source Statistics and Economic Analysis The average producer prices for groundnuts from 200304 to 201213 season are as indicated in Figure 5 below
Source Statistics and Economic Analysis
0
20000
40000
60000
80000
100000
120000
140000
To
n
Period (Years)
Figure 4 Local Groundnut Production vs Consumption
Production Consumption
200304
200405
200506
200607
200708
200809
200910
201011
201112
201213
Price (Rton) 287015 246421 289833 606916 584376 624881 444487 496227 832993 875851
0
1000
2000
3000
4000
5000
6000
7000
8000
9000
10000
Pri
ce(R
To
n)
Years
Figure5 Producer Prices for Groundnuts
7
Figure 5 shows that producer prices for groundnuts were very low during the opening season of the period under analysis (200304) The price declined significantly to the lowest level during 200405 season Generally the figure indicate fluctuating trend of groundnut producer price This was followed by gradual increase in groundnuts producer price between 200506 and 200809 The figure indicates that the period under analysis closed with higher producer prices for the product in 201213 season (R8 78551ton) Figure 6 shows the utilization of groundnuts in South Africa from 200304 to 201213 The figure shows that groundnuts in South Africa are utilized mainly for manufacturing peanut butter for sales as raw peanuts to the direct market for oil and oilcake and for seed The figure further indicates that groundnut is mainly used for peanut butter and direct market as compared to the use for oil amp oilcake and seed On average 2 550 tons of groundnuts are sold for crushing into oil and oilcake in the domestic market while 3 456 tons are directed to the animal feed and seed markets
Source Statistics and Economic Analysis
22 Exports
The volume and value of groundnuts exports from South Africa to the world are summarized in Figure 7 below Figure 7 indicates volume and value of groundnuts exports from 2004 to 2013 The figure indicates that throughout the period under analysis the quantity of groundnuts exports were consistent with the value of groundnuts exports The period under review opened with moderate volume of groundnuts exports On average 14 117 tons were exported at the value of 138 million The figure further indicates that exports of groundnuts fluctuated considerably over the period under analysis The highest volume of groundnuts exports were recorded in 2010 (24977 tons) and the lowest was recorded in 2013 (8 383 tons)
0
10000
20000
30000
40000
50000
60000
70000
Vo
lum
e (
Ton
s)
Marketing Years
Figure 6 Utilization of Groundnuts in the domestic market
Oil and oilcake Peanut butter and direct edible market Seed and unshelled
8
Source Statistics amp Economic Analysis and Quantec Easydata
South Africa imports its groundnuts from countries such as Mozambique Malawi Argentina China and India as shown in Figure 8
Source ITC Trade Map
Figure 8 below shows exporters of groundnuts to the Republic of South Africa during the year 2013 The figure indicates that Mozambique is the largest exporters of groundnuts into South African markets followed by Malawi India Argentina and China in 2013 During the same year Mozambique accounted for about 69 of the total groundnuts imported by South Africa followed by Malawi (16) and India
0
50000
100000
150000
200000
250000
0
5000
10000
15000
20000
25000
30000
2004 2005 2006 2007 2008 2009 2010 2011 2012 2013
Exp
ort
Valu
e (
R000)
Exp
ort
vo
lum
e (
To
ns)
Period (Years)
Figure 7 Volume and value of groundnuts exports - 2004 to 2013
Quantity Value
China 2
Malawi 16 Argentina
2
India 11
Mozambigue 69
Figure 8 Exporters of Groundnuts to RSA in 2013
9
with 11 Both China and Argentina contributed 2 each towards South Africarsquos total groundnut imports
Source Quantec Easy data
Figure 9 indicates volume of groundnuts exports to various regions in the world The figure indicates that South Africa exports mainly to Europe Asia and Africa The figure also indicates that volumes of groundnuts exports to America and Oceania are less than 400 tons of groundnuts per year Figure 9 shows that groundnut exports from South Africa are destined for the markets in Europe Asia Africa the Americas and Oceania The figure indicates that exports to Europe and Asia are more than those destined to neighboring countries to South Africa within the African continent which is not surprising as most countries in Africa are involved mostly in primary agricultural production than in processing Generally the volume of groundnuts exports to Europe started to decline from 2006 until 2007 followed by slight increases between 2008 and 2010 Exports to Asia fluctuated at moderate levels from the year 2004 until some increases were experienced in 2008 The period under review closed with larger volumes of groundnuts exports being destined to Europe followed by Asia Figure 10 indicates exports of groundnuts to European Union from 2004 to 2013 The exports of groundnuts to this region were fluctuating throughout the period under analysis The figure indicates that the South African groundnuts exports over the period under review were destined mainly to Netherlands United Kingdom and Germany Exports to Belgium and Finland remained minimal The period under analysis closed with Netherlands accumulating large volume of groundnuts originating from South Africa
2004 2005 2006 2007 2008 2009 2010 2011 2012 2013
Africa 26433 19157 13585 10703 19373 20326 39759 84493 28516 18393
Americas 0 0 0 60 0 186 181 3168 90 0
Asia 65362 9022 72082 4645 74967 4542 75236 48864 39399 25622
Europe 6715 92769 37215 27005 46637 46552 13298 73614 55142 38556
Oceania 108 39608 252 198 3864 216 162 324 144 144
0
2000
4000
6000
8000
10000
12000
14000
Exp
ort
s V
olu
me (
ton
s)
Period (years)
Figure 9 Volume of groundnuts exports to various regions
Africa Americas Asia Europe Oceania
10
Source Quantec Easy data
Figure 11 presents exports of groundnuts to Eastern Asia from 2004 to 2013 The figure indicates that in Eastern Asia South Africa exports groundnuts mainly to Japan The figure further indicates that exports of groundnuts to China and Hong Kong were very low and erratic during period under analysis As depicted in Figure 11 below exports of groundnuts from South Africa to Eastern Asia have generally been declining from 2005 until the year 2015 mainly because Japan who is the major importer of groundnuts from South Africa in Eastern Asia substituted imports from South Africa with those from Argentina and Brazil
Source Quantec Easy data
2004 2005 2006 2007 2008 2009 2010 2011 2012 2013
Belgium 380 540 360 00 1300 980 970 00 00 00
Germany 19310 33100 16300 8220 1340 3440 14468 7690 00 00
Finland 1799 580 00 00 4700 1140 2880 2344 1218 791
United Kingdom 9425 21439 4860 3480 7025 900 22056 5064 00 00
Netherlands 31336 35131 13855 12505 25132 34506 87495 53437 51590 34023
00 10000 20000 30000 40000 50000 60000 70000 80000 90000
100000
Ex
po
rt V
olu
me
(T
on
s)
Period (Years)
Figure 10 Volume of groundnuts exports to the European Union
Belgium Germany Finland United Kingdom Netherlands
2004 2005 2006 2007 2008 2009 2010 2011 2012 2013
China 0 0 0 0 18 0 0 0 0 0
Hong Kong 0 0 0 0 0 0 0 181 0 0
Japan 6536 9022 7120 4608 7478 4434 6048 4706 3904 2562
0 1000 2000 3000 4000 5000 6000 7000 8000 9000
10000
Exp
ort
Vo
lum
e (
To
ns)
Period (years)
Figure 11 Volume of groundnuts exports to Eastern Asia
China Hong Kong Japan
11
Figure 12 above indicates volumes of groundnuts exports to the SADC region from 2004 to 2013 The figure indicates that South Africa exports groundnuts more greatly to Mozambique and Zimbabwe Exports of groundnuts to Zambia were very lower during the period under analysis The figure further indicates that Angola is also an important market for South African groundnuts Exports groundnuts from South Africa to the SADC countries with the exception of Mozambique were very low between the years 2011 and 2013
Source Quantec Easy data
Figure 13 shows exports of groundnuts by province from 2004 to 2013
Source Quantec Easy data
0
500
1000
1500
2000
2500
3000
2004 2005 2006 2007 2008 2009 2010 2011 2012 2013
Ex
po
rt V
olu
me
(To
ns)
Period (Years)
Figure 12 Volume of groundnuts exports to the SADC region
Angola Mozambique Zambia Zimbabwe
0
20000000
40000000
60000000
80000000
100000000
120000000
140000000
160000000
2004 2005 2006 2007 2008 2009 2010 2011 2012 2013
Ex
po
rt V
alu
e (
Ra
nd
s)
Period (Years)
Figure 13 Value of groundnuts exports by Provinces
Western Cape Northern Cape Free State Kwazulu-Natal North West Gauteng Mpumalanga Limpopo
12
Figure 13 above indicates that Gauteng province is the greatest exporters of groundnuts produced in South Africa followed by Northern Cape and Kwazulu-Natal The figure further indicates that exports from the largest producer (Free State) were very low throughout the period under analysis and this mainly influenced by lack of necessary marketing infrastructure It is also clear that the values of exports from different provinces were fluctuating throughout the period under analysis with those from Western Cape being at the lowest level throughout the period under analysis Figure 14 presents the value of groundnuts exports in Gauteng province from 2004 to 2013 The figure indicates that City of Tshwane is the major exporters of groundnuts as compared to other district Generally exports of groundnuts from Gauteng province were highly volatile throughout the period under analysis The figure also indicates that Ekurhuleni and West Rand also contributes significantly towards Gauteng provincersquos total value of groundnuts exports The period under analysis closed with Ekurhuleni commanding the greatest share of Gautengrsquos value of groundnuts exports
Source Quantec Easy data
Figure 15 below shows value of groundnut exports from North West province during the period 2004 to 2013 Observable from the figure is very low and erratic trend with regard to exports of groundnuts from various districts in the province Bojanala District Municipality was the greatest exporter of groundnuts from North West province between 2004 and 2008 Exports of groundnuts from this district declined dramatically during the year 2009 and remained very low for the rest of the period under analysis Some lower export values were recorded during the year 2012 and 2013
0
10000000
20000000
30000000
40000000
50000000
60000000
70000000
2004 2005 2006 2007 2008 2009 2010 2011 2012 2013
Exp
ort
s V
alu
e (
Ran
ds)
Period (Years)
Figure 14 Value of groundnuts exports from Gauteng Province
West Rand District Municipality Ekurhuleni Metropolitan Municipality City of Johannesburg Metropolitan Municipality City of Tshwane Metropolitan Municipality
13
Source Quantec Easy data
Values of groundnut exports from KwaZulu-Natal Province for the period 2004 to 2013 are shown in Figure 16 below Figure 16 indicates value of groundnuts exports from Kwazulu-Natal during 2004 to 2013The figure indicates that the value of groundnuts export during the period of analysis was highly volatile The figure indicates that eThekwini commands the greatest value of groundnuts exports from the provinces followed by Umgungundlovu Umzinyathi The period under review closed with lower levels of groundnuts exports from KwaZulu-Natal Province
Source Quantec Easy data
0
5000000
10000000
15000000
20000000
25000000
30000000
35000000
40000000
2004 2005 2006 2007 2008 2009 2010 2011 2012 2013
Ex
po
rt V
alu
e (
Ra
nd
s)
Period (Years)
Figure 15 Value of groundnuts exports from North West Province
Bojanala District municipality Central District municipality Bophirima District municipality Southern District municipality
0
5000000
10000000
15000000
20000000
25000000
30000000
35000000
40000000
2004 2005 2006 2007 2008 2009 2010 2011 2012 2013
Exp
ort
Valu
e (
Ran
ds)
Period (Years)
Figure 16 Value of groundnuts exports from KwaZulu-Natal Province
UMgungundlovu District municipality Uthukela District municipality
iLembe District municipality eThekwini Metropolitan Municipality
14
Source Quantec Easy data
Figure 17 indicates value of groundnuts exports from Western Cape during 2004 to 2013The figure indicates that City of Cape Town was the major exporter of groundnuts in Western Cape for a better part of the period under analysis The figure further indicates that Cape Winelands exported only from 2010 until 2013 while Eden district exported only in 2012
Source Quantec Easy data
2004 2005 2006 2007 2008 2009 2010 2011 2012 2013
City of Cape Town 62 3246 11677 18446 5245 12712 18581 55298 974 1149
Cape Winelands 0 0 0 0 0 0 45420 6213 25250 677
Eden District municipality 0 0 0 0 0 0 0 0 23573 0
0
10000
20000
30000
40000
50000
60000
Ex
po
rts
va
lue
(R
an
ds
)
Period (Years)
Figure 17 Value of groundnuts exports from Western Cape Province
City of Cape Town Cape Winelands Eden District municipality
0
1000000
2000000
3000000
4000000
5000000
6000000
7000000
2004 2005 2006 2007 2008 2009 2010 2011 2012 2013
Ex
po
rt V
alu
e (
Ra
nd
s)
Period (Years)
Figure 18 Value of groundnuts exports from Free State
Lejweleputswa District municipality Northern Free State District municipality
15
Figure 18 shows value of groundnuts exports from Free State during 2004 to 2013The figure indicates that generally Free State is not major exporters of groundnuts Despite the facts that is the largest producer of groundnuts in South Africa Exports of groundnuts in Free State originate only from two districts Lejweleputswa and Northern Free State Lejweleputswa exported only in 2010 and 2013 while Northern Free State recorded exports only in 2004
Source Quantec Easy data
Figure 19 shows value of groundnuts exports from Northern Cape during 2004 to 2013The figure indicates that out of all the districts in Northern Cape only one district (Frances Baard) exports groundnuts The figure further indicates that Frances Baard recorded highest value of groundnuts exports during the year 2012
23 Share Analysis
Table 2 Contribution of various provinces to South Africarsquos total value of groundnuts export ()
Year 2004 2005 2006 2007 2008 2009 2010 2011 2012 2013 Province
Western Cape
000 000 002 003 000 001 003 003 003 003
Northern Cape
760 830 882 1176 1161 1421 2279 3155 3244 2511
Free State 049 019 000 019 000 000 283 000 045 470
Kwazulu-Natal
3669 2849 2950 1612 000 809 1075 1125 416 550
North West 2095 2276 2344 3258 000 000 000 001 423 303
Gauteng 3423 4025 3822 3933 6360 7769 6359 5652 5868 6107
Source Calculated from Quantec Easy data
0
10000000
20000000
30000000
40000000
50000000
60000000
70000000
2004 2005 2006 2007 2008 2009 2010 2011 2012 2013
Exp
ort
s V
alu
e(R
and
s)
Period(Years)
Figure19 Value of groundnuts exports from Nothern Cape Province
Frances Baard District municipality
16
Table 2 confirms the earlier observation that Gauteng province is the largest contributor towards South Africarsquos total value of groundnuts exports followed by Kwazulu-Natal and Northern Cape provinces The table further indicates that the share of groundnuts exports from other provinces remained minimal throughout the period under review Northern Cape Provincersquos share of groundnuts exports have been increasing since 2004 until 2012 followed by a slight decline in 2013 During the year 2004 Northern Capersquos contribution to South Africarsquos total groundnuts exports was 760 and this has increased to 3244 in 2012 This scenario is not surprising since Northern Cape Province has recently emerged to be one of the biggest producers of groundnuts having accounted for 33 of South Africarsquos total groundnuts production during 201213 season Table 3 Contribution of various districts to Gauteng Provincersquos total value of groundnut exports ()
Year 2004 2005 2006 2007 2008 2009 2010 2011 2012 2013 District
West Rand 106 803 1207 1081 4646 3301 4251 2656 424 1239
Ekurhuleni 1010 858 1830 1496 007 3692 3565 4473 6245 6385
City of Johannesburg
2792 1472 908 752 098 084 009 031 029 033
City of Tshwane
6092 6867 6055 6671 5249 2923 2175 2840 3301 2443
Source Calculated from Quantec Easy data
Table 3 shows that out of five districts in Gauteng province four districts are contributing to the total groundnuts exports of the province The table indicates that City of Tshwane commanded the greatest share of Gautengrsquos total groundnuts exports value between 2004 and 2008 The table further indicates that the Ekurhuleni district municipality has commanded the greatest share of the Provincersquos total value of groundnuts exports between 2009 and 2013 During the year 2013 Ekurhulenirsquos share of Gautengrsquos total groundnuts exports was 6385 followed by City of Tshwane and West Rand whose contributions to Gautengrsquos groundnuts exports were 2443 and 1239 respectively Table 4 Contribution of various districts to KwaZulu-Natal Provincersquos total value of groundnut exports ()
Year 2004 2005 2006 2007 2008 2009 2010 2011 2012 2013
Districts
UMgungundlovu 099 123 000 000 2677 000 386 007 000 000
UMzinyathi 000 000 000 000 000 000 000 000 000 450
ILembe 008 000 000 099 000 000 000 000 000 000
EThekwini 9893 9871 100 9900 7323 100 9614 9997 100 9550
Source Calculated from Quantec Easy data
Table 4 shows that out of 11 districts in Kwazulu-Natal only five districts are contributing to the total groundnuts exports by the province The figure further indicates that Kwazulu-Natal province has exports of groundnuts originating mainly from EThekwini district primarily due to the use of the Durban harbor as a viaduct of produce that are transported from the Randfontein grain market for export purposes The table indicates that UMgungundlovu UMzinyathi and ILembe Districts contributed
17
insignificantly towards the provincersquos value groundnuts exports During the year 2013 EThekwini commanded the greatest share of Kwazulu-Natal total groundnuts exports 9550 while Umzinyathi district contributed 450 Table 5 below demonstrates the contribution of various districts to the Northern Capersquos total value of groundnut exports The table shows that out of all districts in Northern Cape only one district is contributing to the total groundnuts exports by the province The province only started to export groundnuts from 2004 until 2013 through Frances Baard District which shows a very maximum performance in terms of exports contributing 100 to the Northern Capersquos total value groundnut exports Table 5 Contribution of various districts to the Northern Cape Provincersquos total value of groundnut exports ()
Year 2004 2005 2006 2007 2008 2009 2010 2011 2012 2013 Districts
Frances Baard
100 100 100 100 100 100 100 100 100 100
Source Calculated from Quantec Easydata
2 4 Imports
The quantities of groundnuts imported and import values from 2004 to 2013 pursue the pattern which is shown in Figure 20 below
Source Statistics amp Economic Analysis Quantec Easydata
0
50000
100000
150000
200000
250000
300000
0
5000
10000
15000
20000
25000
30000
2001 2002 2003 2004 2005 2006 2007 2008 2009 2010 2011 2012 2013
Imp
ort
s V
alu
e (
Ran
ds)
Imp
ort
s V
olu
me (
To
ns)
Period (Years)
Figure 20 Groundnuts imports for the period 2004 - 2013
Import Quantity (Ton) Import Value (Rand)
18
On average South Africa imports approximately 11 040 tons of groundnuts per annum to the value of about R92 million Figure 20 indicates that groundnut imports fluctuated considerably from the year 2004 until 2013 This occurred as a result of fluctuations in production volumes which were caused by inconsistent weather conditions over the period The highest quantities of ground were imported during the years 2006 while the lowest were imported in 2010 South Africa imports groundnuts from the following regions Europe Asia the Americas and Africa particularly from the SADC region Figure 21 indicates that over the past ten years South Africa has been importing groundnuts consistently from Africa the Americas Asia and Europe The major groundnuts import market for South Africa is Africa followed by Asia and the Americas On average South Africa imports about 6 728 tons of groundnuts annually from Africa while imports from Americas and Asia are about 2489 tons and 1815 tons per annum respectively
Source Quantec Easy Data
Figure 22 below indicates that on the African Continent South Africa imports groundnuts from the following Countries Malawi Mozambique Zimbabwe Tanzania and Zambia from the SADC region The figure indicates that over the past ten years South Africa has been importing groundnuts consistently from Malawi and Mozambique It is also clear from the figure that groundnut imports from the SADC countries fluctuated considerably over the period under review with the lowest import volumes originating from Zambia Zimbabwe Malawi and Tanzania
0
2000
4000
6000
8000
10000
12000
14000
16000
2004 2005 2006 2007 2008 2009 2010 2011 2012 2013
Imp
ort
s V
olu
me (
To
ns)
Period (Years)
Figure 21 Volume of groundnuts imports from various regions
Africa Americas Asia Europe
19
Source Quantec Easy Data
Source Quantec Easy Data
In Eastern Asia groundnut imports originate mainly from China with some fractional intermittent imports originating from other Eastern Asian countries such as Hong Kong and Japan Figure 23 below indicates that volume of groundnut imports from China were at the highest level in 2004 and thereafter declined rapidly to lower levels until the year 2013 The period under review closed with lower imports of groundnuts from Eastern Asia
2004 2005 2006 2007 2008 2009 2010 2011 2012 2013
Malawi 68378 1503 3107 3659 13677 653 674 55212 34041 2114
Mozambique 13472 30435 409 89769 1188 8333 0 9524 35739 91127
United Republic of Tanzania
1993 0 0 0 11458 0 0 483 27521 41635
Zambia 43642 0 10407 3695 0 0 0 0 18411 250
Zimbabwe 1544 0 12 0 6072 578 0 8648 319 30
0 1000 2000 3000 4000 5000 6000 7000 8000 9000
10000 E
xp
ort
s V
olu
me
(T
on
s)
Period (Years)
Figure 22 Volume of groundnuts imports from the SADC region
Malawi Mozambique United Republic of Tanzania Zambia Zimbabwe
2004 2005 2006 2007 2008 2009 2010 2011 2012 2013
China 18762 16971 17926 10411 48957 99795 95574 7454 66122 23214
Hong Kong 0 0 0024 0 0 0 0192 0 0 0
Japan 36 0 18 0 18 1795 35871 17919 18 36
0 200 400 600 800
1000 1200 1400 1600 1800 2000
Imp
ort
s V
olu
me (
To
ns)
Period (Years)
Figure 23 Volume of groundnuts imports from Eastern Asia
China Hong Kong Japan
20
Source Quantec Easy Data
Figure 26 indicates that South Africarsquos groundnut imports originate mainly from Argentina and Brazil The groundnuts imports volumes from South America were very low from 2004 until 2005 The highest imports of groundnuts from South America were experienced in 2006 from Argentina followed by a huge decline in 2007 The volume of groundnuts imports from Brazil improved marginally between 2006 and 2007 seasons The figure further indicates that the imports of groundnuts were lower between 2008 and 2013 South Africa imported lower volumes of groundnuts from South America during the year 2010 when less than 1000 tons of groundnuts were imported from both Argentina and Brazil combined The figure further shows that there were no imports of groundnuts from Brazil during closing the year (2013) while those from Argentina were also lower
25 Processing
Groundnuts are a high value crop that can be marketed with little processing but are extremely versatile and can be used in a wide range of products The oil made from them can be used for cooking and they can be used to make peanut butter In South Africa processing facilities mainly belong to various companies that produce a wide range of products These include companies that produce peanuts sweets peanut-butter and cooking oil just to mention few Oil contains high amounts of energy and fat-soluble vitamins (A D E and K) and essential fatty acids The oil content of the kernels is between 45 and 55 The peanuts are prepared for the oil extraction process by being shelled and cleaned Oil production requires some type of press with which to extract the oil from the groundnuts and filtering equipment The alternative uses of groundnuts are detailed in the following diagram (Figure 25)
2004 2005 2006 2007 2008 2009 2010 2011 2012 2013
Argentina 7484 3624 67175 10862 36829 10537 14384 0 003 29925
Brazil 90 0 27632 13344 144 0 0 0 006 0
0
1000
2000
3000
4000
5000
6000
7000
8000
Imp
ort
s V
olu
me (
To
ns)
Period (Years)
Figure 24 Volume of groundnuts imports from South America
Argentina Brazil
21
As indicated in Figure 25 groundnuts can be used in various ways at different levels within the industry They can be boiled or roasted for immediate consumption or used as raw material of various products in the industry Oil extracted from the groundnut can be used as raw material for manufacturing of soap massage oil for polio patients body shaving and hair creams and fluid diet which is used to physically strengthen patients and to sharpen their appetites before and after operations The oil cake which is by-product of oil extraction process is used to make glue for wood animal feed fertilizers and antibiotics
22
Figure 25 Groundnut Value Chain tree explaining its uses
Source Grain SA and African Groundnut Council
Oil extraction
Groundnut Oil Cooking oil
Massage oil
Body shave
and hair
creams
PetrolDiesel
Fluid diet
(For Patients)
Oil Cake
Animal
feed
Fertilizers
Antibiotics
Glue for
Wood
Groundnut
Shells
Fertilizers
Peanuts
Peanut -
Butter
Spread on
Bread Ice Cream
Products
Biscuits
Boiled and
Salted
Soap
23
26 Market Value Chain
Figure 26 Market value chain for groundnuts
Farmers produce groundnuts and after harvesting and drying they grade the groundnut pods at a prescribed moisture level in the kernels After grading the pods are packed in gunny bags The packed groundnuts are then sold to either the local market (processors) or foreign market or they may be stored for on-farm processing and future sales The processed groundnut products are sold in an acceptable form to the consumers
Research and
Biotechnology
Input suppliers
FarmersProducers
Silo Owners
Import and
Export Market
Traders and
Transport
Local Market
Peanut-making
Industry
Other
Processors
Oil industry
RetailWholesale
Consumer
24
3 Market Intelligence
31 Tariffs
The following Table 6 indicates the tariffs that are applied by South Africa to the imports of groundnuts from other countries during the year 2014 South Africa generally applies an import duty of 1000 Ad valorem on imports of groundnuts However imports of groundnuts from member-countries of the following regional structures may enter South Africa free of duty SACU European Union and SADC This is due to free trade agreements that exist between South Africa and abovementioned regional structures Table 6
Selected Product description
Tariff regime description Applied Tariff Total ad valorem equivalent tariff (estimated)
Groundnuts not roasted or otherwise cooked 120230
MFN duties (Applied) 1000 1000
Intra SACU rate 000 000
Preferential tariff for European Union Countries
000 000
Preferential tariff for SADC countries
000 000
Source ITC Market Access Map
The following Table 7 indicates the tariffs that are applied by various countries to the exports of groundnuts originating from South Africa in 2012 Table 7
Importers Selected product codes
Product description
Trade regime description
Applied tariffs Total ad valorem equivalent tariff
Netherlands 1202410000 Ground-nuts in shell (excl seed)
MFN duties (Applied)
000 000
Japan 1202 Ground-nuts not roasted
MFN duties (Applied)
6 02315$Ton 40932
Mozambique 12022090 Ground-nuts not roasted
MFN duties (Applied)
2000 2000
Preferential tariff for South Africa
000 000
Swaziland 12024200 Ground-nuts not roasted
MFN duties (Applied)
1000 1000
25
Importers Selected product codes
Product description
Trade regime description
Applied tariffs Total ad valorem equivalent tariff
Preferential tariff for SADC countries
000 000
Norway 12024210
Ground-nuts not roasted
MFN duties (Applied)
57014$Ton 3992
Preferential tariff for SACU countries
51162$Ton 3582
Source ITC Market Access Map
Table 7 above shows that South Africa does not face any tariff barriers when exporting groundnuts to countries such as Netherlands Mozambique and Swaziland This is mainly due to the fact that some of these countries do not charge any tariffs on imports of groundnuts originating from other countries South Africa enjoys a preferential tariff of 0 ad valorem when exporting groundnuts to Mozambique and Swaziland due to the existence of SADC Free Trade Agreement Norway and Japanrsquos groundnuts industries are heavily protected by higher import duties that are charged by these countries on imports of groundnuts from elsewhere Japan applies an import duty of 40932 Ad Valorem on imports of groundnuts originating from other countries while Norway applies tariffs ranging between 3582 and 3992 on imports of groundnuts originating from South Africa There is a preferential tariff of 3582 in Norway on groundnuts imports originating from SACU countries
26
32 Performance of the groundnut industry
Figure 27
Source ITC Trade Map
27
Figure 27 and Table 8 indicate that imports of groundnuts from India Mozambique and Malawi increased significantly between the years 2009 and 2013 Groundnuts imports from India increased by about 237 in quantity between the years 2009 and 2013 while those from Mozambique and Malawi increased by 82 and 70 respectively Table 8 List of supplying markets for the groundnut imported by South Africa in 2013
Exporters
Trade Indicators
Imported value 2013 (USD
thousand)
Share in
South Africas imports
()
Imported quantity
2013
Unit value (USDunit)
Imported growth in value between
2009-2013 (
pa)
Imported growth in quantity between
2009-2013 ( pa)
Imported growth in value between 2012-2013 ( pa)
World 20962 100 19642 1067 71 70 15
Mozambique 8731 417 9089 961 252 82 95
United States of America
4645 222 3488 1332 2234
Malawi 2223 106 2114 1052 59 49 -47
India 1860 89 1540 1208 657 237 -35
Nigeria 709 34 884 802 1409
China 691 33 232 2978 -12 -28 -52
Madagascar 375 18 325 1154 -51
Tanzania United Republic of
361 17 416 868 -90
Source ITC Trade Map
Table 8 and Figure 28 also show that Mozambique is the biggest supplier of groundnuts imported by South Africa in 2013 It is clear from the figure and the table that Mozambique accounted for about 417 of the total groundnuts imported by South Africa during the year 2013 The other major exporters of groundnuts to South Africa are United States of America and Malawi which account for 222 and 106 of South Africarsquos total groundnuts imports respectively South Africa also imports groundnuts from other countries such India Nigeria and China
28
Figure 28
Source ITC Trade Map
29
Table 9 List of Importing markets for the groundnut exported by South Africa in 2012
Importers
Trade Indicators
Exported value 2013
(USD thousand)
Share in South
Africas exports
()
Exported quantity
2013
Unit value
(USDunit)
Exported growth in
value between
2009-2013 ( pa)
Exported growth in quantity between
2009-2013 ( pa)
Exported growth in
value between 2012-2013 (
pa)
World 14821 100 9023 1643 -3 -13 -34
Netherlands 6157 415 3402 1810 8 -5 -44
Japan 5256 355 2562 2052 1 -14 -44
Mozambique 1353 91 1787 757 7 7 202
Swaziland 570 38 456 1250
Norway 527 36 266 1981 3 -12 -7
New Zealand 245 17 144 1701 13 3 -33
Switzerland 227 15 108 2102
Zambia 184 12 81 2272 196 6033
Finland 162 11 79 2051 -1 -15 -42
Source ITC Trade Map
It is clear from Table 9 and Figure 29 that the major export destinations for groundnuts originating from South Africa are Netherlands Japan Mozambique Swaziland and Norway with the greatest volumes being exported to Japan and Netherlands In 2013 Netherlands alone absorbed 415 of South Africarsquos total groundnut exports followed Japan and Mozambique with 355 and 91 respectively South Africarsquos value of groundnuts exports to the world declined by 3 in value terms between the years 2009 and 2013 The figure and the table further show that between the years 2012 and 2013 the value of the South African groundnut exports to the world declined by 34 while those towards Netherlands also declined by 44 over the same period Figure 29 further shows that South Africarsquos groundnuts exports to countries such as Netherlands Japan Norway New Zealand Zimbabwe and Finland have grown at a slow pace compared to these countriesrsquo imports growth from the rest of the world The growth rate of South Africarsquos groundnut exports to countries such as Mozambique and Swaziland is more than the growth in these countriesrsquo imports from the rest of the world The figure further shows that if South Africa wishes to expand its groundnut export base the prospective markets exist in countries such as Canada Germany Mexico Algeria Russian Federation and Indonesia
30
Figure 29 Prospects for market diversification for Groundnuts (1202) exported by South Africa in 2013
Source ITC Trade Map
31
4 ACKNOWLEDGEMENTS The following organizations are acknowledged Statistics and Economic Analysis Department of Agriculture Forestry and Fisheries Tel (012) 319 8453 Fax (012) 319 8031 wwwdaffgovza Grain South Africa wwwgrainsacoza African Groundnut Council wwwafgroundnutcouncilorg Quantec Easydata POBox 35466 Menlo Park Pretoria 0102 Tel 012 361 5154 Fax 012 348 5874 Website wwwquanteccoza ITC Trade Map Website httpwwwtrademaporg ITC Market Access Map wwwmacmaporg Disclaimer This document and its contents have been compiled by the Department of Agriculture Forestry and Fisheries for the purpose of detailing the groundnut industry Anyone who uses the information as contained in this document does so at hisher own risk The views expressed in this document are those of the Department with regard to the industry unless otherwise stated The Department therefore accepts no liability that can be incurred resulting from the use of this information
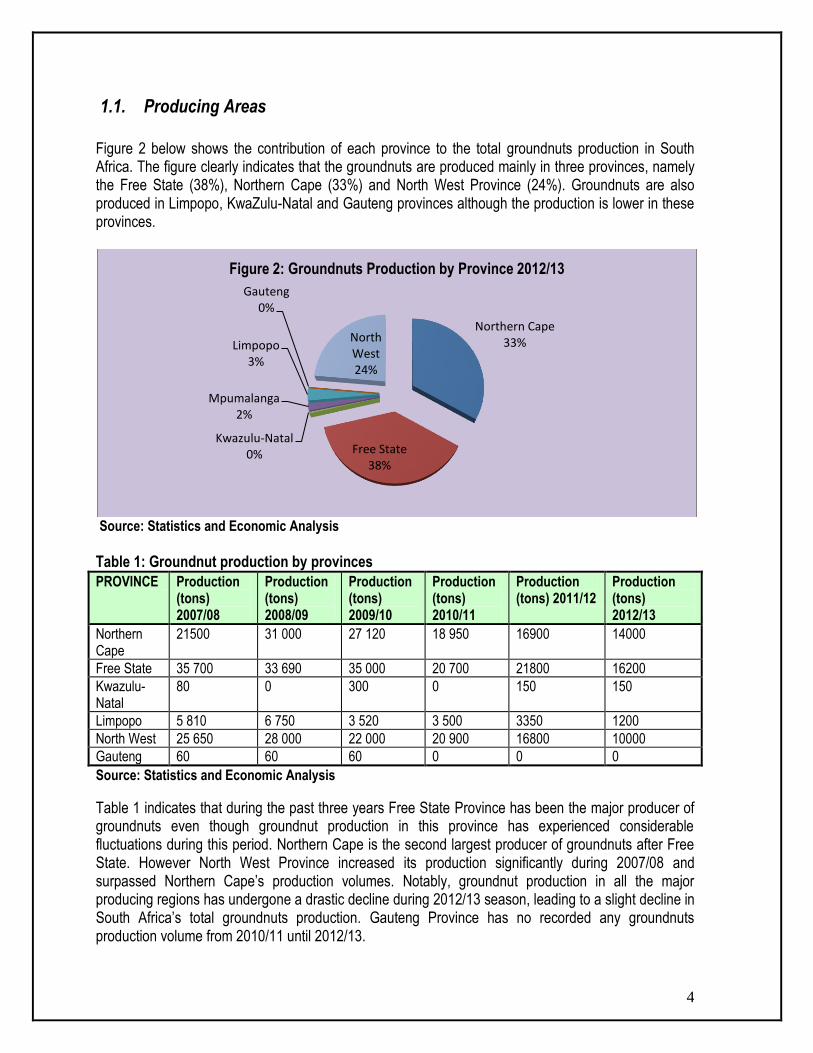
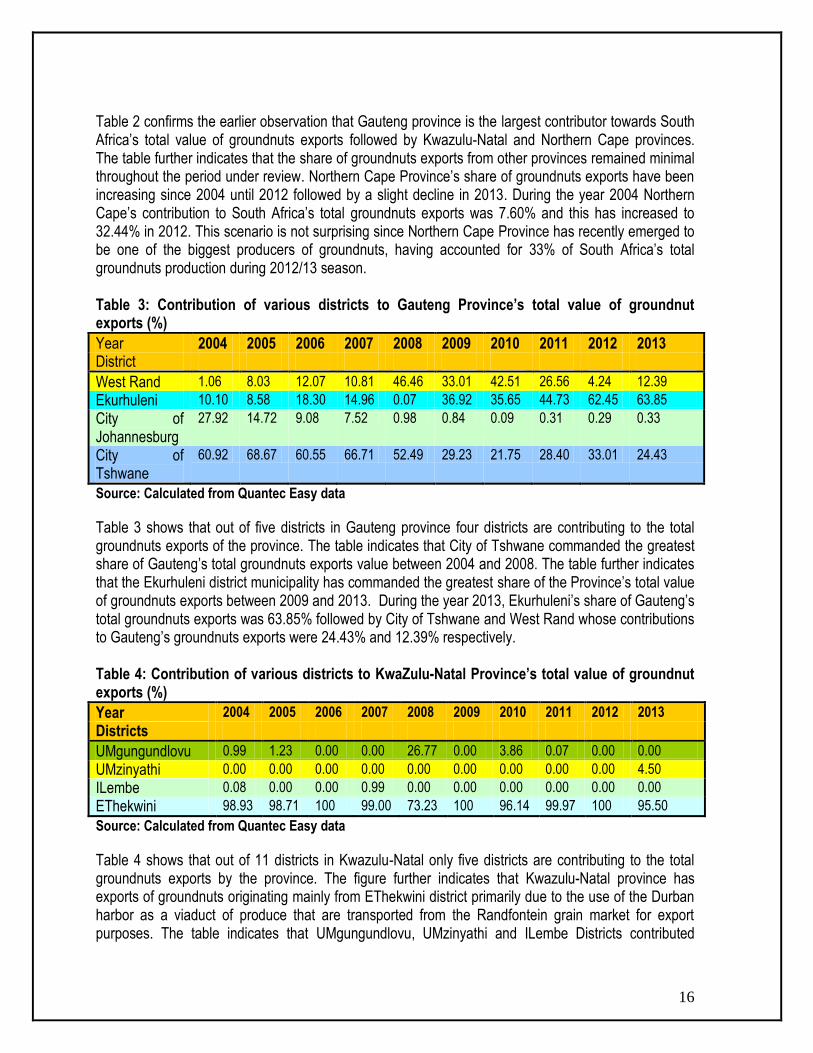
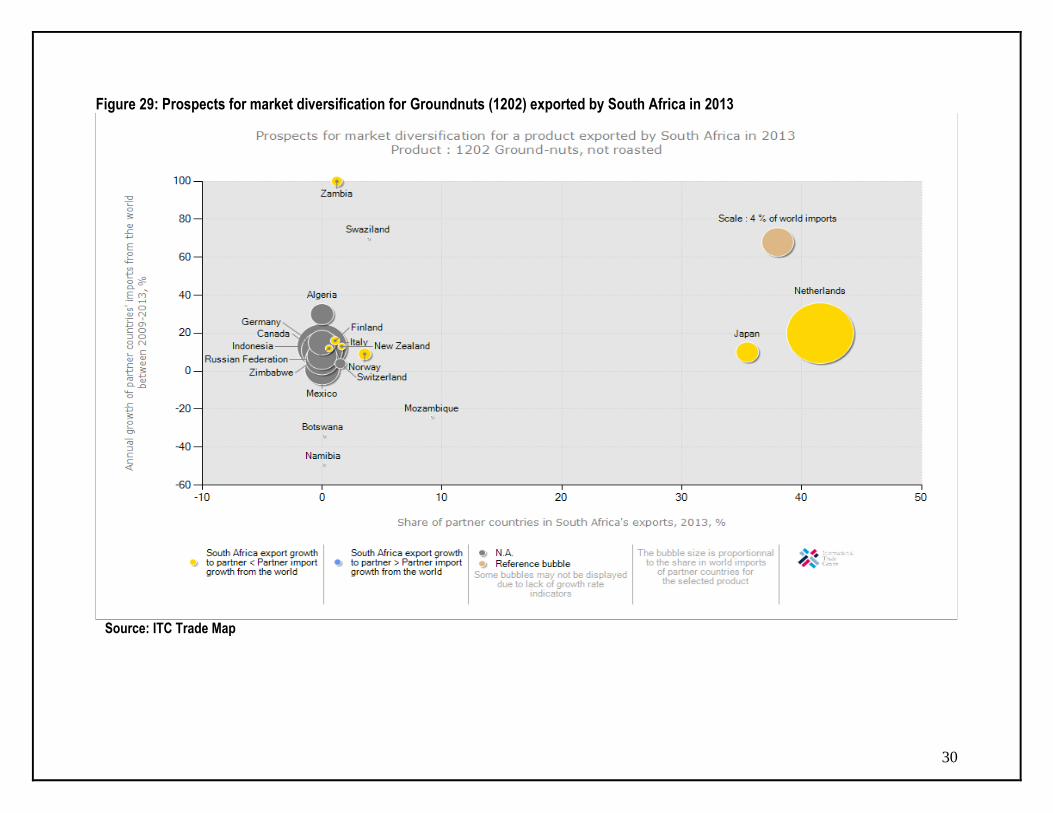