Gorenje Groupstatic14.gorenje.com/files/default/corporate/investor...disposal of furniture...
37
Gorenje Group Investor Conference Zagreb, 26 May 2015
Transcript of Gorenje Groupstatic14.gorenje.com/files/default/corporate/investor...disposal of furniture...

Gorenje Group Investor Conference
Zagreb, 26 May 2015
OWN
PRODUCTION
Slovenia
Serbia
Czech Republic
CONSOLIDATED
REVENUE
EUR 1.25 bn
NUMBER OF
EMPLOYEES
10,468
EXPORT
95%
of sales
GLOBAL
PRESENCE
90 Countries
Worldwide,
mostly in Europe (92%),
also in USA, Australia,
Near and Far East
CORE BUSINESS
Products and
services for home
(MDA, SDA, HVAC,
kitchen furniture)
One of Leading European
Manufacturers of Products for Home
2
Gorenje
Group
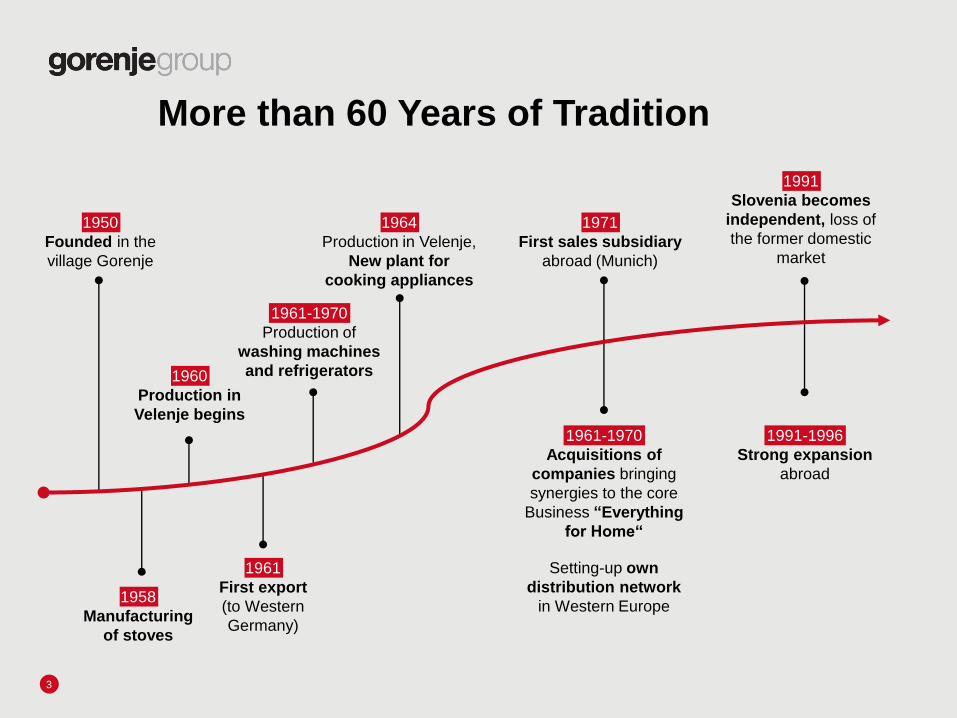
1950
Founded in the
village Gorenje
More than 60 Years of Tradition
3
1960
Production in
Velenje begins
1961-1970
Production of
washing machines
and refrigerators
1964
Production in Velenje,
New plant for
cooking appliances
1971
First sales subsidiary
abroad (Munich)
1991
Slovenia becomes
independent, loss of
the former domestic
market
1958
Manufacturing
of stoves
1961
First export
(to Western
Germany)
1961-1970
Acquisitions of
companies bringing
synergies to the core
Business “Everything
for Home“
Setting-up own
distribution network
in Western Europe
1991-1996
Strong expansion
abroad
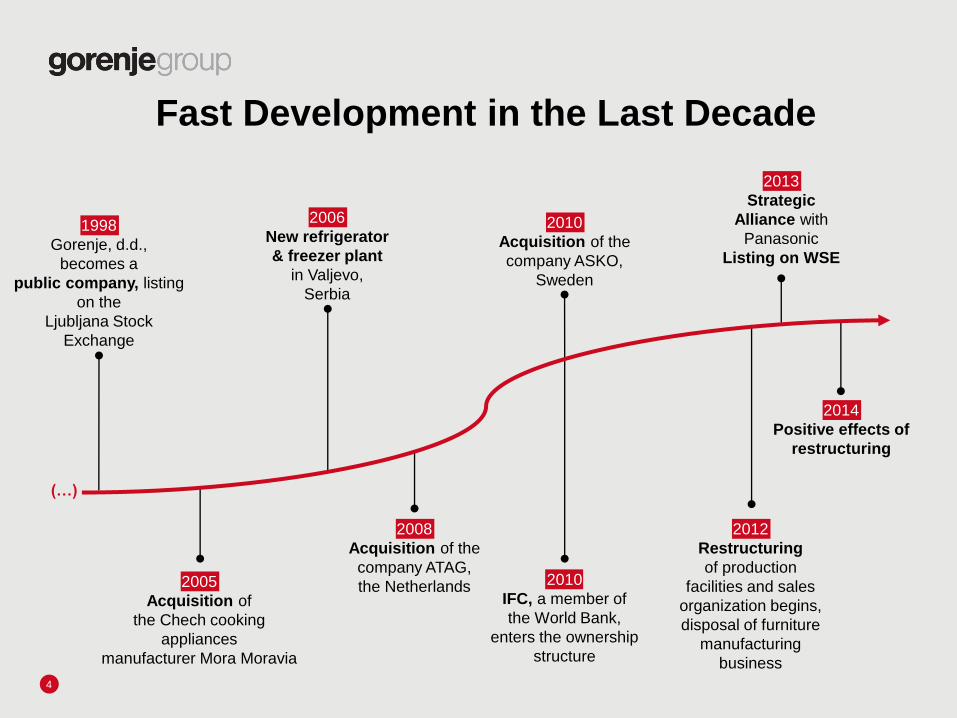
1998
Gorenje, d.d.,
becomes a
public company, listing
on the
Ljubljana Stock
Exchange
Fast Development in the Last Decade
4
2006
New refrigerator
& freezer plant
in Valjevo,
Serbia
2010
Acquisition of the
company ASKO,
Sweden
2013
Strategic
Alliance with
Panasonic
Listing on WSE
2005
Acquisition of
the Chech cooking
appliances
manufacturer Mora Moravia
2010
IFC, a member of
the World Bank,
enters the ownership
structure
(…)
2008
Acquisition of the
company ATAG,
the Netherlands
2014
Positive effects of
restructuring
2012
Restructuring
of production
facilities and sales
organization begins,
disposal of furniture
manufacturing
business
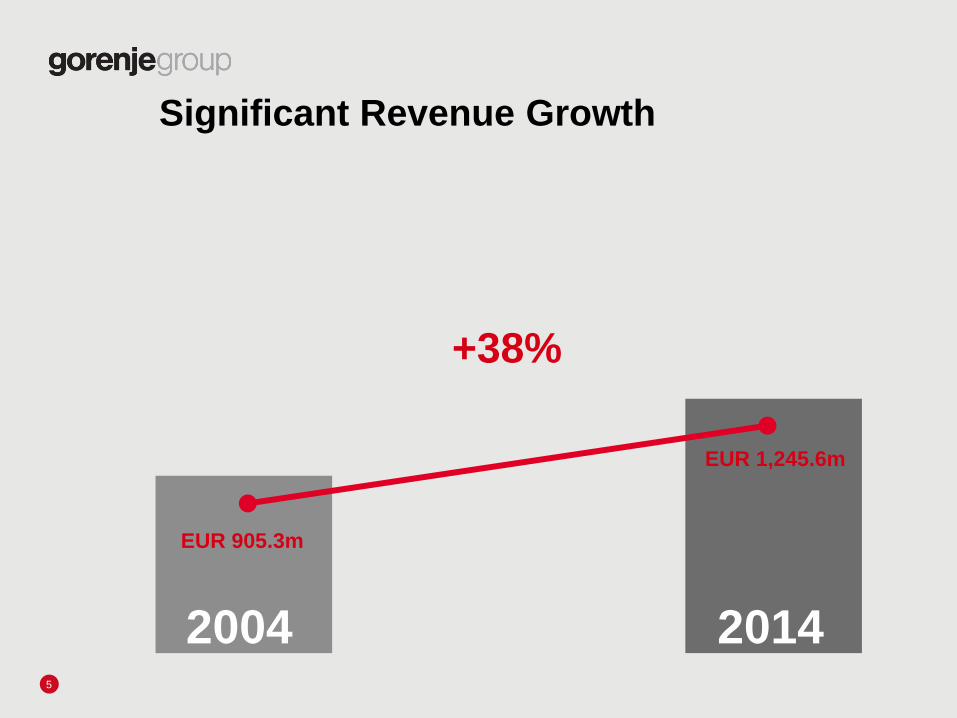
Significant Revenue Growth
5
+38%
EUR 905.3m
EUR 1,245.6m
2004 2014
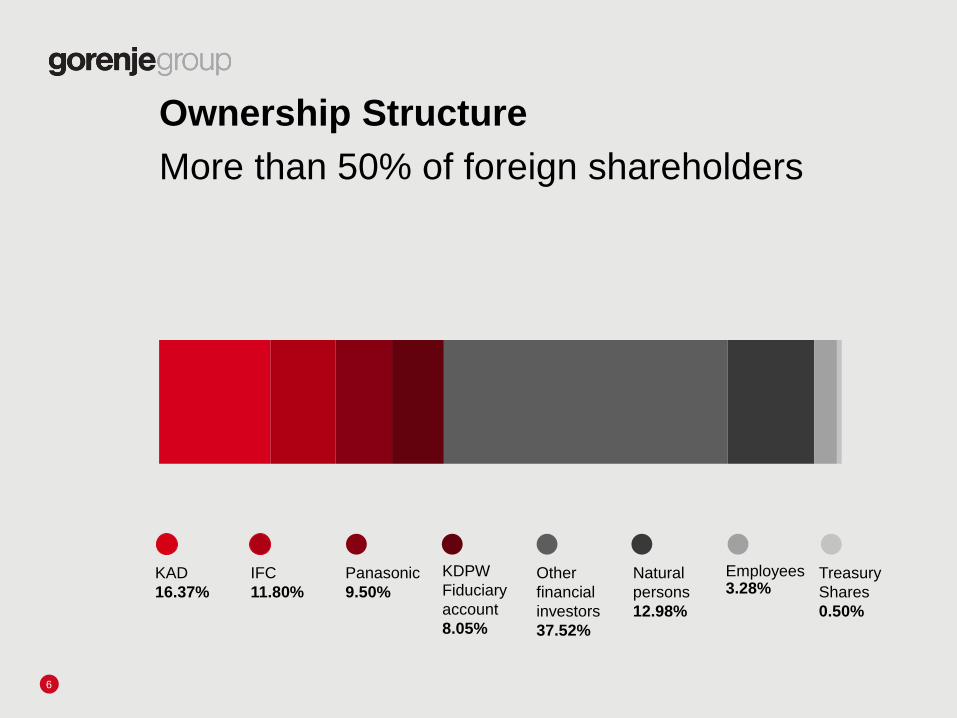
Ownership Structure
More than 50% of foreign shareholders
6
KAD
16.37%
IFC
11.80%
Panasonic
9.50%
KDPW
Fiduciary
account
8.05%
Other
financial
investors
37.52%
Natural
persons
12.98%
Employees 3.28%
Treasury
Shares
0.50%
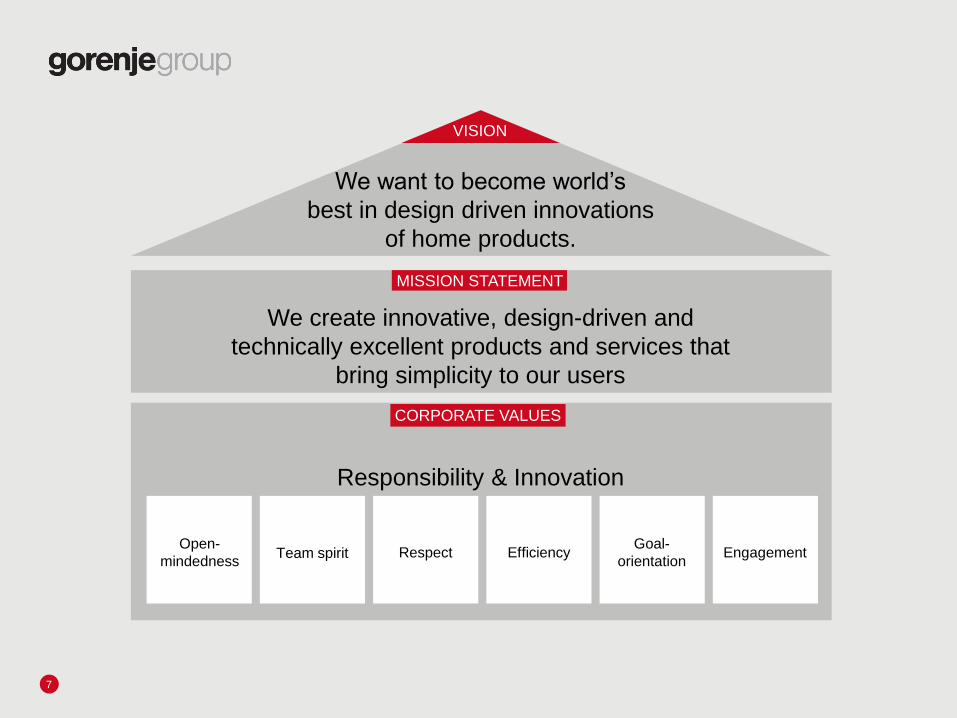
CORPORATE VALUES
MISSION STATEMENT
7
VISION
We want to become world’s
best in design driven innovations
of home products.
We create innovative, design-driven and
technically excellent products and services that
bring simplicity to our users
Responsibility & Innovation
Open-
mindedness Team spirit Respect Efficiency
Goal-
orientation Engagement
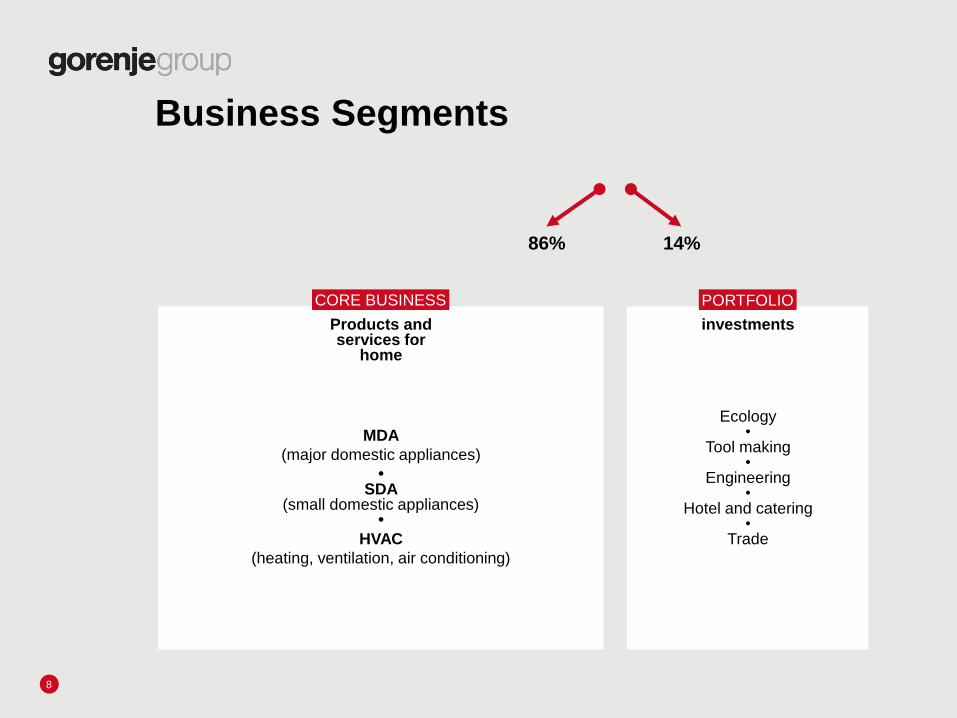
CORE BUSINESS
Business Segments
8
Products and services for
home
MDA
(major domestic appliances)
• SDA
(small domestic appliances) •
HVAC
(heating, ventilation, air conditioning)
investments
Ecology •
Tool making •
Engineering •
Hotel and catering •
Trade
86% 14%
PORTFOLIO
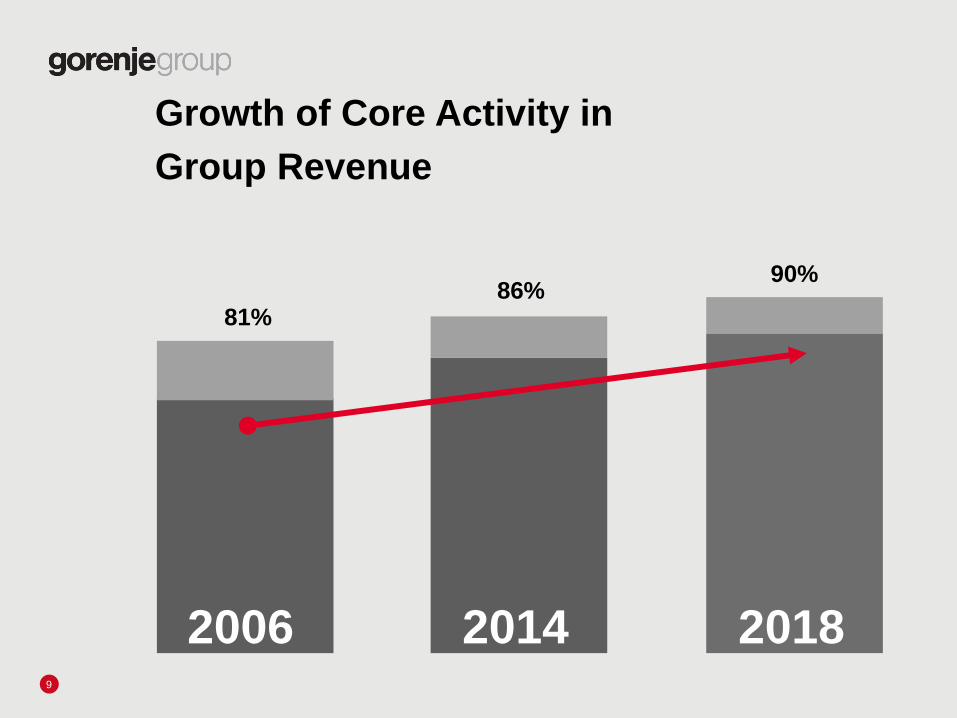
Growth of Core Activity in
Group Revenue
9
2006 2018 2014
81% 86%
90%
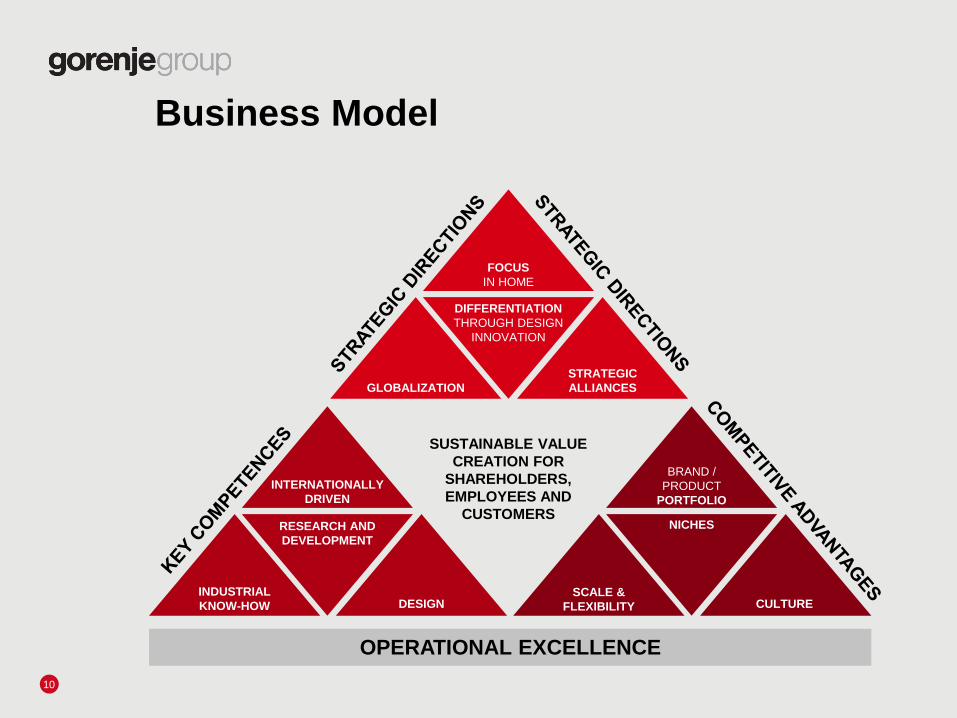
Business Model
10
FOCUS
IN HOME
DIFFERENTIATION
THROUGH DESIGN
INNOVATION
GLOBALIZATION
STRATEGIC
ALLIANCES
SUSTAINABLE VALUE
CREATION FOR
SHAREHOLDERS,
EMPLOYEES AND
CUSTOMERS
BRAND /
PRODUCT
PORTFOLIO
SCALE &
FLEXIBILITY CULTURE DESIGN INDUSTRIAL
KNOW-HOW
INTERNATIONALLY
DRIVEN
RESEARCH AND
DEVELOPMENT
NICHES
OPERATIONAL EXCELLENCE
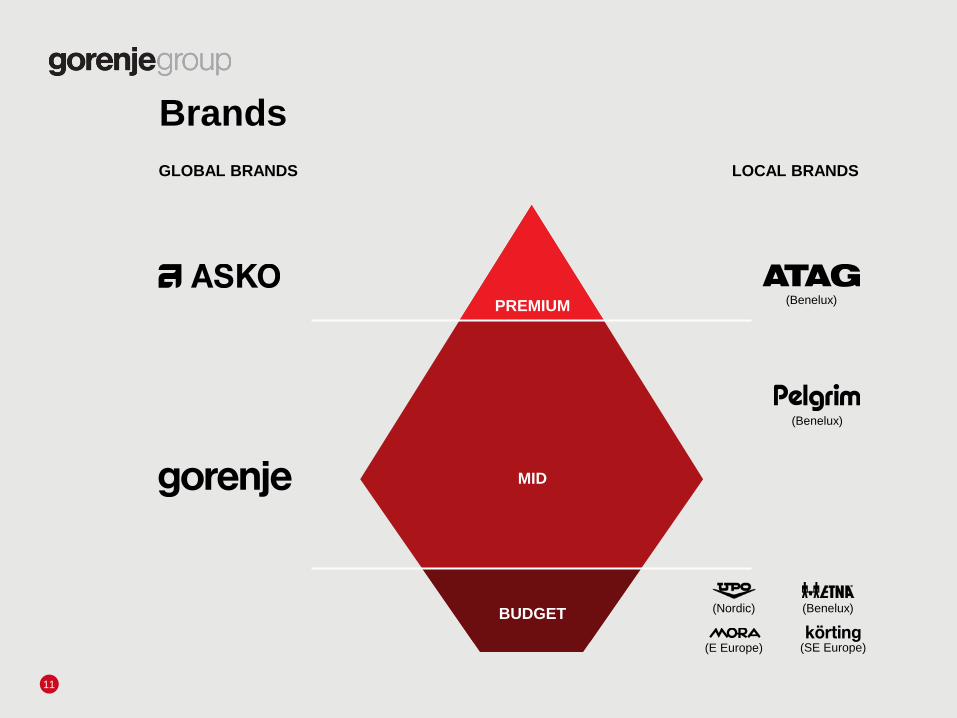
Brands
11
GLOBAL BRANDS LOCAL BRANDS
(Benelux) PREMIUM
MID
BUDGET
(Benelux)
(Nordic) (Benelux)
(E Europe) (SE Europe)
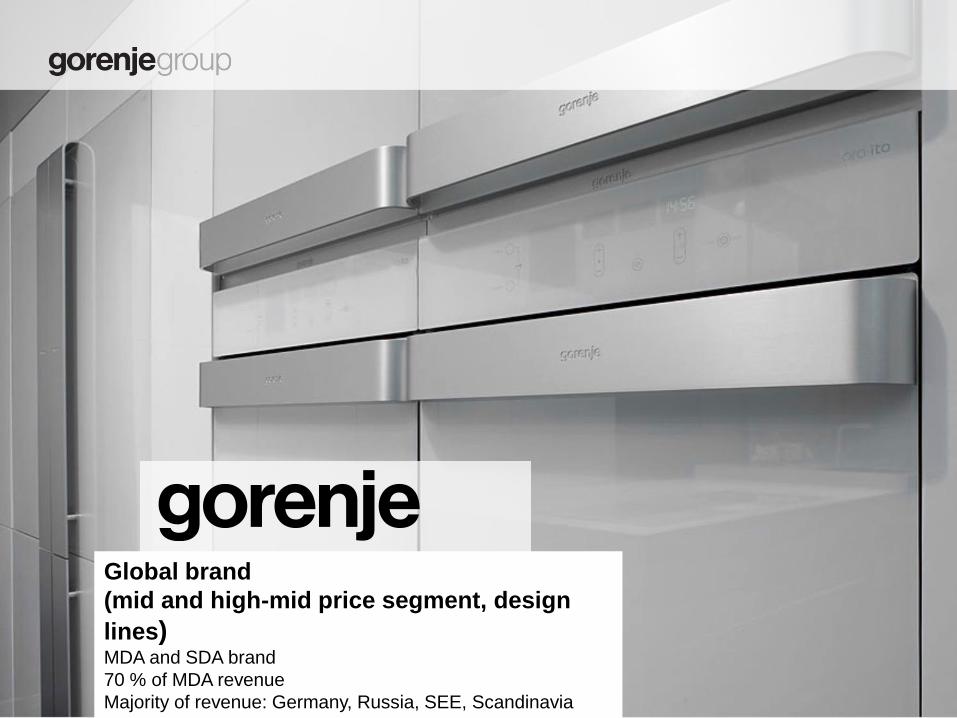
Global brand
(mid and high-mid price segment, design
lines) MDA and SDA brand
70 % of MDA revenue
Majority of revenue: Germany, Russia, SEE, Scandinavia
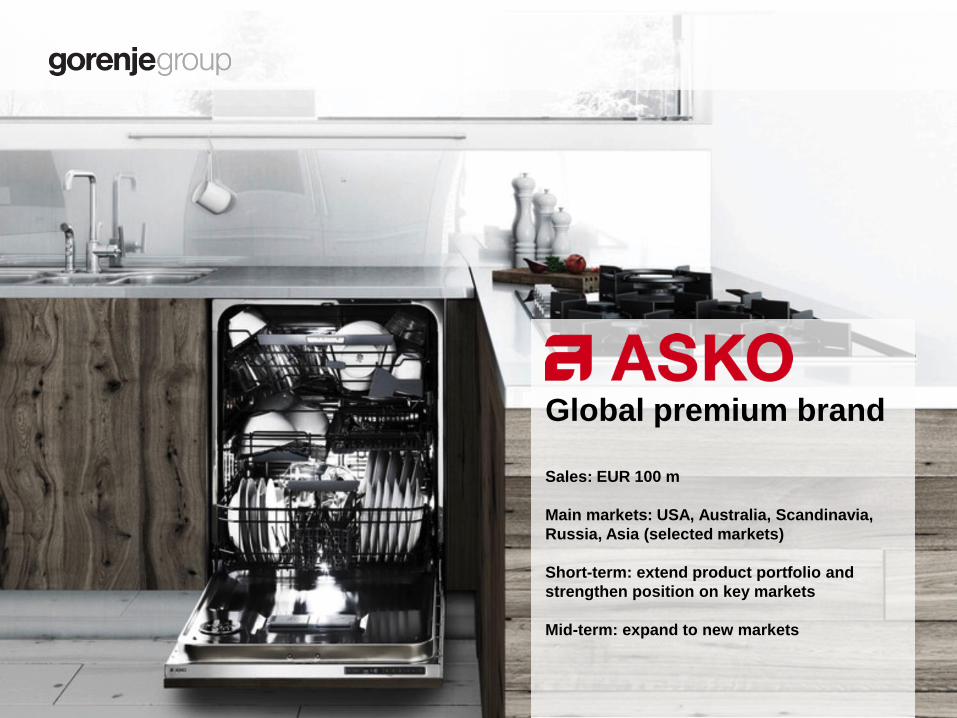
Global premium brand
Sales: EUR 100 m
Main markets: USA, Australia, Scandinavia,
Russia, Asia (selected markets)
Short-term: extend product portfolio and
strengthen position on key markets
Mid-term: expand to new markets
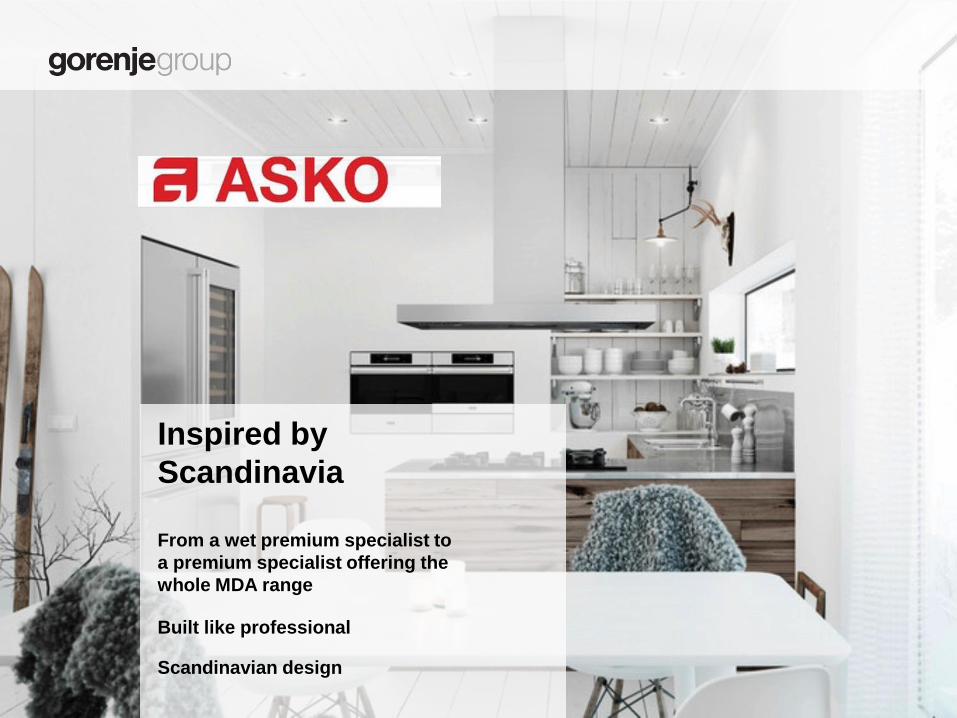
Inspired by
Scandinavia
From a wet premium specialist to
a premium specialist offering the
whole MDA range
Built like professional Scandinavian design
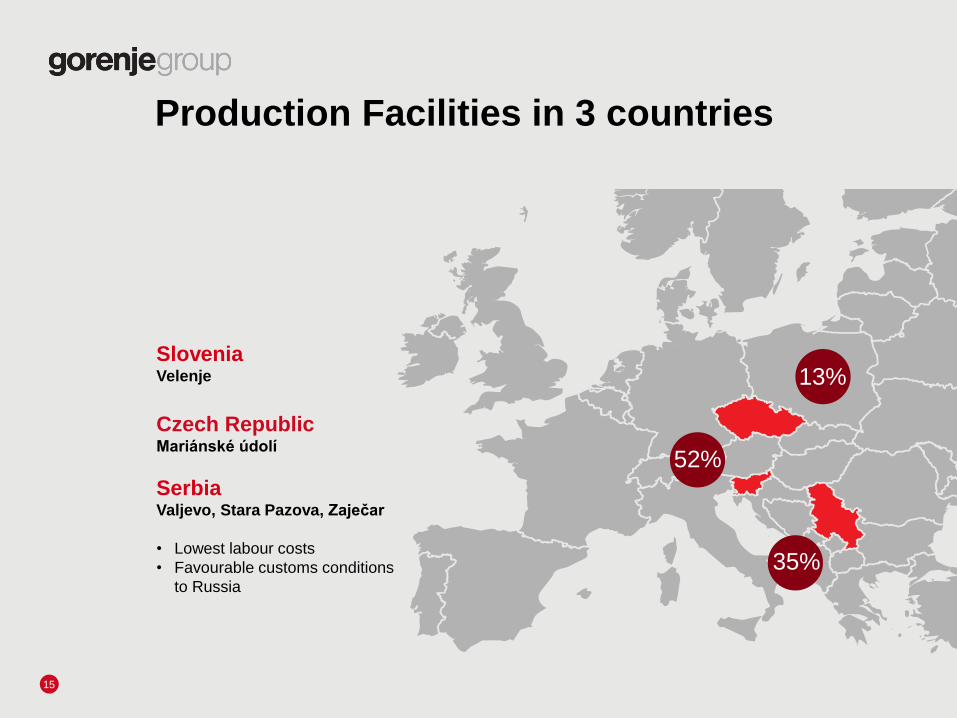
Production Facilities in 3 countries
15
Slovenia Velenje
Czech Republic Mariánské údolí
Serbia Valjevo, Stara Pazova, Zaječar
• Lowest labour costs
• Favourable customs conditions
to Russia
13%
35%
52%
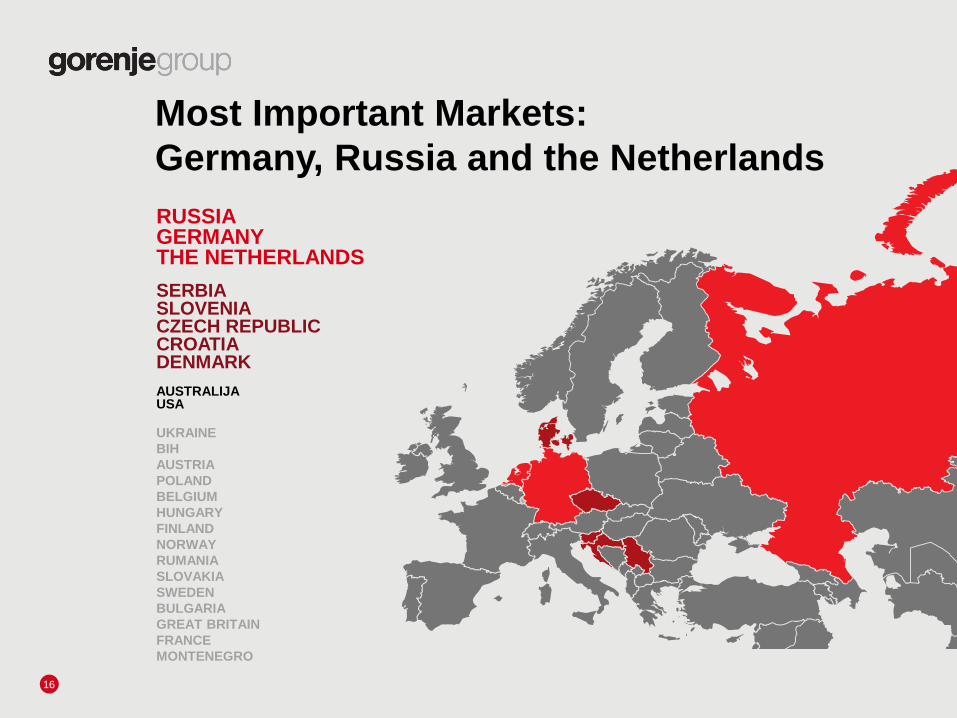
Most Important Markets:
Germany, Russia and the Netherlands
16
RUSSIA GERMANY THE NETHERLANDS SERBIA SLOVENIA CZECH REPUBLIC CROATIA DENMARK AUSTRALIJA USA
UKRAINE
BIH
AUSTRIA
POLAND
BELGIUM
HUNGARY
FINLAND
NORWAY
RUMANIA
SLOVAKIA
SWEDEN
BULGARIA
GREAT BRITAIN
FRANCE
MONTENEGRO
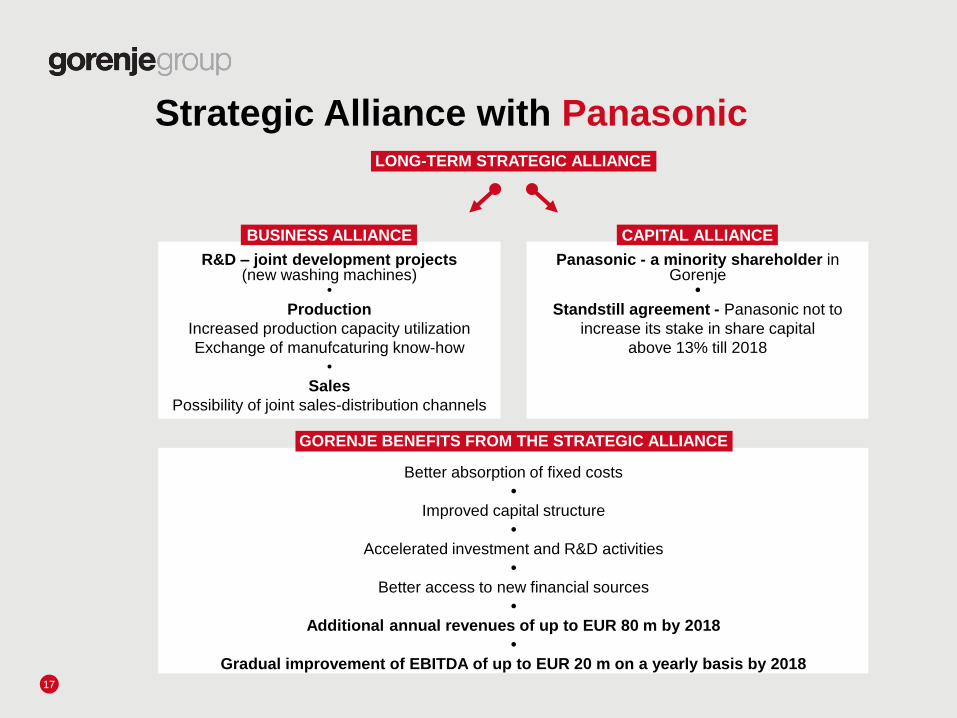
Strategic Alliance with Panasonic
17
R&D – joint development projects (new washing machines)
•
Production
Increased production capacity utilization
Exchange of manufcaturing know-how
•
Sales
Possibility of joint sales-distribution channels
CAPITAL ALLIANCE
LONG-TERM STRATEGIC ALLIANCE
BUSINESS ALLIANCE
Panasonic - a minority shareholder in Gorenje
•
Standstill agreement - Panasonic not to
increase its stake in share capital
above 13% till 2018
Better absorption of fixed costs
•
Improved capital structure
•
Accelerated investment and R&D activities
•
Better access to new financial sources
•
Additional annual revenues of up to EUR 80 m by 2018
•
Gradual improvement of EBITDA of up to EUR 20 m on a yearly basis by 2018
GORENJE BENEFITS FROM THE STRATEGIC ALLIANCE

GRADUALLY
IMPROVE
EBIT
MARGIN
Strategic Goals 2014 - 2018
18
NET DEBT/
EBITDA
not more than 3.0
from 2015 onwards
To be the
WORLD’S
LEADING
design-driven
innovator and
manufacturer of
home
appliances FOCUS
ON CORE
ACTIVITY
– Segment Home –
revenues more than
90%of all Group
revenue by
2018
INCREASE
THE SHARE
OF PREMIUM
BRANDS
SALES
to more
than 25%
GRADUAL
DIVESTMENT
of Portfolio
Companies
INCREASE
SALES
OUTSIDE
EUROPE
to close to
EUR 180 m
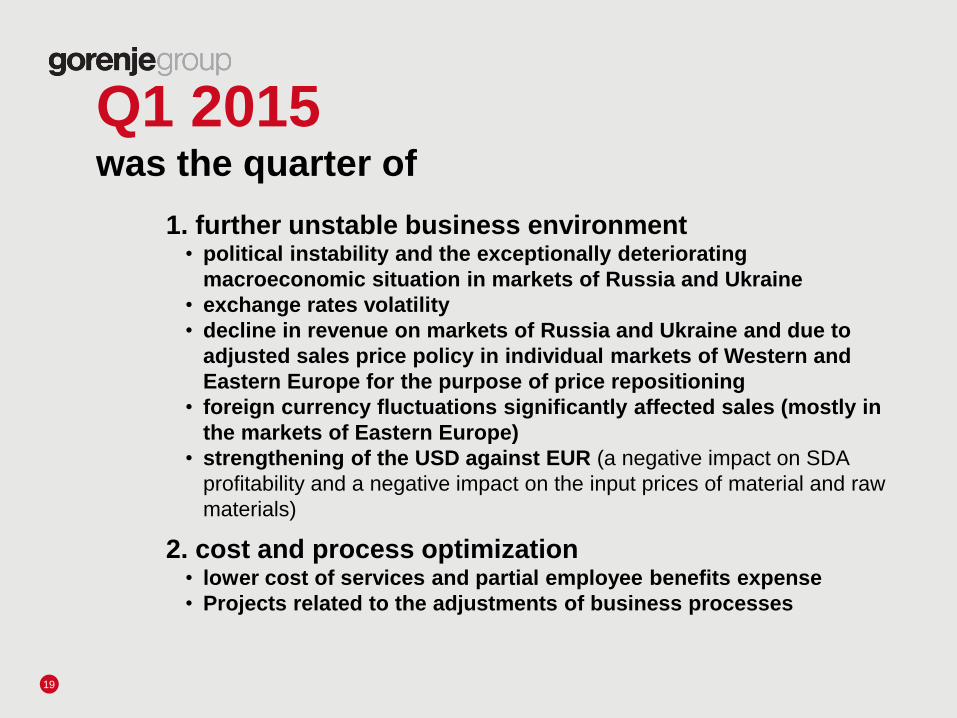
Q1 2015 was the quarter of
19
1. further unstable business environment • political instability and the exceptionally deteriorating
macroeconomic situation in markets of Russia and Ukraine
• exchange rates volatility
• decline in revenue on markets of Russia and Ukraine and due to
adjusted sales price policy in individual markets of Western and
Eastern Europe for the purpose of price repositioning
• foreign currency fluctuations significantly affected sales (mostly in
the markets of Eastern Europe)
• strengthening of the USD against EUR (a negative impact on SDA
profitability and a negative impact on the input prices of material and raw
materials)
2. cost and process optimization • lower cost of services and partial employee benefits expense
• Projects related to the adjustments of business processes
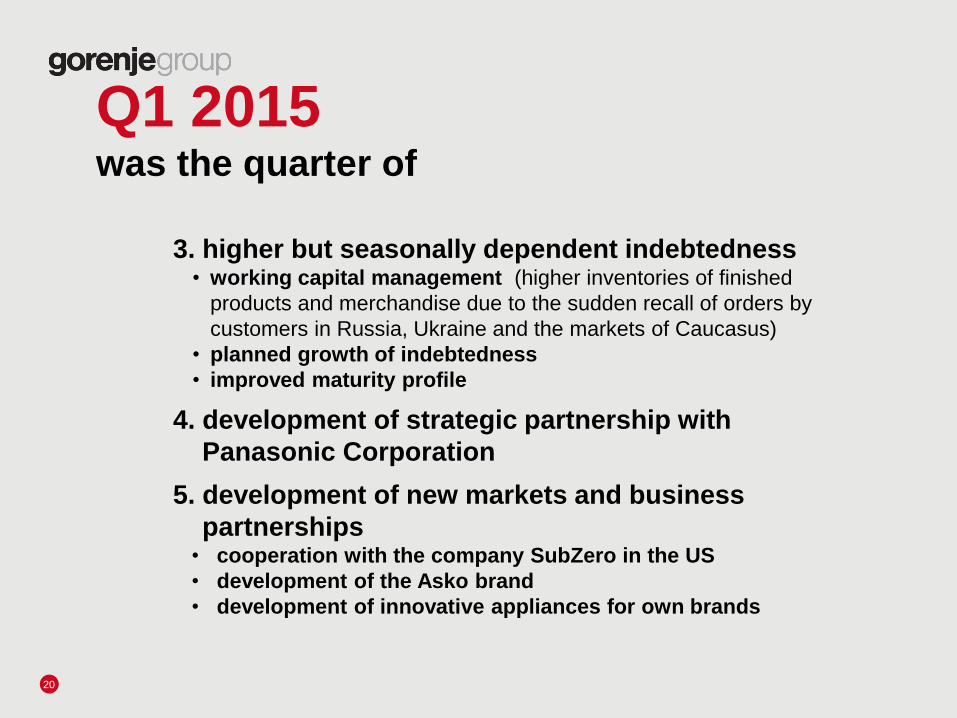
Q1 2015 was the quarter of
20
3. higher but seasonally dependent indebtedness • working capital management (higher inventories of finished
products and merchandise due to the sudden recall of orders by
customers in Russia, Ukraine and the markets of Caucasus)
• planned growth of indebtedness
• improved maturity profile
4. development of strategic partnership with
Panasonic Corporation
5. development of new markets and business
partnerships • cooperation with the company SubZero in the US
• development of the Asko brand
• development of innovative appliances for own brands
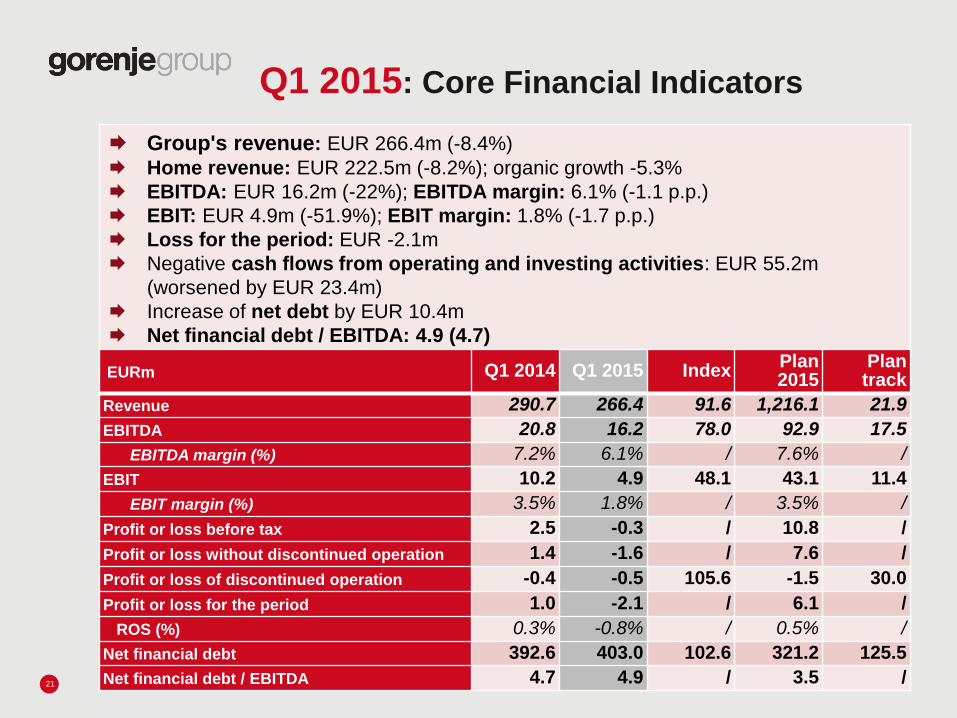
Q1 2015: Core Financial Indicators
21
Group's revenue: EUR 266.4m (-8.4%)
Home revenue: EUR 222.5m (-8.2%); organic growth -5.3%
EBITDA: EUR 16.2m (-22%); EBITDA margin: 6.1% (-1.1 p.p.)
EBIT: EUR 4.9m (-51.9%); EBIT margin: 1.8% (-1.7 p.p.)
Loss for the period: EUR -2.1m
Negative cash flows from operating and investing activities: EUR 55.2m
(worsened by EUR 23.4m)
Increase of net debt by EUR 10.4m
Net financial debt / EBITDA: 4.9 (4.7)
EURm Q1 2014 Q1 2015 Index Plan 2015
Plan track
Revenue 290.7 266.4 91.6 1,216.1 21.9
EBITDA 20.8 16.2 78.0 92.9 17.5
EBITDA margin (%) 7.2% 6.1% / 7.6% /
EBIT 10.2 4.9 48.1 43.1 11.4
EBIT margin (%) 3.5% 1.8% / 3.5% /
Profit or loss before tax 2.5 -0.3 / 10.8 /
Profit or loss without discontinued operation 1.4 -1.6 / 7.6 /
Profit or loss of discontinued operation -0.4 -0.5 105.6 -1.5 30.0
Profit or loss for the period 1.0 -2.1 / 6.1 /
ROS (%) 0.3% -0.8% / 0.5% /
Net financial debt 392.6 403.0 102.6 321.2 125.5
Net financial debt / EBITDA 4.7 4.9 / 3.5 /
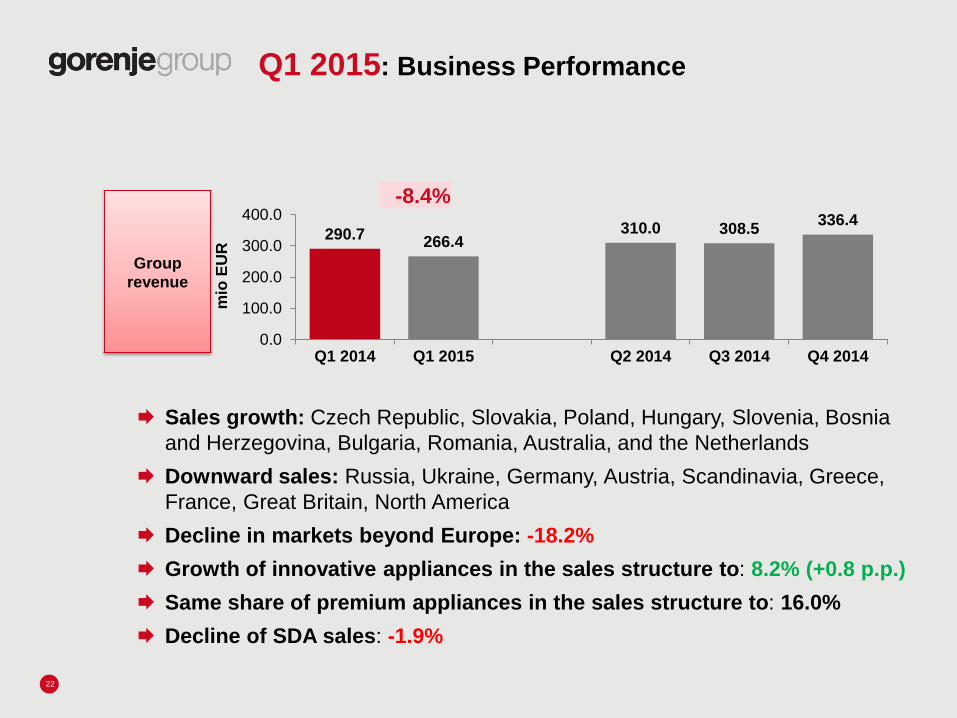
290.7 266.4
310.0 308.5 336.4
0.0
100.0
200.0
300.0
400.0
Q1 2014 Q1 2015 Q2 2014 Q3 2014 Q4 2014
mio
EU
R
Q1 2015: Business Performance
Group
revenue
22
-8.4%
Sales growth: Czech Republic, Slovakia, Poland, Hungary, Slovenia, Bosnia
and Herzegovina, Bulgaria, Romania, Australia, and the Netherlands
Downward sales: Russia, Ukraine, Germany, Austria, Scandinavia, Greece,
France, Great Britain, North America
Decline in markets beyond Europe: -18.2%
Growth of innovative appliances in the sales structure to: 8.2% (+0.8 p.p.)
Same share of premium appliances in the sales structure to: 16.0%
Decline of SDA sales: -1.9%
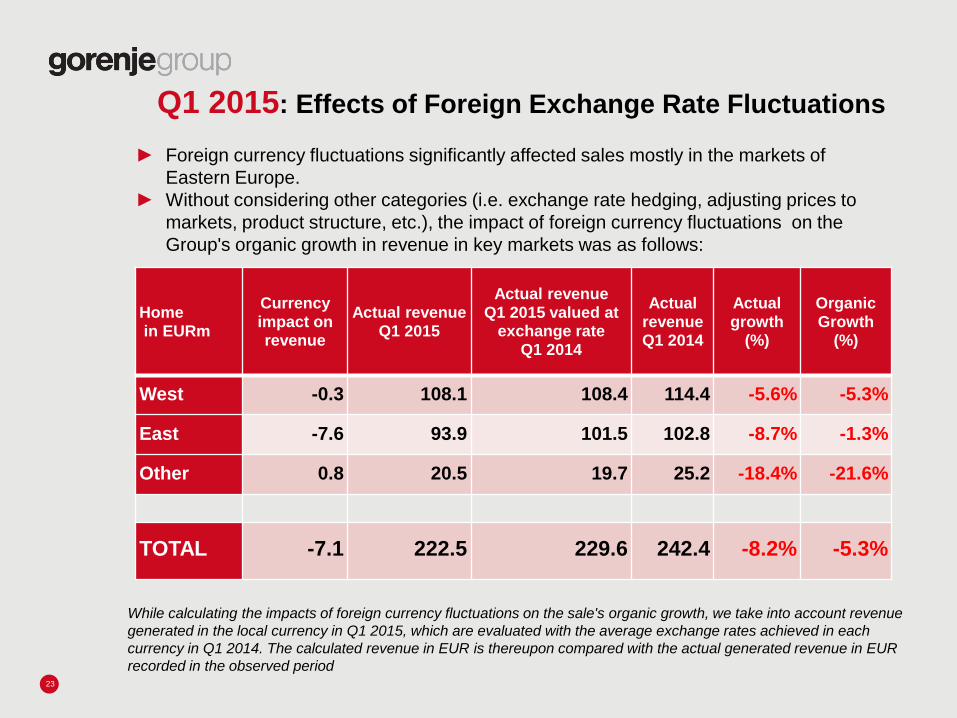
Q1 2015: Effects of Foreign Exchange Rate Fluctuations
23
Home in EURm
Currency
impact on revenue
Actual revenue Q1 2015
Actual revenue Q1 2015 valued at
exchange rate Q1 2014
Actual
revenue Q1 2014
Actual
growth (%)
Organic
Growth (%)
West -0.3 108.1 108.4 114.4 -5.6% -5.3%
East -7.6 93.9 101.5 102.8 -8.7% -1.3%
Other 0.8 20.5 19.7 25.2 -18.4% -21.6%
TOTAL -7.1 222.5 229.6 242.4 -8.2% -5.3%
► Foreign currency fluctuations significantly affected sales mostly in the markets of
Eastern Europe.
► Without considering other categories (i.e. exchange rate hedging, adjusting prices to
markets, product structure, etc.), the impact of foreign currency fluctuations on the
Group's organic growth in revenue in key markets was as follows:
While calculating the impacts of foreign currency fluctuations on the sale's organic growth, we take into account revenue
generated in the local currency in Q1 2015, which are evaluated with the average exchange rates achieved in each
currency in Q1 2014. The calculated revenue in EUR is thereupon compared with the actual generated revenue in EUR
recorded in the observed period
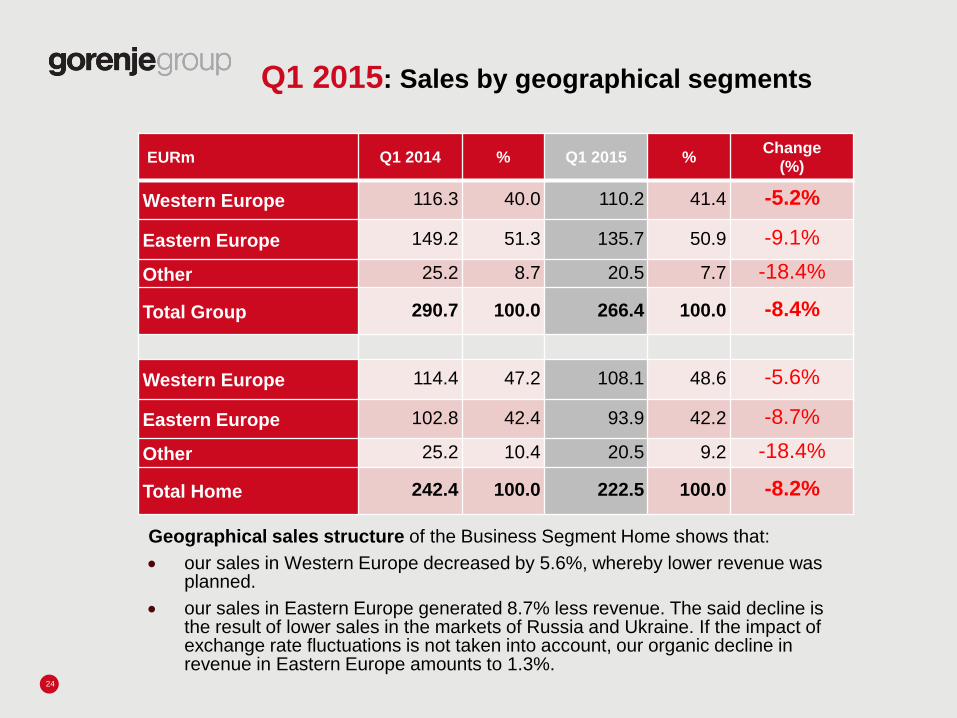
Q1 2015: Sales by geographical segments
24
EURm Q1 2014 % Q1 2015 % Change
(%)
Western Europe 116.3 40.0 110.2 41.4 -5.2%
Eastern Europe 149.2 51.3 135.7 50.9 -9.1%
Other 25.2 8.7 20.5 7.7 -18.4%
Total Group 290.7 100.0 266.4 100.0 -8.4%
Western Europe 114.4 47.2 108.1 48.6 -5.6%
Eastern Europe 102.8 42.4 93.9 42.2 -8.7%
Other 25.2 10.4 20.5 9.2 -18.4%
Total Home 242.4 100.0 222.5 100.0 -8.2%
Geographical sales structure of the Business Segment Home shows that:
our sales in Western Europe decreased by 5.6%, whereby lower revenue was planned.
our sales in Eastern Europe generated 8.7% less revenue. The said decline is the result of lower sales in the markets of Russia and Ukraine. If the impact of exchange rate fluctuations is not taken into account, our organic decline in revenue in Eastern Europe amounts to 1.3%.
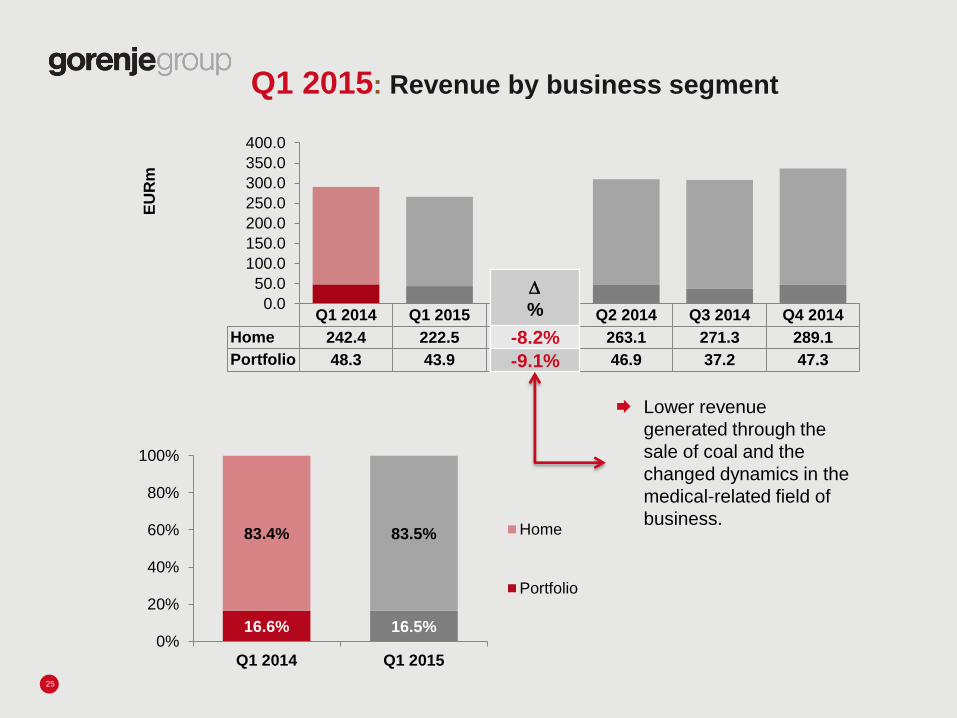
Q1 2014 Q1 2015 Q2 2014 Q3 2014 Q4 2014
Home 242.4 222.5 263.1 271.3 289.1
Portfolio 48.3 43.9 46.9 37.2 47.3
0.0
50.0
100.0
150.0
200.0
250.0
300.0
350.0
400.0E
UR
m
Q1 2015: Revenue by business segment
25
%
-8.2%
-9.1%
16.6% 16.5%
83.4% 83.5%
0%
20%
40%
60%
80%
100%
Q1 2014 Q1 2015
Home
Portfolio
Lower revenue
generated through the
sale of coal and the
changed dynamics in the
medical-related field of
business.
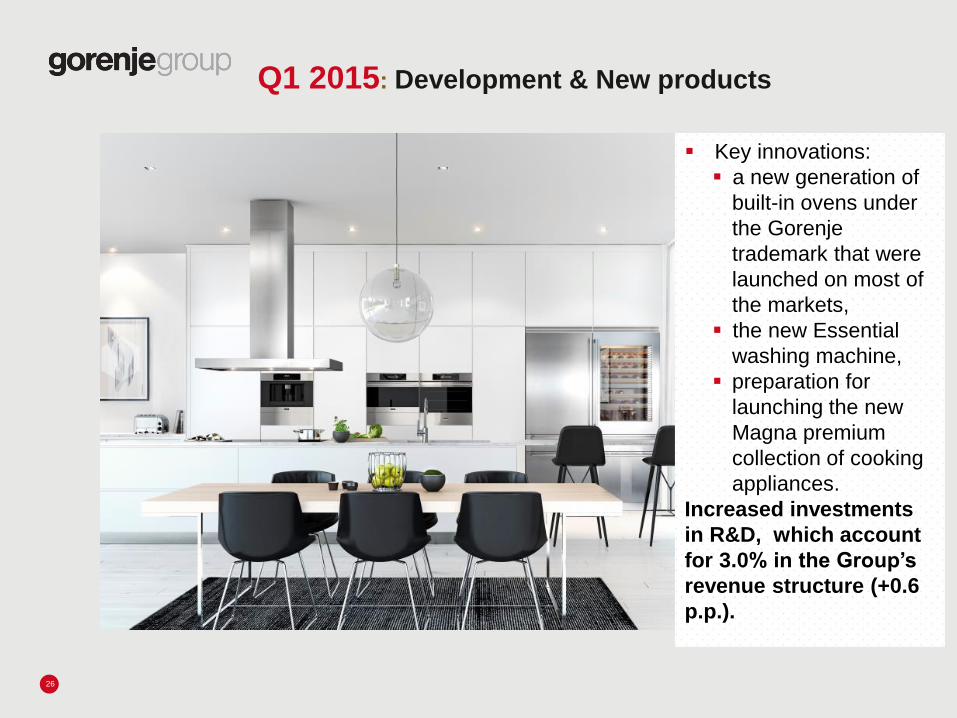
Key innovations:
a new generation of
built-in ovens under
the Gorenje
trademark that were
launched on most of
the markets,
the new Essential
washing machine,
preparation for
launching the new
Magna premium
collection of cooking
appliances.
Increased investments
in R&D, which account
for 3.0% in the Group’s
revenue structure (+0.6
p.p.).
26
Q1 2015: Development & New products
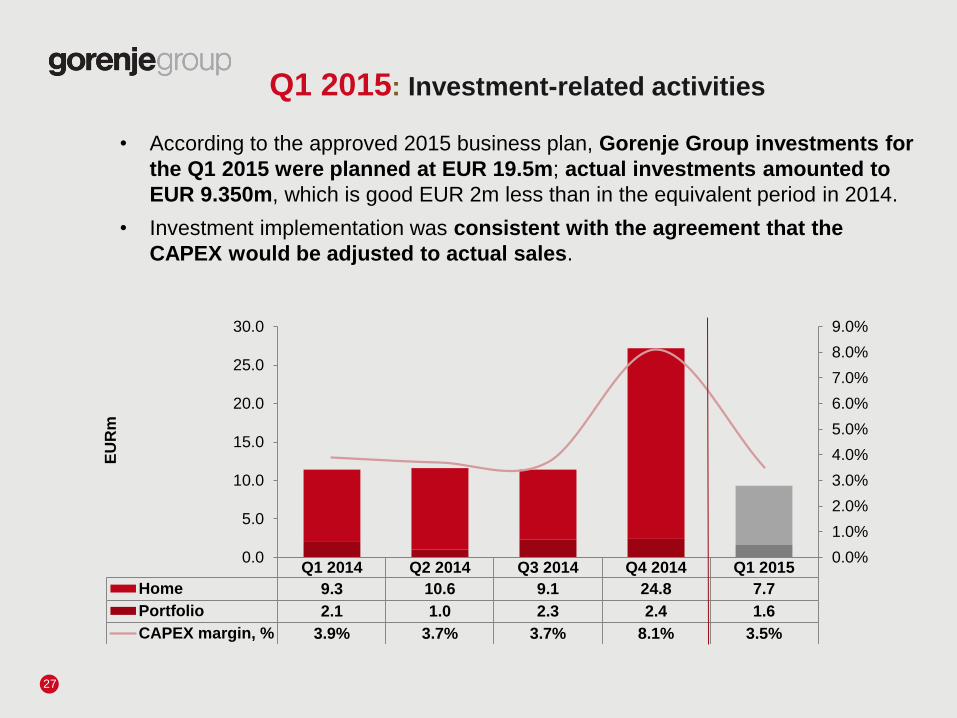
• According to the approved 2015 business plan, Gorenje Group investments for
the Q1 2015 were planned at EUR 19.5m; actual investments amounted to
EUR 9.350m, which is good EUR 2m less than in the equivalent period in 2014.
• Investment implementation was consistent with the agreement that the
CAPEX would be adjusted to actual sales.
27
Q1 2015: Investment-related activities
Q1 2014 Q2 2014 Q3 2014 Q4 2014 Q1 2015
Home 9.3 10.6 9.1 24.8 7.7
Portfolio 2.1 1.0 2.3 2.4 1.6
CAPEX margin, % 3.9% 3.7% 3.7% 8.1% 3.5%
0.0%
1.0%
2.0%
3.0%
4.0%
5.0%
6.0%
7.0%
8.0%
9.0%
0.0
5.0
10.0
15.0
20.0
25.0
30.0
EU
Rm
Q1 2014 Q1 2015 Q2 2014 Q3 2014 Q4 2014
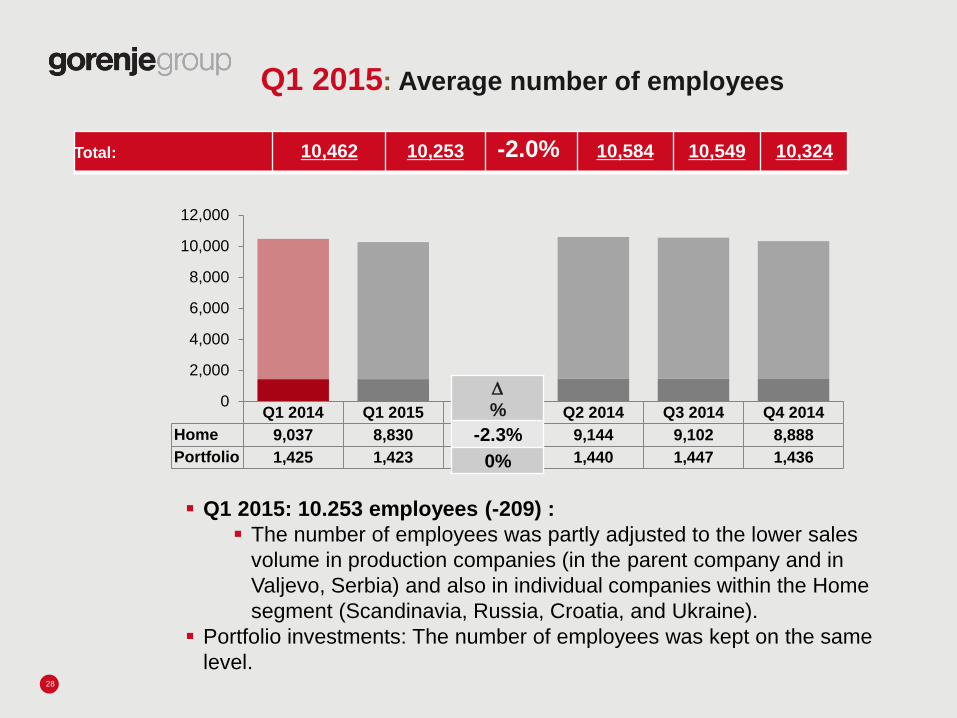
Home 9,037 8,830 9,144 9,102 8,888
Portfolio 1,425 1,423 1,440 1,447 1,436
0
2,000
4,000
6,000
8,000
10,000
12,000
Q1 2015: Average number of employees
Q1 2015: 10.253 employees (-209) :
The number of employees was partly adjusted to the lower sales
volume in production companies (in the parent company and in
Valjevo, Serbia) and also in individual companies within the Home
segment (Scandinavia, Russia, Croatia, and Ukraine).
Portfolio investments: The number of employees was kept on the same
level. 28
%
-2.3%
0%
Total: 10,462 10,253 -2.0% 10,584 10,549 10,324
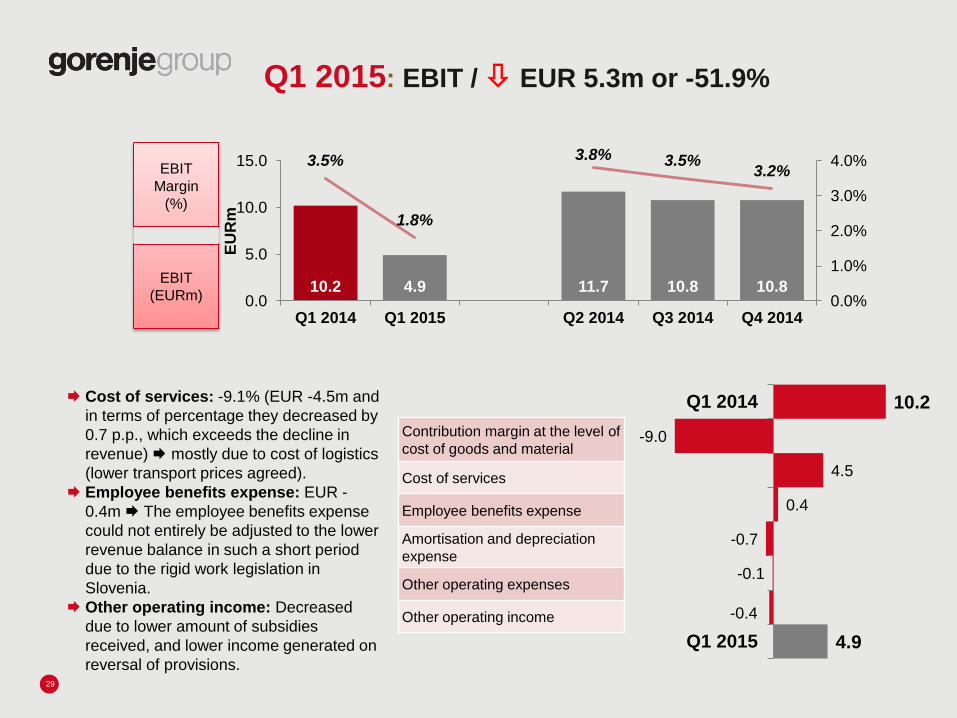
Q1 2015: EBIT / EUR 5.3m or -51.9%
EBIT
Margin
(%)
EBIT
(EURm)
Contribution margin at the level of
cost of goods and material
Cost of services
Employee benefits expense
Amortisation and depreciation
expense
Other operating expenses
Other operating income
10.2
-9.0
4.5
0.4
-0.7
-0.1
-0.4
4.9
Q1 2014
Q1 2015
29
10.2 4.9 11.7 10.8 10.8
3.5%
1.8%
3.8% 3.5% 3.2%
0.0%
1.0%
2.0%
3.0%
4.0%
0.0
5.0
10.0
15.0
Q1 2014 Q1 2015 Q2 2014 Q3 2014 Q4 2014
EU
Rm
Cost of services: -9.1% (EUR -4.5m and
in terms of percentage they decreased by
0.7 p.p., which exceeds the decline in
revenue) mostly due to cost of logistics
(lower transport prices agreed).
Employee benefits expense: EUR -
0.4m The employee benefits expense
could not entirely be adjusted to the lower
revenue balance in such a short period
due to the rigid work legislation in
Slovenia.
Other operating income: Decreased
due to lower amount of subsidies
received, and lower income generated on
reversal of provisions.
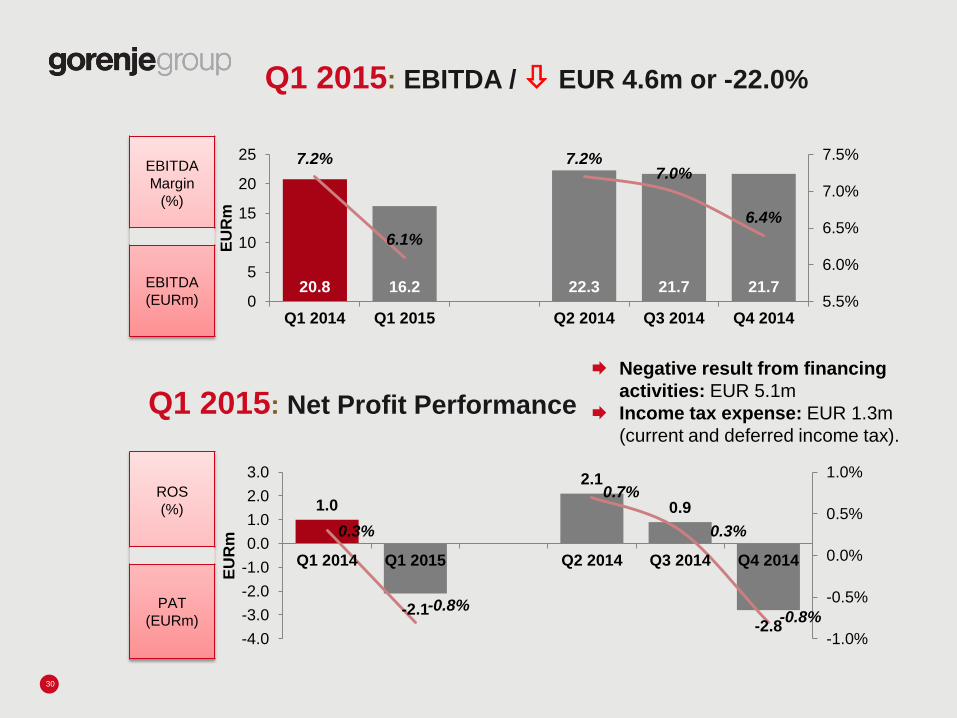
Q1 2015: EBITDA / EUR 4.6m or -22.0%
EBITDA
Margin
(%)
EBITDA
(EURm)
Q1 2015: Net Profit Performance
ROS
(%)
PAT
(EURm)
30
20.8 16.2 22.3 21.7 21.7
7.2%
6.1%
7.2% 7.0%
6.4%
5.5%
6.0%
6.5%
7.0%
7.5%
0
5
10
15
20
25
Q1 2014 Q1 2015 Q2 2014 Q3 2014 Q4 2014
EU
Rm
1.0
-2.1
2.1
0.9
-2.8
0.3%
-0.8%
0.7%
0.3%
-0.8%
-1.0%
-0.5%
0.0%
0.5%
1.0%
-4.0
-3.0
-2.0
-1.0
0.0
1.0
2.0
3.0
Q1 2014 Q1 2015 Q2 2014 Q3 2014 Q4 2014
EU
Rm
Negative result from financing
activities: EUR 5.1m
Income tax expense: EUR 1.3m
(current and deferred income tax).

Q1 2015: Financial Performance / Indebtedness
Movement of total and net financial liabilities in Q1 for the period 2012-2015 * (EURm)
and maturity structure of financial liabilities
31
* Accounting aspect
467.3 473.2 418.2 422.5 425.5
451.9
392.6 403.0
0.0
50.0
100.0
150.0
200.0
250.0
300.0
350.0
400.0
450.0
500.0
31.3.2012 31.3.2013 31.3.2014 31.3.2015
Total financial liabilities Net financial liabilities
62.4% 57.2% 46.4%
60.2%
37.6% 42.8% 53.6%
39.8%
0%
10%
20%
30%
40%
50%
60%
70%
80%
90%
100%
31.3.2012 31.3.2013 31.3.2014 31.3.2015
LT financial liabilities ST financial liabilities
Gross debt: EUR 422.5m (+EUR 4.3m) result complies with interim seasonal
dynamics as the Group generates most of negative cash flows from operating and
investing activities; result comprises also liabilities under the fair value of forward
contracts used for hedging against interest rate and currency fluctuations.
Net financial debt: EUR 403.0m (+EUR 10.3m)
Net financial debt / EBITDA: 4.9 (decline by 0.2)
Cash flows from operating and investing activities: -EUR 55.2m; -EUR 31.9m
in Q1 2014
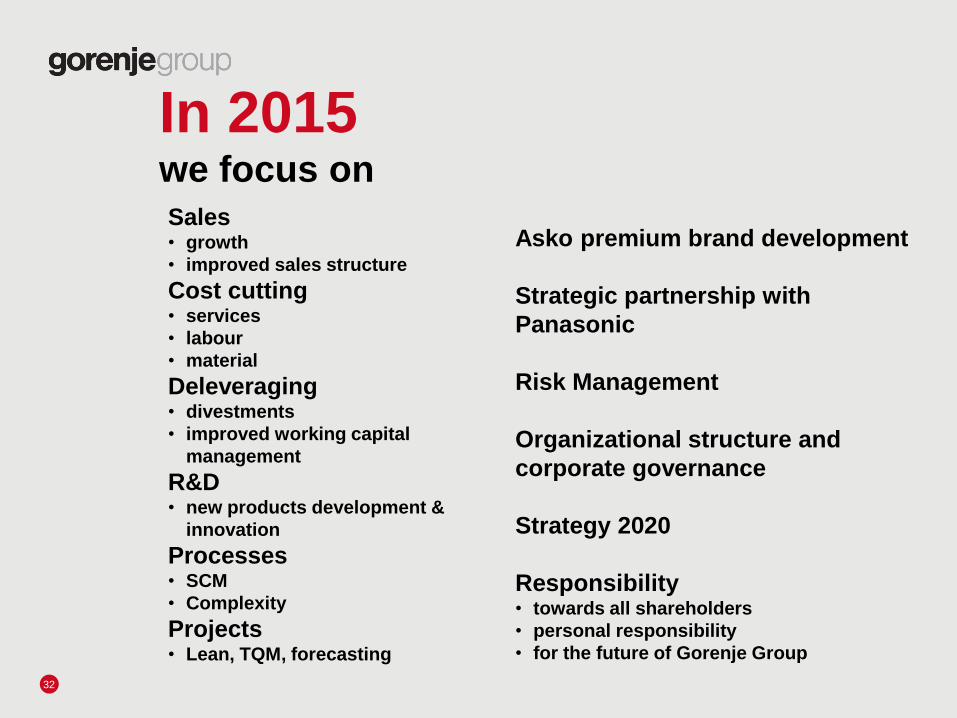
In 2015 we focus on
32
Sales • growth
• improved sales structure
Cost cutting • services
• labour
• material
Deleveraging • divestments
• improved working capital
management
R&D • new products development &
innovation
Processes • SCM
• Complexity
Projects • Lean, TQM, forecasting
Asko premium brand development
Strategic partnership with
Panasonic
Risk Management
Organizational structure and
corporate governance
Strategy 2020
Responsibility • towards all shareholders
• personal responsibility
• for the future of Gorenje Group
*
33
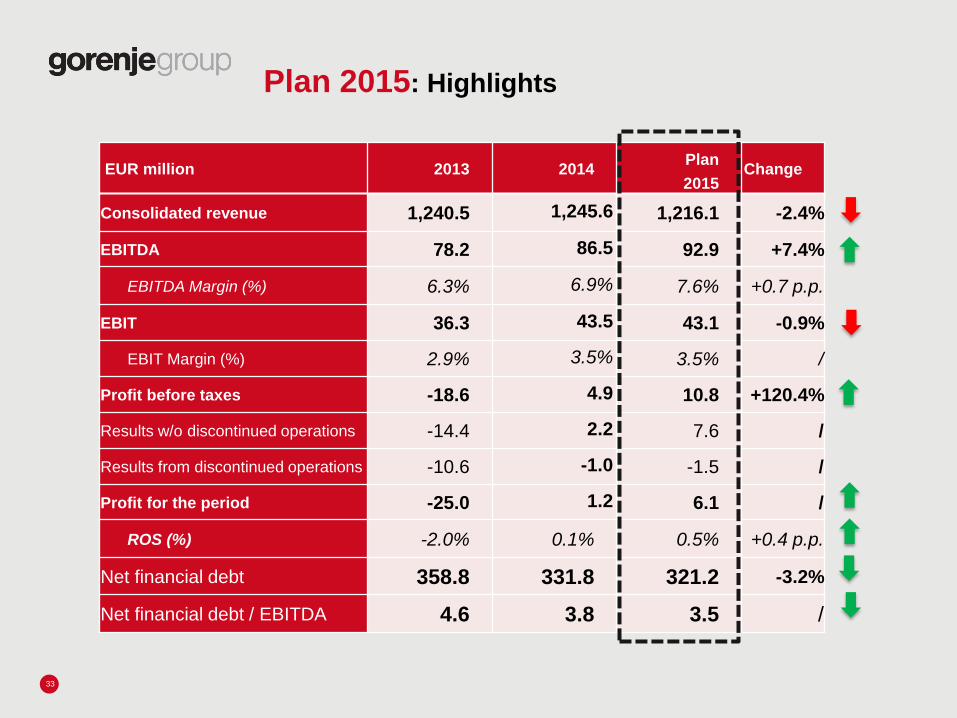
EUR million 2013 2014 Plan 2015
Change
Consolidated revenue 1,240.5 1,245.6 1,216.1 -2.4%
EBITDA 78.2 86.5 92.9 +7.4%
EBITDA Margin (%) 6.3% 6.9% 7.6% +0.7 p.p.
EBIT 36.3 43.5 43.1 -0.9%
EBIT Margin (%) 2.9% 3.5% 3.5% /
Profit before taxes -18.6 4.9 10.8 +120.4%
Results w/o discontinued operations -14.4 2.2 7.6 /
Results from discontinued operations -10.6 -1.0 -1.5 /
Profit for the period -25.0 1.2 6.1 /
ROS (%) -2.0% 0.1% 0.5% +0.4 p.p.
Net financial debt 358.8 331.8 321.2 -3.2%
Net financial debt / EBITDA 4.6 3.8 3.5 /
Plan 2015: Highlights
34
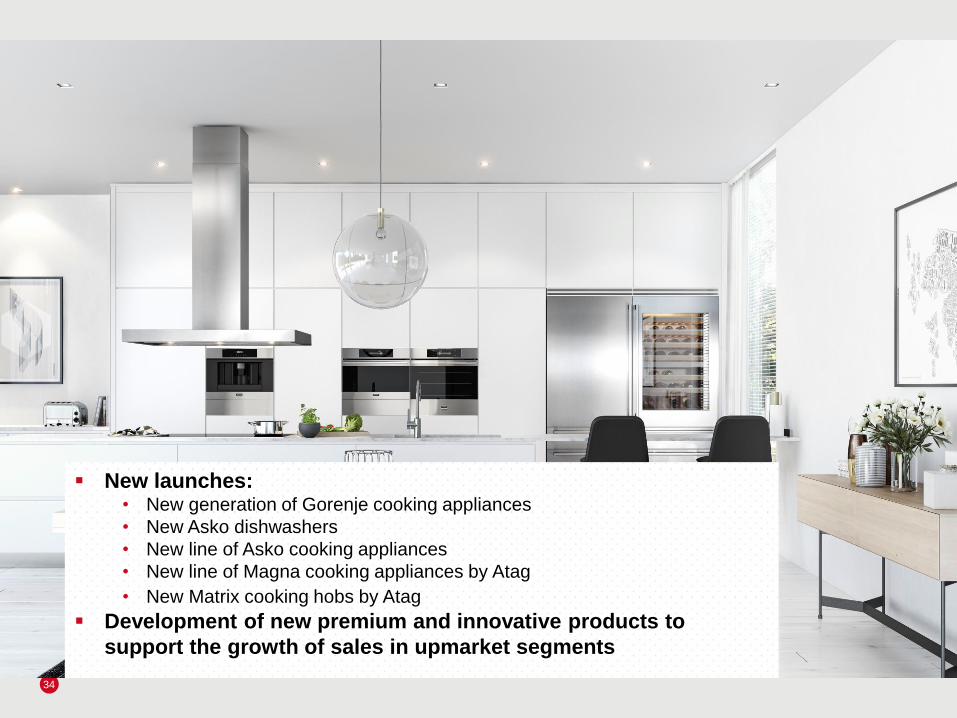
New launches: • New generation of Gorenje cooking appliances
• New Asko dishwashers
• New line of Asko cooking appliances
• New line of Magna cooking appliances by Atag
• New Matrix cooking hobs by Atag
Development of new premium and innovative products to
support the growth of sales in upmarket segments
Thank you
for your attention.
Gorenje Representatives
36
Mr. Štefan Kuhar
Executive director, Finance, Tax and Asset
Management
T +386 3 899 7394
M +386 41 343 500
Gorenje, d.d.
Partizanska cesta 12, SI-3320 Velenje, Slovenia
Slovenia
www.gorenjegoup.com
Mrs. Bojana Rojc
Head of IR
T +386 3 899 1345
M +386 51 351 706
Gorenje, d.d.
Partizanska cesta 12, SI-3320 Velenje, Slovenia
Slovenia
www.gorenjegoup.com
Forward-looking statements
This presentation includes forward-looking information and forecasts – i.e. statements regarding the future, rather
than the past, and statements regarding events within the framework and in relation to the currently effective
legislation on publicly traded companies and securities and pursuant to the Rules and Regulations of the Ljubljana
Stock Exchange. These statements can be identified by the words such as "expected", "anticipated", "forecast",
"intended", "planned or budgeted", "probable or likely", "strive/invest effort to", "estimated", "will", "projected", or
similar expressions. These statements include, among others, financial goals and targets of the parent company
Gorenje, d.d., and the Gorenje Group for the upcoming periods, planned or budgeted operations, and financial plans.
These statements are based on current expectations and forecasts and are subject to risk and uncertainty which may
affect the actual results which may in turn differ from the information stated herein for various reasons. Various
factors, many of which are beyond reasonable control by Gorenje, affect the operations, performance, business
strategy, and results of Gorenje. As a result of these factors, actual results, performance, or achievements of Gorenje
may differ materially from the expected results, performance, or achievements as stated in these forward-looking
statements. These factors include, without prejudice to any not mentioned herein, the following: Consumer demand
and market conditions in geographical segments or regions and in the industries in which Gorenje Group is
conducting its operating activities; effects of changes in exchange rates; competitive downward pressure on
downstream prices; major loss of business with a major account/customer; the possibility of overdue or late payment
on the part of the customers; decrease in prices as a result of persistently harsh market conditions, in an extent much
higher than currently expected by the Gorenje Management Board; success of development of new products and
implementation in the market; development of manufacturer's liability for the product; progress of attainment of
operative and strategic goals regarding efficiency; successful identification of opportunities for growth and mergers
and acquisitions, and integration of such opportunities into the existing operations; further volatility and aggravation of
circumstances in capital markets; progress in attainment of goals regarding structural reorganization and
reorganization in purchasing. If one or more risks or uncertainties are in fact materialized or if the said assumptions
are proven wrong, actual results may deviate materially from those stated as expected, hoped for, forecast, projected,
planned, probable, estimated, or anticipated in this announcement. Gorenje does not intend to assume and will not
allow for any liability to update or revise these forecasts in light of development differing from the expected events.
37