GOFC-GOLD Regional Networks
27
GOFC-GOLD Regional Networks Krishna Vadrevu NASA MSFC
Transcript of GOFC-GOLD Regional Networks

GOFC-GOLD Regional Networks
Krishna VadrevuNASA MSFC
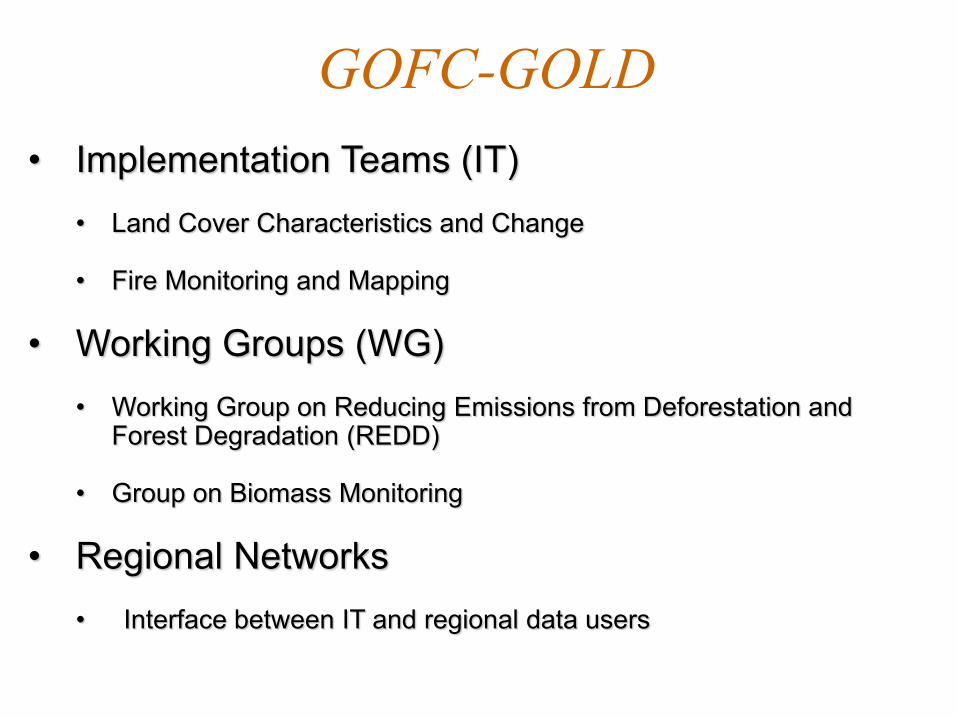
GOFC-GOLD• Implementation Teams (IT)
• Land Cover Characteristics and Change
• Fire Monitoring and Mapping
• Working Groups (WG)• Working Group on Reducing Emissions from Deforestation and
Forest Degradation (REDD)
• Group on Biomass Monitoring
• Regional Networks• Interface between IT and regional data users
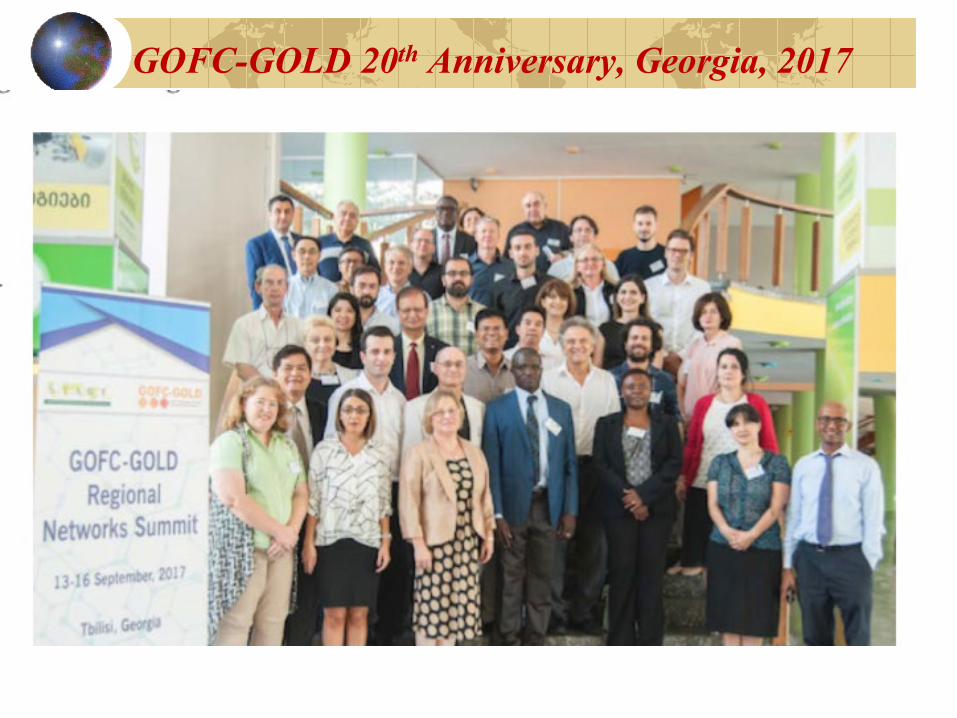
GOFC-GOLD 20th Anniversary, Georgia, 2017
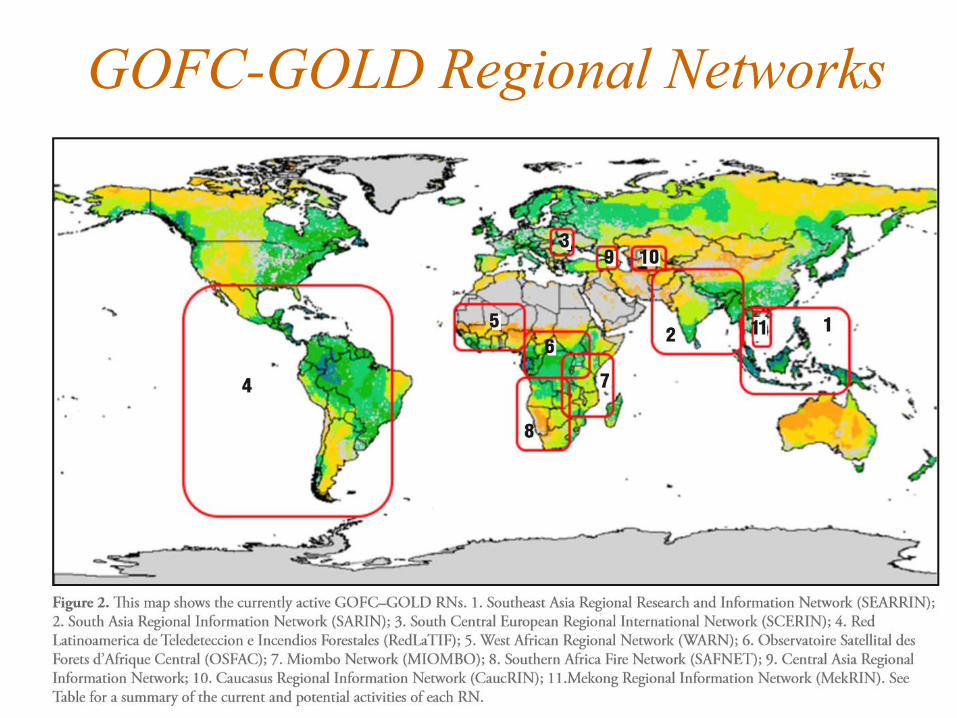
GOFC-GOLD Regional Networks


• Of the 11 networks, 6 networks showing interests in Fires
• SAFNET• RedLATIF• SEARRIN• SARIN
• WARN • Miombo

GOFC-GOLD FAO website - very old info – not actively updated) - (contacted Dough Muchoney and shut it down)
GOFC-GOLD – Fire-IT website – www.gofc-fire.umd.edu
GOFC-GOLD – Land Cover IT website –http://www.gofcgold.wur.nl/
GOFC-GOLD – START website -https://start.org/programs/gofc-gold/
Regional Networks Information is being posted at GOFC-GOLD Fire website;
Consistency is needed !
GOFC-GOLD Website Update
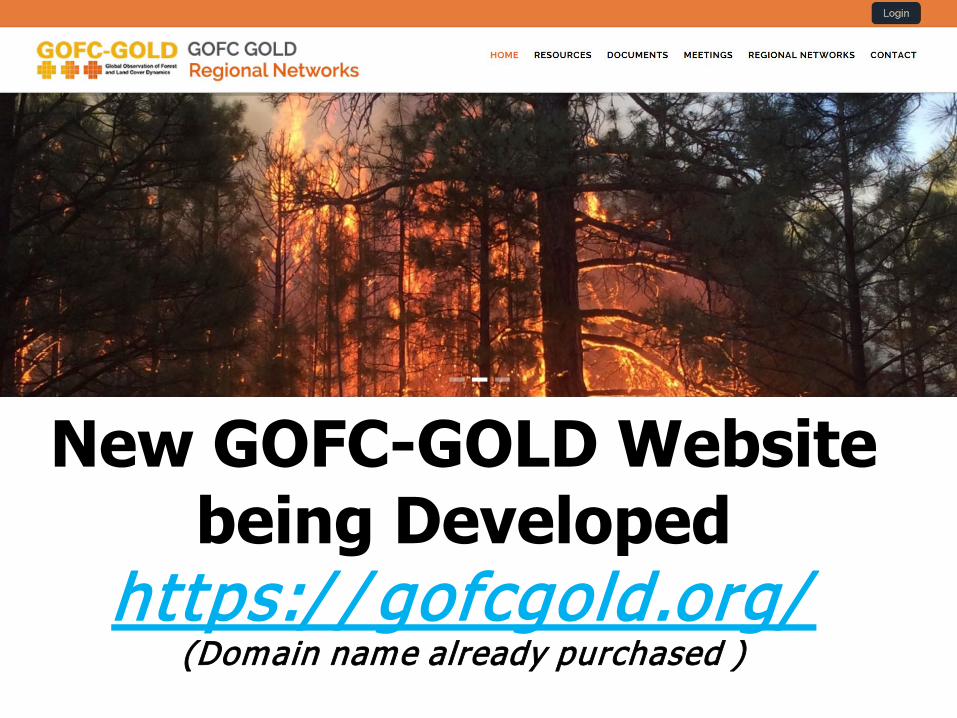
New GOFC-GOLD Websitebeing Developed
https:/ / gofcgold.org/(Domain name already purchased )
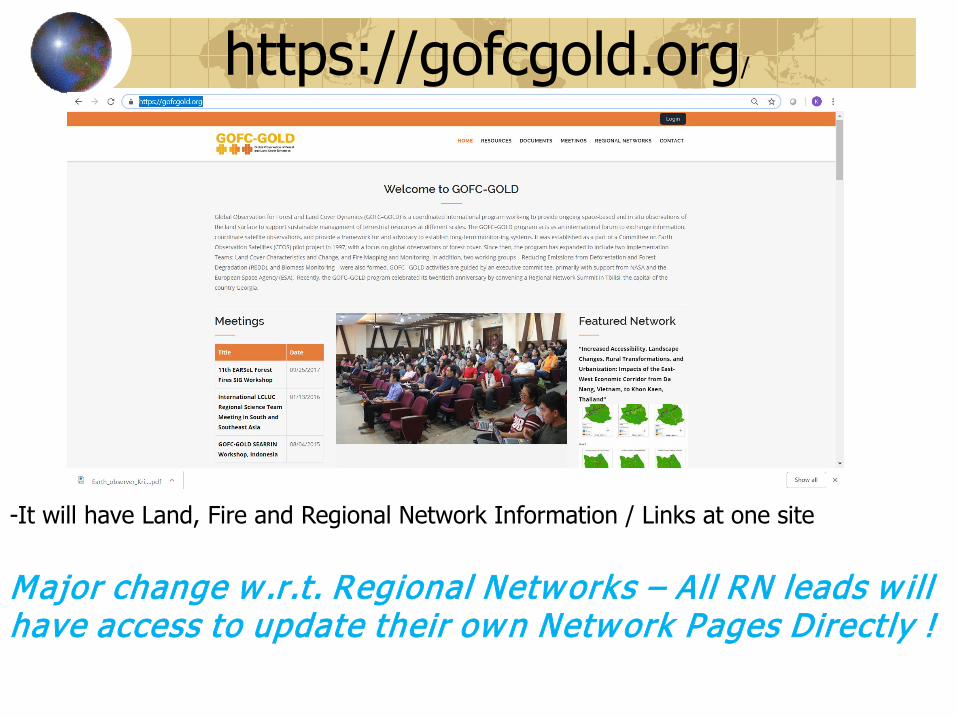
https://gofcgold.org/
-It will have Land, Fire and Regional Network Information / Links at one site
Major change w .r.t. Regional Networks – All RN leads w ill have access to update their own Network Pages Directly !

• Both network researchers are represented in the annual + thematic meetings of South/Southeast Asia Research Initiative (SARI) – LCLUC
• Due to funding issues, we are combining events under one umbrella.
• Dedicated Fires/Biomass Burning sessions involving Regional Scientists for 1.5-days;
• Funding is for mostly Meetings + Trainings through JAXA – NIES (since 7-years and will continue)
Updates from SEARRIN and SARIN

Quezon city, Philippines
28-30th May, 2018
200-participants3-day meeting with sessions on LCLUC, Agriculture and Land-Atmopsheric Interactions
1.5-day - Land Atmospheric Interactions –Parallel sessions
3-day training with 100-participants(31 May + 1, 2nd June)

Brief History of INSAT Satellites Satellite Meteorology in IMD really started in 1982 with the launch of INSAT-1A
which was a multipurpose satellite meant for services to Meteorology, Televisionand Communication. Before that , Indian meteorologists were using analogimageries received from U.S. Polar orbiting satellites series of TIROS-N.
Many satellites for meteorological purposes were launched after the launch ofINSAT-1A as given below:
• INSAT-1A – 10 April 1982• Two Channel VHRR• INSAT-1B – 30 August,1983• INSAT-1C – 21 July 1988• INSAT-1D – 12 June,1990• INSAT-2A – 10 July, 1992• INSAT-2B – 23 July,1993• INSAT-2E – 03 April 1999 Three Channel VHRR• KALPANA-1 – 12 Sept.2002• INSAT-3A – 10 April 2003• INSAT-3D – 25 July, 2013• INSAT-3D – 26 July,2013 --- 6 channel imager and 19 channel sounder
C-Band Transponders mainly for communication
Some with Meteorological Observations
INSAT-3D - India’s Advanced Weather Satellite
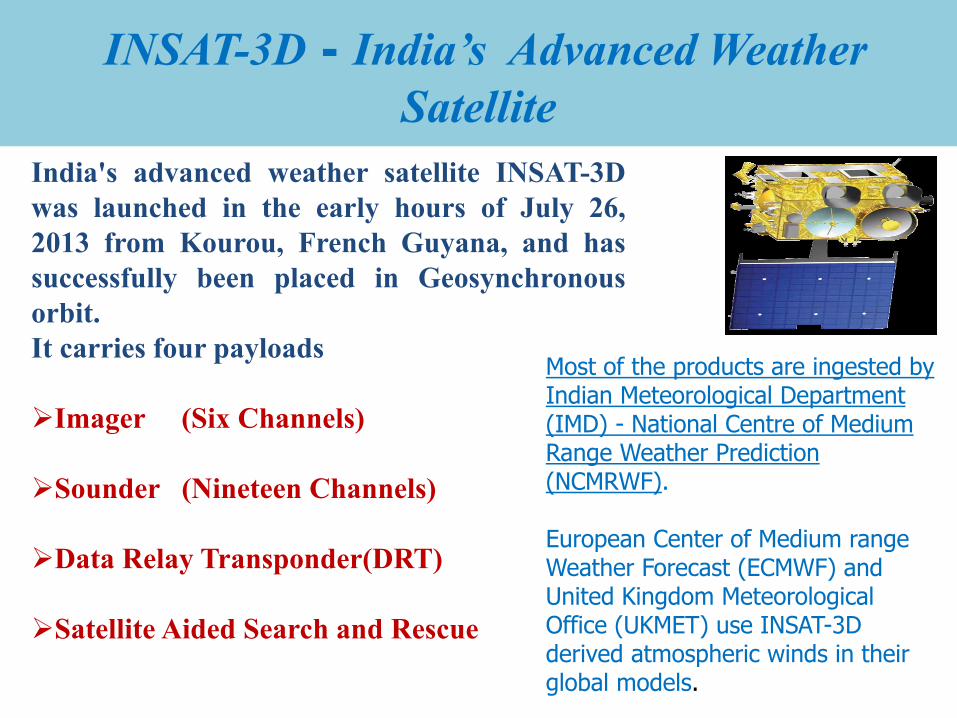
India's advanced weather satellite INSAT-3Dwas launched in the early hours of July 26,2013 from Kourou, French Guyana, and hassuccessfully been placed in Geosynchronousorbit.It carries four payloads
Imager (Six Channels)
Sounder (Nineteen Channels)
Data Relay Transponder(DRT)
Satellite Aided Search and Rescue
Most of the products are ingested by Indian Meteorological Department (IMD) - National Centre of Medium Range Weather Prediction (NCMRWF).
European Center of Medium range Weather Forecast (ECMWF) and United Kingdom Meteorological Office (UKMET) use INSAT-3D derived atmospheric winds in their global models.
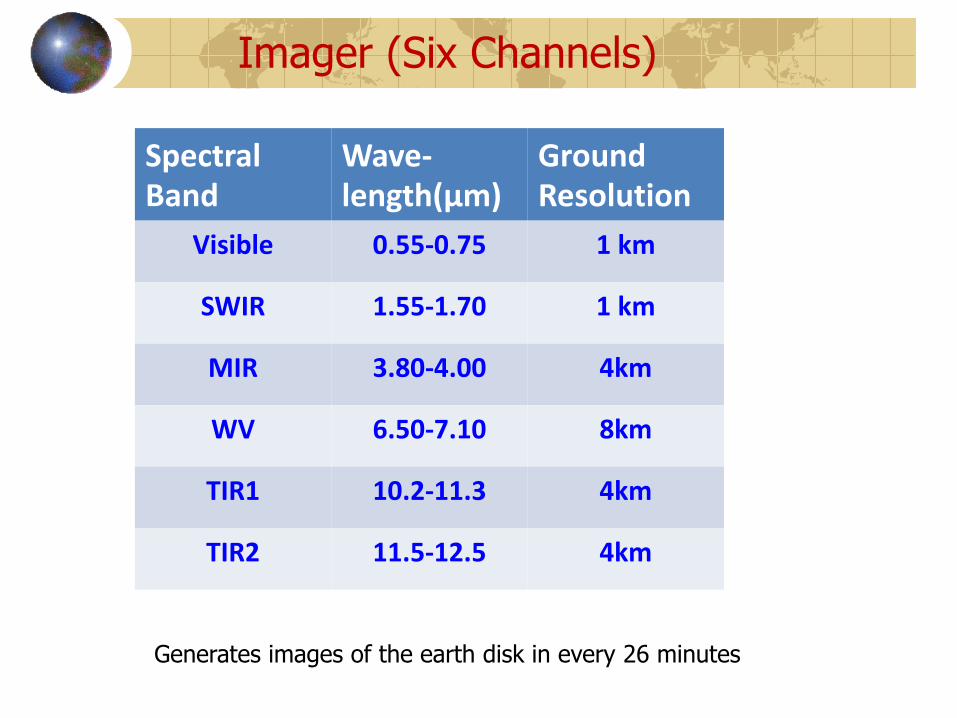
Spectral Band
Wave-length(µm)
Ground Resolution
Visible 0.55-0.75 1 km
SWIR 1.55-1.70 1 km
MIR 3.80-4.00 4km
WV 6.50-7.10 8km
TIR1 10.2-11.3 4km
TIR2 11.5-12.5 4km
Imager (Six Channels)
Generates images of the earth disk in every 26 minutes

INSAT-3D Sounder Channels Characteristics
Detector Ch. No. l c(mm)
nc(cm-1)
NE∆T@300K
Principal absorbing gas Purpose
Long wave
1 14.67 682 0.17 CO2 Stratosphere temperature
2 14.32 699 0.16 CO2 Tropopause temperature
3 14.04 712 0.15 CO2 Upper-level temperature
4 13.64 733 0.12 CO2 Mid-level temperature
5 13.32 751 0.12 CO2 Low-level temperature
6 12.62 793 0.07 water vapor Total precipitable water
7 11.99 834 0.05 water vapor Surface temp., moisture
Mid wave
8 11.04 906 0.05 window Surface temperature
9 9.72 1029 0.10 ozone Total ozone
10 7.44 1344 0.05 water vapor Low-level moisture
11 7.03 1422 0.05 water vapor Mid-level moisture
12 6.53 1531 0.10 water vapor Upper-level moisture
Short wave
13 4.58 2184 0.05 N2O Low-level temperature
14 4.53 2209 0.05 N2O Mid-level temperature
15 4.46 2241 0.05 CO2 Upper-level temperature
16 4.13 2420 0.05 CO2 Boundary-level temp.
17 3.98 2510 0.05 window Surface temperature
18 3.76 2658 0.05 window Surface temp., moisture
Visible 19 0.695 14367 - visible Cloud
19 channel Sounder, with 18 narrow spectral channels in short-wave infrared, middle infrared and long wave infrared regions and one channel in the visible region; Signals every 1-hour

Satellites for Greenhouse Gases Observation(Column observations)
Mission Country / Organization Period GHGs CommentsENVISAT / SCIAMACHY ESA 2002 -2012 CO2, CH4GOSAT Japan 2009 - CO2, CH4 FTSOCO-2 US 2014 - CO2 GratingGHGSat-D/CLAIRE GHGSat (Canada) 2016 - CO2, CH4 Fabry–Pérot TanSat China 2016 - CO2 GratingSentinel-5p / TROPOMI EC 2017 - CH4FY-3D / GAS China 2017 - CO2, CH4GF-5 / GMI China 2018 - CO2, CH4 Spatial HeterodyneGOSAT-2 Japan FY2018 - CO2, CH4 FTSISS / OCO-3 US 2019 - CO2, GratingMicroCarb France 2021 - CO2MERLIN France/ Germany 2021 - CH4 LaserGeoCARB US 2022- CO2, CH4 Geostationary, GratingGOSAT-3 Japan 2022 - ? ?Sentinel 7 (EC) 2025 - CO2 Constellation
OCO-2 (2014-)GOSAT (2009-)ENVISAT (2002-2012)
MicroCarb (2021-)GOSAT-2 (FY2018-)
GHGSat-D (2016-) TanSat (2016-) Sentinel 5p (2017-)
MERLIN (2021-)
FY-3D (2017-) GF-5 (2018-) OCO-3 (2019 -)
Almost 10-years of continuous CO2 data

Improved re-visit time to 3 days (from 6-days)
Band 1-3: 500 m, Band 4: 1500 m,
Improved resolution TANSO cloud imager
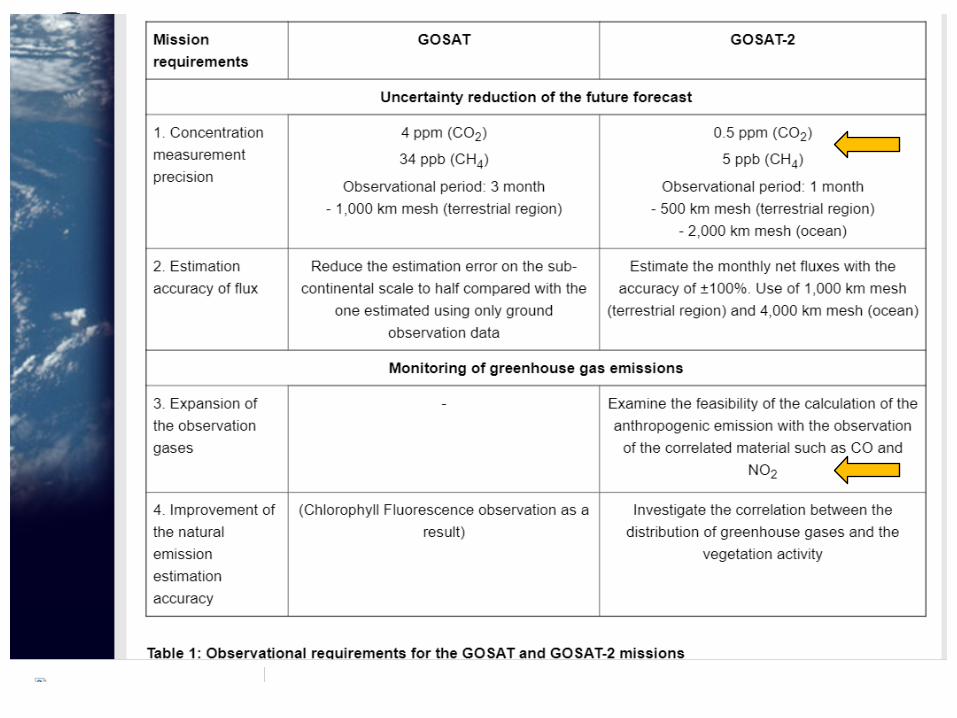
GOSAT-2


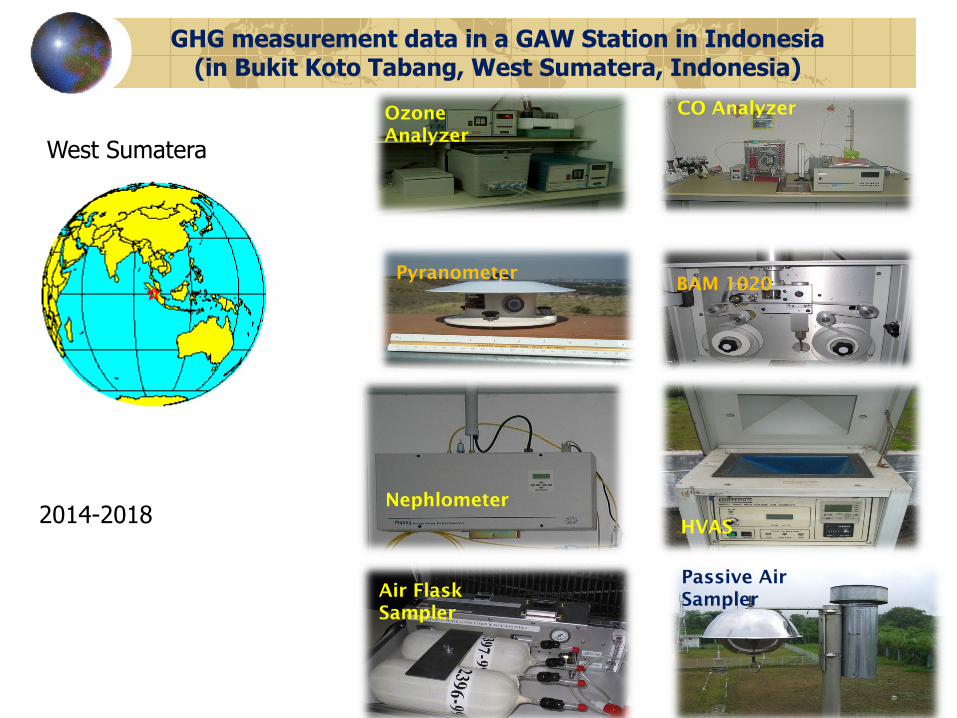
GHG measurement data in a GAW Station in Indonesia (in Bukit Koto Tabang, West Sumatera, Indonesia)
Nephlometer
HVAS
Air Flask Sampler
Passive Air Sampler
West Sumatera Ozone Analyzer
CO Analyzer
PyranometerBAM 1020
2014-2018
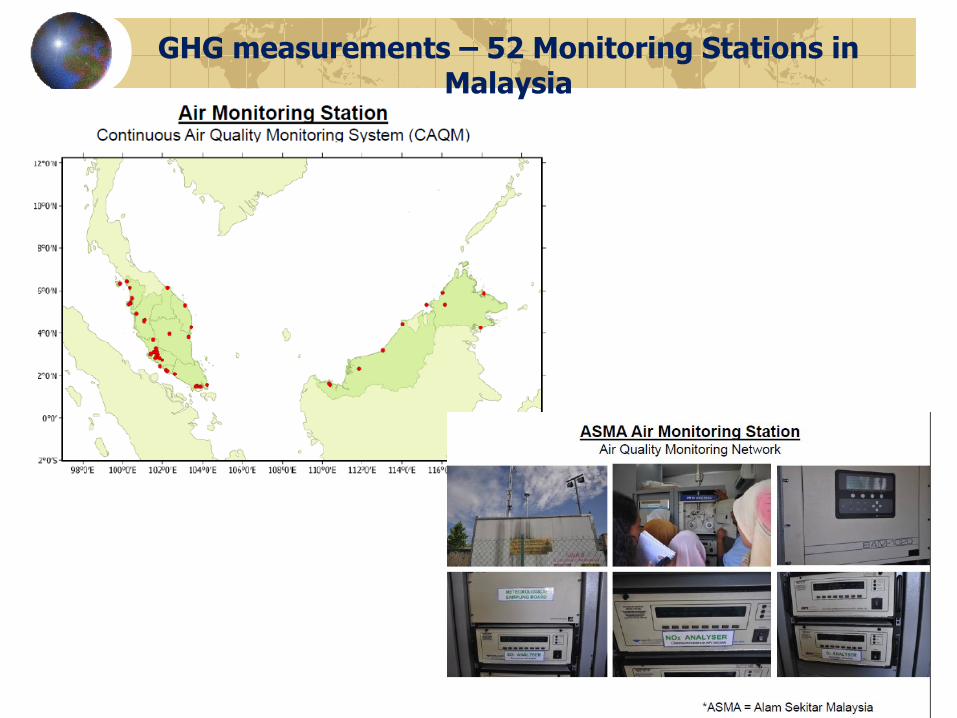
GHG measurements – 52 Monitoring Stations in Malaysia
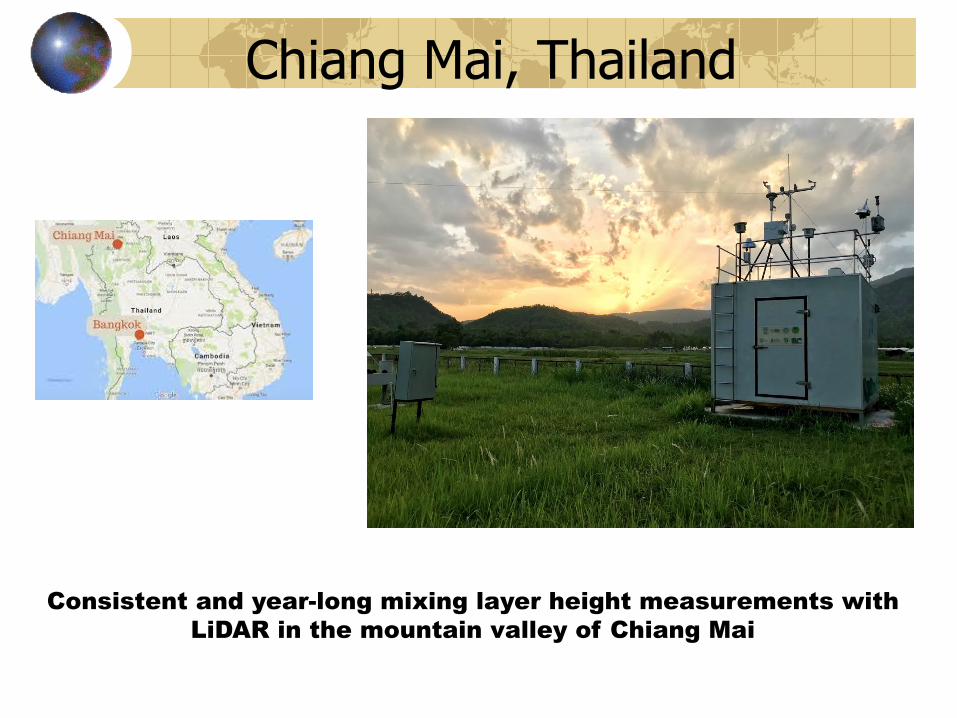
Consistent and year-long mixing layer height measurements with LiDAR in the mountain valley of Chiang Mai
Chiang Mai, Thailand

3-new stations; Dibrugarh, North East India; and Calicut, Kerala, Mandalay, Myanmar
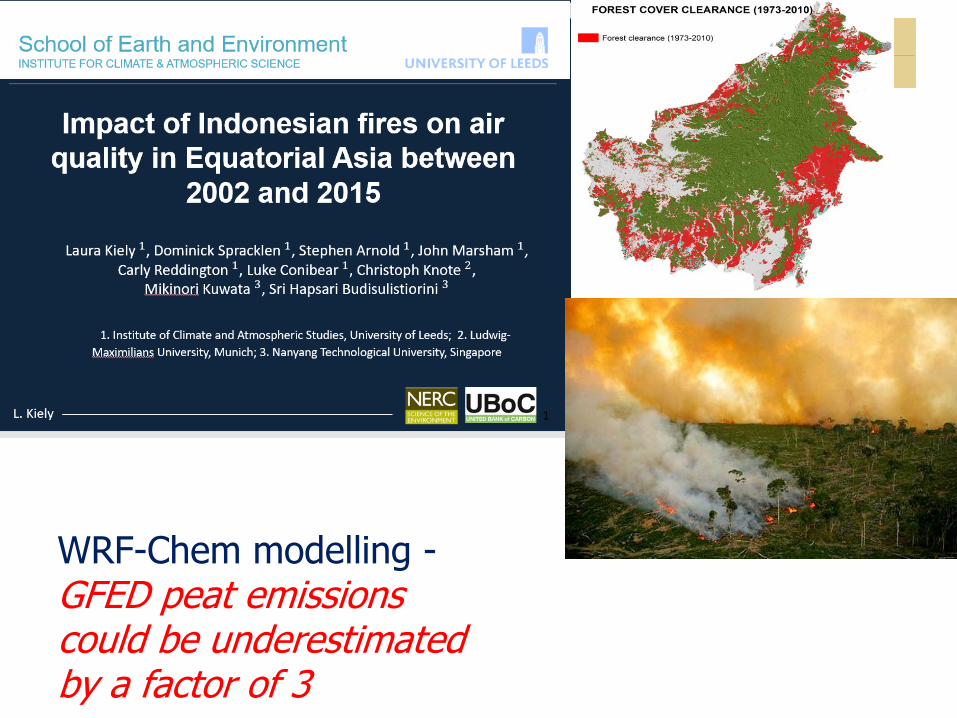
WRF-Chem modelling -GFED peat emissions could be underestimated by a factor of 3
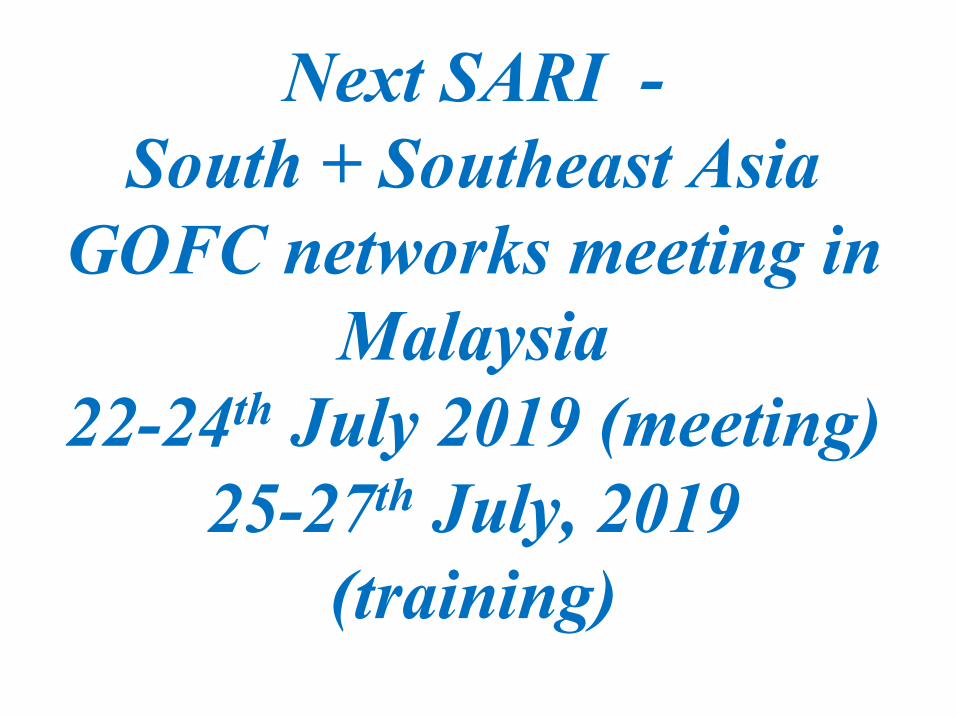
Next SARI -South + Southeast Asia
GOFC networks meeting in Malaysia
22-24th July 2019 (meeting)25-27th July, 2019
(training)