Outline - Home | GOFC GOLD
33
Outline Overview Overview Data continuity – defined Data continuity - Coarse medium and high resolution Data continuity Coarse, medium and high resolution sensors Satellite sensors useful for fire research Satellite sensors useful for fire research Discussion points
Transcript of Outline - Home | GOFC GOLD

Outline
OverviewOverview
Data continuity – defined
Data continuity - Coarse medium and high resolutionData continuity Coarse, medium and high resolution sensors
Satellite sensors useful for fire researchSatellite sensors useful for fire research
Discussion points

Data Continuity - Defined
During 1992, in US, the Congress and White House agreed to fund the
procurement of Landsat 7 The Land Remote Sensing Policy Act of 1992 (Publicprocurement of Landsat 7. The Land Remote Sensing Policy Act of 1992 (Public
Law 102-555) designated NASA and the USGS as the agencies responsible for
managing Landsat 7. A major purpose of the Act was to ensure Landsat data g g j p p
continuity.
The Act defined ‘data continuity’ as:The Act defined ‘data continuity’ as:
…the continued acquisition and availability of unenhanced data which are, from
the point of view of the user – (A) sufficiently consistent (in terms of acquisition p ( ) y ( q
geometry, coverage characteristics, and spectral characteristics) with previous
Landsat data to allow comparisons for global and regional change detection and
characterization; and (B) compatible with such data and with methods used to
receive and process such data.
Greece 2007
Greece, August 2007
• 64 casualties
• Thousands of homeless
• More than 160,000 ha burned in a few days only in the Peloponnesus
• More than 260,000 ha overall• Rapid Burn Scar Maps produced
by DLR (D) and SERTIT (F)y ( ) ( )

Greece 2009Envisat’s Medium R l ti I iResolution Imaging Spectrometer (MERIS) ( )Greece on 24 August 2009 at 09:14 UTC09:14 UTCA new large smoke plume is visible
t f Athwest of Athens, pushed southerly by strong winds. g
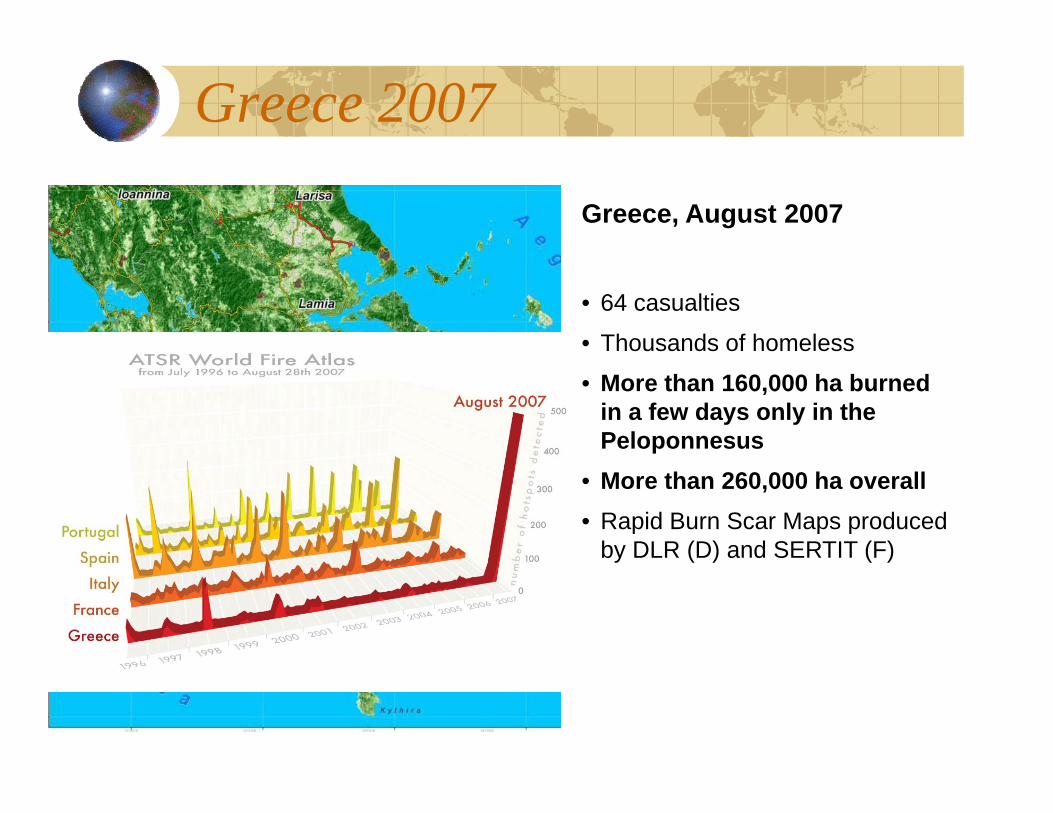
Spectral bands and Fire products
Several combinations also exist!B rn se erit (NBR)Burn severity (NBR) = NIR-MIR/NIR+MIR

Land Remote Sensing and Data 3300 km swathVIIRS
• spatial resolution, 400/800m (nadir (Vis/IR)) • global coverage, 2x/day/satellite
AVHRR/MODIS 2048 km swath
• spatial resolution, 250m, 500m, 1000m • global coverage, 2 days
MISR• spatial resolution, 275m, 550m, 1100m
360 km
• global coverage, 9 days
te R
esol
uti
on
agin
g (5
-
183 kmLandsat• spatial resolution, 15m, 30m, 60m • 16 day orbital repeat
• seasonal global coverage
ASTER 60 km
“Mod
erat
Lan
d Im
a1
20
m)”• spatial resolution 15m, 30m, 90m
~ 10 kmti l l ti < 5 l b l d d ifl b l d d if
Commercial Systems
ASTER 60 km• 45-60 day orbital repeat• global coverage, years• 45-60 day orbital repeat• global coverage, years
Palatiello, 2007
• spatial resolution < 5m • global coverage, decades, if ever• global coverage, decades, if ever
Compromise between resolution of the sensor and spatial coverage.

Land Remote Sensing and Data
1981 1993 1994 1995 1996 1997 1998 1999 2000 2001 2002 2003 2004 2005 2006 2007 2008 2009 2010 2011 2012 2020
NOAA-7, -9, -11 AVHRR(~1:30pm) Jul 1981
Sep 1994
Not RecommendedData Gap
NOAA-14 AVHRR(1:30pm at launch, 5:00pm at the end)NOAA-16 AVHRR(2:00pm)NOAA-17 AVHRR(10:00am)
Jan 1995 Sep 2001
Mar 2001
Aug 2002
Sep 2003**
Jul 2007*( )SPOT-4 VEGETATION(10:30am)SPOT-5 VEGETATION(10:30am)Terra MODIS(10:30am) Feb 2000
Apr 1998
May 2002
Sep 2009*
Dec 2002
Apr 2007*
( 0 30a )Aqua MODIS(1:30pm)NPP VIIRS(1:30pm)NPOESS VIIRS(9:30am and 1:30pm)
Jun 2002
Sep. 2011
Mar. 2014
Sep 2008*
(9:30am and 1:30pm)

THE AVHRR DATA RECORDAVHRR provides the start of the Long Term Data Record continued by
MODIS and VIIRS
Some important issues
1982-1998 SPANNED BY NOAA SATELLITES 7, 9, 11, 14.
Equatorial crossing time allowed to drift within each series, steadily increasing solar zenith q g , y gangle.
Calibration coefficients are different for each AVHRR sensor.
Aerosol variability from El Chichon 1982, Pinatubo 1991, biomass burning, dust etc., need to be considered.
Data can be affected by sub-pixel cloud contamination
Different algorithms were used for compositing: Max NDVI Compositing: FASIR: middle 9 day interval. IMMS: average both 15 day intervals.

Moderate Resolution Imaging Spectroradiometer
Terra Launch on December 18,1999Aqua Launch on May 4, 2002
MODIS Fire productsMODIS Fire products
1). Active Fires – 1-km, daily and 8 day summaries (2001-present)
2). Burnt Areas-500m global monthly (2001-present).
3). Fire Radiative Power – 1km, Daily• T(4μm) is high - absolute signal
T(4μm) T(11μm) is large spectral contrast 3). Fire Radiative Power 1km, Daily (2001-Present)• T(4μm) - T(11μm) is large -spectral contrast
• T(4μm) and/or T(4μm) - T(11μm) differ significantly from surrounding background –spatial contrasttests to minimize false detection (VIS/NIR
T4 = 22 (330k saturation 21 (500k• tests to minimize false detection (VIS/NIR
reflectance; internal cloud mask; water mask; sun-glint test etc.)
= 21 (500kT11 = 32(400k)

National Polar-Orbiting Operational Environmental Satellite SystemEnvironmental Satellite System
•1330 [VIIRS, CrIS, CERES, OMPS-N, ATMS, SARSAT, ADCS, SEM]
• Column ozone, Earth radiation and cloud observations
• 1730 [VIIRS, MIS, SARSAT, ADCS]
• Advanced cloud imagery
• 09:30 orbit by MetOp [AVHRR, IASI, GOME]
• Cloud imagery, column ozone and trace gases
Single satellite design with common sensor locations.
10NPOESS Ensures Climate Data ContinuityNPOESS Ensures Climate Data Continuity
common sensor locations.

VIIRS Overview – Launch September, 2011
PURPOSE: Global operational observations of land, ocean, & atmosphere parameters.
PREDECESSORS: AVHRR, OLS, MODIS, SeaWiFS
Instrument
• Multi-spectral crosstrack scanning instrument• p g
• Flies on every NPOESS satellite, NPP
• 23 of 55 EDRs – land, ocean, atmosphere
• 3 of 6 Key Performance Parameters
• Imagery, Sea Surface Temperature, Soil MoistureMoisture
• Imagery and radiometry
– “Fine” (imaging) 0.4 km resolution (nadir)
– “Moderate” (radiometry) 0.8 km resolution
– 12 bit quantization– 12 bit quantization
• 22 spectral bands (0.4 – 12.5 μm)
– 15 “reflective” VNIR-SWIR bands 0.4 – 2.3 μm
– 3 “mixed” MWIR bands 3.5 – 4.1 μm4 “ i i ” LWIR b d 8 4 12 5– 4 “emissive” LWIR bands 8.4 – 12.5 μm
– Automatic dual VNIR & triple DNB gains
• EDR-dependent swath widths
– 1700, 2000, and 3000 km

VIIRS Bands and Products
VIIRS Band Spectral Range (um) Nadir HSR (m) MODIS Band(s) Range HSRDNB 0.500 - 0.900
Name of Product Group Type Imagery * Imagery EDR
VIIRS 22 Bands:16 M_ Band, 5 I_Band and 1 DNB
VIIRS 24 EDRsLand, Ocean, Atmosphere, Snow
M1 0.402 - 0.422 750 8 0.405 - 0.420 1000M2 0.436 - 0.454 750 9 0.438 - 0.448 1000
M3 0.478 - 0.498 750 3 10 0.459 - 0.479 0.483 - 0.493
500 1000
M4 0.545 - 0.565 750 4 or 12 0.545 - 0.565 0.546 - 0.556
500 1000
I1 0.600 - 0.680 375 1 0.620 - 0.670 250
Precipitable Water Atmosphere EDRSuspended Matter Atmosphere EDR Aerosol Optical Thickness Aerosol EDR Aerosol Particle Size Aerosol EDR Cloud Base Height Cloud EDR Cloud Cover/Layers Cloud EDRI1 0.600 0.680 375
M5 0.662 - 0.682 750 13 or 14 0.662 - 0.672 0.673 - 0.683
1000 1000
M6 0.739 - 0.754 750 15 0.743 - 0.753 1000I2 0.846 - 0.885 375 2 0.841 - 0.876 250
M7 0.846 - 0.885 750 16 or 2 0.862 - 0.877 0.841 - 0.876
1000 250
M8 1.230 - 1.250 750 5 SAME 500
Cloud Cover/Layers Cloud EDRCloud Effective Particle Size Cloud EDR Cloud Optical Thickness/Transmittance Cloud EDR Cloud Top Height Cloud EDR Cloud Top Pressure Cloud EDR Cloud Top Temperature Cloud EDR A ti Fi L d A li tiM9 1.371 - 1.386 750 26 1.360 - 1.390 1000
I3 1.580 - 1.640 375 6 1.628 - 1.652 500M10 1.580 - 1.640 750 6 1.628 - 1.652 500M11 2.225 - 2.275 750 7 2.105 - 2.155 500
I4 3.550 - 3.930 375 20 3.660 - 3.840 1000M12 3.660 - 3.840 750 20 SAME 1000
3.929 - 3.989 1000
Active Fires Land ApplicationAlbedo (Surface) Land EDR Land Surface Temperature Land EDR Soil Moisture Land EDR Surface Type Land EDR Vegetation Index Land EDR
M13 3.973 - 4.128 750 21 or 22 3.929 3.989 3.929 - 3.989
1000 1000
M14 8.400 - 8.700 750 29 SAME 1000
M15 10.263 - 11.263 750 31 10.780 - 11.280 1000
I5 10.500 - 12.400 375 31 or 32 10.780 - 11.280 11.770 - 12.270
1000 1000
M16 11 538 - 12 488 750 32 11 770 - 12 270 1000
Sea Surface Temperature * Ocean EDR Ocean Color and Chlorophyll Ocean EDR Net Heat Flux Ocean EDR Sea Ice Characterization Snow and Ice EDR Ice Surface Temperature Snow and Ice EDR Snow Cover and Depth Snow and Ice EDRM16 11.538 - 12.488 750 32 11.770 - 12.270 1000
Dual gain band
Snow Cover and Depth Snow and Ice EDR
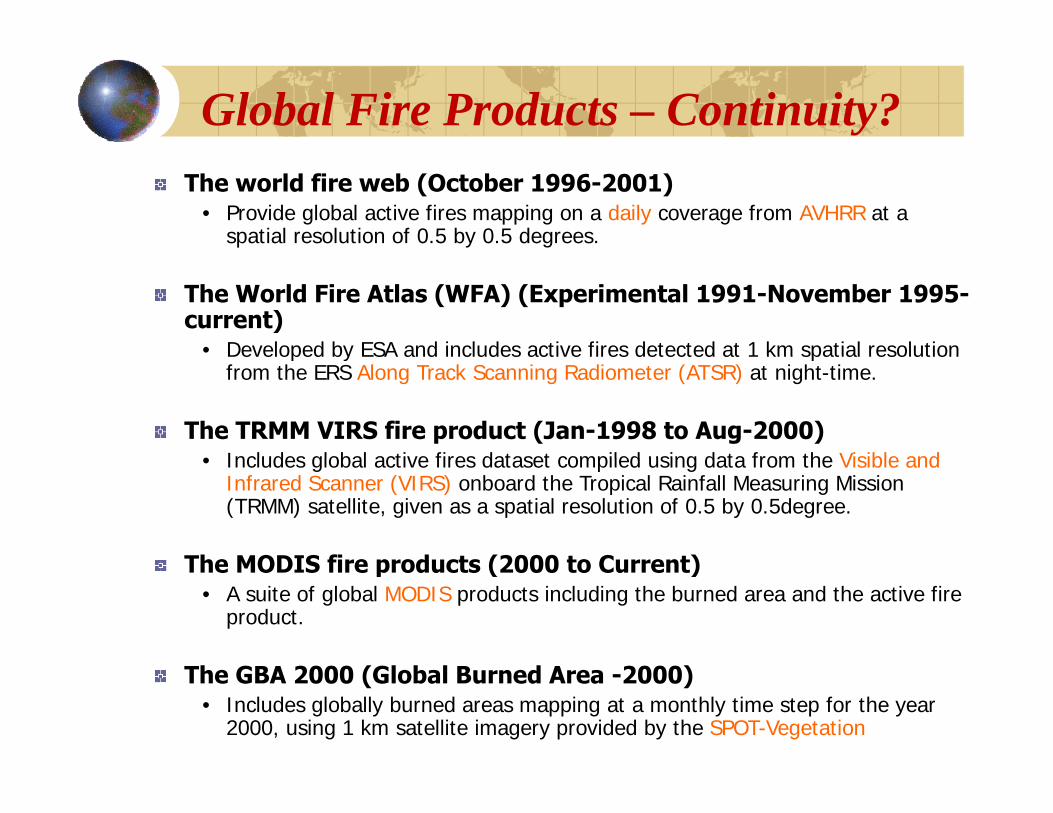
Global Fire Products – Continuity?The world fire web (October 1996-2001)
• Provide global active fires mapping on a daily coverage from AVHRR at a spatial resolution of 0.5 by 0.5 degrees.
The World Fire Atlas (WFA) (Experimental 1991-November 1995-current)
• Developed by ESA and includes active fires detected at 1 km spatial resolutionDeveloped by ESA and includes active fires detected at 1 km spatial resolution from the ERS Along Track Scanning Radiometer (ATSR) at night-time.
The TRMM VIRS fire product (Jan-1998 to Aug-2000)• Includes global active fires dataset compiled using data from the Visible and• Includes global active fires dataset compiled using data from the Visible and
Infrared Scanner (VIRS) onboard the Tropical Rainfall Measuring Mission (TRMM) satellite, given as a spatial resolution of 0.5 by 0.5degree.
The MODIS fire products (2000 to Current)The MODIS fire products (2000 to Current)• A suite of global MODIS products including the burned area and the active fire
product.
The GBA 2000 (Global Burned Area -2000)• Includes globally burned areas mapping at a monthly time step for the year
2000, using 1 km satellite imagery provided by the SPOT-Vegetation

Global Fire Products – Continuity?
GlobScar (Global Burned Area – 2000)• Globally burned areas mapping at a monthly time step for the year 2000, using
1 km satellite imagery provided by the ATSR-2 sensor1 km satellite imagery provided by the ATSR-2 sensorGlobCarbon (Global Burned Areas 1998-2007)
• Global burned areas at a monthly time step including day of detection for years 1998-2007, using 3 algorithms, fire hotspots and ATSR-2, AATSR and SPOT VegetationSPOT-Vegetation
MODIS (Global Burned Areas 2000-present)• Global inventory of burnt area from MODIS sensor
L3JRC product (Global Burnt Areas 2000-2007)• Includes a global inventory of the daily burnt area for seven fire seasons for
the years 2000 to 2007, at moderate spatial resolution (1 km2) from the SPOT Vegetation sensor
Th E i t l Wildfi ABBA Fi P d tThe Experimental Wildfire ABBA Fire Product• Includes active fires detection products for the Western Hemisphere in real
time from GOES satellite with a resolution of 30 min.
• Can we come up with an ensemble fire product

Medium-Spatial-Resolution-Sensors
Landsat – Earth Resources TechnologyLandsat Earth Resources Technology Satellite (ERTS-1)
Spot – Systeme Pour l’Observation de laSpot Systeme Pour l Observation de la Terre
IRS – Indian Remote Sensing SatelliteIRS Indian Remote Sensing SatelliteAster – Advanced Spacebourne Thermal
Emission and ReflectionEmission and Reflection Radiometer

36+ Years of Continuous 36+ Years of Continuous LandsatLandsat Global ObservationGlobal Observation
Landsat 1 was launched July 23, 1972 (MSS)Landsat 2 was launched January 22, 1975 (MSS)Landsat 3 was launched March 5, 1978 (MSS)Landsat 3 was launched March 5, 1978 (MSS)Landsat 4 was launched July 16, 1982 (TM)Landsat 5 was launched March 1, 1984 (TM)Landsat 6 was launched October 5, 1993, but never reached orbitLandsat 7 was launched April 15, 1999, May 2003 SLC-Off (ETM+)Landsat 8 is scheduled for launch in December 2012
http://landsat.usgs.gov
Landsat Data Continuity Mission

Landsat…36 yrs of dataLandsat 5 – 25 years since launch (March 1, 1984)
TM - functioning normally No on board data recordersNo on-board data recorders
Landsat 7 – nearly 5 years beyond design life1999 LaunchETM+ - Scan Line Corrector FailureETM Scan Line Corrector Failure Robust global acquisitions.Both Landsat-5 and 7 satellites have enough fuel to operate till 2012.EROS data center is providing Gap-Filled data at nominal price.
D t f 36 il bl t N C t(Mid D d l Gl b l L d S P j t)Data of 36-years available at No-Cost(Mid Decadal Global Land Survey Project). GeoTIFF formatOrthorectified “GIS-ready”Calibrated across missions and instrumentsGlobal datasets for 2005 already available. 2010 in progress
Landsat data are accessible from:Landsat data are accessible from:GloVis (glovis.usgs.gov) Earth Explorer (earthexplorer.usgs.gov)
Gutman et al., PERS, 2005, 74, 6-10.

Data gaps and possible sources
Landsat quality data gap is increasing Earliest launch date of the LDCM (2012). No mechanism finalized yet for acquisition or purchase of data from international assets However MOUacquisition or purchase of data from international assets. However MOU between UMD and ISRO (NRSC) that is already established can aid in filling such gap (Thanks to Chris and Badarinath).
USGS LandsatLandsat Data Gap Readiness PlanData Gap Readiness PlanDefine a set of options and capabilities to acquire Landsat-like data in the event of the loss of Landsat 5 and/or Landsat 7.
USGS

Landsat data continuity and gap fillers
KEY:meets spec OK
does not meet spec Xneed more information ?need more information ?
1999
2000
2001
2002
2003
2004
2005
2006
2007
2008
2009
2010
2011
2012
2013
Annual Global
Coverage
Spatial Resolution
Spectral
Coverage
Data Q
uality*
ResourceSat-1 OK OK OK ?ResourceSat-,2 OK OK OK ?CBERS 2 ? OK OK ?CBERS 2A ? OK OK ?CBERS 3 ? OK OK ?? OK OK ?CBERS 4 ? OK OK ?RapidEye 1,2,3,4,5 ? OK X ?Terra/ASTER X OK OK OKEO-1/ ALI X OK OK OKSPOT 4 ? OK OK OKSPOT 5 ? OK OK OKALOS ? OK X ?DMC Algeria X OK X ?DMC Nigeria ? OK X ?DMC UK ? OK X ?DMC China X OK X ?
*Data quality is acceptable if verified to meet acceptable specifications for radiometric and geographic accuracy, band-to-band registration as well as global coverage (USGS).

Resourcesat and SPOT
India’s ResourceSat-1 Launched 10/03
High Resolution Linear Imaging Self-High Resolution Linear Imaging SelfScanner (LISS-IV) – 5.8m VNIR SWIRMedium Resolution Linear Imaging Self-Scanner (LISS-III) - 23m - VNIR SWIRAdvanced Wide Field Sensor (AWiFS) -56m
VNIR SWIR– VNIR SWIRFollow-on planned
China-Brazil CBERS launched 10/03
High resolution CCD camera-20m VNIRInfrared Multispectral Scanner-80m SWIR, 160 TIR160m TIRWide field Imager – 260m VNIRFollow-on Planned
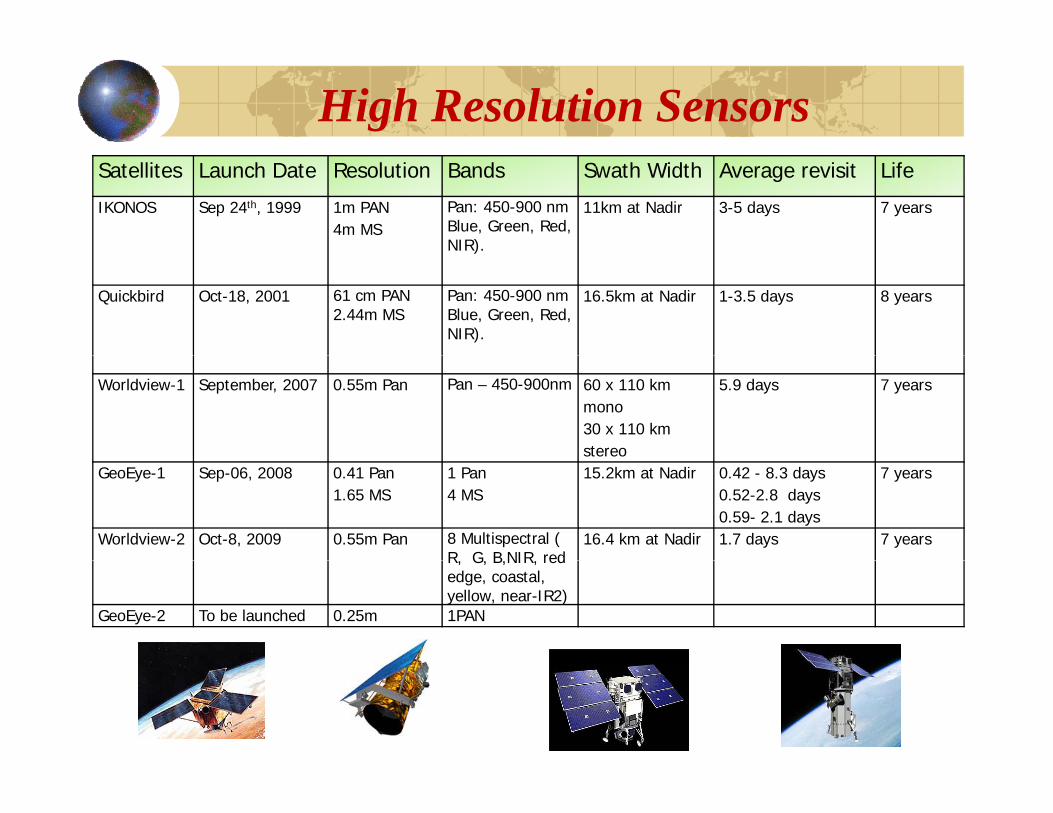
High Resolution Sensors Satellites Launch Date Resolution Bands Swath Width Average revisit Life
IKONOS Sep 24th, 1999 1m PAN4m MS
Pan: 450-900 nmBlue, Green, Red, NIR).
11km at Nadir 3-5 days 7 years
)
Quickbird Oct-18, 2001 61 cm PAN 2.44m MS
Pan: 450-900 nmBlue, Green, Red, NIR).
16.5km at Nadir 1-3.5 days 8 years
Worldview-1 September, 2007 0.55m Pan Pan – 450-900nm 60 x 110 km mono30 x 110 km stereo
5.9 days 7 years
GeoEye-1 Sep-06, 2008 0.41 Pan1.65 MS
1 Pan4 MS
15.2km at Nadir 0.42 - 8.3 days0.52-2.8 days0.59- 2.1 days
7 years
Worldview-2 Oct-8, 2009 0.55m Pan 8 Multispectral ( R G B NIR red
16.4 km at Nadir 1.7 days 7 yearsR, G, B,NIR, red edge, coastal, yellow, near-IR2)
GeoEye-2 To be launched 0.25m 1PAN

IRS data and continuity
IRS-1A IRS-1B IRS-P2 IRS-1C IRS-P3 IRS-1D IRS-P4 IRS-P6 IRS-P6
19881989198919901991 1991
1992 1993 1993 1994 1994 1995 1995 1995
1996 1996 1996 19961997 1997 1997 19971998 1998 1998 19981999 1999 1999 1999 19992000 2000 2000 2000 20002001 2001 2001 2001 2001
2002 2002 2002 20022003 2003 2003 2003 20032004 2004 2004 20042005 2005 2005 2005 20052006 2006 2006 2006 20062007 2007 2007 2007 2007
200820092010

INPE-Brazil-China Collaboration– CBERS
2016
2014
2015
2017
2019
2013
2012
2011
2010
2018
2 020
CBERS‐5CBERS‐4CBERS‐3 CBERS‐6CBERS‐SAR
CBERS 1CBERS-1September 1999 – March 2003CBERS-2
October 2003 – March 2009CBERS-2B
Launched in September, 2007Launched in September, 2007CBERS-3
Scheduled for June, 2011CBERS-4
Scheduled for September, 2014

Satellite Data Continuity Europe
Instrument 1991 1992 1993 1994 1995 1996 1997 1998 1999 2000 2001 2002 2003 2004 2005 2006 2007 2008 2009 2010 2011 2012 2013 2014 2015ATSR, C-SARATSR, C SAR
ATSR-2, C-SARAATSR, MERIS, ASAR
VEGETATION-3C-SAR
OLCI, SLSTRVEGETATION
VEGETATION-2AVHRR-3
AVHRR, -2, -3MODISMODISMODISVIIRS
GCOS Objectives Current Status• Accuracy: 5% error in omission/commission Unknown, high regional variationAccuracy: 5% error in omission/commission Unknown, high regional variation• Spatial resolution: 250m 1 km• Temporal resolution: daily monthly with Day of Detection• Stability: 5% Unknown, high regional variation
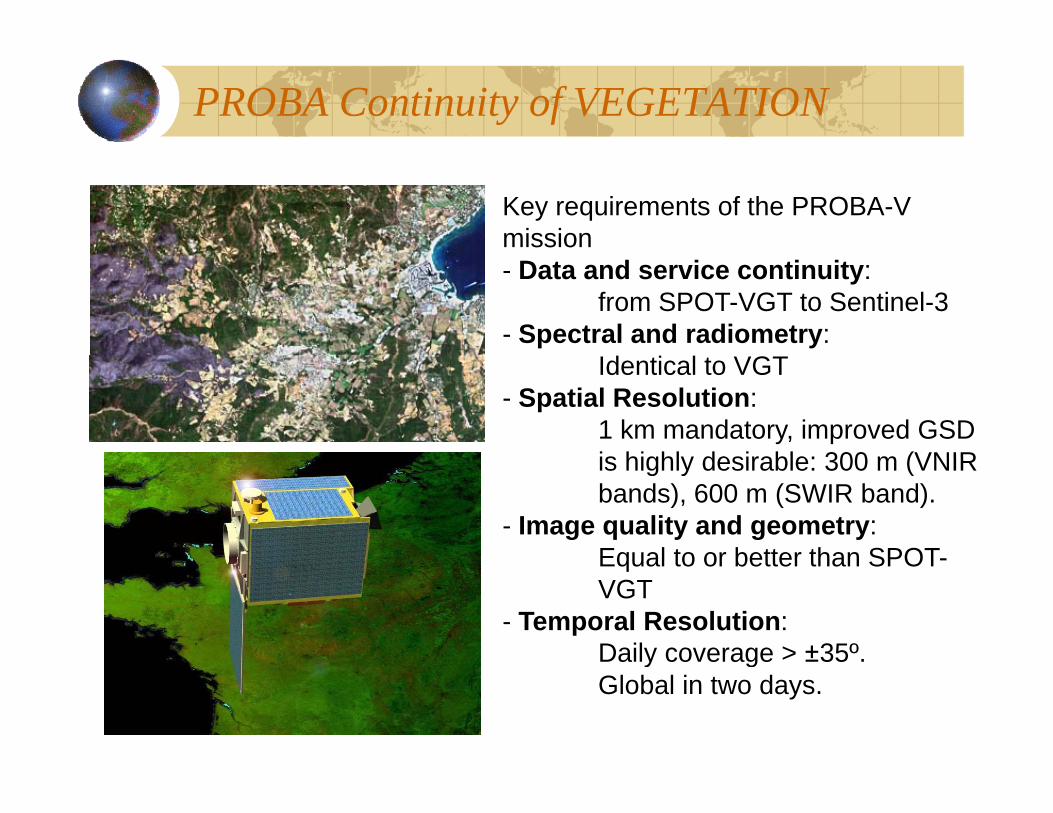
PROBA Continuity of VEGETATION
Key requirements of the PROBA-V mission- Data and service continuity:
from SPOT-VGT to Sentinel-3 - Spectral and radiometry:
GIdentical to VGT - Spatial Resolution:
1 km mandatory, improved GSD is highly desirable: 300 m (VNIRis highly desirable: 300 m (VNIR bands), 600 m (SWIR band).
- Image quality and geometry: Equal to or better than SPOT-Equal to or better than SPOT-VGT
- Temporal Resolution:Daily coverage > ±35º. y gGlobal in two days.

Sentinel-1 Continuity of SAR
Envisaged first launch in 2012 and followed by the second satellite a few years later.
Coverage over Europe and Canada in less than two days.
Radar data delivery: 1 hour of acquisition

Sentinel-2 Continuity of SPOT
First launch in 2013. Multi-Spectral Imager (MSI) with a swath of 290 km. 13 spectral bands (VNIR to SWIR)4 spectral bands at 10m 6 bands at 20m 4 spectral bands at 10m, 6 bands at 20m and 3 bands at 60m spatial resolution. All land surfaces every 5 days under cloud-free conditions

Sentinel–3 Continuity for MERIS/AATSR
The first launch in 2013, followed by a second to provide maximum coverageto provide maximum coverage.Global coverage in 2 days. Improved Swath and dedicated Fire detection (FRP, Day/Night Fire and BA)

Discussion – Dr. Plummer

Data Continuity – Discussion Points
Sensors/PlatformsA. Calibration
D t f t llit d t t l ti iData from satellite sensors used to create a long time series data should be well-characterized, stable, and inter-calibrated. Fine words but reality?
B ErrorB. ErrorError traceability and detection capability needs fundamental
consideration. Is this ever actually done?Q lit d l ti t i t t bilit d t lQuality needs relating to instrument ability and temporal extension of product availability. Ever assessed?
C. Horses for coursesI t t l d p d d fi i p i l h tInstrument value depends on defining precisely what you are aiming to measure in relation to subsequent use? GCOS –should be climate but is it? These also not appropriate for Civil ProtectionCivil Protection.
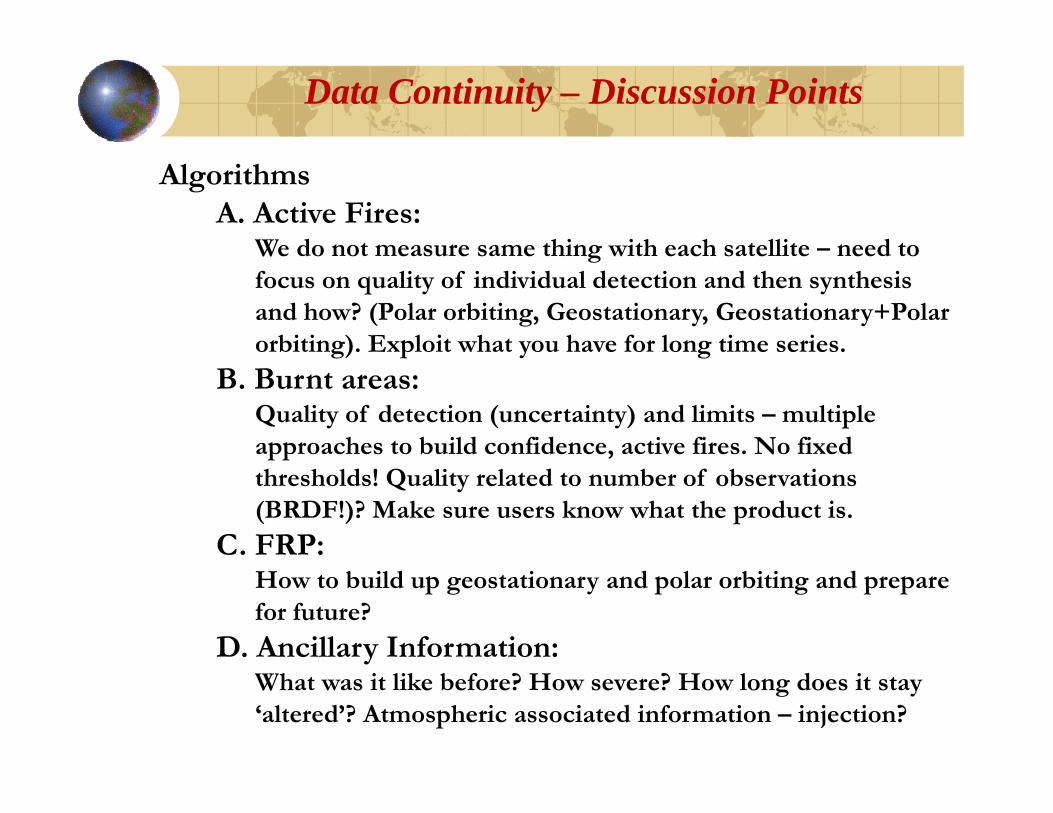
Data Continuity – Discussion Points
AlgorithmsA. Active Fires:
We do not measure same thing with each satellite – need toWe do not measure same thing with each satellite need to focus on quality of individual detection and then synthesis and how? (Polar orbiting, Geostationary, Geostationary+Polar orbiting). Exploit what you have for long time series.g) p y g
B. Burnt areas: Quality of detection (uncertainty) and limits – multiple approaches to build confidence, active fires. No fixed pp ,thresholds! Quality related to number of observations (BRDF!)? Make sure users know what the product is.
C. FRP: How to build up geostationary and polar orbiting and prepare for future?
D. Ancillary Information:yWhat was it like before? How severe? How long does it stay ‘altered’? Atmospheric associated information – injection?

Data Continuity – Discussion Points
Fire Products, Calibration and Validation protocols
A Several fire products availableA. Several fire products available. Once we have a protocol – for what it is appropriate? Do we need an all-encompassing calibration and validation protocol?protocol?Can we address spatio-temporal variability in fires in diverse ecosystems?How do we report error?p
B. Protocols require application.Free and fair and independent? Representative (temporal and spatial)p ( p p )
C. Protocols require data.Do GOFC or CEOS actually provide this and how is it made
available? How if no money!! Who is responsible foravailable? ow if no oney!! Who is esponsible fo providing it? Who for processing??

GOFC/CEOS Initiatives
A. Evaluate fire product accuracy over similar study area / years (Global Product Inter-comparison exercise for b t ) R d bi h d t tburnt area). Round-robin approach – data sets standardised.
B. Active fire synthesis – can we put together ‘the time series’ and start filling in the diurnal behaviour?