Globefish Commodity Update. May 2014 - Tuna · Tuna COMMODITY update The COMMODITY UPDATE reports,...
69
Tuna Extract from GLOBEFISH Databank Prices - Exports - Imports - Production - Processing May 2014 COMMODITY UPDATE
Transcript of Globefish Commodity Update. May 2014 - Tuna · Tuna COMMODITY update The COMMODITY UPDATE reports,...
Tuna
Extract from GLOBEFISH Databank Prices - Exports - Imports - Production - Processing
May 2014
CommodiTy UpdaTe
Food and Agriculture Organization of the United NationsProducts, Trade and Marketing Service
Viale delle Terme di Caracalla00153 Rome, Italy
Contact: [email protected]

Tuna
COMMODITY
update
The COMMODITY UPDATE reports, issued for each commodity once a year, contain
information on prices, imports, exports and production by commodity. The information is taken
form the network of GLOBEFISH correspondents and the GLOBEFISH European Price Report,
INFOFISH Trade News, FAO FISHDAB, EUROSTAT and others.
The issues are scheduled approximately as follows:
FISHMEAL - FISH OIL –Spring CRAB - Autumn
BIVALVES - Spring LOBSTER - Autumn SALMON - Spring CEPHALOPODS - Winter FRESHWATER FISH - Spring GROUNDFISH - Winter
SHRIMP - Summer SMALL PELAGICS - Winter TUNA - Summer
For single issues For an annual subscription to please contact the complete set please contact
GLOBEFISH EUROFISH
Vial.e delle Terme di Caracalla . H.C. Andersens Blvd. 44-4600153 Rome . 1553 Copenhagen V
ITALY Denmark
Tel: ++39 0657054163 . Tel.: ++45 33377755Fax: ++39 0657053020 . Fax: ++45 33377756
E - mail: [email protected] . E - mail: [email protected]
Web si.te: www.gl.obefi.sh.org . Web site: www. eurofish.dk
Al l ri g hts re s e rve d. No part of FAO/GLOBEFISH COMMODITY UPDATE may be reproduced, stored in a retrieval system, or
transmitted in any form or by any means (electronic, mechanical, photocopying or otherwise), without the prior permission of FAO.
Requests for use of this material (including purpose and extent) should be addressed to the Director, Publications Division, Food
and Agriculture Organization of the United Nations, Viale delle Terme di Caracalla, 00153 Rome, Italy.
Prepared by Paola Sabatini and Turan Rahimzadeh

REPORTS
Tuna Market Report 1
PRICES
Raw Material
Monthly tuna prices - Spanish Canneries, in EUR/kg 7
Monthly tuna prices - Indian/Atlantic Ocean, in EUR/kg 8
Monthly ex-vessel frozen skipjack prices (1.8 kg/pc and up) in Abidjan/Dakar/Tema, in USD/tonne 9
Monthly CFR frozen skipjack prices in Thailand (4 lb/pc and up), in USD/tonne 10
Monthly auction prices of frozen skipjack in Japan, origin Southwestern Pacific, in USD/tonne 11
Canned Tuna
Monthly canned tuna in brine prices into USA, lightmeat, 48x6 oz, origin Thailand, in USD/carton 12
Sashimi tuna
Monthly auction prices of fresh bigeye tuna in Japan, origin Indonesia, in yen/kg 14
Monthly auction prices of Southern bluefin tuna in Japan, origin Australia, in yen/kg 16
Monthly prices of farmed bluefin tuna Japan, origin Spain, in yen/kg 17
Monthly tuna loins prices in Europe, origin: Latin America in USD/kg 18
Monthly tuna prices - Pacific Ocean, in USD/kg 18
IMPORTS
Raw Material
Yearly world imports of fresh and frozen tuna into major importing countries in USD million 19
Yearly world imports of fresh and frozen tuna into major importing countries, in 1 000 tonnes 21
Yearly EU imports of tuna loins, by major supplying countries, in 1 000 tonnes 23
Yearly EU imports of tuna loins, by major supplying countries, in Euro million 24
Yearly tuna loins imports into Italy, by origin countries, in 1 000 tonnes 25
TABLE OF CONTENTS

Yearly tuna loins imports into Spain, by origin countries, in 1 000 tonnes 25
Yearly imports of fresh and frozen tuna in Japan, by species, in 1 000 tonnes 26
Yearly imports of tuna loins into USA, in 1 000 tonnes 27
Yearly imports of frozen tuna into USA, in 1 000 tonnes 27
Imports of fresh tuna into the USA by countries of origin, in 1 000 tonnes 28
Canned Tuna
Yearly world imports of canned tuna into major importing countries in 1 000 tonnes 29
Yearly world imports of canned tuna into major importing countries, in USD million 31
Total EU imports of prepared and preserved tuna – by country of origin, in 1 000 tonnes 33
Total EU import of prepared and preserved tuna – by country of origin, in Euro million 34
Belgian canned tuna imports in 1 000 tonnes 35
Canned tuna imports into Italy, by origin countries, in 1 000 tonnes 36
U.S. supply of canned tuna (canned weight) 37
Canned tuna imports into Germany, in 1 000 tonnes 38
Yearly canned tuna imports into UK, by countries of origin, in 1 000 tonnes 39
Yearly quota and cumulative imports of canned tuna not in oil to USA, in 1 000 lbs 40
Yearly imports, tuna pouches USA, in 1 000 tonnes 41
Yearly imports of canned tuna into France, in 1 000 tonnes 41
Yearly imports of canned tuna into the Netherlands by countries of origin, in 1 000 tonnes 42
EXPORTS
Raw Material
Yearly world exports of fresh and frozen tuna by major exporting countries, in USD million 43
Yearly world exports of fresh and frozen tuna by major exporting countries, in 1 000 tonnes 45
Canned Tuna Yearly world exports of canned tuna by major exporting countries, in USD million 47
Yearly world exports of canned tuna by major exporting countries, in 1 000 tonnes 50
Total EU exports of prepared and preserved tuna – by country of destination, in 1000 tonnes 52
Total EU export of prepared and preserved tuna – by country of destination, in Euro 53

Spanish canned tuna exports, in 1 000 tonnes 54
Italian canned tuna exports, in 1 000 tonnes 55
Total Thai exports of prepared and preserved tuna – by country of destination, in 1 000 tonnes 56
PRODUCTION
Yearly world tuna production, by species, in 1 000 tonnes 57
Tuna production by fishing area, in 1 000 tonnes 58
Yearly tuna production by major producing countries, in 1 000 tonnes 59
PROCESSING
Yearly world production of canned tuna by major producing countries, in 1 000 tonnes 62

TUNA MARKET REPORT
Worldwide demand for canned and non-canned tuna remained low during the first quarter of 2014 and prices were under pressure
Frozen skipjack price is nearly 50% lower this April compared with the same month last year. But demand from Asian canners remains weak due to high inventories, particularly in Thailand. Imports take place only to meet short-term needs, while tuna packers are anxious to clear their expensive stocks. In the sashimi tuna market, demand is weak and seasonal in the largest market, Japan. The USA is now the second largest importer of non-canned tuna after Japan.
Overview: Supply and prices in early 2014
As of March 2014, catches in the Western and Central Pacific were moderate as the weather conditions were not conducive for fishing. In the Indian Ocean, there has been a drop in catches, with vessels mostly targeting skipjack on FADs. In the African side of the Atlantic Ocean, catches did not improve.
The delivery price for frozen skipjack to Bangkok in early April 2014 remained weak at USD 1200–1250 per tonne, with these prices almost 50% lower compared with the same time last year, leading to high inventory for Thai tuna packers. Ex-vessel prices for skipjack in Manta dropped to USD 1 400 per tonne. Likewise, the skipjack price has fallen slightly to EUR 775 per tonne FOB Mahe. In Abidjan, ex-vessel price of skipjack also declined to EUR 1 000 per tonne during the reporting period.
Due to low supply, the yellowfin price has increased to EUR 1 800 per tonne FOB Mahe in April 2014. European canners imported cooked, double-cleaned yellowfin loins at USD 8 200 per tonne, DDP Italy.
For sashimi, supplies of longline caught frozen tuna in Japan increased in January when the Taiwan Province of China and Chinese tuna boats landed their catch in
the market before the Lunar New Year holiday. In early 2014, price of frozen bigeye tuna had weakened in the Japanese auction market but improved in April during the Spring Festival.
For farmed bluefin tuna, supplies from the Mediterranean Sea, Mexico and Japan have increased so far in 2014. Similarly, the Southern bluefin fisheries in Australia wrapped up the season with good harvests; 2014 supplies are expected to be higher than compared with other years.
Non-canned market (fresh and frozen)
Japan
Affected by the weak yen and rising prices of imported seafood, Japan’s overall seafood imports declined by 6.4% in quantity and 4.4% in value in 2013 compared with 2012. One of the main drivers behind this decline was the record low imports of both fresh and frozen tuna.
On a year-on-year comparison, imports of total tuna, fresh and frozen (including loins), were 8.62% lower in 2013 at 225 873 tonnes. Although frozen loin imports did increase marginally, supplies of whole dressed tuna were at a ten year low. Other than bluefin, imports of all types of fresh/chilled tuna were at a record low in 2013, leading to an 11% decline in total fresh/chilled tuna imports in 2013 compared with the previous year.
Taking a longer-term perspective demonstrates that this is a continuing trend; from 2004 to 2013, Japan has seen a 52% decline in fresh tuna imports, a clear sign of an overall shrinking demand in the sashimi market. This weakening demand is due in large part to changing preferences of younger Japanese consumers. In addition, salmon has emerged as a strong competitor in both the sashimi and non-sashimi market.
For frozen tuna imports, 2013 also saw declining overall imports (-11.5%) compared with 2012. Again,
Skipjack tuna50%
Yellowfin tuna24%
Bigeye tuna8%
Albacore5%
Atlantic bluefin tuna0%
Pacific bluefin tuna1%
Others12%
Tuna production by species (2012)
1

if looking at the larger picture this decline is more significant; when comparing 2013 with 2004, frozen tuna imports were 51% less by value.
For red meat quality frozen tuna loins, Japanese imports weakened marginally in 2013 compared with 2012 but remained higher than in previous years. Although supplies increased from the Republic of Korea, China and Viet Nam, reduced exports from Fiji and Indonesia caused an overall negative trend for imports. For bluefin frozen loins, imports in 2013 increased by over 3 000 tonnes compared with 2012, indicating the Japanese market’s preference for frozen loins compared with air-flown fresh/chilled tuna.
Since late February 2014, heavy snowfall affected local and imported supplies of fresh tuna in the Japanese sashimi market. Furthermore, consumer demand during this time shifted to warm dishes, reducing sales of sashimi tuna in the restaurant and retail sectors. In the frozen sashimi tuna market, lower sales were observed for the popular red meat tuna (bigeye and yellowfin) during the year-end festival season in 2013. This was a result of increased availability of bluefin tuna, as prices were significantly lower than compared with other years.
Coldstorage holdingsTuna: Japan
Source: INFOFISH Trade News
USA
Demand for fresh tuna in the US market remained steady in 2013, though overall fresh imports experienced a drop of 14.8% in 2013 compared with 2012. Consumer preference for fresh red meat tuna, namely yellowfin and bigeye, remained high. Though imports of yellowfin increased only marginally, imports of bigeye increased by 33.3% in 2013 compared with 2012. Imports of bluefin tuna increased by 20%. Overall, with nearly 22 000 tonnes of fresh tuna imported in 2013, US imports came close to the volume imported by the world’s largest sashimi market, Japan, which imported 27 191 tonnes of fresh tuna in 2013. This makes the US non-canned tuna market come in second in imports only after Japan. Interestingly, most of the red meat tuna imported into the USA enters the `tuna steak’ market segment.
US imports of raw frozen tuna loin meant for non-canning uses declined by 9% to 18 384 in 2013, due to reduced catches in the Indian Ocean and Western Pacific. Supplies increased only from Indonesia and Viet Nam, which mostly supplied treated products. Consumer
ImportsFrozen tuna: Japan
2008 2009 2010 2011 2012 2013(1 000 tonnes)
Bigeye 77.8 77.1 73.4 62.1 79.1 72.7
Yellowfin 47.4 44.1 50.1 47.8 48.0 36.5
Albacore 8.0 8.5 23.2 18.0 15.2 22.1
Skipjack 33.5 53.3 86.6 42.2 30 21.2
S. bluefin 7.4 6.9 6.8 7.4 7.4 8.6
N. Bluefin 4.2 4.0 1.8 3.2 0.4 0.5
Total 178.3 193.8 215.3 180.8 182.2 161.6Source: INFOFISH
ImportsFresh/chilled tuna: Japan
2008 2009 2010 2011 2012 2013(1 000 tonnes)
Yellowfin 15.5 15.5 16.1 13.6 12.2 9.9
Bigeye 15.0 15.2 11.6 12.1 13.3 11.3
Bluefin 4.4 5.8 4.0 2.6 3.4 4.0
S. bluefin 1.2 3.4 2.1 1.2 1.5 1.8
Albacore 0.3 0.3 0.3 0.2 0.2 0.2
Skipjack 0.0 0.0 0.0 0.0 0.0 0.0
Total 36.3 40.2 34.1 29.8 30.6 27.2Source: INFOFISH
Yellowfin
Bigeye
Albacore
Skipjack
Others
0
20
40
60
80
100
120
2002 2003 2004 2005 2006 2007 2008 2009 2010 2011 2012 2013 2014
1000 tonnes
ImportsFresh Tuna: USA
2008 2009 2010 2011 2012 2013(1 000 tonnes)
Yellowfin 15.9 14.2 16.0 16.9 15.8 16.0
Bigeye 5.5 5.5 4.0 4.5 3.0 4.0
Albacore 0.7 0.7 0.5 0.7 0.7 0.9
Bluefin 0.4 0.4 0.5 1.2 0.5 0.6
Skipjack 0.0 0.0 0.0 0.0 0.0 0.0
Others 0.2 0.0 0.3 0.4 5.7 0.4
Total 22.7 20.8 21.3 23.7 25.7 21.9Source: NMFS
2

as the number one supplier of both canned and pouch tuna.
To drive growth, major packers have been launching innovative products to expand their product line and penetrate new market segments. For instance, targeting the younger consumer demographic, Bumble Bee Foods launched its new ‘Heritage Pack’, a premium-quality product which emphasizes healthy and simple eating with minimal ingredients, only solid white albacore or yellowfin tuna, spring water and a pinch of salt (priced at USD 3.18 per 7-oz can). Smaller companies, such as the American Tuna brand, seek to differentiate itself by focusing on sustainable fishing practices and high quality.
In recent news, the WTO has agreed to Mexico’s request to set up a panel in a renewed attempt to settle a dispute with the USA over American “dolphin safe” labels.
Europe
The European canned tuna market improved in 2013 as a result of growing demand. In addition, packers have been more aggressive in promoting new, convenient and sustainable products. Strong commitment from major retailers and packers has resulted in improved demand for pole and line, FAD free caught tuna as well as other certified canned tuna products.
demand remained stable, with the average import price varying between USD 10.40 (Sri Lanka) to USD 12.50 (Philippines) per kg. Imports from Japan consisted of the high value frozen bluefin loins for which the average import price was more than USD 28 per kg.
In the canning market, imports of cooked frozen loins for canning purposes were 5.3% higher in 2013 than compared with 2012.
China
International trade of frozen tuna in China has increased significantly over the years and according to national data, exports in 2013 grew by nearly 41%. Skipjack was the main species in both export and imports. At the same time, more than 80 000 tonnes of frozen tuna were imported into the Chinese market in 2013, which is a 29% increase compared with 2012. The majority of these imports were re-processed into cooked loins, for which the major clients were canned tuna producers in the USA, Thailand and in the EU. In 2013, China exported over 73 000 tonnes of processed tuna (cooked loins and canned products tuna) to the global market.
Canned tuna
USA
The US market for canned tuna continued to be stagnant despite early optimism that the market would revive due to increasing consumer confidence and declining prices. Demand for traditional canned tuna in brine remained flat while demand for pouched tuna increased thanks to the introduction of various new and convenient products on the market. These trends were mirrored in the total US imports of canned tuna in 2013; while canned tuna imports declined by 3.6%, imports of tuna in pouches increased by 6.6% when compared with 2012. Ecuador took advantage of the demand situation in 2013, supplying 17.6% more tuna in pouches to the US market. Nevertheless, Thailand maintained its position
ImportsTuna loins (cooked): USA
2008 2009 2010 2011 2012 2013(1 000 tonnes)
Thailand 14.9 10.1 26.8 24.7 20.1 22.1
Fiji 10.7 12.7 14.9 4.6 10.3 11.6
Mauritius 5.4 9.3 4.9 8.6 5.8 7.5
China 0.3 0.0 0.0 6.2 10.9 4.3
Ecuador 0.9 0.1 0.1 0.9 2.7 0.7
Others 13.0 16.5 18.1 16.5 16.5 23.6
Total 45.2 48.7 64.8 61.5 66.3 69.8Source: NFMS
ImportsTuna pouches: USA
2008 2009 2010 2011 2012 2013(1 000 tonnes)
Thailand 19.3 22.0 21.7 18.9 20.0 19.3
Ecuador 13.5 11.3 13.3 12.2 13.0 15.3
Others 5.9 5.2 6.1 5.5 3.3 4.1
Total 38.7 38.5 41.1 36.6 36.3 38.7Source: NFMS
ImportsCanned tuna (excl. pouches): USA
2008 2009 2010 2011 2012 2013(1 000 tonnes)
Thailand 64.7 78.8 96.6 83.2 62.9 64.1
Viet Nam 14.6 13.1 17.7 19.2 19.2 18.2
Philippines 25.9 25.0 18.5 21.5 18.5 16.7
China 5.2 6.0 5.9 6.7 7.0 8.6
Indonesia 13.5 13.1 12.9 9.5 8.4 7.6
Ecuador 0.7 1.6 3.6 6.6 2.4 1.1
Others 8.1 4.4 4.1 3.9 5.8 3.4
Total 132.7 142.0 159.3 150.6 124.2 119.7Source: NFMS
3

International trade developments
Reports demonstrate that some major canned tuna producing countries, such as Thailand, the Philippines and Ecuador, have been trying to gain better access to the EU markets. While Ecuador has successfully extended its GSP status with their 0% duty for canned tuna entering the EU continuing until the end of 2014, Thailand and the Philippines will need to continue to wait. The vote on the proposed trade agreement between the EU and Thailand was postponed and at the latest meeting in February 2014, no conclusion on whether Thai canned tuna will receive a reduced tariff was reached. Meanwhile, the Philippines applied in February 2014 to be included under the new EU-GSP+ scheme, with the decision expected to come by September or October 2014. These decisions will be crucial to the Philippines as the EU is their second most important market for tuna. Indeed, in 2013, the EU-27 imported almost 31 400 tonnes of prepared/preserved tuna (HS 160141) from the Philippines, marginally up by 3.9% compared with 2012.
Demand for canned tuna in the major EU markets grew positively in 2013. Volumes of canned tuna imports into the UK, France and Germany increased by 9%, 9.8% and 8.6% respectively in 2013 compared with the previous year. Major growth included French imports from the Seychelles (+13%), German imports from Ecuador (+53%) and UK imports from Thailand (53.8%).
In Italy, though canned tuna imports were lower in 2013 compared with 2012, more pre-cooked tuna loins were shipped into the country, mainly from Ecuador
ImportsCanned tuna: France
2008 2009 2010 2011 2012 2013(1 000 tonnes)
Seychelles 12.3 12.8 13.3 17.2 21.2 24.0
Côte d'Ivoire 28.0 19.8 18.6 15.3 21.7 20.8
Spain 20.6 18.2 21.4 26.0 16.4 18.2
Ecuador 9.8 12.4 12.0 13.6 11.6 12.6
Mauritius 1.5 2.1 1.5 2.9 4.8 6.3
Madagascar 7.5 8.2 5.5 7.1 5.6 5.9
Ghana 5.3 5.8 7.7 8.2 6.2 5.9
Thailand 5.1 9.6 7.6 9.4 4.7 5.7
Others 10.7 12.6 7.6 6.1 5.4 7.8
Total 100.8 101.5 95.2 105.8 97.6 107.2Source: Direction Nationale des Statistiques du CommerceExtérieur – DNSCE
ImportsCanned tuna: Germany
2008 2009 2010 2011 2012 2013(1 000 tonnes)
Ecuador 29.4 16.2 8.9 16.4 10.0 15.3
Philippines 18.5 19.9 17.3 15.5 14.0 13.2
Papua NG 6.1 6.8 11.3 8.7 12.2 9.6
Vietnam 3.4 4.0 3.3 5.4 6.1 8.7
Netherlands 0.3 4.3 6.3 7.7 5.6 5.3
Spain 0.8 0.5 0.7 0.6 5.0 5.0
Thailand 8.2 4.3 4.1 3.2 3.2 4.7
Indonesia 6.8 8.2 6.7 8.1 5.6 4.0
Cote d'Ivoire 0.6 1.0 0.0 0.7 1.4 2.7
Perù 0.0 0.0 0.0 0.0 0.0 1.5
Seychelles 4.4 1.2 3.2 1.1 0.3 0.4
Others 3.3 3.2 5.0 6.6 5.3 4.2
Total 81.8 69.6 66.8 74.0 68.7 74.6Source: Germany Customs
(+15.2%). In Spain, Papua New Guinea shipped more pre-cooked tuna loins (+31.8%) in 2013 compared with 2012, despite the fact that Spain has been a strong critic of their tuna industry.
For the first quarter of 2014, European markets for canned tuna remained slow with no major deals reported as buyers continue to look for a more substantial discount. By the end of March 2014, canned skipjack in brine was quoted at around USD 41-42 per carton (48x185g), which some traders believe is a bottom price that is likely to increase once major supermarket chains start filling their stocks.
ImportsCanned tuna: Italy
2008 2009 2010 2011 2012 2013(1 000 tonnes)
Spain 40.0 38.1 41.6 45.8 41.9 37.1
Côte d'Ivoire 9.1 10.6 7.4 7.1 9.6 8.5
Seychelles 5.6 6.4 7.1 6.2 7.1 8.4
Colombia 10.5 8.9 8.0 9.7 8.9 7.3
Ecuador 2.1 3.5 4.0 4.0 5.4 7.3
Mauritius 3.4 4.2 4.6 5.1 5.1 5.0
Portugal 2.1 1.8 1.8 2.1 1.9 2.1
Thailand 3.2 2.2 2.6 3.1 1.7 1.8
Ghana 0.0 0.0 0.0 0.1 0.6 1.5
France 5.1 4.9 0.6 1.3 0.7 0.2
Others 3.1 2.9 2.6 3.0 2.4 4.3
Total 84.2 83.5 80.3 87.5 85.3 83.5Source: ISTAT
4

CFR PricesCanned tuna*: USA, EUROPE
* 48x6.5 oz Europe, 48x6 oz USA, chunk, origin ThailandSource: GLOBEFISH
Thailand
2013 was a tough year for the Thai canned tuna industry due to declining demand from major markets in the USA and the Middle East and high raw tuna material prices, which peaked at almost USD 2 400 per tonne in April 2013. As a result, exports of canned tuna from Thailand in 2013 declined marginally by 3.7% in volume and 5.3% in value compared with 2012. Shipments to the USA, Egypt, Saudi Arabia and Tunisia dropped sharply by 13.6%, 44.9%, 19.2% and 21.4% respectively compared with the previous year. However, exports to major markets in Europe, posted positive growth for the year, including to the UK (+140.8%), France (+43.7%) and the Netherlands (+42.6%). Interestingly, exports in 2013 to the war-torn Syrian Arab Republic also increased significantly by 44.5% in volume compared with 2012.
0.00
10.00
20.00
30.00
40.00
50.00
60.00
Jan-
09
Mar
-09
May
-09
Jul-0
9
Sep-
09
Nov
-09
Jan-
10
Mar
-10
May
-10
Jul-1
0
Sep-
10
Nov
-10
Jan-
11
Mar
-11
May
-11
Jul-1
1
Sep-
11
Nov
-11
Jan-
12
Mar
-12
May
-12
Jul-1
2
Sep-
12
Nov
-12
Jan-
13
Mar
-13
May
-13
Jul-1
3
Sep-
13
Nov
-13
Jan-
14
Mar
-14
USD/carton
USA
Europe
ImportsTuna loins: Italy
2008 2009 2010 2011 2012 2013(1 000 tonnes)
Ecuador 10.4 13.2 9.9 12.7 10.5 12.1
Solomon Isl 2.2 2.2 1.9 3.6 3.9 3.9
Mauritius 6.8 5.0 4.4 1.9 2.6 2.8
Thailand 2.3 8.7 5.2 3.7 4.8 2.7
Philippines 0.1 0.0 0.0 0.0 0.2 1.8
Kenya 4.8 1.5 2.3 3.5 3.1 1.7
China 0.7 2.5 2.2 2.5 1.5 1.6
Madagascar 0.0 0.0 2.2 0.9 0.8 1.4
Colombia 4.8 2.0 1.4 2.5 1.3 1.4
Others 0.7 2.1 3.5 2.6 2.2 4.0
Total 32.8 37.2 33.0 33.9 30.9 33.4Source: ISTAT
ImportsTuna loins: Spain
2008 2009 2010 2011 2012 2013(1 000 tonnes)
Ecuador 22.4 28.7 25.7 21.4 21.4 21.5
PNG 0.2 0.5 1.7 4.5 6.6 8.7
Guatemala 1.5 5.7 8.7 6.5 9.1 7.1
China 1.3 1.9 2.8 3.7 1.8 5.0
El Salvador 12.4 13.1 7.6 5.8 6.1 6.9
Thailand 3.5 6.6 5.6 11.2 2.5 4.6
Mauritius 2.1 5.5 7.5 9.6 9.0 4.8
Indonesia 0.0 0.0 0.0 1.4 2.5 1.7
Philippines 0.0 0.0 0.0 0.0 0.0 1.4
Others 2.8 6.9 6.5 4.3 3.6 1.2
Total 46.2 68.9 66.1 68.4 62.6 62.9Source: Agencia Tributaria
ExportsCanned tuna: Thailand
2008 2009 2010 2011 2012 2013(1 000 tonnes)
USA 94.9 112.7 117.3 99.3 81.6 70.5
Australia 39.7 32.4 41.0 42.3 34.1 33.4
Libya 33.8 33.7 20.5 11.4 30.5 31.4
Japan 28.3 24.3 23.5 29.9 26.8 29.1
Canada 28.1 30.8 28.8 28.8 22.7 24.8
Egypt 34.6 39.8 51.5 44.2 40.4 22.3
Saudi Arabia 19.5 17.0 18.7 20.8 20.1 16.3
UK 15.8 17.0 13.9 22.8 4.4 10.7
South Africa 8.4 9.8 11.3 7.7 9.5 8.6
UAE 10.0 6.0 7.4 10.2 7.6 7.9
Chile 4.3 4.6 7.6 9.5 8.9 7.8
Papua New Guinea 4.3 3.6 5.5 5.0 8.9 7.7
Yemen * * 6.3 7.4 7.6 7.1
Tunisia * 5.5 12.7 8.3 6.5
Syrian AR 4.6 13.0 9.2 9.9 4.1 5.9
Argentina * * * 11.0 7.8 5.5
France 6.2 9.4 7.4 8.1 3.7 5.3
Netherlands 4.0 5.1 7.4 7.4 3.5 5.0
Others 169.6 126.2 152.7 129.9 81.4 90.9
Total 506.1 485.4 535.5 518.3 411.9 396.7
Source: Thai Customs
* inlcuded under "others"
Despite low prices, slow demand for raw tuna material from Thai packers has continued to result in declining imports into Thailand in the first quarter of
5

Graphs Source: GLOBEFISH European Price Report
2014. According to Thai Customs data, imports of frozen whole skipjack into Thailand from January to February 2014 were recorded at around 98 000 tonnes, a 26% decrease when compared with the same period in 2013.
Japan
In Japan, volumes of canned and prepared/preserved tuna imports posted negative growth in 2013 compared with 2012 (-3.5%), but increased by 15.2% in value. Thailand dominated the market with a 70% share in total imports, posting 2% growth in 2013. The Philippines took over Indonesia as the second largest supplier; shipments from the latter dropped sharply by 23.6%, while supplies from the Philippines contracted by 4.7% from 2013 to 2012. These three countries dominated the Japanese market in 2013, covering more than 97% of the total canned tuna imports into Japan.
Outlook
With poor catches in the WCPO and the approaching FAD ban period (July–September), prices of both frozen skipjack and canned tuna are expected to bottom up soon. The market forecast indicates better demand in the coming months, with reduced prices for canned tuna and improved consumer confidence in the US and European markets. In Japan, the Spring Festival has pushed sales of sashimi tuna and demand is expected to be strong in April and May. However, competition from cheaper fresh and frozen salmon will remain a challenge.
Upcoming event: INFOFISH-Tuna 2014 Conference
INFOFISH-TUNA 2014 Conference and Exhibition to be held from 21–23 May in Bangkok will discuss recent trends and outlooks for the industry including a special “green” and ecolabel session during the last day of the conference (see www.tunatradeconference.com for details).
Source: ITN
CFR PricesFrozen Skipjack: Thailand and Africa
0
500
1000
1500
2000
2500
Mar-04 Mar-05 Mar-06 Mar-07 Mar-08 Mar-09 Mar-10 Mar-11 Mar-12 Mar-13 Mar-14
USD/tonne
Thailand
Africa
1.40
1.20
0.501.001.502.002.503.00
Mar
-10
Jun-
10
Sep-
10
Dec
-10
Mar
-11
Jun-
11
Sep-
11
Dec
-11
Mar
-12
Jun-
12
Sep-
12
Dec
-12
Mar
-13
Jun-
13
Sep-
13
Dec
-13
Mar
-14
Skipjack Bangkok CFR
Skipjack Ecuador, ex-vessel
USD/kg
Tuna - Pacific Ocean
2.10
0.900.501.001.502.002.503.00
Mar
-10
Jun-
10
Sep-
10
Dec
-10
Mar
-11
Jun-
11
Sep-
11
Dec
-11
Mar
-12
Jun-
12
Sep-
12
Dec
-12
Mar
-13
Jun-
13
Sep-
13
Dec
-13
Mar
-14
Yellowfin > 10 kg, Spain CFR
Skipjack main sizes, Spain CFREUR/kg
Tuna - Spanish canneries
0.78
1.80
1.00
2.00
0.501.001.502.002.503.00
Mar
-10
Jun-
10
Sep-
10
Dec
-10
Mar
-11
Jun-
11
Sep-
11
Dec
-11
Mar
-12
Jun-
12
Sep-
12
Dec
-12
Mar
-13
Jun-
13
Sep-
13
Dec
-13
Mar
-14
Skipjack, Seychelles, FOB
Yellowfin, Seychelles, FOB
Skipjack, Abidjan ex-vessel
Yellowfin, Abidjan, > 10 kg, ex-vessel
EUR/kg
Tuna - Indian/Atlantic Oceans
6.50
8.20
2.003.004.005.006.007.008.009.00
10.00
Mar
-10
Jun-
10
Sep-
10
Dec
-10
Mar
-11
Jun-
11
Sep-
11
Dec
-11
Mar
-12
Jun-
12
Sep-
12
Dec
-12
Mar
-13
Jun-
13
Sep-
13
Dec
-13
Mar
-14
Skipjack - frozen cooked loins, single cleaned, Spain/Italy DDP
Yellowfin - frozen cooked loins, double cleaned, Italy DDPUSD/kg
Tuna - Loins
6

Raw Material
J F M A M J J A S O N DYellowfin2010 1.35 1.45 1.48 1.60 1.80 1.80 2.00 1.86 1.85 1.85 1.90 1.952011 1.95 2.00 2.15 2.00 1.90 1.85 2.00 1.80 2.05 2.00 1.95 2.152012 2.20 2.20 2.20 2.35 2.40 2.65 2.68 2.70 2.75 2.85 2.80 2.802013 2.65 2.60 2.60 2.50 2.60 2.60 2.55 2.57 2.45 2.45 2.30 2.152014 2.15 1.90 2.10
J F M A M J J A S O N DSkipjack2010 0.75 0.80 0.78 0.80 0.85 1.10 1.20 1.05 0.95 0.90 0.95 0.912011 1.05 1.10 1.20 1.20 1.10 1.10 1.15 1.25 1.25 1.25 1.25 1.202012 1.30 1.50 1.53 1.60 1.70 1.85 1.85 1.88 1.90 1.85 1.80 1.702013 1.70 1.73 1.80 1.80 1.80 1.80 1.80 1.70 1.63 1.40 1.35 1.102014 1.10 0.90 0.90
AN 011118. 1405.Source: EPR - 20140315.
Monthly tuna prices - Spanish CanneriesIn EUR/kg
TUNA PRICES
7

J F M A M J J A S O N DSkipjack Seychelles2010 0.73 0.70 0.60 0.70 1.05 1.15 1.35 1.10 0.90 0.78 0.73 0.752011 1.07 1.10 1.05 1.05 1.05 1.20 1.26 1.20 1.15 1.20 1.10 1.202012 1.30 1.35 1.35 1.38 1.60 1.65 1.70 1.73 1.80 1.86 1.76 1.732013 1.74 1.73 1.68 1.59 1.62 1.67 1.67 1.62 1.50 1.25 1.15 1.052014 1.00 0.80 0.78
J F M A M J J A S O N DYellowfin Seychelles2010 1.18 1.30 1.20 1.30 1.60 1.80 1.85 1.80 1.70 1.55 1.57 1.602011 1.65 1.80 1.75 1.75 1.80 1.80 1.90 2.00 2.05 2.00 1.95 1.802012 1.95 2.00 1.95 1.98 2.20 2.25 2.40 2.45 2.50 2.53 2.45 2.352013 2.25 2.25 2.20 2.20 2.35 2.40 2.40 2.30 2.26 2.15 2.00 1.922014 1.88 1.60 1.80
J F M A M J J A S O N DSkkipjack Abidjan2010 0.59 0.66 0.67 0.60 0.95 0.98 1.20 1.20 0.80 0.83 0.76 0.732011 0.96 0.90 1.00 1.17 0.98 1.08 1.55 1.10 1.60 1.10 1.10 1.102012 1.25 1.33 1.35 1.36 1.55 1.65 1.70 1.75 1.80 1.73 1.68 1.632013 1.64 1.55 1.60 1.65 1.63 1.66 1.66 1.56 1.49 1.25 1.18 1.102014 1.05 1.03 1.00
J F M A M J J A S O N DYellowfin Abidjan2010 1.08 1.17 1.28 1.40 1.65 1.72 1.80 1.70 1.65 1.59 1.63 1.622011 1.75 1.80 1.80 1.94 1.80 1.80 2.10 2.05 2.00 1.95 1.95 1.952012 2.20 1.98 2.03 2.04 2.12 2.35 2.40 2.45 2.50 2.53 2.53 2.532013 2.50 2.48 2.40 2.45 2.40 2.42 2.42 2.42 2.40 2.20 2.00 2.002014 2.03 2.07 2.00
AN 011114. 1405.Source: EPR - 20140315
Monthly tuna prices - Indian/Atlantic OceanIn EUR/kg
8

1986 1987 1988 1989 1990 1991 1992 1993 1994 1995 1996 1997 1998
J NA NA 863 532 750 700 560 560 785 792 945 NA 829F NA NA NA 518 800 747 560 536 790 687 708 NA 832M NA NA 929 525 800 687 530 544 766 700 707 663 821A NA NA 924 521 800 645 542 519 775 689 710 658 827M NA NA 924 512 810 645 538 524 786 633 695 741 839J NA NA 996 485 790 605 560 546 796 626 808 868 NAJ 640 NA 856 598 740 590 575 527 699 648 811 853 NAA 684 NA 830 595 760 610 592 547 720 653 837 824 NAS 650 NA 830 565 780 556 NA 604 873 837 941 836 NAO 660 NA 740 650 682 519 657 725 870 943 967 859 NAN NA NA 783 760 722 533 637 708 895 951 984 883 NAD NA NA 802 775 718 555 560 777 855 1013 961 843 603
1999 2000 2001 2002 2003 2004 2005 2006 2007 2008 2009 2010 2011
J 620 471 357 991 632 718 973 793 1218 1500 1234 856 945F 660 383 449 756 652 734 949 655 1234 1551 1217 910 958M 710 400 453 777 645 671 914 na 1200 1551 1282 905 1050A 700 516 474 842 645 699 714 na 1200 1650 1100 1250 1050M 660 520 519 606 659 710 753 1052 1200 1625 1150 1050 980J 550 604 534 606 690 730 759 1228 1200 1800 1200 1150 1050J 850 464 736 NA 598 778 750 1228 1301 1900 1268 1350 1714A 766 462 625 689 598 778 788 1138 1280 1850 1352 1100 1600S 466 462 635 608 607 850 778 1152 1274 1750 1275 1100 1620O 487 475 750 784 741 1025 760 1167 1366 1650 894 1092 1640N 484 397 717 687 741 935 741 1152 1522 1515 825 1020 1640D 467 296 822 596 829 987 733 1267 1500 1234 829 977 1600
2012 2013 2014
J 1540 NA 1450F 1714 NA 1360M 1714 NA 1300A 1714 2200M 1714 2200J 1844 2070J 1794 NAA 2218 2150S 2218 2150O 2218 1990N NA 1990D NA 1550
AN 011113. 1405.Source: INC - 20140514.
in Abidjan/Dakar/Tema, in USD/tonneMonthly ex-vessel frozen skipjack prices (1.8 kg/pc and up)
9

1986 1987 1988 1989 1990 1991 1992 1993 1994 1995 1996 1997 1998
J NA 730 1150 NA 970 950 740 630 1080 800 838 800 1200F NA 730 1200 NA 850 950 700 710 1050 785 930 900 1155M NA NA NA NA 900 930 750 800 1020 700 850 940 1155A 725 765 1150 820 850 880 750 820 950 670 810 950 1250M NA 805 1130 790 800 880 NA 820 930 670 750 1100 1130J 700 820 NA 700 700 800 NA 740 900 720 825 1150 1050J 700 820 NA 750 750 700 NA 740 920 720 870 1150 1050A NA 1020 NA 800 820 700 715 890 980 1100 1000 1200 1050S 730 1100 NA 825 925 890 715 1025 1100 1100 1150 1200 900O 745 1050 920 1000 925 800 665 1030 1050 1100 1050 1150 680N NA 1050 920 1000 890 800 NA 1040 1070 975 1030 1100 600D NA 970 920 970 880 750 630 1050 930 875 880 1150 630
1999 2000 2001 2002 2003 2004 2005 2006 2007 2008 2009 2010 2011
J 700 NA 490 710 700 810 850 745 1075 1475 900 1000 1450F 850 700 650 720 600 860 880 925 1075 1475 1100 1100 1550M 900 750 725 705 565 850 950 1000 1075 1475 1100 1075 1600A 880 550 950 735 500 850 950 1000 1075 1500 950 1175 1550M 820 400 910 720 505 825 950 1000 1110 1650 1050 1500 1700J 580 400 765 700 655 925 930 925 1300 1925 1250 1700 1900J 560 430 715 730 770 970 930 925 1400 1990 1550 1700 1875A 620 NA 725 790 775 985 1000 900 1450 1950 1550 1450 1725S 600 400 785 770 775 985 990 890 1450 1825 1425 1275 2000O 500 450 790 780 860 985 970 890 1475 1775 1425 1200 1875N 400 430 760 720 860 1000 815 885 1500 1650 850 1025 1850D 450 430 750 700 765 850 815 885 1550 1600 1000 1200 1925
2012 2013 2014
J 2025 1950 1388F 2075 2100 1290M 1950 2200 1238A 2150 2365M 2230 2365J 2215 2325J 2200 1925A 2275 1900S 2275 1900O 2325 1900N 2100 1860D 1890 1625
AN 011111.1403.Source: ITN - 20140514.
Monthly CFR frozen skipjack prices in Thailand (4 lb/pc and up), in USD/tonne
10

J F M A M J J A S O N D1.8/up kg/pc*1983 880 860 875 850 710 705 820 665 745 715 620 6051984 NA 710 650 650 658 522 626 533 470 571 642 5701985 575 620 1004 754 859 727 767 783 785 794 833 8911986 818 812 788 711 546 704 715 659 718 723 652 7461987 644 923 1136 991 1038 1055 1000 1024 1011 1148 1319 13951988 1166 1047 1023 1034 1041 971 780 755 785 862 741 8621989 795 893 1159 1355 818 682 826 895 1494 1615 1167 14211990 1414 1036 1327 1200 1278 1108 997 930 1000 997 1117 8701991 731(A) 1025 795 950 831 826 901 805 743 883 989 9271992 954 957 1289 1015 1504 941 927 703 690 862 885 8461993 1079 1090 1283 1241 1342 1222 1275 1340 1231 1220 1344 12421994 1242 1394 1468 1336 1512 1347 1580 1580 1613 1490 1492 13521995 1102 955 935 995 833 945 1115 1203 1103 1243 1364 12861996 1240 1260 1276 1254 1185 871 779 906 928 943 1031 10151997 904 812 945 1013 1175 1266 1260 1360 1279 1247 1470 14131998 1450 1539 1450 1377 1242 1078 1347 990 1106 1330 1198 12581999 870 785 877 812 1139 990 900 908 944 939 882 10742000 899 825 1014 799 641 539 582 529 448 418 510 4252001 450 642 644 741 1082 944 836 817 815 907 1101 10332002 964 643 759 820 864 758 851 926 935 911 919 9222003 944** 909** 704** 594** 554** 637 701 759 813 1150 1104 12042004 1171 1136 924 949 954 1032 1200 1200 1150 1230 1000 9602005 970 965 1020 834 950 870 1009 1048 1003 970 911 7932006 833 764 798 814 1022 1043 968 953 954 1003 978 10272007 1535 1030 1100 1092 1110 1069 1360 1479 1589 1568 1575 15862008 1601 1517 1599 1563.5 1539.5 1657.5 1915.5 1815 1867 1994 1902 17862009 1570 1494 1444 1297 1294 1384 1459 1522 1547 1463 1357 13782010 1300 1167 1410 1207 1155 1471 1665 1639 1530 na 1326 12212011 1332 1367 1421 1416 1619 1683 1797 1816 2017 1826 1906 20812012 2080 2127 2094 2007 2064 2261 2258 2388 2397 2326 2263 20082013 1788 1650 1771 1715 2215 2307 2226 1996 1817 1774 1759 17712014 1560 1417 1405
NB: Shimizu market from January 1983 to March 1996; Tsukiji market from April 1996 to November 2001; Yaizu market from December 2001 up to present.* 1.5/2.5 kg/pc from January 1983 to March 1996.** 4.8 - 1.8/up kg/pc.(A) Deepsea purse seine caught as from January 1991.
AN011104. 1405.Source: ITN - 20140515.
origin Southwestern Pacific, in USD/tonneMonthly auction prices of frozen skipjack in Japan,
11

Canned Tuna
1989 1990 1991 1992 1993 1994
J 21.00*(A) 21.75 NA 17.50 17.00 21.00F 20.75 21.75 19.50 17.00 16.50 21.00M 20.75 NA 21.00 17.50 16.50 21.00A 20.00 20.00 21.00 17.75 16.50 21.00M 18.00 20.00 21.00 17.75 17.00 20.50J 18.00 20.50 20.00 17.25 21.00 19.00J 17.50 18.50 20.00 17.00 21.00 20.00A 18.00 22.00 19.00 17.50 21.00 20.00S 18.00 22.50 20.25(B) 17.50 20.75 20.00O 18.00 23.50 19.75 17.00 20.75 NAN 18.00 21.50 19.75 17.00 20.75 NAD 21.75 21.50 17.50 16.60 20.75 NA
1995 1996 1997 1998 1999 2000
J NA 21.00 19.50 21.15 NA 15.5F NA 21.25 20.50 NA 18.00**(C) 16.25M 18.75 19.00 20.50 NA 18.00 16.25A 18.88 17.75 21.00 NA 18.00 14.75M 18.88 18.75 21.00 NA 18.00 14.5J 19.50 20.00 21.00 NA 16.75 13.00J 20.00 20.00 21.00 NA 16.75 13.00A 20.00 20.50 22.50 NA 16.75 11.25S 22.25 20.50 22.50 NA 15.75 11.25O 22.25 22.75 22.00 NA 15.25 11.25N 22.00 22.75 22.00 NA 15.25 11.25D 21.00 20.50 22.00 NA 15.25 11.25
48x6 oz, origin Thailand, in USD/carton Monthly canned tuna in brine prices into USA, lightmeat,
12

2001 2002 2003 2004 2005 2006
J 13.75 16.50 14.25 15.00 16.25 16.25F 13.75 16.50 14.25 15.50 16.25 16.25M 16.00 16.50 13.25 15.50 16.25 16.25A 18.10 14.50 13.00 15.50 16.25 16.25M 18.10 14.50 12.50 15.50 16.25 16.25J 18.10 14.50 12.50 15.75 16.25 16.25J 15.50 14.50 14.00 15.75 17.00 16.25A 16.00 15.50 15.00 16.25 17.50 16.75S 17.50 15.50 15.50 16.25 17.50 16.75O 17.50 15.00 16.25 16.25 17.50 16.75N 18.50 15.00 16.25 16.25 17.50 16.75D 16.50 14.25 15.00 16.25 16.25 16.75
2007 2008 2009 2010 2011 2012 2013 2014
J 16.75 27.50 30.60 29.40 25.20 29.70 41.10 38.70F 17.00 27.50 27.60 29.40 25.20 37.50 41.10 38.70M 24.90 27.50 27.60 29.40 27.00 37.50 41.10 37.50A 24.90 27.50 27.60 29.40 27.00 37.50 41.10M 24.90 27.50 27.60 29.40 27.00 37.50 41.10J 24.90 27.50 31.20 29.40 27.00 38.70 41.10J 24.90 27.50 31.20 33.00 27.00 38.70 41.10A 24.90 27.50 31.20 33.00 27.00 41.10 41.10S 24.90 27.50 31.20 33.00 27.00 41.10 41.10O 24.90 27.50 29.40 25.20 26.70 41.10 41.10N 24.90 27.50 29.40 25.20 26.70 41.10 41.10D 27.50 27.50 29.40 25.20 29.70 41.10 39.90
(A) 48*6.5 (or 6 1/2) oz up to August 1991.(B) 48*6.125 (or 6 1/8) oz from September 1991 to January 1998.(C) 48 x 6 oz (48*170 g) as from February 1999.* c&f prices up to January 1998.** FOB prices as from February 1999.
AN 011101. 1405.Source: ITN - 20140315.
Monthly canned tuna in brine prices into USA, lightmeat,48x6 oz, origin Thailand, in USD/carton (cont)
13

Sashimi Tuna
J F M A M J J A S O N Dlow price1990 N/A 400(A) 500 300 800 800(B) 700(B) 300(B) 300 300 300 6001991 300 600 600 500 400 400 400 500 300 600(B) 300(B) 4001992 400 400(B) 500 800(C) 400(B) 300 400(B) 300(B) 500(B) 600 300(B) 4001993 400 300(B) 500 800(B) 800(B) 900(D) 650(B) 650(B) 800(B) 600(B) 500(B) 800(B)1994 600(B) 300(B) 400(B) 1500 500(B) 600(B) 500 500(B) 1000(B) 1000(B) 600(B) 600(B)1995 1000(B) 800 1000 900(B) 900(B) 900(B) 500 400 300 400 400 4001996 500 800 300 600 500 800 500 400 400 500 400 4001997 500 500 400 400 600 500 500 500 600 500 600 3001998 400 500 800 1000 300 1000 400 400 500 500 400 4001999 400 400 400 700 500 500 800 500 400 500 400 7502000 400 600 800 700 500 600 600 1700 1000 400 600 4002001 500 400 700 900 400 600 500 400 1500 400 500 6002002 400 1000 600 400 800 900 650 500 600 700 700 8002003 600 800 400 1000 700 700 1100 700 500 1000 700 8002004 950 1000 850 600 600 1000 800 600 1000 1000 800 8002005 1300 700 1000 1500 900 700 800 800 800 950 1000 8002006 750 800 800 700 800 700 700 600 NA 100 700 6002007 600 700 950 700 750 700 700 800 800 700 800 7002008 1000 600 700 800 700 100 800 NA 700 800 750 7352009 600 1000 700 800 735 600 600 600 600 630 600 6002010 700 700 700 700 800 800 500 600 500 NA 1000 5002011 700 1000 NA 700 1000 840 800 800 NA 1000 1000 8002012 1100 900 800 100 900 700 900 1000 800 1200 840 7002013 1000 1000 1100 1000 900 800 700 1300 1000 800 600 8002014 700 1300 1000
Monthly auction prices of fresh bigeye tuna in Japan,origin Indonesia, in yen/kg
14

J F M A M J J A S O N Dhigh price1990 N/A 5000(A) 1900 3500 3000 2900(B) 3000(B) 3000(B) 4800 2800 2000 40001991 3000 3500 3000 4000 4500 5000 2500 5000 2500 2500(B) 3000(B) 30001992 3000 3500(B) 1000 2200(C) 2200(B) 4000 5300(B) 3500(B) 3000(B) 2500 3000(B) 20001993 4000 2700(B) 3500 3000(B) 3000(B) 3400(D) 4000(B) 3000(B) 4000(B) 3500(B) 3000(B) 3500(B)1994 9500(B) 5500(B) 3500(B) 7000 6000(B) 3500(B) 4000 4500(B) 5000(B) 5000(B) 4500(B) 4500(B)1995 4000(B) 4000 5000 4000(B) 3000(B) 3500(B) 4800 3500 3000 3500 3000 43001996 4500 3800 4000 4000 4000 4200 2500 5300 3500 3500 3800 30001997 3000 4500 3500 3700 3900 3500 2900 3500 3300 2000 2500 35001998 3200 3000 5000 3000 3800 2500 2500 2100 2000 2200 2500 24001999 2500 3200 4500 1500 2500 2400 1800 2300 1900 2600 2300 23002000 3400 2500 2000 2000 2500 3000 1800 2500 2200 1800 1800 23002001 4000 2500 3000 1800 2000 1700 2500 1600 1700 2500 1500 23002002 2500 1900 2200 2100 1800 1200 1800 2400 1700 1000 1000 15002003 1600 1500 2200 1500 800 800 1600 2000 1300 1300 1700 10002004 1500 1000 1200 800 1400 1300 1000 1000 1400 1500 1500 19002005 2000 2000 1800 1700 1200 1000 3000 3000 1300 1200 1300 20002006 1500 1500 1500 1300 1500 1200 2000 1000 NA 2000 1100 13002007 2400 2200 1300 1500 1300 1500 1300 1300 1200 1300 1500 15002008 2500 1700 1500 1500 1500 1000 1500 NA 2000 2000 2400 10852009 2200 1500 1500 1300 1500 1300 2000 1500 1800 1800 1400 14002010 1800 1500 1100 1600 1100 1000 1700 1500 1500 NA 1200 13002011 1500 1500 NA 1600 1700 1000 1000 1000 NA 1500 1300 17002012 2000 1500 1000 1800 1700 1200 1700 1600 1400 1300 1400 16002013 1800 1300 2000 1700 1500 1300 1500 1600 1400 1200 1400 15002014 1500 1400 1600
* Auction Tsukiji market from February 1990.(A) Origin Indonesia/Guam.; (B) Origin Guam/Palau.; (C) Origin Taiwan Province of China.; (D) Origin Las Palmas.
AN 011119.1405.Source: ITN - 20140512.
Monthly auction prices of fresh bigeye tuna in Japan,origin Indonesia, in yen/kg (cont.)
15

J F M A M J J A S O N Dlow price1995 NA 509* 1000 1000 NA NA NA NA 1500 1000 500 7001996 800 800 800 800 600 1000 1500 1000 800 900 1000 8001997 900 500 800 800 900 800 1000 500 500 1000 2000 5001998 500 600 600 1000 400 400 800 700 800 400 700 7001999 700 700 700 800 800 900 1000 1000 900 800 800 8002000 800 800** 800 800 900 900 900 900 900 900 900 9002001 900 600 900 500 900 800 800 800 800 800 800 8002002 800 700 700 500 550 500 500 500 500 500 500 5002003 500 500 500 1350 1510 420 473 473 473 473 473 4732004 473 473 473 525(A) 525 630 630 630 630 630 683 6302005 630 525 525 525 525 na 525 525 525 525 525 5252006 420 420 420 420 630 630 840 735 735 630 840 8402007 840 630 840 840 2500 840 NA NA 2100 2625 578 5782008 578 578 1050 NA NA 1575 2415 1575 2625 2625 2625 26252009 2625 2625 2625 1575 1575 1575 1575 1575 1575 1575 1575 15752010 1575 1575 1575 1575 1575 1890 2310 2100 1995 NA NA NA2011 NA 735 735 735 NA 1575 2100 1785 NA 2415 2415 24152012 2415 2415 2415 NA 2000 1050 2000 1050 1050 1050 930 17852013 630 730 683 735 735 735 735 788 788 840 788 7352014 735 735 735
J F M A M J J A S O N Dhigh price1995 NA 7000* 7000 4000 NA NA NA NA 4500 10000 11800 120001996 12000 9000 11700 12000 11000 11000 12000 10000 12500 11000 10000 110001997 11000 11000 9000 13000 13000 13000 11000 10000 11000 11000 11500 110001998 11000 11000 8500 10000 12500 12000 11000 9000 11000 11000 8800 100001999 10000 10000 10500 7500 7500 9000 9100 9700 8000 11000 8000 80002000 10000 6500** 5000 6500 7500 7500 8000 8500 8600 7000 7500 75002001 8500 6000 8800 8500 8500 7500 8500 7000 7000 7000 8000 75002002 8000 8300 9000 7500 9000 7500 9000 8500 6500 8000 8000 75002003 8500 8000 6500 6300 7700 8925 8400 8400 8400 8400 5985 63002004 6825 8400 8400 6825 8400 7895 7895 7875 7560 6300 5880 68252005 7875 6825 6300 6510 6300 na 6090 6615 8400 6615 6300 68252006 7770 6825 9135 6825 8085 6300 6510 7140 6300 6300 7350 89252007 7350 6300 6300 9030 3200 7350 NA NA 4725 3150 3465 34652008 3465 3465 6300 NA NA 5650 7350 6825 3465 3990 3990 39902009 3990 3990 3990 1785 3675 3990 6330 3465 2835 2415 2415 24152010 2415 2415 2415 2415 1890 5040 3990 3675 4095 NA NA NA2011 NA 6300 6300 6300 NA 6090 3675 6090 NA 3570 3570 35702012 3570 3570 3570 NA 6000 5670 5040 4935 7140 4725 4725 52502013 5880 6300 4200 6300 6300 5250 4515 4200 6090 3885 5250 63002014 4830 5460 8500
* Tsukiji market from February 1995** Only frozen fish from February 2000.Origin Japan/Australia from April 2004.
AN 011120. 1405.Source: ITN - 20140512
Monthly auction prices of Southern bluefin tuna in Japan,origin Australia, in yen/kg
16

J F M A M J J A S O N Dlow price2005 3800 3000 2000 3800 3000 5000 na na na na 2500 25002006 3000 3000 3000 3500 3000 3000 2800 na na na 3000 40002007 3800 3000 3000 3500 3000 3000 na na na na 4000 35202008 3000 5000 3500 3000 3000 3000 2500 3500 na na na 20002009 2500 3000 3000 2500 na na na na na 3000 2300 20002010 3300 2000 2500 3200 3000 3000 1800 3000 3500 na 3000 35002011 3000 3000 3200 3100 3300 3000 1800 3000 3500 na 3000 35002012 3500 3300 3000 4000 4200 3600 3700 3700 3700 3000 na 42002013 4000 4000 4100 4000 4000 4000 4000 4000 4000 4000 3500 30002014 3000 3000 2500
J F M A M J J A S O N Dhigh price2005 4800 4500 4000 4000 3100 6800 na na na na 3400 33002006 4000 4000 4700 4300 4000 4800 10000 na na na 4800 43002007 5000 4400 4400 4500 4000 4800 na na na na 4600 45002008 3500 5800 5500 6100 6100 6100 5500 5000 na na na 26002009 3800 4800 4000 4000 na na na na na 3300 3200 35002010 3500 3100 3200 3300 3200 38000 3000 3200 3800 na 4000 38002011 4500 3800 4300 3500 3700 3400 4100 4500 na 4300 3800 45002012 4500 3500 4000 4500 4300 3700 3800 3800 3800 3500 na 43002013 4300 4100 4400 4200 4100 4100 4100 4100 4100 4100 4000 40002014 3900 4000 3500
AN 011112. 1405.Source: INFOFISH Trade News - 20140315
Monthly prices of farmed bluefin tuna Japan, origin Spain, in yen/kg
17

J F M A M J J A S O N DSkipjack2008 4.71 5.50 5.70 5.50 5.17 5.45 5.65 5.60 6.80 6.80 6.702009 4.00 3.10 3.88 4.20 4.85 4.05 4.91 3.57 3.402010 3.62 4.00 4.00 4.20 3.78 5.40 5.00 5.35 5.10 5.16 4.39 4.112011 4.60 5.20 5.60 5.60 5.60 5.60 5.29 5.31 4.63 6.30 6.00 5.802012 5.70 5.90 6.00 6.00 6.60 6.40 6.65 7.00 6.60 6.60 7.11 7.112013 6.47 6.50 6.50 6.80 6.50 7.00 7.05 7.40 7.30 7.00 6.90 6.802014 6.80 6.40 6.50
J F M A M J J A S O N DYellowfin2008 6.60 7.48 7.70 7.50 7.45 7.45 7.57 7.80 7.95 7.95 7.80 7.202009 7.65 7.15 6.70 6.70 6.50 6.00 5.70 6.00 6.00 5.90 5.102010 6.00 6.00 6.20 6.23 6.35 6.65 6.85 6.95 6.85 6.75 6.65 6.252011 6.30 7.20 7.80 7.80 7.80 7.80 7.80 7.80 7.80 8.50 8.50 8.302012 8.50 8.50 8.50 8.50 8.50 8.50 8.50 8.50 8.50 8.70 8.95 8.952013 8.90 8.60 8.60 9.20 8.40 8.25 8.30 8.34 8.65 8.40 8.40 8.502014 8.50 8.30 8.20
Source: EPR - 20120415.
J F M A M J J A S O N DSkipjack Bangkok2008 1.70 1.92 1.98 1.92 1.85 na 1.40 1.102009 0.90 1.10 1.28 1.10 0.95 1.25 1.50 1.40 1.40 0.90 0.85 0.832010 1.07 1.10 0.95 1.15 1.50 1.70 1.70 1.45 1.28 1.20 1.03 1.202011 1.45 1.55 1.50 1.55 1.80 1.90 1.90 1.70 2.00 2.03 1.80 1.952012 2.05 2.00 1.95 2.10 2.20 2.20 2.23 2.25 2.30 2.40 2.05 1.852013 1.95 2.10 2.23 2.37 2.30 2.15 1.90 1.90 1.90 1.82 1.70 1.602014 1.40 1.28 1.20
J F M A M J J A S O N DSkipjack Ecuador2008 1.40 1.45 1.50 1.85 1.95 na na 1.402009 1.10 1.00 1.00 1.00 1.38 1.30 1.25 1.50 1.52 1.50 1.00 0.922010 0.95 1.20 1.15 1.18 1.55 1.70 1.85 1.70 1.50 1.40 1.25 1.252011 1.55 1.60 1.60 1.40 1.45 1.60 1.85 1.85 1.80 1.95 1.95 1.932012 1.95 2.05 2.05 2.05 2.12 2.20 2.28 2.40 2.40 2.45 2.40 2.102013 2.10 2.15 2.20 2.10 2.10 2.17 2.15 2.05 2.05 2.00 1.90 1.802014 1.70 1.55 1.40
AN 010956. 150410Source: EPR - 20140512.
Monthly tuna prices - Pacific OceanIn USD/kg
Monthly tuna loins pricesin Europe, origin: Latin America in USD/kg
18

TUNA IMPORTS
Country 1979 1980 1981 1982 1983 1984 1985 1986 1987 1988 1989 1990*
Japan 279.4 230.1 284.1 315.0 319.7 353.7 341.0 439.1 609.4 830.3 962.9 1014.8Thailand - - 0.0 0.0 0.0 17.6 87.6 229.5 200.5 472.4 605.1 688.4Spain 9.4 15.3 34.5 45.6 19.9 10.3 11.4 23.5 72.9 137.8 108.7 191.1USA 266.4 341.3 387.6 304.1 204.7 215.9 214.1 238.5 252.0 253.5 332.7 234.2Ecuador - - - - - - - - - - - -Mauritius 3.5 3.9 3.3 3.1 2.1 1.6 2.9 3.8 3.3 2.6 4.8 9.6Italy 117.8 159.1 138.5 122.7 111.5 112.9 127.2 130.6 175.8 198.7 165.5 191.8Viet Nam - - - - - - - - - - - -Korea Rep - - 0.9 0.3 0.4 0.4 0.2 0.3 0.6 2.3 5.1 6.5France 15.7 20.2 23.5 28.3 24.9 22.5 23.5 30.2 41.1 58.8 42.5 58.6Seychelles - - - - - - - - 2.9 4.4 2.9 1.7Fiji, Republic of 4.7 8.7 5.9 3.6 1.9 4.1 4.7 6.1 9.8 16.4 12.4 13.8Mexico - - - - - - - - - - - 0.3Philippines - - - 0.3 - 0.8 - 2.2 1.9 11.4 4.8 17.8China - - - - - - - - - - - -
Portugal 2.8 5.0 11.1 6.7 6.1 7.1 5.7 9.6 11.4 13.5 11.1 22.7Iran (Islamic Rep. of) - - - - - - - - - - - -Canada 8.7 16.6 15.7 17.4 11.2 10.8 10.5 1.9 2.4 5.3 10.6 3.5Madagascar - - - - - - - - - - - -Indonesia 0.0 0.0 0.0 0.0 0.0 0.0 0.0 0.5 - 0.0 0.0 0.1Belgium 0.4 2.4 0.8 0.7 0.4 0.2 0.3 0.4 0.6 0.5 0.4 0.6Côte d'Ivoire 8.8 19.2 17.0 23.7 23.8 21.0 25.5 28.8 46.5 54.8 46.3 28.3Others 33.3 55.1 59.2 41.9 64.9 103.7 70.3 79.9 101.6 130.6 188.0 143.4Totals 750.9 877.0 982.3 913.5 791.7 844.0 925.0 1225.0 1532.6 2193.4 2457.4 2627.2
Country 1991 1992 1993 1994 1995 1996 1997 1998 1999 2000 2001 2002
Japan 1098.1 1291.8 1675.4 1812.1 1916.9 1980.4 1668.7 1538.7 2002.7 2027.4 1820.8 1924.2Thailand 887.8 724.3 560.4 453.8 364.5 351.6 431.1 445.1 379.6 262.4 429.5 454.0Spain 144.7 87.0 102.0 123.0 146.3 152.4 197.2 289.4 189.6 144.1 251.9 270.9
USA 220.0 237.2 273.2 306.2 332.3 352.6 335.2 380.1 344.1 320.7 304.4 252.9Ecuador - - - - 9.7 14.6 0.5 7.0 2.7 0.8 3.3 21.9Mauritius 7.0 10.6 6.0 14.3 18.8 21.7 24.9 29.3 16.0 18.3 32.2 41.2
Italy 133.6 125.2 98.4 107.4 118.5 84.9 76.3 91.8 57.8 46.8 48.6 58.5Viet Nam - - - - 0.4 0.1 0.1 - - - 0.2 0.4
Korea Rep 5.8 7.8 6.0 16.6 9.0 6.8 23.0 9.5 18.6 20.1 31.6 33.4France 33.4 39.7 28.5 35.5 38.4 46.1 41.5 59.9 54.1 38.9 46.2 52.1Seychelles 2.3 1.8 2.5 7.2 0.0 17.4 17.8 15.4 - 9.7 13.9 22.0Fiji, Republic of 13.0 19.8 30.0 8.3 11.3 12.4 12.9 15.4 10.2 0.1 12.2 7.6Mexico 0.3 2.2 1.2 4.5 2.3 0.8 0.3 3.5 7.1 3.9 2.0 0.1Philippines 37.2 40.1 25.8 25.7 37.8 35.0 31.3 43.2 37.0 19.0 8.5 17.0China - 2.4 0.7 0.6 0.2 0.2 0.1 0.6 1.2 3.0 1.4 3.0Portugal 23.0 14.8 14.4 16.6 22.3 22.6 17.4 35.7 21.2 15.8 17.0 18.6Iran (Islamic Rep. of) - - - - 1.1 - - - - - 1.2 6.7Canada 2.4 3.1 2.8 3.0 2.8 3.8 4.9 7.2 7.0 8.6 12.2 12.8Madagascar 0.0 8.5 7.2 5.6 8.4 4.7 13.0 15.4 11.0 6.4 8.1 13.4Indonesia 0.0 0.0 5.9 5.5 4.1 1.9 0.3 1.1 1.5 3.9 1.9 0.8Belgium 0.5 0.5 1.1 2.4 1.6 1.2 1.2 1.4 2.5 3.1 3.7 4.6Côte d'Ivoire 56.6 47.9 48.3 70.5 81.5 67.6 58.2 90.4 64.8 47.7 60.7 79.4Others 137.6 167.5 145.6 192.8 265.5 236.9 313.9 237.1 192.2 205.5 181.4 191.2Totals 2803.4 2832.2 3035.3 3211.7 3392.3 3415.4 3256.6 3301.8 3399.7 3199.6 3272.4 3473.4
Raw Material
Yearly world imports of fresh and frozen tuna** into major importing countries in USD million
19

Country 2003 2004 2005 2006 2007 2008 2009 2010 2011
Japan 1894.4 2163.1 1955.5 1982.9 1855.1 2154.5 1998.9 1949.3 2308.1Thailand 510.9 577.9 740.1 825.6 958.0 1413.5 1040.4 1149.4 1417.9Spain 253.2 230.6 274.2 263.3 357.9 386.1 316.8 343.0 477.6USA 286.5 285.7 305.9 295.8 451.9 431.1 430.6 459.8 440.8Ecuador 25.0 15.3 0.5 1.1 47.4 222.8 209.2 207.7 273.4Mauritius 32.2 53.3 63.2 108.9 129.2 205.2 122.6 142.2 205.4Italy 84.5 63.8 68.2 66.7 78.8 82.0 65.4 90.1 121.8Viet Nam 6.2 6.6 20.8 34.6 61.0 75.4 60.4 90.4 118.4Korea Rep 33.7 31.1 43.0 51.9 72.2 88.0 82.1 65.6 116.4France 61.0 60.7 64.6 74.2 90.6 98.8 98.4 98.7 101.9Seychelles 65.0 73.8 76.8 93.8 79.0 59.9 85.1 74.0 93.0Fiji, Republic of 25.5 20.5 17.0 10.2 5.2 7.9 6.6 19.3 80.5Mexico 0.3 30.8 7.1 29.2 41.2 58.2 13.2 40.5 62.3Philippines 32.6 12.2 38.6 31.0 49.4 59.0 76.7 53.1 59.9China 4.8 18.2 7.8 23.5 17.2 26.9 37.6 30.6 53.3Portugal 17.3 12.6 18.4 24.4 33.6 37.1 39.5 30.1 41.6Iran (Islamic Rep. of) 25.5 11.9 12.2 5.2 9.5 11.8 21.3 59.1 40.9Canada 12.2 16.2 18.9 20.3 22.7 24.9 23.6 28.4 39.2Madagascar 16.0 13.4 12.6 30.5 54.4 23.4 16.7 24.5 37.3Indonesia 1.3 3.4 0.2 5.2 2.5 18.7 15.1 26.7 35.8Belgium 9.8 12.4 13.3 11.0 19.9 23.5 22.9 26.0 34.8Côte d'Ivoire 71.7 61.3 43.9 65.0 83.2 100.3 73.8 37.8 34.6Others 200.6 224.1 288.4 311.1 393.7 379.1 459.3 475.3 511.0Totals 3654.4 3985.6 4091.3 4365.2 4904.1 5988.1 5231.2 5409.7 6578.2
**including bonito
Source: Fishstat Plus - 20140502.
Yearly world imports of fresh and frozen tuna* into major importing countries in USD million (cont.)
* from 1990 excluding loins;
20

Country 1979 1980 1981 1982 1983 1984 1985 1986 1987 1988 1989 1990*
Thailand - - 0.1 0.0 0.0 21.8 86.1 206.5 159.0 258.6 325.2 370.9Japan 102.2 84.8 94.6 122.8 135.0 107.9 144.5 140.7 189.1 215.0 212.2 262.7Spain 8.2 12.1 28.2 42.8 22.1 14.6 14.1 22.5 84.9 125.6 112.6 168.6Ecuador - - - - - - - - - - - -Mauritius 5.0 3.5 2.7 3.1 2.5 2.1 3.3 4.6 3.4 2.6 4.9 7.6Viet Nam - - - - - - - - - - - -Philippines - - - 0.3 - 1.3 - 3.4 3.3 18.6 6.4 21.7Seychelles - - - - - - - - 2.5 4.0 4.3 3.2Iran (Islamic Rep. of) - - - - - - - - - - - -USA 286.5 268.7 273.6 222.1 199.2 183.4 183.2 207.4 199.7 167.6 218.4 138.4Côte d'Ivoire 8.1 13.8 14.5 25.3 28.2 26.8 33.6 37.8 46.1 46.8 51.8 56.2Fiji, Republic of 3.6 5.7 3.2 2.1 1.8 3.7 4.5 7.2 7.2 11.5 17.5 10.5Mexico - - - - - - - - - - - 0.2China - - - - - - - - - - - -Italy 75.1 77.2 71.3 77.3 74.4 83.0 104.6 110.5 119.6 113.5 121.1 123.1Indonesia 0.0 0.1 0.2 0.0 - 0.0 - 0.8 - - 0.0 0.1Madagascar - - - - - - - - - - - 0.0France 10.6 10.8 12.1 20.0 19.1 18.9 19.4 22.4 27.8 36.9 29.6 36.6Tunisia - 0.4 0.3 - - 0.8 1.0 - - 0.8 0.5 1.0Portugal 3.0 4.0 8.2 6.9 7.3 9.4 6.8 11.0 9.6 10.8 11.1 20.6Senegal 11.5 14.4 20.4 14.2 23.1 20.5 24.0 20.6 18.6 32.6 34.7 34.2Korea Rep - - 0.4 0.2 0.2 0.2 0.0 0.0 0.2 1.4 2.3 1.8Others 28.4 38.4 33.1 30.7 38.0 37.9 41.7 45.8 59.6 64.4 81.3 71.9Totals 542.2 534.0 563.0 567.8 550.9 532.2 666.8 841.0 930.5 1110.9 1233.8 1329.1
Country 1991 1992 1993 1994 1995 1996 1997 1998 1999 2000 2001 2002
Thailand 496.3 430.1 407.1 484.1 401.1 319.2 337.2 390.1 491.0 359.5 450.3 520.3Japan 273.2 283.1 337.1 332.0 342.7 336.1 321.3 347.5 345.0 381.1 357.1 416.1Spain 147.0 64.0 90.4 89.0 103.4 118.6 128.0 196.0 173.3 162.1 227.3 208.1Ecuador - - - - 12.7 17.6 0.5 6.4 3.1 1.1 5.0 24.4Mauritius 6.4 13.4 6.7 13.9 20.8 21.2 22.4 24.3 20.7 30.3 40.2 53.0
Viet Nam - - - - 0.2 0.1 0.1 - - - 0.0 0.4Philippines 42.2 56.1 37.4 35.9 54.8 52.4 53.8 72.2 57.3 35.1 19.1 30.2Seychelles 4.7 4.1 3.8 8.2 0.0 19.4 19.8 17.1 - 18.9 18.8 31.9Iran (Islamic Rep. of) - - - - 0.3 - - - - - 0.9 8.4USA 147.9 119.6 130.4 136.9 145.6 148.4 117.5 154.2 105.1 79.7 68.1 42.7Côte d'Ivoire 70.0 64.4 73.2 70.3 77.1 72.3 54.6 61.5 84.0 69.6 73.6 83.1Fiji, Republic of 15.4 8.5 12.8 5.6 7.2 8.2 9.0 8.7 6.3 0.1 7.3 8.8Mexico 0.3 3.0 1.5 3.6 2.4 0.9 0.3 3.8 6.0 6.4 2.7 0.0China - 2.9 0.2 0.2 0.2 0.0 0.0 1.2 0.6 1.5 1.0 2.2Italy 112.4 96.9 84.7 75.0 72.6 56.3 44.6 49.1 45.0 43.3 38.9 40.6Indonesia 0.0 0.0 5.8 4.6 4.0 1.9 0.2 0.8 1.7 7.0 2.0 1.5Madagascar 0.1 15.0 13.5 7.7 10.5 6.7 15.7 12.8 15.1 13.4 12.5 17.3France 19.6 23.1 14.1 16.3 15.5 20.6 14.1 21.2 22.3 14.9 17.3 18.0Tunisia - - - 1.7 1.3 0.6 0.9 4.6 6.4 8.3 12.5 13.3Portugal 22.3 15.5 14.2 13.3 19.2 19.0 13.1 23.9 21.3 16.0 14.2 15.3Senegal 29.9 22.0 16.1 16.0 11.3 14.6 15.1 7.9 2.7 0.2 0.0 0.0Korea Rep 1.0 2.1 1.0 2.6 1.3 0.5 7.6 3.6 4.0 2.5 3.1 5.9Others 79.7 85.8 73.2 117.9 160.5 142.5 206.3 156.8 152.9 157.5 133.5 151.9Totals 1468.4 1309.6 1323.2 1434.7 1464.7 1377.1 1381.9 1563.9 1563.7 1408.7 1505.3 1693.3
Yearly world imports of fresh and frozen tuna**into major importing countries, in 1 000 tonnes
21

Country 2003 2004 2005 2006 2007 2008 2009 2010 2011
Thailand 619.3 579.0 739.0 783.0 725.3 806.9 829.6 831.0 787.1Japan 388.5 407.4 373.1 324.5 267.8 246.1 264.1 278.0 244.9Spain 189.0 141.2 161.7 146.7 160.0 151.5 150.3 156.2 177.4Ecuador 24.1 13.6 1.8 3.1 35.0 129.0 156.8 144.7 161.8Mauritius 38.3 48.4 60.1 92.2 75.2 100.5 87.4 98.1 115.1Viet Nam 5.9 4.7 15.7 27.8 45.9 47.5 33.0 55.5 83.1Philippines 52.0 21.2 60.5 40.2 44.3 37.7 70.5 51.8 52.3Seychelles 85.9 81.6 87.3 91.9 115.9 35.4 63.7 50.2 47.4Iran (Islamic Rep. of) 30.1 13.3 14.5 5.1 9.5 14.4 26.2 66.2 45.8USA 45.0 39.3 36.0 34.2 51.3 48.7 47.4 49.5 45.2Côte d'Ivoire 75.2 61.2 47.2 57.4 60.3 64.4 68.6 44.8 40.5Fiji, Republic of 21.2 22.7 19.5 6.5 4.9 6.6 5.8 14.2 39.3Mexico 0.0 25.6 7.7 28.0 31.2 33.5 11.6 31.0 37.1China 3.6 8.1 4.6 12.1 8.9 11.7 34.8 22.6 30.3Italy 43.4 35.5 29.1 22.9 23.6 20.7 20.2 26.6 29.5Indonesia 1.7 2.0 0.3 3.1 1.8 11.9 12.2 22.7 27.1Madagascar 22.3 15.8 14.4 29.5 21.4 13.5 14.2 17.0 19.6France 19.7 16.0 17.8 19.9 19.2 18.9 19.2 17.7 18.4Tunisia 17.3 13.5 17.1 21.4 16.4 16.5 18.9 16.8 14.5Portugal 12.7 6.7 12.3 12.8 15.1 11.5 20.8 14.2 13.8Senegal 0.0 0.0 0.0 0.0 0.0 - 0.0 5.5 13.1Korea Rep 3.7 3.6 4.6 5.4 6.5 7.0 7.9 6.3 11.0Others 141.5 138.6 175.3 170.9 164.3 131.9 158.0 148.9 135.9Totals 1840.6 1698.9 1899.8 1938.6 1903.6 1965.7 2120.9 2169.3 2190.2
**including bonito
AN 011039. 1405.Source: Fishstat Plus - 20140502.
Yearly world imports of fresh and frozen tuna**into major importing countries, in 1 000 tonnes (cont)
* from 1990 excluding loins;
22

Country 2002 2003 2004 2005 2006 2007 2008 2009 2010 2011 2012
Ecuador 25.3 37.5 22.8 23.4 32.7 28.1 36.0 43.9 37.2 36.5 34.2PNG 0.0 0.0 0.0 0.3 1.4 0.9 0.6 1.8 2.5 5.6 8.2Thailand 2.8 6.6 3.4 5.0 4.7 8.6 7.3 16.9 12.2 16.4 7.9Mauritius 0.1 0.0 0.0 1.5 8.2 8.3 10.8 11.7 12.6 11.7 11.7El Salvador 0.0 0.5 8.7 13.2 10.9 14.8 12.4 13.1 7.6 5.8 6.2Guatemala 0.1 0.2 4.1 6.6 2.4 0.0 1.5 5.7 8.7 7.2 9.1China 0.0 0.0 0.0 0.0 0.0 0.7 2.1 4.5 5.4 6.5 4.1Indonesia 0.1 0.5 0.3 0.2 0.2 0.0 0.0 0.1 0.1 1.4 3.1Spain 0.5 0.9 1.1 1.7 1.4 1.3 1.5 0.7 0.9 1.7 2.0Solomon Is 0.0 0.0 1.1 2.1 1.9 2.1 2.2 2.2 1.9 4.3 4.5Philippines 0.0 0.1 0.1 0.6 1.6 0.2 0.1 0.1 0.1 0.1 0.2Ghana 0.5 0.8 1.4 1.9 2.0 2.9 2.9 3.4 2.7 2.8 3.2Kenya 2.5 3.0 7.5 9.2 7.0 7.9 4.8 3.2 3.7 4.2 4.3Others 32.3 36.9 25.6 25.5 19.3 18.2 14.6 13.4 14.7 10.5 8.2Total 64.1 87.2 76.0 91.4 93.7 94.0 96.6 120.7 110.1 114.9 107.0
Country 2013
Ecuador 35.8PNG 9.8Thailand 9.1Mauritius 7.7El Salvador 7.3Guatemala 7.1China 6.8Indonesia 4.3Spain 4.1Solomon Is 4.0Philippines 3.4Ghana 2.2Kenya 2.0Others 10.1Total 113.7
AN 011025. 1405.Source: EUROSTAT - 20140512.
Yearly EU imports of tuna loins, by major supplying countries, in 1 000 tonnes
23

Country 2002 2003 2004 2005 2006 2007 2008 2009 2010 2011
Ecuador 82.4 95.0 58.8 67.7 100.1 96.3 134.5 140.4 130.1 149.1PNG 0.0 0.0 0.0 1.1 4.5 3.1 2.4 6.7 8.8 21.1Mauritius 0.4 0.1 0.0 5.0 25.0 32.5 49.9 41.1 48.8 49.3Thailand 9.2 15.5 8.0 12.0 15.3 26.6 23.8 65.4 35.2 54.0Guatemala 0.4 0.4 10.4 18.9 7.7 0.0 6.4 18.9 33.2 28.9El Salvador 0.0 1.5 23.0 43.3 38.1 57.7 53.9 51.0 32.2 25.9China 0.0 0.0 0.0 0.1 0.0 2.8 6.9 15.5 15.2 22.6Solomon Is 0.0 0.0 3.5 7.3 6.6 9.2 10.2 8.6 8.1 19.3Indonesia 0.1 1.2 0.4 0.6 0.4 0.0 0.0 0.5 0.2 4.9Spain 2.0 2.7 4.3 6.0 4.8 4.8 6.6 3.5 4.3 7.4Philippines 0.0 0.2 0.1 1.8 4.3 0.8 0.5 0.1 0.1 0.2Kenya 8.8 9.4 23.2 30.4 25.3 32.3 23.4 11.2 15.5 22.4Others 113.7 114.1 79.6 85.6 72.5 74.5 72.3 63.4 70.8 55.1Total 217.0 239.9 211.4 279.7 304.7 340.5 390.7 426.4 402.5 460.3
Country 2012 2013
Ecuador 177.3 189.9PNG 40.7 49.1Mauritius 65.2 46.1Thailand 41.4 46.1Guatemala 48.4 41.4El Salvador 36.1 39.4China 17.5 32.5Solomon Is 25.5 23.7Indonesia 13.2 21.6Spain 10.2 21.2Philippines 1.4 18.1Kenya 26.4 12.9Others 56.3 65.7Total 559.4 607.8
AN 011024. 1405.Source: EUROSTAT - 20140512.
countries, in Euro millionYearly EU imports of tuna loins, by major supplying
24

Country 2000 2001 2002 2003 2004 2005 2006 2007 2008 2009 2010 2011
Ecuador 6.2 9.0 12.9 13.0 11.4 10.5 13.3 11.9 10.4 13.2 9.9 12.7Solomon Isl 0.0 0.0 0.0 0.0 1.1 2.1 1.9 2.1 2.2 2.2 1.9 3.6Mauritius 0.0 0.0 0.0 0.0 0.0 0.1 2.5 3.6 6.8 5.0 4.4 1.9Thailand 1.6 0.5 2.1 1.8 1.1 1.3 3.2 3.9 2.3 8.7 5.2 3.7Philippines 0.0 0.0 0.0 0.0 0.0 0.5 1.1 0.2 0.1 0.0 0.0 0.0Kenya 3.7 5.7 2.3 2.9 7.0 8.0 6.7 7.6 4.8 1.5 2.3 3.5China 0.0 0.0 0.0 0.0 0.0 0.0 0.0 0.7 0.7 2.5 2.2 2.5Madagascar 0.0 0.0 0.0 0.0 0.0 0.0 0.0 0.0 0.0 0.0 2.2 0.9Colombia 12.9 10.8 12.6 14.7 12.3 13.2 9.5 6.9 4.8 2.0 1.4 2.5Others 2.8 2.9 3.0 4.1 1.1 1.4 2.4 0.9 0.7 2.0 3.4 2.8Total 27.3 28.9 32.9 36.4 33.9 37.2 40.7 37.9 32.8 37.2 33.0 33.9
Country 2012 2013
Ecuador 10.5 12.1Solomon Isl 3.9 3.9Mauritius 2.6 2.8Thailand 4.8 2.7Philippines 0.2 1.8Kenya 3.1 1.7China 1.5 1.6Madagascar 0.8 1.4Colombia 1.3 1.4Others 2.2 3.9Total 30.9 33.4
AN 011068. 1405.Source: EUROSTAT/National Statistics - 20140215.
2002 2003 2004 2005 2006 2007 2008 2009 2010 2011 2012 2013
Ecuador 5.8 18.9 7.2 8.8 15.8 13.1 22.4 28.7 25.7 21.4 21.4 21.5PNG 0.0 0.0 0.0 0.0 0.0 0.2 0.2 0.5 1.7 4.5 6.6 8.7Guatemala 0.1 0.2 4.1 6.6 2.2 0.0 1.5 5.7 8.7 6.5 9.1 7.1El Salvador 0.0 0.5 8.7 13.2 10.9 14.8 12.4 13.1 7.6 5.8 6.1 6.9China 0.0 0.0 0.0 0.0 0.0 0.0 1.3 1.9 2.8 3.7 1.8 5.0Mauritius 0.0 0.0 0.0 1.4 4.4 3.1 2.1 5.5 7.5 9.6 9.0 4.8Thailand 0.2 1.1 0.6 1.7 0.0 2.9 3.5 6.6 5.6 11.2 2.5 4.6Indonesia 0.0 0.2 0.1 0.1 0.0 0.0 0.0 0.0 0.0 1.4 2.5 1.7Philippines 0.0 0.0 0.0 0.1 0.4 0.0 0.0 0.0 0.0 0.0 0.0 1.4Peru 0.0 0.0 0.0 0.1 0.1 0.1 0.7 1.0 1.2 0.8 0.5 0.4Colombia 0.2 0.1 0.1 0.1 0.3 0.4 0.7 0.6 0.4 0.2 0.4 0.4Kenya 0.1 0.1 0.5 1.2 0.2 0.0 0.0 1.7 1.3 0.8 1.2 0.2Vietnam 0.1 0.1 0.1 0.1 0.0 0.4 0.2 0.3 0.0 0.0 0.0 0.2Others 6.3 10.5 4.9 2.1 2.9 3.6 1.3 3.4 3.5 2.6 1.5 0.1Total 12.9 31.7 26.1 35.6 37.2 38.4 46.2 68.9 66.1 68.4 62.6 62.9
AN 011067. 1405.Source: EUROSTAT/National Statistics - 20140215
Yearly tuna loins imports into Italy, by origin countries, in 1 000 tonnes
Yearly tuna loins imports into Spain, by origin countries, in 1 000 tonnes
25

1985 1986 1987 1988 1989 1990 1991 1992 1993 1994 1995 1996
Skipjack 6.1 2.9 3.9 3.4 3.2 25.6 29.7 29.3 54.2 52.4 58.2 51.1Albacore 2.6 2.4 3.0 3.1 2.9 1.8 4.2 9.4 2.4 2.3 2.3 2.9Yellowfin 75.4 66.8 98.0 120.1 110.2 134.4 115.0 133.7 175.9 143.7 132.4 135.7Bluefin 4.8 5.2 5.1 5.8 6.8 7.0 6.5 4.9 7.8 10.4 13.8 12.4Bigeye 52.2 60.8 74.7 77.4 83.3 88.7 109.9 98.6 92.4 115.2 126.7 123.8Total 141.1 138.1 184.7 209.8 206.4 257.5 265.3 275.9 332.7 324.0 324.2 325.9
1997 1998 1999 2000 2001 2002 2003 2004 2005 2006 2007 2008
Skipjack 62.7 55.5 76.1 77.6 56.6 73.5 72.0 81.3 52.0 50.5 31.3 33.5Albacore 1.6 2.0 2.2 2.0 5.0 2.4 3.2 6.9 6.3 6.5 6.3 8.3Yellowfin 110.0 115.4 105.1 136.4 120.4 140.6 130.4 133.3 144.9 109.3 75.6 62.9Bluefin 16.5 18.9 15.2 18.9 20.7 20.5 23.6 27.8 23.8 22.5 21.0 17.2Bigeye 120.5 148.7 108.8 134.7 140.9 162.6 145.7 135.2 118.7 102.1 101.3 92.8Total 311.3 340.5 307.4 369.6 343.6 399.6 374.9 384.5 345.7 290.9 235.5 214.7
2009 2010 2011 2012 2013
Skipjack 53.3 59.6 42.2 30.0 21.2Albacore 8.3 8.8 23.5 18.2 15.4Yellowfin 62.9 59.6 66.2 61.4 60.2Bluefin 17.2 20.1 14.7 14.4 12.7Bigeye 92.8 92.3 85.0 74.2 92.4Total 234.5 240.4 231.6 198.2 201.9
AN 011034.1405.Source: National statistics - 20140512.
by species, in 1 000 tonnesYearly imports of fresh and frozen tuna in Japan,
26

1998 1999 2000 2001 2002 2003 2004 2005 2006 2007 2008 2009
Thailand 11.9 13.8 7.7 4.1 6.3 9.6 8.2 8.7 12.5 7.8 14.9 10.1China 0.4 0.0 0.0 0.0 0.0 0.0 0.0 0.0 0.0 1.8 0.3 0.0Fiji 4.6 3.0 3.1 11.5 10.9 11.9 14.9 14.5 12.4 11.0 10.7 12.7Colombia 0.9 4.1 3.9 0.6 0.3 0.0 0.0 0.0 0.0 0.0 0.3 1.4Mauritius 0.0 0.0 0.0 0.0 0.0 0.0 0.0 1.9 7.5 6.8 5.4 9.3Ecuador 20.7 29.0 31.9 16.2 12.9 10.9 6.9 6.5 4.0 1.2 0.9 0.1Others 1.1 1.7 0.7 0.0 5.0 11.4 14.0 15.1 14.7 15.2 12.7 15.1Total 39.6 51.6 47.3 32.4 35.4 43.8 44.0 46.7 51.1 43.8 45.2 48.7
2010 2011 2012 2013
Thailand 26.8 24.7 20.1 22.1China 0.0 6.2 11.0 14.3Fiji 14.9 4.6 10.3 11.6Colombia 5.0 6.9 13.9 9.5Mauritius 4.9 8.6 5.8 7.5Ecuador 0.1 0.9 2.7 0.7Others 13.1 10.6 2.5 4.1Total 64.8 62.5 66.3 69.8
AN 011075. 1405.Source: NMFS - 20140502.
1999 2000 2001 2002 2003 2004 2005 2006 2007 2008 2009 2010
Indonesia 1.5 1.6 2.5 2.3 2.8 3.1 3.7 2.7 9.3 8.9 11.6 12.3Philippines - - - - - 1.6 1.6 1.9 6.0 4.5 4.5 5.5Canada 1.1 1.1 1.0 1.1 3.4 2.3 1.0 0.6 1.3 2.3 1.5 1.9Korea Rep * * * * * * 2.4 1.2 0.9 2.5 1.3 0.5Japan 13.7 4.6 0.8 0.3 0.6 0.7 0.7 0.3 0.4 0.7 0.2 0.2Taiwan PC 45.4 28.5 25.0 2.6 1.1 0.0 0.0 0.0 1.6 0.1 0.3 0.5Others 19.8 20.8 15.8 11.6 11.4 3.3 1.1 2.3 6.0 7.0 7.0 7.2TOTAL 81.5 56.6 45.1 17.9 19.3 11.0 10.5 9.0 25.5 26.0 26.4 28.1
2011 2012 2013
Indonesia 9.0 9.1 9.8Philippines 3.6 4.6 3.9Canada 4.2 0.7 2.6Korea Rep 0.9 1.2 1.0Japan 0.2 0.8 0.3Taiwan PC 0.2 0.3 0.1Others 6.8 11.4 8.4TOTAL 24.9 28.1 26.1
* included under "others"
AN 011076. 1405.Source: NMFS - 20140502.
Yearly imports of frozen tuna into USA,
Yearly imports of tuna loins into USA, in 1 000 tonnes
in 1 000 tonnes
27

1999 2000 2001 2002 2003 2004 2005 2006 2007 2008 2009 2010
Trinidad & Tobago 5.9 4.8 4.1 3.7 2.4 2.5 2.9 4.6 3.4 2.0 2.0 2.3Ecuador 3.7 2.0 0.7 1.2 3.2 1.0 0.7 0.6 1.0 1.4 1.9 1.5Fiji * * * * * * 1.2 1.2 1.2 1.5 1.5 1.1Panama 0.7 1.3 1.4 1.9 2.8 2.5 1.7 1.4 2.5 1.7 1.1 1.6Viet Nam 0.8 1.5 2.4 2.7 3.1 3.3 3.3 2.1 2.2 1.5 2.6 3.6Mexico 1.8 1.2 1.0 1.1 1.7 2.1 2.1 1.4 1.5 0.9 1.1 0.9Costa Rica 0.7 0.8 1.4 2.1 1.9 2.3 1.6 1.3 0.9 0.9 1.0 0.5Brazil 0.8 1.3 2.1 2.0 1.5 1.9 1.8 1.4 0.7 0.5 0.4 0.4Others 9.3 10.2 9.9 9.7 9.0 10.8 10.6 11.2 12.4 12.3 9.3 9.4Total 23.7 23.1 23.0 24.4 25.6 26.4 25.9 25.2 25.8 22.7 20.9 21.3
2011 2012 2013
Trinidad & Tobago 2.1 2.0 1.7Ecuador 1.4 1.8 1.7Fiji 1.6 1.5 1.6Panama 1.9 1.6 1.4Viet Nam 3.0 2.4 1.3Mexico 1.2 1.3 1.3Costa Rica 0.8 1 1.1Brazil 0.2 0.3 0.5Others 8.0 9.3 11.3Total 20.2 21.2 21.9
* included under "others"
AN 010904. 1405.Source: NMFS - 20140502.
Imports of fresh tuna into the USA bycountries of origin, in 1 000 tonnes
28

Canned Tuna
Country 1979 1980 1981 1982 1983 1984 1985 1986 1987 1988 1989 1990
USA 26.7 28.7 26.5 28.8 48.0 58.5 74.3 84.1 78.8 96.2 156.1 156.7Italy 2.5 3.0 1.8 2.5 3.4 3.5 5.0 6.0 9.7 9.3 10.9 11.5UK 10.5 11.1 19.2 13.3 17.6 24.0 24.0 36.5 34.7 47.6 66.1 56.0France 23.4 24.6 27.7 29.8 34.0 32.5 36.9 35.6 46.9 54.8 48.2 53.9Spain 0.0 0.0 0.0 0.1 - 0.1 0.4 0.1 0.1 1.7 0.3 0.4Germany 15.0 15.2 13.6 14.9 16.1 19.1 19.8 25.4 31.5 28.1 32.2 39.9Japan 1.6 2.0 1.4 1.7 2.4 1.4 1.6 0.9 1.7 4.0 5.6 8.0Australia 1.5 2.9 2.3 1.2 1.4 2.6 2.6 2.5 3.5 4.2 7.1 6.8Netherlands 1.4 1.7 1.4 1.4 1.4 2.2 2.0 2.9 4.9 5.7 6.6 7.0Egypt 0.7 0.6 1.1 0.5 1.0 2.0 1.6 3.7 0.9 - - -Libya - - - - - - - 0.0 0.0 0.0 0.0 0.0Canada 9.9 8.8 9.7 7.0 10.7 11.6 11.0 17.7 23.1 20.4 25.9 16.6Saudi Arabia - - - - - - - - - - - -Argentina 0.3 0.5 0.9 0.2 - - - 0.0 0.0 0.0 0.0 0.3Colombia - - - - 1.9 1.9 2.0 1.3 1.0 1.5 0.4 1.3Thailand - - - - - - - - 0.6 0.6 1.2 0.6Chile - - - - - - - - - - - -Belgium 4.5 4.2 4.5 4.1 4.8 5.0 5.3 6.2 7.6 7.3 8.5 14.7Venezuela, Boliv Rep of 1.1 - - 1.8 - 0.0 0.0 0.0 0.0 0.0 0.0 0.0Israel - - - - - - - 0.9 0.8 2.1 3.1 3.1Portugal - - - 0.0 - - - 0.0 0.0 0.1 0.1 0.2Syrian Arab Republic - - - - - - - - - - - -Others 14.2 15.7 13.4 12.1 10.7 14.2 23.2 23.4 32.3 40.8 46.2 48.2Totals 113.2 119.1 123.5 119.4 153.4 178.7 209.8 247.4 278.1 324.4 418.5 425.2
Country 1991 1992 1993 1994 1995 1996 1997 1998 1999 2000 2001 2002
USA 195.7 178.1 136.9 131.7 133.2 127.7 135.4 163.5 212.0 176.1 165.1 199.3Italy 21.4 30.4 31.4 31.5 37.0 47.1 57.8 65.8 72.9 77.4 81.4 96.2UK 71.6 69.9 69.8 75.9 85.8 88.1 100.3 107.1 111.3 104.7 123.6 138.5France 63.2 62.9 74.3 84.8 89.0 92.7 87.1 101.1 80.0 110.1 105.2 128.9Spain 3.7 9.3 12.3 9.1 14.4 15.7 16.4 14.5 25.5 24.7 13.8 23.2Germany 46.4 44.6 38.3 48.6 45.2 54.5 46.7 53.8 69.4 78.1 69.2 85.8Japan 15.3 20.0 24.7 28.7 37.1 33.0 36.2 31.3 33.8 35.1 34.5 41.1Australia 7.8 8.1 9.2 12.3 10.6 12.1 11.1 11.3 14.5 16.8 19.6 23.8Netherlands 6.7 9.3 15.4 9.4 10.0 15.5 16.4 22.7 26.4 26.9 17.1 33.0Egypt - - - 6.6 6.4 8.1 7.0 19.7 9.9 16.0 18.9 14.4Libya - - - 2.6 2.6 3.0 1.2 2.0 2.9 3.0 3.3 3.4Canada 23.1 19.3 24.9 22.0 27.3 25.6 26.5 28.6 32.7 26.5 27.8 34.5Saudi Arabia - 3.5 3.9 2.3 6.6 7.1 7.7 7.4 8.7 7.0 11.6 11.0Argentina 1.3 1.5 3.8 5.7 13.0 12.4 15.2 13.8 16.8 17.9 19.1 4.2Colombia 1.5 2.6 5.2 9.3 10.6 11.6 12.0 9.7 4.3 6.6 6.3 13.9Thailand - - - - 0.0 0.0 0.0 0.0 0.0 0.2 0.2 0.4Chile - 4.1 3.3 3.2 5.9 5.4 7.4 7.8 4.8 5.3 6.2 7.8Belgium 13.3 15.7 9.8 11.1 15.8 12.5 12.4 15.1 16.2 12.2 12.5 14.0Venezuela, Boliv Rep of 0.0 0.0 0.3 0.5 2.6 1.1 2.5 6.6 4.7 9.3 10.9 5.8Israel 3.2 3.2 3.9 3.9 4.5 4.1 4.4 4.8 8.9 7.7 10.2 8.4Portugal 2.4 2.0 2.9 6.8 4.5 2.2 2.8 3.6 6.3 5.6 6.7 6.4Syrian Arab Republic - - - - - - - - - - - 5.1Others 52.4 58.0 65.0 86.4 79.0 83.5 97.2 99.4 104.3 122.2 142.3 149.7Totals 529.0 542.6 535.0 592.3 641.3 662.8 703.5 789.8 866.2 889.3 905.4 1049.1
Yearly world imports of canned tuna* into major importing countries in 1 000 tonnes
29

Country 2003 2004 2005 2006 2007 2008 2009 2010 2011
USA 255.1 248.2 254.5 240.7 218.2 217.6 230.8 266.7 247.8Italy 107.2 110.0 112.1 113.8 120.1 121.0 121.4 113.7 121.6UK 131.0 133.1 132.7 133.2 130.8 142.9 116.3 109.8 116.0France 119.4 117.8 118.5 120.7 115.3 109.4 110.2 102.0 112.3Spain 50.3 46.7 69.3 88.0 83.7 83.4 98.0 95.6 95.3Germany 91.9 81.9 84.2 87.4 85.4 80.8 67.7 66.2 74.0Japan 41.2 47.6 49.3 47.9 48.5 52.1 49.5 47.4 53.0Australia 31.6 54.2 33.1 34.4 35.4 41.6 35.9 42.0 44.0Netherlands 32.0 30.7 47.5 49.6 37.7 44.1 27.5 58.3 40.8Egypt 20.5 17.5 31.9 35.0 35.5 38.3 17.7 71.5 36.1Libya 2.8 2.1 6.0 9.2 11.8 13.5 21.2 38.3 34.7Canada 29.4 35.1 34.8 35.9 34.0 35.5 34.6 34.7 34.7Saudi Arabia 10.7 14.8 14.6 23.9 26.7 26.6 23.8 28.6 28.4Argentina 9.1 14.6 16.3 17.0 23.3 18.3 17.6 26.0 27.7Colombia 13.8 16.1 18.6 21.1 21.2 22.8 20.0 22.8 24.6Thailand 0.4 0.7 2.0 2.1 6.5 14.9 11.3 13.1 24.0Chile 8.8 10.1 11.5 14.2 42.3 15.9 11.8 18.1 22.9Belgium 15.0 13.5 16.1 16.6 16.0 17.0 16.9 15.9 18.1Venezuela, Boliv Rep of 1.0 8.0 8.1 10.7 16.6 28.0 36.8 22.2 15.6Israel 7.9 11.6 12.2 10.3 12.2 14.0 14.7 13.5 14.9Portugal 8.1 7.4 7.9 9.6 10.6 11.1 12.8 12.5 13.4Syrian Arab Republic 5.1 4.0 6.4 7.8 8.0 6.1 11.7 9.5 12.4Others 165.5 173.9 209.2 239.7 256.6 265.1 246.8 281.9 289.6Totals 1157.9 1199.7 1296.8 1368.7 1396.6 1420.0 1355.0 1510.0 1501.9
* Including bonito tuna
AN 011041. 1405.Source: Fishstat Plus - 20140502.
countries, in 1 000 tonnes (cont.)Yearly world imports of canned tuna* into major importing
30

Country 1979 1980 1981 1982 1983 1984 1985 1986 1987 1988 1989 1990
70.0 97.1 93.6 85.7 119.0 130.9 155.4 174.1 164.2 248.3 385.4 386.09.2 13.8 8.5 10.3 11.4 11.2 16.3 25.0 41.1 40.5 48.4 59.6
65.3 78.9 74.8 75.9 82.5 69.6 77.6 84.6 124.9 156.9 118.4 161.332.1 41.4 74.3 40.4 49.6 62.7 60.0 89.6 87.6 139.2 163.5 140.80.1 0.0 0.0 0.1 - 0.2 0.8 0.2 0.2 7.7 0.9 1.14.8 8.9 6.2 6.0 8.1 4.3 4.6 2.8 6.3 15.3 19.4 24.3
33.2 41.1 37.8 37.4 36.2 39.7 38.7 52.0 65.6 67.2 75.7 95.83.4 8.8 7.8 4.0 3.8 6.4 5.8 5.7 7.1 9.6 18.1 16.12.9 4.4 3.9 3.3 3.1 4.4 4.2 6.0 10.2 14.1 15.4 15.6
32.8 39.0 42.0 24.6 33.6 34.8 30.4 51.0 69.0 73.7 97.5 57.8- - - - - - - - - - - -- - - - 5.7 4.0 4.3 2.8 2.7 4.3 1.1 3.8
2.0 2.6 4.6 2.1 3.8 6.3 4.4 9.0 2.8 - - -2.8 - - 4.0 - 0.1 0.1 0.0 0.2 0.0 0.0 0.0
- - - - - - - - 2.2 2.5 5.1 2.212.9 14.9 16.7 12.9 13.8 12.8 13.4 18.5 22.0 22.3 25.1 45.00.4 1.6 2.9 0.5 - - - 0.0 0.1 0.0 0.1 1.1
- - - - - - - - - - - -- - - 0.0 - - - 0.1 0.1 0.3 0.3 0.7- - - - - - - 0.0 0.0 0.0 0.0 0.0- - - - - - - - - 7.6 9.4 10.5- - - - - - - 2.2 1.9 7.6 11.6 12.8
30.5 38.4 38.2 31.8 26.8 32.4 50.2 52.5 71.3 110.3 119.2 133.5
USAItalyranceUKSpainJapanGermanyAustraliaNetherlandsCanadaSaudi Arabia ColombiaEgyptVenezuela, Boliv Rep of ThailandBelgiumArgentinaChilePortugalLibyaAustriaIsraelOthersTotals 302.4 390.9 411.2 339.0 397.5 419.8 466.0 575.9 679.6 927.3 1114.9 1168.0
Country 1991 1992 1993 1994 1995 1996 1997 1998 1999 2000 2001 2002
475.9 398.7 329.0 360.4 330.9 335.0 376.9 443.7 499.9 363.8 430.9 503.696.4 126.9 120.5 131.2 163.6 203.3 243.0 300.5 266.5 232.2 258.1 341.9
151.3 159.9 180.7 220.5 350.3 344.8 319.9 393.8 230.1 252.2 264.1 328.2192.2 168.9 164.3 203.2 232.7 248.2 299.4 340.0 284.4 231.1 271.5 322.810.1 25.8 31.9 25.9 44.7 49.5 49.8 51.6 62.9 50.3 33.7 64.248.3 57.9 71.5 94.1 135.1 119.1 138.9 120.5 117.4 105.1 106.5 129.1
116.5 104.7 84.4 133.0 122.4 140.2 123.6 150.1 168.8 151.1 139.7 196.218.5 19.5 21.5 28.7 29.5 34.9 32.5 34.8 43.0 39.1 46.7 58.415.6 19.6 34.7 24.6 26.8 39.8 47.7 70.7 65.0 49.2 36.7 75.571.8 53.7 69.8 66.0 77.3 74.2 79.2 84.0 82.6 65.3 69.5 79.2
- 9.7 8.8 4.7 17.2 20.3 21.5 21.3 21.5 15.0 25.0 24.01.6 4.8 5.4 9.7 13.7 15.3 15.0 17.5 9.9 12.8 8.8 14.3
- - - 15.5 14.4 17.3 15.1 41.7 18.6 24.7 27.9 20.70.1 0.1 0.9 1.1 6.3 2.8 5.9 17.5 12.5 17.1 17.1 13.30.0 0.0 0.0 0.0 0.1 0.1 0.0 0.1 0.1 0.6 0.4 0.8
39.4 44.1 27.1 34.1 44.3 40.3 39.7 50.2 43.9 29.3 31.3 41.2
USAItalyranceUKSpainJapanGermanyAustraliaNetherlandsCanadaSaudi Arabia ColombiaEgyptVenezuela, Boliv Rep of ThailandBelgiumArgentina 3.9 4.1 10.1 16.3 37.0 33.5 41.2 37.5 40.6 34.6 36.3 8.1Chile - 11.4 8.5 8.6 15.9 14.4 16.1 17.7 13.5 12.3 15.7 16.3Portugal 8.0 6.6 8.5 17.1 16.0 8.2 9.6 13.3 19.8 14.3 17.2 20.0Libya - - - 7.4 11.4 9.2 5.3 9.5 11.2 6.3 7.2 8.0Austria 11.9 13.1 13.3 29.2 9.5 14.4 16.8 17.0 18.3 13.7 17.2 20.6Israel 11.4 11.3 12.3 12.7 14.6 13.2 14.1 17.7 27.2 23.5 26.0 26.3Others 143.7 150.9 159.6 213.1 222.2 220.3 273.3 292.6 267.0 256.7 288.4 309.4Totals 1416.6 1391.7 1362.4 1657.0 1936.0 1998.3 2184.6 2543.4 2324.6 2000.5 2175.7 2622.1
countries, in USD millionYearly world imports of canned tuna* into major importing
31

Country 2003 2004 2005 2006 2007 2008 2009 2010 2011
606.8 655.0 710.1 733.9 702.8 876.6 798.3 950.6 1038.0434.8 468.7 511.8 571.8 691.5 806.7 733.4 654.1 790.9343.8 342.9 357.9 391.6 463.0 551.8 531.5 450.9 568.2312.9 338.7 362.4 377.7 429.4 611.1 445.7 418.0 511.9135.9 141.0 225.1 307.9 346.6 422.2 411.9 403.7 462.6138.8 165.3 183.6 180.1 201.7 299.3 239.0 227.6 304.8226.5 220.5 235.5 250.4 275.0 335.9 254.5 223.3 299.674.1 77.2 98.1 103.6 130.9 182.7 147.3 165.6 211.076.1 77.5 125.2 95.1 126.1 199.5 99.8 135.5 169.775.6 91.3 95.3 103.8 106.4 137.4 125.0 127.9 140.120.0 30.2 28.4 62.8 71.4 100.0 76.4 95.8 119.117.3 23.7 36.6 32.6 51.1 89.4 75.2 91.9 109.422.9 20.2 42.1 45.0 45.9 94.8 82.9 96.0 108.9
2.4 25.6 27.3 35.5 68.0 163.5 237.0 133.6 102.70.9 1.8 5.1 5.5 20.8 61.4 33.4 41.7 98.5
46.1 46.7 53.5 60.7 69.4 89.1 81.5 68.6 88.815.4 26.0 31.6 36.9 55.5 53.3 51.7 66.9 87.918.0 21.7 26.6 34.5 38.2 52.8 38.5 61.7 87.228.0 27.7 29.2 37.1 51.0 64.5 67.0 62.4 72.54.3 3.3 12.6 24.7 20.8 29.6 28.1 60.2 71.3
21.4 25.9 28.9 32.4 40.4 56.1 51.9 43.2 65.023.3 28.4 32.8 32.7 39.7 65.0 54.4 46.3 63.5
358.5 412.5 505.8 606.5 711.4 927.0 852.0 882.5 1097.1
USAItalyranceUKSpainJapanGermanyAustraliaNetherlandsCanadaSaudi Arabia ColombiaEgyptVenezuela, Boliv Rep of ThailandBelgiumArgentinaChilePortugalLibyaAustriaIsraelOthersTotals 3003.8 3271.7 3765.6 4162.5 4757.2 6269.6 5516.6 5508.2 6668.7
* Including bonito tuna
AN 011040. 1405.
Yearly world imports of canned tuna* into major importingcountries, in USD million (cont.)
Source: Fishstat Plus - 20140502.
32

2002 2003 2004 2005 2006 2007 2008 2009 2010 2011 2012
Spain 60.2 62.2 63.5 69.1 70.4 71.6 76.0 74.6 102.8 97.2 86.1Ecuador 29.3 37.1 45.8 62.5 63.2 75.9 93.6 63.7 62.2 71.5 73.7Thailand 58.8 64.9 54.2 67.8 87.4 70.1 66.3 64.4 68.9 76.2 47.4Seychelles 57.6 52.3 54.3 57.3 60.6 47.7 42.8 42.3 41.0 43.5 43.7Mauritius 27.1 28.5 35.1 31.0 37.9 40.6 37.9 35.4 44.2 43.9 46.9Côte d'Ivoire 53.5 42.7 49.5 30.9 31.9 37.1 37.7 31.5 26.3 25.7 34.6Philippines 41.8 42.4 34.3 40.3 46.4 52.0 54.6 54.1 45.5 35.7 31.1Ghana 25.2 30.9 29.0 29.3 25.7 26.7 29.4 26.5 27.4 25.9 26.1Netherlands 28.7 27.6 26.2 33.6 32.2 27.5 34.5 17.3 16.4 16.9 19.2PNG 5.9 12.6 13.9 18.2 12.7 16.3 8.7 14.6 15.9 15.6 19.6Germany 14.6 18.0 15.4 17.3 16.1 16.9 18.1 15.9 15.3 16.8 16.4Indonesia 11.8 9.8 8.5 12.5 8.4 10.9 10.0 11.3 9.2 13.4 14.6Vietnam 2.6 2.5 1.7 3.3 6.8 8.2 8.5 7.8 7.3 8.5 9.4Italy 28.3 18.5 17.2 18.5 17.0 15.2 13.4 13.3 13.8 13.9 13.0Colombia 7.0 7.8 10.5 11.6 8.8 11.9 17.9 12.7 11.4 13.3 12.2France 26.3 23.7 22.1 18.7 14.2 14.8 15.2 12.2 6.4 5.9 6.5Madagascar 15.4 23.0 21.4 19.8 17.6 13.1 7.2 7.3 6.8 9.7 8.0UK 5.4 5.7 4.2 4.0 4.4 3.3 4.4 5.4 6.2 7.7 6.0El Salvador 0.0 0.0 0.0 0.0 0.0 0.6 1.8 2.2 2.8 3.1 3.1Portugal 4.0 3.6 3.7 4.4 3.9 4.0 2.5 2.3 2.4 3.9 3.5Belg/Lux 7.4 4.1 2.0 2.5 2.3 3.6 2.7 2.8 3.1 3.3 3.0Czech Rep 0.0 0.0 1.2 1.5 0.7 1.6 1.1 1.2 1.5 2.1 2.0Senegal 8.6 8.7 7.4 7.4 2.7 2.7 1.8 1.7 0.8 0.5 0.1Turkey 0.3 1.6 1.1 0.8 0.2 0.6 0.1 0.2 0.3 0.0 0.1Others 9.6 11.3 14.8 16.6 18.8 19.3 14.9 8.5 7.8 9.8 7.9Total 529.2 539.5 537.0 578.8 590.6 591.9 601.2 529.2 545.7 564.0 534.5
2013
Spain 86.4Ecuador 84.1Thailand 61.4Seychelles 51.4Mauritius 50.5Côte d'Ivoire 33.5Philippines 29.9Ghana 21.4Netherlands 20.9PNG 18.8Germany 16.5Indonesia 14.0Vietnam 13.2Italy 11.6Colombia 11.5France 7.8Madagascar 7.7UK 6.5El Salvador 3.7Portugal 3.7Belg/Lux 2.9Czech Rep 2.1Senegal 1.7Turkey 0.3Others 12.1Total 573.5
* = included under "Others"**Statistical codes (combined nomenclature) : 16041410, 16041411, 16041414, 16041418, 16042070AN 011072. 1405.Source: EUROSTAT – 20140510.
Total EU imports of prepared and preserved tuna* – by country of origin, in 1 000 tonnes
33

Country 2002 2003 2004 2005 2006 2007 2008 2009 2010 2011 2012
Spain 219.1 217.8 214.2 244.6 268.9 292.5 334.8 327.1 356.0 439.2 441.4Ecuador 74.4 78.9 92.3 138.7 153.5 195.9 290.2 176.4 174.5 229.5 308.8Seychelles 177.6 163.5 141.5 145.8 161.4 138.7 149.0 157.7 150.1 171.5 195.3Thailand 123.1 112.6 99.1 134.3 177.8 156.8 178.8 159.5 176.4 219.2 180.7Mauritius 70.9 59.9 67.9 70.7 93.4 104.8 127.5 104.0 130.2 144.0 199.8Côte d'Ivoire 148.3 115.7 123.7 82.6 88.0 112.8 120.9 106.5 80.8 84.4 138.6Netherlands 90.4 83.1 78.4 96.6 94.5 85.6 118.3 68.9 54.9 66.9 86.2Philippines 81.2 65.0 53.5 68.5 82.2 95.7 127.6 118.6 94.8 83.0 98.1Ghana 67.6 69.6 56.6 61.7 60.2 69.9 86.9 81.3 85.0 81.9 105.5Germany 41.4 47.3 45.6 45.9 47.7 52.9 65.7 59.8 50.1 59.5 73.6PNG 13.5 24.0 25.8 37.5 26.4 35.0 27.7 35.3 37.4 44.6 72.3Italy 62.9 47.4 52.4 58.4 66.1 67.9 70.1 70.8 69.6 75.0 76.1Colombia 18.1 18.4 25.0 31.0 25.6 33.9 56.7 41.2 38.1 47.1 54.4Indonesia 19.9 13.4 11.5 18.3 12.7 17.4 18.9 24.9 18.2 29.7 46.0Vietnam 4.2 3.5 2.4 5.3 11.0 13.5 17.5 15.8 14.2 17.8 26.8France 75.3 67.6 63.4 55.8 46.7 55.8 60.6 54.3 27.2 28.6 29.9UK 18.5 18.5 14.8 12.2 14.2 10.1 15.8 18.6 23.5 30.4 29.6Madagascar 37.2 48.1 42.9 40.1 37.4 31.5 21.6 23.2 16.1 25.2 28.1Portugal 18.5 17.8 18.3 21.2 20.6 21.8 16.9 15.7 14.7 22.6 21.2El Salvador 0.0 0.0 0.0 0.1 0.1 3.1 7.4 8.3 11.5 12.7 15.5Belg/Lux 12.2 8.0 6.9 7.9 8.5 9.4 10.6 11.8 12.2 12.0 13.8Senegal 22.5 23.8 18.9 19.0 6.7 7.2 5.7 5.1 2.5 1.6 0.5Turkey 0.8 3.3 1.8 1.7 0.5 1.5 0.4 0.6 0.5 0.1 0.4Others 27.9 28.9 35.7 42.8 57.4 64.3 47.3 33.5 33.8 42.8 42.9Total 1425.7 1336.2 1292.6 1440.6 1561.4 1677.7 1976.5 1718.8 1672.2 1969.3 2285.5
Country 2013
Spain 467.0Ecuador 375.9Seychelles 265.4Thailand 234.5Mauritius 231.2Côte d'Ivoire 150.8Netherlands 102.5Philippines 101.7Ghana 98.0Germany 79.4PNG 78.5Italy 75.5Colombia 53.9Indonesia 49.5Vietnam 42.1France 37.4UK 36.1Madagascar 33.9Portugal 23.4El Salvador 18.6Belg/Lux 16.0Senegal 7.6Turkey 1.5Others 65.6Total 2646.1
* = included under "Others"
**Statistical codes (combined nomenclature) : 16041410, 16041411, 16041414, 16041418, 16042070
AN 011070. 1405.Source: EUROSTAT – 20140510.
country of origin, in Euro millionTotal EU import of prepared and preserved tuna** – by
34

1999 2000 2001 2002 2003 2004 2005 2006 2007 2008 2009
Germany 2.8 2.8 2.2 2.5 2.6 2.4 2.6 2.6 2.4 2.5 2.1Ecuador 0.8 0.9 0.5 1.7 1.2 0.6 1.4 0.5 0.5 0.9 0.8France 3.1 1.5 1.7 3.5 3.6 4.4 3.9 4.8 3.7 3.2 2.4Mauritius 0.1 0.1 0.5 0.3 0.8 0.5 0.3 0.3 0.4 0.7 0.5Philippines 0.9 0.2 0.1 0.4 0.7 0.2 0.6 0.9 0.9 1.6 2.4Netherlands 1.2 1.0 1.4 1.4 1.4 1.3 2.1 1.9 1.7 2.3 1.9Spain 0.8 0.5 0.4 0.4 0.5 0.4 0.5 0.7 0.7 1.0 1.1Thailand 0.2 0.2 0.2 0.2 0.3 0.2 0.2 0.2 0.4 0.5 0.4Italy 1.1 1.1 1.1 1.2 1.4 1.7 1.6 1.3 1.7 1.1 1.3Cote d Ivoire 0.1 0.0 0.0 0.0 0.0 0.0 0.0 0.0 0.1 0.1 0.2PNG 0.0 0.0 0.0 0.0 0.1 0.0 0.0 0.0 0.8 0.2 0.2Others 4.5 3.6 4.2 2.3 1.8 1.6 2.0 1.8 1.2 1.2 2.1Total 15.6 12.0 12.4 13.9 14.4 13.3 15.1 15.0 14.5 15.3 15.3
2010 2011 2012 2013
Germany 1.9 2.1 2.3 2.5Ecuador 0.8 1.3 2.6 2.5France 2.0 1.9 2.3 2.2Mauritius 0.4 0.7 2.4 2.0Philippines 2.0 0.9 0.7 1.6Netherlands 1.4 1.4 1.8 1.6Spain 1.5 1.8 1.2 1.0Thailand 0.6 1.4 0.9 0.9Italy 1.1 1.5 0.6 0.5Cote d Ivoire 0.2 0.8 0.4 0.5PNG 0.4 0.1 0.7 0.5Others 1.7 2.2 1.8 1.5Total 14.0 16.1 17.5 17.4* Included under "Others".**Statistical codes (combined nomenclature) : 16041410, 16041411, 16041414, 16041418, 16042070
AN 011065. 1405.Source: EUROSTAT – 20140505.
Belgian canned tuna imports in 1 000 tonnes
35

Country 2000 2001 2002 2003 2004 2005 2006 2007 2008 2009 2010
31.7 33.1 33.1 35.0 36.1 37.3 36.9 40.6 40.0 38.1 41.64.8 5.9 9.2 10.0 13.9 8.9 9.1 10.0 9.1 10.6 7.45.0 7.2 6.8 7.7 4.6 6.9 6.8 3.9 5.6 6.4 7.10.1 0.0 0.0 0.0 0.2 0.4 0.3 1.7 2.1 3.5 4.00.2 0.6 2.2 3.8 6.4 7.0 5.0 6.5 10.5 8.9 8.00.0 0.0 0.0 0.0 0.0 0.0 0.2 1.9 3.4 4.2 4.62.2 2.2 2.6 2.7 2.6 2.8 2.6 2.4 2.1 1.8 1.80.0 0.0 0.8 0.4 0.2 0.4 1.2 1.4 3.2 2.2 2.60.4 0.5 0.4 0.2 0.1 0.2 0.2 0.1 0.0 0.0 0.00.0 0.0 0.0 0.0 0.0 0.0 0.0 0.4 0.3 0.4 0.70.0 0.0 0.0 0.0 0.0 0.2 0.4 0.1 0.0 0.0 0.01.2 0.5 0.5 0.6 0.3 0.3 0.1 0.0 0.0 0.0 0.02.4 2.0 5.5 9.0 9.4 7.9 7.0 8.6 8.0 7.3 2.4
SpainCote d IvoireSeychellesEcuadorColombiaMauritiusPortugal Thailand Ghana El SalvadorPapua New GuineaSenegalOthersTotal 48.0 52.0 61.0 69.4 73.9 72.4 69.7 77.6 84.2 83.5 80.3
Country 2011 2012 2013
45.8 41.9 37.17.1 9.6 8.56.2 7.1 8.44.0 5.4 7.39.7 8.9 7.35.1 5.1 5.02.1 1.9 2.13.1 1.7 1.80.1 0.6 1.50.8 0.8 1.20.4 0.1 0.70.0 0.0 0.43.1 2.3 2.1
SpainCote d IvoireSeychellesEcuadorColombiaMauritiusPortugal Thailand Ghana El SalvadorPapua New GuineaSenegalOthersTotal 87.5 85.3 83.5
AN 011059. 1405.Source: National statistics - 20140512.
by origin countries, in 1 000 tonnesCanned tuna imports into Italy,
36

U.S. pack* Imports* Total* Exports* Total Supply*
1989 686.27 348.21 1034.48 6.501990 580.60 284.59 865.19 9.04 856.161991 592.79 351.74 944.53 11.31 933.221992 608.98 323.41 932.39 10.14 922.251993 618.74 224.42 843.16 8.53 834.631994 609.51 249.04 858.56 8.39 850.171995 666.58 215.37 881.95 7.39 874.561996 675.82 193.04 868.85 9.87 858.991997 627.03 212.17 839.20 9.97 829.241998 680.85 240.41 921.26 9.32 911.941999 693.82 334.54 7.95 1020.412000 671.34 312.97 984.30 4.18 980.132001 507.41 292.20 799.62 3.52 796.102002 546.97 378.14 925.11 3.59 921.522003 529.31 459.03 988.34 6.26 982.082004 434.12 443.30 877.42 3.12 874.302005 446.10 452.07 898.17 3.01 895.162006 444.74 419.95 864.69 6.44 858.242007 436.30 378.46 814.75 3.13 811.632008 473.94 377.78 851.72 3.74 847.982009 369.23 397.98 767.21 4.97 762.242010 395.45 442.40 837.80 3.95 833.902011 384.91 412.70 797.60 4.20 793.392012 387.00 353.80 740.80 5.80 734.97
AN 011057.1405.Source: FISHERIES OF THE UNITED STATES/NMFS/GLOBEFISH HIGHLIGHTS -20140512.
1028.35
U.S. supply of canned tuna (canned weight)
1027.98
* in thousand pounds.
37

Country 2005 2006 2007 2008 2009 2010 2011 2012 2013
14.6 15.8 21.2 29.4 16.2 8.9 16.4 10.0 15.320.3 23.4 24.1 18.5 19.9 17.3 15.5 14.0 13.29.6 4.4 5.7 6.1 6.8 11.3 8.7 12.2 9.61.2 2.8 3.9 3.4 4.0 3.3 5.4 6.1 8.70.1 0.2 0.3 0.3 4.3 6.3 7.7 5.6 5.30.9 0.9 0.6 0.8 0.5 0.7 0.6 5.0 5.0
11.5 18.2 11.9 8.2 4.3 4.1 3.2 3.2 4.77.0 6.0 8.1 6.8 8.2 6.7 8.1 5.6 4.00.0 0.0 0.0 0.6 1.0 0.0 0.7 1.4 2.71.5 1.6 1.7 1.3 1.0 0.9 1.2 1.5 2.00.0 0.0 0.0 0.0 0.0 0.0 0.0 0.0 1.50.0 0.0 0.0 0.0 0.0 1.1 1.9 1.1 0.73.5 2.0 0.4 0.0 0.0 0.9 1.5 0.3 0.6
13.5 11.6 7.2 6.5 3.3 5.3 3.2 2.8 1.4
EcuadorPhilippines Papua New Guinea Vietnam Netherlands Spain Thailand Indonesia Cote d Ivoire Italy Peru United Kingdom Madagascar OthersTotal 83.8 86.9 85.1 81.8 69.6 66.8 73.9 68.7 74.7
AN 011056. 1405.Source: National Statistics - 20140512.
Canned tuna imports intoGermany, in 1 000 tonnes
38

Country 1999 2000 2001 2002 2003 2004 2005 2006 2007 2008 2009
Mauritius 11.6 15.4 22.5 23.4 23.2 28.4 25.0 26.2 27.9 26.9 23.0Thailand 17.4 13.7 16.9 17.6 18.2 13.2 16.0 19.4 14.9 14.8 17.2Seychelles 17.5 17.7 23.3 29.4 23.9 29.5 28.7 32.1 24.4 18.9 19.7Ghana 15.3 13.9 19.6 19.1 23.0 22.1 20.2 17.0 18.5 22.6 19.3Philippines 12.1 7.5 6.0 8.5 7.7 6.6 9.6 10.8 13.7 20.5 16.5Ecuador 5.0 5.4 8.6 5.9 6.3 9.6 6.5 6.8 8.2 19.1 7.4Spain 4.4 5.7 9.5 5.9 3.3 3.3 2.6 1.7 1.4 3.3 2.2Indonesia 5.1 6.4 4.7 6.8 4.3 3.1 2.8 1.1 1.4 1.3 0.7PNG 0.0 0.0 0.1 0.4 2.6 2.3 5.1 5.3 4.9 0.9 2.4France 2.3 1.7 1.3 2.2 0.7 1.3 1.3 1.7 3.0 4.0 2.7Portugal 0.9 0.7 0.6 0.5 0.2 0.5 1.0 0.9 1.0 0.2 0.2Maldives 1.7 2.9 2.7 3.4 3.4 4.1 4.5 2.0 2.3 1.1 1.0Cote d Ivoire 2.2 0.6 0.3 0.1 0.7 0.1 0.0 0.0 0.0 0.0 0.0Ireland 0.3 0.4 0.3 0.4 0.5 0.4 0.4 0.2 0.6 2.2 0.6Others 12.6 11.9 7.9 13.1 12.1 7.9 8.8 6.9 8.2 8.2 3.1World 108.2 104.0 124.4 136.7 130.1 132.4 132.6 132.0 130.5 144.0 116.1
Country 2010 2011 2012 2013
Mauritius 28.6 22.9 23.5 24.2Thailand 14.2 21.9 11.7 18.0Seychelles 14.5 15.9 13.3 15.6Ghana 18.6 14.8 15.1 12.7Philippines 14.4 10.2 11.5 11.3Ecuador 4.0 12.2 12.1 10.3Spain 3.7 7.0 6.3 7.7Indonesia 1.3 2.5 6.1 7.5PNG 1.3 2.8 3.2 3.4France 2.3 1.4 1.7 2.8Portugal 0.3 1.4 1.0 1.2Maldives 1.2 0.5 0.9 0.9Cote d Ivoire 0.0 0.1 0.4 0.7Ireland 0.1 0.1 0.2 0.5Others 3.1 3.3 2.2 2.3World 107.8 117.0 109.2 119.0
AN 011050. 1405Source: National Statistics - 20140512.
Yearly canned tuna imports into UK, by countries of origin, in 1 000 tonnes
39

Year Quota Over_Quota Total_Imports1971 77296 - 556381972 78532 - 544741973 109809 - 369731974 112176 - 527461975 120740 - 516711976 98125 - 588931977 111246 - 346311978 101407 - 517811979 125813 - 537031980 109074 - 635531981 104355 - 708511982 109742 - 875791983 91904 30425 1223291984 89699 75600 1653001985 97496 114659 2121551986 81092 152892 2339841987 91539 122932 2144711988 85185 192844 2780291989 76734 232994 3097261990 87157 168533 2556901991 75092 235790 3108821992 73724 259740 3334641993 72681 144287 2169681994 73294 168225 2415191995 73367 126176 1995431996 80027 117205 1972321997 78620 139714 2183351998 67317 176648 2439651999 72086 249016 3211022000 62403 245211 3076142001 65155 220528 2856832002 39947 323042 3629902003 41398 501655 5430532004 50472 377161 4276332005 41965 447133 4890972006 42954 367258 4102122007 41178 300412 3415902008 38951 303915 3428662009 40690 329200 3698902010 36043 370796 4068392011 40011 345514 3855252012 36667 452483 489150
AN 011043.1405.Source: NMFS - 20140512.
oil to USA, in 1 000 lbsYearly quota and cumulative imports of canned tuna not in
40

Country 2002 2003 2004 2005 2006 2007 2008 2009 2010 2011 2012 2013
Thailand 3.9 16.1 19.2 19.7 18.6 16.5 19.3 22.0 21.7 18.9 20.0 19.3Ecuador 12.5 21.3 10.9 13.6 15.6 10.8 13.5 11.3 13.3 12.2 13.0 15.3Others 2.2 3.3 2.2 2.7 3.8 3.8 5.9 5.2 6.1 5.5 3.3 4.1Total 18.6 40.7 32.3 36.0 38.0 31.1 38.7 38.5 41.1 36.6 36.3 38.7
AN 011074. .1404.Source: FISHERY MARKET NEWS REPORT/NMFS (Y) - 20140420.
Yearly imports of canned tuna into France, in 1 000 tonnes
Country 1999 2000 2001 2002 2003 2004 2005 2006 2007 2008 2009 2010
Seychelles 4.3 8.4 8.4 11.0 12.6 14.7 11.3 14.7 13.6 12.3 12.8 13.3Côte d'Ivoire 31.1 41.5 33.5 41.0 30.3 33.7 21.6 22.9 27.0 28.0 19.8 18.6Spain 9.8 17.7 15.2 16.9 16.8 18.7 21.9 22.2 19.9 20.6 18.2 21.4Ecuador 3.3 2.0 2.7 3.1 4.7 4.2 7.2 9.1 10.2 9.8 12.4 12.0Mauritius 0.2 0.2 2.6 1.0 1.4 1.6 1.6 1.8 2.0 1.5 2.1 1.5Ghana 3.6 4.4 5.3 3.6 5.3 5.1 6.5 5.1 5.2 5.3 5.8 7.7Madagascar 4.9 7.3 9.3 10.0 14.4 12.9 14.7 15.4 11.0 7.5 8.2 5.5Thailand 0.2 0.1 0.3 1.0 1.2 1.9 6.7 8.9 6.1 5.1 9.6 7.6Belgium 0.3 0.3 0.3 0.4 0.5 0.7 1.3 1.2 1.2 1.3 1.6 1.8PNG 1.4 1.2 0.3 0.1 0.0 0.0 0.0 0.1 0.4 0.1 1.1 0.8Netherlands 0.4 0.1 0.2 1.3 0.7 1.1 0.8 0.7 0.8 0.8 0.5 0.3Senegal 5.0 4.2 4.9 6.3 6.8 5.0 4.3 1.1 1.7 1.3 1.8 0.8Portugal 1.6 2.0 1.5 0.4 0.2 0.1 0.1 0.1 0.3 0.1 0.1 0.1Italy 0.0 2.5 3.6 21.0 9.2 7.3 8.0 6.1 3.5 2.4 0.3 0.2Others 3.9 4.8 3.0 3.1 3.3 0.3 1.8 2.3 3.7 4.7 7.1 3.8Total 70.0 96.6 91.0 120.1 107.3 107.2 108.1 111.5 106.5 100.8 101.5 95.1
Country 2011 2012 2013
Seychelles 17.2 21.2 24.0Côte d'Ivoire 15.3 21.7 20.8Spain 25.9 16.4 18.2Ecuador 13.6 11.6 12.6Mauritius 2.9 4.8 6.3Ghana 8.2 6.2 5.9Madagascar 7.1 5.6 5.9Thailand 9.4 4.7 5.7Belgium 1.7 1.6 1.8PNG 0.2 0.8 1.6Netherlands 0.5 0.4 1.4Senegal 0.2 0.1 1.0Portugal 0.2 0.2 0.2Italy 0.1 0.1 0.1Others 3.2 2.1 1.7Total 105.8 97.6 107.2
AN 011030.1404.Source: NATIONAL STATISTICS - 20140420
Yearly imports, tuna pouches USA, in 1 000 tonnes
41

Country 1999 2000 2001 2002 2003 2004 2005 2006 2007 2008 2009
1.4 3.1 2.3 6.2 5.5 6.7 15.5 9.9 15.3 22.0 7.81.3 0.3 0.7 1.5 1.6 2.0 1.3 1.2 1.3 1.2 1.30.4 0.5 1.3 1.8 2.3 1.6 4.5 5.8 4.8 3.7 3.33.9 5.5 1.3 3.7 1.9 1.0 2.6 3.2 2.6 4.7 4.20.4 0.7 0.5 0.3 0.6 2.9 2.9 1.4 4.4 2.6 3.20.2 0.3 0.4 0.8 3.1 2.9 3.5 1.9 1.3 1.5 1.70.2 0.1 0.9 2.7 1.3 0.5 0.1 0.0 0.0 0.0 0.03.9 3.4 0.4 0.8 1.5 0.4 0.6 0.8 0.6 0.8 0.10.7 0.0 1.3 3.6 5.0 3.1 2.9 0.9 1.0 0.0 0.00.0 0.0 0.0 0.1 0.2 0.1 0.1 0.2 0.2 0.4 0.44.5 9.3 2.3 8.4 6.1 5.7 8.8 5.1 2.6 4.6 1.81.8 1.4 1.3 1.3 0.8 0.7 1.1 0.5 0.6 0.7 0.97.6 3.2 2.5 2.8 2.9 3.7 4.2 2.9 4.0 2.0 2.7
EcuadorMauritius Thailand Philippines Papua New Guinea Germany Cote d Ivoire Ghana Madagascar Vietnam Seychelles Indonesia OthersTotal 26.4 27.9 15.2 33.8 32.9 31.2 47.9 33.8 38.7 44.2 27.2
Country 2010 2011 2012 2013
16.4 10.4 13.4 15.72.2 4.4 3.6 5.39.0 7.1 2.5 4.82.7 3.0 2.0 2.22.1 3.2 2.5 2.11.5 2.3 2.1 2.10.0 1.4 1.7 2.00.2 2.2 2.9 1.30.0 0.0 1.1 1.00.3 0.4 0.2 0.82.8 2.0 0.6 0.80.3 0.8 0.2 0.7
20.6 3.4 2.0 2.4
EcuadorMauritius Thailand Philippines Papua New Guinea Germany Cote d Ivoire Ghana Madagascar Vietnam Seychelles Indonesia OthersTotal 58.1 40.6 34.8 41.2
AN 011026.1405.Source: EUROSTAT - 20140515.
countries of origin, in 1 000 tonnesYearly imports of canned tuna into the Netherlands by
42
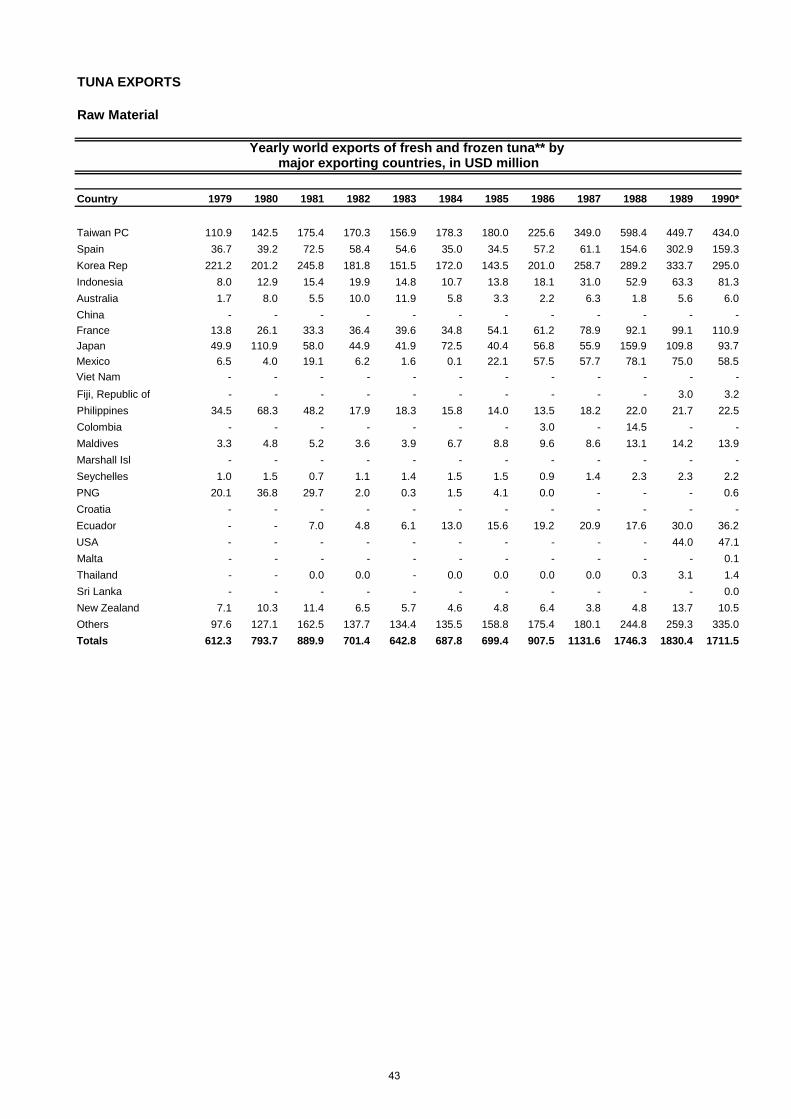
Country 1979 1980 1981 1982 1983 1984 1985 1986 1987 1988 1989 1990*
Taiwan PC 110.9 142.5 175.4 170.3 156.9 178.3 180.0 225.6 349.0 598.4 449.7 434.0Spain 36.7 39.2 72.5 58.4 54.6 35.0 34.5 57.2 61.1 154.6 302.9 159.3Korea Rep 221.2 201.2 245.8 181.8 151.5 172.0 143.5 201.0 258.7 289.2 333.7 295.0Indonesia 8.0 12.9 15.4 19.9 14.8 10.7 13.8 18.1 31.0 52.9 63.3 81.3Australia 1.7 8.0 5.5 10.0 11.9 5.8 3.3 2.2 6.3 1.8 5.6 6.0China - - - - - - - - - - - -France 13.8 26.1 33.3 36.4 39.6 34.8 54.1 61.2 78.9 92.1 99.1 110.9Japan 49.9 110.9 58.0 44.9 41.9 72.5 40.4 56.8 55.9 159.9 109.8 93.7Mexico 6.5 4.0 19.1 6.2 1.6 0.1 22.1 57.5 57.7 78.1 75.0 58.5Viet Nam - - - - - - - - - - - -Fiji, Republic of - - - - - - - - - - 3.0 3.2Philippines 34.5 68.3 48.2 17.9 18.3 15.8 14.0 13.5 18.2 22.0 21.7 22.5Colombia - - - - - - - 3.0 - 14.5 - -Maldives 3.3 4.8 5.2 3.6 3.9 6.7 8.8 9.6 8.6 13.1 14.2 13.9Marshall Isl - - - - - - - - - - - -Seychelles 1.0 1.5 0.7 1.1 1.4 1.5 1.5 0.9 1.4 2.3 2.3 2.2PNG 20.1 36.8 29.7 2.0 0.3 1.5 4.1 0.0 - - - 0.6Croatia - - - - - - - - - - - -Ecuador - - 7.0 4.8 6.1 13.0 15.6 19.2 20.9 17.6 30.0 36.2USA - - - - - - - - - - 44.0 47.1Malta - - - - - - - - - - - 0.1Thailand - - 0.0 0.0 - 0.0 0.0 0.0 0.0 0.3 3.1 1.4Sri Lanka - - - - - - - - - - - 0.0New Zealand 7.1 10.3 11.4 6.5 5.7 4.6 4.8 6.4 3.8 4.8 13.7 10.5Others 97.6 127.1 162.5 137.7 134.4 135.5 158.8 175.4 180.1 244.8 259.3 335.0Totals 612.3 793.7 889.9 701.4 642.8 687.8 699.4 907.5 1131.6 1746.3 1830.4 1711.5
Raw Material
TUNA EXPORTS
Yearly world exports of fresh and frozen tuna** by major exporting countries, in USD million
43

Country 1991 1992 1993 1994 1995 1996 1997 1998 1999 2000 2001 2002
Taiwan PC 343.2 636.8 1123.2 936.8 978.3 1063.9 1145.4 1044.3 1180.6 1132.0 1206.8 1038.9Spain 121.9 74.3 100.0 154.4 170.4 159.6 236.0 199.4 260.2 250.5 321.4 282.0Korea Rep 313.0 327.3 301.3 271.6 281.9 312.2 306.4 285.1 293.4 297.6 253.3 270.6Indonesia 106.7 113.9 167.3 123.0 139.8 113.4 119.2 111.0 106.9 136.1 134.9 126.4Australia 4.3 6.4 7.6 25.1 21.7 36.8 53.1 69.7 114.6 176.1 181.6 191.9China - 1.0 0.4 1.6 1.3 0.8 1.8 2.7 1.2 0.6 2.1 4.6France 103.5 103.7 150.9 171.1 171.6 151.1 159.0 151.7 121.5 104.2 143.8 152.0Japan 125.0 137.7 139.2 118.7 122.9 90.2 167.2 171.8 119.4 107.8 108.5 88.4Mexico 37.1 28.8 32.1 27.1 56.7 35.0 48.2 41.7 31.2 18.8 24.2 33.6Viet Nam - - - - - - 6.2 14.1 18.5 23.0 25.6 32.0Fiji, Republic of 0.7 0.0 0.2 0.6 4.0 10.9 8.8 7.8 4.0 20.8 18.5 18.5Philippines 10.8 8.1 28.5 30.2 43.0 31.8 30.3 70.2 51.5 53.8 45.0 44.5Colombia - - 39.3 51.4 52.6 54.4 56.1 68.0 47.3 49.1 46.4 43.0Maldives 7.5 3.4 7.4 6.7 3.0 16.1 22.4 23.1 13.6 9.9 12.5 27.4PNG 0.5 0.5 0.1 0.5 - 1.6 - 6.6 - 12.3 24.7 31.3Croatia - 0.0 0.1 0.5 0.3 0.4 2.5 6.3 5.2 18.2 33.6 44.9Ecuador 28.9 28.4 19.3 75.2 54.7 49.9 51.4 50.6 40.3 18.4 19.3 15.0USA 41.6 35.8 34.7 48.9 44.1 38.3 34.5 37.6 27.5 26.1 36.7 37.7Malta 0.3 0.4 1.0 4.4 0.4 0.7 0.9 0.4 0.4 2.7 9.1 37.7Thailand 2.2 5.6 1.1 3.1 5.6 12.9 10.9 18.0 24.1 10.6 14.4 10.6Sri Lanka 1.0 1.6 2.5 0.2 0.7 2.3 4.4 2.7 3.7 12.7 14.6 9.5New Zealand 9.6 7.8 7.4 17.4 23.2 16.8 13.2 17.8 17.1 19.9 20.2 19.2Others 321.3 340.7 359.6 349.3 372.5 358.8 411.4 401.2 409.7 446.6 474.4 511.3Totals 1578.9 1862.3 2523.1 2417.8 2548.7 2557.7 2889.3 2801.9 2891.6 2947.7 3171.9 3070.9
Country 2003 2004 2005 2006 2007 2008 2009 2010 2011
Taiwan PC 711.9 1127.1 965.0 850.3 939.3 874.3 891.2 1067.4 1232.4Spain 246.2 341.6 294.3 339.4 376.5 464.7 322.6 316.9 448.1Korea Rep 219.9 245.7 221.7 223.1 263.2 269.6 284.6 344.6 365.8Indonesia 111.9 125.5 117.7 120.8 152.4 172.8 162.1 197.1 219.5Australia 176.2 132.3 135.4 130.9 166.6 133.2 107.9 123.0 171.3China 3.6 1.4 4.3 10.0 23.6 20.3 33.9 100.7 168.4France 185.0 202.2 171.7 186.3 173.0 300.3 154.8 154.3 164.4Japan 114.7 125.8 148.2 129.3 193.9 195.9 127.5 155.8 161.9Mexico 103.0 64.7 68.0 55.5 74.5 65.5 45.8 73.7 146.3Viet Nam 27.7 30.7 26.8 43.4 42.4 30.6 46.1 91.3 110.9Fiji, Republic of 26.0 32.1 34.9 41.0 42.2 56.3 47.5 66.7 106.6Philippines 40.9 36.4 32.8 46.8 79.4 102.1 74.3 104.1 82.6Colombia 37.2 52.7 54.1 46.0 68.4 93.6 86.2 62.7 82.3Maldives 42.0 56.1 67.1 101.3 79.3 97.6 46.6 42.3 81.4PNG 53.3 43.8 - - - - 81.1 - 69.1Croatia 72.2 54.5 36.0 90.0 64.8 56.5 60.2 42.8 67.7Ecuador 16.4 7.8 8.7 7.5 12.4 32.3 55.3 56.6 67.6USA 65.4 74.9 72.6 33.9 59.3 60.9 66.1 70.4 65.0Malta 31.4 11.2 6.8 61.6 44.2 87.7 11.2 78.2 60.1Thailand 15.1 24.4 25.5 36.6 51.1 57.2 52.7 33.6 47.2Sri Lanka 9.5 12.9 20.5 26.8 54.0 52.9 48.4 46.5 46.3New Zealand 18.7 23.7 18.7 18.1 21.8 26.9 22.2 26.9 44.0Others 640.1 758.0 826.4 784.8 923.5 1063.9 807.3 781.2 880.7Totals 2968.4 3585.5 3357.2 3383.2 3905.9 4315.1 3635.5 4036.9 4889.6
**including bonito
AN 010976. 1405.Source: Fishstat Plus - 20140512.
Yearly world exports of fresh and frozen tuna by
* from 1990 excluding loins;
major exporting countries, in USD million (cont.)
44

Country 1979 1980 1981 1982 1983 1984 1985 1986 1987 1988 1989 1990*
Taiwan PC 75.9 76.5 74.9 87.9 87.5 87.3 95.6 126.3 172.6 259.9 179.0 217.6Spain 26.8 21.0 45.0 53.4 45.6 26.6 29.5 52.6 38.5 112.7 122.2 111.8Korea Rep 151.8 117.6 107.1 81.1 187.1 87.6 82.0 182.4 143.2 144.1 148.5 150.8France 13.8 17.2 23.4 36.9 45.8 36.5 62.1 84.0 82.5 78.5 114.6 104.9Indonesia 9.8 11.1 14.0 18.8 20.3 14.7 17.9 24.2 34.0 40.8 36.1 54.1Japan 59.4 91.2 46.3 40.8 56.1 89.1 48.2 70.0 47.5 137.9 85.0 69.8China - - - - - - - - - - - -Colombia - - - - - 0.7 0.8 1.7 2.0 13.5 25.5 28.4Ecuador - - 6.4 5.5 8.2 21.8 25.7 30.7 27.3 19.1 35.5 40.0Viet Nam - - - - - - - - - - - -PNG 27.3 33.1 29.8 2.7 0.5 2.5 8.4 0.0 - - - 0.7Fiji, Republic of - - - - - - - - - - 2.0 2.0Mexico 6.8 3.8 9.5 5.8 1.6 0.1 29.1 65.6 72.1 77.1 87.4 61.2Maldives 12.6 14.1 13.8 9.8 7.9 13.8 17.1 17.8 13.7 19.7 19.7 17.1India - - - - - - - 0.3 0.1 0.2 0.2 0.0USA - - - - - - - - - - 8.6 9.2Thailand - - 0.0 0.0 - 0.1 0.2 0.0 0.0 0.1 2.8 1.5Philippines 35.5 48.7 35.5 14.9 14.2 12.6 11.9 9.2 11.3 10.3 9.6 10.4New Zealand 9.0 9.0 9.5 4.3 6.9 4.9 4.0 6.6 5.0 4.7 10.0 7.6Others 65.8 74.3 98.4 103.5 111.2 98.6 139.8 138.3 123.0 135.3 150.6 201.9Total 526.2 548.0 542.6 485.1 617.0 534.6 600.3 849.6 799.6 1090.2 1065.8 1106.6
Country 1991 1992 1993 1994 1995 1996 1997 1998 1999 2000 2001 2002
Taiwan PC 174.9 290.8 387.6 359.8 350.9 357.5 341.5 449.0 392.6 424.9 431.9 487.5Spain 116.9 57.5 81.9 118.4 117.2 104.2 157.7 93.7 142.3 140.9 169.7 144.7Korea Rep 197.1 189.9 131.5 109.1 120.3 101.6 111.1 151.6 89.2 99.8 85.6 96.3France 121.7 147.6 181.7 163.5 151.6 139.5 135.6 107.2 121.6 143.9 159.1 128.1Indonesia 62.3 54.4 69.7 55.5 57.2 51.0 58.9 64.4 54.3 48.2 49.0 54.5Japan 119.0 101.0 101.9 66.8 81.3 51.0 100.9 115.2 53.3 37.0 53.0 60.4China - 0.4 0.2 1.6 0.6 0.4 3.0 5.5 3.7 1.8 5.9 10.2Colombia 29.2 - 43.8 52.4 52.2 53.2 47.6 51.7 56.7 65.7 55.2 47.5Ecuador 22.3 14.7 13.3 32.8 28.1 22.5 23.7 17.9 32.0 12.8 19.7 10.3Viet Nam - - - - - - 2.9 6.8 6.4 5.9 8.7 13.5PNG 0.8 0.9 0.3 - - 0.2 - 2.2 - - 12.9 9.0Fiji, Republic of 0.8 0.0 0.1 0.5 3.6 4.4 6.6 4.4 2.2 8.4 7.6 9.8Mexico 45.8 26.2 26.2 8.9 57.1 39.5 40.6 31.5 34.1 10.2 19.3 19.9Maldives 10.1 5.5 9.9 7.4 3.1 14.4 16.2 15.0 21.7 13.9 14.5 31.2India 0.1 0.0 0.6 0.9 0.0 0.0 0.0 0.0 0.0 0.1 0.5 1.8USA 8.1 9.1 9.8 12.9 13.1 14.2 10.9 15.4 10.0 7.6 13.9 15.3Thailand 2.5 7.0 1.1 1.1 2.2 4.9 4.5 12.8 14.7 7.2 8.5 6.0Philippines 5.1 3.2 16.5 20.3 21.6 17.1 22.0 48.0 41.1 44.7 23.2 22.5New Zealand 8.9 4.2 4.1 8.0 8.6 9.6 9.6 11.7 8.9 15.2 8.9 8.4Others 168.4 199.7 198.5 205.5 194.8 178.4 195.7 207.5 227.9 271.9 276.6 290.4Total 1151.6 1153.4 1294.5 1248.9 1302.0 1186.1 1315.7 1448.7 1337.0 1360.1 1423.7 1467.4
major exporting countries, in 1 000 tonnesYearly world exports of fresh and frozen tuna** by
45

Country 2003 2004 2005 2006 2007 2008 2009 2010 2011
Taiwan PC 421.9 416.1 394.7 358.1 387.7 325.3 328.3 350.7 347.3Spain 171.6 188.7 184.9 184.3 169.1 174.7 196.9 184.0 207.2Korea Rep 90.1 78.7 90.9 99.3 109.9 110.0 172.8 329.6 140.8France 189.3 175.6 134.9 126.3 84.7 144.9 96.5 81.6 74.8Indonesia 70.2 45.9 40.9 44.7 68.9 83.2 76.4 67.7 71.8Japan 99.9 59.0 104.8 77.9 103.4 82.5 52.7 79.8 69.4China 6.4 2.4 3.5 12.5 28.1 15.6 22.8 37.6 56.8Colombia 40.3 52.0 50.5 41.2 47.5 63.6 54.5 38.3 48.9Ecuador 5.6 7.0 7.1 4.4 4.7 11.2 32.6 40.8 45.7Viet Nam - 9.9 9.0 14.6 14.0 9.8 12.2 37.7 42.2PNG 28.1 24.2 - - - - 26.0 - 37.2Fiji, Republic of 13.0 15.9 18.1 20.1 24.9 29.9 19.5 30.5 34.8Mexico 39.2 5.8 14.4 6.0 19.5 14.0 9.0 24.5 31.3Maldives 52.1 57.9 63.6 95.0 53.8 55.8 30.1 24.7 30.6India 3.4 6.8 10.8 17.9 29.6 24.9 19.4 13.7 20.2USA 20.2 18.8 13.8 12.1 17.8 18.1 19.9 19.1 19.0Thailand 9.2 14.2 13.1 22.2 29.6 32.6 33.4 17.9 18.9Philippines 27.2 23.3 13.7 20.0 24.5 29.3 20.1 29.6 18.8New Zealand 10.2 15.0 12.0 10.8 13.2 14.3 8.0 13.9 18.0Others 400.2 390.6 412.9 389.3 405.5 366.4 347.1 392.0 352.3Total 1698.4 1607.7 1593.6 1556.8 1647.5 1606.1 1578.4 1813.6 1686.0
**including bonito
AN 010976. 1405.Source: Fishstat Plus - 20140512.
* from 1990 excluding loins;
Yearly world exports of fresh and frozen tuna by major exporting countries, in 1 000 tonnes (cont)
46

Canned tuna
Country 1979 1980 1981 1982 1983 1984 1985 1986 1987 1988 1989 1990
Thailand - - 11.3 19.7 39.3 78.7 170.2 285.6 316.8 510.5 537.2 611.7Spain 26.1 38.6 55.9 9.5 16.0 12.7 15.4 16.2 27.6 51.9 43.3 40.7Ecuador 6.2 10.5 14.8 12.6 7.6 6.9 7.6 7.4 11.6 14.7 10.3 13.8Indonesia 0.0 0.5 1.4 4.5 4.4 2.2 3.5 8.3 20.7 39.3 43.5Mauritius 4.0 5.1 6.1 4.3 5.6 7.1 8.0 7.1 7.6 12.6 12.6 9.2China - - - - - - - - - - - -Seychelles - 0.0 - - - - - - 3.7 10.5 8.6 10.4Philippines 6.5 29.5 52.1 46.5 52.8 45.4 47.1 49.6 51.7 91.1 108.3 95.2Viet Nam - - - - - - - - - - - -Italy 11.8 8.2 10.5 9.0 7.4 6.7 7.8 10.0 11.5 12.2 28.8 24.8Côte d'Ivoire 37.3 53.1 46.2 45.2 52.3 47.3 42.0 54.4 72.0 89.7 89.3 112.0Netherlands 0.5 1.4 1.1 0.8 0.8 1.9 1.8 2.8 6.3 9.0 9.1 10.7PNG - - - - - - - - - 0.0 - -El Salvador - - - - - - - - - - - -Germany 0.8 1.5 2.0 1.7 1.8 1.3 2.0 3.4 4.9 4.0 7.3 9.1Portugal 6.0 10.9 5.5 9.4 11.3 8.0 10.9 12.0 13.9 13.7 19.0 22.7Guatemala - - - - - - - - - - - -France 3.0 4.1 5.2 4.6 7.1 10.9 12.4 20.7 24.9 25.6 12.9 8.6Madagascar - - - - - - - - - - - -Ghana 3.0 3.7 3.0 3.5 2.1 7.4 2.2 - - - -Belgium 0.1 0.4 0.2 0.1 0.2 0.4 0.5 0.3 0.8 0.6 1.2 9.0UK 0.8 1.0 0.6 0.7 2.4 1.9 1.9 1.9 2.9 5.0 4.1 4.2Colombia - - - - - - - - - - - 0.3Costa Rica - - - - - 0.2 - - - - - -Brazil 0.8 0.1 0.0 0.2 0.0 0.5 0.8 0.2 0.8 1.2 0.5 0.5Korea Rep 0.0 - - 0.4 0.0 0.1 0.3 1.0 0.6 0.9 0.7 0.4Kenya - - - - - - - - - - - -USA - - - - - - - - - - 9.6 13.8Peru 4.7 2.8 3.0 2.6 0.6 0.4 0.0 0.0 0.1 0.7 0.1Japan 122.1 157.6 146.0 118.5 111.4 122.5 101.1 95.0 56.8 38.3 26.4 19.0Others 58.1 68.7 123.6 99.8 114.3 109.1 111.2 166.8 155.4 183.7 173.3 160.1Totals 288.8 396.5 488.3 390.1 438.9 468.4 550.6 740.2 778.2 1096.1 1142.5 1219.7
Yearly world exports of canned tuna* by major exporting countries, in USD million
47

Country 1991 1992 1993 1994 1995 1996 1997 1998 1999 2000 2001 2002
Thailand 721.7 612.3 589.6 685.7 610.7 555.1 659.8 680.1 639.0 513.6 656.1 707.3Spain 62.3 55.5 62.8 84.0 141.9 167.8 196.2 254.6 200.9 226.0 267.0 259.5Ecuador 13.4 24.6 27.5 44.7 52.7 69.2 77.8 107.2 106.2 99.6 137.9 194.6Indonesia 77.7 32.1 46.5 59.2 73.2 79.6 70.3 104.2 82.5 87.8 84.1 86.0Mauritius 18.7 18.5 21.5 26.9 34.6 39.4 42.7 41.1 37.6 35.6 61.6 67.4China - 0.0 0.1 0.1 0.3 0.3 0.4 3.4 1.5 1.3 3.7 5.2Seychelles 12.1 13.0 11.3 18.8 18.5 34.1 57.2 78.5 99.6 106.3 140.7 161.5Philippines 104.5 94.3 121.5 138.8 111.1 130.8 134.3 130.1 78.1 64.5 68.8 93.2Viet Nam - - - - 0.4 0.1 - - - - 8.4 11.8Italy 23.4 22.9 25.3 22.3 29.4 33.1 35.2 39.4 38.9 48.3 59.7 83.3Côte d'Ivoire 98.1 93.5 109.6 127.8 227.8 216.4 216.7 206.5 141.2 120.0 100.6 136.4Netherlands 8.8 6.5 13.1 8.2 19.9 17.7 31.8 63.6 25.8 8.6 17.5 67.7PNG - - - 0.0 - - 0.7 11.1 18.7 17.7 13.7 21.0El Salvador - - - - - 0.0 - - - 0.0 - -Germany 12.6 7.3 9.0 13.0 21.5 27.1 23.8 35.0 41.4 38.3 42.9 58.9Portugal 30.6 27.2 26.6 26.1 39.8 43.7 24.6 34.1 25.1 22.6 15.3 13.0Guatemala - - - - - - - - - - - 0.1France 6.4 12.0 23.3 33.6 64.7 89.6 118.2 78.4 118.5 161.3 39.9 54.9Madagascar - 14.6 17.0 27.7 27.6 29.0 6.9 34.0 29.3 20.4 28.2 28.7Ghana 0.1 0.4 2.3 9.0 31.3 48.1 65.5 51.2 54.3 59.1 62.7 58.0Belgium 9.8 10.2 2.9 3.8 6.4 3.7 6.6 8.6 8.5 5.9 7.0 7.3UK 5.6 3.8 8.4 7.8 6.5 7.8 11.9 83.7 35.1 9.8 11.4 14.1Colombia 3.9 10.1 13.8 49.1 59.7 35.7 47.7 51.9 35.5 31.0 22.7 29.0Costa Rica - - - 21.3 27.4 39.2 25.3 26.8 23.8 9.8 15.4 22.3Brazil 1.1 4.0 3.8 7.6 8.4 6.0 9.8 11.1 9.1 9.5 9.6 6.3Korea Rep 0.6 0.2 0.5 1.2 1.6 0.7 1.1 1.2 1.1 1.0 3.7 2.9Kenya - - - 0.0 - - - - - - - -USA 17.3 14.2 11.8 11.8 11.0 14.9 15.6 15.4 12.1 6.4 4.4 3.7Peru 0.1 - 0.2 0.1 - - - 4.6 0.7 0.6 2.0 2.2Japan 24.3 17.6 22.0 16.8 12.6 14.4 13.1 10.0 13.2 4.2 7.4 6.8Others 215.5 180.8 132.7 141.9 146.5 167.2 172.0 146.0 109.2 53.2 52.9 42.5Totals 1468.3 1275.9 1302.8 1587.3 1785.4 1870.9 2065.3 2311.8 1986.7 1762.3 1945.1 2245.7
Yearly world exports of canned tuna by major exporting countries, in USD million (cont.)
48

Country 2003 2004 2005 2006 2007 2008 2009 2010 2011
Thailand 830.2 900.6 1132.4 1296.2 1386.8 1940.3 1676.8 1878.1 2274.0Spain 303.0 313.8 325.1 387.5 445.8 543.0 482.0 498.0 709.1Ecuador 211.2 212.9 250.9 303.4 330.0 485.6 334.4 322.6 563.7Indonesia 101.2 118.4 128.6 129.8 151.9 174.3 190.2 186.2 279.2Mauritius 71.7 80.9 107.7 157.5 196.4 212.2 211.2 247.5 264.3China 5.6 8.1 19.7 41.6 67.6 115.8 91.4 133.0 241.1Seychelles 194.7 169.3 178.1 187.2 187.0 231.5 227.3 201.1 214.5Philippines 111.8 114.1 65.4 89.0 125.0 275.7 252.6 231.0 209.8Viet Nam 16.2 21.2 38.0 62.1 85.1 104.4 87.9 117.0 148.9Italy 71.9 84.0 95.1 102.2 128.2 142.1 131.8 109.9 121.1Côte d'Ivoire 136.0 154.2 96.9 120.4 155.6 176.5 135.6 104.4 91.6Netherlands 48.0 50.2 79.2 64.8 88.3 163.3 151.6 101.3 89.5PNG 26.7 29.1 43.4 37.4 50.7 76.4 56.0 74.1 79.0El Salvador 3.7 31.1 52.0 49.2 91.0 106.1 73.7 65.0 67.7Germany 69.7 74.3 82.5 92.1 91.6 115.2 59.4 41.7 54.2Portugal 9.1 20.5 19.0 22.5 24.3 31.2 38.6 29.1 50.2Guatemala 0.3 12.6 21.2 24.8 36.8 14.2 29.0 47.6 47.0France 69.0 72.3 70.2 71.4 101.9 94.0 81.8 38.9 46.3Madagascar 42.7 40.1 20.8 43.7 42.3 32.4 22.9 37.3 43.9Ghana 100.0 70.3 49.0 19.7 30.7 19.8 40.0 39.3 39.0Belgium 9.5 11.4 10.2 13.3 14.5 19.8 22.3 23.3 28.2UK 14.9 15.8 17.0 10.2 31.2 46.8 39.4 20.9 25.2Colombia 33.8 25.3 27.3 21.2 29.9 33.9 23.2 21.5 23.2Costa Rica 27.2 19.9 20.6 14.8 15.5 17.7 13.1 13.9 18.2Brazil 6.1 8.1 11.3 12.4 21.1 23.9 21.7 12.9 14.9Korea Rep 4.7 4.2 4.7 4.8 5.5 5.3 5.9 9.9 14.1Kenya 0.0 0.0 0.0 0.0 2.5 16.9 9.5 11.5 11.3USA 7.6 3.8 4.0 5.7 4.3 7.1 8.5 9.0 10.2Peru 3.4 5.2 6.5 4.8 6.0 7.8 6.0 10.4 9.5Japan 6.3 7.0 6.1 5.8 7.4 8.7 9.2 9.5 9.5Others 75.8 82.2 112.1 92.3 94.8 105.6 95.0 98.0 113.4Totals 2612.1 2760.8 3095.1 3487.7 4049.8 5347.8 4627.9 4743.7 5912.0
* Including bonito tuna
AN 010976. 1405.Source: Fishstat Plus - 20140510.
countries, in USD million (cont.)Yearly world exports of canned tuna by major exporting
49

Country 1979 1980 1981 1982 1983 1984 1985 1986 1987 1988 1989 1990
Thailand - - 4.7 8.5 18.1 39.9 87.1 142.0 144.9 207.8 225.2 258.4Ecuador 2.2 3.2 4.0 3.9 2.5 2.8 3.2 3.2 5.2 6.2 4.0 5.6Spain 6.5 8.0 11.6 2.1 4.1 4.2 4.9 4.3 6.6 11.3 9.5 6.9Indonesia 0.0 - 0.4 0.8 2.2 2.2 1.2 1.8 4.3 8.5 20.6 18.7Mauritius 1.4 1.2 1.5 1.4 2.0 2.6 3.2 2.7 2.9 4.2 4.8 3.6Philippines 4.1 11.2 18.0 19.4 23.5 22.6 25.5 26.4 26.1 37.1 47.5 44.7China - - - - - - - - - - - -Viet Nam - - - - - - - - - - - -Seychelles - 0.0 - - - - - - 1.4 4.0 4.3 4.6Côte d'Ivoire 14.5 17.5 17.1 18.7 23.7 22.4 22.2 23.8 29.4 31.6 38.3 41.4Guatemala - - - - - - - - - - - -Netherlands 0.2 0.4 0.4 0.3 0.3 0.8 0.8 1.2 2.7 3.6 3.6 4.3PNG - - - - - - - - - 0.0 - -Italy 3.2 1.5 2.1 2.1 1.9 1.7 2.0 2.0 1.9 2.3 5.2 4.4El Salvador - - - - - - - - - - - -Germany 0.3 0.4 0.6 0.6 0.7 0.5 0.8 1.2 1.8 1.4 2.6 2.9Madagascar - - - - - - - - - - - -Ghana - 0.8 1.2 1.1 1.2 0.7 3.2 0.7 - - - -France 0.7 0.9 1.4 1.4 2.4 4.7 4.7 6.4 7.3 7.9 3.9 2.2Portugal 1.7 2.4 1.1 2.4 3.4 2.7 3.1 2.7 2.6 2.3 3.9 3.9Belgium 0.0 0.1 0.0 0.0 0.1 0.1 0.2 0.1 0.2 0.2 0.3 2.7Costa Rica - - - - - 0.1 - - - - - -Others 65.8 62.1 78.0 74.2 85.8 92.3 81.5 87.6 67.8 63.8 69.1 64.0Totals 100.5 109.9 142.2 136.9 172.0 200.4 243.6 305.9 304.9 392.0 442.8 468.1
Country 1991 1992 1993 1994 1995 1996 1997 1998 1999 2000 2001 2002
Thailand 305.3 279.1 258.5 291.9 242.2 210.3 228.6 248.9 282.8 266.2 298.6 328.9Ecuador 5.1 10.0 11.2 16.6 19.4 26.5 27.2 36.3 45.6 53.6 65.8 80.3Spain 12.5 10.4 13.9 19.3 31.6 39.7 50.7 61.7 59.5 80.8 90.0 76.3Indonesia 41.1 19.0 23.1 24.3 29.3 31.1 23.9 39.9 36.3 44.7 35.2 38.3Mauritius 6.6 7.4 7.8 8.9 12.3 13.1 15.1 12.6 14.9 17.6 26.8 28.6Philippines 46.1 47.0 55.5 58.0 46.7 69.1 56.2 63.7 36.9 44.2 41.5 48.0China - 0.0 0.1 0.1 0.1 0.1 0.3 1.6 0.9 0.8 2.1 2.9Viet Nam - - - - 0.2 0.1 - - - - 3.7 4.7Seychelles 6.2 4.9 4.5 8.1 6.3 13.0 21.9 21.6 34.6 41.5 62.3 63.7Côte d'Ivoire 47.2 41.4 49.9 43.6 57.1 56.6 56.0 51.7 49.5 57.7 47.3 53.3Guatemala - - - - - - - - - - - 0.0Netherlands 3.4 2.6 5.0 3.2 7.3 6.0 9.9 17.7 9.5 7.7 12.8 29.7PNG - - - 0.0 - - 0.3 4.2 9.1 10.9 9.1 11.4Italy 4.3 3.7 5.3 4.2 5.1 5.2 6.4 7.1 7.3 16.9 14.4 19.1El Salvador - - - - - 0.0 - - - - - -Germany 4.0 2.6 2.8 4.3 6.1 8.9 7.8 9.8 12.8 14.5 15.7 21.4Madagascar - 7.7 8.8 11.1 14.0 14.0 5.9 13.1 13.5 10.0 13.9 12.5Ghana 0.0 0.2 0.8 3.1 10.5 17.1 20.3 17.0 21.3 25.1 27.0 25.3France 1.7 4.1 7.9 11.1 22.4 29.0 35.4 24.5 43.1 64.7 16.1 19.2Portugal 6.0 5.2 6.8 6.8 8.2 9.5 5.5 6.5 5.6 7.1 3.8 2.9Belgium 2.7 2.8 1.1 1.3 2.3 1.2 1.8 2.5 3.0 2.1 2.5 2.1Costa Rica - - - 6.5 8.1 11.8 7.5 8.9 9.3 4.4 7.0 8.9Others 89.8 77.9 65.4 82.4 84.5 88.7 94.4 102.2 85.0 50.6 48.8 43.6Totals 582.0 526.0 528.2 604.8 613.7 651.1 675.3 751.8 780.5 821.0 844.4 921.2
Yearly world exports of canned tuna* by major exporting countries, in 1 000 tonnes
50
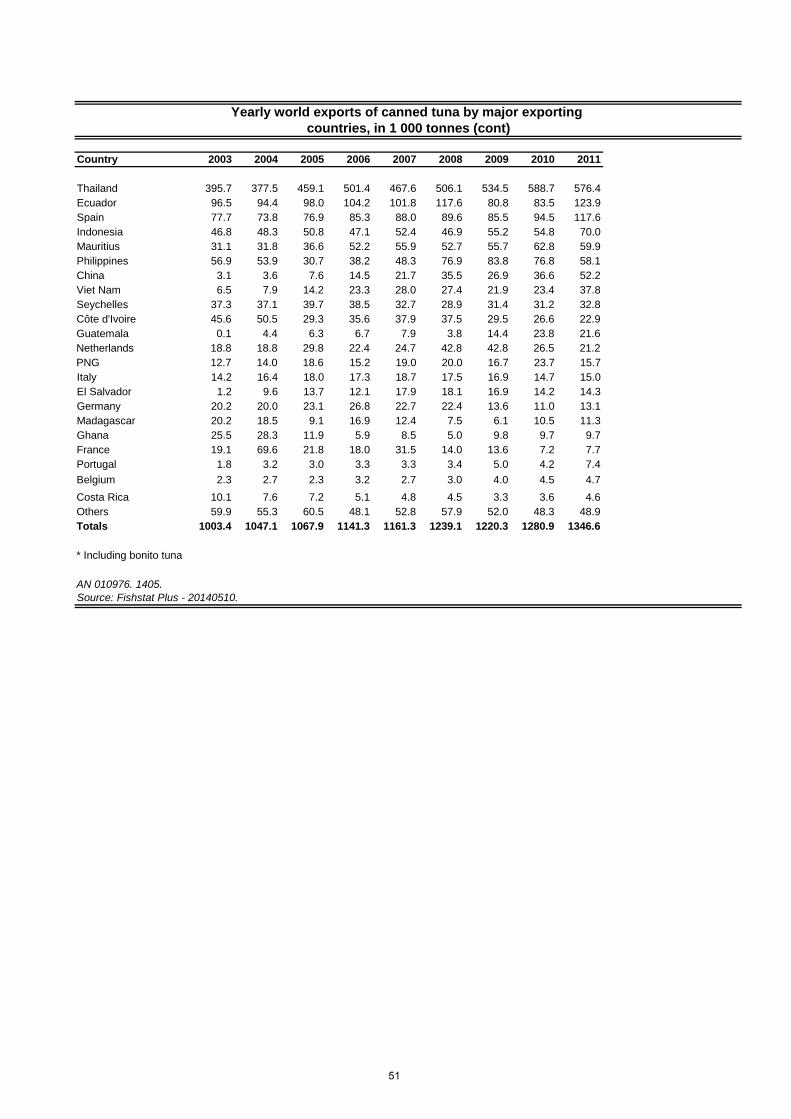
Country 2003 2004 2005 2006 2007 2008 2009 2010 2011
Thailand 395.7 377.5 459.1 501.4 467.6 506.1 534.5 588.7 576.4Ecuador 96.5 94.4 98.0 104.2 101.8 117.6 80.8 83.5 123.9Spain 77.7 73.8 76.9 85.3 88.0 89.6 85.5 94.5 117.6Indonesia 46.8 48.3 50.8 47.1 52.4 46.9 55.2 54.8 70.0Mauritius 31.1 31.8 36.6 52.2 55.9 52.7 55.7 62.8 59.9Philippines 56.9 53.9 30.7 38.2 48.3 76.9 83.8 76.8 58.1China 3.1 3.6 7.6 14.5 21.7 35.5 26.9 36.6 52.2Viet Nam 6.5 7.9 14.2 23.3 28.0 27.4 21.9 23.4 37.8Seychelles 37.3 37.1 39.7 38.5 32.7 28.9 31.4 31.2 32.8Côte d'Ivoire 45.6 50.5 29.3 35.6 37.9 37.5 29.5 26.6 22.9Guatemala 0.1 4.4 6.3 6.7 7.9 3.8 14.4 23.8 21.6Netherlands 18.8 18.8 29.8 22.4 24.7 42.8 42.8 26.5 21.2PNG 12.7 14.0 18.6 15.2 19.0 20.0 16.7 23.7 15.7Italy 14.2 16.4 18.0 17.3 18.7 17.5 16.9 14.7 15.0El Salvador 1.2 9.6 13.7 12.1 17.9 18.1 16.9 14.2 14.3Germany 20.2 20.0 23.1 26.8 22.7 22.4 13.6 11.0 13.1Madagascar 20.2 18.5 9.1 16.9 12.4 7.5 6.1 10.5 11.3Ghana 25.5 28.3 11.9 5.9 8.5 5.0 9.8 9.7 9.7France 19.1 69.6 21.8 18.0 31.5 14.0 13.6 7.2 7.7Portugal 1.8 3.2 3.0 3.3 3.3 3.4 5.0 4.2 7.4Belgium 2.3 2.7 2.3 3.2 2.7 3.0 4.0 4.5 4.7Costa Rica 10.1 7.6 7.2 5.1 4.8 4.5 3.3 3.6 4.6Others 59.9 55.3 60.5 48.1 52.8 57.9 52.0 48.3 48.9Totals 1003.4 1047.1 1067.9 1141.3 1161.3 1239.1 1220.3 1280.9 1346.6
* Including bonito tuna
AN 010976. 1405.Source: Fishstat Plus - 20140510.
countries, in 1 000 tonnes (cont)Yearly world exports of canned tuna by major exporting
51

Country 2002 2003 2004 2005 2006 2007 2008 2009 2010 2011 2012 2013
Italy 39.0 43.2 46.8 40.7 43.5 53.7 49.4 35.3 32.1 53.4 46.5 33.8France 38.8 26.8 25.3 31.7 30.2 26.6 29.5 30.9 32.0 30.4 24.7 27.7Germany 20.9 26.8 26.5 35.0 26.1 26.6 36.9 26.7 18.6 16.8 16.2 17.3UK 16.3 10.1 9.0 9.0 9.0 8.3 13.1 9.6 7.1 10.4 9.6 11.2Portugal 5.6 6.5 7.1 8.1 10.2 9.9 10.7 12.3 11.7 10.0 9.7 9.7Belg/Lux 11.1 8.0 8.1 11.1 12.9 13.1 11.6 10.6 8.9 10.0 8.9 8.5Austria 4.3 2.9 3.5 3.8 5.6 5.9 5.2 7.4 5.0 6.2 5.2 6.2Ireland 3.8 4.1 3.9 3.9 2.0 3.2 3.7 4.5 4.0 3.8 4.7 4.1Greece 6.1 5.9 5.5 4.7 5.2 5.3 5.3 5.2 5.1 4.8 4.3 3.9Poland 0.1 0.2 0.6 1.8 2.0 3.5 3.3 4.0 3.5 2.4 2.6 3.4Netherlands 3.3 2.8 3.1 3.6 3.6 4.5 4.2 4.6 4.1 3.8 4.7 3.3Others 25.7 24.2 24.6 29.8 28.6 32.5 36.0 38.5 37.9 39.3 44.3 45.0Total 174.8 161.4 163.9 183.2 178.9 193.1 208.8 189.5 169.9 191.3 181.3 174.0
*Statistical codes (combined nomenclature) : 16041410, 16041411, 16041414, 16041418, 16042070
AN 010994.1405.Source: EUROSTAT – 20140510.
country of destination, in 1000 tonnesTotal EU exports of prepared and preserved tuna* – by
52

Country 2002 2003 2004 2005 2006 2007 2008 2009 2010 2011 2012 2013
Italy 153.4 171.5 168.4 161.8 192.2 218.1 234.4 166.8 147.5 249.6 237.7 173.6France 118.6 76.4 68.9 85.0 85.5 84.5 103.9 112.0 112.2 127.9 129.6 138.9Germany 54.5 64.9 65.1 80.2 66.7 76.3 112.8 70.1 55.3 56.0 73.5 87.9UK 50.9 33.8 29.5 28.5 29.0 30.3 43.5 32.2 29.5 42.4 43.0 66.0Portugal 19.2 21.2 22.1 24.9 31.2 31.4 38.6 43.7 41.7 37.1 42.4 53.0Belg/Lux 32.2 26.2 26.5 28.7 33.2 38.1 40.6 35.3 27.6 31.1 38.5 42.0Greece 24.8 25.3 23.9 20.1 23.5 25.4 27.3 27.9 26.4 25.3 25.7 24.3Austria 12.5 8.9 10.2 10.0 15.1 17.5 17.9 22.6 16.5 21.9 24.7 27.4Ireland 13.6 13.4 12.2 12.1 6.7 11.4 13.1 17.1 12.8 16.5 21.7 20.2Netherlands 10.5 7.8 7.8 9.9 10.3 13.2 14.5 14.4 13.3 15.7 22.3 17.8Slovenia 7.2 5.0 7.4 10.2 9.1 9.7 11.1 12.6 12.2 14.4 14.7 16.0Switzerland 8.0 7.6 6.7 8.2 8.0 8.9 10.0 10.4 8.7 9.5 10.8 11.8Poland 0.6 0.6 1.5 3.7 4.2 8.3 10.7 11.0 9.3 7.9 10.3 11.8Finland 2.9 2.5 2.8 4.3 3.5 5.0 6.3 8.3 5.8 5.0 7.0 7.6Algeria 3.7 5.2 4.3 5.0 4.5 5.3 4.1 4.0 5.9 4.9 7.6 7.6Spain 6.0 4.1 2.3 2.1 2.4 2.4 2.8 4.0 3.6 4.8 3.8 3.4Saudi Arabia 5.1 4.2 4.4 5.4 6.0 6.0 5.3 5.1 6.3 4.4 8.4 7.0Sweden 1.8 1.4 1.5 1.6 1.8 1.6 5.3 6.8 2.1 2.6 3.1 3.3Libya 6.4 8.3 5.9 2.6 2.8 3.6 2.2 4.9 3.1 1.4 12.5 8.4Angola 1.1 1.4 1.0 1.2 2.3 1.9 3.0 3.0 2.4 3.5 6.4 16.5Romania 0.2 0.5 0.4 0.8 1.0 3.5 5.3 5.2 5.4 7.0 8.9 11.3Czech Rep 3.1 2.9 3.1 5.5 6.4 7.8 8.9 9.1 9.9 10.2 11.3 10.8Slovakia 1.0 1.0 2.2 2.8 2.5 3.6 4.8 4.9 6.0 7.2 8.6 9.8Others 49.6 42.2 42.3 52.0 53.0 62.2 79.4 78.4 80.1 92.2 110.2 124.9Total 586.9 536.4 520.5 566.8 600.9 676.0 805.5 709.9 643.6 798.6 882.6 901.4
*Statistical codes (combined nomenclature) : 16041410, 16041411, 16041414, 16041418, 16042070
AN 010992.1405.Source: EUROSTAT – 20140510.
country of destination, in EuroTotal EU export of prepared and preserved tuna** – by
53

Country 1988 1989 1990 1991 1992 1993 1994 1995 1996 1997 1998 1999
Italy 3.8 5.1 4.4 7.9 6.7 3.6 9.3 9.5 10.8 17.3 19.1 19.3France 0.0 0.0 0.0 0.3 0.5 0.5 1.3 0.8 2.0 4.5 8.2 7.6Portugal 0.1 0.0 0.0 1.4 0.7 1.1 1.6 2.4 2.2 2.7 3.3 4.0UK 0.2 0.2 0.2 0.2 0.1 0.1 1.7 1.5 4.9 7.8 7.5 7.0Germany * * * * * * * * * * * *Others 3.1 4.3 2.3 2.8 2.8 2.4 3.8 6.0 4.4 9.3 17.9 12.6Total 7.2 9.6 6.9 12.6 10.8 7.7 17.7 20.2 24.3 41.6 56.0 50.5
Country 2000 2001 2002 2003 2004 2005 2006 2007 2008 2009 2010 2011
Italy 31.8 30.4 28.7 26.5 25.6 25.8 33.2 41.2 40.2 27 2.9 50.5France 13.9 8.5 9.6 14.3 13.0 17.8 20.2 17.7 20.5 23.3 27.3 25.6Portugal 4.0 1.8 2.3 4.1 3.6 6.5 9.6 9.2 10.2 12 11.5 9.8UK 8.0 8.9 3.7 3.3 2.8 2.8 3.2 2.9 4.1 2.6 3.4 6.8Germany * * 2.9 2.4 1.1 1.4 1.6 1.0 1.1 1.0 1.8 2.7Others 10.1 9.1 19.7 9.8 12.1 12.8 9.6 10.6 8.6 9.7 35.9 10.1Total 67.8 58.7 66.9 60.4 58.2 67.1 77.4 82.6 84.7 75.6 82.8 105.5
Country 2012 2013
Italy 44.5 31.8France 19.4 21.5Portugal 9.6 9.5UK 7.2 8.1Germany 4.6 4.2Others 9.2 8.4Total 94.5 83.5
* included under others
AN 010988.1405.Source: EUROSTAT/NATIONAL STATISTICS - 20140512
Spanish canned tuna exports, in 1 000 tonnes
54

1988 1989 1990 1991 1992 1993 1994 1995 1996 1997 1996 1997
Greece 0.9 1.4 1.1 1.2 1.1 1.4 1.4 1.9 1.8 2.3 1.8 2.3Germany * * * * * * * * * * * *Austria 0.0 0.0 0.0 0.0 0.0 0.0 0.0 0.0 0.1 0.2 0.1 0.2Slovenia 0.0 0.0 0.0 0.0 0.2 0.1 0.2 0.4 0.5 0.5 0.5 0.5Saudi Arabia 0.2 0.3 0.3 0.3 0.4 0.3 0.4 0.4 0.4 0.6 0.4 0.6Belg-Lux 0.7 0.6 0.9 0.9 0.9 1.0 1.0 1.1 1.1 0.8 1.1 0.8Others 0.4 3.4 3 2.7 2 3.6 2.5 2.5 2.5 2.8 2.5 2.8Total 2.2 5.1 4.4 4.2 3.7 5.4 4.5 5.2 5.3 6.4 5.3 6.4
1998 1999 2000 2001 2002 2003 2004 2005 2006 2007 2008 2009
Greece 2.2 2.9 2.6 2.8 3.2 3.8 3.2 2.8 3.4 3.7 3.8 3.8Germany * * * * * * * * * * 1.3 1.2Austria 0.3 0.3 0.3 0.4 0.5 0.5 0.5 0.7 0.7 0.9 0.8 0.8Slovenia 0.6 0.6 0.6 0.7 1.0 0.9 0.9 1.3 1.0 1.4 1.3 1.4Saudi Arabia 0.6 0.5 0.6 1.0 0.8 0.7 0.8 0.9 0.9 0.9 0.8 0.6Belg-Lux 1.0 1.0 2.2 1.4 1.3 1.2 1.4 1.3 1.2 1.4 0.9 0.8Others 2.4 1.7 8.4 7.6 9.9 6.4 5.4 6.9 7 7.2 5.6 5.6Total 7.1 7.0 14.7 13.9 16.7 13.5 12.2 13.9 14.2 15.5 14.5 14.2
2010 2011 2012 2013
Greece 3.4 3.4 3.5 2.9Germany 0.8 1.1 1.5 2.1Austria 0.8 0.9 1.0 2.0Slovenia 1.5 1.6 1.5 1.6Saudi Arabia 0.8 0.8 1.4 1.1Belg-Lux 0.5 0.5 0.6 0.5Others 5.9 6.7 7.6 8.0Total 13.7 15.0 17.1 18.2
* included under others
AN 010982. 1405.Source: EUROSTAT/NATIONAL STATISTICS - 20140510
Italian canned tuna exports,in, 1 000 tonnes
55

Country 1990 1991 1992 1993 1994 1995 1996 1997 1998 1999 2000 2001
USA 127.0 142.0 124.0 91.6 89.7 60.7 55.9 63.7 77.3 100.4 70.7 71.5Egypt 5.4 10.4 5.4 8.2 9.5 11.8 11.0 9.8 - - 1.8 1.7Libya 4.8 5.6 2.3 3.9 2.6 1.4 1.5 - 24.4 11.6 27.6 29.7Australia 7.1 8.7 9.0 10.4 10.6 11.1 12.3 11.8 11.0 18.4 19.5 20.0Canada 8.8 11.9 11.5 16.3 16.7 17.7 16.6 19.7 13.5 17.5 21.6 19.8Japan 4.3 8.3 13.9 16.7 34.3 20.3 16.7 17.6 16.3 24.9 23.7 24.1UK 30.8 38.3 36.9 33.4 32.3 29.8 22.1 21.4 10.9 10.1 6.1 12.4Saudi Arabia 2.1 5.6 2.6 4.5 6.2 6.3 8.5 7.5 21.0 18.8 13.5 17.2South Africa - - 0.8 1.1 1.0 1.6 1.3 3.2 1.6 1.2 2.4 2.9UAE * * * * * * * * * * * *Chile * * * * * * * * * * * *Papua New Guinea * * * * * * * * * * * *Yemen * * * * * * * * * * * *Tunisia * * * * * * * * * * * *Syrian AR * * * * * * * * * * * *Argentina * * * * * * * * * * * *France * * * * * * * * * * * *Netherlands 68.0 74.5 72.7 72.5 88.9 81.4 64.2 74.0 72.9 79.9 79.3 99.3Total 258.4 305.3 279.1 258.5 291.9 242.2 210.3 228.6 248.9 282.8 266.2 298.6
Country 2002 2003 2004 2005 2006 2007 2008 2009 2010 2011 2012 2013
USA 73.6 108.1 98.5 111.8 103.2 87.7 94.9 112.7 117.3 99.3 81.6 70.5Egypt 9.5 14.2 18.3 25.2 27.6 28.8 33.8 39.8 51.5 44.2 40.4 22.3Libya 21.2 23.0 19.3 25.0 34.1 25.1 34.6 33.7 20.5 11.4 30.5 31.4Australia 23.7 28.6 29.9 33.0 32.6 33.3 39.7 32.4 41.0 42.3 34.1 33.4Canada 23.5 24.1 28.9 28.6 26.3 25.7 28.3 30.8 28.8 28.8 22.7 24.8Japan 25.5 25.3 25.4 28.8 29.7 26.4 28.1 24.3 23.5 29.9 26.8 29.1UK 12.4 11.8 14.3 15.1 20.1 21.2 19.6 17 13.9 22.8 4.4 10.7Saudi Arabia 17.2 18.1 13.2 16.6 19.7 13.4 15.8 17 18.7 20.8 20.1 16.3South Africa 2.8 4.9 5.3 6.2 9.3 9.8 8.4 9.8 11.3 7.7 9.5 8.6UAE * * * * * * 10.0 6.0 7.4 10.2 7.6 7.9Chile * * * * * * 4.3 4.6 7.6 9.5 8.9 7.8Papua New Guinea * * * * * * 4.3 3.6 5.5 5.0 8.9 7.7Yemen * * * * * * * * 6.3 7.4 7.6 7.1Tunisia * * * * * * * 5.5 12.7 8.3 6.5Syrian AR * * * * * * 4.6 13.0 9.2 9.9 4.1 5.9Argentina * * * * * * * * * 11.0 7.8 5.5France * * * * * * 6.2 9.4 7.4 8.1 3.7 5.3Netherlands * * * * * * 4.0 5.1 7.4 7.4 3.5 5.0Others 110.8 137.6 124.4 164.6 256.8 196.2 169.5 126.2 152.7 129.9 81.4 90.9Total 320.2 395.7 377.5 454.9 559.4 467.6 506.1 485.4 535.5 518.3 411.9 396.7
* included under others
AN 010980. 1405.Source: NATIONAL STATISTICS - 20140512.
country of destination, in 1 000 tonnesTotal Thai exports of prepared and preserved tuna – by
56

TUNA PRODUCTION
Species 1982 1983 1984 1985 1986 1987 1988 1989 1990 1991 1992 1993
Skipjack tuna 789.8 909.2 1072.5 917.4 1089.0 1014.6 1239.5 1219.2 1285.5 1588.2 1442.7 1503.3Yellowfin tuna 574.7 603.1 628.3 738.1 813.6 886.4 910.0 942.4 1041.9 971.2 1089.5 1167.5Bigeye tuna 234.4 232.1 230.7 267.0 282.1 279.7 267.3 274.2 316.8 299.0 311.9 342.4Albacore 206.6 174.3 179.0 193.5 216.6 221.1 226.8 246.1 233.2 171.9 219.8 200.0Pacific bluefin tuna 29.2 20.7 12.0 16.4 18.8 15.4 9.0 11.5 8.8 15.9 13.3 11.0Atlantic bluefin tuna 23.5 24.0 26.6 26.5 21.6 20.7 26.3 23.7 26.0 27.9 33.8 36.1Southern bluefin tuna 42.8 43.9 39.3 35.2 26.9 25.9 23.3 18.4 16.9 12.1 13.2 14.3Total 1901.1 2007.3 2188.3 2194.1 2468.7 2463.8 2702.2 2735.5 2929.1 3086.1 3124.1 3274.7
Species 1994 1995 1996 1997 1998 1999 2000 2001 2002 2003 2004 2005
Skipjack tuna 1576.0 1688.9 1603.5 1594.0 1897.8 1974.3 1978.9 1834.7 2034.2 2184.6 2132.6 2384.4Yellowfin tuna 1148.7 1108.7 1096.3 1205.3 1259.5 1256.8 1250.9 1372.5 1404.9 1498.7 1447.6 1388.9Bigeye tuna 388.8 402.1 404.6 440.1 452.7 462.9 472.4 444.0 483.4 445.7 510.1 429.1Albacore 212.1 196.3 201.9 221.6 231.4 256.0 218.3 241.8 245.8 227.5 231.9 202.3Pacific bluefin tuna 16.8 28.1 23.4 23.3 15.1 28.2 30.5 17.9 18.2 14.6 27.7 29.5Atlantic bluefin tuna 49.0 49.2 52.7 48.8 42.6 36.1 37.0 37.7 37.9 34.9 37.6 40.4Southern bluefin tuna 12.9 15.7 18.1 17.0 18.8 20.8 17.9 21.5 19.4 15.9 19.2 17.4Total 3404.3 3489.0 3400.6 3550.1 3918.0 4035.2 4006.0 3970.1 4243.6 4421.8 4406.6 4492.0
Species 2006 2007 2008 2009 2010 2011 2012
Skipjack tuna 2574.7 2490.3 2524.7 2669.7 2634.1 2644.8 2795.3Yellowfin tuna 1183.9 1100.7 1190.4 1155.6 1234.0 1239.2 1352.2Bigeye tuna 446.4 453.0 445.4 414.1 384.4 402.5 450.5Albacore 221.1 230.8 198.0 233.1 239.3 228.4 256.1Pacific bluefin tuna 26.4 20.1 24.3 22.2 23.7 25.0 24.7Atlantic bluefin tuna 38.6 41.2 30.2 26.3 17.1 15.9 15.2Southern bluefin tuna 16.4 13.0 15.3 13.9 12.5 10.9 11.7Total 4507.5 4349.1 4428.2 4535.1 4545.1 4566.7 4905.8
AN 010908. 1405.Source: Fishstat Plus - 20140502.
Yearly world tuna production, by species, in 1 000 tonnes
57

Area 1982 1983 1984 1985 1986 1987 1988 1989 1990 1991 1992
Pacific, Western Central 519.3 718.1 737.2 595.7 813.9 831.6 864.8 940.8 1090.7 1251.0 1118.1Indian Ocean, Western 119.5 133.2 209.6 262.6 293.1 326.0 412.2 401.4 404.0 398.0 499.1Pacific, Eastern Central 324.8 249.6 289.4 466.3 466.5 445.7 472.6 444.2 406.2 359.3 419.3Atlantic, Eastern Central 305.2 271.5 208.0 232.0 237.4 237.7 244.7 254.2 318.8 365.5 322.3Pacific, Southeast 50.8 61.5 77.8 72.9 64.1 74.2 85.8 98.1 127.8 114.7 124.1Indian Ocean, Eastern 91.6 96.5 105.1 100.6 113.3 112.1 121.2 116.1 105.5 109.2 117.6Pacific, Northwest 244.8 255.7 339.7 214.1 258.0 240.6 278.1 227.2 256.8 275.5 240.3Atlantic, Southwest 31.3 25.4 24.9 42.9 41.8 34.3 38.2 66.0 55.8 44.8 61.2Atlantic, Southeast 48.3 29.4 35.7 46.7 41.1 35.3 39.7 39.6 33.3 32.5 40.6Atlantic, Northeast 44.1 48.7 38.0 38.0 42.6 46.2 51.3 43.5 43.8 33.9 38.7Pacific, Southwest 46.3 26.8 19.8 17.5 18.0 20.1 22.1 36.8 29.3 31.4 60.7Atlantic, Western Central 46.2 63.6 70.0 64.0 44.3 31.0 33.8 38.0 27.6 38.2 41.8Pacific, Northeast 2.4 3.6 3.4 5.9 4.4 2.8 9.0 4.1 3.4 2.4 5.2Mediterranean and Black Sea 17.0 14.9 20.5 23.5 19.8 17.9 21.3 19.9 19.5 22.3 26.5Atlantic, Northwest 9.5 8.7 9.2 11.3 10.3 8.1 7.4 5.6 6.6 7.5 8.6Total 1901.1 2007.3 2188.3 2194.1 2468.7 2463.8 2702.2 2735.5 2929.1 3086.1 3124.1
Area 1993 1994 1995 1996 1997 1998 1999 2000 2001 2002 2003
Pacific, Western Central 1077.9 1305.0 1297.4 1233.3 1225.4 1561.9 1473.9 1551.6 1512.3 1711.2 1643.9Indian Ocean, Western 635.3 573.2 627.7 589.9 583.1 559.1 681.5 672.4 659.5 768.7 853.9Pacific, Eastern Central 324.7 327.7 357.7 349.0 390.1 419.5 392.5 369.8 423.0 536.8 510.2Atlantic, Eastern Central 370.7 367.1 351.1 331.4 294.8 318.9 340.2 291.6 320.8 253.0 277.9Pacific, Southeast 135.4 163.8 175.2 188.4 222.5 213.7 331.1 320.1 312.2 269.7 370.4Indian Ocean, Eastern 148.7 180.5 213.9 259.9 285.9 301.6 310.7 273.0 246.9 239.8 247.9Pacific, Northwest 305.7 206.3 215.8 193.5 301.6 299.0 277.3 280.9 245.7 260.0 294.3Atlantic, Southwest 52.6 50.6 38.7 55.9 54.4 46.5 47.2 49.0 51.5 47.5 47.5Atlantic, Southeast 55.1 58.9 51.3 39.1 31.9 45.7 46.7 45.8 41.1 38.2 37.9Atlantic, Northeast 44.6 39.0 47.7 41.0 39.0 36.7 37.5 36.1 25.9 25.3 25.3Pacific, Southwest 36.9 27.7 28.4 32.1 33.0 35.7 25.6 31.8 32.1 34.9 27.7Atlantic, Western Central 49.0 48.8 32.4 31.0 33.1 31.8 31.8 37.5 50.4 35.0 30.7Pacific, Northeast 5.4 8.9 6.7 10.0 14.6 11.5 4.7 11.2 12.1 12.2 17.9Mediterranean and Black Sea 26.9 40.9 39.2 41.2 36.3 31.7 28.5 29.7 30.6 30.6 33.6Atlantic, Northwest 5.8 6.0 5.8 4.9 4.5 4.8 6.0 5.4 6.0 4.7 2.6Total 3274.7 3404.3 3489.0 3400.6 3550.1 3918.0 4035.2 4006.0 3970.1 4243.6 4421.8
Area 2004 2005 2006 2007 2008 2009 2010 2011 2012
Pacific, Western Central 1749.5 1808.3 1935.4 2091.0 2103.2 2253.5 2217.0 2179.5 2476.3Indian Ocean, Western 900.3 964.3 945.4 675.9 608.1 550.4 546.1 528.3 574.0Pacific, Eastern Central 464.3 436.7 401.3 377.1 369.2 457.2 494.4 445.7 506.7Atlantic, Eastern Central 291.0 264.0 232.5 236.0 258.5 284.7 296.3 325.6 342.9Pacific, Southeast 306.5 350.3 347.0 246.2 372.4 308.4 243.2 361.3 328.7Indian Ocean, Eastern 292.5 245.5 249.3 277.9 308.0 312.3 322.3 312.0 273.2Pacific, Northwest 175.5 213.2 176.7 234.2 231.1 190.3 237.2 218.4 208.4Atlantic, Southwest 49.5 48.7 41.7 42.7 38.3 42.2 36.3 48.1 44.5Atlantic, Southeast 32.4 24.9 29.8 35.2 30.8 33.9 32.8 34.9 41.6Atlantic, Northeast 29.3 44.2 46.3 34.5 29.4 22.3 32.5 29.1 30.5Pacific, Southwest 26.5 22.0 19.7 20.3 21.3 17.6 30.8 30.6 27.4Atlantic, Western Central 33.5 20.4 26.0 20.5 17.0 20.7 23.4 18.8 20.7Pacific, Northeast 19.1 12.4 17.4 16.4 14.5 16.4 16.3 15.5 14.7Mediterranean and Black Sea 33.3 33.6 35.7 38.8 24.1 23.2 14.0 15.5 12.9Atlantic, Northwest 3.6 3.5 3.3 2.7 2.4 2.0 2.5 3.4 3.4Total 4406.6 4492.0 4507.5 4349.1 4428.2 4535.1 4545.1 4566.7 4905.8*Skipjack tuna Atlantic bluefin tunaYellowfin tuna Southern bluefin tunaBigeye tuna Pacific bluefin tunaAlbacore
AN 010911. 1405.Source: Fishstat Plus - 20140502.
Tuna* production by fishing area, in 1 000 tonnes
58

Country 1982 1983 1984 1985 1986 1987 1988 1989 1990 1991 1992 1993
Indonesia 104.8 118.9 130.8 136.4 137.3 138.4 155.0 190.2 215.2 225.7 256.0 254.0Japan 677.8 700.6 792.1 657.9 785.4 693.9 755.4 675.1 656.3 727.2 677.2 742.9Taiwan PC 111.0 101.5 100.2 121.5 161.8 190.7 212.6 241.8 277.8 214.5 319.3 397.1Philippines 102.8 118.5 103.6 124.8 136.5 125.6 113.0 126.8 180.8 198.0 128.2 106.3Korea Rep 107.8 88.6 71.2 91.6 108.5 131.4 147.0 170.9 232.6 266.5 224.6 166.9USA 198.9 265.2 263.5 233.8 251.2 283.5 276.0 245.2 232.6 235.6 260.9 220.6Spain 134.1 127.5 150.6 179.5 189.3 204.7 236.4 252.0 260.0 270.4 238.3 261.8Ecuador 19.8 21.2 30.9 34.8 41.3 36.1 49.7 58.5 57.9 50.7 43.5 44.0Papua New Guinea 2.7 0.5 2.7 9.3 - - - - - - - 0.0Mexico 38.5 38.5 85.4 93.3 106.2 112.0 132.8 136.9 125.7 129.0 131.9 120.9China - - - - - - 0.0 0.1 0.5 1.0 2.7 6.6Sri Lanka 11.5 9.1 16.7 16.1 18.0 16.3 20.6 23.9 26.6 30.9 36.8 42.9Maldives 20.4 27.6 41.5 49.9 52.0 50.8 65.1 64.2 66.9 66.6 67.3 68.8France 94.8 105.2 98.8 112.4 126.7 135.0 153.6 143.3 155.4 167.0 174.0 190.6Kiribati 2.3 3.4 3.8 2.5 3.2 2.2 3.3 4.1 2.4 2.0 2.4 2.1Marshall Is - - - - - - - - - - 0.0 0.1Ghana 28.9 32.6 31.9 33.5 35.8 36.4 36.4 31.9 41.3 38.4 31.2 37.1Panama 24.1 10.2 8.7 20.3 23.4 20.8 17.1 20.6 19.5 30.0 37.5 41.7Viet Nam - - - - - - - - - - - -Iran (Islamic Rep. of) - - - - - - - 1.3 3.1 4.4 18.2 25.0Seychelles 0.5 0.2 0.2 0.3 0.0 0.0 0.0 0.0 2.2 0.9Venezuela, Boliv Rep o 35.8 57.0 62.9 65.4 63.0 65.3 65.9 78.6 73.6 72.6 76.8 79.9India 6.9 4.9 6.3 10.7 7.6 11.4 8.1 10.4 11.9 10.6 10.4 14.0Vanuatu 0.5 0.5 0.4 5.5 14.2 17.4 23.0 24.4 36.8 41.3 42.6 38.1Colombia 0.0 0.0 0.2 0.2 0.3 0.2 0.1 0.5 2.8 4.6 13.4Micronesia, Fed.States 0.8 0.8 0.8 0.4 0.5 0.6 11.3 15.5 16.9Brazil 21.9 20.1 17.1 28.9 26.4 19.7 21.2 24.2 23.0 23.8 26.3 27.8Yemen 0.0 0.1 0.3 2.4 3.9 4.7 5.4 6.2 7.0 7.7 8.5 7.6Others 154.5 154.5 167.8 162.8 176.2 166.7 204.4 204.5 221.8 255.4 288.7 347.5Total 1901.1 2007.3 2188.3 2194.1 2468.7 2463.8 2702.2 2735.5 2929.1 3086.1 3124.1 3274.7
in 1 000 tonnesYearly tuna* production by major producing countries,
59

Country 1994 1995 1996 1997 1998 1999 2000 2001 2002 2003 2004 2005
Indonesia 290.7 303.7 367.6 362.3 420.5 453.9 432.3 397.2 393.7 362.1 395.4 347.5Japan 659.8 649.3 554.7 642.3 696.4 609.6 635.8 572.7 - 585.1 482.6 536.6Taiwan PC 351.4 362.8 382.3 354.1 459.8 405.1 435.9 439.3 495.9 439.3 458.7 408.6Philippines 148.6 171.1 171.3 177.4 199.6 203.1 206.2 190.7 211.9 269.6 277.9 285.2Korea Rep 242.6 217.7 195.9 212.1 255.4 182.0 218.2 230.5 257.6 229.4 231.3 252.2USA 253.4 223.7 206.4 205.2 216.8 217.2 152.4 149.7 154.2 112.5 99.9 79.6Spain 253.6 294.5 262.8 258.2 235.9 315.7 303.1 257.6 280.1 312.4 275.6 287.2Ecuador 43.5 60.9 74.7 101.1 128.7 204.6 175.5 145.4 135.9 195.7 176.8 233.0Papua New Guinea 1.4 12.7 10.6 19.4 50.7 39.0 68.8 92.8 124.7 159.6 225.4 235.4Mexico 131.0 140.3 151.2 166.4 135.7 143.9 120.7 145.2 160.7 143.0 150.8 153.4China 13.4 11.7 7.7 6.6 8.1 21.9 23.3 34.7 38.3 82.8 64.4 86.0Sri Lanka 53.4 51.2 60.4 68.6 67.4 86.5 86.3 76.5 76.6 106.5 110.8 83.7Maldives 82.5 82.9 78.9 82.0 92.6 107.2 91.9 102.6 137.2 128.4 132.3 153.6France 198.7 174.8 163.6 137.0 125.8 152.5 151.7 136.0 161.4 174.6 165.7 164.5Kiribati 3.1 5.4 6.6 7.0 9.4 9.8 14.7 5.4 9.8 6.9 6.7 9.2Marshall Is 0.0 0.0 - - - - 7.6 35.8 39.0 37.9 46.7 56.2Ghana 36.0 33.4 37.1 51.6 65.2 83.3 52.6 88.1 61.3 56.6 77.8 76.1Panama 45.8 46.7 30.3 19.1 8.5 15.5 25.2 20.3 29.7 44.0 75.1 92.0Viet Nam - - - - - - 33.6 35.4 37.7 37.5 50.5 52.4Iran (Islamic Rep. of) 33.8 38.4 33.6 28.4 28.9 35.7 36.0 46.6 54.0 73.8 105.2 124.2Seychelles 0.0 0.1 8.8 20.4 29.0 26.4 44.5 54.5 80.0 94.3 101.9Venezuela, Boliv Rep o 80.7 66.6 85.4 85.7 87.4 86.2 90.0 132.2 135.1 113.7 83.5 68.6India 12.8 17.1 15.4 14.7 18.4 18.8 16.1 13.8 16.9 17.7 27.6 32.3Vanuatu 45.1 55.5 45.3 67.9 72.8 89.2 68.5 34.0 42.4 55.9 81.6 98.2Colombia 24.8 36.5 31.2 25.1 20.9 26.0 23.6 27.5 33.2 62.5 29.3 39.4Micronesia, Fed.States 20.9 6.8 7.4 8.3 14.2 10.9 21.7 17.6 20.6 30.8 28.5 28.3Brazil 26.6 23.4 27.8 31.2 30.4 31.2 38.5 39.9 30.3 29.0 32.0 35.2Yemen 8.3 13.2 15.0 17.1 19.1 21.1 23.2 25.2 27.2 25.3 31.3 26.4Others 342.4 388.7 377.1 392.4 428.9 436.3 426.4 432.7 1023.8 449.1 389.0 345.0Total 3404.3 3489.0 3400.6 3550.1 3918.0 4035.2 4006.0 3970.1 4243.6 4421.8 4406.6 4492.0
Yearly tuna production by major producing countries, in 1 000 tonnes, 1979-2012, (cont.)
60

Country 2006 2007 2008 2009 2010 2011 2012
Indonesia 399.1 451.2 485.1 529.3 508.2 611.5 666.4Japan 496.1 548.4 535.9 486.0 531.6 463.1 468.0Taiwan PC 373.5 401.4 328.9 328.2 335.8 316.3 356.4Philippines 313.0 360.6 430.6 412.8 389.4 331.7 347.6Korea Rep 288.8 294.4 281.1 319.7 311.9 244.0 299.5USA 91.7 94.2 135.2 201.2 240.1 226.6 281.5Spain 314.0 210.0 256.6 252.1 259.9 283.2 281.5Ecuador 229.5 171.0 239.6 205.4 171.9 244.4 266.9Papua New Guinea 233.2 230.0 205.7 213.0 208.3 164.6 240.1Mexico 112.2 119.5 117.5 133.6 128.3 119.8 124.2China 97.7 92.9 99.5 124.8 98.4 115.9 108.1Sri Lanka 89.6 96.1 99.6 100.3 110.8 99.7 100.9Maldives 161.3 118.5 110.8 86.8 95.6 93.2 98.4France 143.3 100.6 102.6 90.6 89.4 86.4 77.0Kiribati 6.7 18.0 18.4 34.0 38.9 60.0 76.2Marshall Is 42.3 59.4 33.0 44.0 57.2 90.5 72.4Ghana 51.3 63.3 60.9 65.0 73.1 65.6 69.9Panama 111.2 89.4 101.4 93.5 83.0 80.0 67.7Viet Nam 52.6 54.2 49.9 44.2 41.7 49.6 65.6Iran (Islamic Rep. of) 143.4 84.4 63.4 68.6 53.8 46.3 63.8Seychelles 86.3 58.1 62.1 73.8 81.3 69.5 62.0Venezuela, Boliv Rep o 67.4 54.6 57.5 61.2 45.4 53.4 52.6India 40.8 43.6 40.2 36.3 42.2 42.5 47.4Vanuatu 86.6 89.8 60.3 59.8 48.7 37.3 40.1Colombia 40.8 41.9 48.0 46.7 38.3 45.9 39.3Micronesia, Fed.States 10.8 15.4 19.4 21.2 23.8 28.4 37.6Brazil 28.9 31.8 25.0 28.0 25.7 37.5 37.0Yemen 19.3 15.9 13.7 14.9 16.0 24.9 35.8Others 376.0 340.6 346.2 360.0 396.5 434.9 422.3Total 4507.5 4349.1 4428.2 4535.1 4545.1 4566.7 4905.8*Skipjack tuna Atlantic bluefin tunaYellowfin tuna Southern bluefin tunaBigeye tuna Pacific bluefin tunaAlbacore
AN 010901. 1405.Source: Fishstat Plus - 20140502.
in 1 000 tonnes, 1979-2012Yearly tuna production by major producing countries,
61

Country 1982 1983 1984 1985 1986 1987 1988 1989 1990 1991 1992 1993
Thailand 8.5 18.1 39.9 87.1 142.0 144.9 207.8 225.1 233.0 272.8 243.6 220.7Spain 56.3 53.5 55.7 55.0 59.3 63.1 67.1 75.0 81.8 72.3 82.9 114.6Ecuador 11.3 4.9 8.8 9.6 10.8 9.8 8.5 9.1 12.5 12.1 18.3 21.8USA 245.6 268.3 285.4 250.0 294.5 296.7 271.3 311.3 263.9 269.0 273.9 280.8Iran (Islamic Rep. of) 3.3 3.4 4.9 5.6 4.2 4.7 9.5 10.4 12.2 12.6 18.7 21.6Indonesia 5.6 10.7 2.2 1.2 1.8 4.3 8.5 20.6 18.7 41.1 23.1 10.9Italy 48.0 52.0 58.5 64.5 78.7 84.0 80.0 85.0 86.1 87.0 93.1 62.8Philippines 19.4 23.5 22.6 25.3 26.4 26.1 37.1 47.5 44.7 46.1 47.0 55.5Mauritius 2.8 3.8 3.5 4.2 4.4 4.5 4.3 8.3 10.0 13.8 14.0 10.3Mexico 13.3 10.5 22.3 26.1 22.7 17.5 23.0 23.4 21.6 47.3 58.3 48.1Japan 125.0 140.1 144.6 134.1 128.6 127.5 132.1 103.8 92.1 99.7 98.1 91.6Seychelles - - - - - 1.4 4.0 4.3 4.1 4.3 3.2 4.5Côte d'Ivoire 20.4 23.4 23.1 22.2 23.8 29.4 31.6 38.3 41.4 47.2 41.4 49.9France 18.0 17.7 21.9 25.1 29.1 29.6 28.1 32.6 31.5 33.4 32.0 33.4Madagascar - - - - - - - - - - 7.7 8.8Portugal 7.1 7.3 8.9 9.4 12.2 10.3 11.2 13.2 16.6 21.4 17.4 16.6El Salvador - - - - - - - - - - - -Ghana 2.9 3.2 2.9 3.4 3.5 3.3 3.5 3.2 4.1 3.7 3.1 3.7Peru 1.2 1.7 0.6 0.1 0.1 1.3 1.7 0.5 1.0 1.7 1.6 1.3Tunisia 1.3 1.2 1.3 1.1 0.8 1.5 2.6 2.1 2.9 1.5 1.0 0.5Others 59.0 73.9 80.2 78.0 88.5 68.0 82.9 79.9 82.5 104.6 99.5 97.5Totals 649.0 717.2 787.3 802.0 931.4 927.8 1014.9 1093.7 1060.7 1191.7 1177.8 1155.0
Country 1994 1995 1996 1997 1998 1999 2000 2001 2002 2003 2004 2005
Thailand 252.6 245.0 212.0 230.0 252.0 284.0 269.1 299.0 330.0 400.0 380.0 460.5Spain 146.1 161.2 153.5 160.5 203.2 208.9 224.4 233.9 256.5 227.0 240.5 206.7Ecuador 29.7 29.6 26.5 27.2 64.7 45.6 53.6 65.8 143.8 166.3 202.5 174.0USA 276.5 302.4 306.6 284.4 308.8 303.5 304.2 230.3 248.1 240.1 194.5 201.8Iran (Islamic Rep. of) 20.0 27.7 23.0 22.7 23.6 28.6 20.6 39.4 42.5 51.9 61.3 69.0Indonesia 24.3 29.3 31.1 23.9 39.9 36.3 44.7 35.2 38.3 46.8 48.3 50.8Italy 68.8 64.0 74.7 62.8 80.7 75.0 68.9 77.7 84.4 57.2 60.7 54.4Philippines 58.0 46.7 58.4 56.2 53.1 36.9 36.5 33.9 48.0 56.9 53.9 30.8Mauritius 11.9 16.2 14.7 14.4 14.3 12.7 18.3 26.0 27.4 30.8 34.2 38.9Mexico 53.9 54.1 51.1 66.5 55.1 57.2 48.9 60.6 71.8 70.0 71.0 71.5Japan 82.7 77.0 71.4 68.0 66.0 65.5 69.5 60.7 62.1 61.0 58.3 56.3Seychelles 5.1 7.5 12.7 15.1 18.9 33.2 28.8 27.8 34.5 36.4 36.1 40.6Côte d'Ivoire 43.6 57.1 61.9 49.1 58.1 46.2 57.1 58.8 121.8 47.7 50.5 29.1France 35.0 46.4 43.2 43.6 39.5 44.9 44.4 47.7 48.6 46.3 45.0 42.9Madagascar 11.1 14.0 14.0 12.0 13.1 13.5 10.0 13.9 12.5 20.2 18.5 9.0Portugal 20.2 21.3 20.8 17.9 19.3 18.4 16.7 13.7 12.8 14.6 15.7 16.4El Salvador - - - - - - - - - 1.2 9.6 12.7Ghana 5.4 10.5 12.8 22.8 17.0 21.3 25.1 27.0 25.3 25.5 28.3 11.9Peru 0.2 0.6 0.4 0.6 4.8 0.2 1.8 3.4 4.2 5.0 2.5 7.3Tunisia 0.5 0.5 0.5 2.5 6.1 9.5 9.0 9.0 16.0 19.6 11.6 17.5Others 89.2 85.2 77.9 77.7 67.1 61.3 54.3 52.6 48.3 55.1 44.7 81.3Totals 1234.8 1296.4 1267.1 1258.0 1405.5 1402.7 1405.8 1416.2 1676.9 1679.7 1667.8 1683.4
TUNA PROCESSING
Yearly world production of canned tuna by major producing countries, in 1 000 tonnes
62

Country 2006 2007 2008 2009 2010 2011
Thailand 503.7 472.0 510.0 534.6 588.8 576.5Spain 219.9 267.7 267.8 230.6 243.9 248.4Ecuador 185.0 151.8 167.6 184.1 185.0 220.0USA 201.7 197.9 215.0 167.5 179.4 174.4Iran (Islamic Rep. of) 84.0 69.9 58.0 59.0 60.7 81.3Indonesia 44.6 47.0 42.9 55.2 55.0 70.0Italy 62.0 50.0 64.0 60.3 64.5 62.2Philippines 38.5 48.3 77.0 84.0 100.0 58.0Mauritius 57.9 44.3 44.5 82.4 97.2 57.6Mexico 67.3 38.2 35.9 41.0 37.5 37.8Japan 53.5 47.7 45.6 43.7 39.5 37.6Seychelles 40.2 31.6 28.9 29.3 30.3 30.2Côte d'Ivoire 34.9 37.6 35.5 29.5 27.0 22.9France 37.2 35.7 36.9 31.9 23.4 20.3Madagascar 16.9 12.4 11.0 14.0 16.0 19.0Portugal 13.9 14.5 13.2 15.9 14.6 17.0El Salvador 12.2 24.1 22.7 16.9 14.2 14.3Ghana 5.9 8.5 5.0 9.8 9.7 9.7Peru 4.9 1.8 2.1 2.9 8.5 9.0Tunisia 18.5 16.4 16.4 15.2 7.1 8.2Others 55.1 49.7 37.4 35.1 27.7 26.2Totals 1757.7 1666.9 1737.4 1743.0 1830.1 1800.4
AN 010953. 1405.Source: Fishstat Plus - 20140502.
Yearly world production of canned tuna by major producing countries, in 1 000 tonnes (cont.)
63

GLOBEFISH RESEARCH PROGRAMME
Food and Agriculture Organization of the United NationsFishery Industries Division
Viale delle Terme di Caracalla00100 Rome, Italy
Tel.: +39 06 5705 4759Fax: +39 06 5705 5188
www.globefish.org
Fishery Industry in China
Volume 76