Globefish Commodity Update - April 2013 · Groundfish COMMODITY update The COMMODITY UPDATE...
122
Groundfish Extract from GLOBEFISH Databank Prices - Exports - Imports - Production April 2013 COMMODITY UPDATE
Transcript of Globefish Commodity Update - April 2013 · Groundfish COMMODITY update The COMMODITY UPDATE...
Groundfish
Extract from GLOBEFISH Databank Prices - Exports - Imports - Production
April 2013
Commodity Update
Food and Agriculture Organization of the United NationsProducts, Trade and Marketing Service
Viale delle Terme di Caracalla00153 Rome, Italy
Contact: [email protected]
Groundfish
COMMODITY
update
The COMMODITY UPDATE reports, issued for each commodity once a year, contain
information on prices, imports, exports and production by commodity. The information is taken form the network of GLOBEFISH correspondents and the GLOBEFISH European Price Report,
INFOFISH Trade News, FAO FISHDAB, EUROSTAT and others.
The issues are scheduled approximately as follows:
FISHMEAL - FISH OIL –Spring CRAB - Autumn
BIVALVES - Spring LOBSTER - Autumn SALMON - Spring CEPHALOPODS - Winter FRESHWATER FISH - Spring GROUNDFISH - Winter
SHRIMP - Summer SMALL PELAGICS - Winter TUNA - Summer
For single issues For an annual subscription to please contact the complete set please contact
GLOBEFISH EUROFISH
Vial.e delle Terme di Caracalla . H.C. Andersens Blvd. 44-46
00153 Rome . 1553 Copenhagen VITALY Denmark
Tel: ++39 0657054163 . Tel.: ++45 33377755
Fax: ++39 0657053020 . Fax: ++45 33377756
E - mail: [email protected] . E - mail: [email protected]
Web si.te: www.gl.obefi.sh.org . Web site: www. eurofish.dk
Prepared by Felix Dent
Al l ri g hts re s e rve d. No part of FAO/GLOBEFISH COMMODITY UPDATE may be reproduced, stored in a retrieval system, or transmitted in any form or by any means (electronic, mechanical, photocopying or otherwise), without the prior permission of FAO.
Requests for use of this material (including purpose and extent) should be addressed to the Director, Publications Division, Food
and Agriculture Organization of the United Nations, Viale delle Terme di Caracalla, 00153 Rome, Italy.
Layout: Turan Rahimzadeh.

Groundfish Market Report 1
PRICES
COD
Cod prices, standard 16-1/2 lb blocks, CFR, East Coast (USA),
origin Canada, in USD/lb, 1983-2013 (monthly) 6
Cod fillet block prices, skinless & boneless, DAP, in Germany,
origin Poland/Norway, in EUR/kg, 2004-2013 (monthly) 7
HAKE
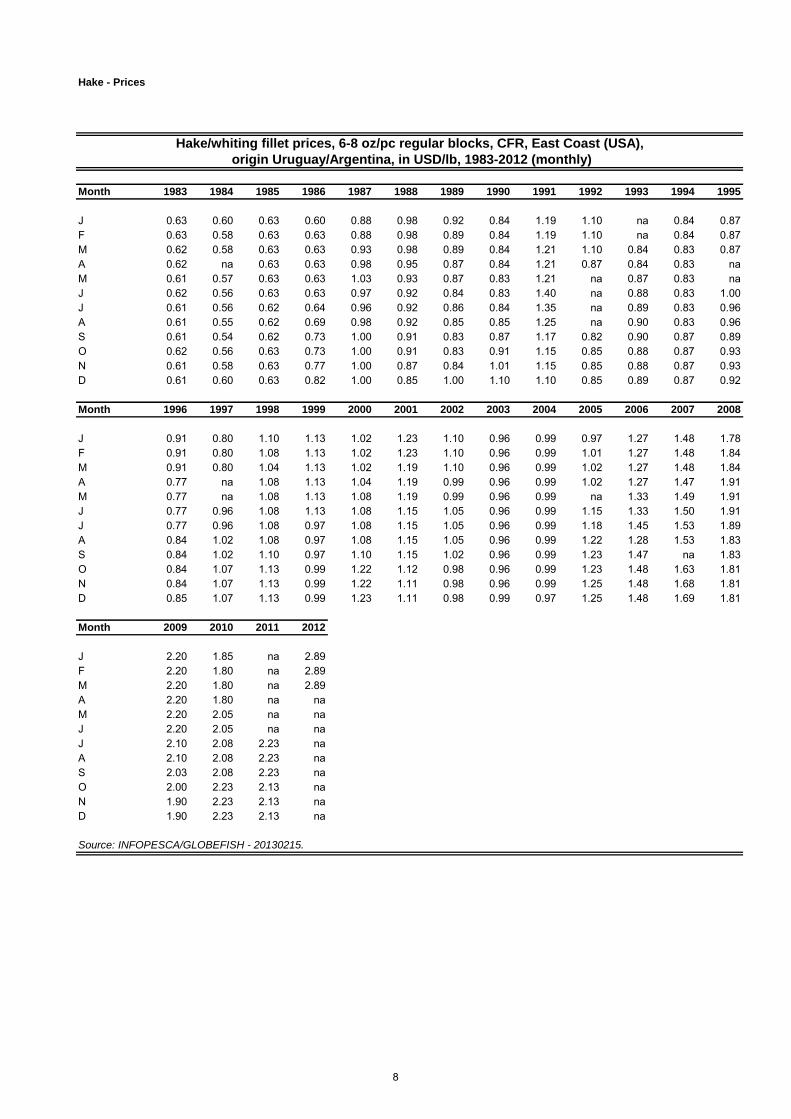
Hake/whiting fillet prices, 6-8 oz/pc regular blocks, CFR, East Coast (USA),
origin Uruguay/Argentina, in USD/lb, 1983-2012 (monthly) 8
Hake (Merluccius gayi) prices, CFR, in Europe,
origin Chile, in USD/kg, 2003-2010 (monthly) 9
Hake (Merluccisus capensis ) prices, DDP, in Spain,
origin Namibia, in EUR/kg, 2006-2012 (monthly) 10
ALASKA POLLACK
Alaska Pollack frozen fillet block prices, CFR, in Boston,
domestic production, in USD/lb, 2001-2013 (monthly) 11
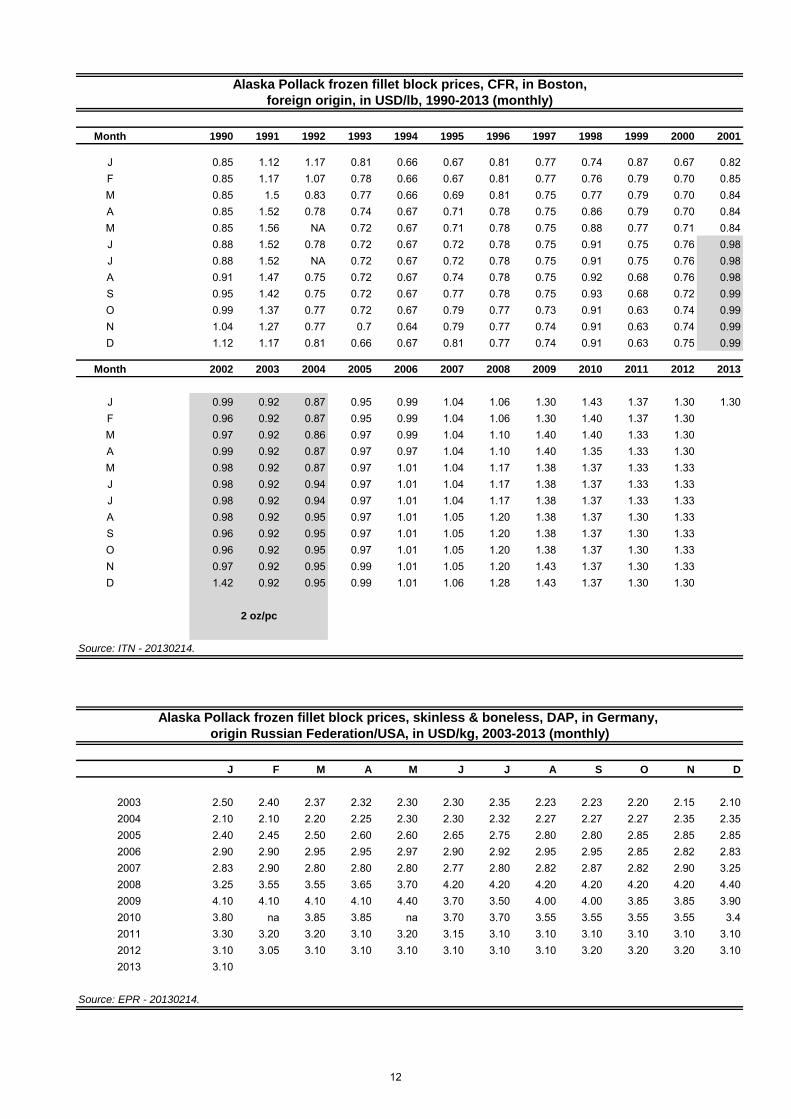
Alaska Pollack frozen fillet block prices, CFR, in Boston,
foreign origin, in USD/lb, 1990-2013 (monthly) 12
Alaska Pollack frozen fillet block prices, skinless & boneless, DAP, in Germany,
origin Russian Federation/USA, in USD/kg, 2003-2013 (monthly) 12
TURBOT
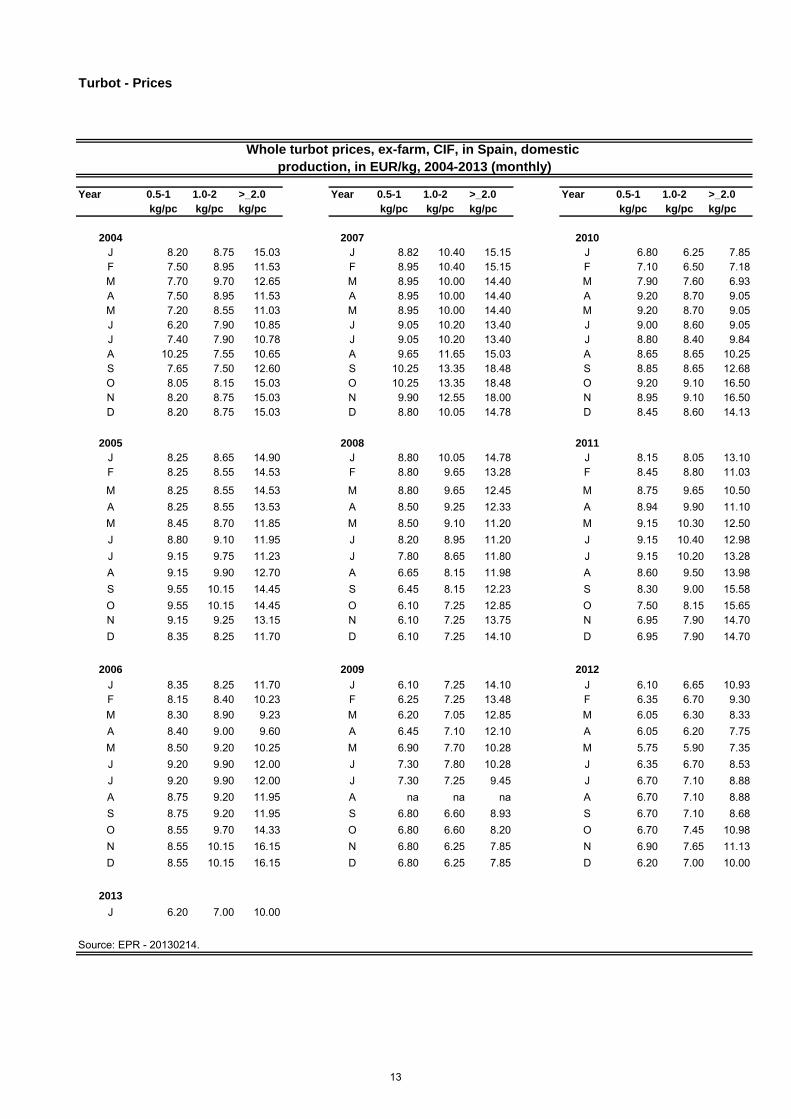
Whole turbot prices, ex-farm, CIF, in Spain, domestic
production, in EUR/kg, 2004-2013 (monthly) 13
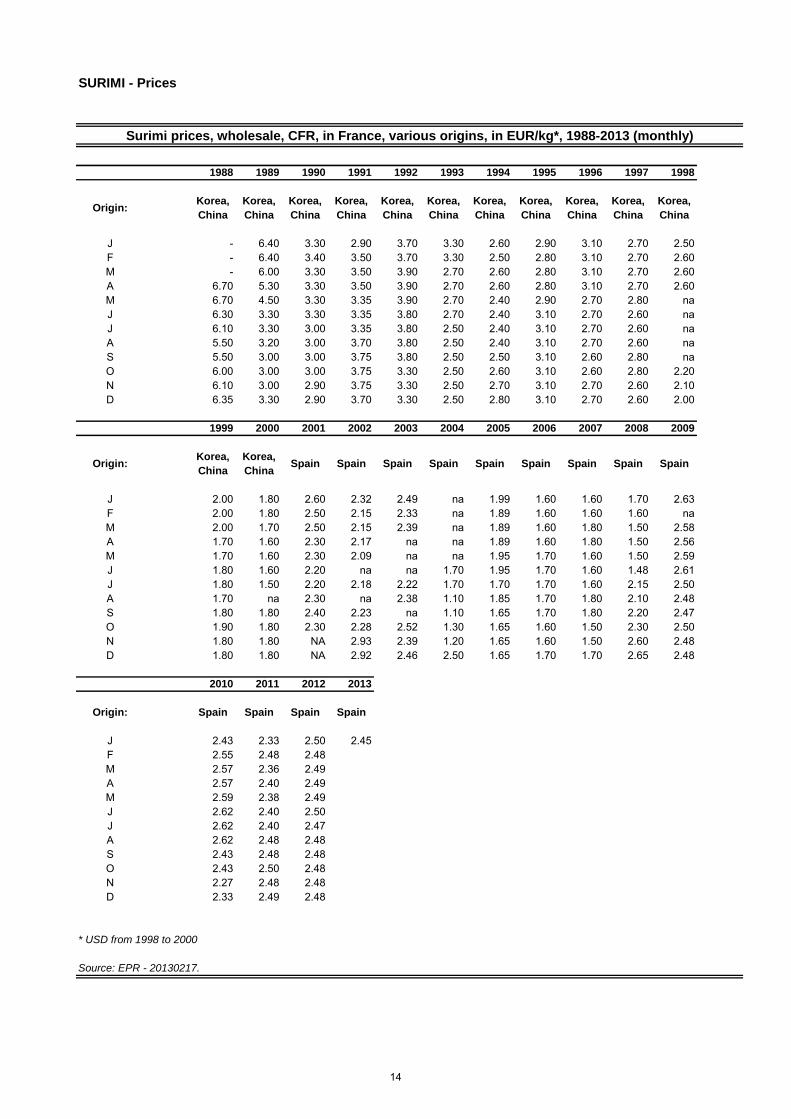
SURIMI
Surimi prices, wholesale, CFR, in France, various origins, in EUR/kg*, 1988-2013 (monthly) 14
i
TABLE OF CONTENTS
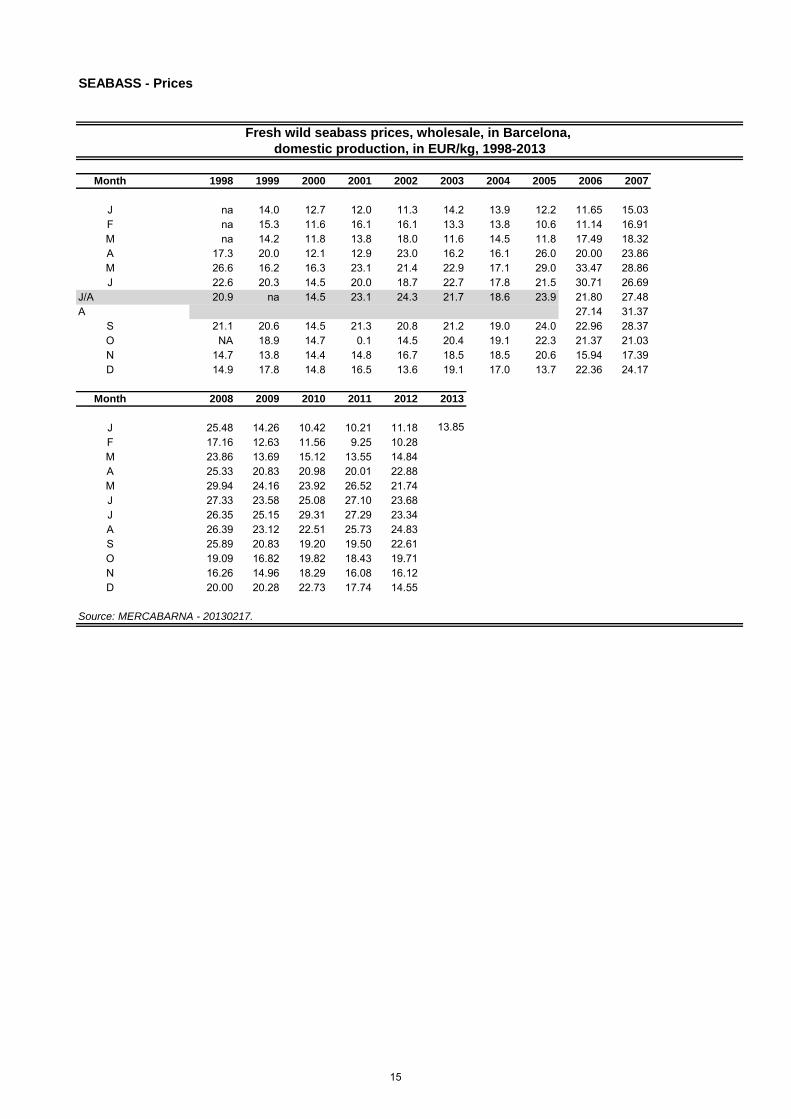
SEABASS
Fresh wild seabass prices, wholesale, in Barcelona,
domestic production, in EUR/kg, 1998-2013 15
Fresh farmed seabass prices, whole, 300-450 gr/pc, CIF,
in Italy, origin Greece, in EUR/kg, 1999-2013 (monthly) 16
Fresh farmed seabass prices, wholesale, in Barcelona,
domestic production, in USD/kg, 1998-2013 (monthly) 17
Fresh farmed seabass prices, 300-450 g, CIF, in France,
origin Greece, in USD/kg, 1988-2010 (monthly) 18
SEABREAM
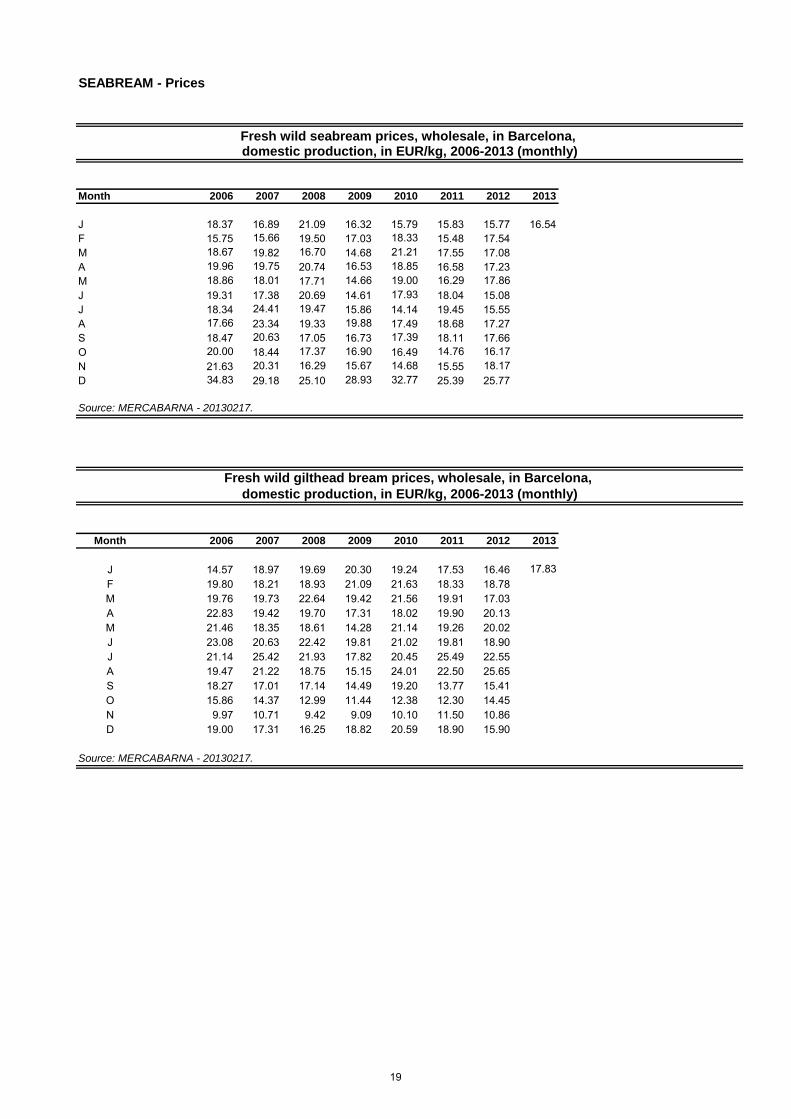
Fresh wild seabream prices, wholesale, in Barcelona,
domestic production, in EUR/kg, 2006-2013 (monthly) 19
Fresh wild gilthead bream prices, wholesale, in Barcelona,
domestic production, in EUR/kg, 2006-2013 (monthly) 19
Fresh farmed gilthead bream, wholesale, in Barcelona,
domestic production, in EUR/kg, 1998-2013 (monthly) 20
Fresh farmed seabream prices, 300-450 gr/pc, CIF,
in Italy, origin Greece, in EUR/kg, 1999-2013 (monthly) 21
Fresh farmed seabream prices, 300-450 gr, CIF, in France,
origin Greece, in EUR/kg, 2004-2010 (monthly) 21
SAITHE
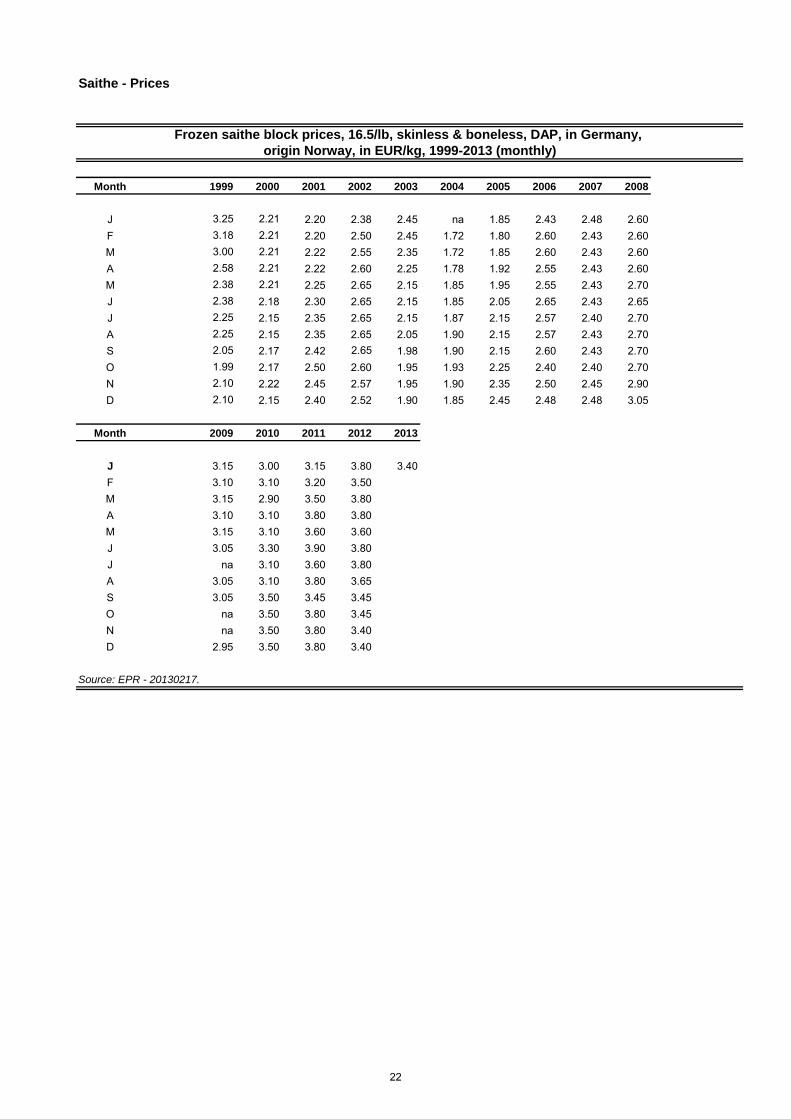
Frozen saithe block prices, 16.5/lb, skinless & boneless, DAP, in Germany,
origin Norway, in EUR/kg, 1999-2013 (monthly) 22
GROUNDFISH - GENERAL
Dover Sole prices, raw material, FOB, Netherlands,
domestic production, in EUR/kg, 2003-2010 (monthly) 23
Fresh monkfish prices, skin-off, DDP, in Spain,
origin Namibia, in EUR/kg, 2007-2012 (monthly) 23
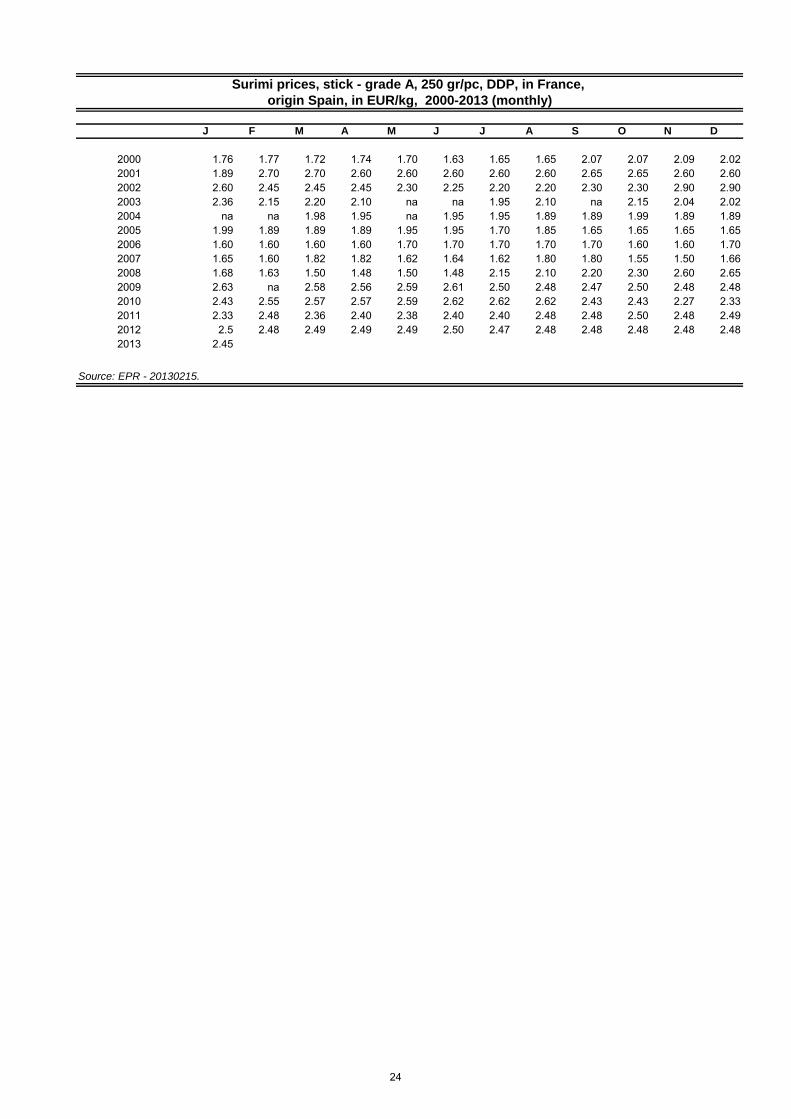
Surimi prices, stick - grade A, 250 gr/pc, DDP, in France,
origin Spain, in EUR/kg, 2000-2013 (monthly) 24
ii
IMPORTS
COD
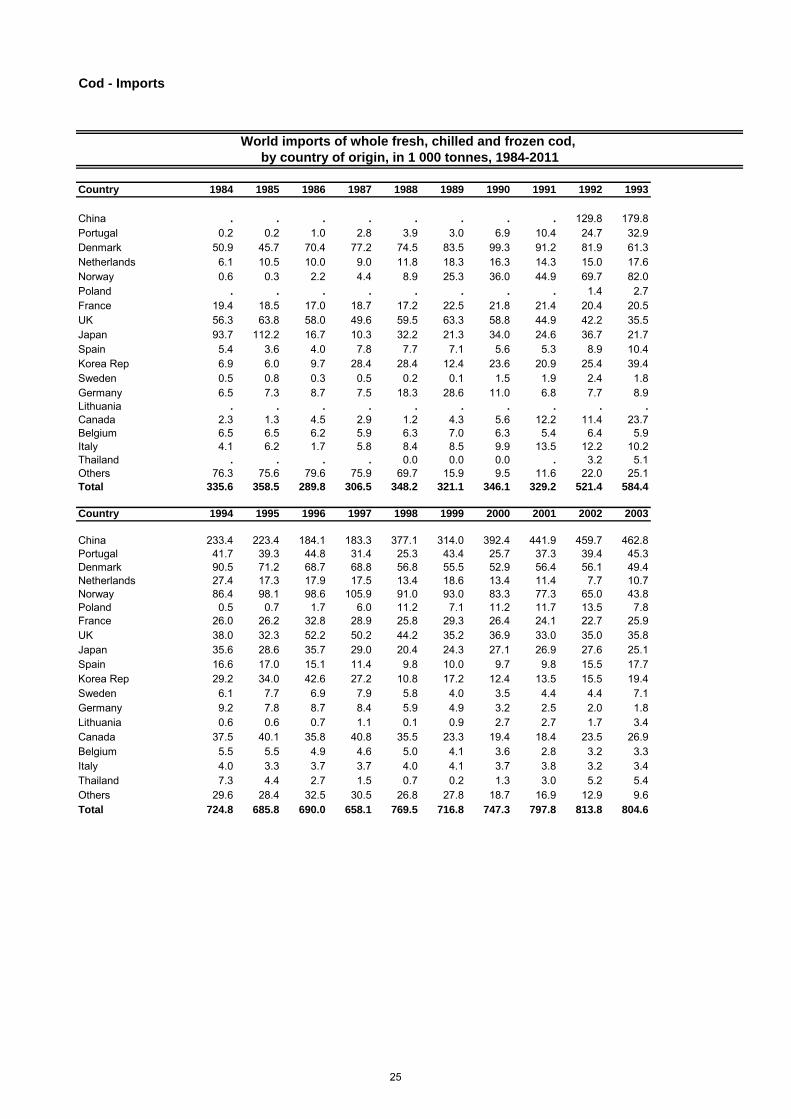
World imports of whole fresh, chilled and frozen cod,
by country of origin, in 1 000 tonnes, 1984-2011 25
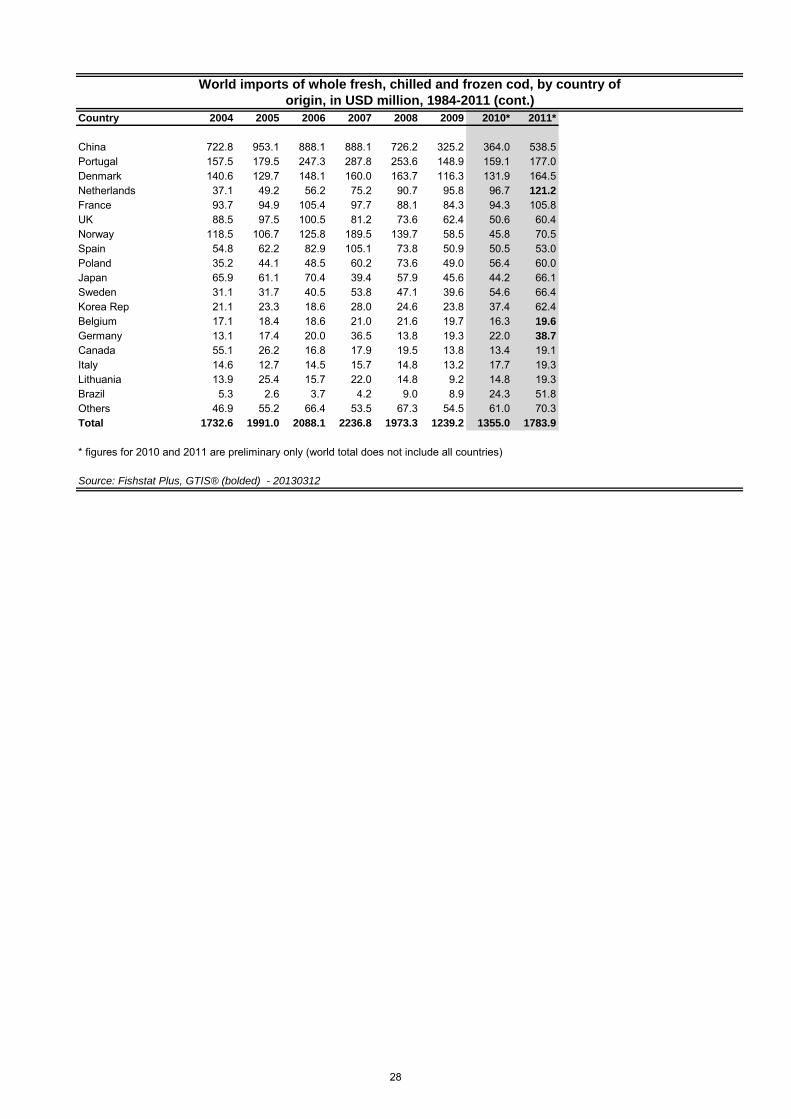
World imports of whole fresh, chilled and frozen cod, by country of
origin, in USD million, 1984-2011 27
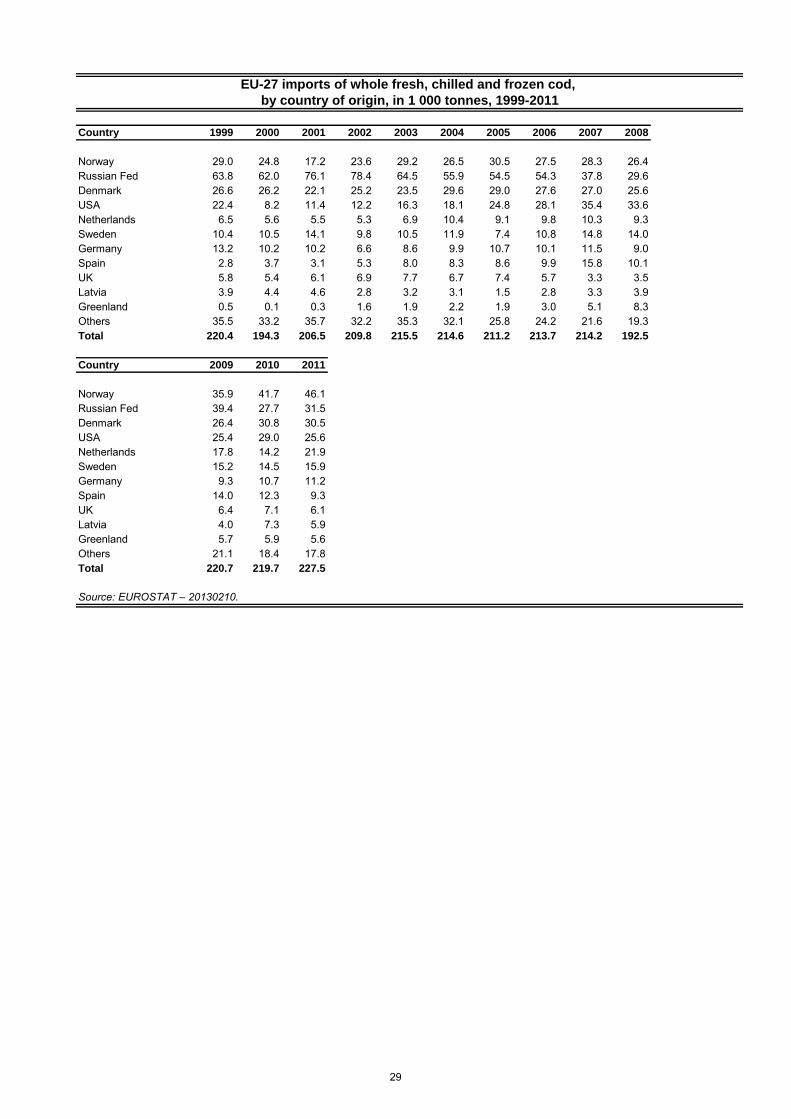
EU-27 imports of whole fresh, chilled and frozen cod,
by country of origin, in 1 000 tonnes, 1999-2011 29
EU-27 imports of whole fresh, chilled and frozen cod,
by country of origin, in EUR million, 1999-2011 30
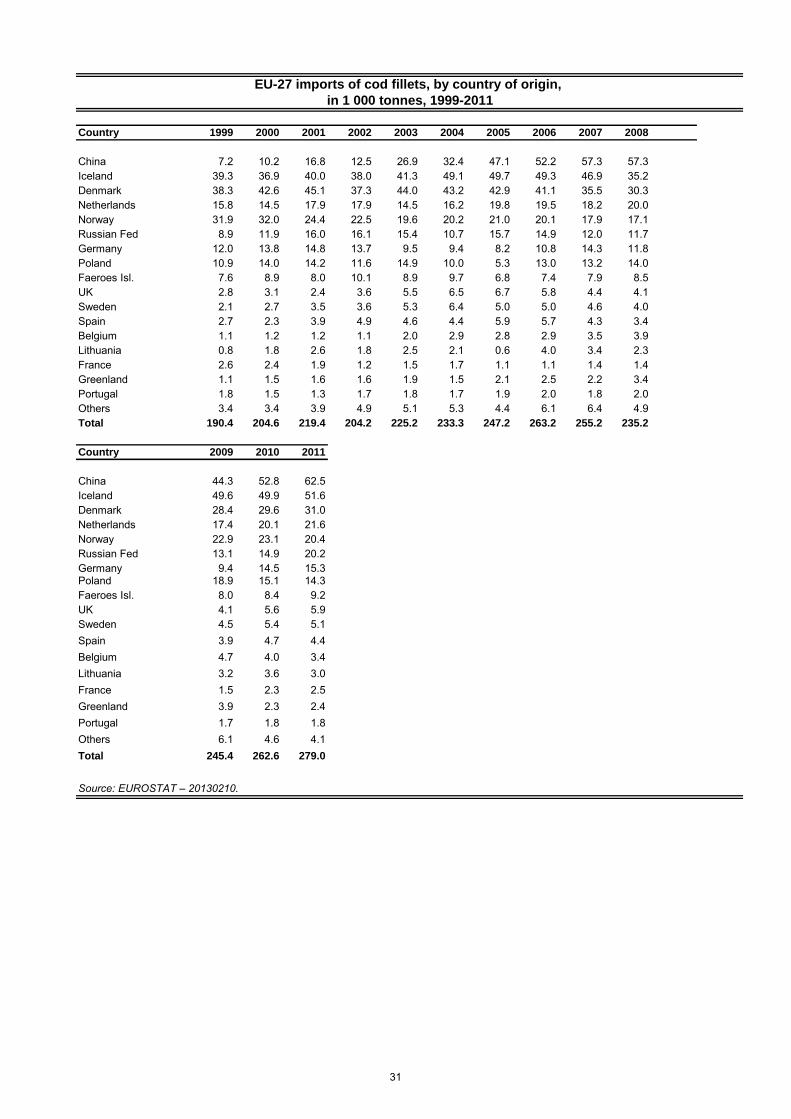
EU-27 imports of cod fillets, by country of origin,
in 1 000 tonnes, 1999-2011 31
EU-27 imports of cod fillets, by country of origin,
in EUR million, 1999-2011 32
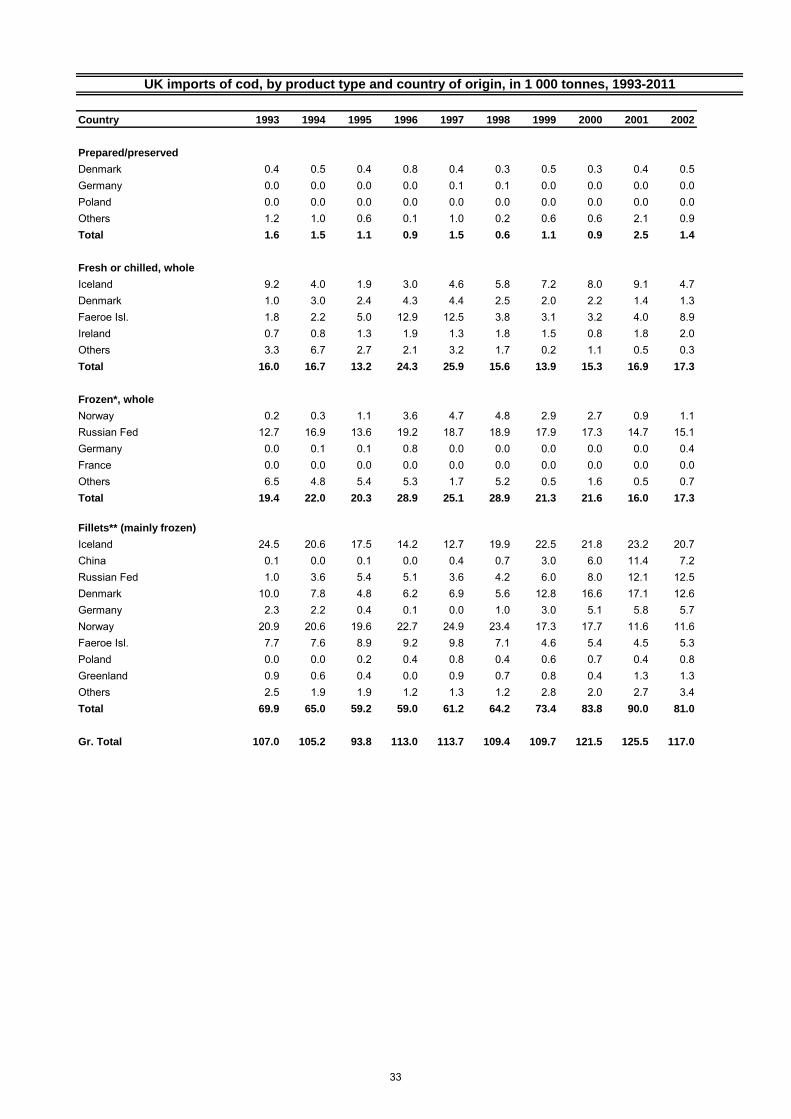
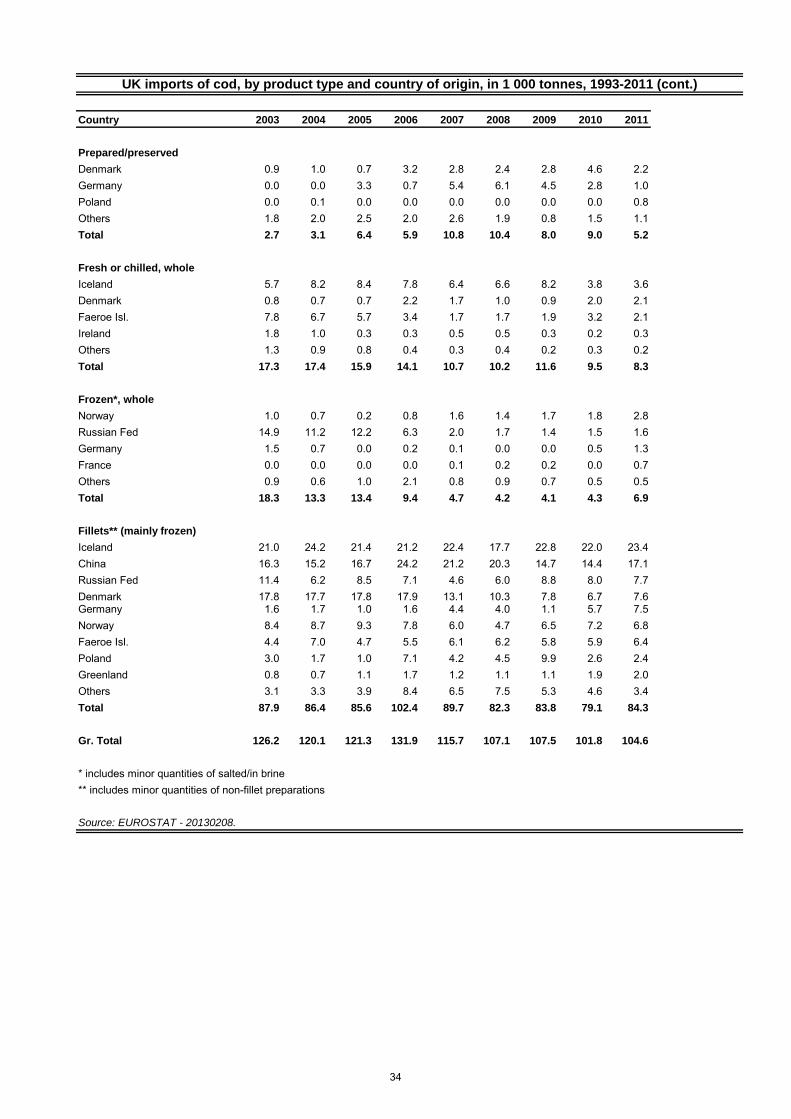
UK imports of cod, by product type and country of origin, in 1 000 tonnes, 1993-2011 33
Portuguese imports of cod, by product type and country of origin,
in 1 000 tonnes, 1993-2011 35
French imports of cod, by product type and country of origin, in 1 000 tonnes, 1993-2011 37
Chinese imports of frozen cod, by country of origin, in 1 000 tonnes, 1995-2011 39
HAKE
World imports of whole fresh, chilled and frozen hake,
by country of origin, in 1 000 tonnes, 1984-2011 40
World imports of whole fresh, chilled and frozen hake,
by country of origin, in USD million, 1984-2011 41
EU-27 imports of whole fresh, chilled and frozen hake,
by country of origin, in 1 000 tonnes, 1999-2011 43
EU-27 imports of whole fresh, chilled, frozen hake,
by country of origin, in EUR million, 1999-2011 44
EU-27 imports of hake fillets, by country of origin, in 1 000 tonnes, 1999-2011 45
EU-27 imports of hake fillets, by country of origin,
in EUR million, 1999-2011 46
Brazilian imports of frozen hake fillets, by country of origin, in 1 000 tonnes, 1997-2011 46
iii
ALASKA POLLACK
EU-27 imports of whole fresh, chilled and frozen Alaska pollack,
by country of origin, in 1 000 tonnes, 1999-2011 47
EU-27 imports of whole fresh, chilled and frozen Alaska pollack, by
country of origin, in EUR million, 1999-2011 47
EU-27 imports of Alaska pollack fillets, by country of
origin, in 1 000 tonnes, 1999-2011 48
EU-27 imports of Alaska pollack fillets, by country of
origin, in EUR million, 1999-2011 49
USA imports of frozen Alaska pollack fillets,
by country of origin, in 1 000 tonnes, 1990-2011 49
SURIMI
Japanese imports of frozen surimi, by country of
origin, in 1 000 tonnes, 1995-2011 50
SAITHE
EU-27 imports of whole fresh, chilled and frozen saithe,
by country of origin, in 1 000 tonnes, 1999-2011 51
EU-27 imports of whole fresh, chilled and frozen saithe,
by country of origin, in EUR million, 1999-2011 52
EU-27 imports of fresh, chilled and frozen saithe fillets, by
country of origin, in 1 000 tonnes, 1999-2011 53
EU-27 imports of fresh, chilled and frozen saithe fillets,
by country of origin, in EUR million, 1999-2011 53
German imports of fresh, chilled and frozen saithe fillets, by
country of origin, in 1 000 tonnes, 1993-2011 54
GROUNDFISH - GENERAL
EU-27 imports of frozen Patagonian toothfish fillets,
by country of origin, in 1 000 tonnes, 2000-2011 55
EU-27 imports of frozen Patagonian toothfish fillets,
by country of origin, in EUR million, 2000-2011 55
EU-27 imports of fresh, chilled and frozen Patagonian toothfish,
by country of origin, in tonnes, 2007-2011 56
iv
EU-27 imports of fresh, chilled and frozen Patagonian toothfish,
by counrty of origin, in EUR 1 000, 2007-2011 56
Japanese imports of frozen Patagonian
toothfish, in tonnes, 1998-2011 57
Japanese imports of frozen Patagonian toothfish,
in USD million, 1998-2011 57
US imports of Patagonian toothfish, by product type
and country of origin, in tonnes, 1998-2011 58
EU-27 imports of whole fresh, chilled and frozen redfish,
by country of origin, in 1 000 tonnes, 1999-2011 59
EU-27 imports of whole fresh, chilled and frozen redfish, by
country of origin, in EUR million, 1999-2011 60
EU-27 imports of redfish fillets, by country
of origin, in 1 000 tonnes, 1999-2011 61
EU-27 imports of redfish fillets, by country
of origin, in EUR million, 1999-2011 62
EU-27 imports of whole fresh, chilled and frozen haddock,
by country of origin, in 1 000 tonnes, 1999-2011 63
EU-27 imports of whole fresh, chilled and frozen haddock,
by country of origin, in EUR million, 1999-2011 64
EU-27 imports of frozen haddock fillets, by
country of origin, in 1 000 tonnes, 1999-2011 65
EU-27 imports of frozen haddock fillets, by
country of origin, in EUR million, 1999-2011 66
EU-27 imports of whole fresh, chilled and frozen flatfish*, by
country of origin, in 1 000 tonnes, 1999-2011 67
EU-27 imports of whole fresh, chilled and frozen flatfish*,
by country of origin, in EUR million, 1999-2011 68
EU-27 imports of flatfish* fillets, by country
of origin, in 1 000 tonnes, 1999-2011 69
EU-27 imports of flatfish* fillets, by country of
of origin, in EUR million, 1999-2011 69
World imports of frozen groundfish** fillets, in 1 000 tonnes, 1984-2011 70
v
EU-27 imports of frozen groundfish* fillets, by
country of origin, in 1 000 tonnes, 1999-2011 72
Chinese imports of whole frozen flatfish*, by country
of origin, in 1 000 tonnes, 1995-2011 73
USA imports of groundfish, by product type and
country of origin, in 1 000 tonnes, 1990-2011 74
EXPORTS
COD
EU-27 exports of whole fresh, chilled and frozen cod,
by country of destination, in 1 000 tonnes, 1999-2011 76
EU-27 exports of cod fillets, by country of
destination, in 1 000 tonnes, 1999-2011 77
HAKE
EU-27 exports of whole fresh, chilled and frozen hake, by country
of destination, in 1 000 tonnes, 1999-2011 78
KLIPFISH
Norwegian exports of salted and dried groundfish (klipfish),
by country of destination, in 1 000 tonnes, 1988-2011 79
SALTFISH
Norwegian exports of salted, non-dried fish (saltfish), by country
of destination, in 1 000 tonnes, 1993-2011 80
GROUNDFISH
EU-27 exports of flatfish* fillets, by country of
destination, in 1 000 tonnes, 1999-2011 81
World exports of selected cured groundfish products*
(including re-exports), in 1 000 tonnes, 1982-2009 82
World exports of fresh and frozen Patagonian toothfish,
by major exporting countries, in tonnes, 1988-2007 84
EU-27 exports of frozen Patagonian toothfish, by country
of destination, in EUR million, 2000-2011 85
vi
EU-27 exports of frozen Patagonian toothfish, by country
of destination, in 1 000 tonnes, 2000-2011 86
EU-27 exports of frozen Patagonian toothfish fillets,
by country of destination, in tonnes, 2000-2011 86
EU-27 exports of frozen Patagonian toothfish fillets,
by country of destination, in EUR 1 000, 2000-2011 87
PRODUCTION
COD
World cod* (Gadus species ) production, by major
producing countries, in 1 000 tonnes, 1984-2011 88
HAKE
World hake* production, by major producing
countries, in 1 000 tonnes, 1984-2011 90
ALASKA POLLACK
World Alaska pollack production, by major producing
countries, in 1 000 tonnes, 1984-2011 92
SEABASS
World aquaculture production of European seabass, by
major producing countries, in 1 000 tonnes, 1984-2011 93
SEABREAM
World aquaculture production of gilthead seabream, by major
producing countries, in 1 000 tonnes, 1984-2011 94
GROUNDFISH - GENERAL
World flatfish* production, by major producing
countries, in 1 000 tonnes, 1984-2011 95
World flatfish* production, by major species, in 1 000 tonnes, 1984-2011 97
World haddock production, by major producing countries, in 1 000 tonnes, 1984-2011 98
vii
World redfish (sebastes ) production, by major
producing countries, in 1 000 tonnes, 1984-2011 99
Icelandic groundfish landings, by selected species,
in 1 000 tonnes, 1992-2011 100
World groundfish* production, by major species, in 1 000 tonnes, 1984-2011 101
World groundfish* production, by major producing
countries, in 1 000 tonnes, 1984-2011 102
USA groundfish landings, by selected species, 1 000 tonnes, 1984-2011 104
PROCESSING
COD
World production of frozen cod fillets, by major
producing countries, in 1 000 tonnes, 1984-2009 105
World production of fresh cod fillets, by major producing
countries, in 1 000 tonnes, 1984-2009 106
HAKE
World production of fresh, frozen and canned hake, by selected products
and major producing countries, in 1 000 tonnes, 1984-2009 107
KLIPFISH
World production of stockfish and klipfish (Atl. cod), by major
producing countries, in 1 000 tonnes, 1984-2009 110
viii
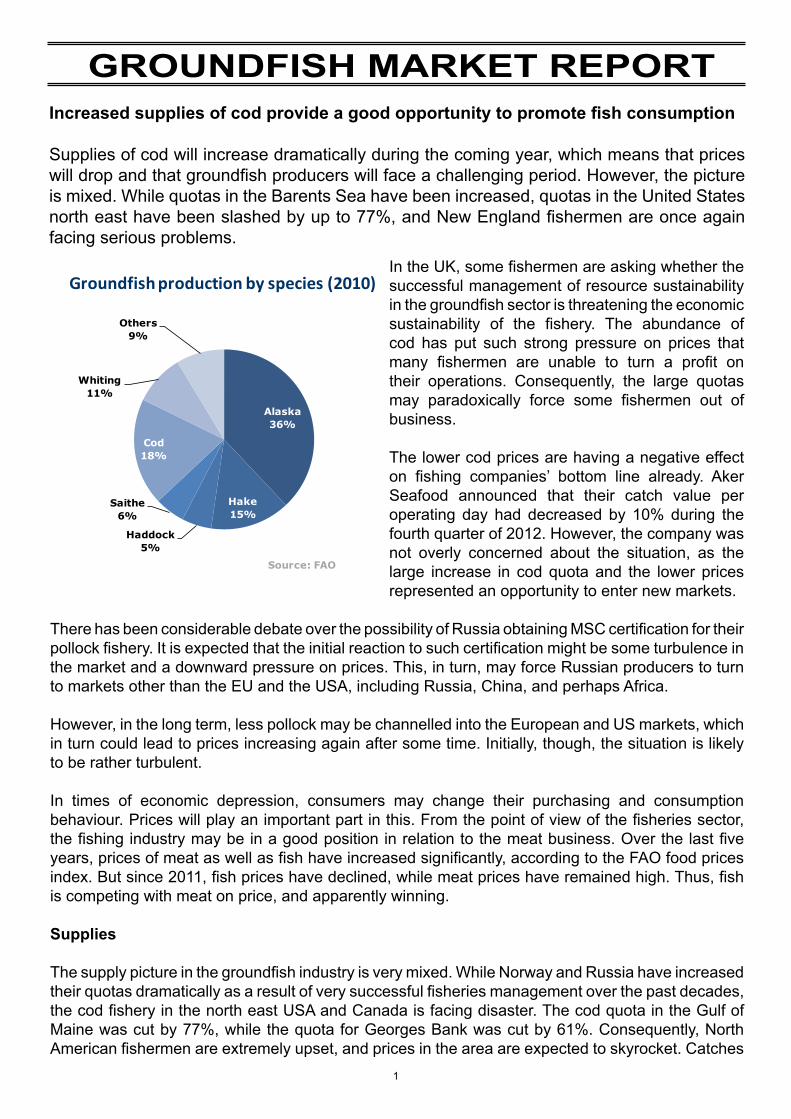
GROUNDFISH MARKET REPORTIncreased supplies of cod provide a good opportunity to promote fish consumption
Supplies of cod will increase dramatically during the coming year, which means that prices will drop and that groundfish producers will face a challenging period. However, the picture is mixed. While quotas in the Barents Sea have been increased, quotas in the United States north east have been slashed by up to 77%, and New England fishermen are once again facing serious problems.
In the UK, some fishermen are asking whether the successful management of resource sustainability in the groundfish sector is threatening the economic sustainability of the fishery. The abundance of cod has put such strong pressure on prices that many fishermen are unable to turn a profit on their operations. Consequently, the large quotas may paradoxically force some fishermen out of business.
The lower cod prices are having a negative effect on fishing companies’ bottom line already. Aker Seafood announced that their catch value per operating day had decreased by 10% during the fourth quarter of 2012. However, the company was not overly concerned about the situation, as the large increase in cod quota and the lower prices represented an opportunity to enter new markets.
There has been considerable debate over the possibility of Russia obtaining MSC certification for their pollock fishery. It is expected that the initial reaction to such certification might be some turbulence in the market and a downward pressure on prices. This, in turn, may force Russian producers to turn to markets other than the EU and the USA, including Russia, China, and perhaps Africa.
However, in the long term, less pollock may be channelled into the European and US markets, which in turn could lead to prices increasing again after some time. Initially, though, the situation is likely to be rather turbulent.
In times of economic depression, consumers may change their purchasing and consumption behaviour. Prices will play an important part in this. From the point of view of the fisheries sector, the fishing industry may be in a good position in relation to the meat business. Over the last five years, prices of meat as well as fish have increased significantly, according to the FAO food prices index. But since 2011, fish prices have declined, while meat prices have remained high. Thus, fish is competing with meat on price, and apparently winning.
Supplies
The supply picture in the groundfish industry is very mixed. While Norway and Russia have increased their quotas dramatically as a result of very successful fisheries management over the past decades, the cod fishery in the north east USA and Canada is facing disaster. The cod quota in the Gulf of Maine was cut by 77%, while the quota for Georges Bank was cut by 61%. Consequently, North American fishermen are extremely upset, and prices in the area are expected to skyrocket. Catches
Alaska36%
Hake15%
Haddock5%
Saithe6%
Cod18%
Whiting 11%
Others9%
Groundfish production by species (2010)
Source: FAO
1
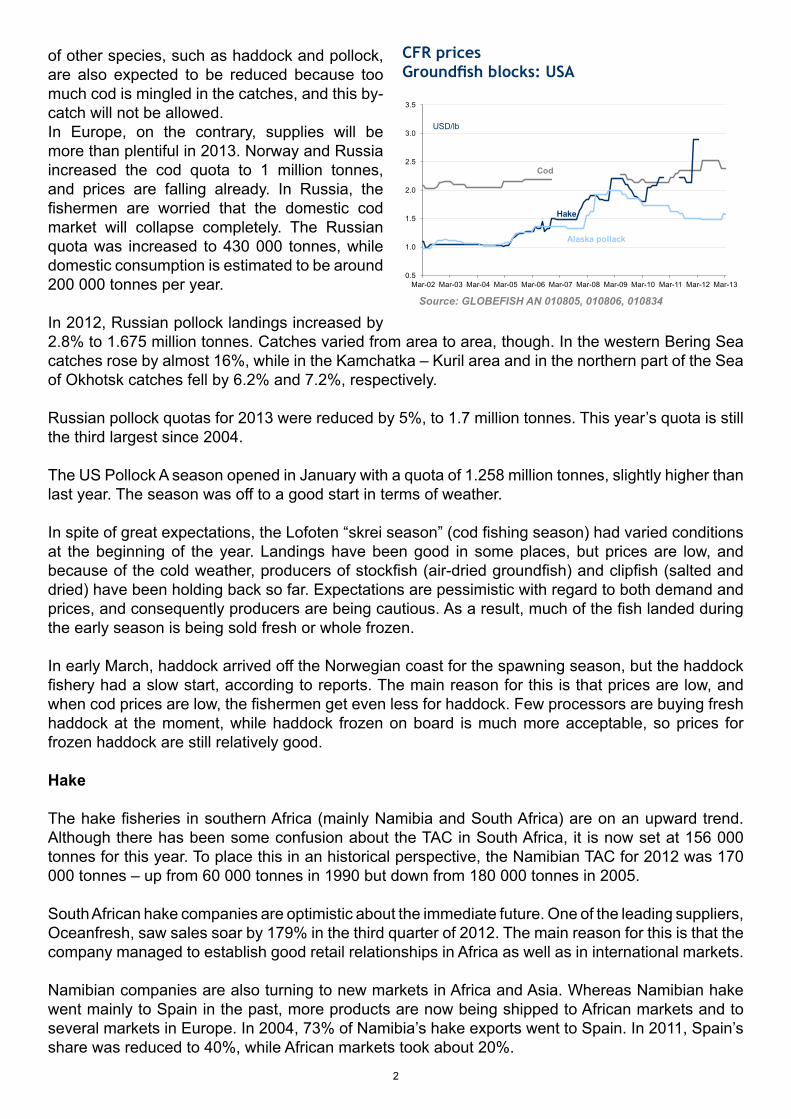
CFR pricesGroundfish blocks: USA
Source: GLOBEFISH AN 010805, 010806, 010834
0.5
1.0
1.5
2.0
2.5
3.0
3.5
Mar-02 Mar-03 Mar-04 Mar-05 Mar-06 Mar-07 Mar-08 Mar-09 Mar-10 Mar-11 Mar-12 Mar-13
USD/lb
Cod
Hake
Alaska pollack
of other species, such as haddock and pollock, are also expected to be reduced because too much cod is mingled in the catches, and this by-catch will not be allowed. In Europe, on the contrary, supplies will be more than plentiful in 2013. Norway and Russia increased the cod quota to 1 million tonnes, and prices are falling already. In Russia, the fishermen are worried that the domestic cod market will collapse completely. The Russian quota was increased to 430 000 tonnes, while domestic consumption is estimated to be around 200 000 tonnes per year.
In 2012, Russian pollock landings increased by 2.8% to 1.675 million tonnes. Catches varied from area to area, though. In the western Bering Sea catches rose by almost 16%, while in the Kamchatka – Kuril area and in the northern part of the Sea of Okhotsk catches fell by 6.2% and 7.2%, respectively.
Russian pollock quotas for 2013 were reduced by 5%, to 1.7 million tonnes. This year’s quota is still the third largest since 2004.
The US Pollock A season opened in January with a quota of 1.258 million tonnes, slightly higher than last year. The season was off to a good start in terms of weather.
In spite of great expectations, the Lofoten “skrei season” (cod fishing season) had varied conditions at the beginning of the year. Landings have been good in some places, but prices are low, and because of the cold weather, producers of stockfish (air-dried groundfish) and clipfish (salted and dried) have been holding back so far. Expectations are pessimistic with regard to both demand and prices, and consequently producers are being cautious. As a result, much of the fish landed during the early season is being sold fresh or whole frozen.
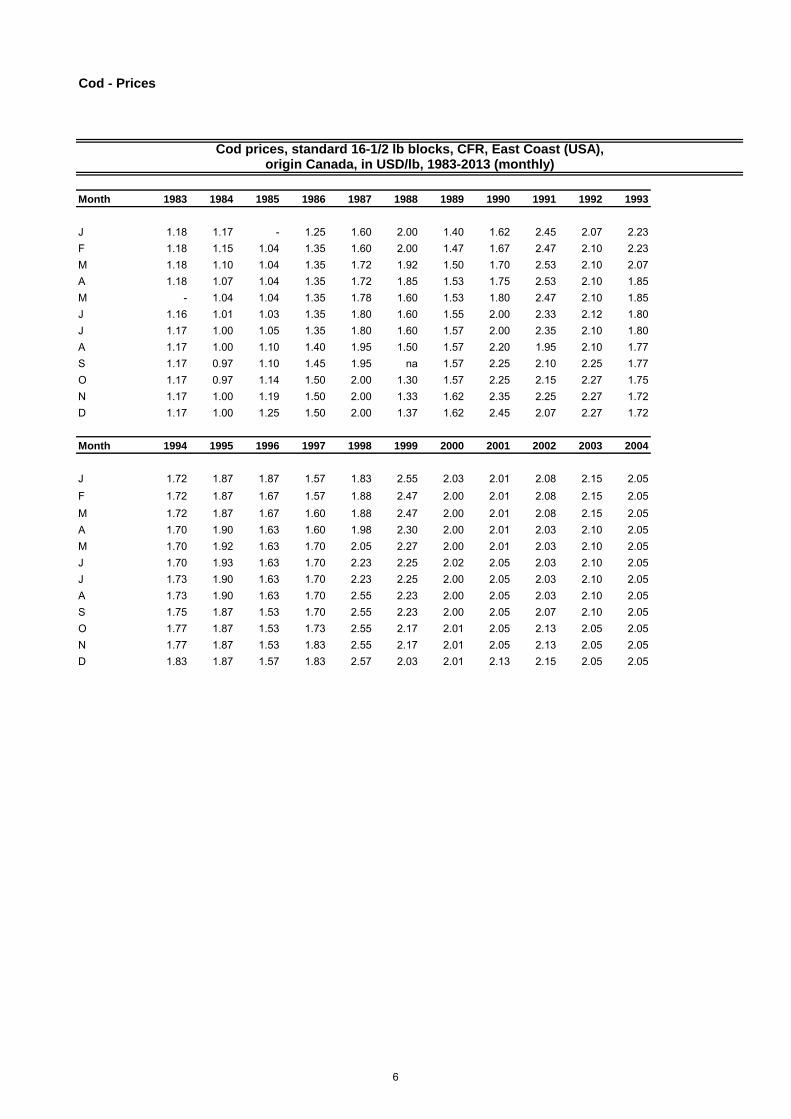
In early March, haddock arrived off the Norwegian coast for the spawning season, but the haddock fishery had a slow start, according to reports. The main reason for this is that prices are low, and when cod prices are low, the fishermen get even less for haddock. Few processors are buying fresh haddock at the moment, while haddock frozen on board is much more acceptable, so prices for frozen haddock are still relatively good.
Hake
The hake fisheries in southern Africa (mainly Namibia and South Africa) are on an upward trend. Although there has been some confusion about the TAC in South Africa, it is now set at 156 000 tonnes for this year. To place this in an historical perspective, the Namibian TAC for 2012 was 170 000 tonnes – up from 60 000 tonnes in 1990 but down from 180 000 tonnes in 2005.
South African hake companies are optimistic about the immediate future. One of the leading suppliers, Oceanfresh, saw sales soar by 179% in the third quarter of 2012. The main reason for this is that the company managed to establish good retail relationships in Africa as well as in international markets.
Namibian companies are also turning to new markets in Africa and Asia. Whereas Namibian hake went mainly to Spain in the past, more products are now being shipped to African markets and to several markets in Europe. In 2004, 73% of Namibia’s hake exports went to Spain. In 2011, Spain’s share was reduced to 40%, while African markets took about 20%.
2
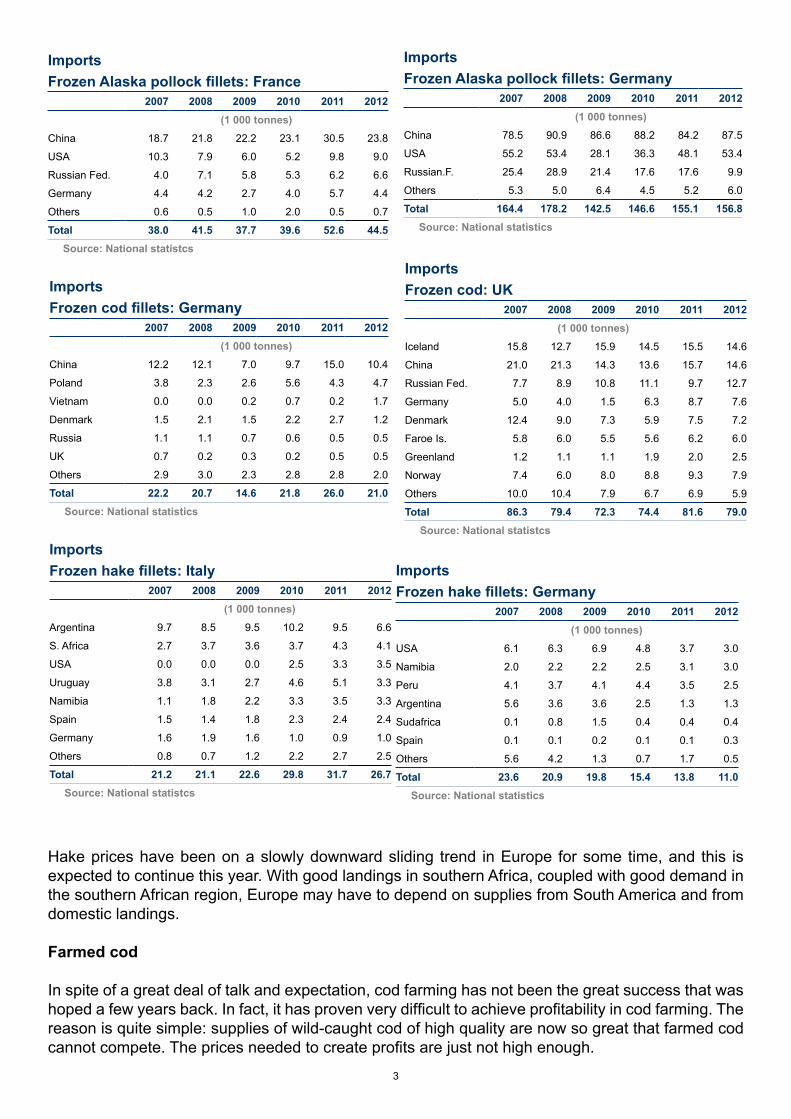
ImportsFrozen Alaska pollock fillets: Germany
2007 2008 2009 2010 2011 2012
(1 000 tonnes)China 78.5 90.9 86.6 88.2 84.2 87.5
USA 55.2 53.4 28.1 36.3 48.1 53.4
Russian.F. 25.4 28.9 21.4 17.6 17.6 9.9
Others 5.3 5.0 6.4 4.5 5.2 6.0
Total 164.4 178.2 142.5 146.6 155.1 156.8Source: National statistics
ImportsFrozen cod fillets: Germany
2007 2008 2009 2010 2011 2012
(1 000 tonnes)China 12.2 12.1 7.0 9.7 15.0 10.4
Poland 3.8 2.3 2.6 5.6 4.3 4.7
Vietnam 0.0 0.0 0.2 0.7 0.2 1.7
Denmark 1.5 2.1 1.5 2.2 2.7 1.2
Russia 1.1 1.1 0.7 0.6 0.5 0.5
UK 0.7 0.2 0.3 0.2 0.5 0.5
Others 2.9 3.0 2.3 2.8 2.8 2.0
Total 22.2 20.7 14.6 21.8 26.0 21.0Source: National statistics
ImportsFrozen hake fillets: Germany
2007 2008 2009 2010 2011 2012
(1 000 tonnes)USA 6.1 6.3 6.9 4.8 3.7 3.0
Namibia 2.0 2.2 2.2 2.5 3.1 3.0
Peru 4.1 3.7 4.1 4.4 3.5 2.5
Argentina 5.6 3.6 3.6 2.5 1.3 1.3
Sudafrica 0.1 0.8 1.5 0.4 0.4 0.4
Spain 0.1 0.1 0.2 0.1 0.1 0.3
Others 5.6 4.2 1.3 0.7 1.7 0.5
Total 23.6 20.9 19.8 15.4 13.8 11.0Source: National statistics
ImportsFrozen Alaska pollock fillets: France
2007 2008 2009 2010 2011 2012
(1 000 tonnes)China 18.7 21.8 22.2 23.1 30.5 23.8
USA 10.3 7.9 6.0 5.2 9.8 9.0
Russian Fed. 4.0 7.1 5.8 5.3 6.2 6.6
Germany 4.4 4.2 2.7 4.0 5.7 4.4
Others 0.6 0.5 1.0 2.0 0.5 0.7
Total 38.0 41.5 37.7 39.6 52.6 44.5Source: National statistcs
ImportsFrozen cod: UK
2007 2008 2009 2010 2011 2012
(1 000 tonnes)Iceland 15.8 12.7 15.9 14.5 15.5 14.6
China 21.0 21.3 14.3 13.6 15.7 14.6
Russian Fed. 7.7 8.9 10.8 11.1 9.7 12.7
Germany 5.0 4.0 1.5 6.3 8.7 7.6
Denmark 12.4 9.0 7.3 5.9 7.5 7.2
Faroe Is. 5.8 6.0 5.5 5.6 6.2 6.0
Greenland 1.2 1.1 1.1 1.9 2.0 2.5
Norway 7.4 6.0 8.0 8.8 9.3 7.9
Others 10.0 10.4 7.9 6.7 6.9 5.9
Total 86.3 79.4 72.3 74.4 81.6 79.0Source: National statistcs
ImportsFrozen hake fillets: Italy
2007 2008 2009 2010 2011 2012
(1 000 tonnes)Argentina 9.7 8.5 9.5 10.2 9.5 6.6
S. Africa 2.7 3.7 3.6 3.7 4.3 4.1
USA 0.0 0.0 0.0 2.5 3.3 3.5
Uruguay 3.8 3.1 2.7 4.6 5.1 3.3
Namibia 1.1 1.8 2.2 3.3 3.5 3.3
Spain 1.5 1.4 1.8 2.3 2.4 2.4
Germany 1.6 1.9 1.6 1.0 0.9 1.0
Others 0.8 0.7 1.2 2.2 2.7 2.5
Total 21.2 21.1 22.6 29.8 31.7 26.7Source: National statistcs
Hake prices have been on a slowly downward sliding trend in Europe for some time, and this is expected to continue this year. With good landings in southern Africa, coupled with good demand in the southern African region, Europe may have to depend on supplies from South America and from domestic landings.
Farmed cod
In spite of a great deal of talk and expectation, cod farming has not been the great success that was hoped a few years back. In fact, it has proven very difficult to achieve profitability in cod farming. The reason is quite simple: supplies of wild-caught cod of high quality are now so great that farmed cod cannot compete. The prices needed to create profits are just not high enough.
3
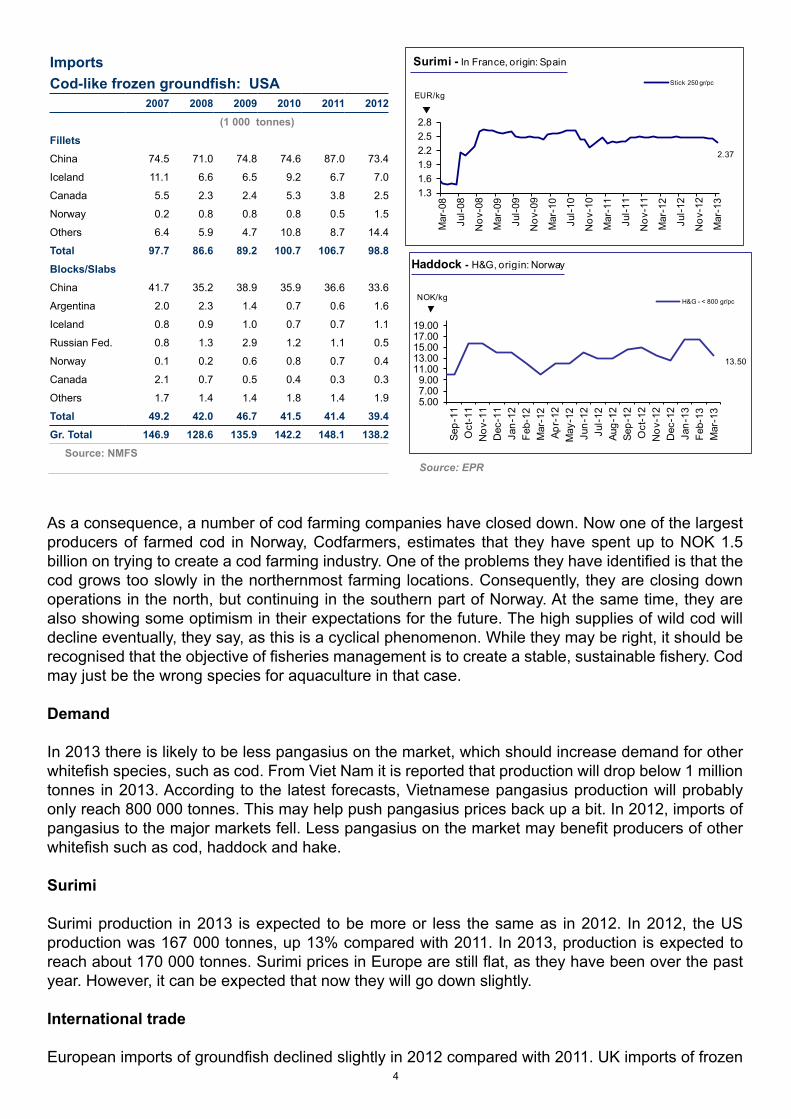
ImportsCod-like frozen groundfish: USA
2007 2008 2009 2010 2011 2012
(1 000 tonnes)
FilletsChina 74.5 71.0 74.8 74.6 87.0 73.4
Iceland 11.1 6.6 6.5 9.2 6.7 7.0
Canada 5.5 2.3 2.4 5.3 3.8 2.5
Norway 0.2 0.8 0.8 0.8 0.5 1.5
Others 6.4 5.9 4.7 10.8 8.7 14.4
Total 97.7 86.6 89.2 100.7 106.7 98.8
Blocks/SlabsChina 41.7 35.2 38.9 35.9 36.6 33.6
Argentina 2.0 2.3 1.4 0.7 0.6 1.6
Iceland 0.8 0.9 1.0 0.7 0.7 1.1
Russian Fed. 0.8 1.3 2.9 1.2 1.1 0.5
Norway 0.1 0.2 0.6 0.8 0.7 0.4
Canada 2.1 0.7 0.5 0.4 0.3 0.3
Others 1.7 1.4 1.4 1.8 1.4 1.9
Total 49.2 42.0 46.7 41.5 41.4 39.4Gr. Total 146.9 128.6 135.9 142.2 148.1 138.2
Source: NMFS
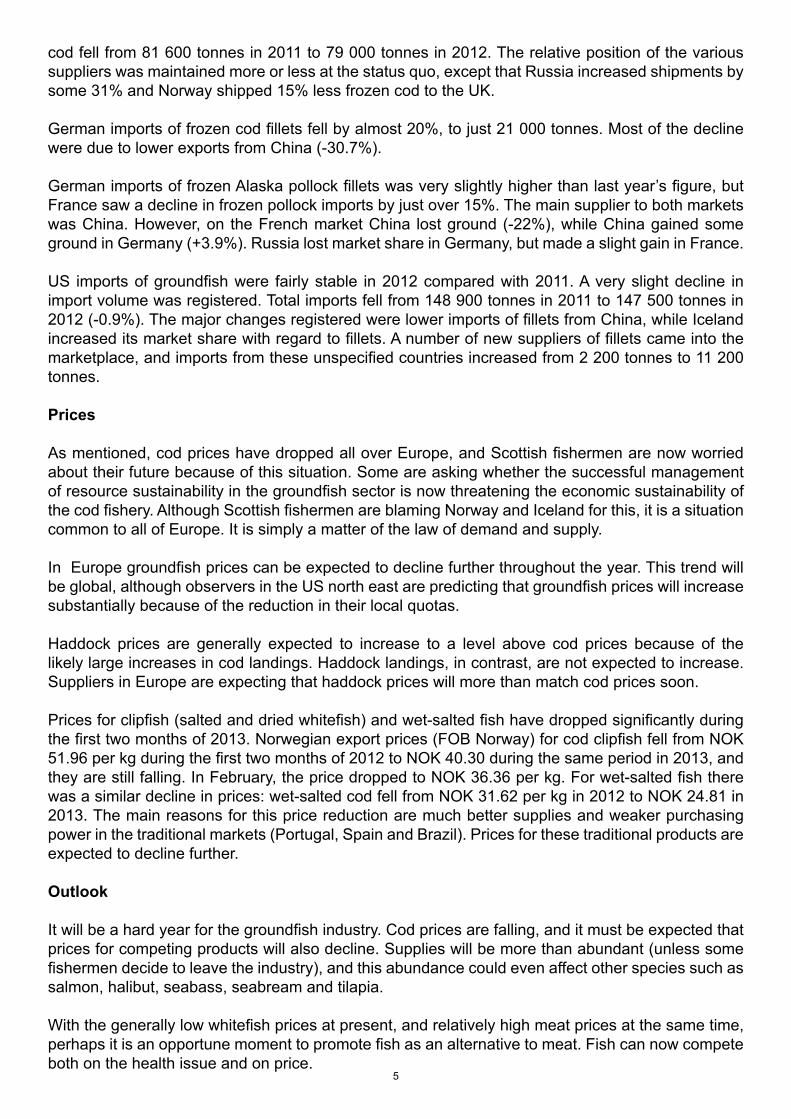
2.37
1.31.61.92.22.52.8
Mar
-08
Jul-0
8
Nov
-08
Mar
-09
Jul-0
9
Nov
-09
Mar
-10
Jul-1
0
Nov
-10
Mar
-11
Jul-1
1
Nov
-11
Mar
-12
Jul-1
2
Nov
-12
Mar
-13
Surimi - In France, origin: Spain
Stick 250 gr/pc
EUR/kg
Source: EPR
13.50
5.007.009.00
11.0013.0015.0017.0019.00
Sep-
11O
ct-1
1N
ov-1
1D
ec-1
1Ja
n-12
Feb-
12M
ar-1
2Ap
r-12
May
-12
Jun-
12Ju
l-12
Aug-
12Se
p-12
Oct
-12
Nov
-12
Dec
-12
Jan-
13Fe
b-13
Mar
-13
H&G - < 800 gr/pcNOK/kg
Haddock - H&G, origin: Norway
As a consequence, a number of cod farming companies have closed down. Now one of the largest producers of farmed cod in Norway, Codfarmers, estimates that they have spent up to NOK 1.5 billion on trying to create a cod farming industry. One of the problems they have identified is that the cod grows too slowly in the northernmost farming locations. Consequently, they are closing down operations in the north, but continuing in the southern part of Norway. At the same time, they are also showing some optimism in their expectations for the future. The high supplies of wild cod will decline eventually, they say, as this is a cyclical phenomenon. While they may be right, it should be recognised that the objective of fisheries management is to create a stable, sustainable fishery. Cod may just be the wrong species for aquaculture in that case.
Demand
In 2013 there is likely to be less pangasius on the market, which should increase demand for other whitefish species, such as cod. From Viet Nam it is reported that production will drop below 1 million tonnes in 2013. According to the latest forecasts, Vietnamese pangasius production will probably only reach 800 000 tonnes. This may help push pangasius prices back up a bit. In 2012, imports of pangasius to the major markets fell. Less pangasius on the market may benefit producers of other whitefish such as cod, haddock and hake.
Surimi
Surimi production in 2013 is expected to be more or less the same as in 2012. In 2012, the US production was 167 000 tonnes, up 13% compared with 2011. In 2013, production is expected to reach about 170 000 tonnes. Surimi prices in Europe are still flat, as they have been over the past year. However, it can be expected that now they will go down slightly.
International trade
European imports of groundfish declined slightly in 2012 compared with 2011. UK imports of frozen 4
cod fell from 81 600 tonnes in 2011 to 79 000 tonnes in 2012. The relative position of the various suppliers was maintained more or less at the status quo, except that Russia increased shipments by some 31% and Norway shipped 15% less frozen cod to the UK.
German imports of frozen cod fillets fell by almost 20%, to just 21 000 tonnes. Most of the decline were due to lower exports from China (-30.7%).
German imports of frozen Alaska pollock fillets was very slightly higher than last year’s figure, but France saw a decline in frozen pollock imports by just over 15%. The main supplier to both markets was China. However, on the French market China lost ground (-22%), while China gained some ground in Germany (+3.9%). Russia lost market share in Germany, but made a slight gain in France.
US imports of groundfish were fairly stable in 2012 compared with 2011. A very slight decline in import volume was registered. Total imports fell from 148 900 tonnes in 2011 to 147 500 tonnes in 2012 (-0.9%). The major changes registered were lower imports of fillets from China, while Iceland increased its market share with regard to fillets. A number of new suppliers of fillets came into the marketplace, and imports from these unspecified countries increased from 2 200 tonnes to 11 200 tonnes.
Prices
As mentioned, cod prices have dropped all over Europe, and Scottish fishermen are now worried about their future because of this situation. Some are asking whether the successful management of resource sustainability in the groundfish sector is now threatening the economic sustainability of the cod fishery. Although Scottish fishermen are blaming Norway and Iceland for this, it is a situation common to all of Europe. It is simply a matter of the law of demand and supply.
In Europe groundfish prices can be expected to decline further throughout the year. This trend will be global, although observers in the US north east are predicting that groundfish prices will increase substantially because of the reduction in their local quotas. Haddock prices are generally expected to increase to a level above cod prices because of the likely large increases in cod landings. Haddock landings, in contrast, are not expected to increase. Suppliers in Europe are expecting that haddock prices will more than match cod prices soon.
Prices for clipfish (salted and dried whitefish) and wet-salted fish have dropped significantly during the first two months of 2013. Norwegian export prices (FOB Norway) for cod clipfish fell from NOK 51.96 per kg during the first two months of 2012 to NOK 40.30 during the same period in 2013, and they are still falling. In February, the price dropped to NOK 36.36 per kg. For wet-salted fish there was a similar decline in prices: wet-salted cod fell from NOK 31.62 per kg in 2012 to NOK 24.81 in 2013. The main reasons for this price reduction are much better supplies and weaker purchasing power in the traditional markets (Portugal, Spain and Brazil). Prices for these traditional products are expected to decline further.
Outlook
It will be a hard year for the groundfish industry. Cod prices are falling, and it must be expected that prices for competing products will also decline. Supplies will be more than abundant (unless some fishermen decide to leave the industry), and this abundance could even affect other species such as salmon, halibut, seabass, seabream and tilapia.
With the generally low whitefish prices at present, and relatively high meat prices at the same time, perhaps it is an opportune moment to promote fish as an alternative to meat. Fish can now compete both on the health issue and on price.
5
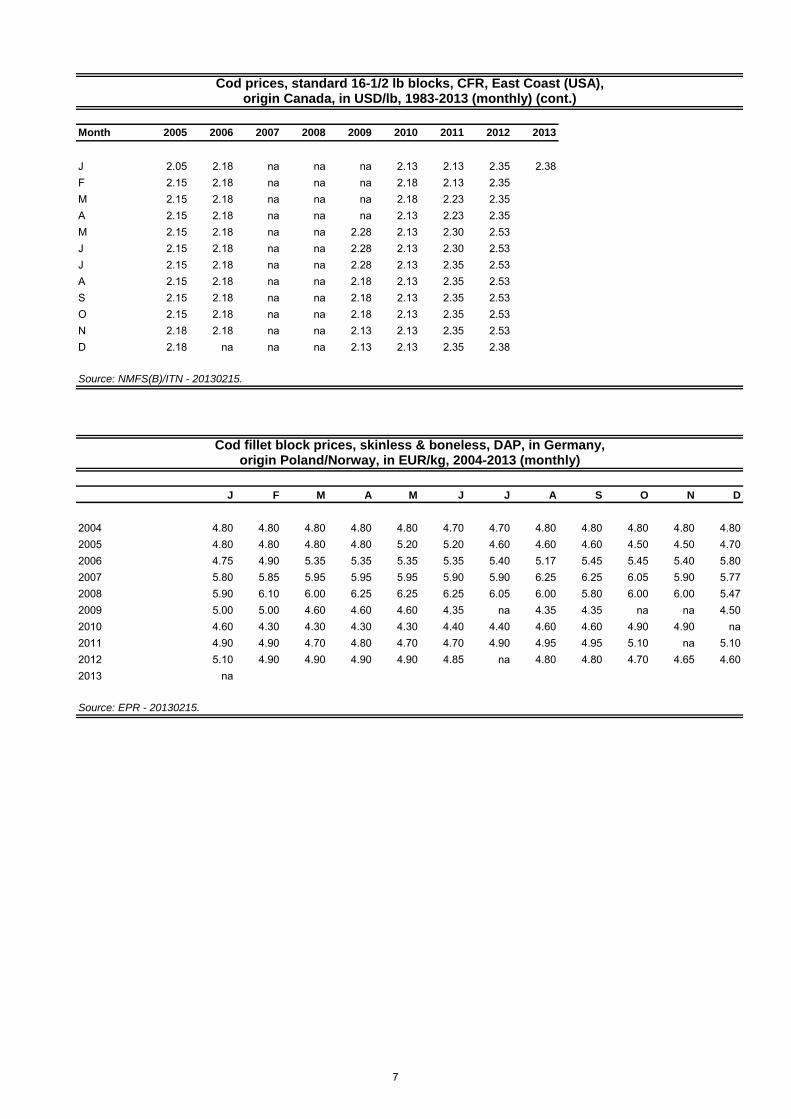
Cod - Prices
Month 1983 1984 1985 1986 1987 1988 1989 1990 1991 1992 1993
J 1.18 1.17 - 1.25 1.60 2.00 1.40 1.62 2.45 2.07 2.23F 1.18 1.15 1.04 1.35 1.60 2.00 1.47 1.67 2.47 2.10 2.23M 1.18 1.10 1.04 1.35 1.72 1.92 1.50 1.70 2.53 2.10 2.07A 1.18 1.07 1.04 1.35 1.72 1.85 1.53 1.75 2.53 2.10 1.85M - 1.04 1.04 1.35 1.78 1.60 1.53 1.80 2.47 2.10 1.85J 1.16 1.01 1.03 1.35 1.80 1.60 1.55 2.00 2.33 2.12 1.80J 1.17 1.00 1.05 1.35 1.80 1.60 1.57 2.00 2.35 2.10 1.80A 1.17 1.00 1.10 1.40 1.95 1.50 1.57 2.20 1.95 2.10 1.77S 1.17 0.97 1.10 1.45 1.95 na 1.57 2.25 2.10 2.25 1.77O 1.17 0.97 1.14 1.50 2.00 1.30 1.57 2.25 2.15 2.27 1.75N 1.17 1.00 1.19 1.50 2.00 1.33 1.62 2.35 2.25 2.27 1.72D 1.17 1.00 1.25 1.50 2.00 1.37 1.62 2.45 2.07 2.27 1.72
Month 1994 1995 1996 1997 1998 1999 2000 2001 2002 2003 2004
J 1.72 1.87 1.87 1.57 1.83 2.55 2.03 2.01 2.08 2.15 2.05F 1.72 1.87 1.67 1.57 1.88 2.47 2.00 2.01 2.08 2.15 2.05M 1.72 1.87 1.67 1.60 1.88 2.47 2.00 2.01 2.08 2.15 2.05A 1.70 1.90 1.63 1.60 1.98 2.30 2.00 2.01 2.03 2.10 2.05M 1.70 1.92 1.63 1.70 2.05 2.27 2.00 2.01 2.03 2.10 2.05J 1.70 1.93 1.63 1.70 2.23 2.25 2.02 2.05 2.03 2.10 2.05J 1.73 1.90 1.63 1.70 2.23 2.25 2.00 2.05 2.03 2.10 2.05A 1.73 1.90 1.63 1.70 2.55 2.23 2.00 2.05 2.03 2.10 2.05S 1.75 1.87 1.53 1.70 2.55 2.23 2.00 2.05 2.07 2.10 2.05O 1.77 1.87 1.53 1.73 2.55 2.17 2.01 2.05 2.13 2.05 2.05N 1.77 1.87 1.53 1.83 2.55 2.17 2.01 2.05 2.13 2.05 2.05D 1.83 1.87 1.57 1.83 2.57 2.03 2.01 2.13 2.15 2.05 2.05
Cod prices, standard 16-1/2 lb blocks, CFR, East Coast (USA),origin Canada, in USD/lb, 1983-2013 (monthly)
6
Month 2005 2006 2007 2008 2009 2010 2011 2012 2013
J 2.05 2.18 na na na 2.13 2.13 2.35 2.38F 2.15 2.18 na na na 2.18 2.13 2.35M 2.15 2.18 na na na 2.18 2.23 2.35A 2.15 2.18 na na na 2.13 2.23 2.35M 2.15 2.18 na na 2.28 2.13 2.30 2.53J 2.15 2.18 na na 2.28 2.13 2.30 2.53J 2.15 2.18 na na 2.28 2.13 2.35 2.53A 2.15 2.18 na na 2.18 2.13 2.35 2.53S 2.15 2.18 na na 2.18 2.13 2.35 2.53O 2.15 2.18 na na 2.18 2.13 2.35 2.53N 2.18 2.18 na na 2.13 2.13 2.35 2.53D 2.18 na na na 2.13 2.13 2.35 2.38
Source: NMFS(B)/ITN - 20130215.
J F M A M J J A S O N D
2004 4.80 4.80 4.80 4.80 4.80 4.70 4.70 4.80 4.80 4.80 4.80 4.802005 4.80 4.80 4.80 4.80 5.20 5.20 4.60 4.60 4.60 4.50 4.50 4.702006 4.75 4.90 5.35 5.35 5.35 5.35 5.40 5.17 5.45 5.45 5.40 5.802007 5.80 5.85 5.95 5.95 5.95 5.90 5.90 6.25 6.25 6.05 5.90 5.772008 5.90 6.10 6.00 6.25 6.25 6.25 6.05 6.00 5.80 6.00 6.00 5.472009 5.00 5.00 4.60 4.60 4.60 4.35 na 4.35 4.35 na na 4.502010 4.60 4.30 4.30 4.30 4.30 4.40 4.40 4.60 4.60 4.90 4.90 na2011 4.90 4.90 4.70 4.80 4.70 4.70 4.90 4.95 4.95 5.10 na 5.102012 5.10 4.90 4.90 4.90 4.90 4.85 na 4.80 4.80 4.70 4.65 4.602013 na
Source: EPR - 20130215.
Cod fillet block prices, skinless & boneless, DAP, in Germany,origin Poland/Norway, in EUR/kg, 2004-2013 (monthly)
Cod prices, standard 16-1/2 lb blocks, CFR, East Coast (USA),origin Canada, in USD/lb, 1983-2013 (monthly) (cont.)
7
Hake - Prices
Month 1983 1984 1985 1986 1987 1988 1989 1990 1991 1992 1993 1994 1995
J 0.63 0.60 0.63 0.60 0.88 0.98 0.92 0.84 1.19 1.10 na 0.84 0.87F 0.63 0.58 0.63 0.63 0.88 0.98 0.89 0.84 1.19 1.10 na 0.84 0.87M 0.62 0.58 0.63 0.63 0.93 0.98 0.89 0.84 1.21 1.10 0.84 0.83 0.87A 0.62 na 0.63 0.63 0.98 0.95 0.87 0.84 1.21 0.87 0.84 0.83 naM 0.61 0.57 0.63 0.63 1.03 0.93 0.87 0.83 1.21 na 0.87 0.83 naJ 0.62 0.56 0.63 0.63 0.97 0.92 0.84 0.83 1.40 na 0.88 0.83 1.00J 0.61 0.56 0.62 0.64 0.96 0.92 0.86 0.84 1.35 na 0.89 0.83 0.96A 0.61 0.55 0.62 0.69 0.98 0.92 0.85 0.85 1.25 na 0.90 0.83 0.96S 0.61 0.54 0.62 0.73 1.00 0.91 0.83 0.87 1.17 0.82 0.90 0.87 0.89O 0.62 0.56 0.63 0.73 1.00 0.91 0.83 0.91 1.15 0.85 0.88 0.87 0.93N 0.61 0.58 0.63 0.77 1.00 0.87 0.84 1.01 1.15 0.85 0.88 0.87 0.93D 0.61 0.60 0.63 0.82 1.00 0.85 1.00 1.10 1.10 0.85 0.89 0.87 0.92
Month 1996 1997 1998 1999 2000 2001 2002 2003 2004 2005 2006 2007 2008
J 0.91 0.80 1.10 1.13 1.02 1.23 1.10 0.96 0.99 0.97 1.27 1.48 1.78F 0.91 0.80 1.08 1.13 1.02 1.23 1.10 0.96 0.99 1.01 1.27 1.48 1.84M 0.91 0.80 1.04 1.13 1.02 1.19 1.10 0.96 0.99 1.02 1.27 1.48 1.84A 0.77 na 1.08 1.13 1.04 1.19 0.99 0.96 0.99 1.02 1.27 1.47 1.91M 0.77 na 1.08 1.13 1.08 1.19 0.99 0.96 0.99 na 1.33 1.49 1.91J 0.77 0.96 1.08 1.13 1.08 1.15 1.05 0.96 0.99 1.15 1.33 1.50 1.91J 0.77 0.96 1.08 0.97 1.08 1.15 1.05 0.96 0.99 1.18 1.45 1.53 1.89A 0.84 1.02 1.08 0.97 1.08 1.15 1.05 0.96 0.99 1.22 1.28 1.53 1.83S 0.84 1.02 1.10 0.97 1.10 1.15 1.02 0.96 0.99 1.23 1.47 na 1.83O 0.84 1.07 1.13 0.99 1.22 1.12 0.98 0.96 0.99 1.23 1.48 1.63 1.81N 0.84 1.07 1.13 0.99 1.22 1.11 0.98 0.96 0.99 1.25 1.48 1.68 1.81D 0.85 1.07 1.13 0.99 1.23 1.11 0.98 0.99 0.97 1.25 1.48 1.69 1.81
Month 2009 2010 2011 2012
J 2.20 1.85 na 2.89F 2.20 1.80 na 2.89M 2.20 1.80 na 2.89A 2.20 1.80 na naM 2.20 2.05 na naJ 2.20 2.05 na naJ 2.10 2.08 2.23 naA 2.10 2.08 2.23 naS 2.03 2.08 2.23 naO 2.00 2.23 2.13 naN 1.90 2.23 2.13 naD 1.90 2.23 2.13 na
Source: INFOPESCA/GLOBEFISH - 20130215.
Hake/whiting fillet prices, 6-8 oz/pc regular blocks, CFR, East Coast (USA),
origin Uruguay/Argentina, in USD/lb, 1983-2012 (monthly)
8
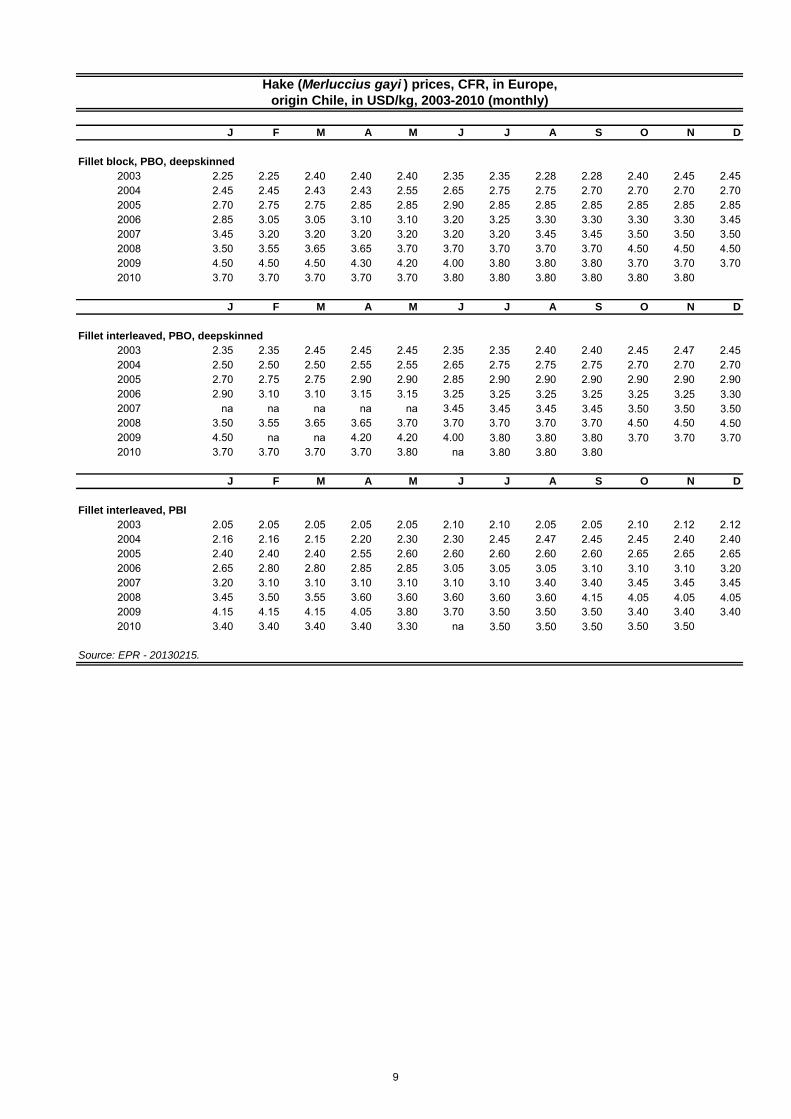
J F M A M J J A S O N D
Fillet block, PBO, deepskinned
2003 2.25 2.25 2.40 2.40 2.40 2.35 2.35 2.28 2.28 2.40 2.45 2.452004 2.45 2.45 2.43 2.43 2.55 2.65 2.75 2.75 2.70 2.70 2.70 2.702005 2.70 2.75 2.75 2.85 2.85 2.90 2.85 2.85 2.85 2.85 2.85 2.852006 2.85 3.05 3.05 3.10 3.10 3.20 3.25 3.30 3.30 3.30 3.30 3.452007 3.45 3.20 3.20 3.20 3.20 3.20 3.20 3.45 3.45 3.50 3.50 3.502008 3.50 3.55 3.65 3.65 3.70 3.70 3.70 3.70 3.70 4.50 4.50 4.502009 4.50 4.50 4.50 4.30 4.20 4.00 3.80 3.80 3.80 3.70 3.70 3.702010 3.70 3.70 3.70 3.70 3.70 3.80 3.80 3.80 3.80 3.80 3.80
J F M A M J J A S O N D
Fillet interleaved, PBO, deepskinned
2003 2.35 2.35 2.45 2.45 2.45 2.35 2.35 2.40 2.40 2.45 2.47 2.452004 2.50 2.50 2.50 2.55 2.55 2.65 2.75 2.75 2.75 2.70 2.70 2.702005 2.70 2.75 2.75 2.90 2.90 2.85 2.90 2.90 2.90 2.90 2.90 2.902006 2.90 3.10 3.10 3.15 3.15 3.25 3.25 3.25 3.25 3.25 3.25 3.302007 na na na na na 3.45 3.45 3.45 3.45 3.50 3.50 3.502008 3.50 3.55 3.65 3.65 3.70 3.70 3.70 3.70 3.70 4.50 4.50 4.502009 4.50 na na 4.20 4.20 4.00 3.80 3.80 3.80 3.70 3.70 3.702010 3.70 3.70 3.70 3.70 3.80 na 3.80 3.80 3.80
J F M A M J J A S O N D
Fillet interleaved, PBI
2003 2.05 2.05 2.05 2.05 2.05 2.10 2.10 2.05 2.05 2.10 2.12 2.122004 2.16 2.16 2.15 2.20 2.30 2.30 2.45 2.47 2.45 2.45 2.40 2.402005 2.40 2.40 2.40 2.55 2.60 2.60 2.60 2.60 2.60 2.65 2.65 2.652006 2.65 2.80 2.80 2.85 2.85 3.05 3.05 3.05 3.10 3.10 3.10 3.202007 3.20 3.10 3.10 3.10 3.10 3.10 3.10 3.40 3.40 3.45 3.45 3.452008 3.45 3.50 3.55 3.60 3.60 3.60 3.60 3.60 4.15 4.05 4.05 4.052009 4.15 4.15 4.15 4.05 3.80 3.70 3.50 3.50 3.50 3.40 3.40 3.402010 3.40 3.40 3.40 3.40 3.30 na 3.50 3.50 3.50 3.50 3.50
Source: EPR - 20130215.
Hake (Merluccius gayi ) prices, CFR, in Europe,
origin Chile, in USD/kg, 2003-2010 (monthly)
9
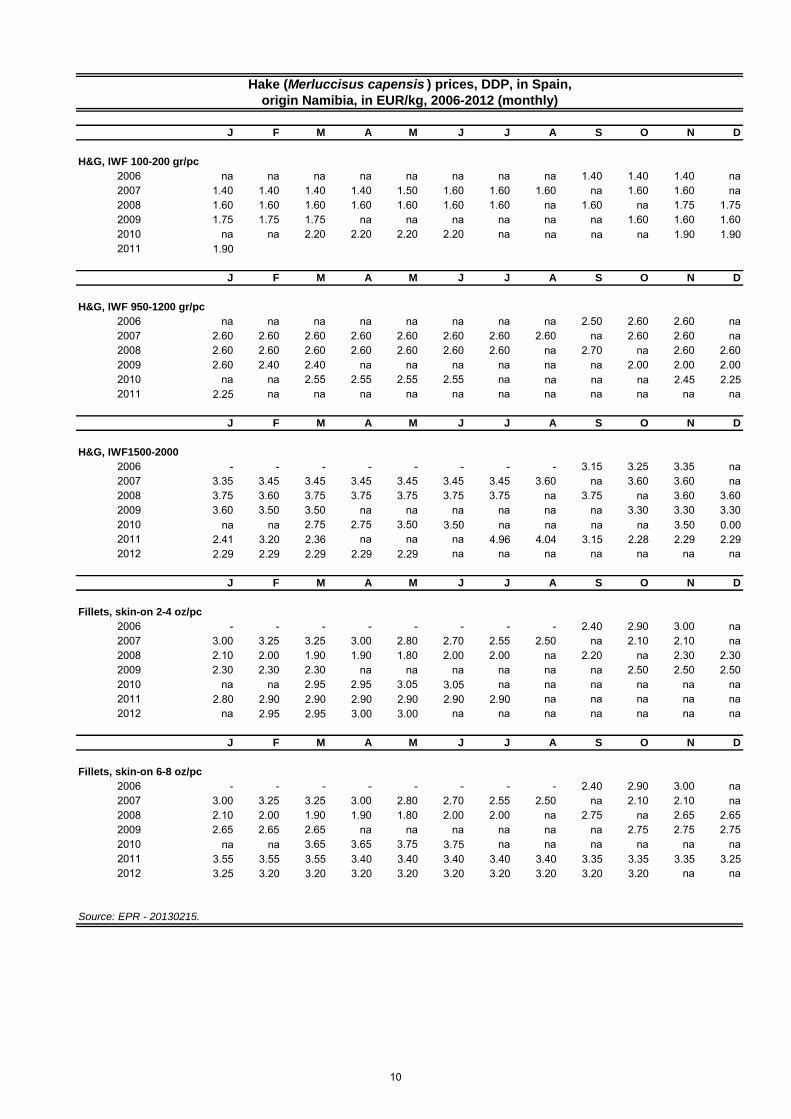
J F M A M J J A S O N D
H&G, IWF 100-200 gr/pc
2006 na na na na na na na na 1.40 1.40 1.40 na2007 1.40 1.40 1.40 1.40 1.50 1.60 1.60 1.60 na 1.60 1.60 na2008 1.60 1.60 1.60 1.60 1.60 1.60 1.60 na 1.60 na 1.75 1.752009 1.75 1.75 1.75 na na na na na na 1.60 1.60 1.602010 na na 2.20 2.20 2.20 2.20 na na na na 1.90 1.902011 1.90
J F M A M J J A S O N D
H&G, IWF 950-1200 gr/pc
2006 na na na na na na na na 2.50 2.60 2.60 na2007 2.60 2.60 2.60 2.60 2.60 2.60 2.60 2.60 na 2.60 2.60 na2008 2.60 2.60 2.60 2.60 2.60 2.60 2.60 na 2.70 na 2.60 2.602009 2.60 2.40 2.40 na na na na na na 2.00 2.00 2.002010 na na 2.55 2.55 2.55 2.55 na na na na 2.45 2.252011 2.25 na na na na na na na na na na na
J F M A M J J A S O N D
H&G, IWF1500-2000
2006 - - - - - - - - 3.15 3.25 3.35 na2007 3.35 3.45 3.45 3.45 3.45 3.45 3.45 3.60 na 3.60 3.60 na2008 3.75 3.60 3.75 3.75 3.75 3.75 3.75 na 3.75 na 3.60 3.602009 3.60 3.50 3.50 na na na na na na 3.30 3.30 3.302010 na na 2.75 2.75 3.50 3.50 na na na na 3.50 0.002011 2.41 3.20 2.36 na na na 4.96 4.04 3.15 2.28 2.29 2.292012 2.29 2.29 2.29 2.29 2.29 na na na na na na na
J F M A M J J A S O N D
Fillets, skin-on 2-4 oz/pc
2006 - - - - - - - - 2.40 2.90 3.00 na2007 3.00 3.25 3.25 3.00 2.80 2.70 2.55 2.50 na 2.10 2.10 na2008 2.10 2.00 1.90 1.90 1.80 2.00 2.00 na 2.20 na 2.30 2.302009 2.30 2.30 2.30 na na na na na na 2.50 2.50 2.502010 na na 2.95 2.95 3.05 3.05 na na na na na na2011 2.80 2.90 2.90 2.90 2.90 2.90 2.90 na na na na na2012 na 2.95 2.95 3.00 3.00 na na na na na na na
J F M A M J J A S O N D
Fillets, skin-on 6-8 oz/pc
2006 - - - - - - - - 2.40 2.90 3.00 na2007 3.00 3.25 3.25 3.00 2.80 2.70 2.55 2.50 na 2.10 2.10 na2008 2.10 2.00 1.90 1.90 1.80 2.00 2.00 na 2.75 na 2.65 2.652009 2.65 2.65 2.65 na na na na na na 2.75 2.75 2.752010 na na 3.65 3.65 3.75 3.75 na na na na na na2011 3.55 3.55 3.55 3.40 3.40 3.40 3.40 3.40 3.35 3.35 3.35 3.252012 3.25 3.20 3.20 3.20 3.20 3.20 3.20 3.20 3.20 3.20 na na
Source: EPR - 20130215.
Hake (Merluccisus capensis ) prices, DDP, in Spain,
origin Namibia, in EUR/kg, 2006-2012 (monthly)
10
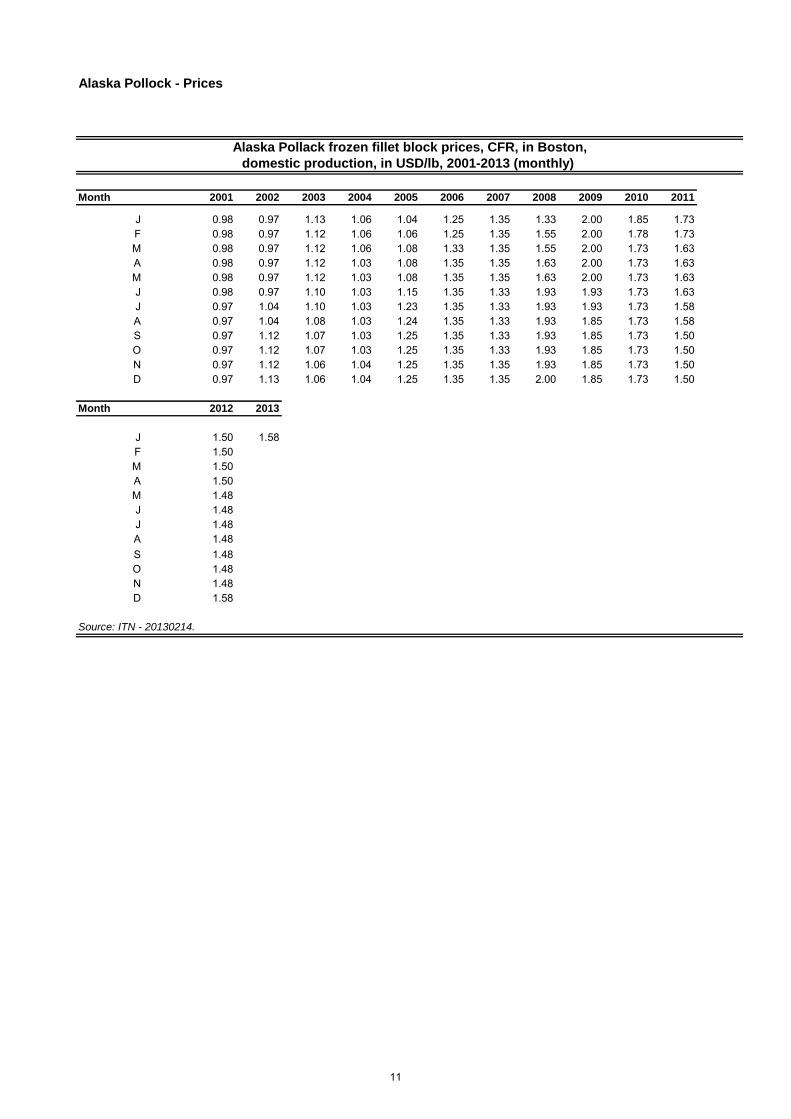
Month 2001 2002 2003 2004 2005 2006 2007 2008 2009 2010 2011
J 0.98 0.97 1.13 1.06 1.04 1.25 1.35 1.33 2.00 1.85 1.73F 0.98 0.97 1.12 1.06 1.06 1.25 1.35 1.55 2.00 1.78 1.73M 0.98 0.97 1.12 1.06 1.08 1.33 1.35 1.55 2.00 1.73 1.63A 0.98 0.97 1.12 1.03 1.08 1.35 1.35 1.63 2.00 1.73 1.63M 0.98 0.97 1.12 1.03 1.08 1.35 1.35 1.63 2.00 1.73 1.63J 0.98 0.97 1.10 1.03 1.15 1.35 1.33 1.93 1.93 1.73 1.63J 0.97 1.04 1.10 1.03 1.23 1.35 1.33 1.93 1.93 1.73 1.58A 0.97 1.04 1.08 1.03 1.24 1.35 1.33 1.93 1.85 1.73 1.58S 0.97 1.12 1.07 1.03 1.25 1.35 1.33 1.93 1.85 1.73 1.50O 0.97 1.12 1.07 1.03 1.25 1.35 1.33 1.93 1.85 1.73 1.50N 0.97 1.12 1.06 1.04 1.25 1.35 1.35 1.93 1.85 1.73 1.50D 0.97 1.13 1.06 1.04 1.25 1.35 1.35 2.00 1.85 1.73 1.50
Month 2012 2013
J 1.50 1.58F 1.50M 1.50A 1.50M 1.48J 1.48J 1.48A 1.48S 1.48O 1.48N 1.48D 1.58
Source: ITN - 20130214.
Alaska Pollock - Prices
Alaska Pollack frozen fillet block prices, CFR, in Boston,
domestic production, in USD/lb, 2001-2013 (monthly)
11
Month 1990 1991 1992 1993 1994 1995 1996 1997 1998 1999 2000 2001
J 0.85 1.12 1.17 0.81 0.66 0.67 0.81 0.77 0.74 0.87 0.67 0.82F 0.85 1.17 1.07 0.78 0.66 0.67 0.81 0.77 0.76 0.79 0.70 0.85M 0.85 1.5 0.83 0.77 0.66 0.69 0.81 0.75 0.77 0.79 0.70 0.84A 0.85 1.52 0.78 0.74 0.67 0.71 0.78 0.75 0.86 0.79 0.70 0.84M 0.85 1.56 NA 0.72 0.67 0.71 0.78 0.75 0.88 0.77 0.71 0.84J 0.88 1.52 0.78 0.72 0.67 0.72 0.78 0.75 0.91 0.75 0.76 0.98J 0.88 1.52 NA 0.72 0.67 0.72 0.78 0.75 0.91 0.75 0.76 0.98A 0.91 1.47 0.75 0.72 0.67 0.74 0.78 0.75 0.92 0.68 0.76 0.98S 0.95 1.42 0.75 0.72 0.67 0.77 0.78 0.75 0.93 0.68 0.72 0.99O 0.99 1.37 0.77 0.72 0.67 0.79 0.77 0.73 0.91 0.63 0.74 0.99N 1.04 1.27 0.77 0.7 0.64 0.79 0.77 0.74 0.91 0.63 0.74 0.99D 1.12 1.17 0.81 0.66 0.67 0.81 0.77 0.74 0.91 0.63 0.75 0.99
Month 2002 2003 2004 2005 2006 2007 2008 2009 2010 2011 2012 2013
J 0.99 0.92 0.87 0.95 0.99 1.04 1.06 1.30 1.43 1.37 1.30 1.30F 0.96 0.92 0.87 0.95 0.99 1.04 1.06 1.30 1.40 1.37 1.30M 0.97 0.92 0.86 0.97 0.99 1.04 1.10 1.40 1.40 1.33 1.30A 0.99 0.92 0.87 0.97 0.97 1.04 1.10 1.40 1.35 1.33 1.30M 0.98 0.92 0.87 0.97 1.01 1.04 1.17 1.38 1.37 1.33 1.33J 0.98 0.92 0.94 0.97 1.01 1.04 1.17 1.38 1.37 1.33 1.33J 0.98 0.92 0.94 0.97 1.01 1.04 1.17 1.38 1.37 1.33 1.33A 0.98 0.92 0.95 0.97 1.01 1.05 1.20 1.38 1.37 1.30 1.33S 0.96 0.92 0.95 0.97 1.01 1.05 1.20 1.38 1.37 1.30 1.33O 0.96 0.92 0.95 0.97 1.01 1.05 1.20 1.38 1.37 1.30 1.33N 0.97 0.92 0.95 0.99 1.01 1.05 1.20 1.43 1.37 1.30 1.33D 1.42 0.92 0.95 0.99 1.01 1.06 1.28 1.43 1.37 1.30 1.30
Source: ITN - 20130214.
J F M A M J J A S O N D
2003 2.50 2.40 2.37 2.32 2.30 2.30 2.35 2.23 2.23 2.20 2.15 2.102004 2.10 2.10 2.20 2.25 2.30 2.30 2.32 2.27 2.27 2.27 2.35 2.352005 2.40 2.45 2.50 2.60 2.60 2.65 2.75 2.80 2.80 2.85 2.85 2.852006 2.90 2.90 2.95 2.95 2.97 2.90 2.92 2.95 2.95 2.85 2.82 2.832007 2.83 2.90 2.80 2.80 2.80 2.77 2.80 2.82 2.87 2.82 2.90 3.252008 3.25 3.55 3.55 3.65 3.70 4.20 4.20 4.20 4.20 4.20 4.20 4.402009 4.10 4.10 4.10 4.10 4.40 3.70 3.50 4.00 4.00 3.85 3.85 3.902010 3.80 na 3.85 3.85 na 3.70 3.70 3.55 3.55 3.55 3.55 3.42011 3.30 3.20 3.20 3.10 3.20 3.15 3.10 3.10 3.10 3.10 3.10 3.102012 3.10 3.05 3.10 3.10 3.10 3.10 3.10 3.10 3.20 3.20 3.20 3.102013 3.10
Source: EPR - 20130214.
origin Russian Federation/USA, in USD/kg, 2003-2013 (monthly)
2 oz/pc
Alaska Pollack frozen fillet block prices, CFR, in Boston,
foreign origin, in USD/lb, 1990-2013 (monthly)
Alaska Pollack frozen fillet block prices, skinless & boneless, DAP, in Germany,
12
Turbot - Prices
Year 0.5-1 1.0-2 >_2.0 Year 0.5-1 1.0-2 >_2.0 Year 0.5-1 1.0-2 >_2.0
kg/pc kg/pc kg/pc kg/pc kg/pc kg/pc kg/pc kg/pc kg/pc
2004 2007 2010
J 8.20 8.75 15.03 J 8.82 10.40 15.15 J 6.80 6.25 7.85F 7.50 8.95 11.53 F 8.95 10.40 15.15 F 7.10 6.50 7.18M 7.70 9.70 12.65 M 8.95 10.00 14.40 M 7.90 7.60 6.93A 7.50 8.95 11.53 A 8.95 10.00 14.40 A 9.20 8.70 9.05M 7.20 8.55 11.03 M 8.95 10.00 14.40 M 9.20 8.70 9.05J 6.20 7.90 10.85 J 9.05 10.20 13.40 J 9.00 8.60 9.05J 7.40 7.90 10.78 J 9.05 10.20 13.40 J 8.80 8.40 9.84A 10.25 7.55 10.65 A 9.65 11.65 15.03 A 8.65 8.65 10.25S 7.65 7.50 12.60 S 10.25 13.35 18.48 S 8.85 8.65 12.68O 8.05 8.15 15.03 O 10.25 13.35 18.48 O 9.20 9.10 16.50N 8.20 8.75 15.03 N 9.90 12.55 18.00 N 8.95 9.10 16.50D 8.20 8.75 15.03 D 8.80 10.05 14.78 D 8.45 8.60 14.13
2005 2008 2011
J 8.25 8.65 14.90 J 8.80 10.05 14.78 J 8.15 8.05 13.10F 8.25 8.55 14.53 F 8.80 9.65 13.28 F 8.45 8.80 11.03
M 8.25 8.55 14.53 M 8.80 9.65 12.45 M 8.75 9.65 10.50A 8.25 8.55 13.53 A 8.50 9.25 12.33 A 8.94 9.90 11.10M 8.45 8.70 11.85 M 8.50 9.10 11.20 M 9.15 10.30 12.50J 8.80 9.10 11.95 J 8.20 8.95 11.20 J 9.15 10.40 12.98J 9.15 9.75 11.23 J 7.80 8.65 11.80 J 9.15 10.20 13.28A 9.15 9.90 12.70 A 6.65 8.15 11.98 A 8.60 9.50 13.98S 9.55 10.15 14.45 S 6.45 8.15 12.23 S 8.30 9.00 15.58O 9.55 10.15 14.45 O 6.10 7.25 12.85 O 7.50 8.15 15.65N 9.15 9.25 13.15 N 6.10 7.25 13.75 N 6.95 7.90 14.70D 8.35 8.25 11.70 D 6.10 7.25 14.10 D 6.95 7.90 14.70
2006 2009 2012
J 8.35 8.25 11.70 J 6.10 7.25 14.10 J 6.10 6.65 10.93F 8.15 8.40 10.23 F 6.25 7.25 13.48 F 6.35 6.70 9.30M 8.30 8.90 9.23 M 6.20 7.05 12.85 M 6.05 6.30 8.33A 8.40 9.00 9.60 A 6.45 7.10 12.10 A 6.05 6.20 7.75M 8.50 9.20 10.25 M 6.90 7.70 10.28 M 5.75 5.90 7.35J 9.20 9.90 12.00 J 7.30 7.80 10.28 J 6.35 6.70 8.53J 9.20 9.90 12.00 J 7.30 7.25 9.45 J 6.70 7.10 8.88A 8.75 9.20 11.95 A na na na A 6.70 7.10 8.88S 8.75 9.20 11.95 S 6.80 6.60 8.93 S 6.70 7.10 8.68O 8.55 9.70 14.33 O 6.80 6.60 8.20 O 6.70 7.45 10.98N 8.55 10.15 16.15 N 6.80 6.25 7.85 N 6.90 7.65 11.13D 8.55 10.15 16.15 D 6.80 6.25 7.85 D 6.20 7.00 10.00
2013
J 6.20 7.00 10.00
Source: EPR - 20130214.
Whole turbot prices, ex-farm, CIF, in Spain, domestic
production, in EUR/kg, 2004-2013 (monthly)
13
SURIMI - Prices
1988 1989 1990 1991 1992 1993 1994 1995 1996 1997 1998
Korea, Korea, Korea, Korea, Korea, Korea, Korea, Korea, Korea, Korea, Korea,
China China China China China China China China China China China
J - 6.40 3.30 2.90 3.70 3.30 2.60 2.90 3.10 2.70 2.50F - 6.40 3.40 3.50 3.70 3.30 2.50 2.80 3.10 2.70 2.60M - 6.00 3.30 3.50 3.90 2.70 2.60 2.80 3.10 2.70 2.60A 6.70 5.30 3.30 3.50 3.90 2.70 2.60 2.80 3.10 2.70 2.60M 6.70 4.50 3.30 3.35 3.90 2.70 2.40 2.90 2.70 2.80 naJ 6.30 3.30 3.30 3.35 3.80 2.70 2.40 3.10 2.70 2.60 naJ 6.10 3.30 3.00 3.35 3.80 2.50 2.40 3.10 2.70 2.60 naA 5.50 3.20 3.00 3.70 3.80 2.50 2.40 3.10 2.70 2.60 naS 5.50 3.00 3.00 3.75 3.80 2.50 2.50 3.10 2.60 2.80 naO 6.00 3.00 3.00 3.75 3.30 2.50 2.60 3.10 2.60 2.80 2.20N 6.10 3.00 2.90 3.75 3.30 2.50 2.70 3.10 2.70 2.60 2.10D 6.35 3.30 2.90 3.70 3.30 2.50 2.80 3.10 2.70 2.60 2.00
1999 2000 2001 2002 2003 2004 2005 2006 2007 2008 2009
Korea, Korea,
China China
J 2.00 1.80 2.60 2.32 2.49 na 1.99 1.60 1.60 1.70 2.63F 2.00 1.80 2.50 2.15 2.33 na 1.89 1.60 1.60 1.60 naM 2.00 1.70 2.50 2.15 2.39 na 1.89 1.60 1.80 1.50 2.58A 1.70 1.60 2.30 2.17 na na 1.89 1.60 1.80 1.50 2.56M 1.70 1.60 2.30 2.09 na na 1.95 1.70 1.60 1.50 2.59J 1.80 1.60 2.20 na na 1.70 1.95 1.70 1.60 1.48 2.61J 1.80 1.50 2.20 2.18 2.22 1.70 1.70 1.70 1.60 2.15 2.50A 1.70 na 2.30 na 2.38 1.10 1.85 1.70 1.80 2.10 2.48S 1.80 1.80 2.40 2.23 na 1.10 1.65 1.70 1.80 2.20 2.47O 1.90 1.80 2.30 2.28 2.52 1.30 1.65 1.60 1.50 2.30 2.50N 1.80 1.80 NA 2.93 2.39 1.20 1.65 1.60 1.50 2.60 2.48D 1.80 1.80 NA 2.92 2.46 2.50 1.65 1.70 1.70 2.65 2.48
2010 2011 2012 2013
Origin: Spain Spain Spain Spain
J 2.43 2.33 2.50 2.45F 2.55 2.48 2.48M 2.57 2.36 2.49A 2.57 2.40 2.49M 2.59 2.38 2.49J 2.62 2.40 2.50J 2.62 2.40 2.47A 2.62 2.48 2.48S 2.43 2.48 2.48O 2.43 2.50 2.48N 2.27 2.48 2.48D 2.33 2.49 2.48
* USD from 1998 to 2000
Source: EPR - 20130217.
Surimi prices, wholesale, CFR, in France, various origins, in EUR/kg*, 1988-2013 (monthly)
Origin:
Origin: Spain Spain Spain Spain Spain Spain Spain Spain Spain
14
SEABASS - Prices
Month 1998 1999 2000 2001 2002 2003 2004 2005 2006 2007
J na 14.0 12.7 12.0 11.3 14.2 13.9 12.2 11.65 15.03F na 15.3 11.6 16.1 16.1 13.3 13.8 10.6 11.14 16.91M na 14.2 11.8 13.8 18.0 11.6 14.5 11.8 17.49 18.32A 17.3 20.0 12.1 12.9 23.0 16.2 16.1 26.0 20.00 23.86M 26.6 16.2 16.3 23.1 21.4 22.9 17.1 29.0 33.47 28.86J 22.6 20.3 14.5 20.0 18.7 22.7 17.8 21.5 30.71 26.69
J/A 20.9 na 14.5 23.1 24.3 21.7 18.6 23.9 21.80 27.48A 27.14 31.37
S 21.1 20.6 14.5 21.3 20.8 21.2 19.0 24.0 22.96 28.37O NA 18.9 14.7 0.1 14.5 20.4 19.1 22.3 21.37 21.03N 14.7 13.8 14.4 14.8 16.7 18.5 18.5 20.6 15.94 17.39D 14.9 17.8 14.8 16.5 13.6 19.1 17.0 13.7 22.36 24.17
Month 2008 2009 2010 2011 2012 2013
J 25.48 14.26 10.42 10.21 11.18 13.85F 17.16 12.63 11.56 9.25 10.28M 23.86 13.69 15.12 13.55 14.84A 25.33 20.83 20.98 20.01 22.88M 29.94 24.16 23.92 26.52 21.74J 27.33 23.58 25.08 27.10 23.68J 26.35 25.15 29.31 27.29 23.34A 26.39 23.12 22.51 25.73 24.83S 25.89 20.83 19.20 19.50 22.61O 19.09 16.82 19.82 18.43 19.71N 16.26 14.96 18.29 16.08 16.12D 20.00 20.28 22.73 17.74 14.55
Source: MERCABARNA - 20130217.
Fresh wild seabass prices, wholesale, in Barcelona,
domestic production, in EUR/kg, 1998-2013
15
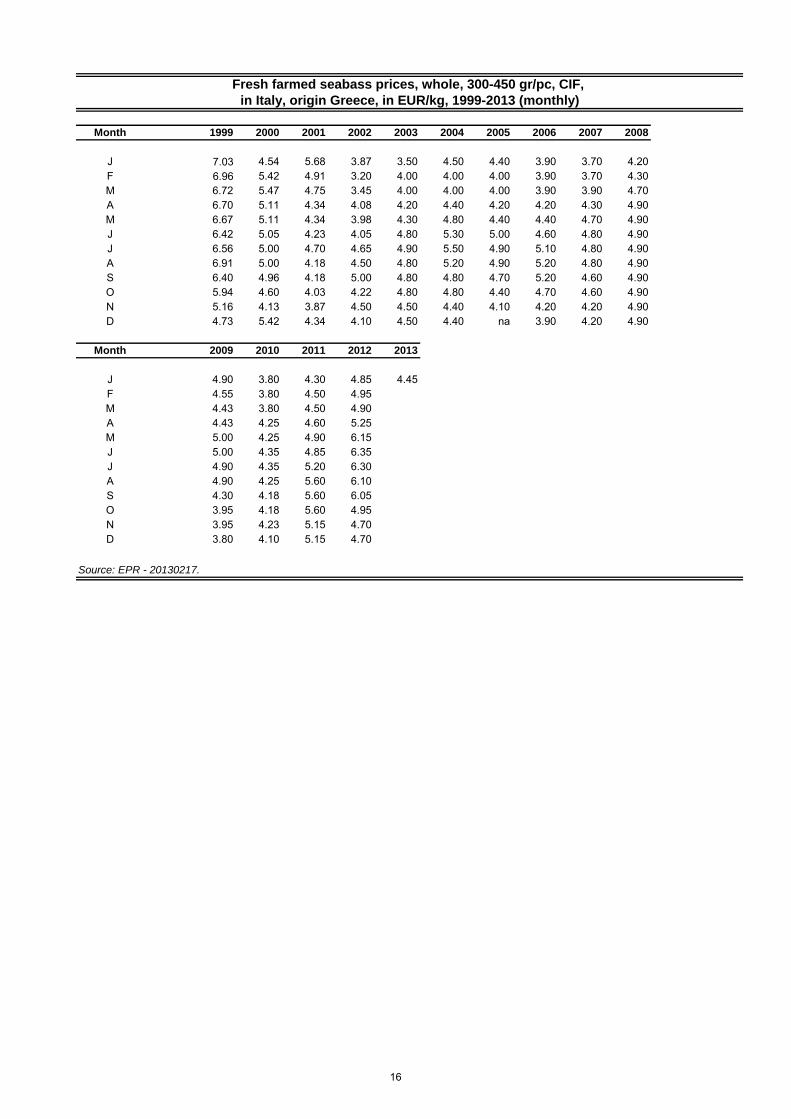
Month 1999 2000 2001 2002 2003 2004 2005 2006 2007 2008
J 7.03 4.54 5.68 3.87 3.50 4.50 4.40 3.90 3.70 4.20F 6.96 5.42 4.91 3.20 4.00 4.00 4.00 3.90 3.70 4.30M 6.72 5.47 4.75 3.45 4.00 4.00 4.00 3.90 3.90 4.70A 6.70 5.11 4.34 4.08 4.20 4.40 4.20 4.20 4.30 4.90M 6.67 5.11 4.34 3.98 4.30 4.80 4.40 4.40 4.70 4.90J 6.42 5.05 4.23 4.05 4.80 5.30 5.00 4.60 4.80 4.90J 6.56 5.00 4.70 4.65 4.90 5.50 4.90 5.10 4.80 4.90A 6.91 5.00 4.18 4.50 4.80 5.20 4.90 5.20 4.80 4.90S 6.40 4.96 4.18 5.00 4.80 4.80 4.70 5.20 4.60 4.90O 5.94 4.60 4.03 4.22 4.80 4.80 4.40 4.70 4.60 4.90N 5.16 4.13 3.87 4.50 4.50 4.40 4.10 4.20 4.20 4.90D 4.73 5.42 4.34 4.10 4.50 4.40 na 3.90 4.20 4.90
Month 2009 2010 2011 2012 2013
J 4.90 3.80 4.30 4.85 4.45F 4.55 3.80 4.50 4.95M 4.43 3.80 4.50 4.90A 4.43 4.25 4.60 5.25M 5.00 4.25 4.90 6.15J 5.00 4.35 4.85 6.35J 4.90 4.35 5.20 6.30A 4.90 4.25 5.60 6.10S 4.30 4.18 5.60 6.05O 3.95 4.18 5.60 4.95N 3.95 4.23 5.15 4.70D 3.80 4.10 5.15 4.70
Source: EPR - 20130217.
Fresh farmed seabass prices, whole, 300-450 gr/pc, CIF,
in Italy, origin Greece, in EUR/kg, 1999-2013 (monthly)
16
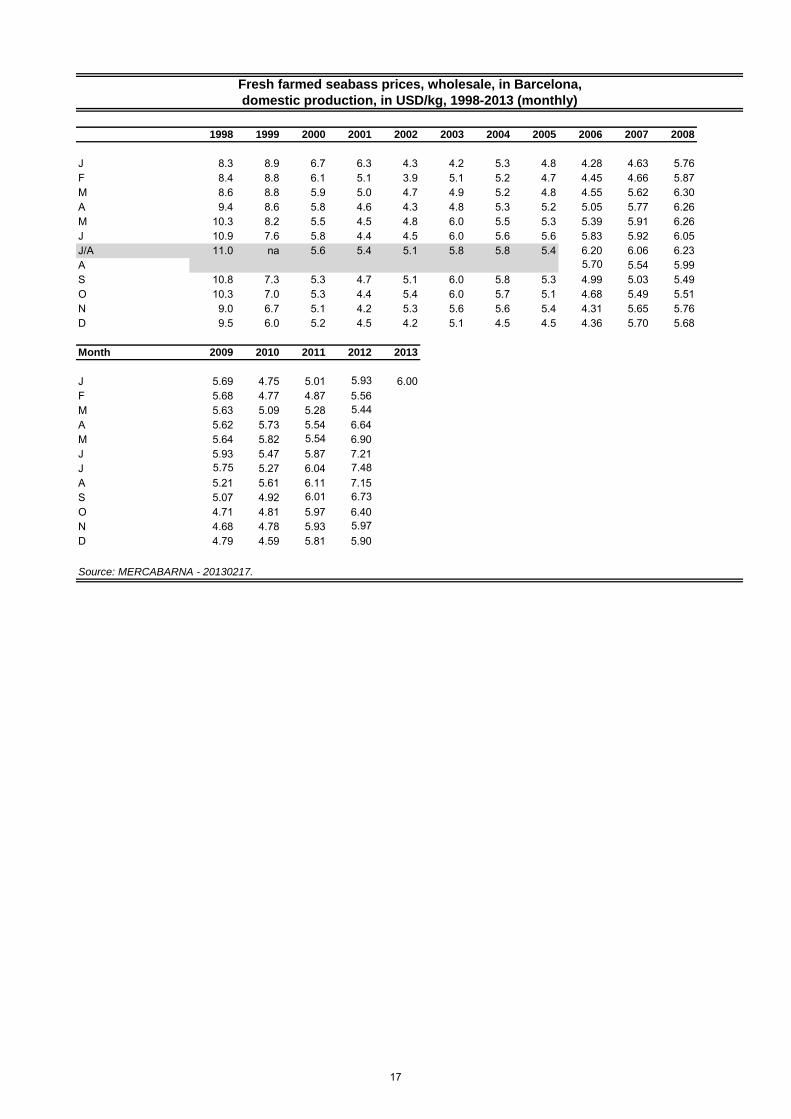
1998 1999 2000 2001 2002 2003 2004 2005 2006 2007 2008
J 8.3 8.9 6.7 6.3 4.3 4.2 5.3 4.8 4.28 4.63 5.76F 8.4 8.8 6.1 5.1 3.9 5.1 5.2 4.7 4.45 4.66 5.87M 8.6 8.8 5.9 5.0 4.7 4.9 5.2 4.8 4.55 5.62 6.30A 9.4 8.6 5.8 4.6 4.3 4.8 5.3 5.2 5.05 5.77 6.26M 10.3 8.2 5.5 4.5 4.8 6.0 5.5 5.3 5.39 5.91 6.26J 10.9 7.6 5.8 4.4 4.5 6.0 5.6 5.6 5.83 5.92 6.05J/A 11.0 na 5.6 5.4 5.1 5.8 5.8 5.4 6.20 6.06 6.23A 5.70 5.54 5.99S 10.8 7.3 5.3 4.7 5.1 6.0 5.8 5.3 4.99 5.03 5.49O 10.3 7.0 5.3 4.4 5.4 6.0 5.7 5.1 4.68 5.49 5.51N 9.0 6.7 5.1 4.2 5.3 5.6 5.6 5.4 4.31 5.65 5.76D 9.5 6.0 5.2 4.5 4.2 5.1 4.5 4.5 4.36 5.70 5.68
Month 2009 2010 2011 2012 2013
J 5.69 4.75 5.01 5.93 6.00F 5.68 4.77 4.87 5.56M 5.63 5.09 5.28 5.44A 5.62 5.73 5.54 6.64M 5.64 5.82 5.54 6.90J 5.93 5.47 5.87 7.21J 5.75 5.27 6.04 7.48A 5.21 5.61 6.11 7.15S 5.07 4.92 6.01 6.73O 4.71 4.81 5.97 6.40N 4.68 4.78 5.93 5.97D 4.79 4.59 5.81 5.90
Source: MERCABARNA - 20130217.
Fresh farmed seabass prices, wholesale, in Barcelona,
domestic production, in USD/kg, 1998-2013 (monthly)
17
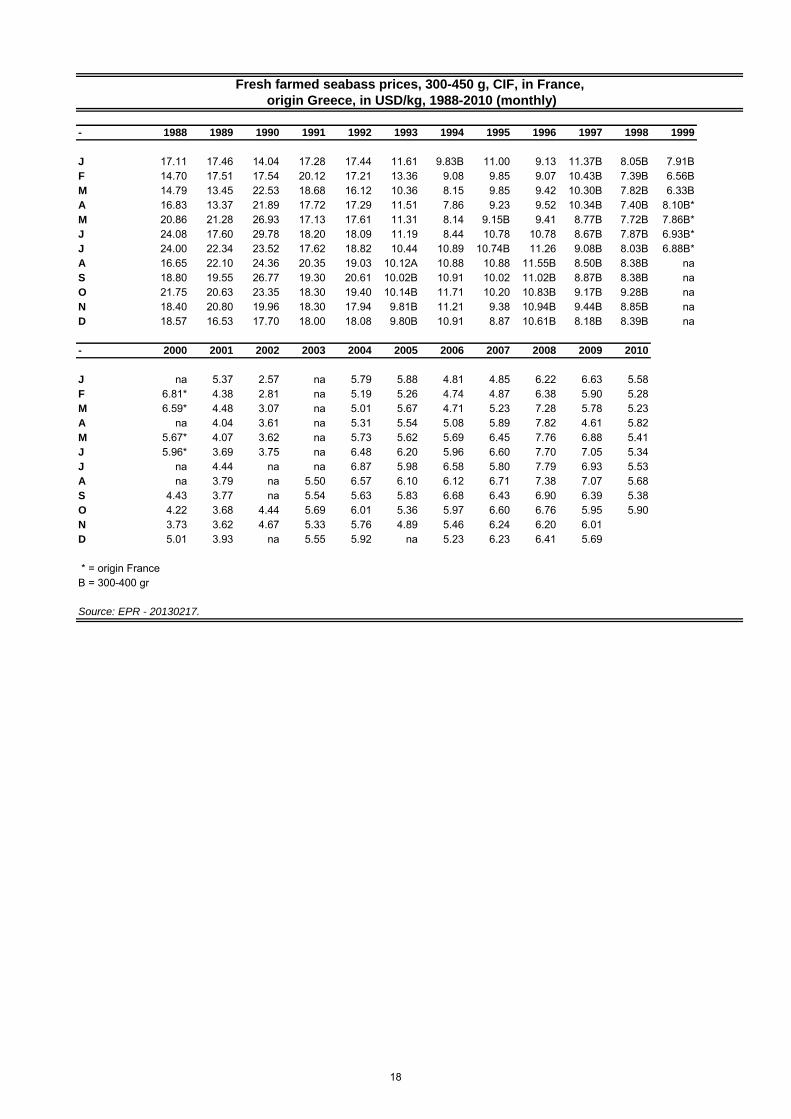
- 1988 1989 1990 1991 1992 1993 1994 1995 1996 1997 1998 1999
J 17.11 17.46 14.04 17.28 17.44 11.61 9.83B 11.00 9.13 11.37B 8.05B 7.91BF 14.70 17.51 17.54 20.12 17.21 13.36 9.08 9.85 9.07 10.43B 7.39B 6.56BM 14.79 13.45 22.53 18.68 16.12 10.36 8.15 9.85 9.42 10.30B 7.82B 6.33BA 16.83 13.37 21.89 17.72 17.29 11.51 7.86 9.23 9.52 10.34B 7.40B 8.10B*M 20.86 21.28 26.93 17.13 17.61 11.31 8.14 9.15B 9.41 8.77B 7.72B 7.86B*J 24.08 17.60 29.78 18.20 18.09 11.19 8.44 10.78 10.78 8.67B 7.87B 6.93B*J 24.00 22.34 23.52 17.62 18.82 10.44 10.89 10.74B 11.26 9.08B 8.03B 6.88B*A 16.65 22.10 24.36 20.35 19.03 10.12A 10.88 10.88 11.55B 8.50B 8.38B naS 18.80 19.55 26.77 19.30 20.61 10.02B 10.91 10.02 11.02B 8.87B 8.38B naO 21.75 20.63 23.35 18.30 19.40 10.14B 11.71 10.20 10.83B 9.17B 9.28B naN 18.40 20.80 19.96 18.30 17.94 9.81B 11.21 9.38 10.94B 9.44B 8.85B naD 18.57 16.53 17.70 18.00 18.08 9.80B 10.91 8.87 10.61B 8.18B 8.39B na
- 2000 2001 2002 2003 2004 2005 2006 2007 2008 2009 2010
J na 5.37 2.57 na 5.79 5.88 4.81 4.85 6.22 6.63 5.58F 6.81* 4.38 2.81 na 5.19 5.26 4.74 4.87 6.38 5.90 5.28M 6.59* 4.48 3.07 na 5.01 5.67 4.71 5.23 7.28 5.78 5.23A na 4.04 3.61 na 5.31 5.54 5.08 5.89 7.82 4.61 5.82M 5.67* 4.07 3.62 na 5.73 5.62 5.69 6.45 7.76 6.88 5.41J 5.96* 3.69 3.75 na 6.48 6.20 5.96 6.60 7.70 7.05 5.34J na 4.44 na na 6.87 5.98 6.58 5.80 7.79 6.93 5.53A na 3.79 na 5.50 6.57 6.10 6.12 6.71 7.38 7.07 5.68S 4.43 3.77 na 5.54 5.63 5.83 6.68 6.43 6.90 6.39 5.38O 4.22 3.68 4.44 5.69 6.01 5.36 5.97 6.60 6.76 5.95 5.90N 3.73 3.62 4.67 5.33 5.76 4.89 5.46 6.24 6.20 6.01D 5.01 3.93 na 5.55 5.92 na 5.23 6.23 6.41 5.69
* = origin FranceB = 300-400 gr
Source: EPR - 20130217.
Fresh farmed seabass prices, 300-450 g, CIF, in France,
origin Greece, in USD/kg, 1988-2010 (monthly)
18
SEABREAM - Prices
Month 2006 2007 2008 2009 2010 2011 2012 2013
J 18.37 16.89 21.09 16.32 15.79 15.83 15.77 16.54F 15.75 15.66 19.50 17.03 18.33 15.48 17.54M 18.67 19.82 16.70 14.68 21.21 17.55 17.08A 19.96 19.75 20.74 16.53 18.85 16.58 17.23M 18.86 18.01 17.71 14.66 19.00 16.29 17.86J 19.31 17.38 20.69 14.61 17.93 18.04 15.08J 18.34 24.41 19.47 15.86 14.14 19.45 15.55A 17.66 23.34 19.33 19.88 17.49 18.68 17.27S 18.47 20.63 17.05 16.73 17.39 18.11 17.66O 20.00 18.44 17.37 16.90 16.49 14.76 16.17N 21.63 20.31 16.29 15.67 14.68 15.55 18.17D 34.83 29.18 25.10 28.93 32.77 25.39 25.77
Source: MERCABARNA - 20130217.
Month 2006 2007 2008 2009 2010 2011 2012 2013
J 14.57 18.97 19.69 20.30 19.24 17.53 16.46 17.83F 19.80 18.21 18.93 21.09 21.63 18.33 18.78M 19.76 19.73 22.64 19.42 21.56 19.91 17.03A 22.83 19.42 19.70 17.31 18.02 19.90 20.13M 21.46 18.35 18.61 14.28 21.14 19.26 20.02J 23.08 20.63 22.42 19.81 21.02 19.81 18.90J 21.14 25.42 21.93 17.82 20.45 25.49 22.55A 19.47 21.22 18.75 15.15 24.01 22.50 25.65S 18.27 17.01 17.14 14.49 19.20 13.77 15.41O 15.86 14.37 12.99 11.44 12.38 12.30 14.45N 9.97 10.71 9.42 9.09 10.10 11.50 10.86D 19.00 17.31 16.25 18.82 20.59 18.90 15.90
Source: MERCABARNA - 20130217.
Fresh wild seabream prices, wholesale, in Barcelona, domestic production, in EUR/kg, 2006-2013 (monthly)
Fresh wild gilthead bream prices, wholesale, in Barcelona,
domestic production, in EUR/kg, 2006-2013 (monthly)
19
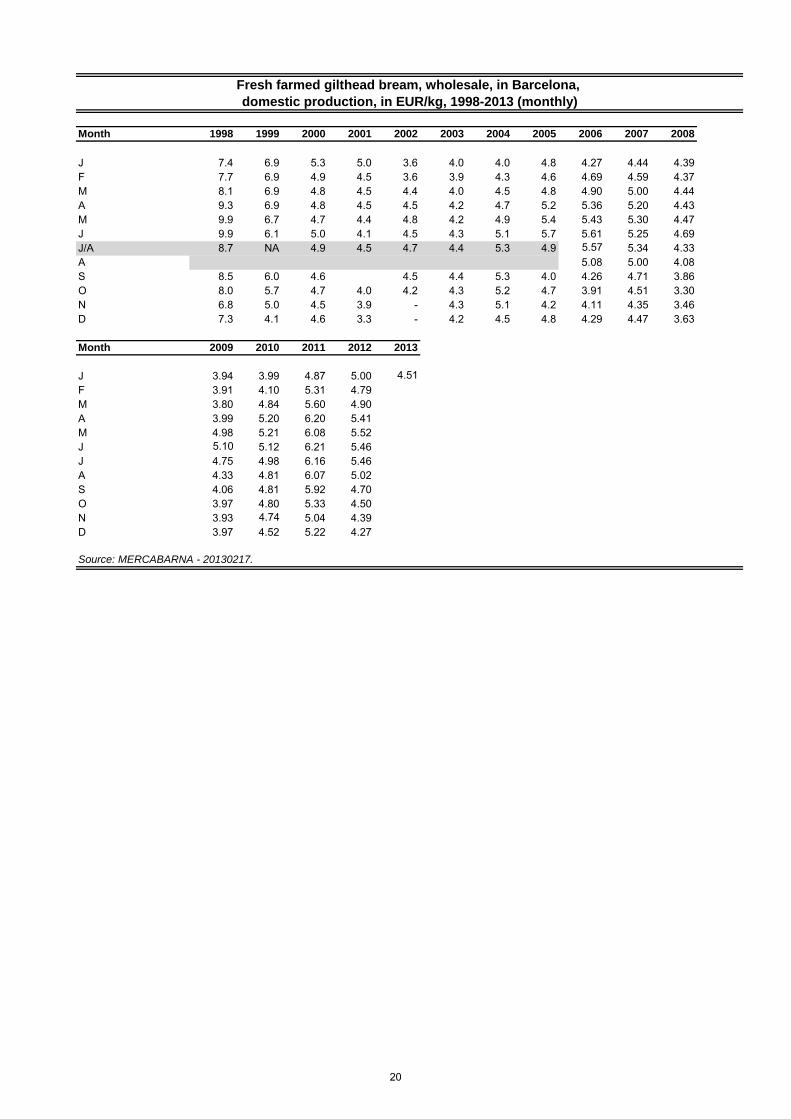
Month 1998 1999 2000 2001 2002 2003 2004 2005 2006 2007 2008
J 7.4 6.9 5.3 5.0 3.6 4.0 4.0 4.8 4.27 4.44 4.39F 7.7 6.9 4.9 4.5 3.6 3.9 4.3 4.6 4.69 4.59 4.37M 8.1 6.9 4.8 4.5 4.4 4.0 4.5 4.8 4.90 5.00 4.44A 9.3 6.9 4.8 4.5 4.5 4.2 4.7 5.2 5.36 5.20 4.43M 9.9 6.7 4.7 4.4 4.8 4.2 4.9 5.4 5.43 5.30 4.47J 9.9 6.1 5.0 4.1 4.5 4.3 5.1 5.7 5.61 5.25 4.69J/A 8.7 NA 4.9 4.5 4.7 4.4 5.3 4.9 5.57 5.34 4.33A 5.08 5.00 4.08S 8.5 6.0 4.6 4.5 4.4 5.3 4.0 4.26 4.71 3.86O 8.0 5.7 4.7 4.0 4.2 4.3 5.2 4.7 3.91 4.51 3.30N 6.8 5.0 4.5 3.9 - 4.3 5.1 4.2 4.11 4.35 3.46D 7.3 4.1 4.6 3.3 - 4.2 4.5 4.8 4.29 4.47 3.63
Month 2009 2010 2011 2012 2013
J 3.94 3.99 4.87 5.00 4.51F 3.91 4.10 5.31 4.79M 3.80 4.84 5.60 4.90A 3.99 5.20 6.20 5.41M 4.98 5.21 6.08 5.52J 5.10 5.12 6.21 5.46J 4.75 4.98 6.16 5.46A 4.33 4.81 6.07 5.02S 4.06 4.81 5.92 4.70O 3.97 4.80 5.33 4.50N 3.93 4.74 5.04 4.39D 3.97 4.52 5.22 4.27
Source: MERCABARNA - 20130217.
Fresh farmed gilthead bream, wholesale, in Barcelona,
domestic production, in EUR/kg, 1998-2013 (monthly)
20
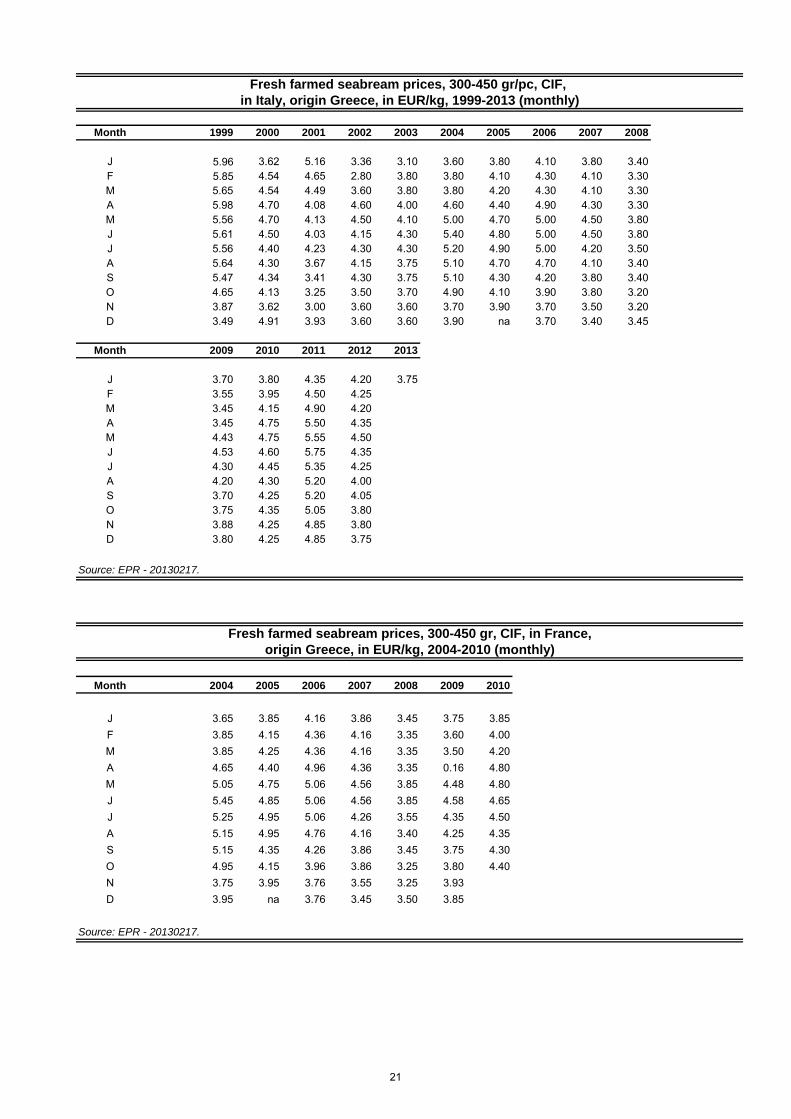
Month 1999 2000 2001 2002 2003 2004 2005 2006 2007 2008
J 5.96 3.62 5.16 3.36 3.10 3.60 3.80 4.10 3.80 3.40F 5.85 4.54 4.65 2.80 3.80 3.80 4.10 4.30 4.10 3.30M 5.65 4.54 4.49 3.60 3.80 3.80 4.20 4.30 4.10 3.30A 5.98 4.70 4.08 4.60 4.00 4.60 4.40 4.90 4.30 3.30M 5.56 4.70 4.13 4.50 4.10 5.00 4.70 5.00 4.50 3.80J 5.61 4.50 4.03 4.15 4.30 5.40 4.80 5.00 4.50 3.80J 5.56 4.40 4.23 4.30 4.30 5.20 4.90 5.00 4.20 3.50A 5.64 4.30 3.67 4.15 3.75 5.10 4.70 4.70 4.10 3.40S 5.47 4.34 3.41 4.30 3.75 5.10 4.30 4.20 3.80 3.40O 4.65 4.13 3.25 3.50 3.70 4.90 4.10 3.90 3.80 3.20N 3.87 3.62 3.00 3.60 3.60 3.70 3.90 3.70 3.50 3.20D 3.49 4.91 3.93 3.60 3.60 3.90 na 3.70 3.40 3.45
Month 2009 2010 2011 2012 2013
J 3.70 3.80 4.35 4.20 3.75F 3.55 3.95 4.50 4.25M 3.45 4.15 4.90 4.20A 3.45 4.75 5.50 4.35M 4.43 4.75 5.55 4.50J 4.53 4.60 5.75 4.35J 4.30 4.45 5.35 4.25A 4.20 4.30 5.20 4.00S 3.70 4.25 5.20 4.05O 3.75 4.35 5.05 3.80N 3.88 4.25 4.85 3.80D 3.80 4.25 4.85 3.75
Source: EPR - 20130217.
Month 2004 2005 2006 2007 2008 2009 2010
J 3.65 3.85 4.16 3.86 3.45 3.75 3.85F 3.85 4.15 4.36 4.16 3.35 3.60 4.00M 3.85 4.25 4.36 4.16 3.35 3.50 4.20A 4.65 4.40 4.96 4.36 3.35 0.16 4.80M 5.05 4.75 5.06 4.56 3.85 4.48 4.80J 5.45 4.85 5.06 4.56 3.85 4.58 4.65J 5.25 4.95 5.06 4.26 3.55 4.35 4.50A 5.15 4.95 4.76 4.16 3.40 4.25 4.35S 5.15 4.35 4.26 3.86 3.45 3.75 4.30O 4.95 4.15 3.96 3.86 3.25 3.80 4.40N 3.75 3.95 3.76 3.55 3.25 3.93D 3.95 na 3.76 3.45 3.50 3.85
Source: EPR - 20130217.
origin Greece, in EUR/kg, 2004-2010 (monthly)
Fresh farmed seabream prices, 300-450 gr, CIF, in France,
Fresh farmed seabream prices, 300-450 gr/pc, CIF,
in Italy, origin Greece, in EUR/kg, 1999-2013 (monthly)
21
Saithe - Prices
Month 1999 2000 2001 2002 2003 2004 2005 2006 2007 2008
J 3.25 2.21 2.20 2.38 2.45 na 1.85 2.43 2.48 2.60F 3.18 2.21 2.20 2.50 2.45 1.72 1.80 2.60 2.43 2.60M 3.00 2.21 2.22 2.55 2.35 1.72 1.85 2.60 2.43 2.60A 2.58 2.21 2.22 2.60 2.25 1.78 1.92 2.55 2.43 2.60M 2.38 2.21 2.25 2.65 2.15 1.85 1.95 2.55 2.43 2.70J 2.38 2.18 2.30 2.65 2.15 1.85 2.05 2.65 2.43 2.65J 2.25 2.15 2.35 2.65 2.15 1.87 2.15 2.57 2.40 2.70A 2.25 2.15 2.35 2.65 2.05 1.90 2.15 2.57 2.43 2.70S 2.05 2.17 2.42 2.65 1.98 1.90 2.15 2.60 2.43 2.70O 1.99 2.17 2.50 2.60 1.95 1.93 2.25 2.40 2.40 2.70N 2.10 2.22 2.45 2.57 1.95 1.90 2.35 2.50 2.45 2.90D 2.10 2.15 2.40 2.52 1.90 1.85 2.45 2.48 2.48 3.05
Month 2009 2010 2011 2012 2013
J 3.15 3.00 3.15 3.80 3.40F 3.10 3.10 3.20 3.50M 3.15 2.90 3.50 3.80A 3.10 3.10 3.80 3.80M 3.15 3.10 3.60 3.60J 3.05 3.30 3.90 3.80J na 3.10 3.60 3.80A 3.05 3.10 3.80 3.65S 3.05 3.50 3.45 3.45O na 3.50 3.80 3.45N na 3.50 3.80 3.40D 2.95 3.50 3.80 3.40
Source: EPR - 20130217.
Frozen saithe block prices, 16.5/lb, skinless & boneless, DAP, in Germany,
origin Norway, in EUR/kg, 1999-2013 (monthly)
22
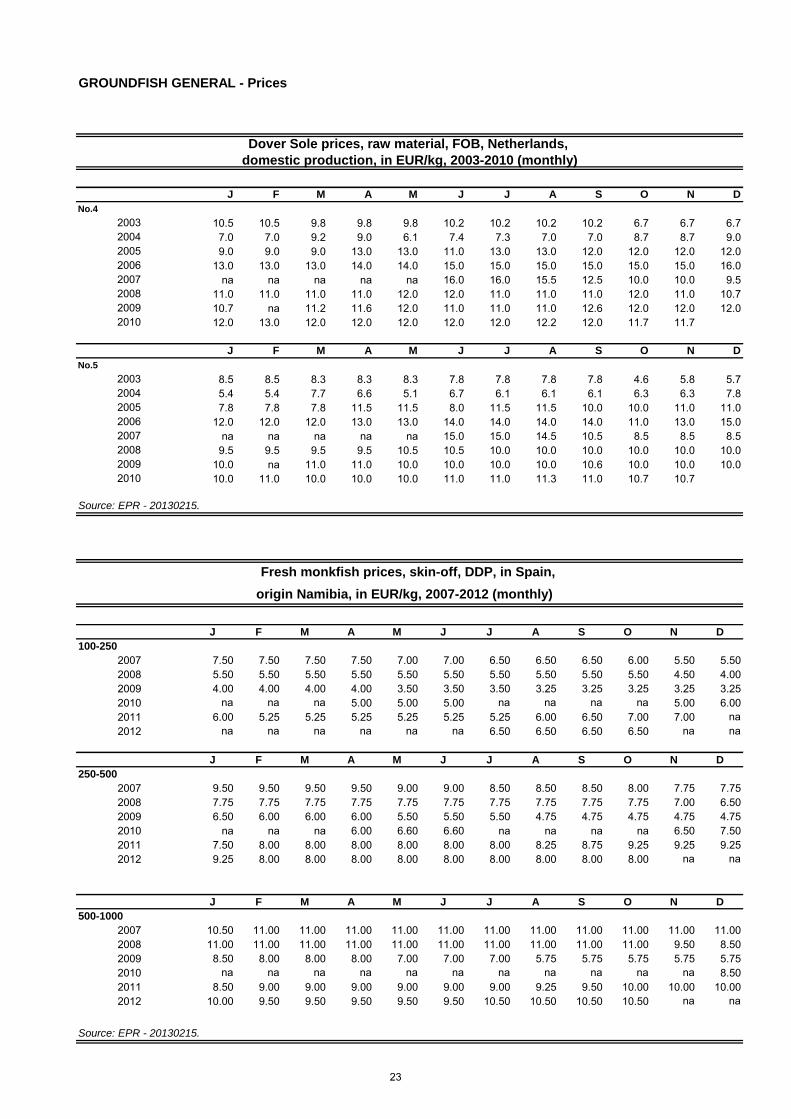
J F M A M J J A S O N D
No.4
2003 10.5 10.5 9.8 9.8 9.8 10.2 10.2 10.2 10.2 6.7 6.7 6.72004 7.0 7.0 9.2 9.0 6.1 7.4 7.3 7.0 7.0 8.7 8.7 9.02005 9.0 9.0 9.0 13.0 13.0 11.0 13.0 13.0 12.0 12.0 12.0 12.02006 13.0 13.0 13.0 14.0 14.0 15.0 15.0 15.0 15.0 15.0 15.0 16.02007 na na na na na 16.0 16.0 15.5 12.5 10.0 10.0 9.52008 11.0 11.0 11.0 11.0 12.0 12.0 11.0 11.0 11.0 12.0 11.0 10.72009 10.7 na 11.2 11.6 12.0 11.0 11.0 11.0 12.6 12.0 12.0 12.02010 12.0 13.0 12.0 12.0 12.0 12.0 12.0 12.2 12.0 11.7 11.7
J F M A M J J A S O N D
No.5
2003 8.5 8.5 8.3 8.3 8.3 7.8 7.8 7.8 7.8 4.6 5.8 5.72004 5.4 5.4 7.7 6.6 5.1 6.7 6.1 6.1 6.1 6.3 6.3 7.82005 7.8 7.8 7.8 11.5 11.5 8.0 11.5 11.5 10.0 10.0 11.0 11.02006 12.0 12.0 12.0 13.0 13.0 14.0 14.0 14.0 14.0 11.0 13.0 15.02007 na na na na na 15.0 15.0 14.5 10.5 8.5 8.5 8.52008 9.5 9.5 9.5 9.5 10.5 10.5 10.0 10.0 10.0 10.0 10.0 10.02009 10.0 na 11.0 11.0 10.0 10.0 10.0 10.0 10.6 10.0 10.0 10.02010 10.0 11.0 10.0 10.0 10.0 11.0 11.0 11.3 11.0 10.7 10.7
Source: EPR - 20130215.
J F M A M J J A S O N D
100-250
gr/pc 2007 7.50 7.50 7.50 7.50 7.00 7.00 6.50 6.50 6.50 6.00 5.50 5.502008 5.50 5.50 5.50 5.50 5.50 5.50 5.50 5.50 5.50 5.50 4.50 4.002009 4.00 4.00 4.00 4.00 3.50 3.50 3.50 3.25 3.25 3.25 3.25 3.252010 na na na 5.00 5.00 5.00 na na na na 5.00 6.002011 6.00 5.25 5.25 5.25 5.25 5.25 5.25 6.00 6.50 7.00 7.00 na2012 na na na na na na 6.50 6.50 6.50 6.50 na na
J F M A M J J A S O N D
250-500
2007 9.50 9.50 9.50 9.50 9.00 9.00 8.50 8.50 8.50 8.00 7.75 7.752008 7.75 7.75 7.75 7.75 7.75 7.75 7.75 7.75 7.75 7.75 7.00 6.502009 6.50 6.00 6.00 6.00 5.50 5.50 5.50 4.75 4.75 4.75 4.75 4.752010 na na na 6.00 6.60 6.60 na na na na 6.50 7.502011 7.50 8.00 8.00 8.00 8.00 8.00 8.00 8.25 8.75 9.25 9.25 9.252012 9.25 8.00 8.00 8.00 8.00 8.00 8.00 8.00 8.00 8.00 na na
J F M A M J J A S O N D
500-1000
2007 10.50 11.00 11.00 11.00 11.00 11.00 11.00 11.00 11.00 11.00 11.00 11.002008 11.00 11.00 11.00 11.00 11.00 11.00 11.00 11.00 11.00 11.00 9.50 8.502009 8.50 8.00 8.00 8.00 7.00 7.00 7.00 5.75 5.75 5.75 5.75 5.752010 na na na na na na na na na na na 8.502011 8.50 9.00 9.00 9.00 9.00 9.00 9.00 9.25 9.50 10.00 10.00 10.002012 10.00 9.50 9.50 9.50 9.50 9.50 10.50 10.50 10.50 10.50 na na
Source: EPR - 20130215.
GROUNDFISH GENERAL - Prices
Dover Sole prices, raw material, FOB, Netherlands,
Fresh monkfish prices, skin-off, DDP, in Spain,
domestic production, in EUR/kg, 2003-2010 (monthly)
origin Namibia, in EUR/kg, 2007-2012 (monthly)
23
J F M A M J J A S O N D
2000 1.76 1.77 1.72 1.74 1.70 1.63 1.65 1.65 2.07 2.07 2.09 2.022001 1.89 2.70 2.70 2.60 2.60 2.60 2.60 2.60 2.65 2.65 2.60 2.602002 2.60 2.45 2.45 2.45 2.30 2.25 2.20 2.20 2.30 2.30 2.90 2.902003 2.36 2.15 2.20 2.10 na na 1.95 2.10 na 2.15 2.04 2.022004 na na 1.98 1.95 na 1.95 1.95 1.89 1.89 1.99 1.89 1.892005 1.99 1.89 1.89 1.89 1.95 1.95 1.70 1.85 1.65 1.65 1.65 1.652006 1.60 1.60 1.60 1.60 1.70 1.70 1.70 1.70 1.70 1.60 1.60 1.702007 1.65 1.60 1.82 1.82 1.62 1.64 1.62 1.80 1.80 1.55 1.50 1.662008 1.68 1.63 1.50 1.48 1.50 1.48 2.15 2.10 2.20 2.30 2.60 2.652009 2.63 na 2.58 2.56 2.59 2.61 2.50 2.48 2.47 2.50 2.48 2.482010 2.43 2.55 2.57 2.57 2.59 2.62 2.62 2.62 2.43 2.43 2.27 2.332011 2.33 2.48 2.36 2.40 2.38 2.40 2.40 2.48 2.48 2.50 2.48 2.492012 2.5 2.48 2.49 2.49 2.49 2.50 2.47 2.48 2.48 2.48 2.48 2.482013 2.45
Source: EPR - 20130215.
origin Spain, in EUR/kg, 2000-2013 (monthly)
Surimi prices, stick - grade A, 250 gr/pc, DDP, in France,
24
Country 1984 1985 1986 1987 1988 1989 1990 1991 1992 1993
China . . . . . . . . 129.8 179.8Portugal 0.2 0.2 1.0 2.8 3.9 3.0 6.9 10.4 24.7 32.9Denmark 50.9 45.7 70.4 77.2 74.5 83.5 99.3 91.2 81.9 61.3Netherlands 6.1 10.5 10.0 9.0 11.8 18.3 16.3 14.3 15.0 17.6Norway 0.6 0.3 2.2 4.4 8.9 25.3 36.0 44.9 69.7 82.0Poland . . . . . . . . 1.4 2.7France 19.4 18.5 17.0 18.7 17.2 22.5 21.8 21.4 20.4 20.5UK 56.3 63.8 58.0 49.6 59.5 63.3 58.8 44.9 42.2 35.5Japan 93.7 112.2 16.7 10.3 32.2 21.3 34.0 24.6 36.7 21.7Spain 5.4 3.6 4.0 7.8 7.7 7.1 5.6 5.3 8.9 10.4Korea Rep 6.9 6.0 9.7 28.4 28.4 12.4 23.6 20.9 25.4 39.4Sweden 0.5 0.8 0.3 0.5 0.2 0.1 1.5 1.9 2.4 1.8Germany 6.5 7.3 8.7 7.5 18.3 28.6 11.0 6.8 7.7 8.9Lithuania . . . . . . . . . .
Canada 2.3 1.3 4.5 2.9 1.2 4.3 5.6 12.2 11.4 23.7Belgium 6.5 6.5 6.2 5.9 6.3 7.0 6.3 5.4 6.4 5.9Italy 4.1 6.2 1.7 5.8 8.4 8.5 9.9 13.5 12.2 10.2Thailand . . . . 0.0 0.0 0.0 . 3.2 5.1Others 76.3 75.6 79.6 75.9 69.7 15.9 9.5 11.6 22.0 25.1Total 335.6 358.5 289.8 306.5 348.2 321.1 346.1 329.2 521.4 584.4
Country 1994 1995 1996 1997 1998 1999 2000 2001 2002 2003
China 233.4 223.4 184.1 183.3 377.1 314.0 392.4 441.9 459.7 462.8Portugal 41.7 39.3 44.8 31.4 25.3 43.4 25.7 37.3 39.4 45.3Denmark 90.5 71.2 68.7 68.8 56.8 55.5 52.9 56.4 56.1 49.4Netherlands 27.4 17.3 17.9 17.5 13.4 18.6 13.4 11.4 7.7 10.7Norway 86.4 98.1 98.6 105.9 91.0 93.0 83.3 77.3 65.0 43.8Poland 0.5 0.7 1.7 6.0 11.2 7.1 11.2 11.7 13.5 7.8France 26.0 26.2 32.8 28.9 25.8 29.3 26.4 24.1 22.7 25.9UK 38.0 32.3 52.2 50.2 44.2 35.2 36.9 33.0 35.0 35.8Japan 35.6 28.6 35.7 29.0 20.4 24.3 27.1 26.9 27.6 25.1Spain 16.6 17.0 15.1 11.4 9.8 10.0 9.7 9.8 15.5 17.7Korea Rep 29.2 34.0 42.6 27.2 10.8 17.2 12.4 13.5 15.5 19.4Sweden 6.1 7.7 6.9 7.9 5.8 4.0 3.5 4.4 4.4 7.1Germany 9.2 7.8 8.7 8.4 5.9 4.9 3.2 2.5 2.0 1.8Lithuania 0.6 0.6 0.7 1.1 0.1 0.9 2.7 2.7 1.7 3.4Canada 37.5 40.1 35.8 40.8 35.5 23.3 19.4 18.4 23.5 26.9Belgium 5.5 5.5 4.9 4.6 5.0 4.1 3.6 2.8 3.2 3.3Italy 4.0 3.3 3.7 3.7 4.0 4.1 3.7 3.8 3.2 3.4Thailand 7.3 4.4 2.7 1.5 0.7 0.2 1.3 3.0 5.2 5.4Others 29.6 28.4 32.5 30.5 26.8 27.8 18.7 16.9 12.9 9.6Total 724.8 685.8 690.0 658.1 769.5 716.8 747.3 797.8 813.8 804.6
Cod - Imports
World imports of whole fresh, chilled and frozen cod,
by country of origin, in 1 000 tonnes, 1984-2011
25

Country 2004 2005 2006 2007 2008 2009 2010* 2011*
China 585.0 670.2 591.1 490.0 350.6 151.9 150.1 178.1Portugal 51.1 53.4 61.0 57.4 49.4 48.2 43.4 42.4Denmark 48.8 36.4 35.5 33.2 35.3 38.2 41.0 44.0Netherlands 12.7 16.1 16.1 20.9 21.3 33.6 29.6 31.6
Norway 43.0 35.2 34.8 42.8 31.9 22.4 16.1 21.2Poland 12.7 14.2 15.3 16.0 19.2 22.2 26.1 21.7France 24.3 20.4 20.2 17.2 14.2 17.4 18.2 17.9UK 30.6 29.3 23.3 15.1 14.3 15.6 14.6 15.1Japan 23.7 20.4 17.1 8.8 11.7 14.9 12.9 16.7Spain 15.1 15.2 18.4 20.3 12.7 13.8 11.9 10.6Korea Rep 15.8 15.5 12.1 14.6 13.1 12.9 16.8 23.7Sweden 8.1 7.6 8.2 8.4 7.9 10.2 12.4 13.0Germany 3.4 4.3 3.9 6.9 1.9 4.6 5.4 8.2
Lithuania 6.3 9.3 5.9 6.8 5.0 4.5 6.2 6.3Canada 19.1 7.9 4.3 3.8 4.2 4.5 4.6 5.2Belgium 2.7 2.9 2.7 2.5 2.5 2.8 2.3 2.5
Italy 3.3 2.5 2.5 2.3 2.1 2.1 2.6 2.8Thailand 5.2 4.1 3.5 1.7 2.2 2.1 2.3 2.7Others 9.4 12.3 12.8 10.4 11.7 11.9 11.4 16.5Total 920.4 977.2 888.6 779.0 611.2 433.8 427.9 480.1
* figures for 2010 and 2011 are preliminary only (world total does not include all countries)
Source: Fishstat Plus, GTIS® (bolded) - 20130312
World imports of whole fresh, chilled and frozen cod,
by country of origin, in 1 000 tonnes, 1984-2011 (cont.)
26
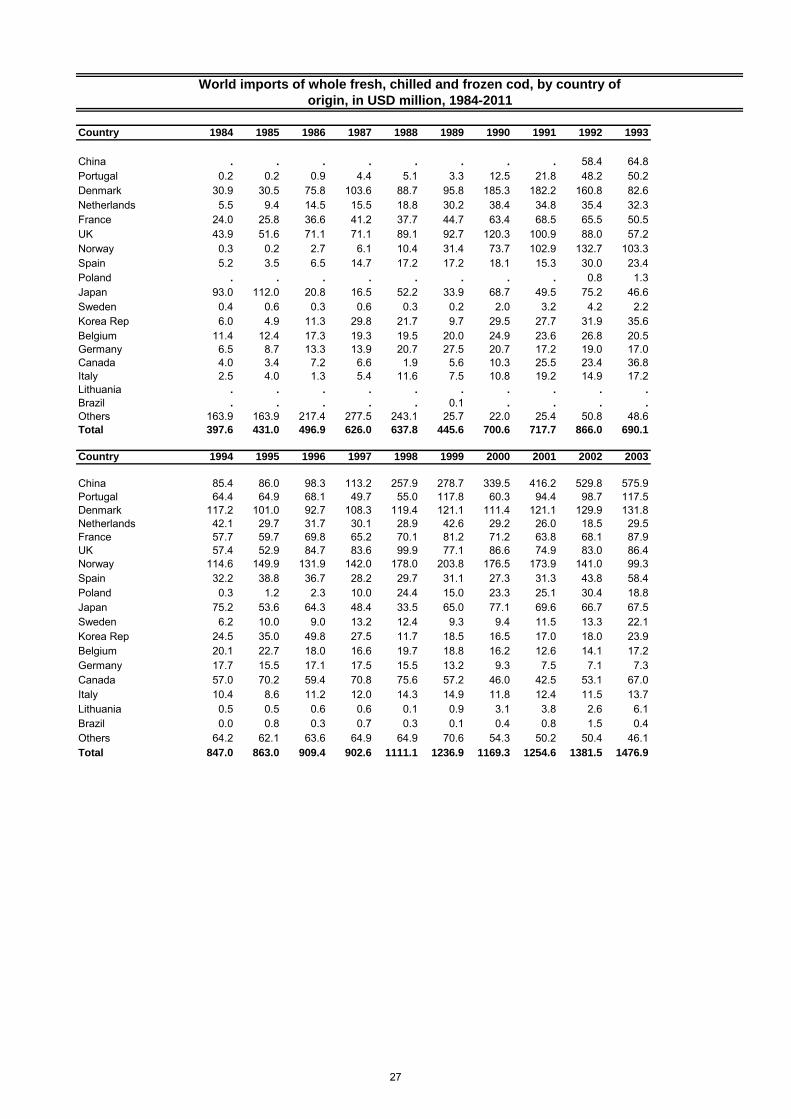
Country 1984 1985 1986 1987 1988 1989 1990 1991 1992 1993
China . . . . . . . . 58.4 64.8Portugal 0.2 0.2 0.9 4.4 5.1 3.3 12.5 21.8 48.2 50.2Denmark 30.9 30.5 75.8 103.6 88.7 95.8 185.3 182.2 160.8 82.6Netherlands 5.5 9.4 14.5 15.5 18.8 30.2 38.4 34.8 35.4 32.3France 24.0 25.8 36.6 41.2 37.7 44.7 63.4 68.5 65.5 50.5UK 43.9 51.6 71.1 71.1 89.1 92.7 120.3 100.9 88.0 57.2Norway 0.3 0.2 2.7 6.1 10.4 31.4 73.7 102.9 132.7 103.3Spain 5.2 3.5 6.5 14.7 17.2 17.2 18.1 15.3 30.0 23.4Poland . . . . . . . . 0.8 1.3Japan 93.0 112.0 20.8 16.5 52.2 33.9 68.7 49.5 75.2 46.6Sweden 0.4 0.6 0.3 0.6 0.3 0.2 2.0 3.2 4.2 2.2Korea Rep 6.0 4.9 11.3 29.8 21.7 9.7 29.5 27.7 31.9 35.6Belgium 11.4 12.4 17.3 19.3 19.5 20.0 24.9 23.6 26.8 20.5Germany 6.5 8.7 13.3 13.9 20.7 27.5 20.7 17.2 19.0 17.0Canada 4.0 3.4 7.2 6.6 1.9 5.6 10.3 25.5 23.4 36.8Italy 2.5 4.0 1.3 5.4 11.6 7.5 10.8 19.2 14.9 17.2Lithuania . . . . . . . . . .
Brazil . . . . . 0.1 . . . .
Others 163.9 163.9 217.4 277.5 243.1 25.7 22.0 25.4 50.8 48.6Total 397.6 431.0 496.9 626.0 637.8 445.6 700.6 717.7 866.0 690.1
Country 1994 1995 1996 1997 1998 1999 2000 2001 2002 2003
China 85.4 86.0 98.3 113.2 257.9 278.7 339.5 416.2 529.8 575.9Portugal 64.4 64.9 68.1 49.7 55.0 117.8 60.3 94.4 98.7 117.5Denmark 117.2 101.0 92.7 108.3 119.4 121.1 111.4 121.1 129.9 131.8Netherlands 42.1 29.7 31.7 30.1 28.9 42.6 29.2 26.0 18.5 29.5France 57.7 59.7 69.8 65.2 70.1 81.2 71.2 63.8 68.1 87.9UK 57.4 52.9 84.7 83.6 99.9 77.1 86.6 74.9 83.0 86.4Norway 114.6 149.9 131.9 142.0 178.0 203.8 176.5 173.9 141.0 99.3Spain 32.2 38.8 36.7 28.2 29.7 31.1 27.3 31.3 43.8 58.4Poland 0.3 1.2 2.3 10.0 24.4 15.0 23.3 25.1 30.4 18.8Japan 75.2 53.6 64.3 48.4 33.5 65.0 77.1 69.6 66.7 67.5Sweden 6.2 10.0 9.0 13.2 12.4 9.3 9.4 11.5 13.3 22.1Korea Rep 24.5 35.0 49.8 27.5 11.7 18.5 16.5 17.0 18.0 23.9Belgium 20.1 22.7 18.0 16.6 19.7 18.8 16.2 12.6 14.1 17.2Germany 17.7 15.5 17.1 17.5 15.5 13.2 9.3 7.5 7.1 7.3Canada 57.0 70.2 59.4 70.8 75.6 57.2 46.0 42.5 53.1 67.0Italy 10.4 8.6 11.2 12.0 14.3 14.9 11.8 12.4 11.5 13.7Lithuania 0.5 0.5 0.6 0.6 0.1 0.9 3.1 3.8 2.6 6.1Brazil 0.0 0.8 0.3 0.7 0.3 0.1 0.4 0.8 1.5 0.4Others 64.2 62.1 63.6 64.9 64.9 70.6 54.3 50.2 50.4 46.1Total 847.0 863.0 909.4 902.6 1111.1 1236.9 1169.3 1254.6 1381.5 1476.9
World imports of whole fresh, chilled and frozen cod, by country of
origin, in USD million, 1984-2011
27
Country 2004 2005 2006 2007 2008 2009 2010* 2011*
China 722.8 953.1 888.1 888.1 726.2 325.2 364.0 538.5Portugal 157.5 179.5 247.3 287.8 253.6 148.9 159.1 177.0Denmark 140.6 129.7 148.1 160.0 163.7 116.3 131.9 164.5Netherlands 37.1 49.2 56.2 75.2 90.7 95.8 96.7 121.2
France 93.7 94.9 105.4 97.7 88.1 84.3 94.3 105.8UK 88.5 97.5 100.5 81.2 73.6 62.4 50.6 60.4Norway 118.5 106.7 125.8 189.5 139.7 58.5 45.8 70.5Spain 54.8 62.2 82.9 105.1 73.8 50.9 50.5 53.0Poland 35.2 44.1 48.5 60.2 73.6 49.0 56.4 60.0Japan 65.9 61.1 70.4 39.4 57.9 45.6 44.2 66.1Sweden 31.1 31.7 40.5 53.8 47.1 39.6 54.6 66.4Korea Rep 21.1 23.3 18.6 28.0 24.6 23.8 37.4 62.4Belgium 17.1 18.4 18.6 21.0 21.6 19.7 16.3 19.6
Germany 13.1 17.4 20.0 36.5 13.8 19.3 22.0 38.7
Canada 55.1 26.2 16.8 17.9 19.5 13.8 13.4 19.1Italy 14.6 12.7 14.5 15.7 14.8 13.2 17.7 19.3Lithuania 13.9 25.4 15.7 22.0 14.8 9.2 14.8 19.3Brazil 5.3 2.6 3.7 4.2 9.0 8.9 24.3 51.8Others 46.9 55.2 66.4 53.5 67.3 54.5 61.0 70.3Total 1732.6 1991.0 2088.1 2236.8 1973.3 1239.2 1355.0 1783.9
* figures for 2010 and 2011 are preliminary only (world total does not include all countries)
Source: Fishstat Plus, GTIS® (bolded) - 20130312
World imports of whole fresh, chilled and frozen cod, by country of
origin, in USD million, 1984-2011 (cont.)
28
Country 1999 2000 2001 2002 2003 2004 2005 2006 2007 2008
Norway 29.0 24.8 17.2 23.6 29.2 26.5 30.5 27.5 28.3 26.4Russian Fed 63.8 62.0 76.1 78.4 64.5 55.9 54.5 54.3 37.8 29.6Denmark 26.6 26.2 22.1 25.2 23.5 29.6 29.0 27.6 27.0 25.6USA 22.4 8.2 11.4 12.2 16.3 18.1 24.8 28.1 35.4 33.6Netherlands 6.5 5.6 5.5 5.3 6.9 10.4 9.1 9.8 10.3 9.3Sweden 10.4 10.5 14.1 9.8 10.5 11.9 7.4 10.8 14.8 14.0Germany 13.2 10.2 10.2 6.6 8.6 9.9 10.7 10.1 11.5 9.0Spain 2.8 3.7 3.1 5.3 8.0 8.3 8.6 9.9 15.8 10.1UK 5.8 5.4 6.1 6.9 7.7 6.7 7.4 5.7 3.3 3.5Latvia 3.9 4.4 4.6 2.8 3.2 3.1 1.5 2.8 3.3 3.9Greenland 0.5 0.1 0.3 1.6 1.9 2.2 1.9 3.0 5.1 8.3Others 35.5 33.2 35.7 32.2 35.3 32.1 25.8 24.2 21.6 19.3Total 220.4 194.3 206.5 209.8 215.5 214.6 211.2 213.7 214.2 192.5
Country 2009 2010 2011
Norway 35.9 41.7 46.1Russian Fed 39.4 27.7 31.5Denmark 26.4 30.8 30.5USA 25.4 29.0 25.6Netherlands 17.8 14.2 21.9Sweden 15.2 14.5 15.9Germany 9.3 10.7 11.2Spain 14.0 12.3 9.3UK 6.4 7.1 6.1Latvia 4.0 7.3 5.9Greenland 5.7 5.9 5.6Others 21.1 18.4 17.8Total 220.7 219.7 227.5
Source: EUROSTAT – 20130210.
EU-27 imports of whole fresh, chilled and frozen cod,
by country of origin, in 1 000 tonnes, 1999-2011
29
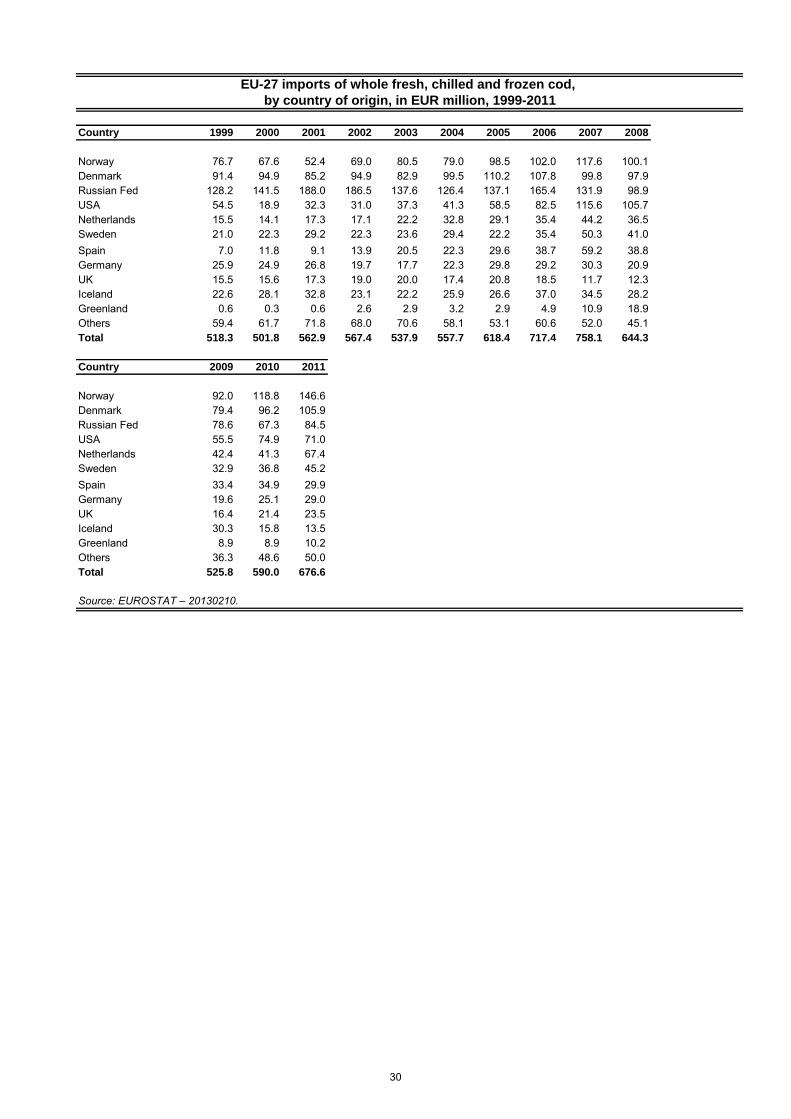
Country 1999 2000 2001 2002 2003 2004 2005 2006 2007 2008
Norway 76.7 67.6 52.4 69.0 80.5 79.0 98.5 102.0 117.6 100.1Denmark 91.4 94.9 85.2 94.9 82.9 99.5 110.2 107.8 99.8 97.9Russian Fed 128.2 141.5 188.0 186.5 137.6 126.4 137.1 165.4 131.9 98.9USA 54.5 18.9 32.3 31.0 37.3 41.3 58.5 82.5 115.6 105.7Netherlands 15.5 14.1 17.3 17.1 22.2 32.8 29.1 35.4 44.2 36.5Sweden 21.0 22.3 29.2 22.3 23.6 29.4 22.2 35.4 50.3 41.0Spain 7.0 11.8 9.1 13.9 20.5 22.3 29.6 38.7 59.2 38.8Germany 25.9 24.9 26.8 19.7 17.7 22.3 29.8 29.2 30.3 20.9UK 15.5 15.6 17.3 19.0 20.0 17.4 20.8 18.5 11.7 12.3Iceland 22.6 28.1 32.8 23.1 22.2 25.9 26.6 37.0 34.5 28.2Greenland 0.6 0.3 0.6 2.6 2.9 3.2 2.9 4.9 10.9 18.9Others 59.4 61.7 71.8 68.0 70.6 58.1 53.1 60.6 52.0 45.1Total 518.3 501.8 562.9 567.4 537.9 557.7 618.4 717.4 758.1 644.3
Country 2009 2010 2011
Norway 92.0 118.8 146.6Denmark 79.4 96.2 105.9Russian Fed 78.6 67.3 84.5USA 55.5 74.9 71.0Netherlands 42.4 41.3 67.4Sweden 32.9 36.8 45.2Spain 33.4 34.9 29.9Germany 19.6 25.1 29.0UK 16.4 21.4 23.5Iceland 30.3 15.8 13.5Greenland 8.9 8.9 10.2Others 36.3 48.6 50.0Total 525.8 590.0 676.6
Source: EUROSTAT – 20130210.
EU-27 imports of whole fresh, chilled and frozen cod,
by country of origin, in EUR million, 1999-2011
30
Country 1999 2000 2001 2002 2003 2004 2005 2006 2007 2008
China 7.2 10.2 16.8 12.5 26.9 32.4 47.1 52.2 57.3 57.3Iceland 39.3 36.9 40.0 38.0 41.3 49.1 49.7 49.3 46.9 35.2Denmark 38.3 42.6 45.1 37.3 44.0 43.2 42.9 41.1 35.5 30.3Netherlands 15.8 14.5 17.9 17.9 14.5 16.2 19.8 19.5 18.2 20.0Norway 31.9 32.0 24.4 22.5 19.6 20.2 21.0 20.1 17.9 17.1Russian Fed 8.9 11.9 16.0 16.1 15.4 10.7 15.7 14.9 12.0 11.7Germany 12.0 13.8 14.8 13.7 9.5 9.4 8.2 10.8 14.3 11.8Poland 10.9 14.0 14.2 11.6 14.9 10.0 5.3 13.0 13.2 14.0Faeroes Isl. 7.6 8.9 8.0 10.1 8.9 9.7 6.8 7.4 7.9 8.5UK 2.8 3.1 2.4 3.6 5.5 6.5 6.7 5.8 4.4 4.1Sweden 2.1 2.7 3.5 3.6 5.3 6.4 5.0 5.0 4.6 4.0Spain 2.7 2.3 3.9 4.9 4.6 4.4 5.9 5.7 4.3 3.4Belgium 1.1 1.2 1.2 1.1 2.0 2.9 2.8 2.9 3.5 3.9Lithuania 0.8 1.8 2.6 1.8 2.5 2.1 0.6 4.0 3.4 2.3France 2.6 2.4 1.9 1.2 1.5 1.7 1.1 1.1 1.4 1.4Greenland 1.1 1.5 1.6 1.6 1.9 1.5 2.1 2.5 2.2 3.4Portugal 1.8 1.5 1.3 1.7 1.8 1.7 1.9 2.0 1.8 2.0Others 3.4 3.4 3.9 4.9 5.1 5.3 4.4 6.1 6.4 4.9Total 190.4 204.6 219.4 204.2 225.2 233.3 247.2 263.2 255.2 235.2
Country 2009 2010 2011
China 44.3 52.8 62.5Iceland 49.6 49.9 51.6Denmark 28.4 29.6 31.0Netherlands 17.4 20.1 21.6Norway 22.9 23.1 20.4Russian Fed 13.1 14.9 20.2Germany 9.4 14.5 15.3Poland 18.9 15.1 14.3Faeroes Isl. 8.0 8.4 9.2UK 4.1 5.6 5.9Sweden 4.5 5.4 5.1Spain 3.9 4.7 4.4Belgium 4.7 4.0 3.4Lithuania 3.2 3.6 3.0France 1.5 2.3 2.5Greenland 3.9 2.3 2.4Portugal 1.7 1.8 1.8Others 6.1 4.6 4.1Total 245.4 262.6 279.0
Source: EUROSTAT – 20130210.
in 1 000 tonnes, 1999-2011
EU-27 imports of cod fillets, by country of origin,
31
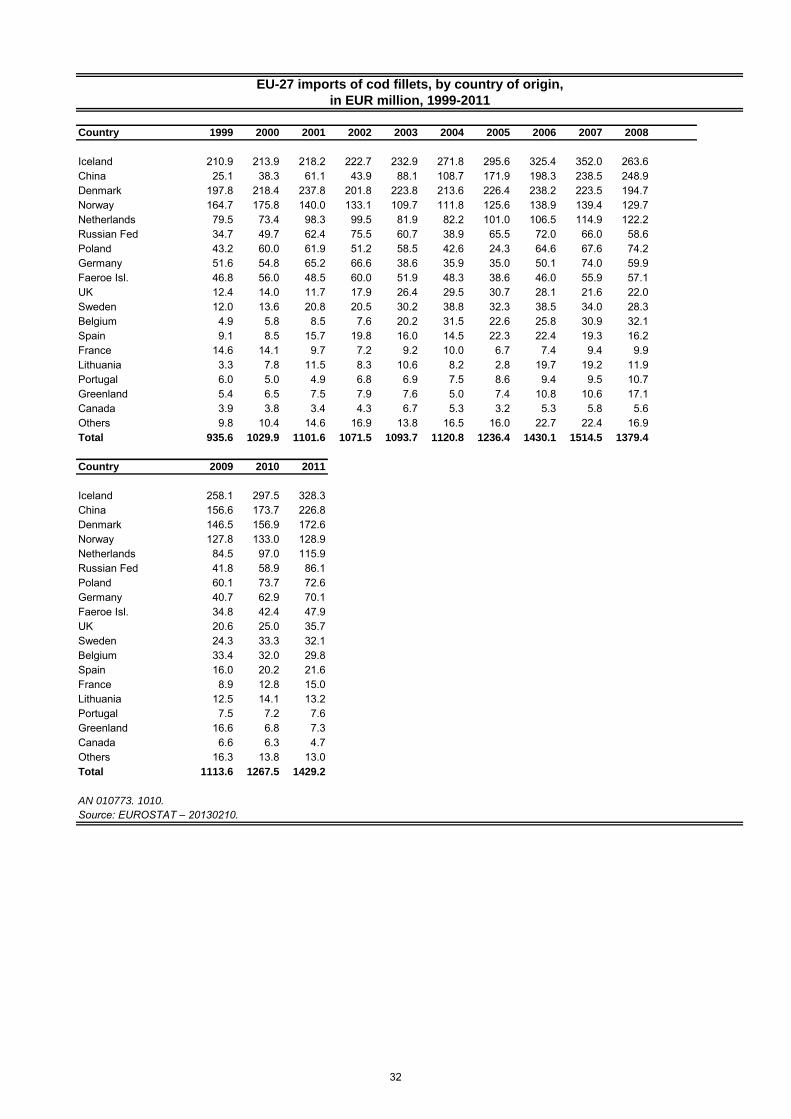
Country 1999 2000 2001 2002 2003 2004 2005 2006 2007 2008
Iceland 210.9 213.9 218.2 222.7 232.9 271.8 295.6 325.4 352.0 263.6China 25.1 38.3 61.1 43.9 88.1 108.7 171.9 198.3 238.5 248.9Denmark 197.8 218.4 237.8 201.8 223.8 213.6 226.4 238.2 223.5 194.7Norway 164.7 175.8 140.0 133.1 109.7 111.8 125.6 138.9 139.4 129.7Netherlands 79.5 73.4 98.3 99.5 81.9 82.2 101.0 106.5 114.9 122.2Russian Fed 34.7 49.7 62.4 75.5 60.7 38.9 65.5 72.0 66.0 58.6Poland 43.2 60.0 61.9 51.2 58.5 42.6 24.3 64.6 67.6 74.2Germany 51.6 54.8 65.2 66.6 38.6 35.9 35.0 50.1 74.0 59.9Faeroe Isl. 46.8 56.0 48.5 60.0 51.9 48.3 38.6 46.0 55.9 57.1UK 12.4 14.0 11.7 17.9 26.4 29.5 30.7 28.1 21.6 22.0Sweden 12.0 13.6 20.8 20.5 30.2 38.8 32.3 38.5 34.0 28.3Belgium 4.9 5.8 8.5 7.6 20.2 31.5 22.6 25.8 30.9 32.1Spain 9.1 8.5 15.7 19.8 16.0 14.5 22.3 22.4 19.3 16.2France 14.6 14.1 9.7 7.2 9.2 10.0 6.7 7.4 9.4 9.9Lithuania 3.3 7.8 11.5 8.3 10.6 8.2 2.8 19.7 19.2 11.9Portugal 6.0 5.0 4.9 6.8 6.9 7.5 8.6 9.4 9.5 10.7Greenland 5.4 6.5 7.5 7.9 7.6 5.0 7.4 10.8 10.6 17.1Canada 3.9 3.8 3.4 4.3 6.7 5.3 3.2 5.3 5.8 5.6Others 9.8 10.4 14.6 16.9 13.8 16.5 16.0 22.7 22.4 16.9Total 935.6 1029.9 1101.6 1071.5 1093.7 1120.8 1236.4 1430.1 1514.5 1379.4
Country 2009 2010 2011
Iceland 258.1 297.5 328.3China 156.6 173.7 226.8Denmark 146.5 156.9 172.6Norway 127.8 133.0 128.9Netherlands 84.5 97.0 115.9Russian Fed 41.8 58.9 86.1Poland 60.1 73.7 72.6Germany 40.7 62.9 70.1Faeroe Isl. 34.8 42.4 47.9UK 20.6 25.0 35.7Sweden 24.3 33.3 32.1Belgium 33.4 32.0 29.8Spain 16.0 20.2 21.6France 8.9 12.8 15.0Lithuania 12.5 14.1 13.2Portugal 7.5 7.2 7.6Greenland 16.6 6.8 7.3Canada 6.6 6.3 4.7Others 16.3 13.8 13.0Total 1113.6 1267.5 1429.2
AN 010773. 1010.
Source: EUROSTAT – 20130210.
EU-27 imports of cod fillets, by country of origin,
in EUR million, 1999-2011
32
Country 1993 1994 1995 1996 1997 1998 1999 2000 2001 2002
Prepared/preserved
Denmark 0.4 0.5 0.4 0.8 0.4 0.3 0.5 0.3 0.4 0.5Germany 0.0 0.0 0.0 0.0 0.1 0.1 0.0 0.0 0.0 0.0Poland 0.0 0.0 0.0 0.0 0.0 0.0 0.0 0.0 0.0 0.0Others 1.2 1.0 0.6 0.1 1.0 0.2 0.6 0.6 2.1 0.9Total 1.6 1.5 1.1 0.9 1.5 0.6 1.1 0.9 2.5 1.4
Fresh or chilled, whole
Iceland 9.2 4.0 1.9 3.0 4.6 5.8 7.2 8.0 9.1 4.7Denmark 1.0 3.0 2.4 4.3 4.4 2.5 2.0 2.2 1.4 1.3Faeroe Isl. 1.8 2.2 5.0 12.9 12.5 3.8 3.1 3.2 4.0 8.9Ireland 0.7 0.8 1.3 1.9 1.3 1.8 1.5 0.8 1.8 2.0Others 3.3 6.7 2.7 2.1 3.2 1.7 0.2 1.1 0.5 0.3Total 16.0 16.7 13.2 24.3 25.9 15.6 13.9 15.3 16.9 17.3
Frozen*, whole
Norway 0.2 0.3 1.1 3.6 4.7 4.8 2.9 2.7 0.9 1.1Russian Fed 12.7 16.9 13.6 19.2 18.7 18.9 17.9 17.3 14.7 15.1Germany 0.0 0.1 0.1 0.8 0.0 0.0 0.0 0.0 0.0 0.4France 0.0 0.0 0.0 0.0 0.0 0.0 0.0 0.0 0.0 0.0Others 6.5 4.8 5.4 5.3 1.7 5.2 0.5 1.6 0.5 0.7Total 19.4 22.0 20.3 28.9 25.1 28.9 21.3 21.6 16.0 17.3
Fillets** (mainly frozen)
Iceland 24.5 20.6 17.5 14.2 12.7 19.9 22.5 21.8 23.2 20.7China 0.1 0.0 0.1 0.0 0.4 0.7 3.0 6.0 11.4 7.2Russian Fed 1.0 3.6 5.4 5.1 3.6 4.2 6.0 8.0 12.1 12.5Denmark 10.0 7.8 4.8 6.2 6.9 5.6 12.8 16.6 17.1 12.6Germany 2.3 2.2 0.4 0.1 0.0 1.0 3.0 5.1 5.8 5.7Norway 20.9 20.6 19.6 22.7 24.9 23.4 17.3 17.7 11.6 11.6Faeroe Isl. 7.7 7.6 8.9 9.2 9.8 7.1 4.6 5.4 4.5 5.3Poland 0.0 0.0 0.2 0.4 0.8 0.4 0.6 0.7 0.4 0.8Greenland 0.9 0.6 0.4 0.0 0.9 0.7 0.8 0.4 1.3 1.3Others 2.5 1.9 1.9 1.2 1.3 1.2 2.8 2.0 2.7 3.4Total 69.9 65.0 59.2 59.0 61.2 64.2 73.4 83.8 90.0 81.0
Gr. Total 107.0 105.2 93.8 113.0 113.7 109.4 109.7 121.5 125.5 117.0
UK imports of cod, by product type and country of origin, in 1 000 tonnes, 1993-2011
33
Country 2003 2004 2005 2006 2007 2008 2009 2010 2011
Prepared/preserved
Denmark 0.9 1.0 0.7 3.2 2.8 2.4 2.8 4.6 2.2Germany 0.0 0.0 3.3 0.7 5.4 6.1 4.5 2.8 1.0Poland 0.0 0.1 0.0 0.0 0.0 0.0 0.0 0.0 0.8Others 1.8 2.0 2.5 2.0 2.6 1.9 0.8 1.5 1.1Total 2.7 3.1 6.4 5.9 10.8 10.4 8.0 9.0 5.2
Fresh or chilled, whole
Iceland 5.7 8.2 8.4 7.8 6.4 6.6 8.2 3.8 3.6Denmark 0.8 0.7 0.7 2.2 1.7 1.0 0.9 2.0 2.1Faeroe Isl. 7.8 6.7 5.7 3.4 1.7 1.7 1.9 3.2 2.1Ireland 1.8 1.0 0.3 0.3 0.5 0.5 0.3 0.2 0.3Others 1.3 0.9 0.8 0.4 0.3 0.4 0.2 0.3 0.2Total 17.3 17.4 15.9 14.1 10.7 10.2 11.6 9.5 8.3
Frozen*, whole
Norway 1.0 0.7 0.2 0.8 1.6 1.4 1.7 1.8 2.8Russian Fed 14.9 11.2 12.2 6.3 2.0 1.7 1.4 1.5 1.6Germany 1.5 0.7 0.0 0.2 0.1 0.0 0.0 0.5 1.3France 0.0 0.0 0.0 0.0 0.1 0.2 0.2 0.0 0.7Others 0.9 0.6 1.0 2.1 0.8 0.9 0.7 0.5 0.5Total 18.3 13.3 13.4 9.4 4.7 4.2 4.1 4.3 6.9
Fillets** (mainly frozen)
Iceland 21.0 24.2 21.4 21.2 22.4 17.7 22.8 22.0 23.4China 16.3 15.2 16.7 24.2 21.2 20.3 14.7 14.4 17.1Russian Fed 11.4 6.2 8.5 7.1 4.6 6.0 8.8 8.0 7.7Denmark 17.8 17.7 17.8 17.9 13.1 10.3 7.8 6.7 7.6Germany 1.6 1.7 1.0 1.6 4.4 4.0 1.1 5.7 7.5Norway 8.4 8.7 9.3 7.8 6.0 4.7 6.5 7.2 6.8Faeroe Isl. 4.4 7.0 4.7 5.5 6.1 6.2 5.8 5.9 6.4Poland 3.0 1.7 1.0 7.1 4.2 4.5 9.9 2.6 2.4Greenland 0.8 0.7 1.1 1.7 1.2 1.1 1.1 1.9 2.0Others 3.1 3.3 3.9 8.4 6.5 7.5 5.3 4.6 3.4Total 87.9 86.4 85.6 102.4 89.7 82.3 83.8 79.1 84.3
Gr. Total 126.2 120.1 121.3 131.9 115.7 107.1 107.5 101.8 104.6
* includes minor quantities of salted/in brine** includes minor quantities of non-fillet preparations
Source: EUROSTAT - 20130208.
UK imports of cod, by product type and country of origin, in 1 000 tonnes, 1993-2011 (cont.)
34
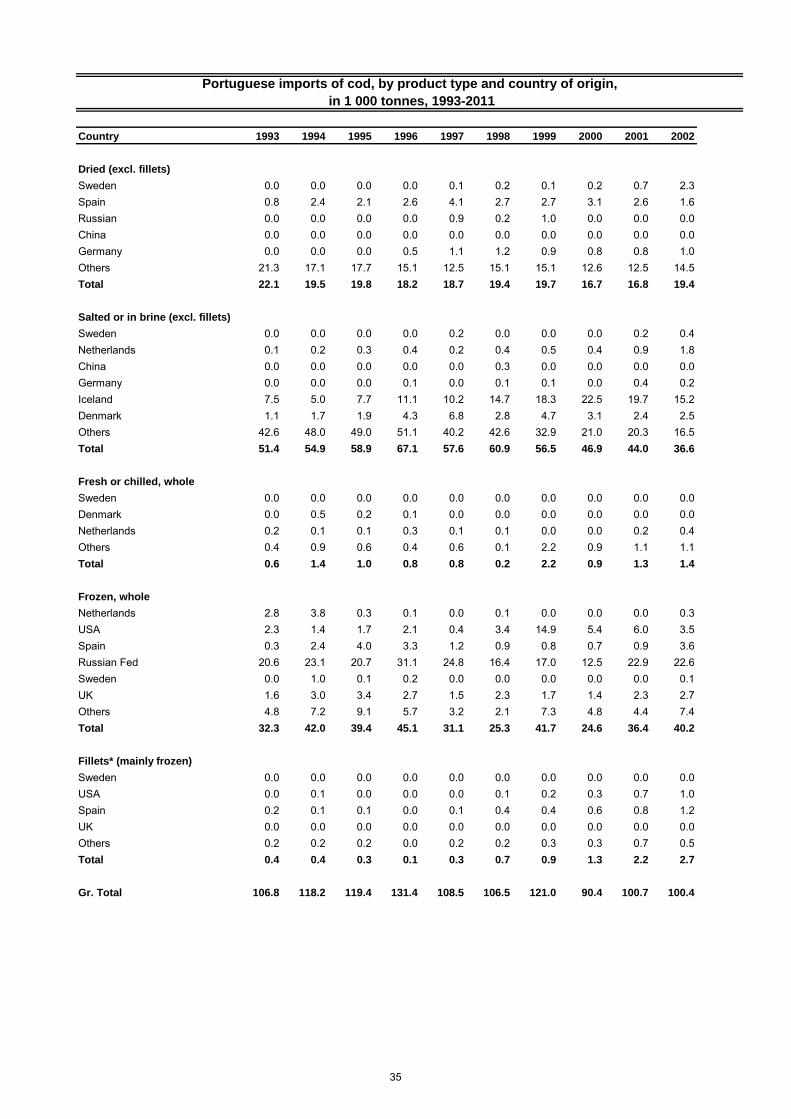
Country 1993 1994 1995 1996 1997 1998 1999 2000 2001 2002
Dried (excl. fillets)
Sweden 0.0 0.0 0.0 0.0 0.1 0.2 0.1 0.2 0.7 2.3Spain 0.8 2.4 2.1 2.6 4.1 2.7 2.7 3.1 2.6 1.6Russian 0.0 0.0 0.0 0.0 0.9 0.2 1.0 0.0 0.0 0.0China 0.0 0.0 0.0 0.0 0.0 0.0 0.0 0.0 0.0 0.0Germany 0.0 0.0 0.0 0.5 1.1 1.2 0.9 0.8 0.8 1.0Others 21.3 17.1 17.7 15.1 12.5 15.1 15.1 12.6 12.5 14.5Total 22.1 19.5 19.8 18.2 18.7 19.4 19.7 16.7 16.8 19.4
Salted or in brine (excl. fillets)
Sweden 0.0 0.0 0.0 0.0 0.2 0.0 0.0 0.0 0.2 0.4Netherlands 0.1 0.2 0.3 0.4 0.2 0.4 0.5 0.4 0.9 1.8China 0.0 0.0 0.0 0.0 0.0 0.3 0.0 0.0 0.0 0.0Germany 0.0 0.0 0.0 0.1 0.0 0.1 0.1 0.0 0.4 0.2Iceland 7.5 5.0 7.7 11.1 10.2 14.7 18.3 22.5 19.7 15.2Denmark 1.1 1.7 1.9 4.3 6.8 2.8 4.7 3.1 2.4 2.5Others 42.6 48.0 49.0 51.1 40.2 42.6 32.9 21.0 20.3 16.5Total 51.4 54.9 58.9 67.1 57.6 60.9 56.5 46.9 44.0 36.6
Fresh or chilled, whole
Sweden 0.0 0.0 0.0 0.0 0.0 0.0 0.0 0.0 0.0 0.0Denmark 0.0 0.5 0.2 0.1 0.0 0.0 0.0 0.0 0.0 0.0Netherlands 0.2 0.1 0.1 0.3 0.1 0.1 0.0 0.0 0.2 0.4Others 0.4 0.9 0.6 0.4 0.6 0.1 2.2 0.9 1.1 1.1Total 0.6 1.4 1.0 0.8 0.8 0.2 2.2 0.9 1.3 1.4
Frozen, whole
Netherlands 2.8 3.8 0.3 0.1 0.0 0.1 0.0 0.0 0.0 0.3USA 2.3 1.4 1.7 2.1 0.4 3.4 14.9 5.4 6.0 3.5Spain 0.3 2.4 4.0 3.3 1.2 0.9 0.8 0.7 0.9 3.6Russian Fed 20.6 23.1 20.7 31.1 24.8 16.4 17.0 12.5 22.9 22.6Sweden 0.0 1.0 0.1 0.2 0.0 0.0 0.0 0.0 0.0 0.1UK 1.6 3.0 3.4 2.7 1.5 2.3 1.7 1.4 2.3 2.7Others 4.8 7.2 9.1 5.7 3.2 2.1 7.3 4.8 4.4 7.4Total 32.3 42.0 39.4 45.1 31.1 25.3 41.7 24.6 36.4 40.2
Fillets* (mainly frozen)
Sweden 0.0 0.0 0.0 0.0 0.0 0.0 0.0 0.0 0.0 0.0USA 0.0 0.1 0.0 0.0 0.0 0.1 0.2 0.3 0.7 1.0Spain 0.2 0.1 0.1 0.0 0.1 0.4 0.4 0.6 0.8 1.2UK 0.0 0.0 0.0 0.0 0.0 0.0 0.0 0.0 0.0 0.0Others 0.2 0.2 0.2 0.0 0.2 0.2 0.3 0.3 0.7 0.5Total 0.4 0.4 0.3 0.1 0.3 0.7 0.9 1.3 2.2 2.7
Gr. Total 106.8 118.2 119.4 131.4 108.5 106.5 121.0 90.4 100.7 100.4
Portuguese imports of cod, by product type and country of origin,
in 1 000 tonnes, 1993-2011
35
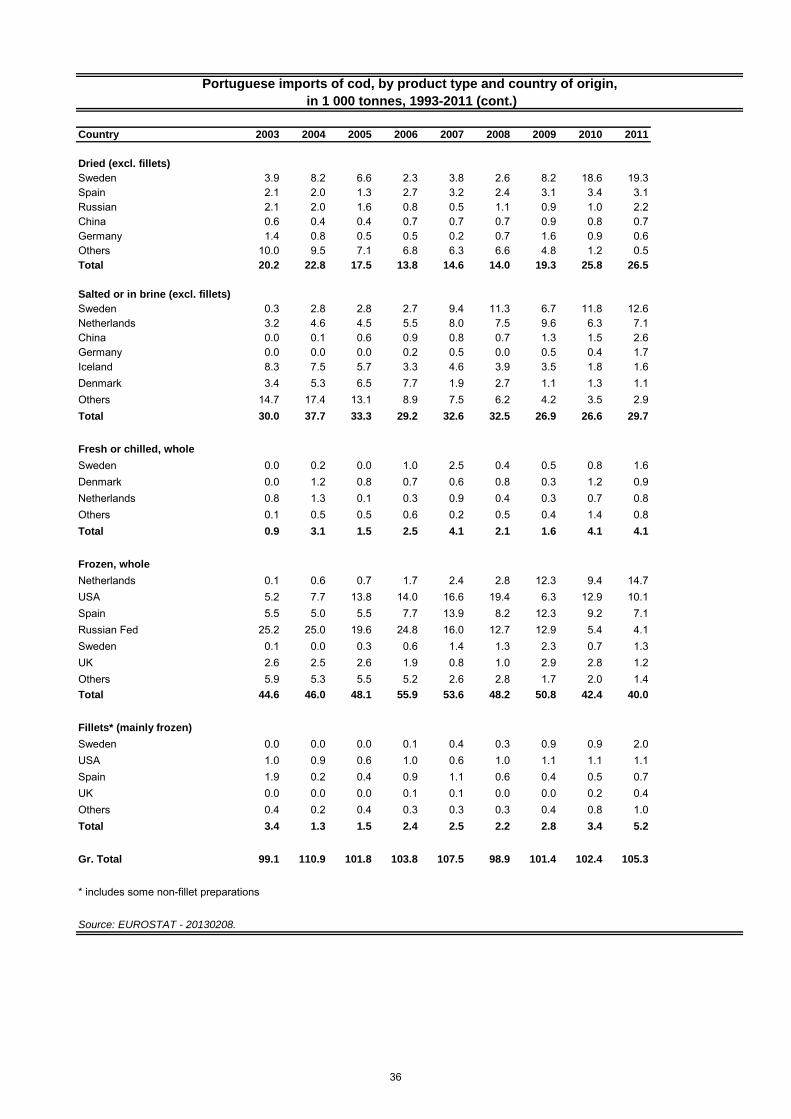
Country 2003 2004 2005 2006 2007 2008 2009 2010 2011
Dried (excl. fillets)
Sweden 3.9 8.2 6.6 2.3 3.8 2.6 8.2 18.6 19.3Spain 2.1 2.0 1.3 2.7 3.2 2.4 3.1 3.4 3.1Russian 2.1 2.0 1.6 0.8 0.5 1.1 0.9 1.0 2.2China 0.6 0.4 0.4 0.7 0.7 0.7 0.9 0.8 0.7Germany 1.4 0.8 0.5 0.5 0.2 0.7 1.6 0.9 0.6Others 10.0 9.5 7.1 6.8 6.3 6.6 4.8 1.2 0.5Total 20.2 22.8 17.5 13.8 14.6 14.0 19.3 25.8 26.5
Salted or in brine (excl. fillets)
Sweden 0.3 2.8 2.8 2.7 9.4 11.3 6.7 11.8 12.6Netherlands 3.2 4.6 4.5 5.5 8.0 7.5 9.6 6.3 7.1China 0.0 0.1 0.6 0.9 0.8 0.7 1.3 1.5 2.6Germany 0.0 0.0 0.0 0.2 0.5 0.0 0.5 0.4 1.7Iceland 8.3 7.5 5.7 3.3 4.6 3.9 3.5 1.8 1.6Denmark 3.4 5.3 6.5 7.7 1.9 2.7 1.1 1.3 1.1Others 14.7 17.4 13.1 8.9 7.5 6.2 4.2 3.5 2.9Total 30.0 37.7 33.3 29.2 32.6 32.5 26.9 26.6 29.7
Fresh or chilled, whole
Sweden 0.0 0.2 0.0 1.0 2.5 0.4 0.5 0.8 1.6Denmark 0.0 1.2 0.8 0.7 0.6 0.8 0.3 1.2 0.9Netherlands 0.8 1.3 0.1 0.3 0.9 0.4 0.3 0.7 0.8Others 0.1 0.5 0.5 0.6 0.2 0.5 0.4 1.4 0.8Total 0.9 3.1 1.5 2.5 4.1 2.1 1.6 4.1 4.1
Frozen, whole
Netherlands 0.1 0.6 0.7 1.7 2.4 2.8 12.3 9.4 14.7USA 5.2 7.7 13.8 14.0 16.6 19.4 6.3 12.9 10.1Spain 5.5 5.0 5.5 7.7 13.9 8.2 12.3 9.2 7.1Russian Fed 25.2 25.0 19.6 24.8 16.0 12.7 12.9 5.4 4.1Sweden 0.1 0.0 0.3 0.6 1.4 1.3 2.3 0.7 1.3UK 2.6 2.5 2.6 1.9 0.8 1.0 2.9 2.8 1.2Others 5.9 5.3 5.5 5.2 2.6 2.8 1.7 2.0 1.4Total 44.6 46.0 48.1 55.9 53.6 48.2 50.8 42.4 40.0
Fillets* (mainly frozen)
Sweden 0.0 0.0 0.0 0.1 0.4 0.3 0.9 0.9 2.0USA 1.0 0.9 0.6 1.0 0.6 1.0 1.1 1.1 1.1Spain 1.9 0.2 0.4 0.9 1.1 0.6 0.4 0.5 0.7UK 0.0 0.0 0.0 0.1 0.1 0.0 0.0 0.2 0.4Others 0.4 0.2 0.4 0.3 0.3 0.3 0.4 0.8 1.0Total 3.4 1.3 1.5 2.4 2.5 2.2 2.8 3.4 5.2
Gr. Total 99.1 110.9 101.8 103.8 107.5 98.9 101.4 102.4 105.3
* includes some non-fillet preparations
Source: EUROSTAT - 20130208.
in 1 000 tonnes, 1993-2011 (cont.)
Portuguese imports of cod, by product type and country of origin,
36
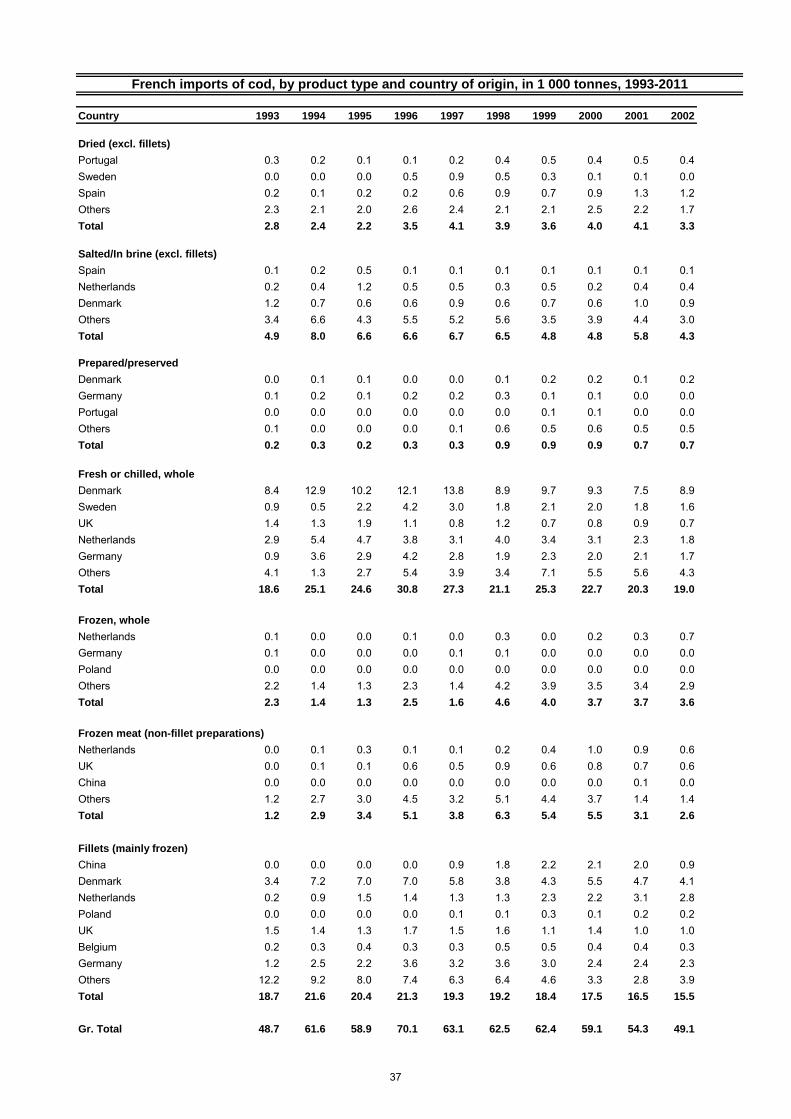
Country 1993 1994 1995 1996 1997 1998 1999 2000 2001 2002
Dried (excl. fillets)
Portugal 0.3 0.2 0.1 0.1 0.2 0.4 0.5 0.4 0.5 0.4Sweden 0.0 0.0 0.0 0.5 0.9 0.5 0.3 0.1 0.1 0.0Spain 0.2 0.1 0.2 0.2 0.6 0.9 0.7 0.9 1.3 1.2Others 2.3 2.1 2.0 2.6 2.4 2.1 2.1 2.5 2.2 1.7Total 2.8 2.4 2.2 3.5 4.1 3.9 3.6 4.0 4.1 3.3
Salted/In brine (excl. fillets)
Spain 0.1 0.2 0.5 0.1 0.1 0.1 0.1 0.1 0.1 0.1Netherlands 0.2 0.4 1.2 0.5 0.5 0.3 0.5 0.2 0.4 0.4Denmark 1.2 0.7 0.6 0.6 0.9 0.6 0.7 0.6 1.0 0.9Others 3.4 6.6 4.3 5.5 5.2 5.6 3.5 3.9 4.4 3.0Total 4.9 8.0 6.6 6.6 6.7 6.5 4.8 4.8 5.8 4.3
Prepared/preserved
Denmark 0.0 0.1 0.1 0.0 0.0 0.1 0.2 0.2 0.1 0.2Germany 0.1 0.2 0.1 0.2 0.2 0.3 0.1 0.1 0.0 0.0Portugal 0.0 0.0 0.0 0.0 0.0 0.0 0.1 0.1 0.0 0.0Others 0.1 0.0 0.0 0.0 0.1 0.6 0.5 0.6 0.5 0.5Total 0.2 0.3 0.2 0.3 0.3 0.9 0.9 0.9 0.7 0.7
Fresh or chilled, whole
Denmark 8.4 12.9 10.2 12.1 13.8 8.9 9.7 9.3 7.5 8.9Sweden 0.9 0.5 2.2 4.2 3.0 1.8 2.1 2.0 1.8 1.6UK 1.4 1.3 1.9 1.1 0.8 1.2 0.7 0.8 0.9 0.7Netherlands 2.9 5.4 4.7 3.8 3.1 4.0 3.4 3.1 2.3 1.8Germany 0.9 3.6 2.9 4.2 2.8 1.9 2.3 2.0 2.1 1.7Others 4.1 1.3 2.7 5.4 3.9 3.4 7.1 5.5 5.6 4.3Total 18.6 25.1 24.6 30.8 27.3 21.1 25.3 22.7 20.3 19.0
Frozen, whole
Netherlands 0.1 0.0 0.0 0.1 0.0 0.3 0.0 0.2 0.3 0.7Germany 0.1 0.0 0.0 0.0 0.1 0.1 0.0 0.0 0.0 0.0Poland 0.0 0.0 0.0 0.0 0.0 0.0 0.0 0.0 0.0 0.0Others 2.2 1.4 1.3 2.3 1.4 4.2 3.9 3.5 3.4 2.9Total 2.3 1.4 1.3 2.5 1.6 4.6 4.0 3.7 3.7 3.6
Frozen meat (non-fillet preparations)
Netherlands 0.0 0.1 0.3 0.1 0.1 0.2 0.4 1.0 0.9 0.6UK 0.0 0.1 0.1 0.6 0.5 0.9 0.6 0.8 0.7 0.6China 0.0 0.0 0.0 0.0 0.0 0.0 0.0 0.0 0.1 0.0Others 1.2 2.7 3.0 4.5 3.2 5.1 4.4 3.7 1.4 1.4Total 1.2 2.9 3.4 5.1 3.8 6.3 5.4 5.5 3.1 2.6
Fillets (mainly frozen)
China 0.0 0.0 0.0 0.0 0.9 1.8 2.2 2.1 2.0 0.9Denmark 3.4 7.2 7.0 7.0 5.8 3.8 4.3 5.5 4.7 4.1Netherlands 0.2 0.9 1.5 1.4 1.3 1.3 2.3 2.2 3.1 2.8Poland 0.0 0.0 0.0 0.0 0.1 0.1 0.3 0.1 0.2 0.2UK 1.5 1.4 1.3 1.7 1.5 1.6 1.1 1.4 1.0 1.0Belgium 0.2 0.3 0.4 0.3 0.3 0.5 0.5 0.4 0.4 0.3Germany 1.2 2.5 2.2 3.6 3.2 3.6 3.0 2.4 2.4 2.3Others 12.2 9.2 8.0 7.4 6.3 6.4 4.6 3.3 2.8 3.9Total 18.7 21.6 20.4 21.3 19.3 19.2 18.4 17.5 16.5 15.5
Gr. Total 48.7 61.6 58.9 70.1 63.1 62.5 62.4 59.1 54.3 49.1
French imports of cod, by product type and country of origin, in 1 000 tonnes, 1993-2011
37
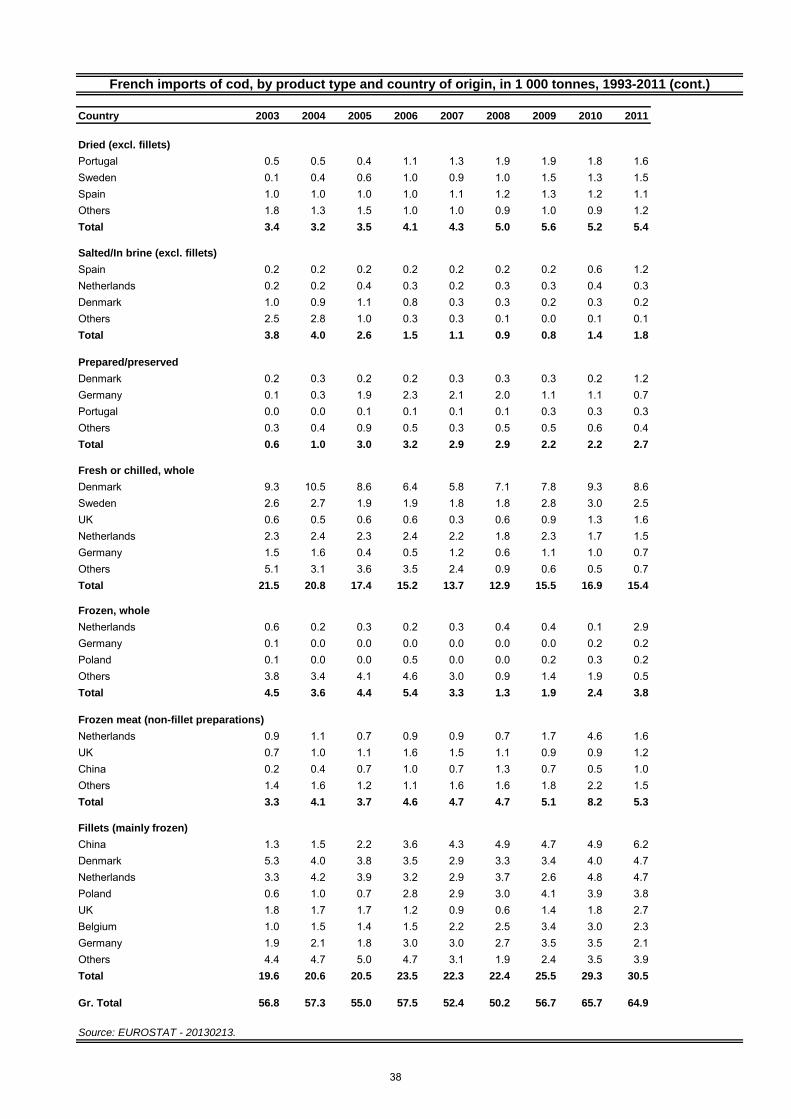
Country 2003 2004 2005 2006 2007 2008 2009 2010 2011
Dried (excl. fillets)
Portugal 0.5 0.5 0.4 1.1 1.3 1.9 1.9 1.8 1.6Sweden 0.1 0.4 0.6 1.0 0.9 1.0 1.5 1.3 1.5Spain 1.0 1.0 1.0 1.0 1.1 1.2 1.3 1.2 1.1Others 1.8 1.3 1.5 1.0 1.0 0.9 1.0 0.9 1.2Total 3.4 3.2 3.5 4.1 4.3 5.0 5.6 5.2 5.4
Salted/In brine (excl. fillets)
Spain 0.2 0.2 0.2 0.2 0.2 0.2 0.2 0.6 1.2Netherlands 0.2 0.2 0.4 0.3 0.2 0.3 0.3 0.4 0.3Denmark 1.0 0.9 1.1 0.8 0.3 0.3 0.2 0.3 0.2Others 2.5 2.8 1.0 0.3 0.3 0.1 0.0 0.1 0.1Total 3.8 4.0 2.6 1.5 1.1 0.9 0.8 1.4 1.8
Prepared/preserved
Denmark 0.2 0.3 0.2 0.2 0.3 0.3 0.3 0.2 1.2Germany 0.1 0.3 1.9 2.3 2.1 2.0 1.1 1.1 0.7Portugal 0.0 0.0 0.1 0.1 0.1 0.1 0.3 0.3 0.3Others 0.3 0.4 0.9 0.5 0.3 0.5 0.5 0.6 0.4Total 0.6 1.0 3.0 3.2 2.9 2.9 2.2 2.2 2.7
Fresh or chilled, whole
Denmark 9.3 10.5 8.6 6.4 5.8 7.1 7.8 9.3 8.6Sweden 2.6 2.7 1.9 1.9 1.8 1.8 2.8 3.0 2.5UK 0.6 0.5 0.6 0.6 0.3 0.6 0.9 1.3 1.6Netherlands 2.3 2.4 2.3 2.4 2.2 1.8 2.3 1.7 1.5Germany 1.5 1.6 0.4 0.5 1.2 0.6 1.1 1.0 0.7Others 5.1 3.1 3.6 3.5 2.4 0.9 0.6 0.5 0.7Total 21.5 20.8 17.4 15.2 13.7 12.9 15.5 16.9 15.4
Frozen, whole
Netherlands 0.6 0.2 0.3 0.2 0.3 0.4 0.4 0.1 2.9Germany 0.1 0.0 0.0 0.0 0.0 0.0 0.0 0.2 0.2Poland 0.1 0.0 0.0 0.5 0.0 0.0 0.2 0.3 0.2Others 3.8 3.4 4.1 4.6 3.0 0.9 1.4 1.9 0.5Total 4.5 3.6 4.4 5.4 3.3 1.3 1.9 2.4 3.8
Frozen meat (non-fillet preparations)
Netherlands 0.9 1.1 0.7 0.9 0.9 0.7 1.7 4.6 1.6UK 0.7 1.0 1.1 1.6 1.5 1.1 0.9 0.9 1.2China 0.2 0.4 0.7 1.0 0.7 1.3 0.7 0.5 1.0Others 1.4 1.6 1.2 1.1 1.6 1.6 1.8 2.2 1.5Total 3.3 4.1 3.7 4.6 4.7 4.7 5.1 8.2 5.3
Fillets (mainly frozen)
China 1.3 1.5 2.2 3.6 4.3 4.9 4.7 4.9 6.2Denmark 5.3 4.0 3.8 3.5 2.9 3.3 3.4 4.0 4.7Netherlands 3.3 4.2 3.9 3.2 2.9 3.7 2.6 4.8 4.7Poland 0.6 1.0 0.7 2.8 2.9 3.0 4.1 3.9 3.8UK 1.8 1.7 1.7 1.2 0.9 0.6 1.4 1.8 2.7Belgium 1.0 1.5 1.4 1.5 2.2 2.5 3.4 3.0 2.3Germany 1.9 2.1 1.8 3.0 3.0 2.7 3.5 3.5 2.1Others 4.4 4.7 5.0 4.7 3.1 1.9 2.4 3.5 3.9Total 19.6 20.6 20.5 23.5 22.3 22.4 25.5 29.3 30.5
Gr. Total 56.8 57.3 55.0 57.5 52.4 50.2 56.7 65.7 64.9
French imports of cod, by product type and country of origin, in 1 000 tonnes, 1993-2011 (cont.)
Source: EUROSTAT - 20130213.
38
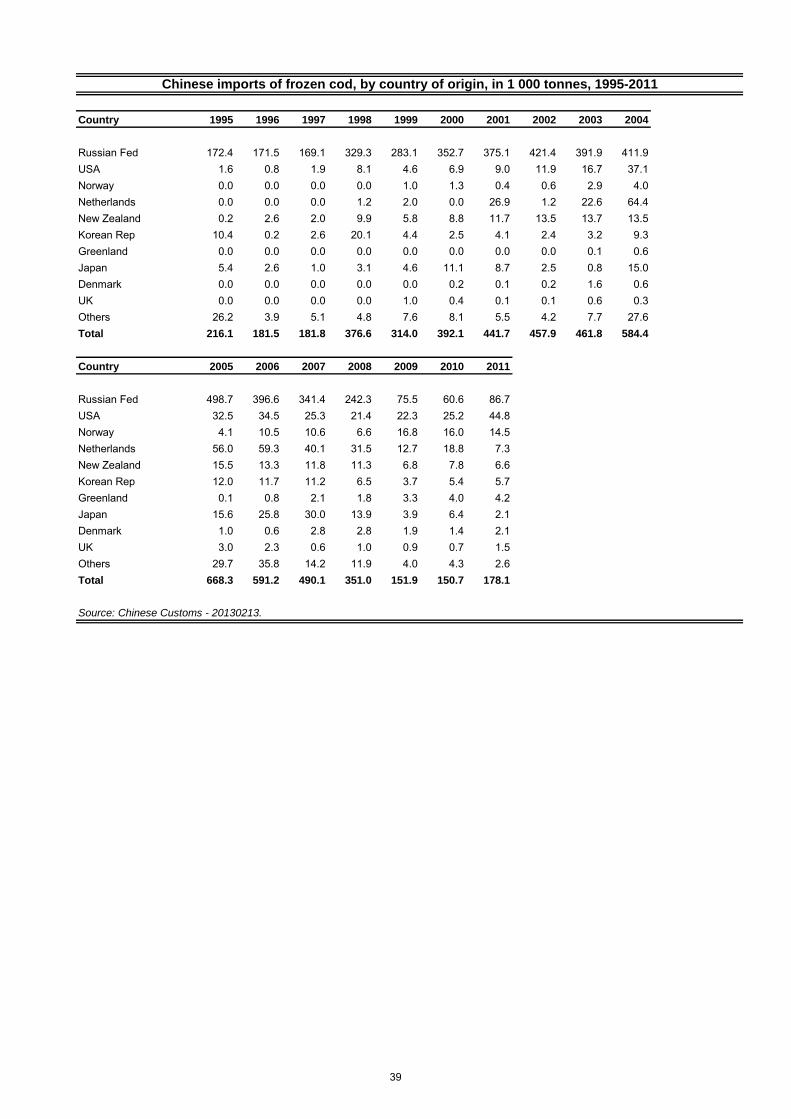
Country 1995 1996 1997 1998 1999 2000 2001 2002 2003 2004
Russian Fed 172.4 171.5 169.1 329.3 283.1 352.7 375.1 421.4 391.9 411.9USA 1.6 0.8 1.9 8.1 4.6 6.9 9.0 11.9 16.7 37.1Norway 0.0 0.0 0.0 0.0 1.0 1.3 0.4 0.6 2.9 4.0Netherlands 0.0 0.0 0.0 1.2 2.0 0.0 26.9 1.2 22.6 64.4New Zealand 0.2 2.6 2.0 9.9 5.8 8.8 11.7 13.5 13.7 13.5Korean Rep 10.4 0.2 2.6 20.1 4.4 2.5 4.1 2.4 3.2 9.3Greenland 0.0 0.0 0.0 0.0 0.0 0.0 0.0 0.0 0.1 0.6Japan 5.4 2.6 1.0 3.1 4.6 11.1 8.7 2.5 0.8 15.0Denmark 0.0 0.0 0.0 0.0 0.0 0.2 0.1 0.2 1.6 0.6UK 0.0 0.0 0.0 0.0 1.0 0.4 0.1 0.1 0.6 0.3Others 26.2 3.9 5.1 4.8 7.6 8.1 5.5 4.2 7.7 27.6Total 216.1 181.5 181.8 376.6 314.0 392.1 441.7 457.9 461.8 584.4
Country 2005 2006 2007 2008 2009 2010 2011
Russian Fed 498.7 396.6 341.4 242.3 75.5 60.6 86.7USA 32.5 34.5 25.3 21.4 22.3 25.2 44.8Norway 4.1 10.5 10.6 6.6 16.8 16.0 14.5Netherlands 56.0 59.3 40.1 31.5 12.7 18.8 7.3New Zealand 15.5 13.3 11.8 11.3 6.8 7.8 6.6Korean Rep 12.0 11.7 11.2 6.5 3.7 5.4 5.7Greenland 0.1 0.8 2.1 1.8 3.3 4.0 4.2Japan 15.6 25.8 30.0 13.9 3.9 6.4 2.1Denmark 1.0 0.6 2.8 2.8 1.9 1.4 2.1UK 3.0 2.3 0.6 1.0 0.9 0.7 1.5Others 29.7 35.8 14.2 11.9 4.0 4.3 2.6Total 668.3 591.2 490.1 351.0 151.9 150.7 178.1
Source: Chinese Customs - 20130213.
Chinese imports of frozen cod, by country of origin, in 1 000 tonnes, 1995-2011
39
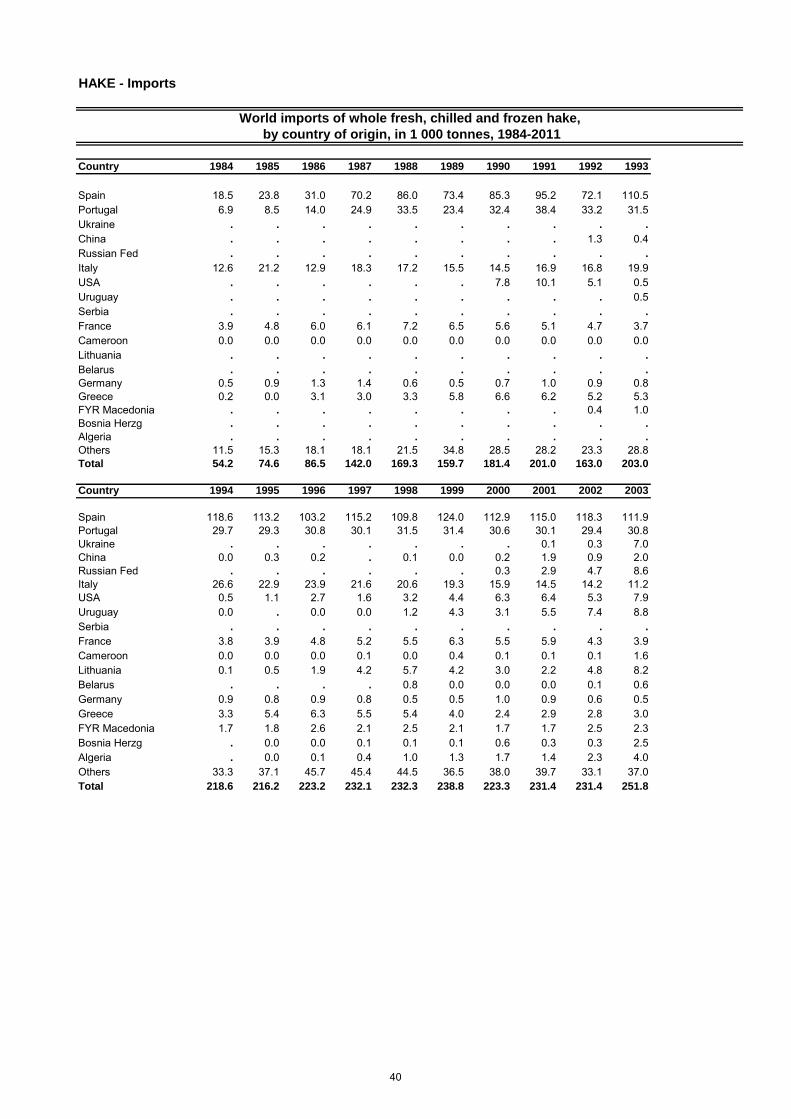
HAKE - Imports
Country 1984 1985 1986 1987 1988 1989 1990 1991 1992 1993
Spain 18.5 23.8 31.0 70.2 86.0 73.4 85.3 95.2 72.1 110.5Portugal 6.9 8.5 14.0 24.9 33.5 23.4 32.4 38.4 33.2 31.5Ukraine . . . . . . . . . .
China . . . . . . . . 1.3 0.4Russian Fed . . . . . . . . . .
Italy 12.6 21.2 12.9 18.3 17.2 15.5 14.5 16.9 16.8 19.9USA . . . . . . 7.8 10.1 5.1 0.5Uruguay . . . . . . . . . 0.5Serbia . . . . . . . . . .
France 3.9 4.8 6.0 6.1 7.2 6.5 5.6 5.1 4.7 3.7Cameroon 0.0 0.0 0.0 0.0 0.0 0.0 0.0 0.0 0.0 0.0Lithuania . . . . . . . . . .
Belarus . . . . . . . . . .
Germany 0.5 0.9 1.3 1.4 0.6 0.5 0.7 1.0 0.9 0.8Greece 0.2 0.0 3.1 3.0 3.3 5.8 6.6 6.2 5.2 5.3FYR Macedonia . . . . . . . . 0.4 1.0Bosnia Herzg . . . . . . . . . .
Algeria . . . . . . . . . .
Others 11.5 15.3 18.1 18.1 21.5 34.8 28.5 28.2 23.3 28.8Total 54.2 74.6 86.5 142.0 169.3 159.7 181.4 201.0 163.0 203.0
Country 1994 1995 1996 1997 1998 1999 2000 2001 2002 2003
Spain 118.6 113.2 103.2 115.2 109.8 124.0 112.9 115.0 118.3 111.9Portugal 29.7 29.3 30.8 30.1 31.5 31.4 30.6 30.1 29.4 30.8Ukraine . . . . . . . 0.1 0.3 7.0China 0.0 0.3 0.2 . 0.1 0.0 0.2 1.9 0.9 2.0Russian Fed . . . . . . 0.3 2.9 4.7 8.6Italy 26.6 22.9 23.9 21.6 20.6 19.3 15.9 14.5 14.2 11.2USA 0.5 1.1 2.7 1.6 3.2 4.4 6.3 6.4 5.3 7.9Uruguay 0.0 . 0.0 0.0 1.2 4.3 3.1 5.5 7.4 8.8Serbia . . . . . . . . . .
France 3.8 3.9 4.8 5.2 5.5 6.3 5.5 5.9 4.3 3.9Cameroon 0.0 0.0 0.0 0.1 0.0 0.4 0.1 0.1 0.1 1.6Lithuania 0.1 0.5 1.9 4.2 5.7 4.2 3.0 2.2 4.8 8.2Belarus . . . . 0.8 0.0 0.0 0.0 0.1 0.6Germany 0.9 0.8 0.9 0.8 0.5 0.5 1.0 0.9 0.6 0.5Greece 3.3 5.4 6.3 5.5 5.4 4.0 2.4 2.9 2.8 3.0FYR Macedonia 1.7 1.8 2.6 2.1 2.5 2.1 1.7 1.7 2.5 2.3Bosnia Herzg . 0.0 0.0 0.1 0.1 0.1 0.6 0.3 0.3 2.5Algeria . 0.0 0.1 0.4 1.0 1.3 1.7 1.4 2.3 4.0Others 33.3 37.1 45.7 45.4 44.5 36.5 38.0 39.7 33.1 37.0Total 218.6 216.2 223.2 232.1 232.3 238.8 223.3 231.4 231.4 251.8
World imports of whole fresh, chilled and frozen hake,
by country of origin, in 1 000 tonnes, 1984-2011
40
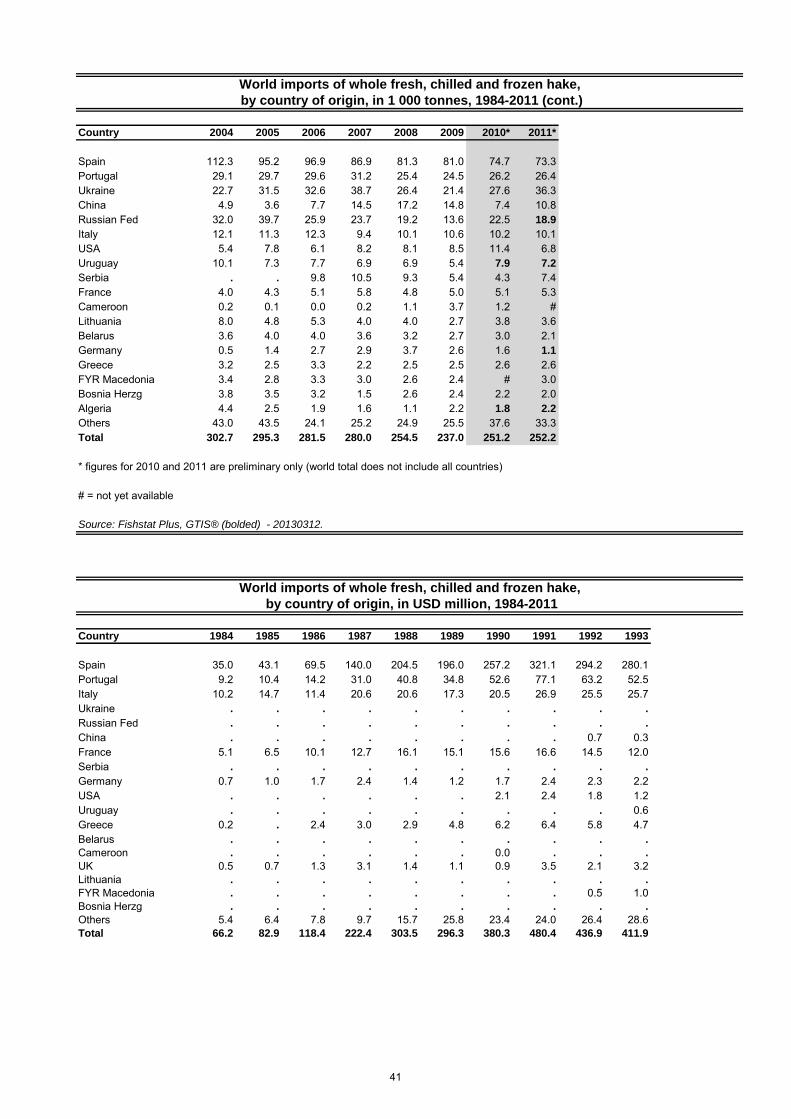
Country 2004 2005 2006 2007 2008 2009 2010* 2011*
Spain 112.3 95.2 96.9 86.9 81.3 81.0 74.7 73.3Portugal 29.1 29.7 29.6 31.2 25.4 24.5 26.2 26.4Ukraine 22.7 31.5 32.6 38.7 26.4 21.4 27.6 36.3China 4.9 3.6 7.7 14.5 17.2 14.8 7.4 10.8Russian Fed 32.0 39.7 25.9 23.7 19.2 13.6 22.5 18.9
Italy 12.1 11.3 12.3 9.4 10.1 10.6 10.2 10.1USA 5.4 7.8 6.1 8.2 8.1 8.5 11.4 6.8Uruguay 10.1 7.3 7.7 6.9 6.9 5.4 7.9 7.2
Serbia . . 9.8 10.5 9.3 5.4 4.3 7.4France 4.0 4.3 5.1 5.8 4.8 5.0 5.1 5.3Cameroon 0.2 0.1 0.0 0.2 1.1 3.7 1.2 #Lithuania 8.0 4.8 5.3 4.0 4.0 2.7 3.8 3.6Belarus 3.6 4.0 4.0 3.6 3.2 2.7 3.0 2.1Germany 0.5 1.4 2.7 2.9 3.7 2.6 1.6 1.1
Greece 3.2 2.5 3.3 2.2 2.5 2.5 2.6 2.6FYR Macedonia 3.4 2.8 3.3 3.0 2.6 2.4 # 3.0Bosnia Herzg 3.8 3.5 3.2 1.5 2.6 2.4 2.2 2.0Algeria 4.4 2.5 1.9 1.6 1.1 2.2 1.8 2.2
Others 43.0 43.5 24.1 25.2 24.9 25.5 37.6 33.3Total 302.7 295.3 281.5 280.0 254.5 237.0 251.2 252.2
* figures for 2010 and 2011 are preliminary only (world total does not include all countries)
# = not yet available
Source: Fishstat Plus, GTIS® (bolded) - 20130312.
Country 1984 1985 1986 1987 1988 1989 1990 1991 1992 1993
Spain 35.0 43.1 69.5 140.0 204.5 196.0 257.2 321.1 294.2 280.1Portugal 9.2 10.4 14.2 31.0 40.8 34.8 52.6 77.1 63.2 52.5Italy 10.2 14.7 11.4 20.6 20.6 17.3 20.5 26.9 25.5 25.7Ukraine . . . . . . . . . .
Russian Fed . . . . . . . . . .
China . . . . . . . . 0.7 0.3France 5.1 6.5 10.1 12.7 16.1 15.1 15.6 16.6 14.5 12.0Serbia . . . . . . . . . .
Germany 0.7 1.0 1.7 2.4 1.4 1.2 1.7 2.4 2.3 2.2USA . . . . . . 2.1 2.4 1.8 1.2Uruguay . . . . . . . . . 0.6Greece 0.2 . 2.4 3.0 2.9 4.8 6.2 6.4 5.8 4.7Belarus . . . . . . . . . .
Cameroon . . . . . . 0.0 . . .
UK 0.5 0.7 1.3 3.1 1.4 1.1 0.9 3.5 2.1 3.2Lithuania . . . . . . . . . .
FYR Macedonia . . . . . . . . 0.5 1.0Bosnia Herzg . . . . . . . . . .
Others 5.4 6.4 7.8 9.7 15.7 25.8 23.4 24.0 26.4 28.6Total 66.2 82.9 118.4 222.4 303.5 296.3 380.3 480.4 436.9 411.9
World imports of whole fresh, chilled and frozen hake,
by country of origin, in USD million, 1984-2011
World imports of whole fresh, chilled and frozen hake,
by country of origin, in 1 000 tonnes, 1984-2011 (cont.)
41
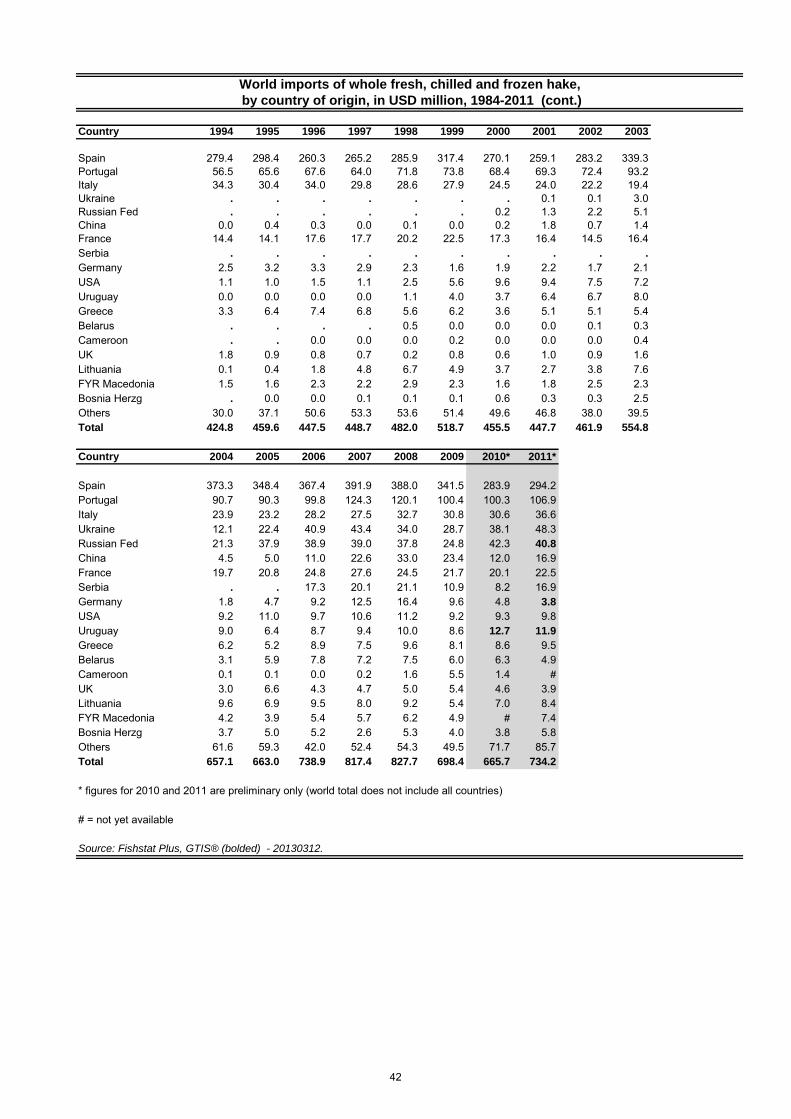
Country 1994 1995 1996 1997 1998 1999 2000 2001 2002 2003
Spain 279.4 298.4 260.3 265.2 285.9 317.4 270.1 259.1 283.2 339.3Portugal 56.5 65.6 67.6 64.0 71.8 73.8 68.4 69.3 72.4 93.2Italy 34.3 30.4 34.0 29.8 28.6 27.9 24.5 24.0 22.2 19.4Ukraine . . . . . . . 0.1 0.1 3.0Russian Fed . . . . . . 0.2 1.3 2.2 5.1China 0.0 0.4 0.3 0.0 0.1 0.0 0.2 1.8 0.7 1.4France 14.4 14.1 17.6 17.7 20.2 22.5 17.3 16.4 14.5 16.4Serbia . . . . . . . . . .
Germany 2.5 3.2 3.3 2.9 2.3 1.6 1.9 2.2 1.7 2.1USA 1.1 1.0 1.5 1.1 2.5 5.6 9.6 9.4 7.5 7.2Uruguay 0.0 0.0 0.0 0.0 1.1 4.0 3.7 6.4 6.7 8.0Greece 3.3 6.4 7.4 6.8 5.6 6.2 3.6 5.1 5.1 5.4Belarus . . . . 0.5 0.0 0.0 0.0 0.1 0.3Cameroon . . 0.0 0.0 0.0 0.2 0.0 0.0 0.0 0.4UK 1.8 0.9 0.8 0.7 0.2 0.8 0.6 1.0 0.9 1.6Lithuania 0.1 0.4 1.8 4.8 6.7 4.9 3.7 2.7 3.8 7.6FYR Macedonia 1.5 1.6 2.3 2.2 2.9 2.3 1.6 1.8 2.5 2.3Bosnia Herzg . 0.0 0.0 0.1 0.1 0.1 0.6 0.3 0.3 2.5Others 30.0 37.1 50.6 53.3 53.6 51.4 49.6 46.8 38.0 39.5Total 424.8 459.6 447.5 448.7 482.0 518.7 455.5 447.7 461.9 554.8
Country 2004 2005 2006 2007 2008 2009 2010* 2011*
Spain 373.3 348.4 367.4 391.9 388.0 341.5 283.9 294.2Portugal 90.7 90.3 99.8 124.3 120.1 100.4 100.3 106.9Italy 23.9 23.2 28.2 27.5 32.7 30.8 30.6 36.6Ukraine 12.1 22.4 40.9 43.4 34.0 28.7 38.1 48.3Russian Fed 21.3 37.9 38.9 39.0 37.8 24.8 42.3 40.8
China 4.5 5.0 11.0 22.6 33.0 23.4 12.0 16.9France 19.7 20.8 24.8 27.6 24.5 21.7 20.1 22.5Serbia . . 17.3 20.1 21.1 10.9 8.2 16.9Germany 1.8 4.7 9.2 12.5 16.4 9.6 4.8 3.8
USA 9.2 11.0 9.7 10.6 11.2 9.2 9.3 9.8Uruguay 9.0 6.4 8.7 9.4 10.0 8.6 12.7 11.9
Greece 6.2 5.2 8.9 7.5 9.6 8.1 8.6 9.5Belarus 3.1 5.9 7.8 7.2 7.5 6.0 6.3 4.9Cameroon 0.1 0.1 0.0 0.2 1.6 5.5 1.4 #
UK 3.0 6.6 4.3 4.7 5.0 5.4 4.6 3.9Lithuania 9.6 6.9 9.5 8.0 9.2 5.4 7.0 8.4FYR Macedonia 4.2 3.9 5.4 5.7 6.2 4.9 # 7.4Bosnia Herzg 3.7 5.0 5.2 2.6 5.3 4.0 3.8 5.8Others 61.6 59.3 42.0 52.4 54.3 49.5 71.7 85.7Total 657.1 663.0 738.9 817.4 827.7 698.4 665.7 734.2
* figures for 2010 and 2011 are preliminary only (world total does not include all countries)
# = not yet available
Source: Fishstat Plus, GTIS® (bolded) - 20130312.
World imports of whole fresh, chilled and frozen hake,
by country of origin, in USD million, 1984-2011 (cont.)
42
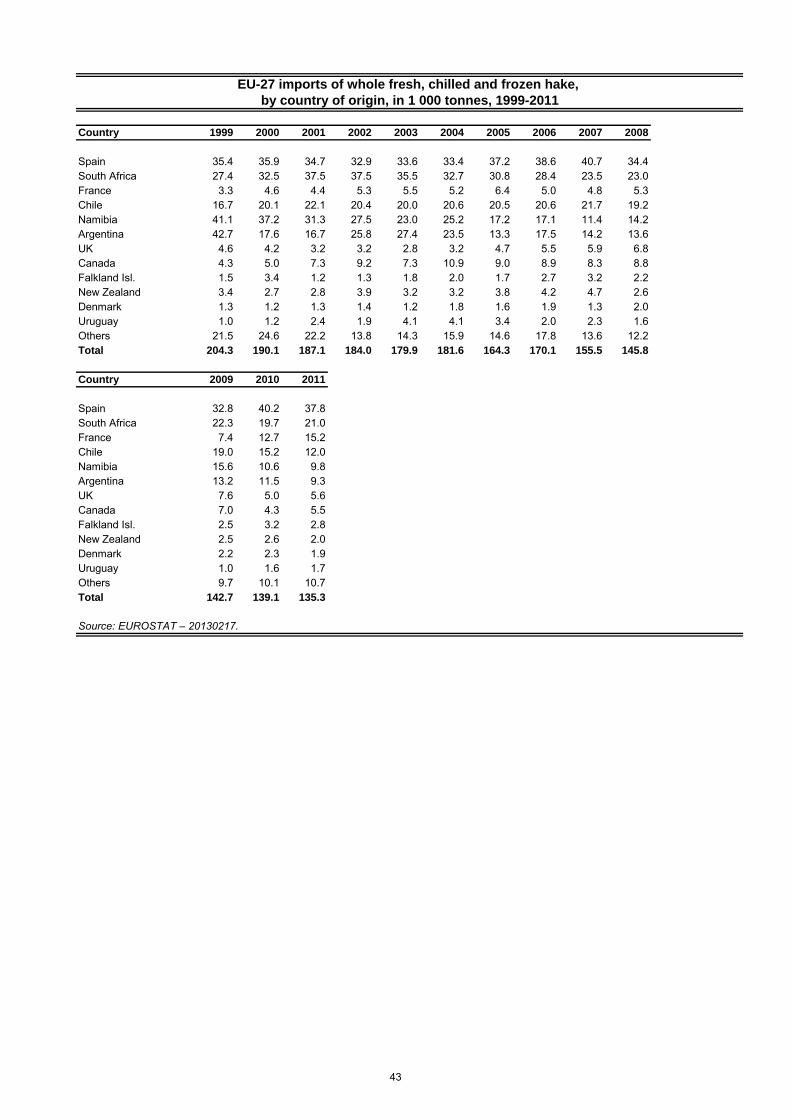
Country 1999 2000 2001 2002 2003 2004 2005 2006 2007 2008
Spain 35.4 35.9 34.7 32.9 33.6 33.4 37.2 38.6 40.7 34.4South Africa 27.4 32.5 37.5 37.5 35.5 32.7 30.8 28.4 23.5 23.0France 3.3 4.6 4.4 5.3 5.5 5.2 6.4 5.0 4.8 5.3Chile 16.7 20.1 22.1 20.4 20.0 20.6 20.5 20.6 21.7 19.2Namibia 41.1 37.2 31.3 27.5 23.0 25.2 17.2 17.1 11.4 14.2Argentina 42.7 17.6 16.7 25.8 27.4 23.5 13.3 17.5 14.2 13.6UK 4.6 4.2 3.2 3.2 2.8 3.2 4.7 5.5 5.9 6.8Canada 4.3 5.0 7.3 9.2 7.3 10.9 9.0 8.9 8.3 8.8Falkland Isl. 1.5 3.4 1.2 1.3 1.8 2.0 1.7 2.7 3.2 2.2New Zealand 3.4 2.7 2.8 3.9 3.2 3.2 3.8 4.2 4.7 2.6Denmark 1.3 1.2 1.3 1.4 1.2 1.8 1.6 1.9 1.3 2.0Uruguay 1.0 1.2 2.4 1.9 4.1 4.1 3.4 2.0 2.3 1.6Others 21.5 24.6 22.2 13.8 14.3 15.9 14.6 17.8 13.6 12.2Total 204.3 190.1 187.1 184.0 179.9 181.6 164.3 170.1 155.5 145.8
Country 2009 2010 2011
Spain 32.8 40.2 37.8South Africa 22.3 19.7 21.0France 7.4 12.7 15.2Chile 19.0 15.2 12.0Namibia 15.6 10.6 9.8Argentina 13.2 11.5 9.3UK 7.6 5.0 5.6Canada 7.0 4.3 5.5Falkland Isl. 2.5 3.2 2.8New Zealand 2.5 2.6 2.0Denmark 2.2 2.3 1.9Uruguay 1.0 1.6 1.7Others 9.7 10.1 10.7Total 142.7 139.1 135.3
Source: EUROSTAT – 20130217.
EU-27 imports of whole fresh, chilled and frozen hake,
by country of origin, in 1 000 tonnes, 1999-2011
43
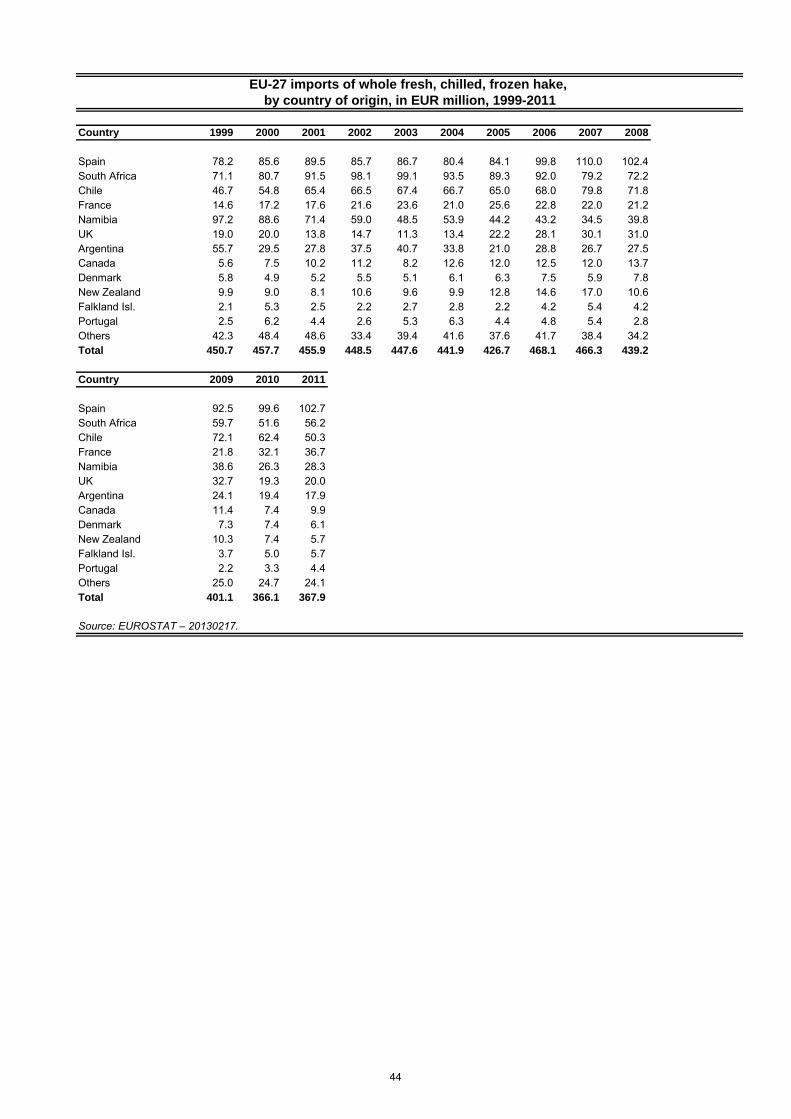
Country 1999 2000 2001 2002 2003 2004 2005 2006 2007 2008
Spain 78.2 85.6 89.5 85.7 86.7 80.4 84.1 99.8 110.0 102.4South Africa 71.1 80.7 91.5 98.1 99.1 93.5 89.3 92.0 79.2 72.2Chile 46.7 54.8 65.4 66.5 67.4 66.7 65.0 68.0 79.8 71.8France 14.6 17.2 17.6 21.6 23.6 21.0 25.6 22.8 22.0 21.2Namibia 97.2 88.6 71.4 59.0 48.5 53.9 44.2 43.2 34.5 39.8UK 19.0 20.0 13.8 14.7 11.3 13.4 22.2 28.1 30.1 31.0Argentina 55.7 29.5 27.8 37.5 40.7 33.8 21.0 28.8 26.7 27.5Canada 5.6 7.5 10.2 11.2 8.2 12.6 12.0 12.5 12.0 13.7Denmark 5.8 4.9 5.2 5.5 5.1 6.1 6.3 7.5 5.9 7.8New Zealand 9.9 9.0 8.1 10.6 9.6 9.9 12.8 14.6 17.0 10.6Falkland Isl. 2.1 5.3 2.5 2.2 2.7 2.8 2.2 4.2 5.4 4.2Portugal 2.5 6.2 4.4 2.6 5.3 6.3 4.4 4.8 5.4 2.8Others 42.3 48.4 48.6 33.4 39.4 41.6 37.6 41.7 38.4 34.2Total 450.7 457.7 455.9 448.5 447.6 441.9 426.7 468.1 466.3 439.2
Country 2009 2010 2011
Spain 92.5 99.6 102.7South Africa 59.7 51.6 56.2Chile 72.1 62.4 50.3France 21.8 32.1 36.7Namibia 38.6 26.3 28.3UK 32.7 19.3 20.0Argentina 24.1 19.4 17.9Canada 11.4 7.4 9.9Denmark 7.3 7.4 6.1New Zealand 10.3 7.4 5.7Falkland Isl. 3.7 5.0 5.7Portugal 2.2 3.3 4.4Others 25.0 24.7 24.1Total 401.1 366.1 367.9
Source: EUROSTAT – 20130217.
by country of origin, in EUR million, 1999-2011
EU-27 imports of whole fresh, chilled, frozen hake,
44
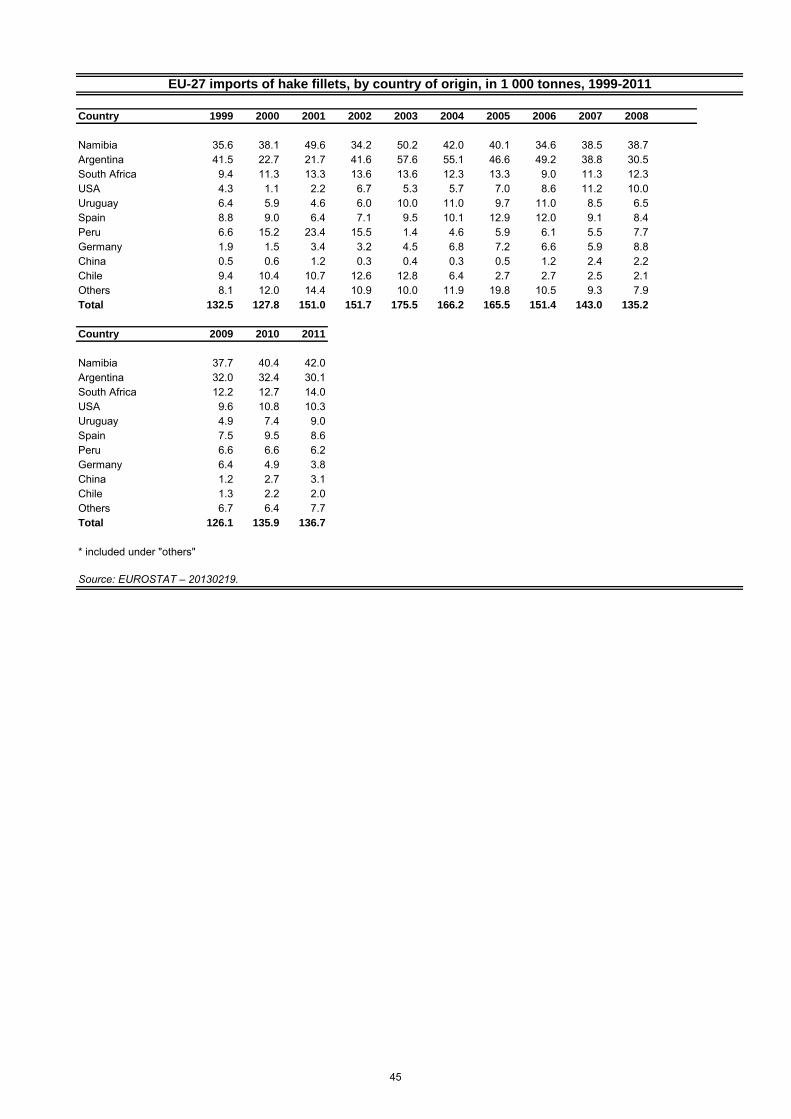
Country 1999 2000 2001 2002 2003 2004 2005 2006 2007 2008
Namibia 35.6 38.1 49.6 34.2 50.2 42.0 40.1 34.6 38.5 38.7Argentina 41.5 22.7 21.7 41.6 57.6 55.1 46.6 49.2 38.8 30.5South Africa 9.4 11.3 13.3 13.6 13.6 12.3 13.3 9.0 11.3 12.3USA 4.3 1.1 2.2 6.7 5.3 5.7 7.0 8.6 11.2 10.0Uruguay 6.4 5.9 4.6 6.0 10.0 11.0 9.7 11.0 8.5 6.5Spain 8.8 9.0 6.4 7.1 9.5 10.1 12.9 12.0 9.1 8.4Peru 6.6 15.2 23.4 15.5 1.4 4.6 5.9 6.1 5.5 7.7Germany 1.9 1.5 3.4 3.2 4.5 6.8 7.2 6.6 5.9 8.8China 0.5 0.6 1.2 0.3 0.4 0.3 0.5 1.2 2.4 2.2Chile 9.4 10.4 10.7 12.6 12.8 6.4 2.7 2.7 2.5 2.1Others 8.1 12.0 14.4 10.9 10.0 11.9 19.8 10.5 9.3 7.9Total 132.5 127.8 151.0 151.7 175.5 166.2 165.5 151.4 143.0 135.2
Country 2009 2010 2011
Namibia 37.7 40.4 42.0Argentina 32.0 32.4 30.1South Africa 12.2 12.7 14.0USA 9.6 10.8 10.3Uruguay 4.9 7.4 9.0Spain 7.5 9.5 8.6Peru 6.6 6.6 6.2Germany 6.4 4.9 3.8China 1.2 2.7 3.1Chile 1.3 2.2 2.0Others 6.7 6.4 7.7Total 126.1 135.9 136.7
* included under "others"
Source: EUROSTAT – 20130219.
EU-27 imports of hake fillets, by country of origin, in 1 000 tonnes, 1999-2011
45
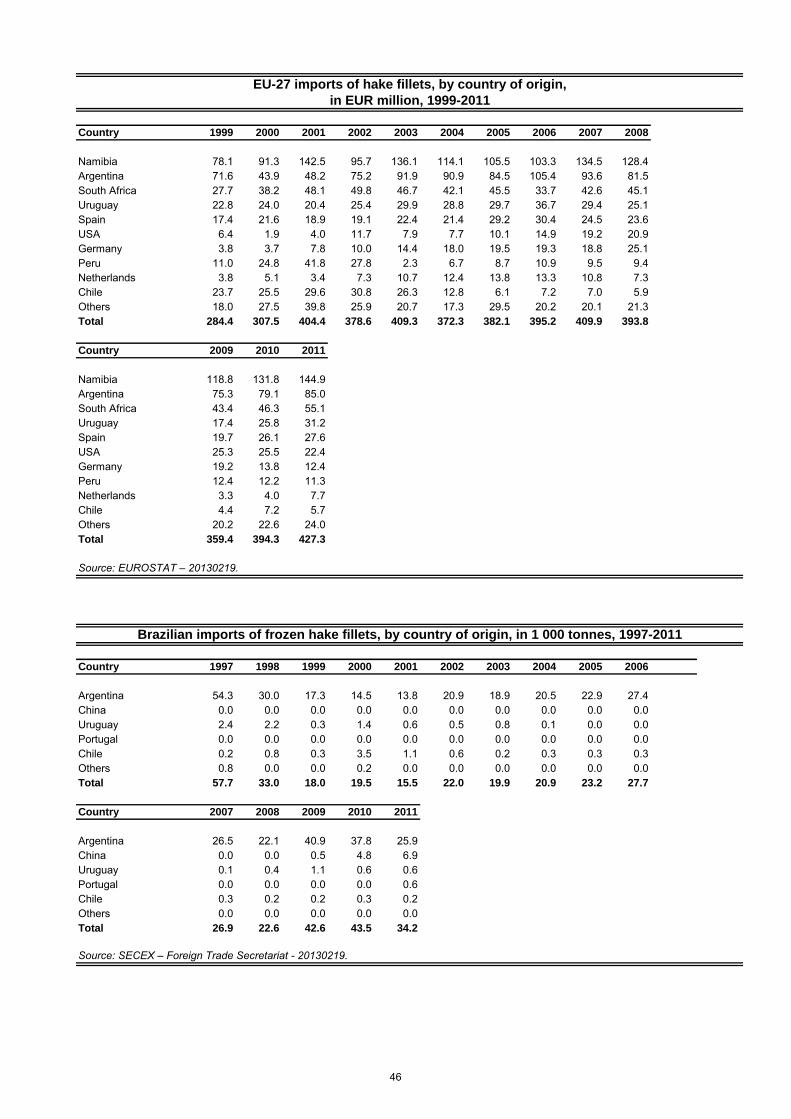
Country 1999 2000 2001 2002 2003 2004 2005 2006 2007 2008
Namibia 78.1 91.3 142.5 95.7 136.1 114.1 105.5 103.3 134.5 128.4Argentina 71.6 43.9 48.2 75.2 91.9 90.9 84.5 105.4 93.6 81.5South Africa 27.7 38.2 48.1 49.8 46.7 42.1 45.5 33.7 42.6 45.1Uruguay 22.8 24.0 20.4 25.4 29.9 28.8 29.7 36.7 29.4 25.1Spain 17.4 21.6 18.9 19.1 22.4 21.4 29.2 30.4 24.5 23.6USA 6.4 1.9 4.0 11.7 7.9 7.7 10.1 14.9 19.2 20.9Germany 3.8 3.7 7.8 10.0 14.4 18.0 19.5 19.3 18.8 25.1Peru 11.0 24.8 41.8 27.8 2.3 6.7 8.7 10.9 9.5 9.4Netherlands 3.8 5.1 3.4 7.3 10.7 12.4 13.8 13.3 10.8 7.3Chile 23.7 25.5 29.6 30.8 26.3 12.8 6.1 7.2 7.0 5.9Others 18.0 27.5 39.8 25.9 20.7 17.3 29.5 20.2 20.1 21.3Total 284.4 307.5 404.4 378.6 409.3 372.3 382.1 395.2 409.9 393.8
Country 2009 2010 2011
Namibia 118.8 131.8 144.9Argentina 75.3 79.1 85.0South Africa 43.4 46.3 55.1Uruguay 17.4 25.8 31.2Spain 19.7 26.1 27.6USA 25.3 25.5 22.4Germany 19.2 13.8 12.4Peru 12.4 12.2 11.3Netherlands 3.3 4.0 7.7Chile 4.4 7.2 5.7Others 20.2 22.6 24.0Total 359.4 394.3 427.3
Source: EUROSTAT – 20130219.
Country 1997 1998 1999 2000 2001 2002 2003 2004 2005 2006
Argentina 54.3 30.0 17.3 14.5 13.8 20.9 18.9 20.5 22.9 27.4China 0.0 0.0 0.0 0.0 0.0 0.0 0.0 0.0 0.0 0.0Uruguay 2.4 2.2 0.3 1.4 0.6 0.5 0.8 0.1 0.0 0.0Portugal 0.0 0.0 0.0 0.0 0.0 0.0 0.0 0.0 0.0 0.0Chile 0.2 0.8 0.3 3.5 1.1 0.6 0.2 0.3 0.3 0.3Others 0.8 0.0 0.0 0.2 0.0 0.0 0.0 0.0 0.0 0.0Total 57.7 33.0 18.0 19.5 15.5 22.0 19.9 20.9 23.2 27.7
Country 2007 2008 2009 2010 2011
Argentina 26.5 22.1 40.9 37.8 25.9China 0.0 0.0 0.5 4.8 6.9Uruguay 0.1 0.4 1.1 0.6 0.6Portugal 0.0 0.0 0.0 0.0 0.6Chile 0.3 0.2 0.2 0.3 0.2Others 0.0 0.0 0.0 0.0 0.0Total 26.9 22.6 42.6 43.5 34.2
Source: SECEX – Foreign Trade Secretariat - 20130219.
Brazilian imports of frozen hake fillets, by country of origin, in 1 000 tonnes, 1997-2011
EU-27 imports of hake fillets, by country of origin,
in EUR million, 1999-2011
46
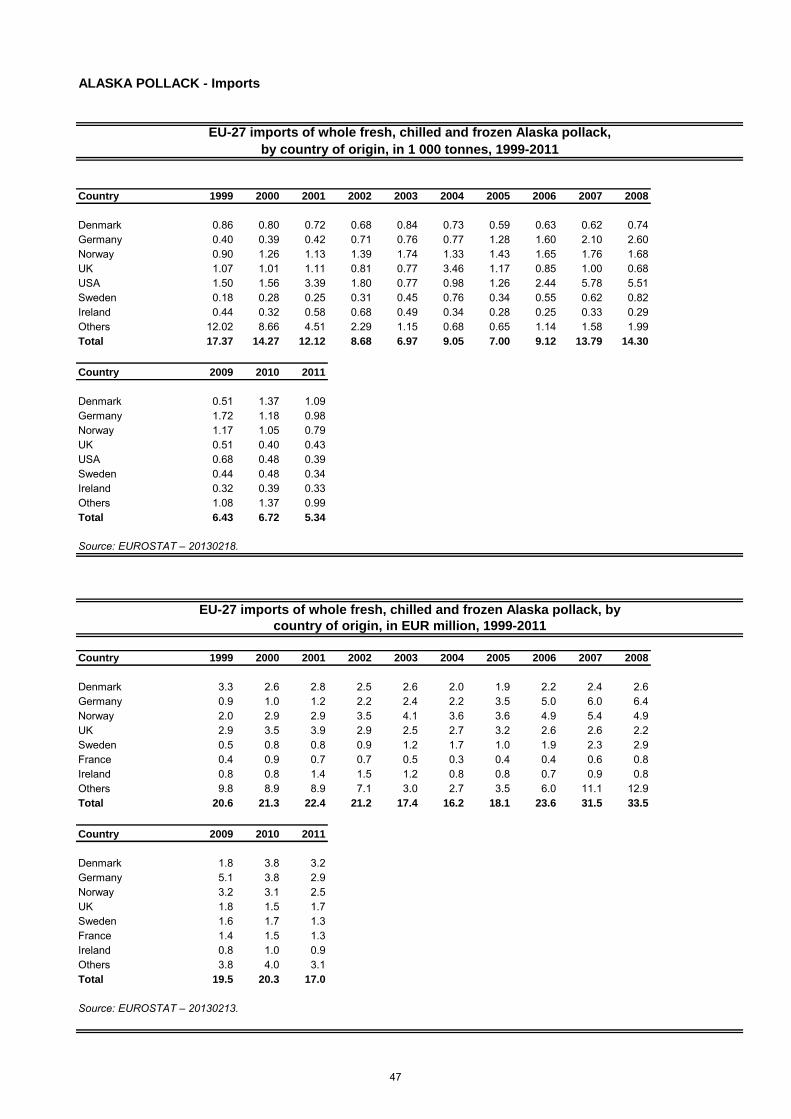
Country 1999 2000 2001 2002 2003 2004 2005 2006 2007 2008
Denmark 0.86 0.80 0.72 0.68 0.84 0.73 0.59 0.63 0.62 0.74Germany 0.40 0.39 0.42 0.71 0.76 0.77 1.28 1.60 2.10 2.60Norway 0.90 1.26 1.13 1.39 1.74 1.33 1.43 1.65 1.76 1.68UK 1.07 1.01 1.11 0.81 0.77 3.46 1.17 0.85 1.00 0.68USA 1.50 1.56 3.39 1.80 0.77 0.98 1.26 2.44 5.78 5.51Sweden 0.18 0.28 0.25 0.31 0.45 0.76 0.34 0.55 0.62 0.82Ireland 0.44 0.32 0.58 0.68 0.49 0.34 0.28 0.25 0.33 0.29Others 12.02 8.66 4.51 2.29 1.15 0.68 0.65 1.14 1.58 1.99Total 17.37 14.27 12.12 8.68 6.97 9.05 7.00 9.12 13.79 14.30
Country 2009 2010 2011
Denmark 0.51 1.37 1.09Germany 1.72 1.18 0.98Norway 1.17 1.05 0.79UK 0.51 0.40 0.43USA 0.68 0.48 0.39Sweden 0.44 0.48 0.34Ireland 0.32 0.39 0.33Others 1.08 1.37 0.99Total 6.43 6.72 5.34
Source: EUROSTAT – 20130218.
Country 1999 2000 2001 2002 2003 2004 2005 2006 2007 2008
Denmark 3.3 2.6 2.8 2.5 2.6 2.0 1.9 2.2 2.4 2.6Germany 0.9 1.0 1.2 2.2 2.4 2.2 3.5 5.0 6.0 6.4Norway 2.0 2.9 2.9 3.5 4.1 3.6 3.6 4.9 5.4 4.9UK 2.9 3.5 3.9 2.9 2.5 2.7 3.2 2.6 2.6 2.2Sweden 0.5 0.8 0.8 0.9 1.2 1.7 1.0 1.9 2.3 2.9France 0.4 0.9 0.7 0.7 0.5 0.3 0.4 0.4 0.6 0.8Ireland 0.8 0.8 1.4 1.5 1.2 0.8 0.8 0.7 0.9 0.8Others 9.8 8.9 8.9 7.1 3.0 2.7 3.5 6.0 11.1 12.9Total 20.6 21.3 22.4 21.2 17.4 16.2 18.1 23.6 31.5 33.5
Country 2009 2010 2011
Denmark 1.8 3.8 3.2Germany 5.1 3.8 2.9Norway 3.2 3.1 2.5UK 1.8 1.5 1.7Sweden 1.6 1.7 1.3France 1.4 1.5 1.3Ireland 0.8 1.0 0.9Others 3.8 4.0 3.1Total 19.5 20.3 17.0
Source: EUROSTAT – 20130213.
ALASKA POLLACK - Imports
EU-27 imports of whole fresh, chilled and frozen Alaska pollack,
EU-27 imports of whole fresh, chilled and frozen Alaska pollack, by
country of origin, in EUR million, 1999-2011
by country of origin, in 1 000 tonnes, 1999-2011
47
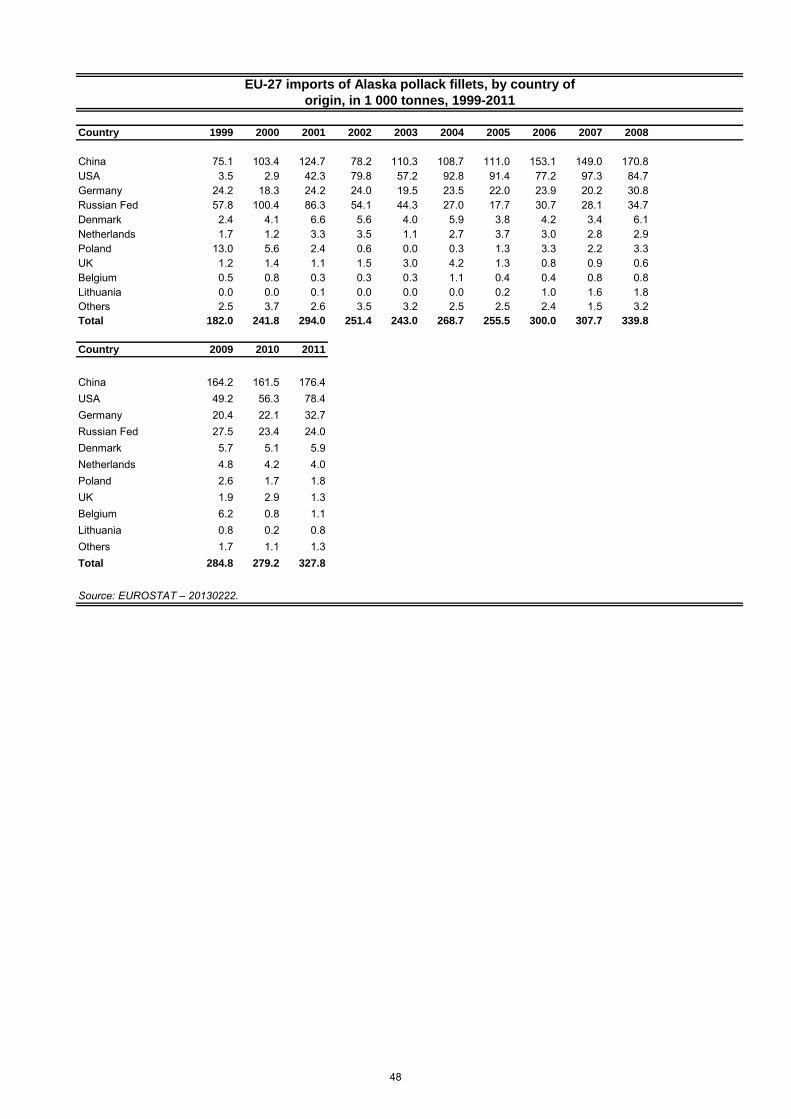
Country 1999 2000 2001 2002 2003 2004 2005 2006 2007 2008
China 75.1 103.4 124.7 78.2 110.3 108.7 111.0 153.1 149.0 170.8USA 3.5 2.9 42.3 79.8 57.2 92.8 91.4 77.2 97.3 84.7Germany 24.2 18.3 24.2 24.0 19.5 23.5 22.0 23.9 20.2 30.8Russian Fed 57.8 100.4 86.3 54.1 44.3 27.0 17.7 30.7 28.1 34.7Denmark 2.4 4.1 6.6 5.6 4.0 5.9 3.8 4.2 3.4 6.1Netherlands 1.7 1.2 3.3 3.5 1.1 2.7 3.7 3.0 2.8 2.9Poland 13.0 5.6 2.4 0.6 0.0 0.3 1.3 3.3 2.2 3.3UK 1.2 1.4 1.1 1.5 3.0 4.2 1.3 0.8 0.9 0.6Belgium 0.5 0.8 0.3 0.3 0.3 1.1 0.4 0.4 0.8 0.8Lithuania 0.0 0.0 0.1 0.0 0.0 0.0 0.2 1.0 1.6 1.8Others 2.5 3.7 2.6 3.5 3.2 2.5 2.5 2.4 1.5 3.2Total 182.0 241.8 294.0 251.4 243.0 268.7 255.5 300.0 307.7 339.8
Country 2009 2010 2011
China 164.2 161.5 176.4USA 49.2 56.3 78.4Germany 20.4 22.1 32.7Russian Fed 27.5 23.4 24.0Denmark 5.7 5.1 5.9Netherlands 4.8 4.2 4.0Poland 2.6 1.7 1.8UK 1.9 2.9 1.3Belgium 6.2 0.8 1.1Lithuania 0.8 0.2 0.8Others 1.7 1.1 1.3Total 284.8 279.2 327.8
Source: EUROSTAT – 20130222.
EU-27 imports of Alaska pollack fillets, by country of
origin, in 1 000 tonnes, 1999-2011
48
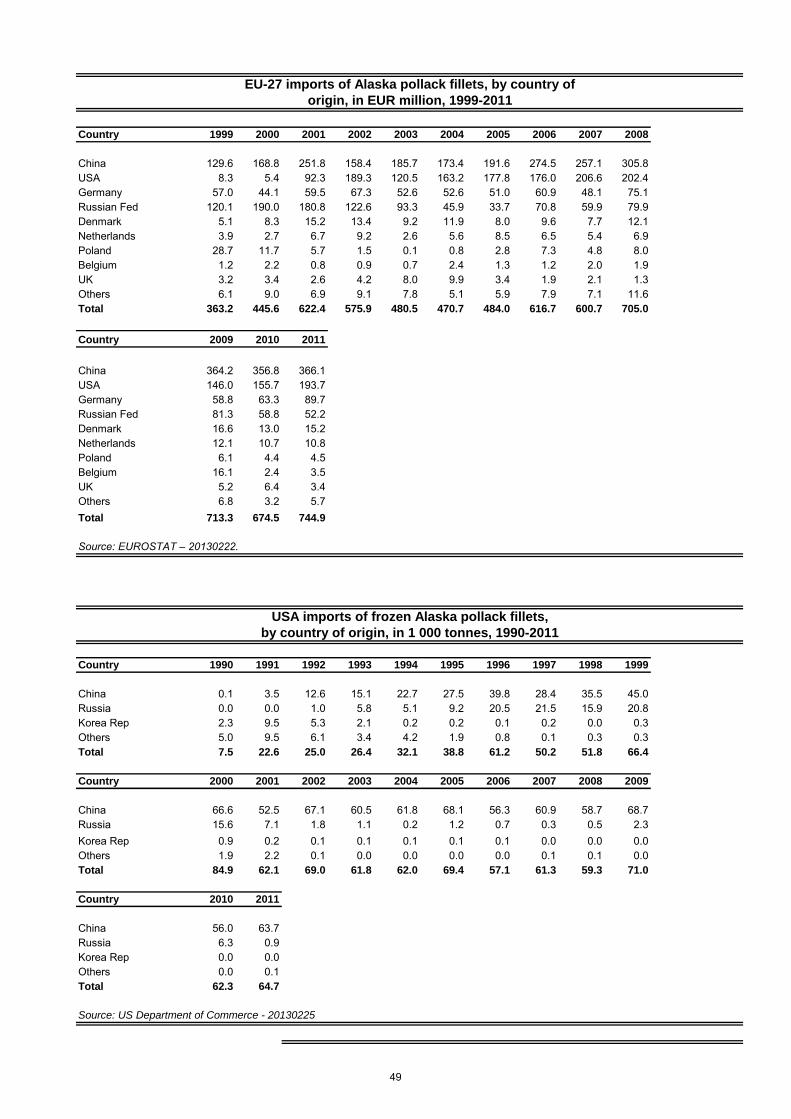
Country 1999 2000 2001 2002 2003 2004 2005 2006 2007 2008
China 129.6 168.8 251.8 158.4 185.7 173.4 191.6 274.5 257.1 305.8USA 8.3 5.4 92.3 189.3 120.5 163.2 177.8 176.0 206.6 202.4Germany 57.0 44.1 59.5 67.3 52.6 52.6 51.0 60.9 48.1 75.1Russian Fed 120.1 190.0 180.8 122.6 93.3 45.9 33.7 70.8 59.9 79.9Denmark 5.1 8.3 15.2 13.4 9.2 11.9 8.0 9.6 7.7 12.1Netherlands 3.9 2.7 6.7 9.2 2.6 5.6 8.5 6.5 5.4 6.9Poland 28.7 11.7 5.7 1.5 0.1 0.8 2.8 7.3 4.8 8.0Belgium 1.2 2.2 0.8 0.9 0.7 2.4 1.3 1.2 2.0 1.9UK 3.2 3.4 2.6 4.2 8.0 9.9 3.4 1.9 2.1 1.3Others 6.1 9.0 6.9 9.1 7.8 5.1 5.9 7.9 7.1 11.6Total 363.2 445.6 622.4 575.9 480.5 470.7 484.0 616.7 600.7 705.0
Country 2009 2010 2011
China 364.2 356.8 366.1USA 146.0 155.7 193.7Germany 58.8 63.3 89.7Russian Fed 81.3 58.8 52.2Denmark 16.6 13.0 15.2Netherlands 12.1 10.7 10.8Poland 6.1 4.4 4.5Belgium 16.1 2.4 3.5UK 5.2 6.4 3.4Others 6.8 3.2 5.7Total 713.3 674.5 744.9
Source: EUROSTAT – 20130222.
Country 1990 1991 1992 1993 1994 1995 1996 1997 1998 1999
China 0.1 3.5 12.6 15.1 22.7 27.5 39.8 28.4 35.5 45.0Russia 0.0 0.0 1.0 5.8 5.1 9.2 20.5 21.5 15.9 20.8Korea Rep 2.3 9.5 5.3 2.1 0.2 0.2 0.1 0.2 0.0 0.3Others 5.0 9.5 6.1 3.4 4.2 1.9 0.8 0.1 0.3 0.3Total 7.5 22.6 25.0 26.4 32.1 38.8 61.2 50.2 51.8 66.4
Country 2000 2001 2002 2003 2004 2005 2006 2007 2008 2009
China 66.6 52.5 67.1 60.5 61.8 68.1 56.3 60.9 58.7 68.7Russia 15.6 7.1 1.8 1.1 0.2 1.2 0.7 0.3 0.5 2.3Korea Rep 0.9 0.2 0.1 0.1 0.1 0.1 0.1 0.0 0.0 0.0Others 1.9 2.2 0.1 0.0 0.0 0.0 0.0 0.1 0.1 0.0Total 84.9 62.1 69.0 61.8 62.0 69.4 57.1 61.3 59.3 71.0
Country 2010 2011
China 56.0 63.7Russia 6.3 0.9Korea Rep 0.0 0.0Others 0.0 0.1Total 62.3 64.7
Source: US Department of Commerce - 20130225
EU-27 imports of Alaska pollack fillets, by country of
origin, in EUR million, 1999-2011
USA imports of frozen Alaska pollack fillets,
by country of origin, in 1 000 tonnes, 1990-2011
49
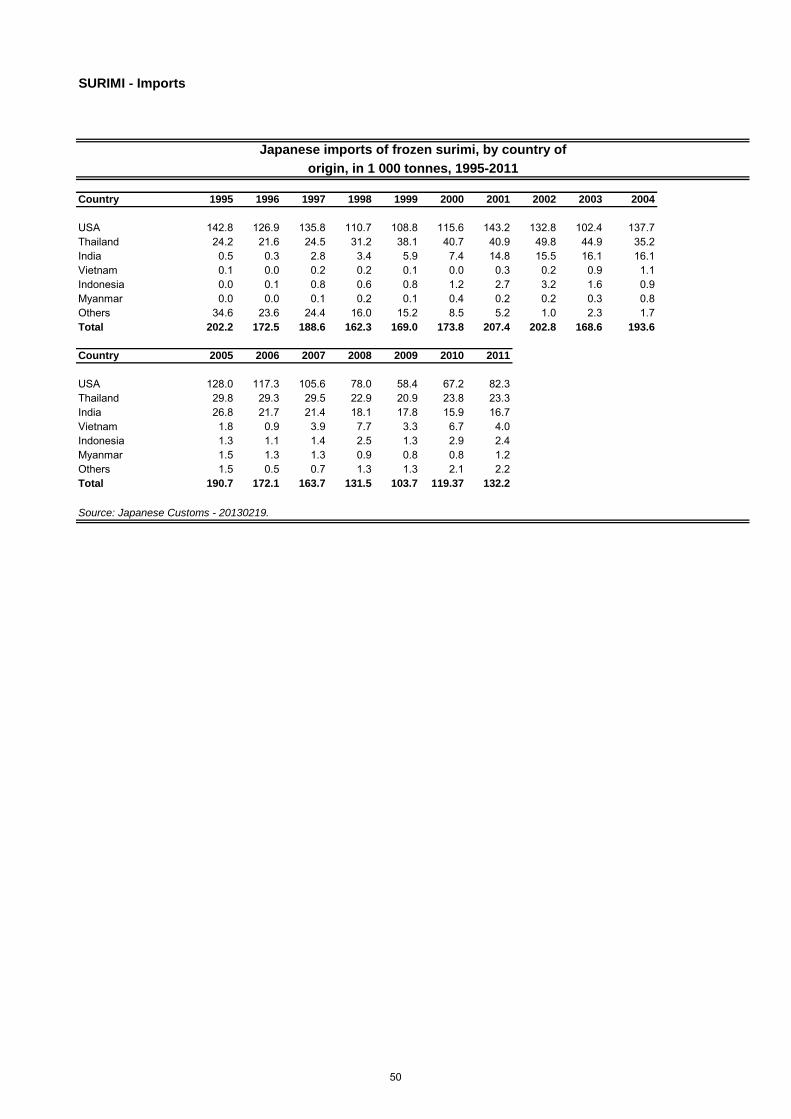
SURIMI - Imports
Country 1995 1996 1997 1998 1999 2000 2001 2002 2003 2004
USA 142.8 126.9 135.8 110.7 108.8 115.6 143.2 132.8 102.4 137.7Thailand 24.2 21.6 24.5 31.2 38.1 40.7 40.9 49.8 44.9 35.2India 0.5 0.3 2.8 3.4 5.9 7.4 14.8 15.5 16.1 16.1Vietnam 0.1 0.0 0.2 0.2 0.1 0.0 0.3 0.2 0.9 1.1Indonesia 0.0 0.1 0.8 0.6 0.8 1.2 2.7 3.2 1.6 0.9Myanmar 0.0 0.0 0.1 0.2 0.1 0.4 0.2 0.2 0.3 0.8Others 34.6 23.6 24.4 16.0 15.2 8.5 5.2 1.0 2.3 1.7Total 202.2 172.5 188.6 162.3 169.0 173.8 207.4 202.8 168.6 193.6
Country 2005 2006 2007 2008 2009 2010 2011
USA 128.0 117.3 105.6 78.0 58.4 67.2 82.3Thailand 29.8 29.3 29.5 22.9 20.9 23.8 23.3India 26.8 21.7 21.4 18.1 17.8 15.9 16.7Vietnam 1.8 0.9 3.9 7.7 3.3 6.7 4.0Indonesia 1.3 1.1 1.4 2.5 1.3 2.9 2.4Myanmar 1.5 1.3 1.3 0.9 0.8 0.8 1.2Others 1.5 0.5 0.7 1.3 1.3 2.1 2.2Total 190.7 172.1 163.7 131.5 103.7 119.37 132.2
Source: Japanese Customs - 20130219.
Japanese imports of frozen surimi, by country of
origin, in 1 000 tonnes, 1995-2011
50
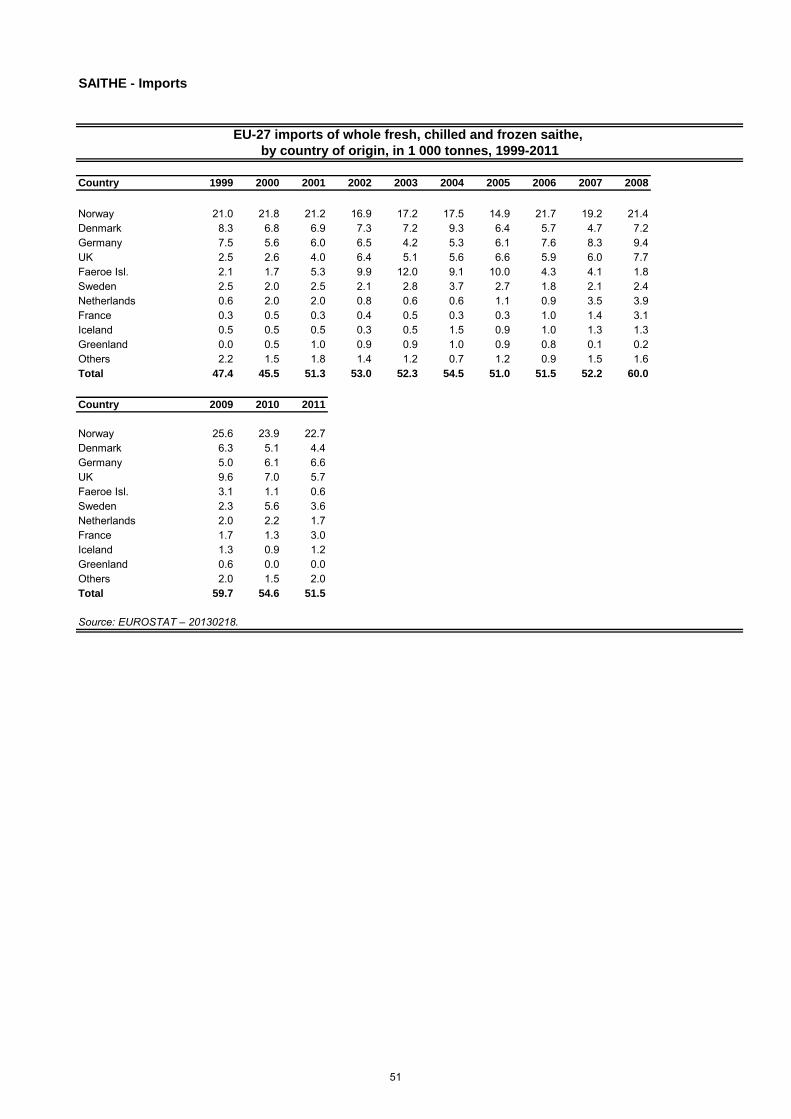
SAITHE - Imports
Country 1999 2000 2001 2002 2003 2004 2005 2006 2007 2008
Norway 21.0 21.8 21.2 16.9 17.2 17.5 14.9 21.7 19.2 21.4Denmark 8.3 6.8 6.9 7.3 7.2 9.3 6.4 5.7 4.7 7.2Germany 7.5 5.6 6.0 6.5 4.2 5.3 6.1 7.6 8.3 9.4UK 2.5 2.6 4.0 6.4 5.1 5.6 6.6 5.9 6.0 7.7Faeroe Isl. 2.1 1.7 5.3 9.9 12.0 9.1 10.0 4.3 4.1 1.8Sweden 2.5 2.0 2.5 2.1 2.8 3.7 2.7 1.8 2.1 2.4Netherlands 0.6 2.0 2.0 0.8 0.6 0.6 1.1 0.9 3.5 3.9France 0.3 0.5 0.3 0.4 0.5 0.3 0.3 1.0 1.4 3.1Iceland 0.5 0.5 0.5 0.3 0.5 1.5 0.9 1.0 1.3 1.3Greenland 0.0 0.5 1.0 0.9 0.9 1.0 0.9 0.8 0.1 0.2Others 2.2 1.5 1.8 1.4 1.2 0.7 1.2 0.9 1.5 1.6Total 47.4 45.5 51.3 53.0 52.3 54.5 51.0 51.5 52.2 60.0
Country 2009 2010 2011
Norway 25.6 23.9 22.7Denmark 6.3 5.1 4.4Germany 5.0 6.1 6.6UK 9.6 7.0 5.7Faeroe Isl. 3.1 1.1 0.6Sweden 2.3 5.6 3.6Netherlands 2.0 2.2 1.7France 1.7 1.3 3.0Iceland 1.3 0.9 1.2Greenland 0.6 0.0 0.0Others 2.0 1.5 2.0Total 59.7 54.6 51.5
Source: EUROSTAT – 20130218.
EU-27 imports of whole fresh, chilled and frozen saithe,
by country of origin, in 1 000 tonnes, 1999-2011
51
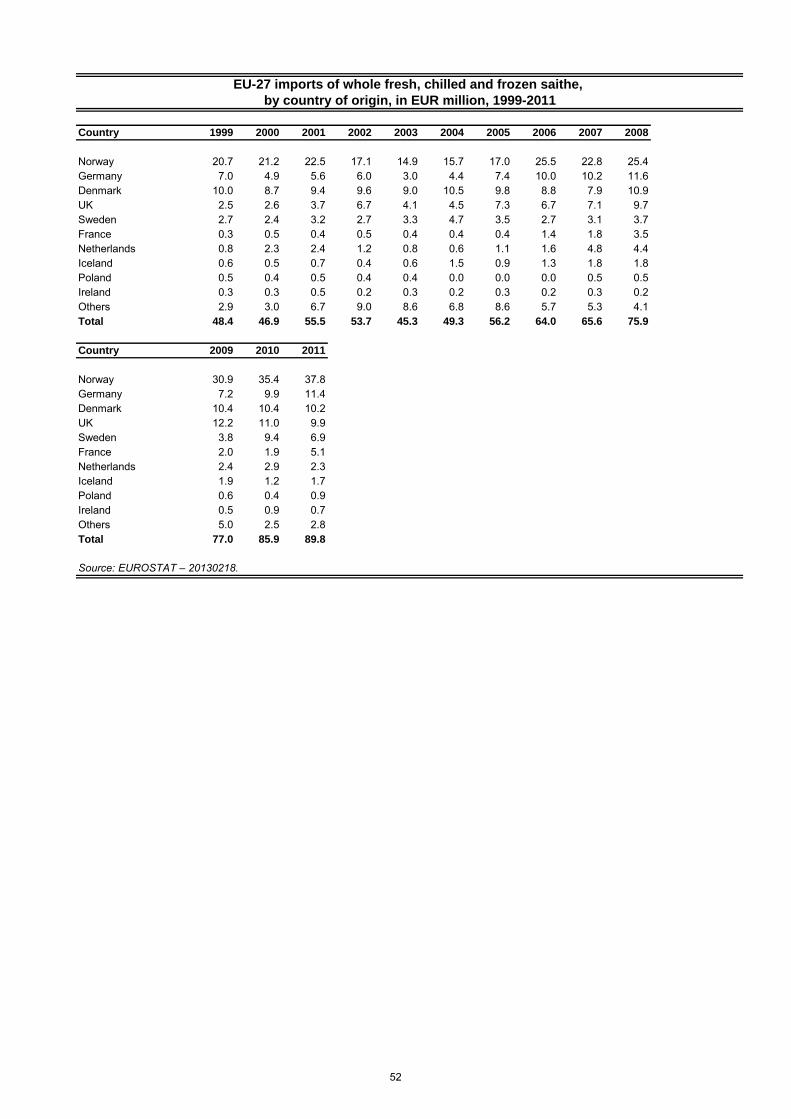
Country 1999 2000 2001 2002 2003 2004 2005 2006 2007 2008
Norway 20.7 21.2 22.5 17.1 14.9 15.7 17.0 25.5 22.8 25.4Germany 7.0 4.9 5.6 6.0 3.0 4.4 7.4 10.0 10.2 11.6Denmark 10.0 8.7 9.4 9.6 9.0 10.5 9.8 8.8 7.9 10.9UK 2.5 2.6 3.7 6.7 4.1 4.5 7.3 6.7 7.1 9.7Sweden 2.7 2.4 3.2 2.7 3.3 4.7 3.5 2.7 3.1 3.7France 0.3 0.5 0.4 0.5 0.4 0.4 0.4 1.4 1.8 3.5Netherlands 0.8 2.3 2.4 1.2 0.8 0.6 1.1 1.6 4.8 4.4Iceland 0.6 0.5 0.7 0.4 0.6 1.5 0.9 1.3 1.8 1.8Poland 0.5 0.4 0.5 0.4 0.4 0.0 0.0 0.0 0.5 0.5Ireland 0.3 0.3 0.5 0.2 0.3 0.2 0.3 0.2 0.3 0.2Others 2.9 3.0 6.7 9.0 8.6 6.8 8.6 5.7 5.3 4.1Total 48.4 46.9 55.5 53.7 45.3 49.3 56.2 64.0 65.6 75.9
Country 2009 2010 2011
Norway 30.9 35.4 37.8Germany 7.2 9.9 11.4Denmark 10.4 10.4 10.2UK 12.2 11.0 9.9Sweden 3.8 9.4 6.9France 2.0 1.9 5.1Netherlands 2.4 2.9 2.3Iceland 1.9 1.2 1.7Poland 0.6 0.4 0.9Ireland 0.5 0.9 0.7Others 5.0 2.5 2.8Total 77.0 85.9 89.8
Source: EUROSTAT – 20130218.
EU-27 imports of whole fresh, chilled and frozen saithe,
by country of origin, in EUR million, 1999-2011
52
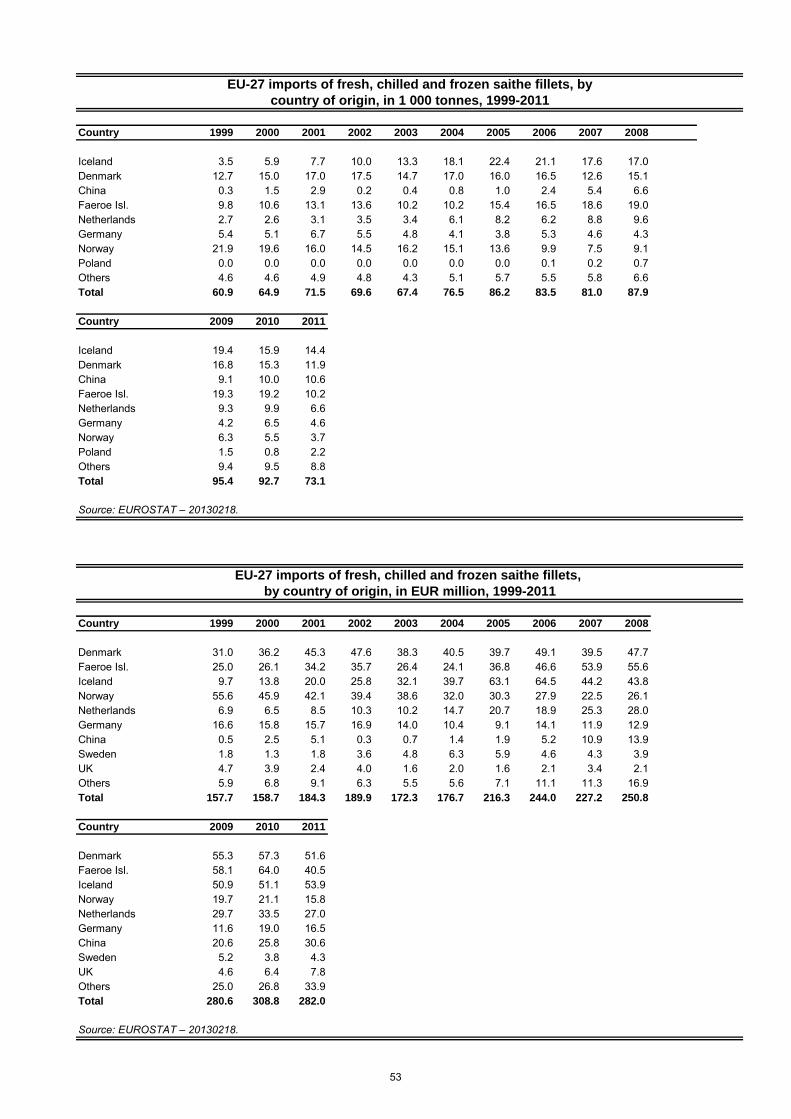
Country 1999 2000 2001 2002 2003 2004 2005 2006 2007 2008
Iceland 3.5 5.9 7.7 10.0 13.3 18.1 22.4 21.1 17.6 17.0Denmark 12.7 15.0 17.0 17.5 14.7 17.0 16.0 16.5 12.6 15.1China 0.3 1.5 2.9 0.2 0.4 0.8 1.0 2.4 5.4 6.6Faeroe Isl. 9.8 10.6 13.1 13.6 10.2 10.2 15.4 16.5 18.6 19.0Netherlands 2.7 2.6 3.1 3.5 3.4 6.1 8.2 6.2 8.8 9.6Germany 5.4 5.1 6.7 5.5 4.8 4.1 3.8 5.3 4.6 4.3Norway 21.9 19.6 16.0 14.5 16.2 15.1 13.6 9.9 7.5 9.1Poland 0.0 0.0 0.0 0.0 0.0 0.0 0.0 0.1 0.2 0.7Others 4.6 4.6 4.9 4.8 4.3 5.1 5.7 5.5 5.8 6.6Total 60.9 64.9 71.5 69.6 67.4 76.5 86.2 83.5 81.0 87.9
Country 2009 2010 2011
Iceland 19.4 15.9 14.4Denmark 16.8 15.3 11.9China 9.1 10.0 10.6Faeroe Isl. 19.3 19.2 10.2Netherlands 9.3 9.9 6.6Germany 4.2 6.5 4.6Norway 6.3 5.5 3.7Poland 1.5 0.8 2.2Others 9.4 9.5 8.8Total 95.4 92.7 73.1
Source: EUROSTAT – 20130218.
Country 1999 2000 2001 2002 2003 2004 2005 2006 2007 2008
Denmark 31.0 36.2 45.3 47.6 38.3 40.5 39.7 49.1 39.5 47.7Faeroe Isl. 25.0 26.1 34.2 35.7 26.4 24.1 36.8 46.6 53.9 55.6Iceland 9.7 13.8 20.0 25.8 32.1 39.7 63.1 64.5 44.2 43.8Norway 55.6 45.9 42.1 39.4 38.6 32.0 30.3 27.9 22.5 26.1Netherlands 6.9 6.5 8.5 10.3 10.2 14.7 20.7 18.9 25.3 28.0Germany 16.6 15.8 15.7 16.9 14.0 10.4 9.1 14.1 11.9 12.9China 0.5 2.5 5.1 0.3 0.7 1.4 1.9 5.2 10.9 13.9Sweden 1.8 1.3 1.8 3.6 4.8 6.3 5.9 4.6 4.3 3.9UK 4.7 3.9 2.4 4.0 1.6 2.0 1.6 2.1 3.4 2.1Others 5.9 6.8 9.1 6.3 5.5 5.6 7.1 11.1 11.3 16.9Total 157.7 158.7 184.3 189.9 172.3 176.7 216.3 244.0 227.2 250.8
Country 2009 2010 2011
Denmark 55.3 57.3 51.6Faeroe Isl. 58.1 64.0 40.5Iceland 50.9 51.1 53.9Norway 19.7 21.1 15.8Netherlands 29.7 33.5 27.0Germany 11.6 19.0 16.5China 20.6 25.8 30.6Sweden 5.2 3.8 4.3UK 4.6 6.4 7.8Others 25.0 26.8 33.9Total 280.6 308.8 282.0
Source: EUROSTAT – 20130218.
EU-27 imports of fresh, chilled and frozen saithe fillets, by
country of origin, in 1 000 tonnes, 1999-2011
EU-27 imports of fresh, chilled and frozen saithe fillets,
by country of origin, in EUR million, 1999-2011
53
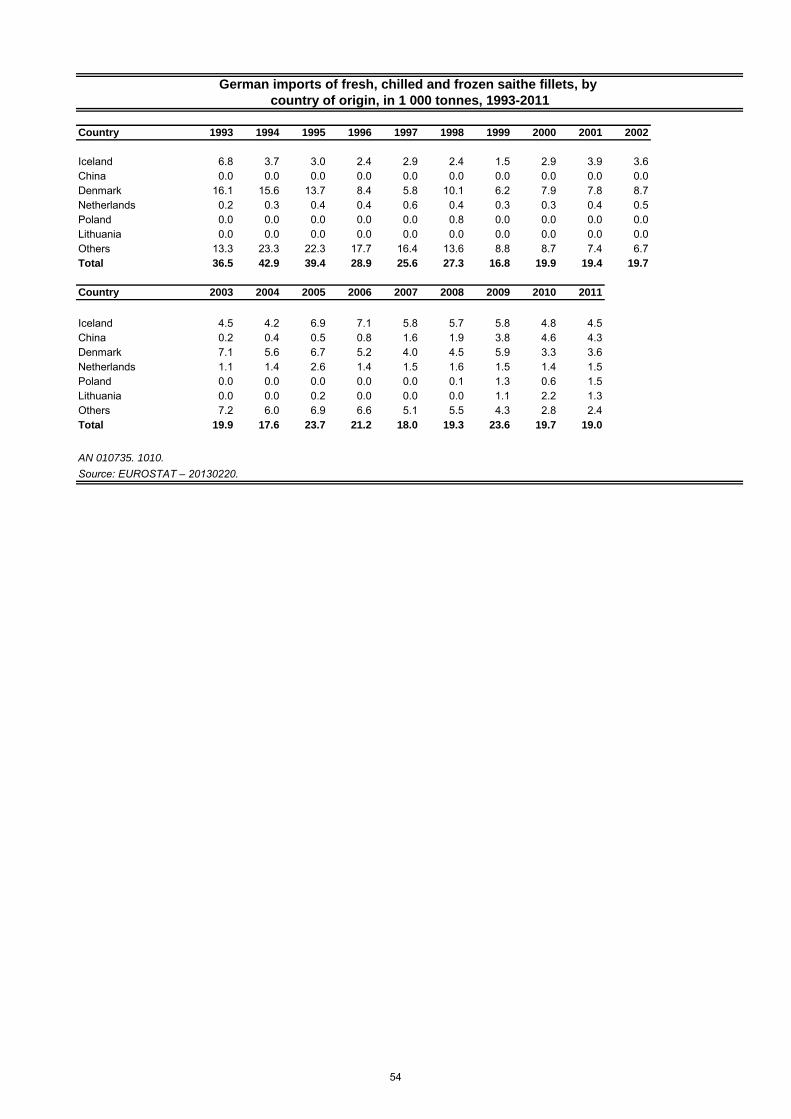
Country 1993 1994 1995 1996 1997 1998 1999 2000 2001 2002
Iceland 6.8 3.7 3.0 2.4 2.9 2.4 1.5 2.9 3.9 3.6China 0.0 0.0 0.0 0.0 0.0 0.0 0.0 0.0 0.0 0.0Denmark 16.1 15.6 13.7 8.4 5.8 10.1 6.2 7.9 7.8 8.7Netherlands 0.2 0.3 0.4 0.4 0.6 0.4 0.3 0.3 0.4 0.5Poland 0.0 0.0 0.0 0.0 0.0 0.8 0.0 0.0 0.0 0.0Lithuania 0.0 0.0 0.0 0.0 0.0 0.0 0.0 0.0 0.0 0.0Others 13.3 23.3 22.3 17.7 16.4 13.6 8.8 8.7 7.4 6.7Total 36.5 42.9 39.4 28.9 25.6 27.3 16.8 19.9 19.4 19.7
Country 2003 2004 2005 2006 2007 2008 2009 2010 2011
Iceland 4.5 4.2 6.9 7.1 5.8 5.7 5.8 4.8 4.5China 0.2 0.4 0.5 0.8 1.6 1.9 3.8 4.6 4.3Denmark 7.1 5.6 6.7 5.2 4.0 4.5 5.9 3.3 3.6Netherlands 1.1 1.4 2.6 1.4 1.5 1.6 1.5 1.4 1.5Poland 0.0 0.0 0.0 0.0 0.0 0.1 1.3 0.6 1.5Lithuania 0.0 0.0 0.2 0.0 0.0 0.0 1.1 2.2 1.3Others 7.2 6.0 6.9 6.6 5.1 5.5 4.3 2.8 2.4Total 19.9 17.6 23.7 21.2 18.0 19.3 23.6 19.7 19.0
AN 010735. 1010.
Source: EUROSTAT – 20130220.
country of origin, in 1 000 tonnes, 1993-2011
German imports of fresh, chilled and frozen saithe fillets, by
54
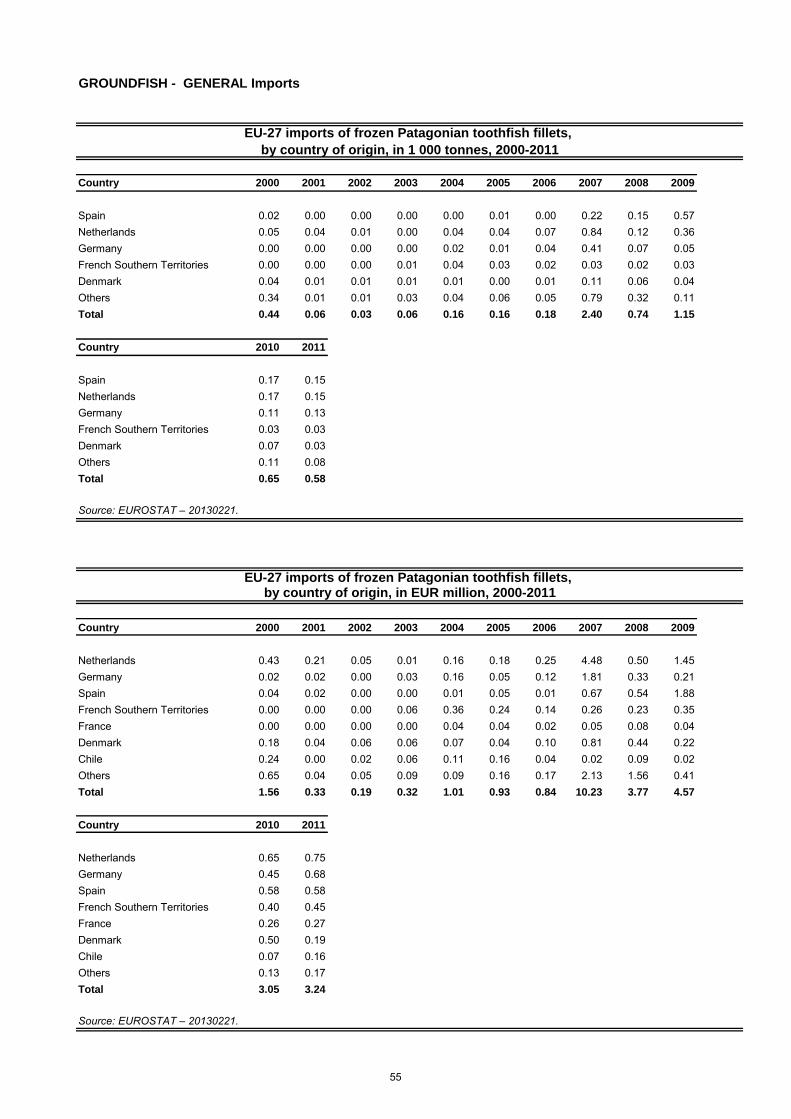
Country 2000 2001 2002 2003 2004 2005 2006 2007 2008 2009
Spain 0.02 0.00 0.00 0.00 0.00 0.01 0.00 0.22 0.15 0.57Netherlands 0.05 0.04 0.01 0.00 0.04 0.04 0.07 0.84 0.12 0.36Germany 0.00 0.00 0.00 0.00 0.02 0.01 0.04 0.41 0.07 0.05French Southern Territories 0.00 0.00 0.00 0.01 0.04 0.03 0.02 0.03 0.02 0.03Denmark 0.04 0.01 0.01 0.01 0.01 0.00 0.01 0.11 0.06 0.04Others 0.34 0.01 0.01 0.03 0.04 0.06 0.05 0.79 0.32 0.11Total 0.44 0.06 0.03 0.06 0.16 0.16 0.18 2.40 0.74 1.15
Country 2010 2011
Spain 0.17 0.15Netherlands 0.17 0.15Germany 0.11 0.13French Southern Territories 0.03 0.03Denmark 0.07 0.03Others 0.11 0.08Total 0.65 0.58
Country 2000 2001 2002 2003 2004 2005 2006 2007 2008 2009
Netherlands 0.43 0.21 0.05 0.01 0.16 0.18 0.25 4.48 0.50 1.45Germany 0.02 0.02 0.00 0.03 0.16 0.05 0.12 1.81 0.33 0.21Spain 0.04 0.02 0.00 0.00 0.01 0.05 0.01 0.67 0.54 1.88French Southern Territories 0.00 0.00 0.00 0.06 0.36 0.24 0.14 0.26 0.23 0.35France 0.00 0.00 0.00 0.00 0.04 0.04 0.02 0.05 0.08 0.04Denmark 0.18 0.04 0.06 0.06 0.07 0.04 0.10 0.81 0.44 0.22Chile 0.24 0.00 0.02 0.06 0.11 0.16 0.04 0.02 0.09 0.02Others 0.65 0.04 0.05 0.09 0.09 0.16 0.17 2.13 1.56 0.41Total 1.56 0.33 0.19 0.32 1.01 0.93 0.84 10.23 3.77 4.57
Country 2010 2011
Netherlands 0.65 0.75Germany 0.45 0.68Spain 0.58 0.58French Southern Territories 0.40 0.45France 0.26 0.27Denmark 0.50 0.19Chile 0.07 0.16Others 0.13 0.17Total 3.05 3.24
Source: EUROSTAT – 20130221.
Source: EUROSTAT – 20130221.
GROUNDFISH - GENERAL Imports
EU-27 imports of frozen Patagonian toothfish fillets,
EU-27 imports of frozen Patagonian toothfish fillets, by country of origin, in EUR million, 2000-2011
by country of origin, in 1 000 tonnes, 2000-2011
55
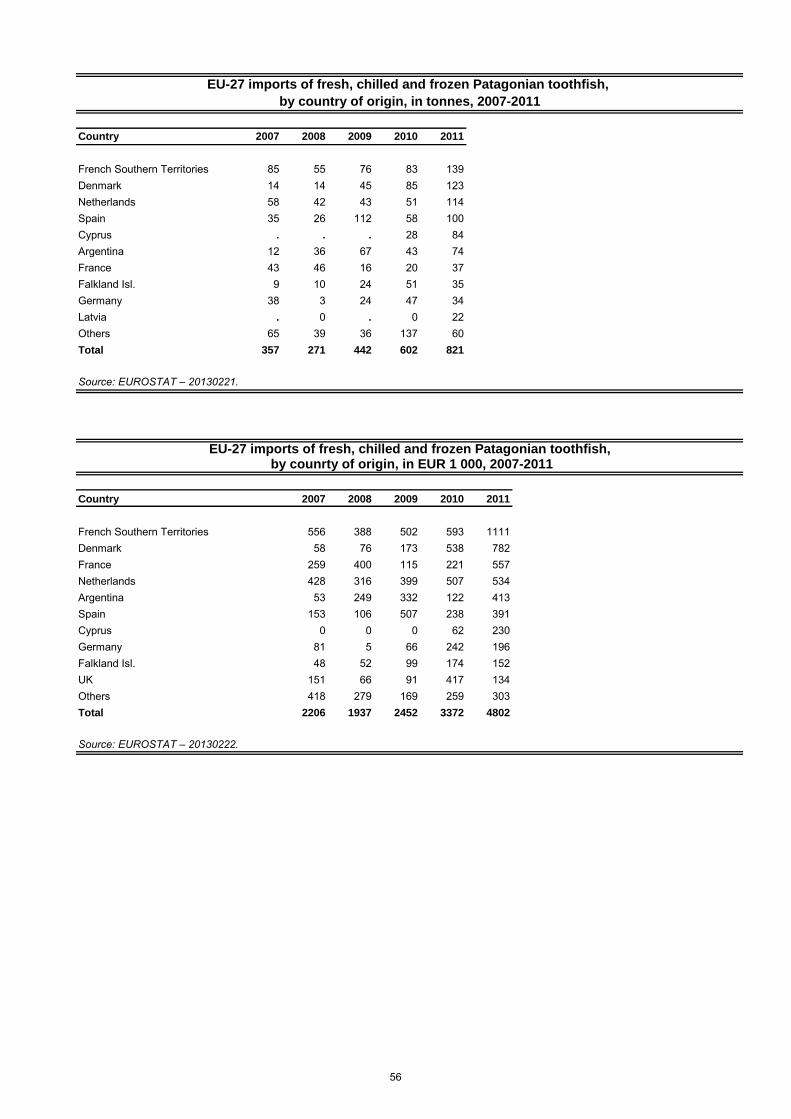
Country 2007 2008 2009 2010 2011
French Southern Territories 85 55 76 83 139Denmark 14 14 45 85 123Netherlands 58 42 43 51 114Spain 35 26 112 58 100Cyprus . . . 28 84Argentina 12 36 67 43 74France 43 46 16 20 37Falkland Isl. 9 10 24 51 35Germany 38 3 24 47 34Latvia . 0 . 0 22Others 65 39 36 137 60Total 357 271 442 602 821
Country 2007 2008 2009 2010 2011
French Southern Territories 556 388 502 593 1111Denmark 58 76 173 538 782France 259 400 115 221 557Netherlands 428 316 399 507 534Argentina 53 249 332 122 413Spain 153 106 507 238 391Cyprus 0 0 0 62 230Germany 81 5 66 242 196Falkland Isl. 48 52 99 174 152UK 151 66 91 417 134Others 418 279 169 259 303Total 2206 1937 2452 3372 4802
Source: EUROSTAT – 20130221.
EU-27 imports of fresh, chilled and frozen Patagonian toothfish,
Source: EUROSTAT – 20130222.
EU-27 imports of fresh, chilled and frozen Patagonian toothfish, by counrty of origin, in EUR 1 000, 2007-2011
by country of origin, in tonnes, 2007-2011
56
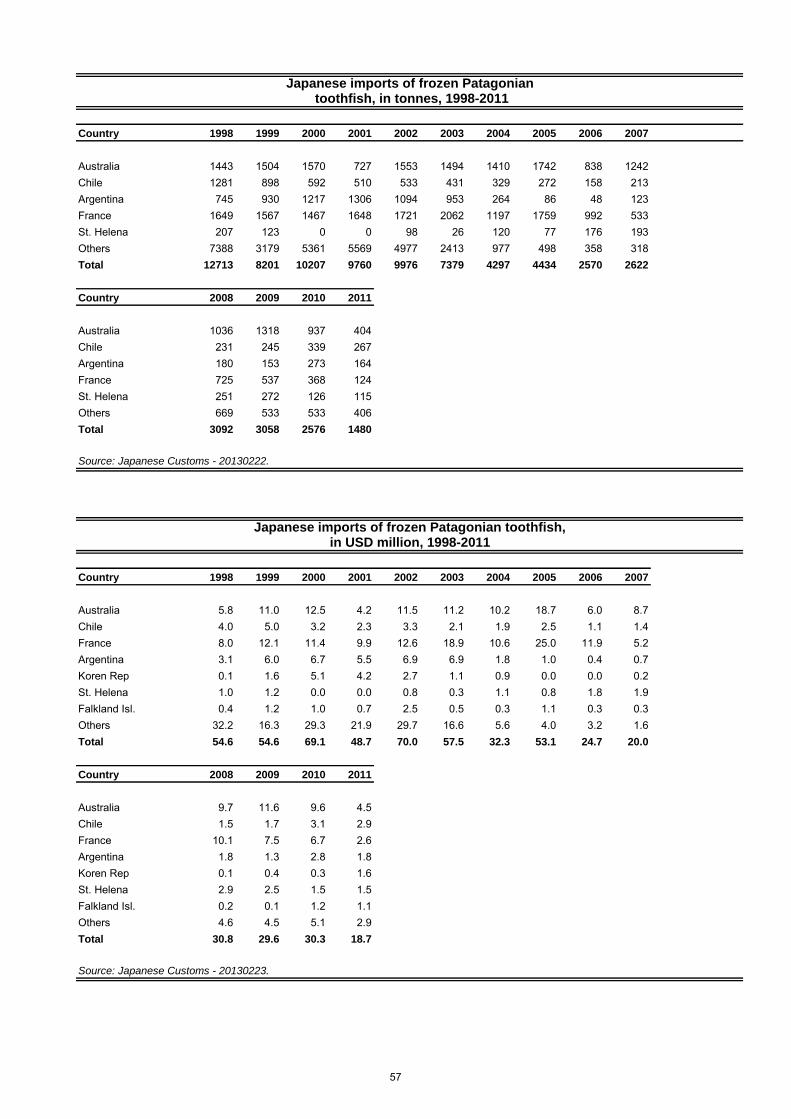
Country 1998 1999 2000 2001 2002 2003 2004 2005 2006 2007
Australia 1443 1504 1570 727 1553 1494 1410 1742 838 1242Chile 1281 898 592 510 533 431 329 272 158 213Argentina 745 930 1217 1306 1094 953 264 86 48 123France 1649 1567 1467 1648 1721 2062 1197 1759 992 533St. Helena 207 123 0 0 98 26 120 77 176 193Others 7388 3179 5361 5569 4977 2413 977 498 358 318Total 12713 8201 10207 9760 9976 7379 4297 4434 2570 2622
Country 2008 2009 2010 2011
Australia 1036 1318 937 404Chile 231 245 339 267Argentina 180 153 273 164France 725 537 368 124St. Helena 251 272 126 115Others 669 533 533 406Total 3092 3058 2576 1480
Source: Japanese Customs - 20130222.
Country 1998 1999 2000 2001 2002 2003 2004 2005 2006 2007
Australia 5.8 11.0 12.5 4.2 11.5 11.2 10.2 18.7 6.0 8.7Chile 4.0 5.0 3.2 2.3 3.3 2.1 1.9 2.5 1.1 1.4France 8.0 12.1 11.4 9.9 12.6 18.9 10.6 25.0 11.9 5.2Argentina 3.1 6.0 6.7 5.5 6.9 6.9 1.8 1.0 0.4 0.7Koren Rep 0.1 1.6 5.1 4.2 2.7 1.1 0.9 0.0 0.0 0.2St. Helena 1.0 1.2 0.0 0.0 0.8 0.3 1.1 0.8 1.8 1.9Falkland Isl. 0.4 1.2 1.0 0.7 2.5 0.5 0.3 1.1 0.3 0.3Others 32.2 16.3 29.3 21.9 29.7 16.6 5.6 4.0 3.2 1.6Total 54.6 54.6 69.1 48.7 70.0 57.5 32.3 53.1 24.7 20.0
Country 2008 2009 2010 2011
Australia 9.7 11.6 9.6 4.5Chile 1.5 1.7 3.1 2.9France 10.1 7.5 6.7 2.6Argentina 1.8 1.3 2.8 1.8Koren Rep 0.1 0.4 0.3 1.6St. Helena 2.9 2.5 1.5 1.5Falkland Isl. 0.2 0.1 1.2 1.1Others 4.6 4.5 5.1 2.9Total 30.8 29.6 30.3 18.7
Source: Japanese Customs - 20130223.
toothfish, in tonnes, 1998-2011
Japanese imports of frozen Patagonian toothfish,
Japanese imports of frozen Patagonian
in USD million, 1998-2011
57
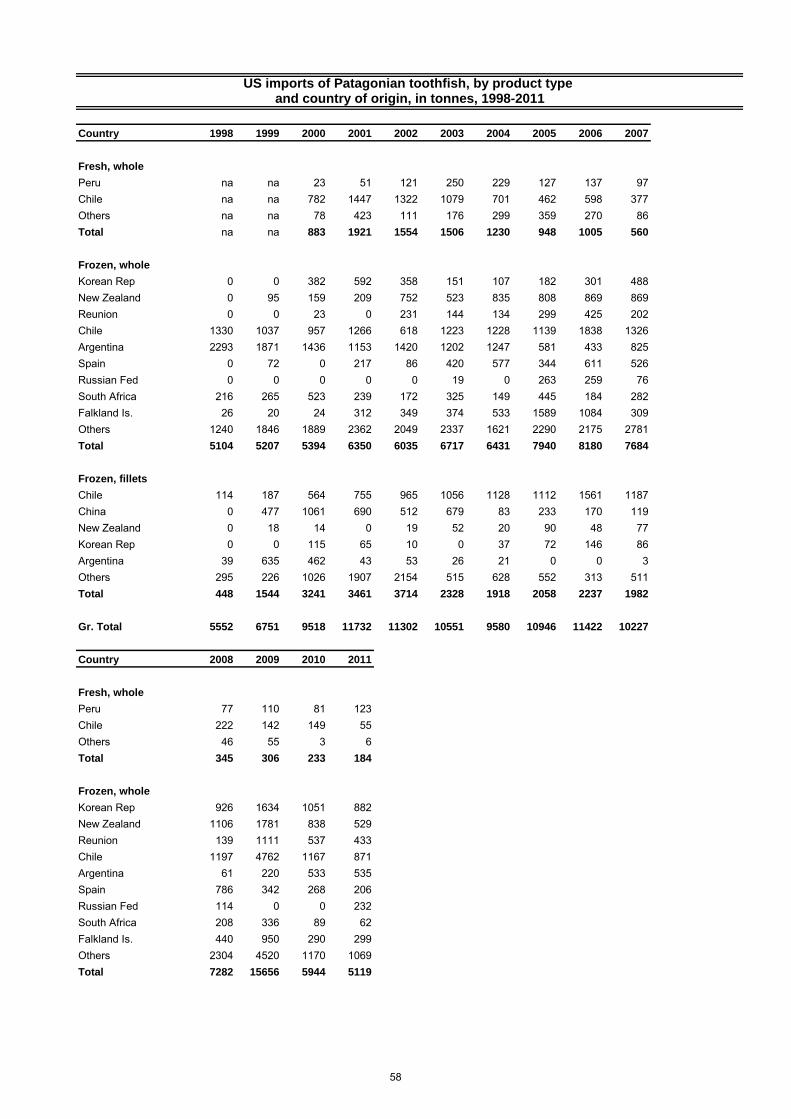
Country 1998 1999 2000 2001 2002 2003 2004 2005 2006 2007
Fresh, whole
Peru na na 23 51 121 250 229 127 137 97Chile na na 782 1447 1322 1079 701 462 598 377Others na na 78 423 111 176 299 359 270 86Total na na 883 1921 1554 1506 1230 948 1005 560
Frozen, whole
Korean Rep 0 0 382 592 358 151 107 182 301 488New Zealand 0 95 159 209 752 523 835 808 869 869Reunion 0 0 23 0 231 144 134 299 425 202Chile 1330 1037 957 1266 618 1223 1228 1139 1838 1326Argentina 2293 1871 1436 1153 1420 1202 1247 581 433 825Spain 0 72 0 217 86 420 577 344 611 526Russian Fed 0 0 0 0 0 19 0 263 259 76South Africa 216 265 523 239 172 325 149 445 184 282Falkland Is. 26 20 24 312 349 374 533 1589 1084 309Others 1240 1846 1889 2362 2049 2337 1621 2290 2175 2781Total 5104 5207 5394 6350 6035 6717 6431 7940 8180 7684
Frozen, fillets
Chile 114 187 564 755 965 1056 1128 1112 1561 1187China 0 477 1061 690 512 679 83 233 170 119New Zealand 0 18 14 0 19 52 20 90 48 77Korean Rep 0 0 115 65 10 0 37 72 146 86Argentina 39 635 462 43 53 26 21 0 0 3Others 295 226 1026 1907 2154 515 628 552 313 511Total 448 1544 3241 3461 3714 2328 1918 2058 2237 1982
Gr. Total 5552 6751 9518 11732 11302 10551 9580 10946 11422 10227
Country 2008 2009 2010 2011
Fresh, whole
Peru 77 110 81 123Chile 222 142 149 55Others 46 55 3 6Total 345 306 233 184
Frozen, whole
Korean Rep 926 1634 1051 882New Zealand 1106 1781 838 529Reunion 139 1111 537 433Chile 1197 4762 1167 871Argentina 61 220 533 535Spain 786 342 268 206Russian Fed 114 0 0 232South Africa 208 336 89 62Falkland Is. 440 950 290 299Others 2304 4520 1170 1069Total 7282 15656 5944 5119
US imports of Patagonian toothfish, by product type and country of origin, in tonnes, 1998-2011
58
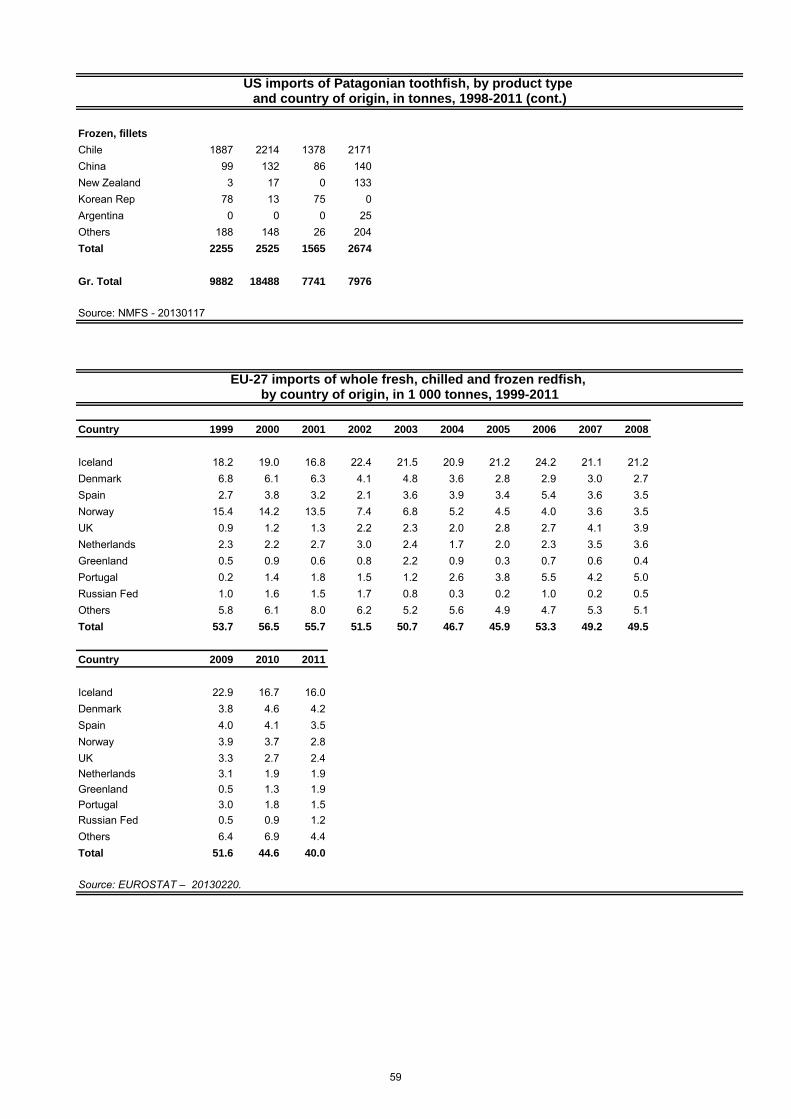
Frozen, fillets
Chile 1887 2214 1378 2171China 99 132 86 140New Zealand 3 17 0 133Korean Rep 78 13 75 0Argentina 0 0 0 25Others 188 148 26 204Total 2255 2525 1565 2674
Gr. Total 9882 18488 7741 7976
Source: NMFS - 20130117
Country 1999 2000 2001 2002 2003 2004 2005 2006 2007 2008
Iceland 18.2 19.0 16.8 22.4 21.5 20.9 21.2 24.2 21.1 21.2Denmark 6.8 6.1 6.3 4.1 4.8 3.6 2.8 2.9 3.0 2.7Spain 2.7 3.8 3.2 2.1 3.6 3.9 3.4 5.4 3.6 3.5Norway 15.4 14.2 13.5 7.4 6.8 5.2 4.5 4.0 3.6 3.5UK 0.9 1.2 1.3 2.2 2.3 2.0 2.8 2.7 4.1 3.9Netherlands 2.3 2.2 2.7 3.0 2.4 1.7 2.0 2.3 3.5 3.6Greenland 0.5 0.9 0.6 0.8 2.2 0.9 0.3 0.7 0.6 0.4Portugal 0.2 1.4 1.8 1.5 1.2 2.6 3.8 5.5 4.2 5.0Russian Fed 1.0 1.6 1.5 1.7 0.8 0.3 0.2 1.0 0.2 0.5Others 5.8 6.1 8.0 6.2 5.2 5.6 4.9 4.7 5.3 5.1Total 53.7 56.5 55.7 51.5 50.7 46.7 45.9 53.3 49.2 49.5
Country 2009 2010 2011
Iceland 22.9 16.7 16.0Denmark 3.8 4.6 4.2Spain 4.0 4.1 3.5Norway 3.9 3.7 2.8UK 3.3 2.7 2.4Netherlands 3.1 1.9 1.9Greenland 0.5 1.3 1.9Portugal 3.0 1.8 1.5Russian Fed 0.5 0.9 1.2Others 6.4 6.9 4.4Total 51.6 44.6 40.0
Source: EUROSTAT – 20130220.
by country of origin, in 1 000 tonnes, 1999-2011EU-27 imports of whole fresh, chilled and frozen redfish,
US imports of Patagonian toothfish, by product type and country of origin, in tonnes, 1998-2011 (cont.)
59
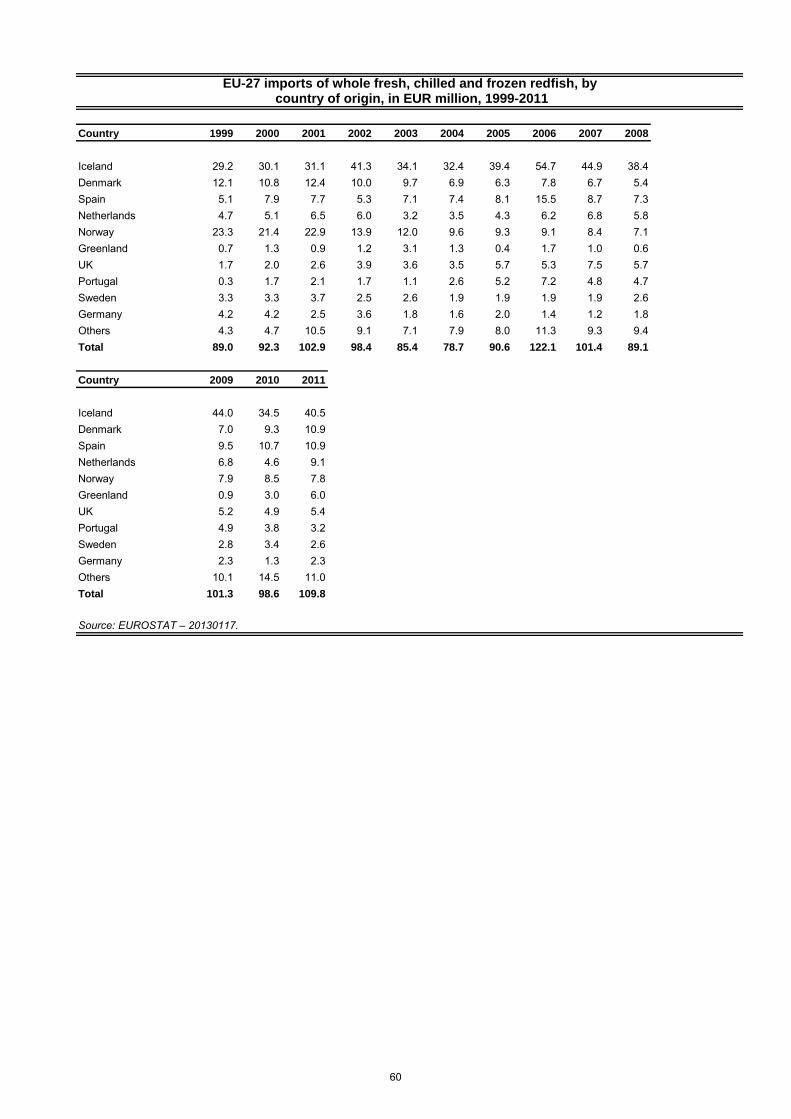
Country 1999 2000 2001 2002 2003 2004 2005 2006 2007 2008
Iceland 29.2 30.1 31.1 41.3 34.1 32.4 39.4 54.7 44.9 38.4Denmark 12.1 10.8 12.4 10.0 9.7 6.9 6.3 7.8 6.7 5.4Spain 5.1 7.9 7.7 5.3 7.1 7.4 8.1 15.5 8.7 7.3Netherlands 4.7 5.1 6.5 6.0 3.2 3.5 4.3 6.2 6.8 5.8Norway 23.3 21.4 22.9 13.9 12.0 9.6 9.3 9.1 8.4 7.1Greenland 0.7 1.3 0.9 1.2 3.1 1.3 0.4 1.7 1.0 0.6UK 1.7 2.0 2.6 3.9 3.6 3.5 5.7 5.3 7.5 5.7Portugal 0.3 1.7 2.1 1.7 1.1 2.6 5.2 7.2 4.8 4.7Sweden 3.3 3.3 3.7 2.5 2.6 1.9 1.9 1.9 1.9 2.6Germany 4.2 4.2 2.5 3.6 1.8 1.6 2.0 1.4 1.2 1.8Others 4.3 4.7 10.5 9.1 7.1 7.9 8.0 11.3 9.3 9.4Total 89.0 92.3 102.9 98.4 85.4 78.7 90.6 122.1 101.4 89.1
Country 2009 2010 2011
Iceland 44.0 34.5 40.5Denmark 7.0 9.3 10.9Spain 9.5 10.7 10.9Netherlands 6.8 4.6 9.1Norway 7.9 8.5 7.8Greenland 0.9 3.0 6.0UK 5.2 4.9 5.4Portugal 4.9 3.8 3.2Sweden 2.8 3.4 2.6Germany 2.3 1.3 2.3Others 10.1 14.5 11.0Total 101.3 98.6 109.8
Source: EUROSTAT – 20130117.
EU-27 imports of whole fresh, chilled and frozen redfish, by country of origin, in EUR million, 1999-2011
60
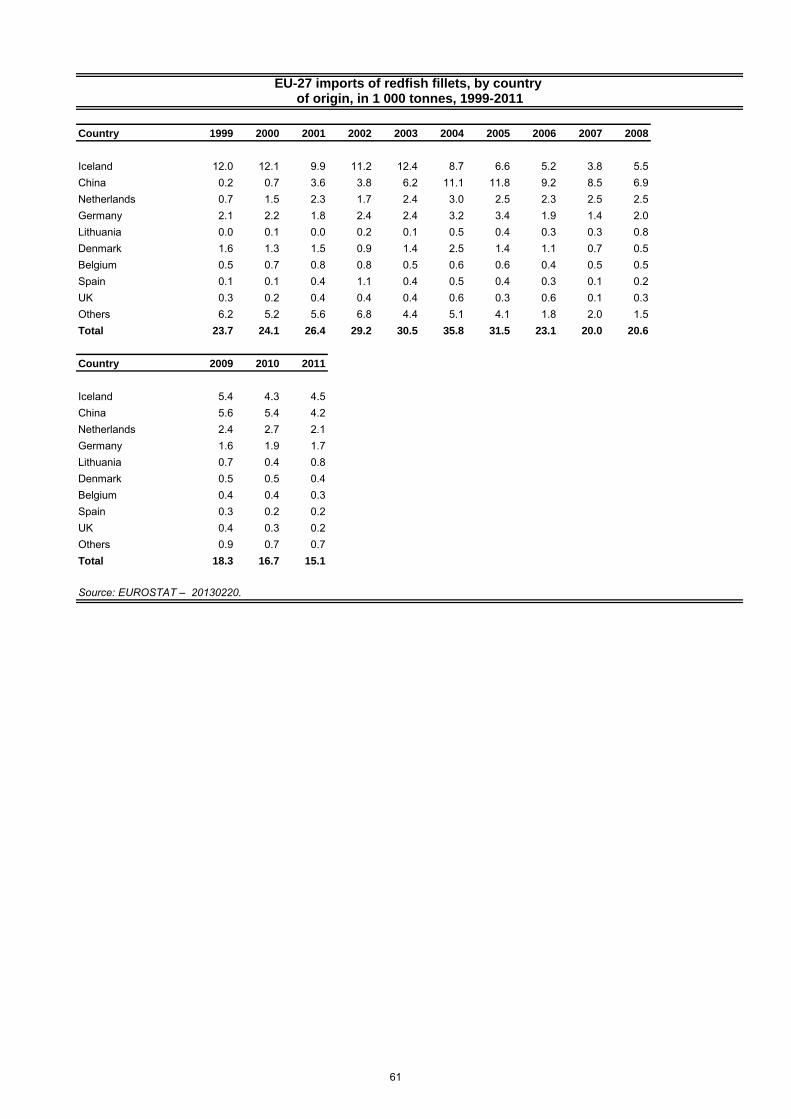
Country 1999 2000 2001 2002 2003 2004 2005 2006 2007 2008
Iceland 12.0 12.1 9.9 11.2 12.4 8.7 6.6 5.2 3.8 5.5China 0.2 0.7 3.6 3.8 6.2 11.1 11.8 9.2 8.5 6.9Netherlands 0.7 1.5 2.3 1.7 2.4 3.0 2.5 2.3 2.5 2.5Germany 2.1 2.2 1.8 2.4 2.4 3.2 3.4 1.9 1.4 2.0Lithuania 0.0 0.1 0.0 0.2 0.1 0.5 0.4 0.3 0.3 0.8Denmark 1.6 1.3 1.5 0.9 1.4 2.5 1.4 1.1 0.7 0.5Belgium 0.5 0.7 0.8 0.8 0.5 0.6 0.6 0.4 0.5 0.5Spain 0.1 0.1 0.4 1.1 0.4 0.5 0.4 0.3 0.1 0.2UK 0.3 0.2 0.4 0.4 0.4 0.6 0.3 0.6 0.1 0.3Others 6.2 5.2 5.6 6.8 4.4 5.1 4.1 1.8 2.0 1.5Total 23.7 24.1 26.4 29.2 30.5 35.8 31.5 23.1 20.0 20.6
Country 2009 2010 2011
Iceland 5.4 4.3 4.5China 5.6 5.4 4.2Netherlands 2.4 2.7 2.1Germany 1.6 1.9 1.7Lithuania 0.7 0.4 0.8Denmark 0.5 0.5 0.4Belgium 0.4 0.4 0.3Spain 0.3 0.2 0.2UK 0.4 0.3 0.2Others 0.9 0.7 0.7Total 18.3 16.7 15.1
Source: EUROSTAT – 20130220.
of origin, in 1 000 tonnes, 1999-2011EU-27 imports of redfish fillets, by country
61
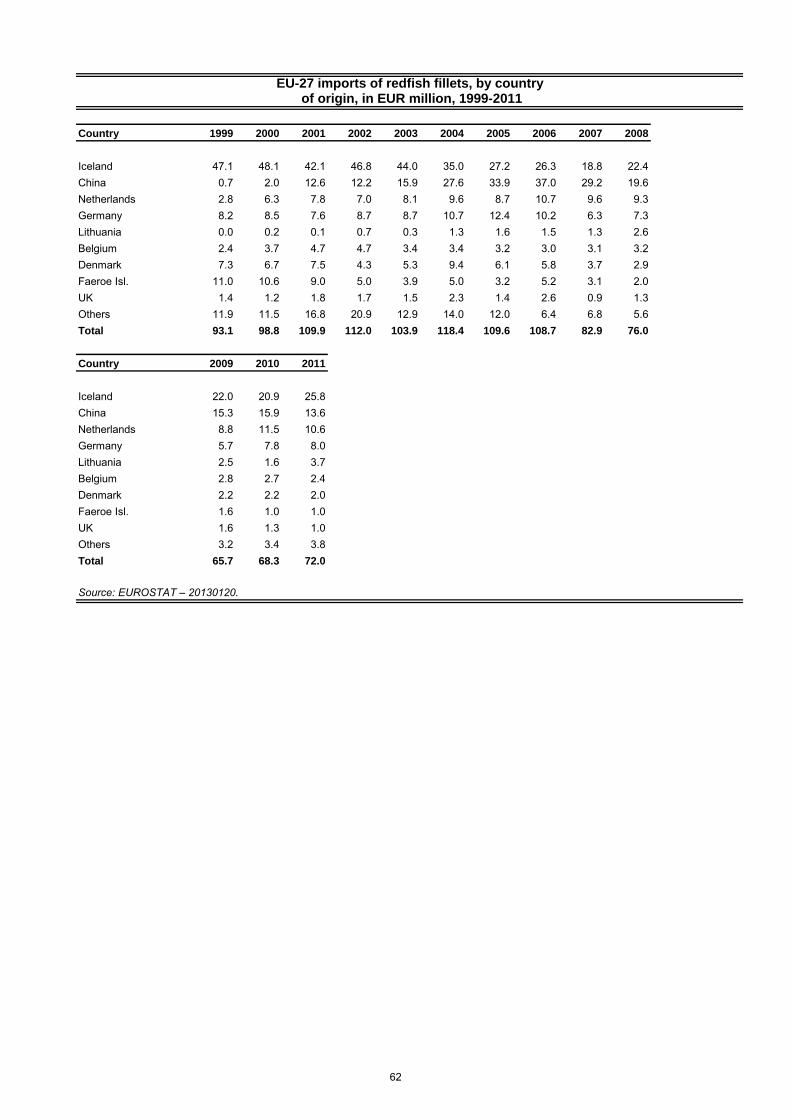
Country 1999 2000 2001 2002 2003 2004 2005 2006 2007 2008
Iceland 47.1 48.1 42.1 46.8 44.0 35.0 27.2 26.3 18.8 22.4China 0.7 2.0 12.6 12.2 15.9 27.6 33.9 37.0 29.2 19.6Netherlands 2.8 6.3 7.8 7.0 8.1 9.6 8.7 10.7 9.6 9.3Germany 8.2 8.5 7.6 8.7 8.7 10.7 12.4 10.2 6.3 7.3Lithuania 0.0 0.2 0.1 0.7 0.3 1.3 1.6 1.5 1.3 2.6Belgium 2.4 3.7 4.7 4.7 3.4 3.4 3.2 3.0 3.1 3.2Denmark 7.3 6.7 7.5 4.3 5.3 9.4 6.1 5.8 3.7 2.9Faeroe Isl. 11.0 10.6 9.0 5.0 3.9 5.0 3.2 5.2 3.1 2.0UK 1.4 1.2 1.8 1.7 1.5 2.3 1.4 2.6 0.9 1.3Others 11.9 11.5 16.8 20.9 12.9 14.0 12.0 6.4 6.8 5.6Total 93.1 98.8 109.9 112.0 103.9 118.4 109.6 108.7 82.9 76.0
Country 2009 2010 2011
Iceland 22.0 20.9 25.8China 15.3 15.9 13.6Netherlands 8.8 11.5 10.6Germany 5.7 7.8 8.0Lithuania 2.5 1.6 3.7Belgium 2.8 2.7 2.4Denmark 2.2 2.2 2.0Faeroe Isl. 1.6 1.0 1.0UK 1.6 1.3 1.0Others 3.2 3.4 3.8Total 65.7 68.3 72.0
Source: EUROSTAT – 20130120.
EU-27 imports of redfish fillets, by country of origin, in EUR million, 1999-2011
62
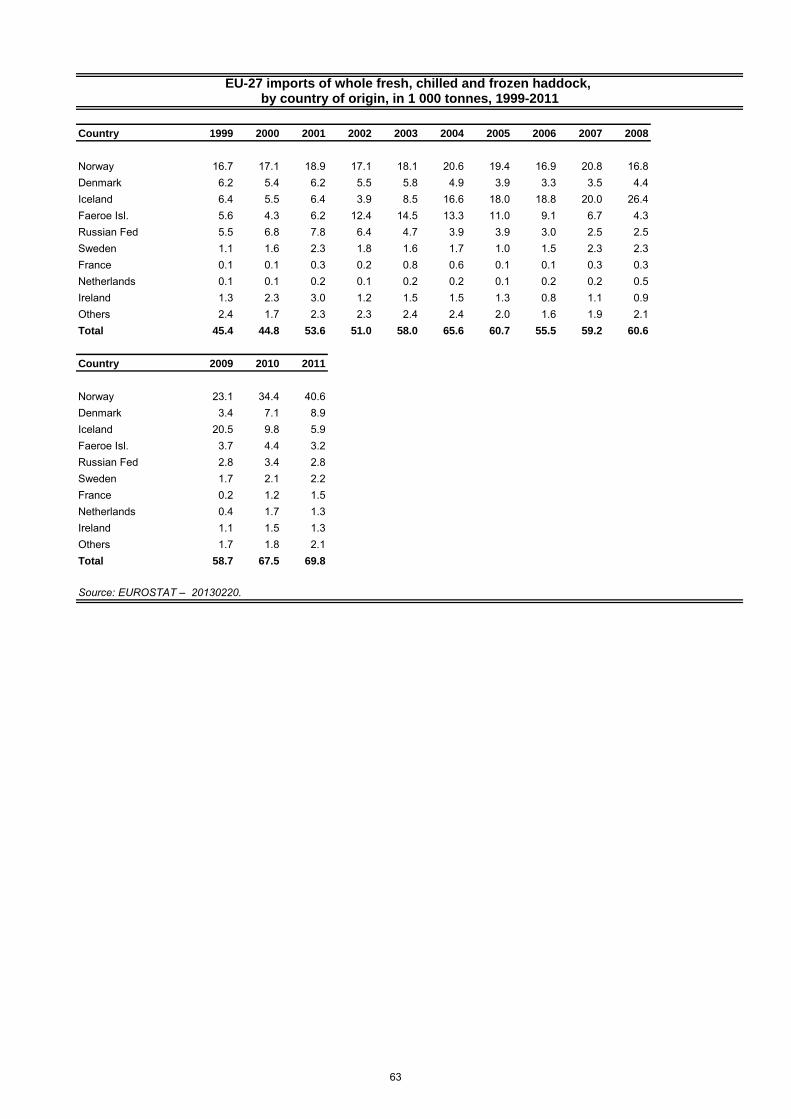
Country 1999 2000 2001 2002 2003 2004 2005 2006 2007 2008
Norway 16.7 17.1 18.9 17.1 18.1 20.6 19.4 16.9 20.8 16.8Denmark 6.2 5.4 6.2 5.5 5.8 4.9 3.9 3.3 3.5 4.4Iceland 6.4 5.5 6.4 3.9 8.5 16.6 18.0 18.8 20.0 26.4Faeroe Isl. 5.6 4.3 6.2 12.4 14.5 13.3 11.0 9.1 6.7 4.3Russian Fed 5.5 6.8 7.8 6.4 4.7 3.9 3.9 3.0 2.5 2.5Sweden 1.1 1.6 2.3 1.8 1.6 1.7 1.0 1.5 2.3 2.3France 0.1 0.1 0.3 0.2 0.8 0.6 0.1 0.1 0.3 0.3Netherlands 0.1 0.1 0.2 0.1 0.2 0.2 0.1 0.2 0.2 0.5Ireland 1.3 2.3 3.0 1.2 1.5 1.5 1.3 0.8 1.1 0.9Others 2.4 1.7 2.3 2.3 2.4 2.4 2.0 1.6 1.9 2.1Total 45.4 44.8 53.6 51.0 58.0 65.6 60.7 55.5 59.2 60.6
Country 2009 2010 2011
Norway 23.1 34.4 40.6Denmark 3.4 7.1 8.9Iceland 20.5 9.8 5.9Faeroe Isl. 3.7 4.4 3.2Russian Fed 2.8 3.4 2.8Sweden 1.7 2.1 2.2France 0.2 1.2 1.5Netherlands 0.4 1.7 1.3Ireland 1.1 1.5 1.3Others 1.7 1.8 2.1Total 58.7 67.5 69.8
Source: EUROSTAT – 20130220.
by country of origin, in 1 000 tonnes, 1999-2011EU-27 imports of whole fresh, chilled and frozen haddock,
63
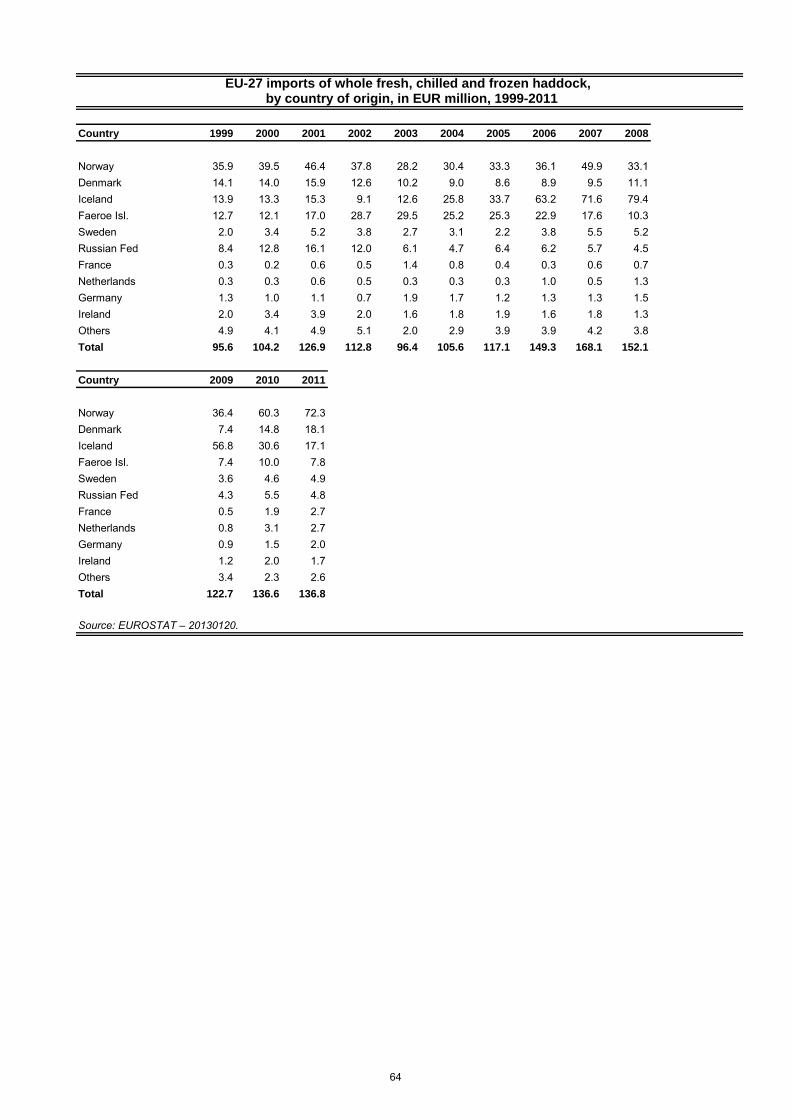
Country 1999 2000 2001 2002 2003 2004 2005 2006 2007 2008
Norway 35.9 39.5 46.4 37.8 28.2 30.4 33.3 36.1 49.9 33.1Denmark 14.1 14.0 15.9 12.6 10.2 9.0 8.6 8.9 9.5 11.1Iceland 13.9 13.3 15.3 9.1 12.6 25.8 33.7 63.2 71.6 79.4Faeroe Isl. 12.7 12.1 17.0 28.7 29.5 25.2 25.3 22.9 17.6 10.3Sweden 2.0 3.4 5.2 3.8 2.7 3.1 2.2 3.8 5.5 5.2Russian Fed 8.4 12.8 16.1 12.0 6.1 4.7 6.4 6.2 5.7 4.5France 0.3 0.2 0.6 0.5 1.4 0.8 0.4 0.3 0.6 0.7Netherlands 0.3 0.3 0.6 0.5 0.3 0.3 0.3 1.0 0.5 1.3Germany 1.3 1.0 1.1 0.7 1.9 1.7 1.2 1.3 1.3 1.5Ireland 2.0 3.4 3.9 2.0 1.6 1.8 1.9 1.6 1.8 1.3Others 4.9 4.1 4.9 5.1 2.0 2.9 3.9 3.9 4.2 3.8Total 95.6 104.2 126.9 112.8 96.4 105.6 117.1 149.3 168.1 152.1
Country 2009 2010 2011
Norway 36.4 60.3 72.3Denmark 7.4 14.8 18.1Iceland 56.8 30.6 17.1Faeroe Isl. 7.4 10.0 7.8Sweden 3.6 4.6 4.9Russian Fed 4.3 5.5 4.8France 0.5 1.9 2.7Netherlands 0.8 3.1 2.7Germany 0.9 1.5 2.0Ireland 1.2 2.0 1.7Others 3.4 2.3 2.6Total 122.7 136.6 136.8
Source: EUROSTAT – 20130120.
by country of origin, in EUR million, 1999-2011EU-27 imports of whole fresh, chilled and frozen haddock,
64
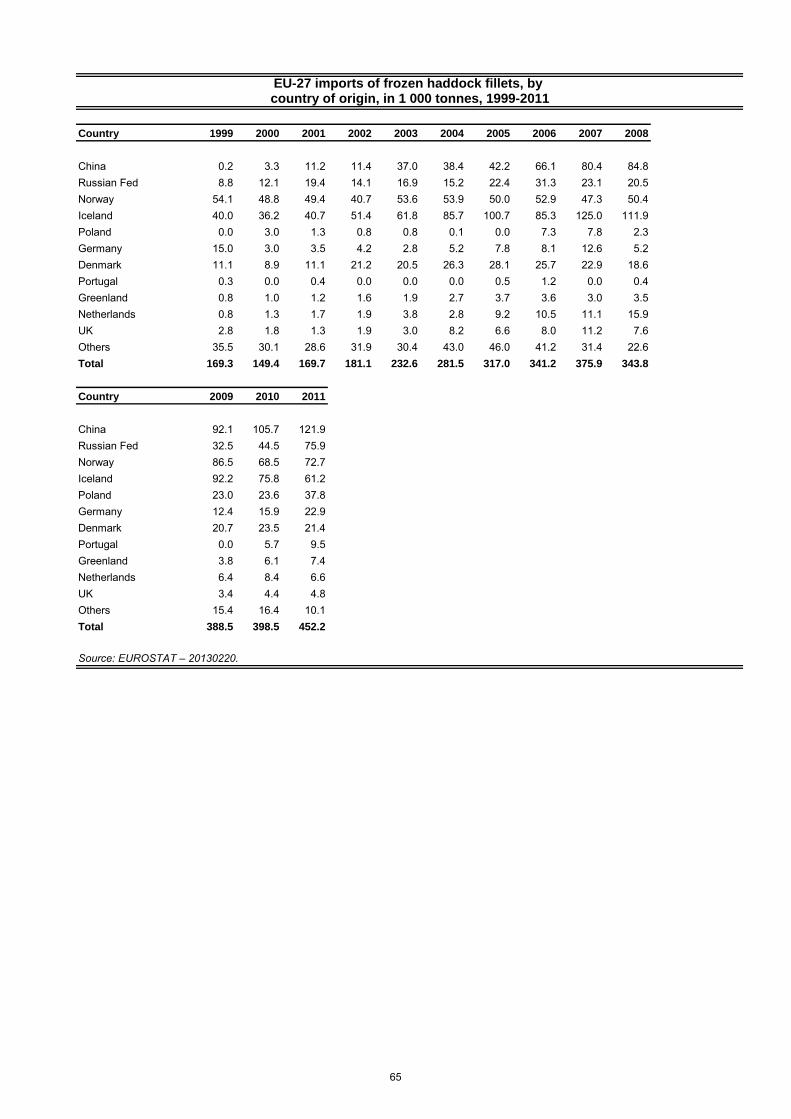
Country 1999 2000 2001 2002 2003 2004 2005 2006 2007 2008
China 0.2 3.3 11.2 11.4 37.0 38.4 42.2 66.1 80.4 84.8Russian Fed 8.8 12.1 19.4 14.1 16.9 15.2 22.4 31.3 23.1 20.5Norway 54.1 48.8 49.4 40.7 53.6 53.9 50.0 52.9 47.3 50.4Iceland 40.0 36.2 40.7 51.4 61.8 85.7 100.7 85.3 125.0 111.9Poland 0.0 3.0 1.3 0.8 0.8 0.1 0.0 7.3 7.8 2.3Germany 15.0 3.0 3.5 4.2 2.8 5.2 7.8 8.1 12.6 5.2Denmark 11.1 8.9 11.1 21.2 20.5 26.3 28.1 25.7 22.9 18.6Portugal 0.3 0.0 0.4 0.0 0.0 0.0 0.5 1.2 0.0 0.4Greenland 0.8 1.0 1.2 1.6 1.9 2.7 3.7 3.6 3.0 3.5Netherlands 0.8 1.3 1.7 1.9 3.8 2.8 9.2 10.5 11.1 15.9UK 2.8 1.8 1.3 1.9 3.0 8.2 6.6 8.0 11.2 7.6Others 35.5 30.1 28.6 31.9 30.4 43.0 46.0 41.2 31.4 22.6Total 169.3 149.4 169.7 181.1 232.6 281.5 317.0 341.2 375.9 343.8
Country 2009 2010 2011
China 92.1 105.7 121.9Russian Fed 32.5 44.5 75.9Norway 86.5 68.5 72.7Iceland 92.2 75.8 61.2Poland 23.0 23.6 37.8Germany 12.4 15.9 22.9Denmark 20.7 23.5 21.4Portugal 0.0 5.7 9.5Greenland 3.8 6.1 7.4Netherlands 6.4 8.4 6.6UK 3.4 4.4 4.8Others 15.4 16.4 10.1Total 388.5 398.5 452.2
Source: EUROSTAT – 20130220.
EU-27 imports of frozen haddock fillets, by country of origin, in 1 000 tonnes, 1999-2011
65
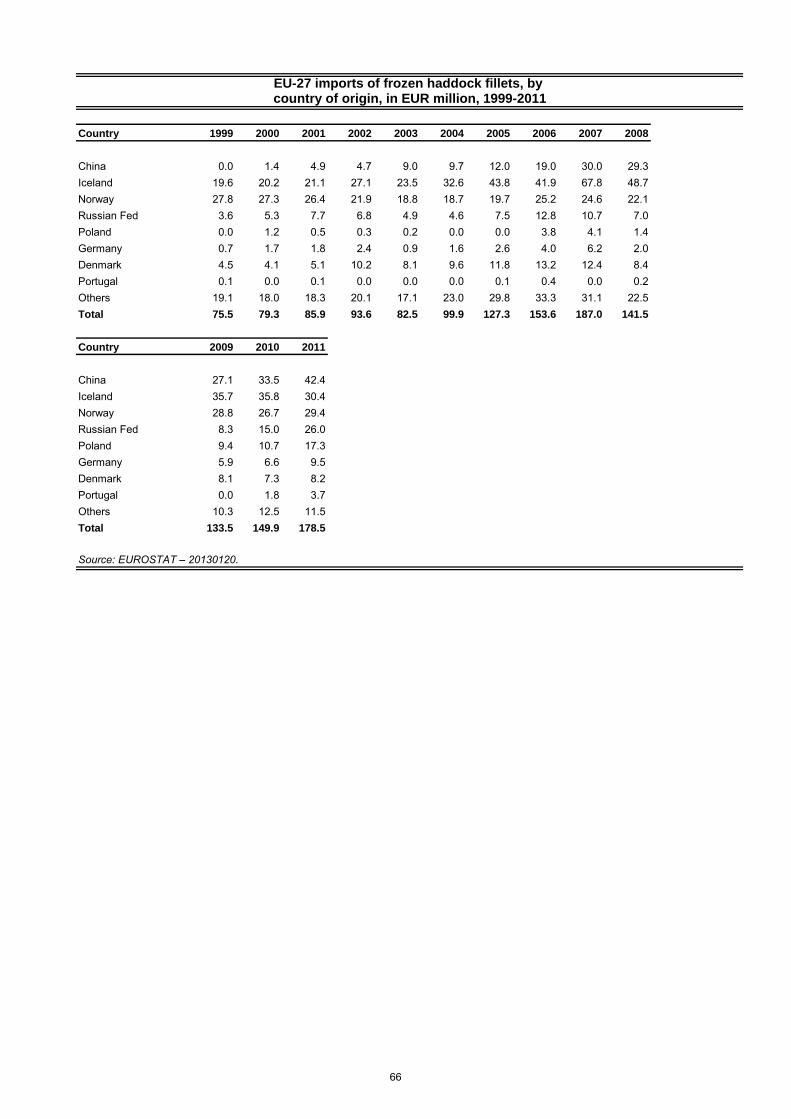
Country 1999 2000 2001 2002 2003 2004 2005 2006 2007 2008
China 0.0 1.4 4.9 4.7 9.0 9.7 12.0 19.0 30.0 29.3Iceland 19.6 20.2 21.1 27.1 23.5 32.6 43.8 41.9 67.8 48.7Norway 27.8 27.3 26.4 21.9 18.8 18.7 19.7 25.2 24.6 22.1Russian Fed 3.6 5.3 7.7 6.8 4.9 4.6 7.5 12.8 10.7 7.0Poland 0.0 1.2 0.5 0.3 0.2 0.0 0.0 3.8 4.1 1.4Germany 0.7 1.7 1.8 2.4 0.9 1.6 2.6 4.0 6.2 2.0Denmark 4.5 4.1 5.1 10.2 8.1 9.6 11.8 13.2 12.4 8.4Portugal 0.1 0.0 0.1 0.0 0.0 0.0 0.1 0.4 0.0 0.2Others 19.1 18.0 18.3 20.1 17.1 23.0 29.8 33.3 31.1 22.5Total 75.5 79.3 85.9 93.6 82.5 99.9 127.3 153.6 187.0 141.5
Country 2009 2010 2011
China 27.1 33.5 42.4Iceland 35.7 35.8 30.4Norway 28.8 26.7 29.4Russian Fed 8.3 15.0 26.0Poland 9.4 10.7 17.3Germany 5.9 6.6 9.5Denmark 8.1 7.3 8.2Portugal 0.0 1.8 3.7Others 10.3 12.5 11.5Total 133.5 149.9 178.5
Source: EUROSTAT – 20130120.
EU-27 imports of frozen haddock fillets, by country of origin, in EUR million, 1999-2011
66
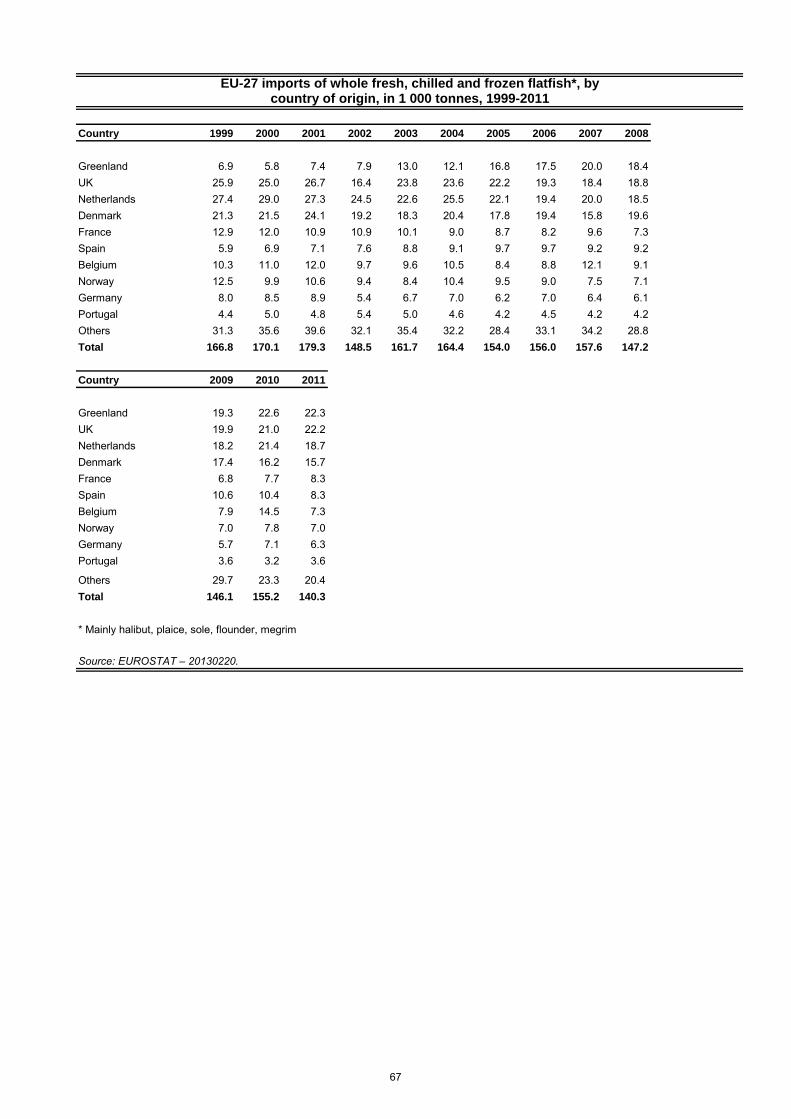
Country 1999 2000 2001 2002 2003 2004 2005 2006 2007 2008
Greenland 6.9 5.8 7.4 7.9 13.0 12.1 16.8 17.5 20.0 18.4UK 25.9 25.0 26.7 16.4 23.8 23.6 22.2 19.3 18.4 18.8Netherlands 27.4 29.0 27.3 24.5 22.6 25.5 22.1 19.4 20.0 18.5Denmark 21.3 21.5 24.1 19.2 18.3 20.4 17.8 19.4 15.8 19.6France 12.9 12.0 10.9 10.9 10.1 9.0 8.7 8.2 9.6 7.3Spain 5.9 6.9 7.1 7.6 8.8 9.1 9.7 9.7 9.2 9.2Belgium 10.3 11.0 12.0 9.7 9.6 10.5 8.4 8.8 12.1 9.1Norway 12.5 9.9 10.6 9.4 8.4 10.4 9.5 9.0 7.5 7.1Germany 8.0 8.5 8.9 5.4 6.7 7.0 6.2 7.0 6.4 6.1Portugal 4.4 5.0 4.8 5.4 5.0 4.6 4.2 4.5 4.2 4.2Others 31.3 35.6 39.6 32.1 35.4 32.2 28.4 33.1 34.2 28.8Total 166.8 170.1 179.3 148.5 161.7 164.4 154.0 156.0 157.6 147.2
Country 2009 2010 2011
Greenland 19.3 22.6 22.3UK 19.9 21.0 22.2Netherlands 18.2 21.4 18.7Denmark 17.4 16.2 15.7France 6.8 7.7 8.3Spain 10.6 10.4 8.3Belgium 7.9 14.5 7.3Norway 7.0 7.8 7.0Germany 5.7 7.1 6.3Portugal 3.6 3.2 3.6
Others 29.7 23.3 20.4Total 146.1 155.2 140.3
* Mainly halibut, plaice, sole, flounder, megrim
Source: EUROSTAT – 20130220.
country of origin, in 1 000 tonnes, 1999-2011EU-27 imports of whole fresh, chilled and frozen flatfish*, by
67
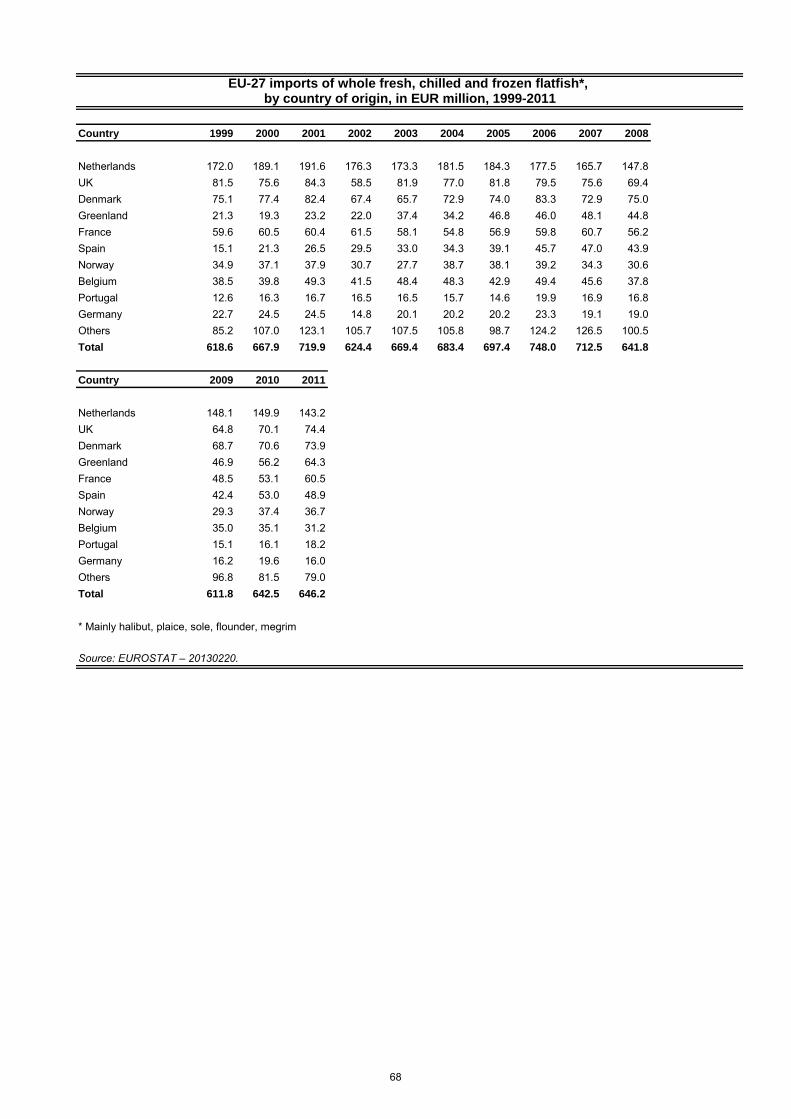
Country 1999 2000 2001 2002 2003 2004 2005 2006 2007 2008
Netherlands 172.0 189.1 191.6 176.3 173.3 181.5 184.3 177.5 165.7 147.8UK 81.5 75.6 84.3 58.5 81.9 77.0 81.8 79.5 75.6 69.4Denmark 75.1 77.4 82.4 67.4 65.7 72.9 74.0 83.3 72.9 75.0Greenland 21.3 19.3 23.2 22.0 37.4 34.2 46.8 46.0 48.1 44.8France 59.6 60.5 60.4 61.5 58.1 54.8 56.9 59.8 60.7 56.2Spain 15.1 21.3 26.5 29.5 33.0 34.3 39.1 45.7 47.0 43.9Norway 34.9 37.1 37.9 30.7 27.7 38.7 38.1 39.2 34.3 30.6Belgium 38.5 39.8 49.3 41.5 48.4 48.3 42.9 49.4 45.6 37.8Portugal 12.6 16.3 16.7 16.5 16.5 15.7 14.6 19.9 16.9 16.8Germany 22.7 24.5 24.5 14.8 20.1 20.2 20.2 23.3 19.1 19.0Others 85.2 107.0 123.1 105.7 107.5 105.8 98.7 124.2 126.5 100.5Total 618.6 667.9 719.9 624.4 669.4 683.4 697.4 748.0 712.5 641.8
Country 2009 2010 2011
Netherlands 148.1 149.9 143.2UK 64.8 70.1 74.4Denmark 68.7 70.6 73.9Greenland 46.9 56.2 64.3France 48.5 53.1 60.5Spain 42.4 53.0 48.9Norway 29.3 37.4 36.7Belgium 35.0 35.1 31.2Portugal 15.1 16.1 18.2Germany 16.2 19.6 16.0Others 96.8 81.5 79.0Total 611.8 642.5 646.2
* Mainly halibut, plaice, sole, flounder, megrim
Source: EUROSTAT – 20130220.
EU-27 imports of whole fresh, chilled and frozen flatfish*, by country of origin, in EUR million, 1999-2011
68
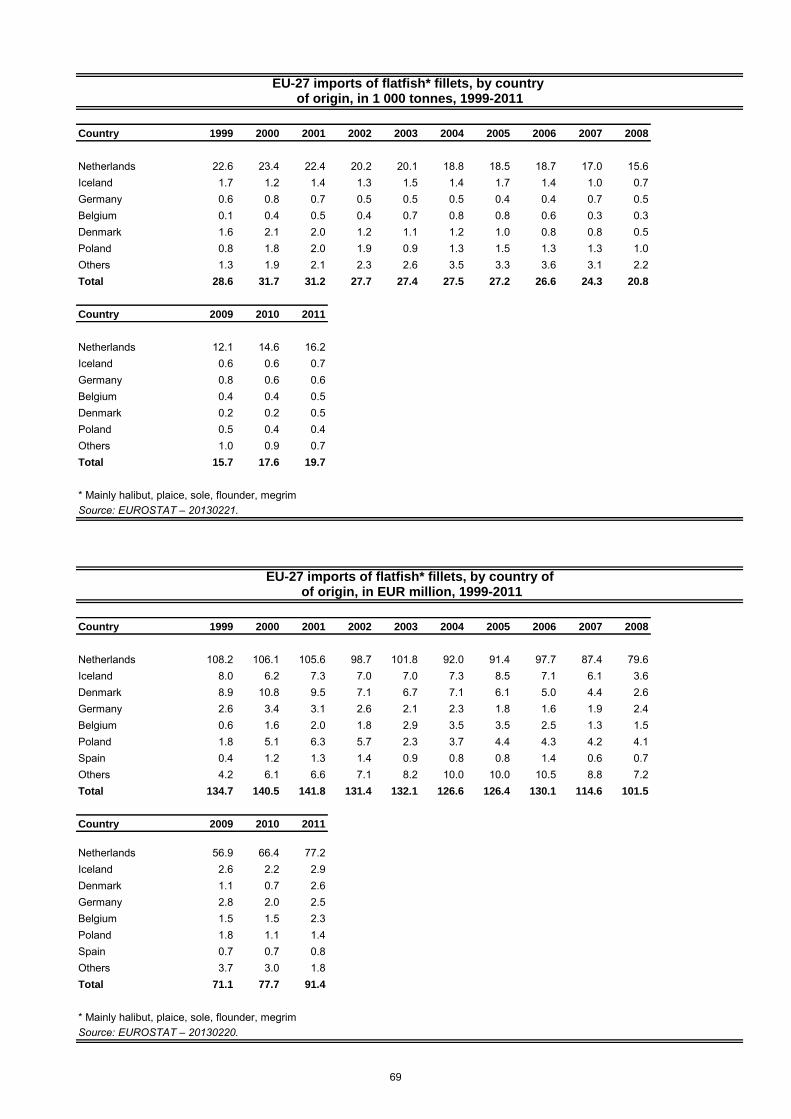
Country 1999 2000 2001 2002 2003 2004 2005 2006 2007 2008
Netherlands 22.6 23.4 22.4 20.2 20.1 18.8 18.5 18.7 17.0 15.6Iceland 1.7 1.2 1.4 1.3 1.5 1.4 1.7 1.4 1.0 0.7Germany 0.6 0.8 0.7 0.5 0.5 0.5 0.4 0.4 0.7 0.5Belgium 0.1 0.4 0.5 0.4 0.7 0.8 0.8 0.6 0.3 0.3Denmark 1.6 2.1 2.0 1.2 1.1 1.2 1.0 0.8 0.8 0.5Poland 0.8 1.8 2.0 1.9 0.9 1.3 1.5 1.3 1.3 1.0Others 1.3 1.9 2.1 2.3 2.6 3.5 3.3 3.6 3.1 2.2Total 28.6 31.7 31.2 27.7 27.4 27.5 27.2 26.6 24.3 20.8
Country 2009 2010 2011
Netherlands 12.1 14.6 16.2Iceland 0.6 0.6 0.7Germany 0.8 0.6 0.6Belgium 0.4 0.4 0.5Denmark 0.2 0.2 0.5Poland 0.5 0.4 0.4Others 1.0 0.9 0.7Total 15.7 17.6 19.7
* Mainly halibut, plaice, sole, flounder, megrimSource: EUROSTAT – 20130221.
Country 1999 2000 2001 2002 2003 2004 2005 2006 2007 2008
Netherlands 108.2 106.1 105.6 98.7 101.8 92.0 91.4 97.7 87.4 79.6Iceland 8.0 6.2 7.3 7.0 7.0 7.3 8.5 7.1 6.1 3.6Denmark 8.9 10.8 9.5 7.1 6.7 7.1 6.1 5.0 4.4 2.6Germany 2.6 3.4 3.1 2.6 2.1 2.3 1.8 1.6 1.9 2.4Belgium 0.6 1.6 2.0 1.8 2.9 3.5 3.5 2.5 1.3 1.5Poland 1.8 5.1 6.3 5.7 2.3 3.7 4.4 4.3 4.2 4.1Spain 0.4 1.2 1.3 1.4 0.9 0.8 0.8 1.4 0.6 0.7Others 4.2 6.1 6.6 7.1 8.2 10.0 10.0 10.5 8.8 7.2Total 134.7 140.5 141.8 131.4 132.1 126.6 126.4 130.1 114.6 101.5
Country 2009 2010 2011
Netherlands 56.9 66.4 77.2Iceland 2.6 2.2 2.9Denmark 1.1 0.7 2.6Germany 2.8 2.0 2.5Belgium 1.5 1.5 2.3Poland 1.8 1.1 1.4Spain 0.7 0.7 0.8Others 3.7 3.0 1.8Total 71.1 77.7 91.4
* Mainly halibut, plaice, sole, flounder, megrimSource: EUROSTAT – 20130220.
EU-27 imports of flatfish* fillets, by country of of origin, in EUR million, 1999-2011
EU-27 imports of flatfish* fillets, by country of origin, in 1 000 tonnes, 1999-2011
69
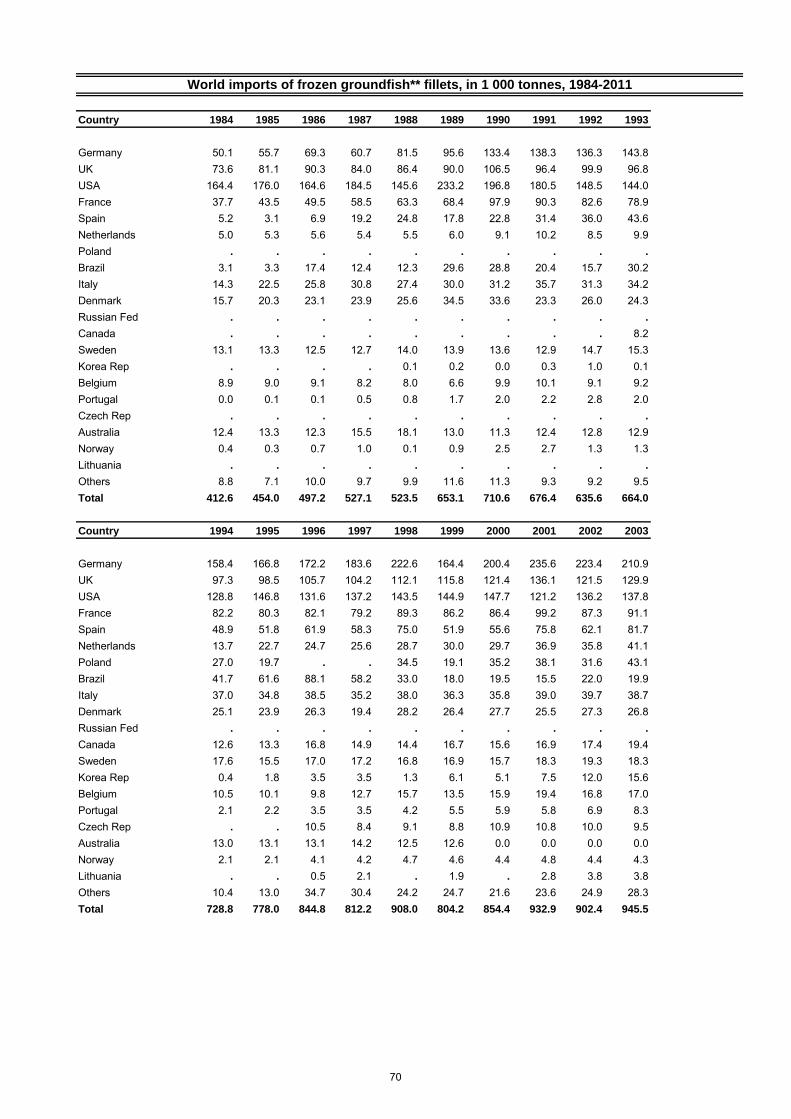
Country 1984 1985 1986 1987 1988 1989 1990 1991 1992 1993
Germany 50.1 55.7 69.3 60.7 81.5 95.6 133.4 138.3 136.3 143.8UK 73.6 81.1 90.3 84.0 86.4 90.0 106.5 96.4 99.9 96.8USA 164.4 176.0 164.6 184.5 145.6 233.2 196.8 180.5 148.5 144.0France 37.7 43.5 49.5 58.5 63.3 68.4 97.9 90.3 82.6 78.9Spain 5.2 3.1 6.9 19.2 24.8 17.8 22.8 31.4 36.0 43.6Netherlands 5.0 5.3 5.6 5.4 5.5 6.0 9.1 10.2 8.5 9.9Poland . . . . . . . . . .
Brazil 3.1 3.3 17.4 12.4 12.3 29.6 28.8 20.4 15.7 30.2Italy 14.3 22.5 25.8 30.8 27.4 30.0 31.2 35.7 31.3 34.2Denmark 15.7 20.3 23.1 23.9 25.6 34.5 33.6 23.3 26.0 24.3Russian Fed . . . . . . . . . .
Canada . . . . . . . . . 8.2Sweden 13.1 13.3 12.5 12.7 14.0 13.9 13.6 12.9 14.7 15.3Korea Rep . . . . 0.1 0.2 0.0 0.3 1.0 0.1Belgium 8.9 9.0 9.1 8.2 8.0 6.6 9.9 10.1 9.1 9.2Portugal 0.0 0.1 0.1 0.5 0.8 1.7 2.0 2.2 2.8 2.0Czech Rep . . . . . . . . . .
Australia 12.4 13.3 12.3 15.5 18.1 13.0 11.3 12.4 12.8 12.9Norway 0.4 0.3 0.7 1.0 0.1 0.9 2.5 2.7 1.3 1.3Lithuania . . . . . . . . . .
Others 8.8 7.1 10.0 9.7 9.9 11.6 11.3 9.3 9.2 9.5Total 412.6 454.0 497.2 527.1 523.5 653.1 710.6 676.4 635.6 664.0
Country 1994 1995 1996 1997 1998 1999 2000 2001 2002 2003
Germany 158.4 166.8 172.2 183.6 222.6 164.4 200.4 235.6 223.4 210.9UK 97.3 98.5 105.7 104.2 112.1 115.8 121.4 136.1 121.5 129.9USA 128.8 146.8 131.6 137.2 143.5 144.9 147.7 121.2 136.2 137.8France 82.2 80.3 82.1 79.2 89.3 86.2 86.4 99.2 87.3 91.1Spain 48.9 51.8 61.9 58.3 75.0 51.9 55.6 75.8 62.1 81.7Netherlands 13.7 22.7 24.7 25.6 28.7 30.0 29.7 36.9 35.8 41.1Poland 27.0 19.7 . . 34.5 19.1 35.2 38.1 31.6 43.1Brazil 41.7 61.6 88.1 58.2 33.0 18.0 19.5 15.5 22.0 19.9Italy 37.0 34.8 38.5 35.2 38.0 36.3 35.8 39.0 39.7 38.7Denmark 25.1 23.9 26.3 19.4 28.2 26.4 27.7 25.5 27.3 26.8Russian Fed . . . . . . . . . .
Canada 12.6 13.3 16.8 14.9 14.4 16.7 15.6 16.9 17.4 19.4Sweden 17.6 15.5 17.0 17.2 16.8 16.9 15.7 18.3 19.3 18.3Korea Rep 0.4 1.8 3.5 3.5 1.3 6.1 5.1 7.5 12.0 15.6Belgium 10.5 10.1 9.8 12.7 15.7 13.5 15.9 19.4 16.8 17.0Portugal 2.1 2.2 3.5 3.5 4.2 5.5 5.9 5.8 6.9 8.3Czech Rep . . 10.5 8.4 9.1 8.8 10.9 10.8 10.0 9.5Australia 13.0 13.1 13.1 14.2 12.5 12.6 0.0 0.0 0.0 0.0Norway 2.1 2.1 4.1 4.2 4.7 4.6 4.4 4.8 4.4 4.3Lithuania . . 0.5 2.1 . 1.9 . 2.8 3.8 3.8Others 10.4 13.0 34.7 30.4 24.2 24.7 21.6 23.6 24.9 28.3Total 728.8 778.0 844.8 812.2 908.0 804.2 854.4 932.9 902.4 945.5
World imports of frozen groundfish** fillets, in 1 000 tonnes, 1984-2011
70
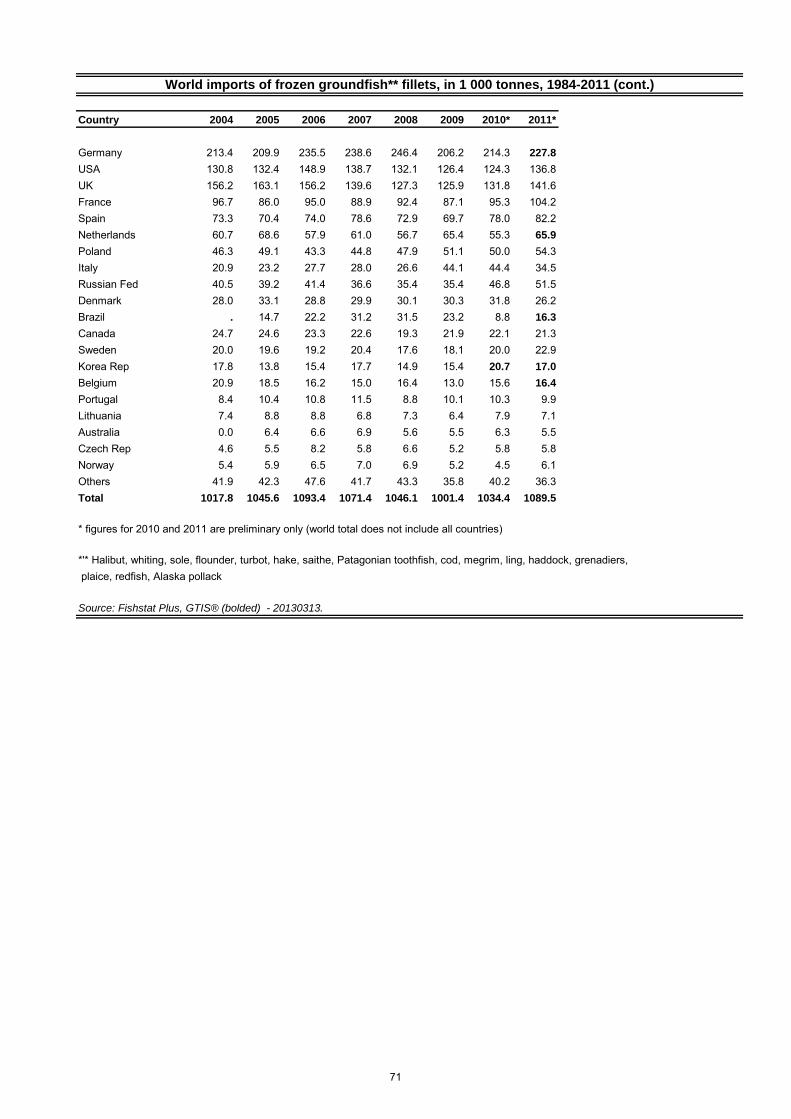
Country 2004 2005 2006 2007 2008 2009 2010* 2011*
Germany 213.4 209.9 235.5 238.6 246.4 206.2 214.3 227.8
USA 130.8 132.4 148.9 138.7 132.1 126.4 124.3 136.8UK 156.2 163.1 156.2 139.6 127.3 125.9 131.8 141.6France 96.7 86.0 95.0 88.9 92.4 87.1 95.3 104.2Spain 73.3 70.4 74.0 78.6 72.9 69.7 78.0 82.2Netherlands 60.7 68.6 57.9 61.0 56.7 65.4 55.3 65.9
Poland 46.3 49.1 43.3 44.8 47.9 51.1 50.0 54.3Italy 20.9 23.2 27.7 28.0 26.6 44.1 44.4 34.5Russian Fed 40.5 39.2 41.4 36.6 35.4 35.4 46.8 51.5Denmark 28.0 33.1 28.8 29.9 30.1 30.3 31.8 26.2Brazil . 14.7 22.2 31.2 31.5 23.2 8.8 16.3
Canada 24.7 24.6 23.3 22.6 19.3 21.9 22.1 21.3Sweden 20.0 19.6 19.2 20.4 17.6 18.1 20.0 22.9Korea Rep 17.8 13.8 15.4 17.7 14.9 15.4 20.7 17.0
Belgium 20.9 18.5 16.2 15.0 16.4 13.0 15.6 16.4
Portugal 8.4 10.4 10.8 11.5 8.8 10.1 10.3 9.9Lithuania 7.4 8.8 8.8 6.8 7.3 6.4 7.9 7.1Australia 0.0 6.4 6.6 6.9 5.6 5.5 6.3 5.5Czech Rep 4.6 5.5 8.2 5.8 6.6 5.2 5.8 5.8Norway 5.4 5.9 6.5 7.0 6.9 5.2 4.5 6.1Others 41.9 42.3 47.6 41.7 43.3 35.8 40.2 36.3Total 1017.8 1045.6 1093.4 1071.4 1046.1 1001.4 1034.4 1089.5
* figures for 2010 and 2011 are preliminary only (world total does not include all countries)
*'* Halibut, whiting, sole, flounder, turbot, hake, saithe, Patagonian toothfish, cod, megrim, ling, haddock, grenadiers, plaice, redfish, Alaska pollack
Source: Fishstat Plus, GTIS® (bolded) - 20130313.
World imports of frozen groundfish** fillets, in 1 000 tonnes, 1984-2011 (cont.)
71
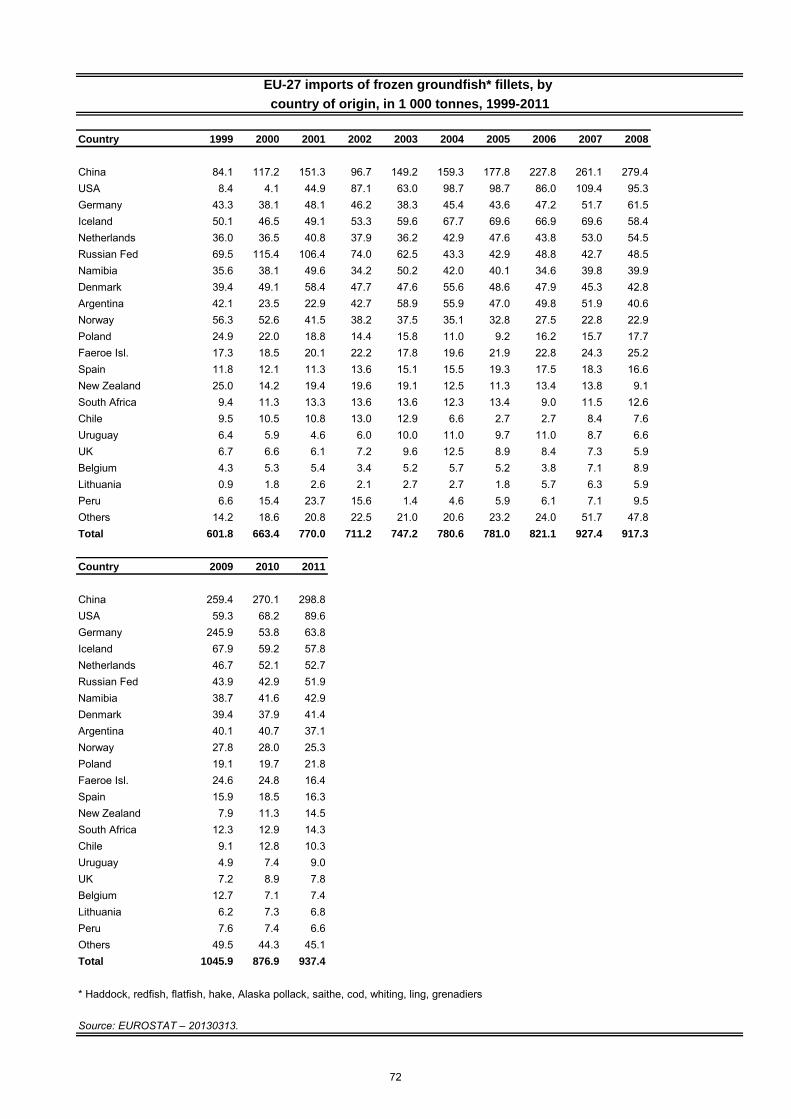
Country 1999 2000 2001 2002 2003 2004 2005 2006 2007 2008
China 84.1 117.2 151.3 96.7 149.2 159.3 177.8 227.8 261.1 279.4USA 8.4 4.1 44.9 87.1 63.0 98.7 98.7 86.0 109.4 95.3Germany 43.3 38.1 48.1 46.2 38.3 45.4 43.6 47.2 51.7 61.5Iceland 50.1 46.5 49.1 53.3 59.6 67.7 69.6 66.9 69.6 58.4Netherlands 36.0 36.5 40.8 37.9 36.2 42.9 47.6 43.8 53.0 54.5Russian Fed 69.5 115.4 106.4 74.0 62.5 43.3 42.9 48.8 42.7 48.5Namibia 35.6 38.1 49.6 34.2 50.2 42.0 40.1 34.6 39.8 39.9Denmark 39.4 49.1 58.4 47.7 47.6 55.6 48.6 47.9 45.3 42.8Argentina 42.1 23.5 22.9 42.7 58.9 55.9 47.0 49.8 51.9 40.6Norway 56.3 52.6 41.5 38.2 37.5 35.1 32.8 27.5 22.8 22.9Poland 24.9 22.0 18.8 14.4 15.8 11.0 9.2 16.2 15.7 17.7Faeroe Isl. 17.3 18.5 20.1 22.2 17.8 19.6 21.9 22.8 24.3 25.2Spain 11.8 12.1 11.3 13.6 15.1 15.5 19.3 17.5 18.3 16.6New Zealand 25.0 14.2 19.4 19.6 19.1 12.5 11.3 13.4 13.8 9.1South Africa 9.4 11.3 13.3 13.6 13.6 12.3 13.4 9.0 11.5 12.6Chile 9.5 10.5 10.8 13.0 12.9 6.6 2.7 2.7 8.4 7.6Uruguay 6.4 5.9 4.6 6.0 10.0 11.0 9.7 11.0 8.7 6.6UK 6.7 6.6 6.1 7.2 9.6 12.5 8.9 8.4 7.3 5.9Belgium 4.3 5.3 5.4 3.4 5.2 5.7 5.2 3.8 7.1 8.9Lithuania 0.9 1.8 2.6 2.1 2.7 2.7 1.8 5.7 6.3 5.9Peru 6.6 15.4 23.7 15.6 1.4 4.6 5.9 6.1 7.1 9.5Others 14.2 18.6 20.8 22.5 21.0 20.6 23.2 24.0 51.7 47.8Total 601.8 663.4 770.0 711.2 747.2 780.6 781.0 821.1 927.4 917.3
Country 2009 2010 2011
China 259.4 270.1 298.8USA 59.3 68.2 89.6Germany 245.9 53.8 63.8Iceland 67.9 59.2 57.8Netherlands 46.7 52.1 52.7Russian Fed 43.9 42.9 51.9Namibia 38.7 41.6 42.9Denmark 39.4 37.9 41.4Argentina 40.1 40.7 37.1Norway 27.8 28.0 25.3Poland 19.1 19.7 21.8Faeroe Isl. 24.6 24.8 16.4Spain 15.9 18.5 16.3New Zealand 7.9 11.3 14.5South Africa 12.3 12.9 14.3Chile 9.1 12.8 10.3Uruguay 4.9 7.4 9.0UK 7.2 8.9 7.8Belgium 12.7 7.1 7.4Lithuania 6.2 7.3 6.8Peru 7.6 7.4 6.6Others 49.5 44.3 45.1Total 1045.9 876.9 937.4
* Haddock, redfish, flatfish, hake, Alaska pollack, saithe, cod, whiting, ling, grenadiers
Source: EUROSTAT – 20130313.
country of origin, in 1 000 tonnes, 1999-2011
EU-27 imports of frozen groundfish* fillets, by
72
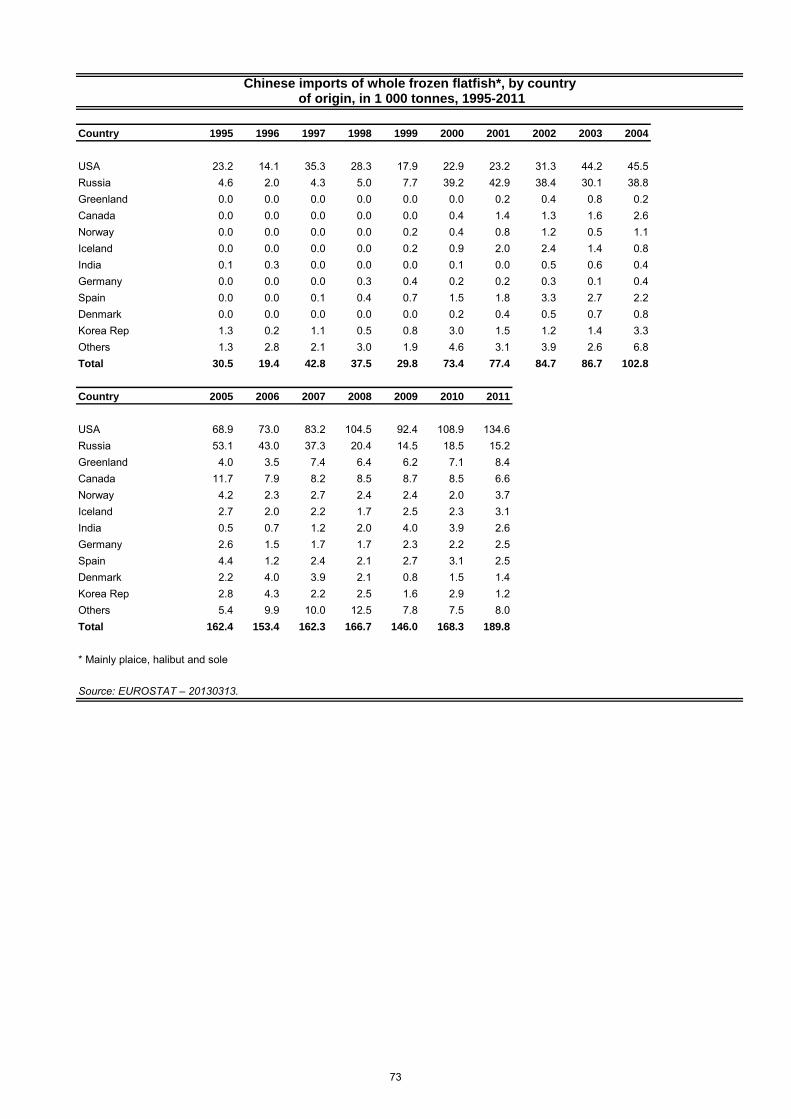
Country 1995 1996 1997 1998 1999 2000 2001 2002 2003 2004
USA 23.2 14.1 35.3 28.3 17.9 22.9 23.2 31.3 44.2 45.5Russia 4.6 2.0 4.3 5.0 7.7 39.2 42.9 38.4 30.1 38.8Greenland 0.0 0.0 0.0 0.0 0.0 0.0 0.2 0.4 0.8 0.2Canada 0.0 0.0 0.0 0.0 0.0 0.4 1.4 1.3 1.6 2.6Norway 0.0 0.0 0.0 0.0 0.2 0.4 0.8 1.2 0.5 1.1Iceland 0.0 0.0 0.0 0.0 0.2 0.9 2.0 2.4 1.4 0.8India 0.1 0.3 0.0 0.0 0.0 0.1 0.0 0.5 0.6 0.4Germany 0.0 0.0 0.0 0.3 0.4 0.2 0.2 0.3 0.1 0.4Spain 0.0 0.0 0.1 0.4 0.7 1.5 1.8 3.3 2.7 2.2Denmark 0.0 0.0 0.0 0.0 0.0 0.2 0.4 0.5 0.7 0.8Korea Rep 1.3 0.2 1.1 0.5 0.8 3.0 1.5 1.2 1.4 3.3Others 1.3 2.8 2.1 3.0 1.9 4.6 3.1 3.9 2.6 6.8Total 30.5 19.4 42.8 37.5 29.8 73.4 77.4 84.7 86.7 102.8
Country 2005 2006 2007 2008 2009 2010 2011
USA 68.9 73.0 83.2 104.5 92.4 108.9 134.6Russia 53.1 43.0 37.3 20.4 14.5 18.5 15.2Greenland 4.0 3.5 7.4 6.4 6.2 7.1 8.4Canada 11.7 7.9 8.2 8.5 8.7 8.5 6.6Norway 4.2 2.3 2.7 2.4 2.4 2.0 3.7Iceland 2.7 2.0 2.2 1.7 2.5 2.3 3.1India 0.5 0.7 1.2 2.0 4.0 3.9 2.6Germany 2.6 1.5 1.7 1.7 2.3 2.2 2.5Spain 4.4 1.2 2.4 2.1 2.7 3.1 2.5Denmark 2.2 4.0 3.9 2.1 0.8 1.5 1.4Korea Rep 2.8 4.3 2.2 2.5 1.6 2.9 1.2Others 5.4 9.9 10.0 12.5 7.8 7.5 8.0Total 162.4 153.4 162.3 166.7 146.0 168.3 189.8
* Mainly plaice, halibut and sole
Source: EUROSTAT – 20130313.
Chinese imports of whole frozen flatfish*, by country of origin, in 1 000 tonnes, 1995-2011
73
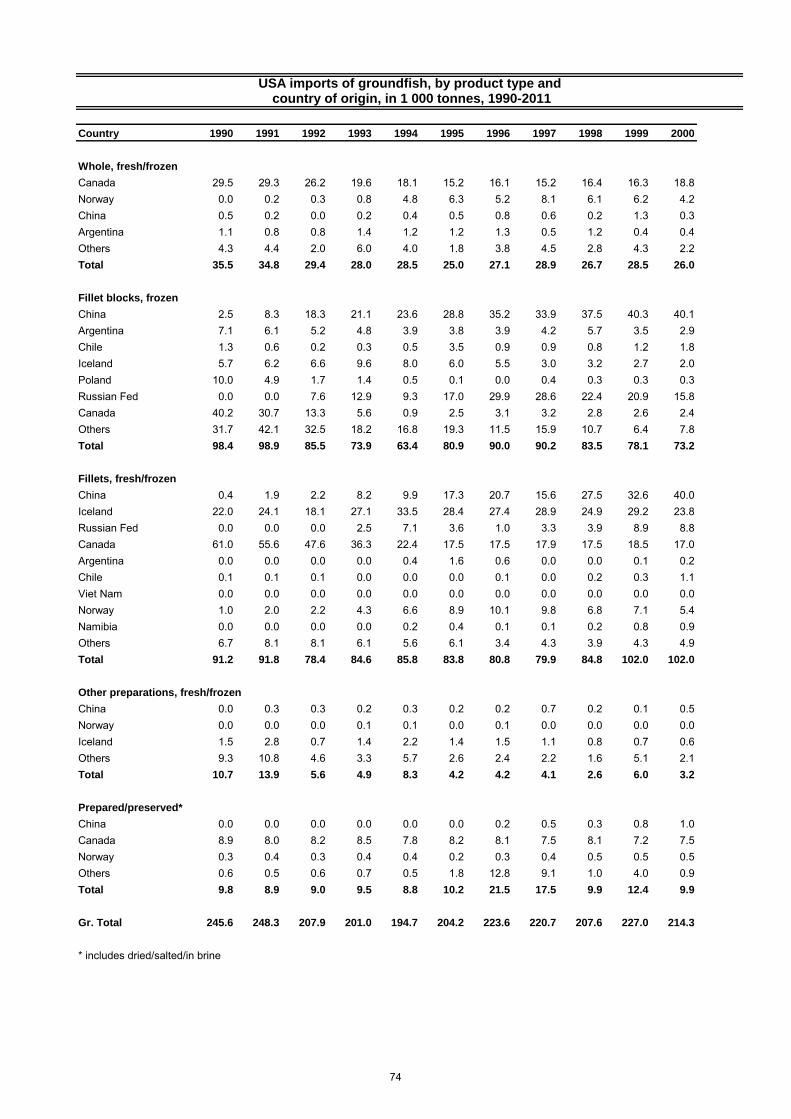
Country 1990 1991 1992 1993 1994 1995 1996 1997 1998 1999 2000
Whole, fresh/frozen
Canada 29.5 29.3 26.2 19.6 18.1 15.2 16.1 15.2 16.4 16.3 18.8Norway 0.0 0.2 0.3 0.8 4.8 6.3 5.2 8.1 6.1 6.2 4.2China 0.5 0.2 0.0 0.2 0.4 0.5 0.8 0.6 0.2 1.3 0.3Argentina 1.1 0.8 0.8 1.4 1.2 1.2 1.3 0.5 1.2 0.4 0.4Others 4.3 4.4 2.0 6.0 4.0 1.8 3.8 4.5 2.8 4.3 2.2Total 35.5 34.8 29.4 28.0 28.5 25.0 27.1 28.9 26.7 28.5 26.0
Fillet blocks, frozen
China 2.5 8.3 18.3 21.1 23.6 28.8 35.2 33.9 37.5 40.3 40.1Argentina 7.1 6.1 5.2 4.8 3.9 3.8 3.9 4.2 5.7 3.5 2.9Chile 1.3 0.6 0.2 0.3 0.5 3.5 0.9 0.9 0.8 1.2 1.8Iceland 5.7 6.2 6.6 9.6 8.0 6.0 5.5 3.0 3.2 2.7 2.0Poland 10.0 4.9 1.7 1.4 0.5 0.1 0.0 0.4 0.3 0.3 0.3Russian Fed 0.0 0.0 7.6 12.9 9.3 17.0 29.9 28.6 22.4 20.9 15.8Canada 40.2 30.7 13.3 5.6 0.9 2.5 3.1 3.2 2.8 2.6 2.4Others 31.7 42.1 32.5 18.2 16.8 19.3 11.5 15.9 10.7 6.4 7.8Total 98.4 98.9 85.5 73.9 63.4 80.9 90.0 90.2 83.5 78.1 73.2
Fillets, fresh/frozen
China 0.4 1.9 2.2 8.2 9.9 17.3 20.7 15.6 27.5 32.6 40.0Iceland 22.0 24.1 18.1 27.1 33.5 28.4 27.4 28.9 24.9 29.2 23.8Russian Fed 0.0 0.0 0.0 2.5 7.1 3.6 1.0 3.3 3.9 8.9 8.8Canada 61.0 55.6 47.6 36.3 22.4 17.5 17.5 17.9 17.5 18.5 17.0Argentina 0.0 0.0 0.0 0.0 0.4 1.6 0.6 0.0 0.0 0.1 0.2Chile 0.1 0.1 0.1 0.0 0.0 0.0 0.1 0.0 0.2 0.3 1.1Viet Nam 0.0 0.0 0.0 0.0 0.0 0.0 0.0 0.0 0.0 0.0 0.0Norway 1.0 2.0 2.2 4.3 6.6 8.9 10.1 9.8 6.8 7.1 5.4Namibia 0.0 0.0 0.0 0.0 0.2 0.4 0.1 0.1 0.2 0.8 0.9Others 6.7 8.1 8.1 6.1 5.6 6.1 3.4 4.3 3.9 4.3 4.9Total 91.2 91.8 78.4 84.6 85.8 83.8 80.8 79.9 84.8 102.0 102.0
Other preparations, fresh/frozen
China 0.0 0.3 0.3 0.2 0.3 0.2 0.2 0.7 0.2 0.1 0.5Norway 0.0 0.0 0.0 0.1 0.1 0.0 0.1 0.0 0.0 0.0 0.0Iceland 1.5 2.8 0.7 1.4 2.2 1.4 1.5 1.1 0.8 0.7 0.6Others 9.3 10.8 4.6 3.3 5.7 2.6 2.4 2.2 1.6 5.1 2.1Total 10.7 13.9 5.6 4.9 8.3 4.2 4.2 4.1 2.6 6.0 3.2
Prepared/preserved*
China 0.0 0.0 0.0 0.0 0.0 0.0 0.2 0.5 0.3 0.8 1.0Canada 8.9 8.0 8.2 8.5 7.8 8.2 8.1 7.5 8.1 7.2 7.5Norway 0.3 0.4 0.3 0.4 0.4 0.2 0.3 0.4 0.5 0.5 0.5Others 0.6 0.5 0.6 0.7 0.5 1.8 12.8 9.1 1.0 4.0 0.9Total 9.8 8.9 9.0 9.5 8.8 10.2 21.5 17.5 9.9 12.4 9.9
Gr. Total 245.6 248.3 207.9 201.0 194.7 204.2 223.6 220.7 207.6 227.0 214.3
* includes dried/salted/in brine
USA imports of groundfish, by product type and country of origin, in 1 000 tonnes, 1990-2011
74
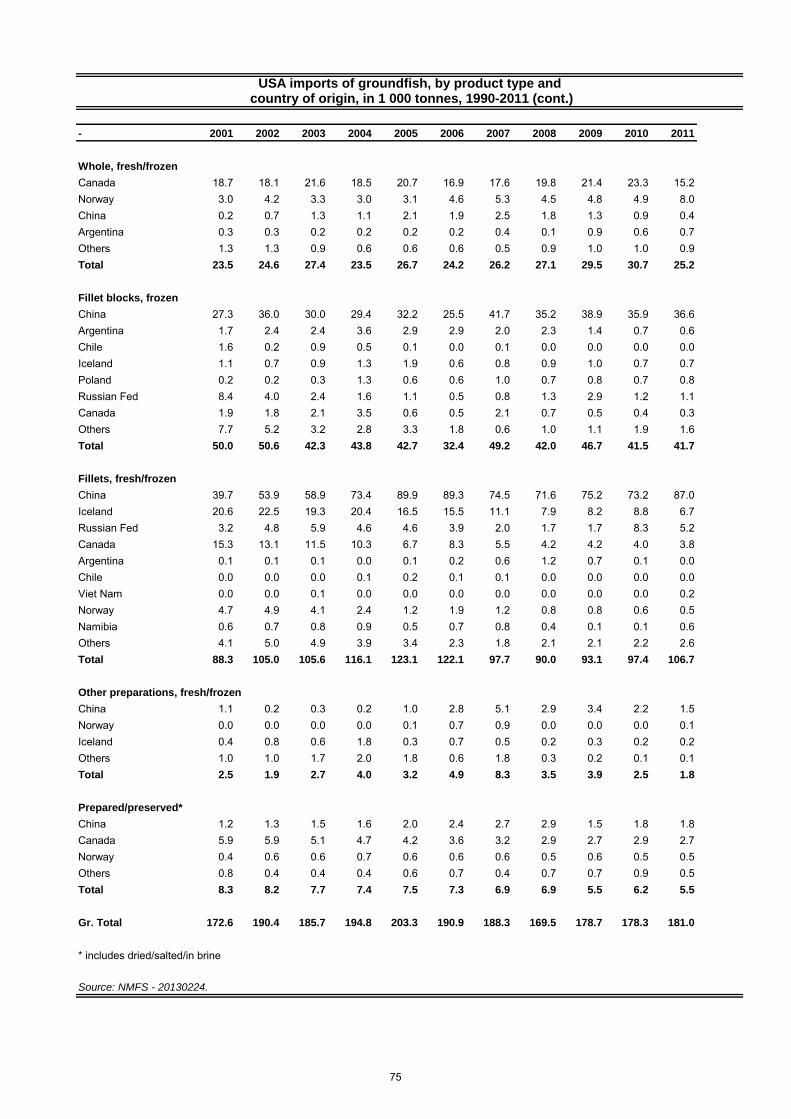
- 2001 2002 2003 2004 2005 2006 2007 2008 2009 2010 2011
Whole, fresh/frozen
Canada 18.7 18.1 21.6 18.5 20.7 16.9 17.6 19.8 21.4 23.3 15.2Norway 3.0 4.2 3.3 3.0 3.1 4.6 5.3 4.5 4.8 4.9 8.0China 0.2 0.7 1.3 1.1 2.1 1.9 2.5 1.8 1.3 0.9 0.4Argentina 0.3 0.3 0.2 0.2 0.2 0.2 0.4 0.1 0.9 0.6 0.7Others 1.3 1.3 0.9 0.6 0.6 0.6 0.5 0.9 1.0 1.0 0.9Total 23.5 24.6 27.4 23.5 26.7 24.2 26.2 27.1 29.5 30.7 25.2
Fillet blocks, frozen
China 27.3 36.0 30.0 29.4 32.2 25.5 41.7 35.2 38.9 35.9 36.6Argentina 1.7 2.4 2.4 3.6 2.9 2.9 2.0 2.3 1.4 0.7 0.6Chile 1.6 0.2 0.9 0.5 0.1 0.0 0.1 0.0 0.0 0.0 0.0Iceland 1.1 0.7 0.9 1.3 1.9 0.6 0.8 0.9 1.0 0.7 0.7Poland 0.2 0.2 0.3 1.3 0.6 0.6 1.0 0.7 0.8 0.7 0.8Russian Fed 8.4 4.0 2.4 1.6 1.1 0.5 0.8 1.3 2.9 1.2 1.1Canada 1.9 1.8 2.1 3.5 0.6 0.5 2.1 0.7 0.5 0.4 0.3Others 7.7 5.2 3.2 2.8 3.3 1.8 0.6 1.0 1.1 1.9 1.6Total 50.0 50.6 42.3 43.8 42.7 32.4 49.2 42.0 46.7 41.5 41.7
Fillets, fresh/frozen
China 39.7 53.9 58.9 73.4 89.9 89.3 74.5 71.6 75.2 73.2 87.0Iceland 20.6 22.5 19.3 20.4 16.5 15.5 11.1 7.9 8.2 8.8 6.7Russian Fed 3.2 4.8 5.9 4.6 4.6 3.9 2.0 1.7 1.7 8.3 5.2Canada 15.3 13.1 11.5 10.3 6.7 8.3 5.5 4.2 4.2 4.0 3.8Argentina 0.1 0.1 0.1 0.0 0.1 0.2 0.6 1.2 0.7 0.1 0.0Chile 0.0 0.0 0.0 0.1 0.2 0.1 0.1 0.0 0.0 0.0 0.0Viet Nam 0.0 0.0 0.1 0.0 0.0 0.0 0.0 0.0 0.0 0.0 0.2Norway 4.7 4.9 4.1 2.4 1.2 1.9 1.2 0.8 0.8 0.6 0.5Namibia 0.6 0.7 0.8 0.9 0.5 0.7 0.8 0.4 0.1 0.1 0.6Others 4.1 5.0 4.9 3.9 3.4 2.3 1.8 2.1 2.1 2.2 2.6Total 88.3 105.0 105.6 116.1 123.1 122.1 97.7 90.0 93.1 97.4 106.7
Other preparations, fresh/frozen
China 1.1 0.2 0.3 0.2 1.0 2.8 5.1 2.9 3.4 2.2 1.5Norway 0.0 0.0 0.0 0.0 0.1 0.7 0.9 0.0 0.0 0.0 0.1Iceland 0.4 0.8 0.6 1.8 0.3 0.7 0.5 0.2 0.3 0.2 0.2Others 1.0 1.0 1.7 2.0 1.8 0.6 1.8 0.3 0.2 0.1 0.1Total 2.5 1.9 2.7 4.0 3.2 4.9 8.3 3.5 3.9 2.5 1.8
Prepared/preserved*
China 1.2 1.3 1.5 1.6 2.0 2.4 2.7 2.9 1.5 1.8 1.8Canada 5.9 5.9 5.1 4.7 4.2 3.6 3.2 2.9 2.7 2.9 2.7Norway 0.4 0.6 0.6 0.7 0.6 0.6 0.6 0.5 0.6 0.5 0.5Others 0.8 0.4 0.4 0.4 0.6 0.7 0.4 0.7 0.7 0.9 0.5Total 8.3 8.2 7.7 7.4 7.5 7.3 6.9 6.9 5.5 6.2 5.5
Gr. Total 172.6 190.4 185.7 194.8 203.3 190.9 188.3 169.5 178.7 178.3 181.0
* includes dried/salted/in brine
Source: NMFS - 20130224.
country of origin, in 1 000 tonnes, 1990-2011 (cont.)USA imports of groundfish, by product type and
75
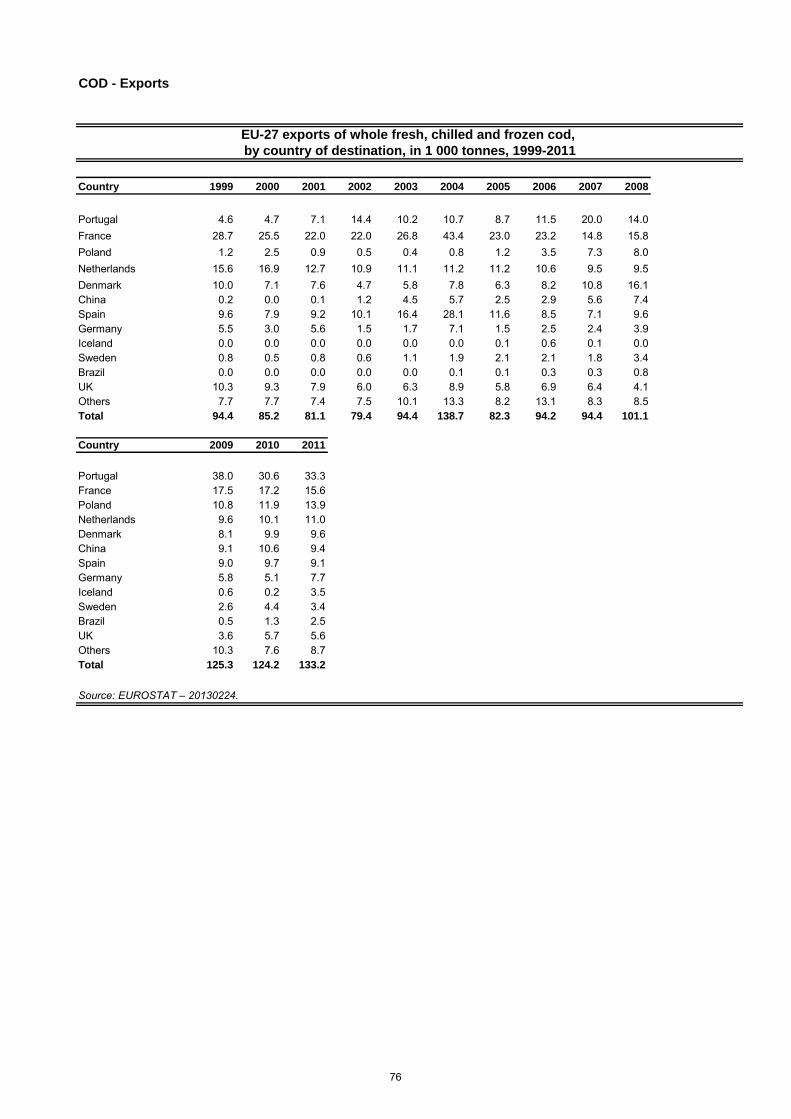
COD - Exports
Country 1999 2000 2001 2002 2003 2004 2005 2006 2007 2008
Portugal 4.6 4.7 7.1 14.4 10.2 10.7 8.7 11.5 20.0 14.0France 28.7 25.5 22.0 22.0 26.8 43.4 23.0 23.2 14.8 15.8Poland 1.2 2.5 0.9 0.5 0.4 0.8 1.2 3.5 7.3 8.0Netherlands 15.6 16.9 12.7 10.9 11.1 11.2 11.2 10.6 9.5 9.5Denmark 10.0 7.1 7.6 4.7 5.8 7.8 6.3 8.2 10.8 16.1China 0.2 0.0 0.1 1.2 4.5 5.7 2.5 2.9 5.6 7.4Spain 9.6 7.9 9.2 10.1 16.4 28.1 11.6 8.5 7.1 9.6Germany 5.5 3.0 5.6 1.5 1.7 7.1 1.5 2.5 2.4 3.9Iceland 0.0 0.0 0.0 0.0 0.0 0.0 0.1 0.6 0.1 0.0Sweden 0.8 0.5 0.8 0.6 1.1 1.9 2.1 2.1 1.8 3.4Brazil 0.0 0.0 0.0 0.0 0.0 0.1 0.1 0.3 0.3 0.8UK 10.3 9.3 7.9 6.0 6.3 8.9 5.8 6.9 6.4 4.1Others 7.7 7.7 7.4 7.5 10.1 13.3 8.2 13.1 8.3 8.5Total 94.4 85.2 81.1 79.4 94.4 138.7 82.3 94.2 94.4 101.1
Country 2009 2010 2011
Portugal 38.0 30.6 33.3France 17.5 17.2 15.6Poland 10.8 11.9 13.9Netherlands 9.6 10.1 11.0Denmark 8.1 9.9 9.6China 9.1 10.6 9.4Spain 9.0 9.7 9.1Germany 5.8 5.1 7.7Iceland 0.6 0.2 3.5Sweden 2.6 4.4 3.4Brazil 0.5 1.3 2.5UK 3.6 5.7 5.6Others 10.3 7.6 8.7Total 125.3 124.2 133.2
Source: EUROSTAT – 20130224.
by country of destination, in 1 000 tonnes, 1999-2011
EU-27 exports of whole fresh, chilled and frozen cod,
76
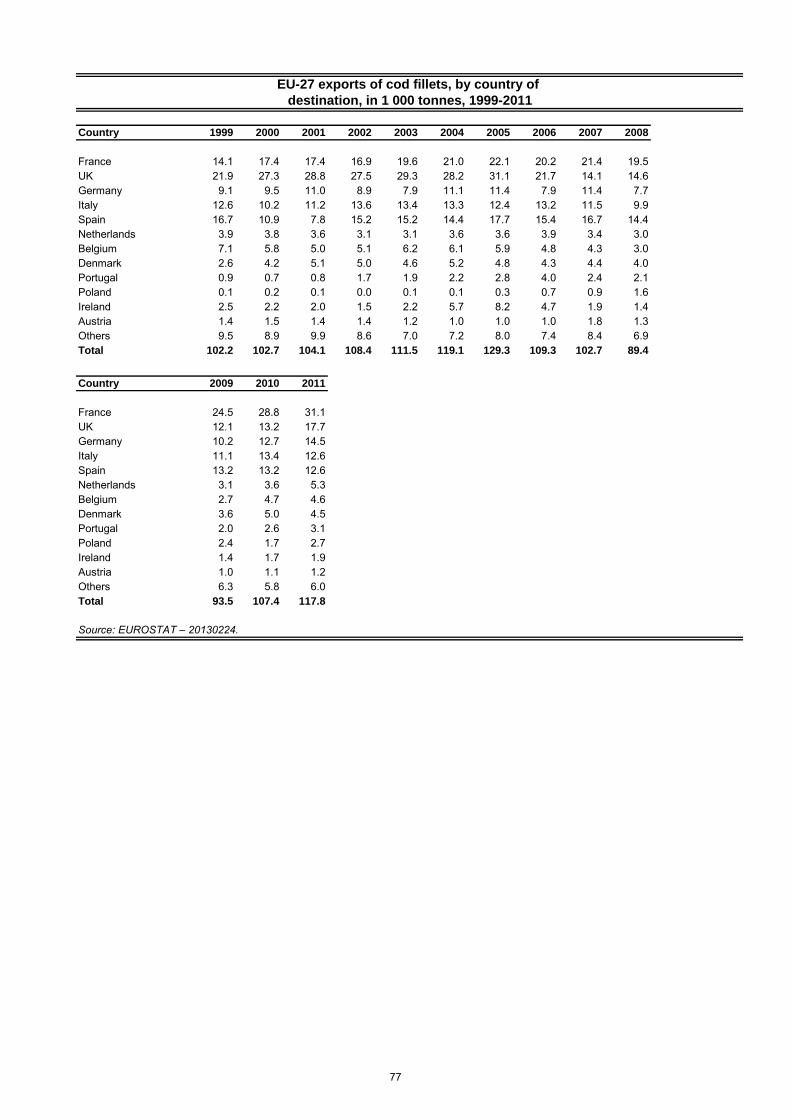
Country 1999 2000 2001 2002 2003 2004 2005 2006 2007 2008
France 14.1 17.4 17.4 16.9 19.6 21.0 22.1 20.2 21.4 19.5UK 21.9 27.3 28.8 27.5 29.3 28.2 31.1 21.7 14.1 14.6Germany 9.1 9.5 11.0 8.9 7.9 11.1 11.4 7.9 11.4 7.7Italy 12.6 10.2 11.2 13.6 13.4 13.3 12.4 13.2 11.5 9.9Spain 16.7 10.9 7.8 15.2 15.2 14.4 17.7 15.4 16.7 14.4Netherlands 3.9 3.8 3.6 3.1 3.1 3.6 3.6 3.9 3.4 3.0Belgium 7.1 5.8 5.0 5.1 6.2 6.1 5.9 4.8 4.3 3.0Denmark 2.6 4.2 5.1 5.0 4.6 5.2 4.8 4.3 4.4 4.0Portugal 0.9 0.7 0.8 1.7 1.9 2.2 2.8 4.0 2.4 2.1Poland 0.1 0.2 0.1 0.0 0.1 0.1 0.3 0.7 0.9 1.6Ireland 2.5 2.2 2.0 1.5 2.2 5.7 8.2 4.7 1.9 1.4Austria 1.4 1.5 1.4 1.4 1.2 1.0 1.0 1.0 1.8 1.3Others 9.5 8.9 9.9 8.6 7.0 7.2 8.0 7.4 8.4 6.9Total 102.2 102.7 104.1 108.4 111.5 119.1 129.3 109.3 102.7 89.4
Country 2009 2010 2011
France 24.5 28.8 31.1UK 12.1 13.2 17.7Germany 10.2 12.7 14.5Italy 11.1 13.4 12.6Spain 13.2 13.2 12.6Netherlands 3.1 3.6 5.3Belgium 2.7 4.7 4.6Denmark 3.6 5.0 4.5Portugal 2.0 2.6 3.1Poland 2.4 1.7 2.7Ireland 1.4 1.7 1.9Austria 1.0 1.1 1.2Others 6.3 5.8 6.0Total 93.5 107.4 117.8
Source: EUROSTAT – 20130224.
destination, in 1 000 tonnes, 1999-2011
EU-27 exports of cod fillets, by country of
77
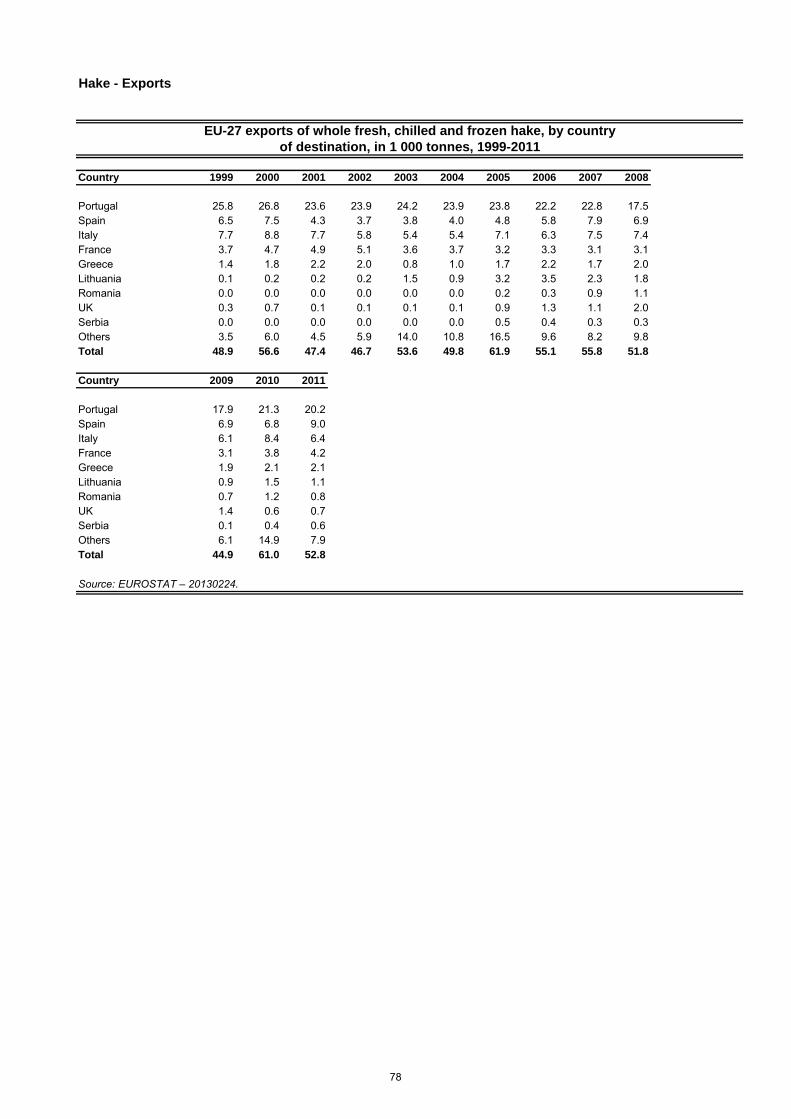
Hake - Exports
Country 1999 2000 2001 2002 2003 2004 2005 2006 2007 2008
Portugal 25.8 26.8 23.6 23.9 24.2 23.9 23.8 22.2 22.8 17.5Spain 6.5 7.5 4.3 3.7 3.8 4.0 4.8 5.8 7.9 6.9Italy 7.7 8.8 7.7 5.8 5.4 5.4 7.1 6.3 7.5 7.4France 3.7 4.7 4.9 5.1 3.6 3.7 3.2 3.3 3.1 3.1Greece 1.4 1.8 2.2 2.0 0.8 1.0 1.7 2.2 1.7 2.0Lithuania 0.1 0.2 0.2 0.2 1.5 0.9 3.2 3.5 2.3 1.8Romania 0.0 0.0 0.0 0.0 0.0 0.0 0.2 0.3 0.9 1.1UK 0.3 0.7 0.1 0.1 0.1 0.1 0.9 1.3 1.1 2.0Serbia 0.0 0.0 0.0 0.0 0.0 0.0 0.5 0.4 0.3 0.3Others 3.5 6.0 4.5 5.9 14.0 10.8 16.5 9.6 8.2 9.8Total 48.9 56.6 47.4 46.7 53.6 49.8 61.9 55.1 55.8 51.8
Country 2009 2010 2011
Portugal 17.9 21.3 20.2Spain 6.9 6.8 9.0Italy 6.1 8.4 6.4France 3.1 3.8 4.2Greece 1.9 2.1 2.1Lithuania 0.9 1.5 1.1Romania 0.7 1.2 0.8UK 1.4 0.6 0.7Serbia 0.1 0.4 0.6Others 6.1 14.9 7.9Total 44.9 61.0 52.8
Source: EUROSTAT – 20130224.
EU-27 exports of whole fresh, chilled and frozen hake, by country
of destination, in 1 000 tonnes, 1999-2011
78
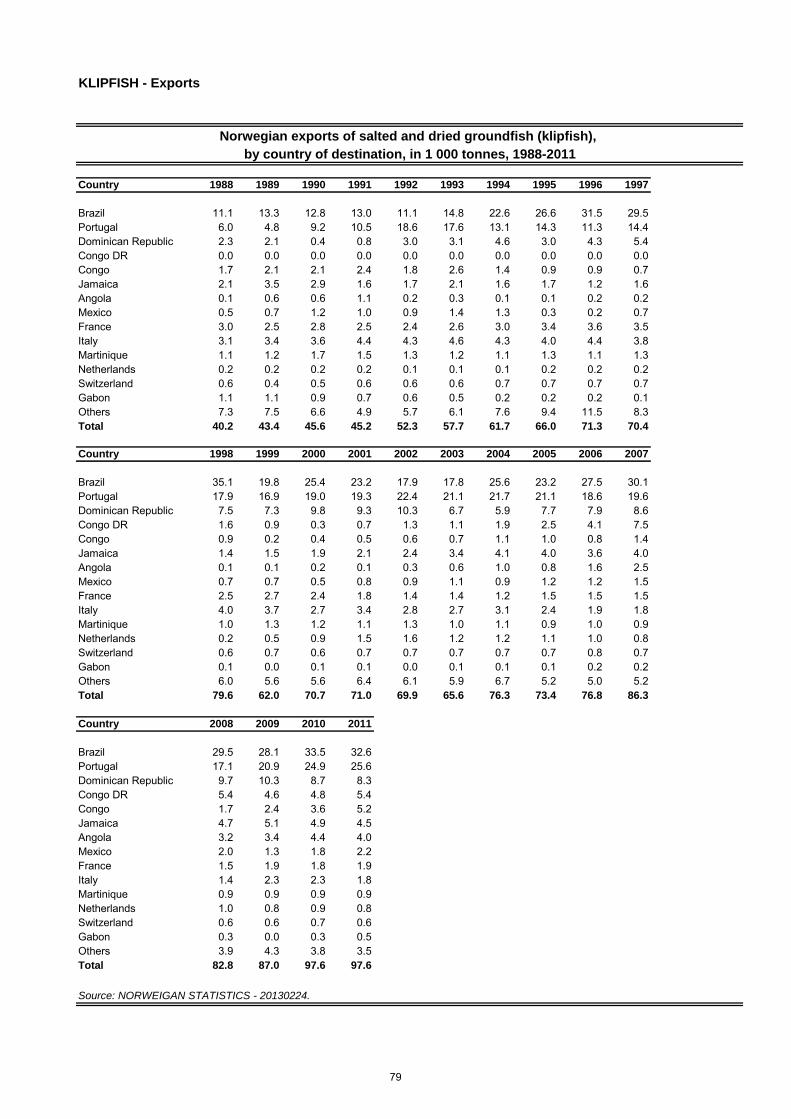
KLIPFISH - Exports
Country 1988 1989 1990 1991 1992 1993 1994 1995 1996 1997
Brazil 11.1 13.3 12.8 13.0 11.1 14.8 22.6 26.6 31.5 29.5Portugal 6.0 4.8 9.2 10.5 18.6 17.6 13.1 14.3 11.3 14.4Dominican Republic 2.3 2.1 0.4 0.8 3.0 3.1 4.6 3.0 4.3 5.4Congo DR 0.0 0.0 0.0 0.0 0.0 0.0 0.0 0.0 0.0 0.0Congo 1.7 2.1 2.1 2.4 1.8 2.6 1.4 0.9 0.9 0.7Jamaica 2.1 3.5 2.9 1.6 1.7 2.1 1.6 1.7 1.2 1.6Angola 0.1 0.6 0.6 1.1 0.2 0.3 0.1 0.1 0.2 0.2Mexico 0.5 0.7 1.2 1.0 0.9 1.4 1.3 0.3 0.2 0.7France 3.0 2.5 2.8 2.5 2.4 2.6 3.0 3.4 3.6 3.5Italy 3.1 3.4 3.6 4.4 4.3 4.6 4.3 4.0 4.4 3.8Martinique 1.1 1.2 1.7 1.5 1.3 1.2 1.1 1.3 1.1 1.3Netherlands 0.2 0.2 0.2 0.2 0.1 0.1 0.1 0.2 0.2 0.2Switzerland 0.6 0.4 0.5 0.6 0.6 0.6 0.7 0.7 0.7 0.7Gabon 1.1 1.1 0.9 0.7 0.6 0.5 0.2 0.2 0.2 0.1Others 7.3 7.5 6.6 4.9 5.7 6.1 7.6 9.4 11.5 8.3Total 40.2 43.4 45.6 45.2 52.3 57.7 61.7 66.0 71.3 70.4
Country 1998 1999 2000 2001 2002 2003 2004 2005 2006 2007
Brazil 35.1 19.8 25.4 23.2 17.9 17.8 25.6 23.2 27.5 30.1Portugal 17.9 16.9 19.0 19.3 22.4 21.1 21.7 21.1 18.6 19.6Dominican Republic 7.5 7.3 9.8 9.3 10.3 6.7 5.9 7.7 7.9 8.6Congo DR 1.6 0.9 0.3 0.7 1.3 1.1 1.9 2.5 4.1 7.5Congo 0.9 0.2 0.4 0.5 0.6 0.7 1.1 1.0 0.8 1.4Jamaica 1.4 1.5 1.9 2.1 2.4 3.4 4.1 4.0 3.6 4.0Angola 0.1 0.1 0.2 0.1 0.3 0.6 1.0 0.8 1.6 2.5Mexico 0.7 0.7 0.5 0.8 0.9 1.1 0.9 1.2 1.2 1.5France 2.5 2.7 2.4 1.8 1.4 1.4 1.2 1.5 1.5 1.5Italy 4.0 3.7 2.7 3.4 2.8 2.7 3.1 2.4 1.9 1.8Martinique 1.0 1.3 1.2 1.1 1.3 1.0 1.1 0.9 1.0 0.9Netherlands 0.2 0.5 0.9 1.5 1.6 1.2 1.2 1.1 1.0 0.8Switzerland 0.6 0.7 0.6 0.7 0.7 0.7 0.7 0.7 0.8 0.7Gabon 0.1 0.0 0.1 0.1 0.0 0.1 0.1 0.1 0.2 0.2Others 6.0 5.6 5.6 6.4 6.1 5.9 6.7 5.2 5.0 5.2Total 79.6 62.0 70.7 71.0 69.9 65.6 76.3 73.4 76.8 86.3
Country 2008 2009 2010 2011
Brazil 29.5 28.1 33.5 32.6Portugal 17.1 20.9 24.9 25.6Dominican Republic 9.7 10.3 8.7 8.3Congo DR 5.4 4.6 4.8 5.4Congo 1.7 2.4 3.6 5.2Jamaica 4.7 5.1 4.9 4.5Angola 3.2 3.4 4.4 4.0Mexico 2.0 1.3 1.8 2.2France 1.5 1.9 1.8 1.9Italy 1.4 2.3 2.3 1.8Martinique 0.9 0.9 0.9 0.9Netherlands 1.0 0.8 0.9 0.8Switzerland 0.6 0.6 0.7 0.6Gabon 0.3 0.0 0.3 0.5Others 3.9 4.3 3.8 3.5Total 82.8 87.0 97.6 97.6
Source: NORWEIGAN STATISTICS - 20130224.
Norwegian exports of salted and dried groundfish (klipfish),
by country of destination, in 1 000 tonnes, 1988-2011
79
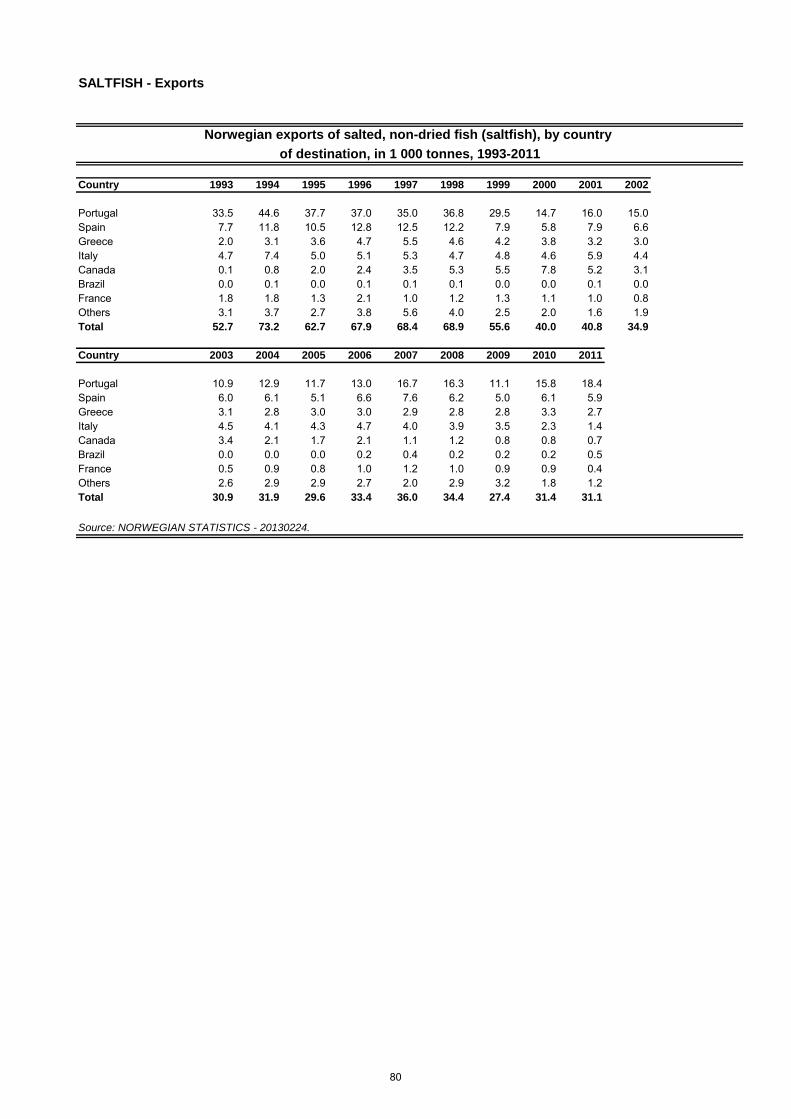
SALTFISH - Exports
Country 1993 1994 1995 1996 1997 1998 1999 2000 2001 2002
Portugal 33.5 44.6 37.7 37.0 35.0 36.8 29.5 14.7 16.0 15.0Spain 7.7 11.8 10.5 12.8 12.5 12.2 7.9 5.8 7.9 6.6Greece 2.0 3.1 3.6 4.7 5.5 4.6 4.2 3.8 3.2 3.0Italy 4.7 7.4 5.0 5.1 5.3 4.7 4.8 4.6 5.9 4.4Canada 0.1 0.8 2.0 2.4 3.5 5.3 5.5 7.8 5.2 3.1Brazil 0.0 0.1 0.0 0.1 0.1 0.1 0.0 0.0 0.1 0.0France 1.8 1.8 1.3 2.1 1.0 1.2 1.3 1.1 1.0 0.8Others 3.1 3.7 2.7 3.8 5.6 4.0 2.5 2.0 1.6 1.9Total 52.7 73.2 62.7 67.9 68.4 68.9 55.6 40.0 40.8 34.9
Country 2003 2004 2005 2006 2007 2008 2009 2010 2011
Portugal 10.9 12.9 11.7 13.0 16.7 16.3 11.1 15.8 18.4Spain 6.0 6.1 5.1 6.6 7.6 6.2 5.0 6.1 5.9Greece 3.1 2.8 3.0 3.0 2.9 2.8 2.8 3.3 2.7Italy 4.5 4.1 4.3 4.7 4.0 3.9 3.5 2.3 1.4Canada 3.4 2.1 1.7 2.1 1.1 1.2 0.8 0.8 0.7Brazil 0.0 0.0 0.0 0.2 0.4 0.2 0.2 0.2 0.5France 0.5 0.9 0.8 1.0 1.2 1.0 0.9 0.9 0.4Others 2.6 2.9 2.9 2.7 2.0 2.9 3.2 1.8 1.2Total 30.9 31.9 29.6 33.4 36.0 34.4 27.4 31.4 31.1
Source: NORWEGIAN STATISTICS - 20130224.
Norwegian exports of salted, non-dried fish (saltfish), by country
of destination, in 1 000 tonnes, 1993-2011
80
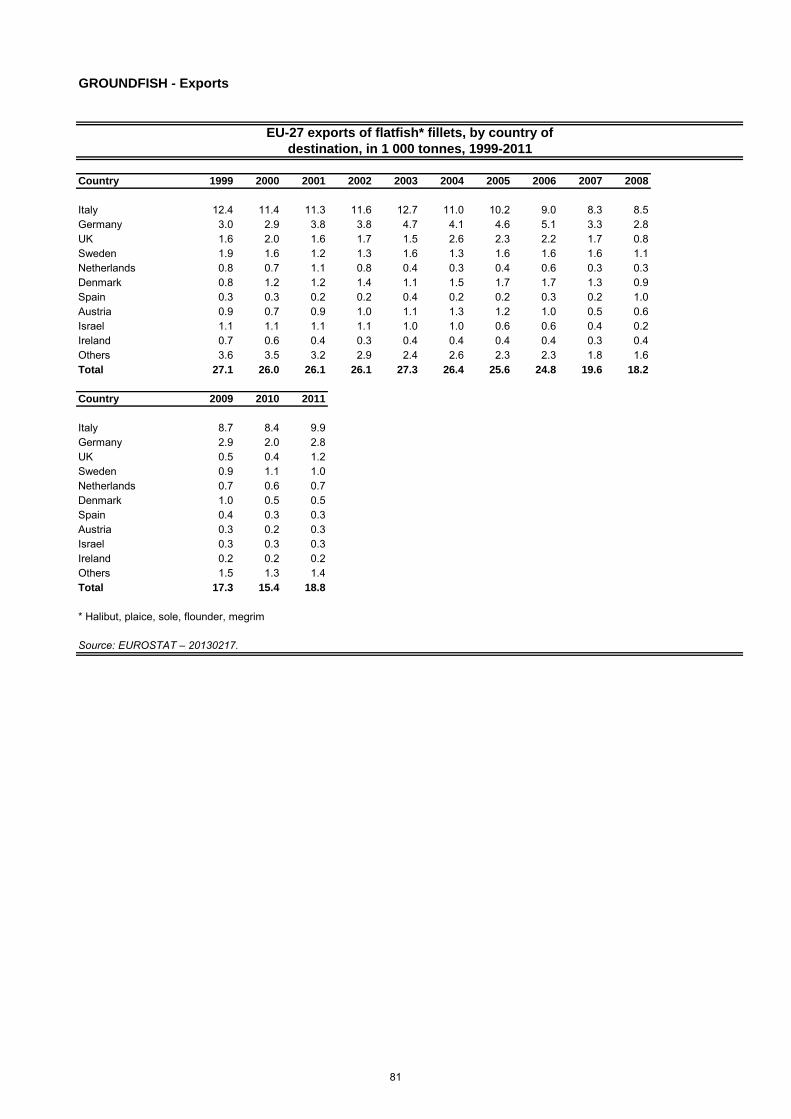
Country 1999 2000 2001 2002 2003 2004 2005 2006 2007 2008
Italy 12.4 11.4 11.3 11.6 12.7 11.0 10.2 9.0 8.3 8.5Germany 3.0 2.9 3.8 3.8 4.7 4.1 4.6 5.1 3.3 2.8UK 1.6 2.0 1.6 1.7 1.5 2.6 2.3 2.2 1.7 0.8Sweden 1.9 1.6 1.2 1.3 1.6 1.3 1.6 1.6 1.6 1.1Netherlands 0.8 0.7 1.1 0.8 0.4 0.3 0.4 0.6 0.3 0.3Denmark 0.8 1.2 1.2 1.4 1.1 1.5 1.7 1.7 1.3 0.9Spain 0.3 0.3 0.2 0.2 0.4 0.2 0.2 0.3 0.2 1.0Austria 0.9 0.7 0.9 1.0 1.1 1.3 1.2 1.0 0.5 0.6Israel 1.1 1.1 1.1 1.1 1.0 1.0 0.6 0.6 0.4 0.2Ireland 0.7 0.6 0.4 0.3 0.4 0.4 0.4 0.4 0.3 0.4Others 3.6 3.5 3.2 2.9 2.4 2.6 2.3 2.3 1.8 1.6Total 27.1 26.0 26.1 26.1 27.3 26.4 25.6 24.8 19.6 18.2
Country 2009 2010 2011
Italy 8.7 8.4 9.9Germany 2.9 2.0 2.8UK 0.5 0.4 1.2Sweden 0.9 1.1 1.0Netherlands 0.7 0.6 0.7Denmark 1.0 0.5 0.5Spain 0.4 0.3 0.3Austria 0.3 0.2 0.3Israel 0.3 0.3 0.3Ireland 0.2 0.2 0.2Others 1.5 1.3 1.4Total 17.3 15.4 18.8
* Halibut, plaice, sole, flounder, megrim
Source: EUROSTAT – 20130217.
GROUNDFISH - Exports
EU-27 exports of flatfish* fillets, by country of
destination, in 1 000 tonnes, 1999-2011
81
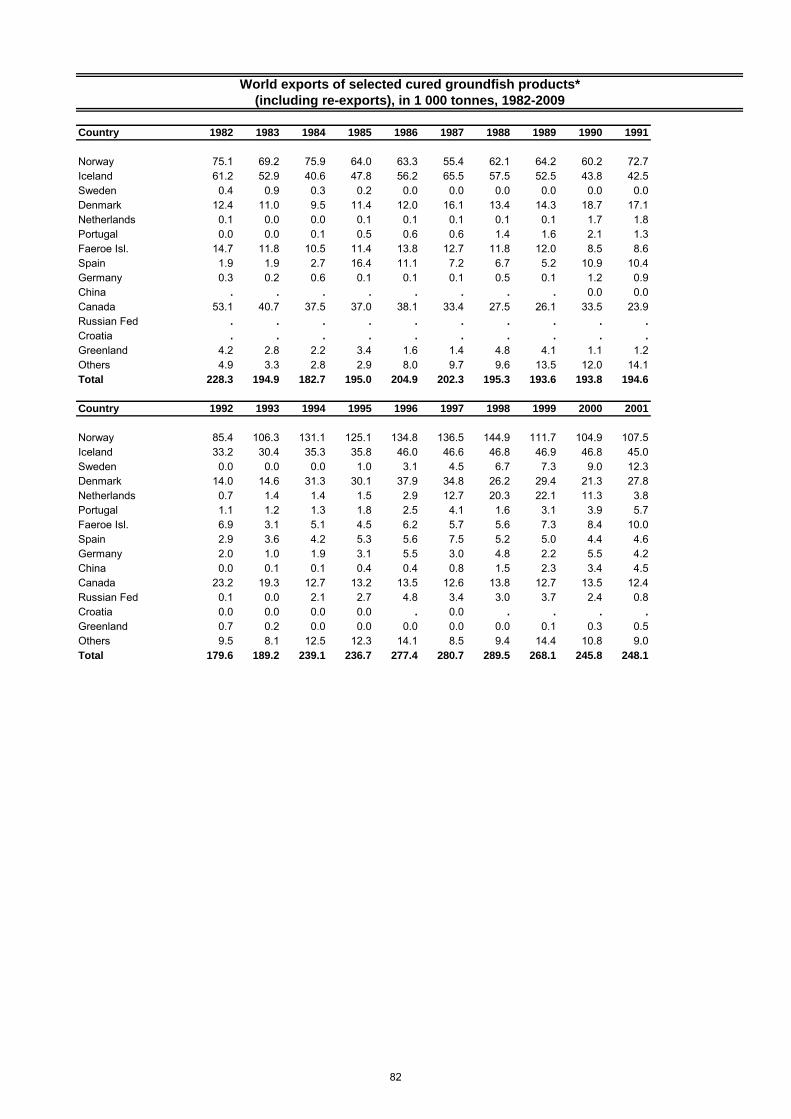
Country 1982 1983 1984 1985 1986 1987 1988 1989 1990 1991
Norway 75.1 69.2 75.9 64.0 63.3 55.4 62.1 64.2 60.2 72.7Iceland 61.2 52.9 40.6 47.8 56.2 65.5 57.5 52.5 43.8 42.5Sweden 0.4 0.9 0.3 0.2 0.0 0.0 0.0 0.0 0.0 0.0Denmark 12.4 11.0 9.5 11.4 12.0 16.1 13.4 14.3 18.7 17.1Netherlands 0.1 0.0 0.0 0.1 0.1 0.1 0.1 0.1 1.7 1.8Portugal 0.0 0.0 0.1 0.5 0.6 0.6 1.4 1.6 2.1 1.3Faeroe Isl. 14.7 11.8 10.5 11.4 13.8 12.7 11.8 12.0 8.5 8.6Spain 1.9 1.9 2.7 16.4 11.1 7.2 6.7 5.2 10.9 10.4Germany 0.3 0.2 0.6 0.1 0.1 0.1 0.5 0.1 1.2 0.9China . . . . . . . . 0.0 0.0Canada 53.1 40.7 37.5 37.0 38.1 33.4 27.5 26.1 33.5 23.9Russian Fed . . . . . . . . . .
Croatia . . . . . . . . . .
Greenland 4.2 2.8 2.2 3.4 1.6 1.4 4.8 4.1 1.1 1.2Others 4.9 3.3 2.8 2.9 8.0 9.7 9.6 13.5 12.0 14.1Total 228.3 194.9 182.7 195.0 204.9 202.3 195.3 193.6 193.8 194.6
Country 1992 1993 1994 1995 1996 1997 1998 1999 2000 2001
Norway 85.4 106.3 131.1 125.1 134.8 136.5 144.9 111.7 104.9 107.5Iceland 33.2 30.4 35.3 35.8 46.0 46.6 46.8 46.9 46.8 45.0Sweden 0.0 0.0 0.0 1.0 3.1 4.5 6.7 7.3 9.0 12.3Denmark 14.0 14.6 31.3 30.1 37.9 34.8 26.2 29.4 21.3 27.8Netherlands 0.7 1.4 1.4 1.5 2.9 12.7 20.3 22.1 11.3 3.8Portugal 1.1 1.2 1.3 1.8 2.5 4.1 1.6 3.1 3.9 5.7Faeroe Isl. 6.9 3.1 5.1 4.5 6.2 5.7 5.6 7.3 8.4 10.0Spain 2.9 3.6 4.2 5.3 5.6 7.5 5.2 5.0 4.4 4.6Germany 2.0 1.0 1.9 3.1 5.5 3.0 4.8 2.2 5.5 4.2China 0.0 0.1 0.1 0.4 0.4 0.8 1.5 2.3 3.4 4.5Canada 23.2 19.3 12.7 13.2 13.5 12.6 13.8 12.7 13.5 12.4Russian Fed 0.1 0.0 2.1 2.7 4.8 3.4 3.0 3.7 2.4 0.8Croatia 0.0 0.0 0.0 0.0 . 0.0 . . . .
Greenland 0.7 0.2 0.0 0.0 0.0 0.0 0.0 0.1 0.3 0.5Others 9.5 8.1 12.5 12.3 14.1 8.5 9.4 14.4 10.8 9.0Total 179.6 189.2 239.1 236.7 277.4 280.7 289.5 268.1 245.8 248.1
World exports of selected cured groundfish products*
(including re-exports), in 1 000 tonnes, 1982-2009
82
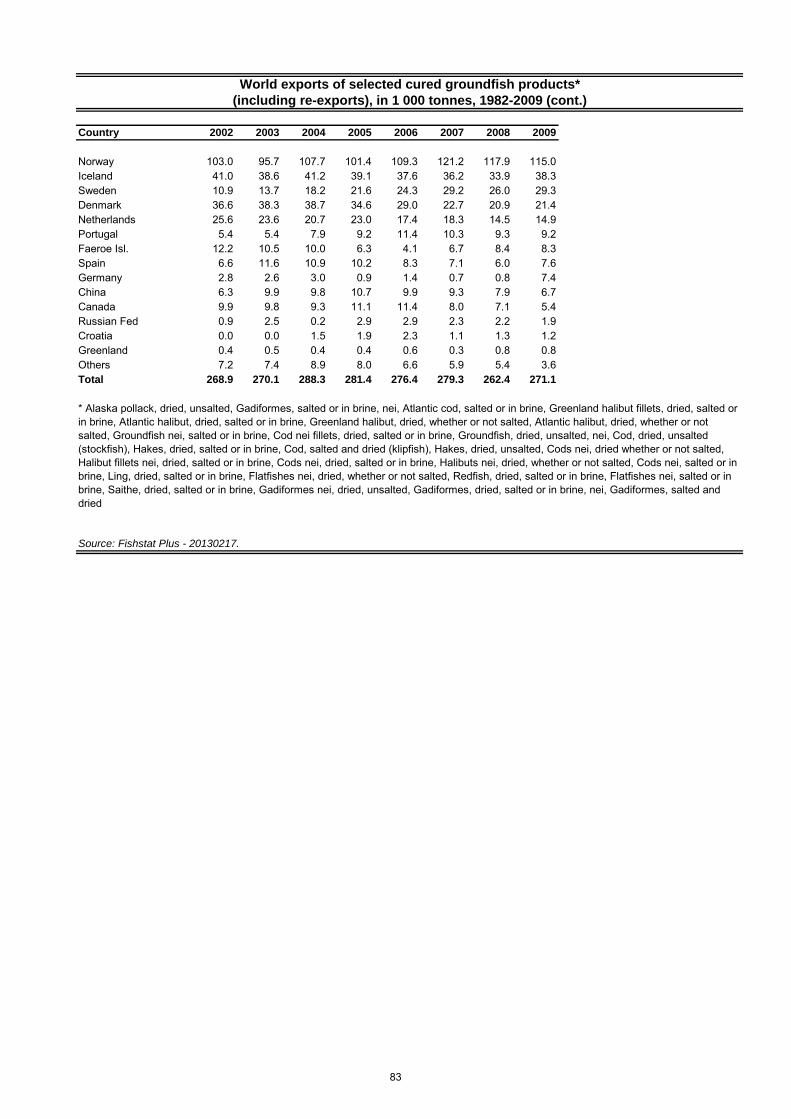
Country 2002 2003 2004 2005 2006 2007 2008 2009
Norway 103.0 95.7 107.7 101.4 109.3 121.2 117.9 115.0Iceland 41.0 38.6 41.2 39.1 37.6 36.2 33.9 38.3Sweden 10.9 13.7 18.2 21.6 24.3 29.2 26.0 29.3Denmark 36.6 38.3 38.7 34.6 29.0 22.7 20.9 21.4Netherlands 25.6 23.6 20.7 23.0 17.4 18.3 14.5 14.9Portugal 5.4 5.4 7.9 9.2 11.4 10.3 9.3 9.2Faeroe Isl. 12.2 10.5 10.0 6.3 4.1 6.7 8.4 8.3Spain 6.6 11.6 10.9 10.2 8.3 7.1 6.0 7.6Germany 2.8 2.6 3.0 0.9 1.4 0.7 0.8 7.4China 6.3 9.9 9.8 10.7 9.9 9.3 7.9 6.7Canada 9.9 9.8 9.3 11.1 11.4 8.0 7.1 5.4Russian Fed 0.9 2.5 0.2 2.9 2.9 2.3 2.2 1.9Croatia 0.0 0.0 1.5 1.9 2.3 1.1 1.3 1.2Greenland 0.4 0.5 0.4 0.4 0.6 0.3 0.8 0.8Others 7.2 7.4 8.9 8.0 6.6 5.9 5.4 3.6Total 268.9 270.1 288.3 281.4 276.4 279.3 262.4 271.1
Source: Fishstat Plus - 20130217.
* Alaska pollack, dried, unsalted, Gadiformes, salted or in brine, nei, Atlantic cod, salted or in brine, Greenland halibut fillets, dried, salted or in brine, Atlantic halibut, dried, salted or in brine, Greenland halibut, dried, whether or not salted, Atlantic halibut, dried, whether or not salted, Groundfish nei, salted or in brine, Cod nei fillets, dried, salted or in brine, Groundfish, dried, unsalted, nei, Cod, dried, unsalted (stockfish), Hakes, dried, salted or in brine, Cod, salted and dried (klipfish), Hakes, dried, unsalted, Cods nei, dried whether or not salted, Halibut fillets nei, dried, salted or in brine, Cods nei, dried, salted or in brine, Halibuts nei, dried, whether or not salted, Cods nei, salted or in brine, Ling, dried, salted or in brine, Flatfishes nei, dried, whether or not salted, Redfish, dried, salted or in brine, Flatfishes nei, salted or in brine, Saithe, dried, salted or in brine, Gadiformes nei, dried, unsalted, Gadiformes, dried, salted or in brine, nei, Gadiformes, salted and dried
World exports of selected cured groundfish products*
(including re-exports), in 1 000 tonnes, 1982-2009 (cont.)
83
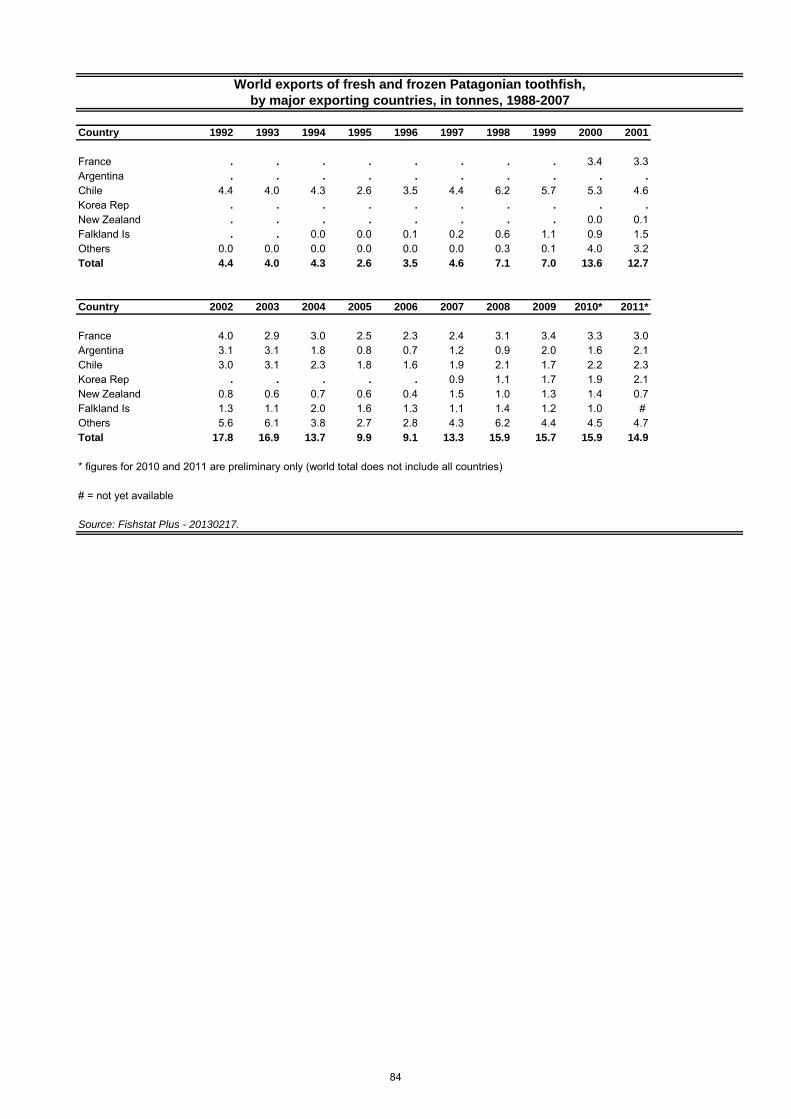
Country 1992 1993 1994 1995 1996 1997 1998 1999 2000 2001
France . . . . . . . . 3.4 3.3Argentina . . . . . . . . . .
Chile 4.4 4.0 4.3 2.6 3.5 4.4 6.2 5.7 5.3 4.6Korea Rep . . . . . . . . . .
New Zealand . . . . . . . . 0.0 0.1Falkland Is . . 0.0 0.0 0.1 0.2 0.6 1.1 0.9 1.5Others 0.0 0.0 0.0 0.0 0.0 0.0 0.3 0.1 4.0 3.2Total 4.4 4.0 4.3 2.6 3.5 4.6 7.1 7.0 13.6 12.7
Country 2002 2003 2004 2005 2006 2007 2008 2009 2010* 2011*
France 4.0 2.9 3.0 2.5 2.3 2.4 3.1 3.4 3.3 3.0Argentina 3.1 3.1 1.8 0.8 0.7 1.2 0.9 2.0 1.6 2.1Chile 3.0 3.1 2.3 1.8 1.6 1.9 2.1 1.7 2.2 2.3Korea Rep . . . . . 0.9 1.1 1.7 1.9 2.1New Zealand 0.8 0.6 0.7 0.6 0.4 1.5 1.0 1.3 1.4 0.7Falkland Is 1.3 1.1 2.0 1.6 1.3 1.1 1.4 1.2 1.0 # Others 5.6 6.1 3.8 2.7 2.8 4.3 6.2 4.4 4.5 4.7Total 17.8 16.9 13.7 9.9 9.1 13.3 15.9 15.7 15.9 14.9
* figures for 2010 and 2011 are preliminary only (world total does not include all countries)
# = not yet available
Source: Fishstat Plus - 20130217.
by major exporting countries, in tonnes, 1988-2007
World exports of fresh and frozen Patagonian toothfish,
84
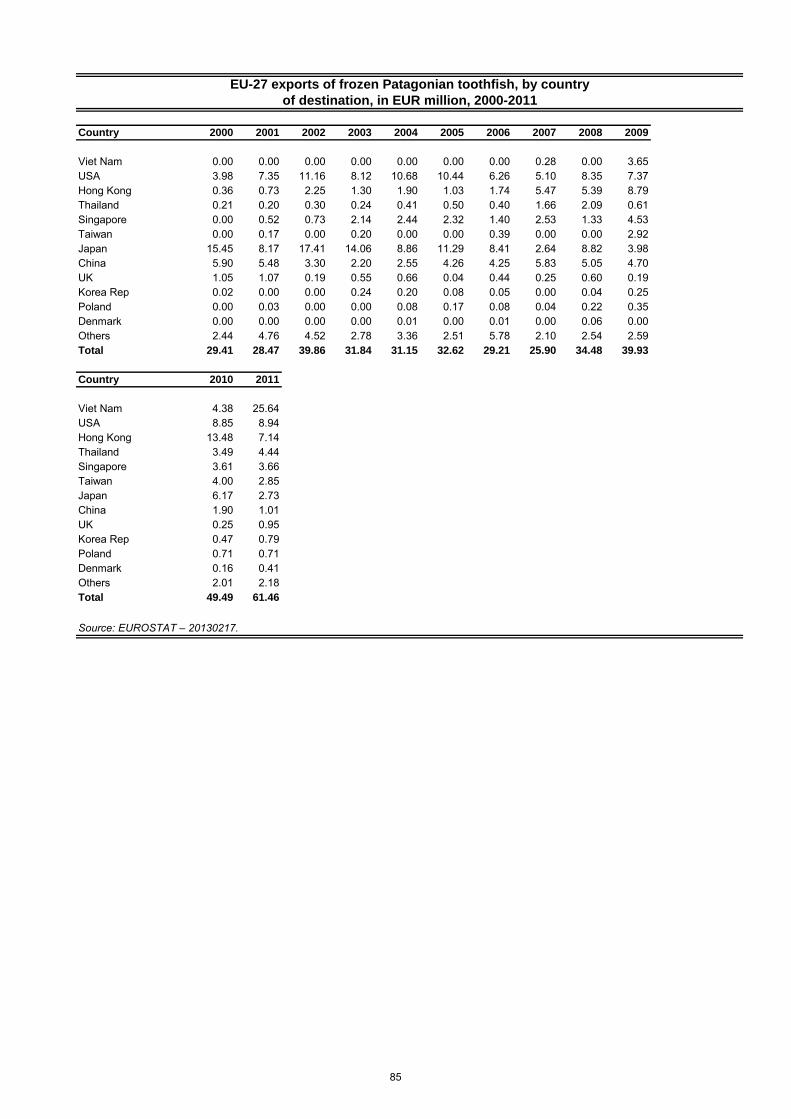
Country 2000 2001 2002 2003 2004 2005 2006 2007 2008 2009
Viet Nam 0.00 0.00 0.00 0.00 0.00 0.00 0.00 0.28 0.00 3.65USA 3.98 7.35 11.16 8.12 10.68 10.44 6.26 5.10 8.35 7.37Hong Kong 0.36 0.73 2.25 1.30 1.90 1.03 1.74 5.47 5.39 8.79Thailand 0.21 0.20 0.30 0.24 0.41 0.50 0.40 1.66 2.09 0.61Singapore 0.00 0.52 0.73 2.14 2.44 2.32 1.40 2.53 1.33 4.53Taiwan 0.00 0.17 0.00 0.20 0.00 0.00 0.39 0.00 0.00 2.92Japan 15.45 8.17 17.41 14.06 8.86 11.29 8.41 2.64 8.82 3.98China 5.90 5.48 3.30 2.20 2.55 4.26 4.25 5.83 5.05 4.70UK 1.05 1.07 0.19 0.55 0.66 0.04 0.44 0.25 0.60 0.19Korea Rep 0.02 0.00 0.00 0.24 0.20 0.08 0.05 0.00 0.04 0.25Poland 0.00 0.03 0.00 0.00 0.08 0.17 0.08 0.04 0.22 0.35Denmark 0.00 0.00 0.00 0.00 0.01 0.00 0.01 0.00 0.06 0.00Others 2.44 4.76 4.52 2.78 3.36 2.51 5.78 2.10 2.54 2.59Total 29.41 28.47 39.86 31.84 31.15 32.62 29.21 25.90 34.48 39.93
Country 2010 2011
Viet Nam 4.38 25.64USA 8.85 8.94Hong Kong 13.48 7.14Thailand 3.49 4.44Singapore 3.61 3.66Taiwan 4.00 2.85Japan 6.17 2.73China 1.90 1.01UK 0.25 0.95Korea Rep 0.47 0.79Poland 0.71 0.71Denmark 0.16 0.41Others 2.01 2.18Total 49.49 61.46
Source: EUROSTAT – 20130217.
of destination, in EUR million, 2000-2011
EU-27 exports of frozen Patagonian toothfish, by country
85
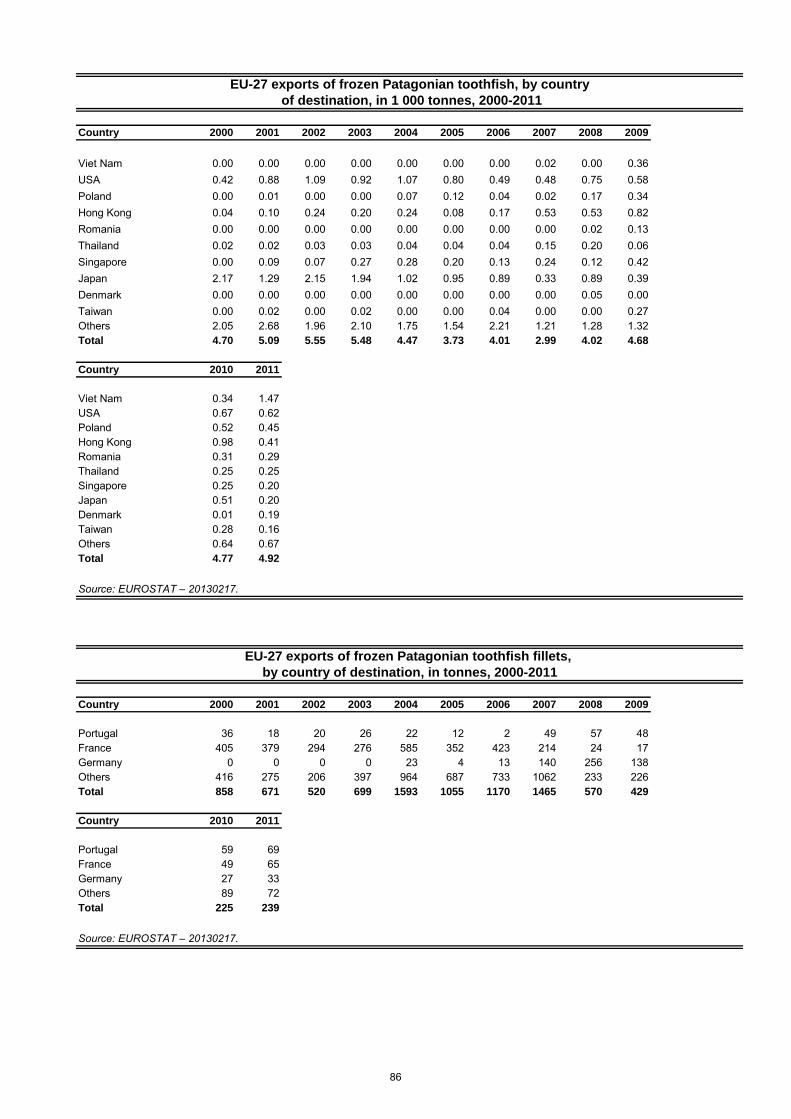
Country 2000 2001 2002 2003 2004 2005 2006 2007 2008 2009
Viet Nam 0.00 0.00 0.00 0.00 0.00 0.00 0.00 0.02 0.00 0.36USA 0.42 0.88 1.09 0.92 1.07 0.80 0.49 0.48 0.75 0.58Poland 0.00 0.01 0.00 0.00 0.07 0.12 0.04 0.02 0.17 0.34Hong Kong 0.04 0.10 0.24 0.20 0.24 0.08 0.17 0.53 0.53 0.82Romania 0.00 0.00 0.00 0.00 0.00 0.00 0.00 0.00 0.02 0.13Thailand 0.02 0.02 0.03 0.03 0.04 0.04 0.04 0.15 0.20 0.06Singapore 0.00 0.09 0.07 0.27 0.28 0.20 0.13 0.24 0.12 0.42Japan 2.17 1.29 2.15 1.94 1.02 0.95 0.89 0.33 0.89 0.39Denmark 0.00 0.00 0.00 0.00 0.00 0.00 0.00 0.00 0.05 0.00Taiwan 0.00 0.02 0.00 0.02 0.00 0.00 0.04 0.00 0.00 0.27Others 2.05 2.68 1.96 2.10 1.75 1.54 2.21 1.21 1.28 1.32Total 4.70 5.09 5.55 5.48 4.47 3.73 4.01 2.99 4.02 4.68
Country 2010 2011
Viet Nam 0.34 1.47USA 0.67 0.62Poland 0.52 0.45Hong Kong 0.98 0.41Romania 0.31 0.29Thailand 0.25 0.25Singapore 0.25 0.20Japan 0.51 0.20Denmark 0.01 0.19Taiwan 0.28 0.16Others 0.64 0.67Total 4.77 4.92
Source: EUROSTAT – 20130217.
Country 2000 2001 2002 2003 2004 2005 2006 2007 2008 2009
Portugal 36 18 20 26 22 12 2 49 57 48France 405 379 294 276 585 352 423 214 24 17Germany 0 0 0 0 23 4 13 140 256 138Others 416 275 206 397 964 687 733 1062 233 226Total 858 671 520 699 1593 1055 1170 1465 570 429
Country 2010 2011
Portugal 59 69France 49 65Germany 27 33Others 89 72Total 225 239
Source: EUROSTAT – 20130217.
EU-27 exports of frozen Patagonian toothfish fillets,
EU-27 exports of frozen Patagonian toothfish, by country
of destination, in 1 000 tonnes, 2000-2011
by country of destination, in tonnes, 2000-2011
86
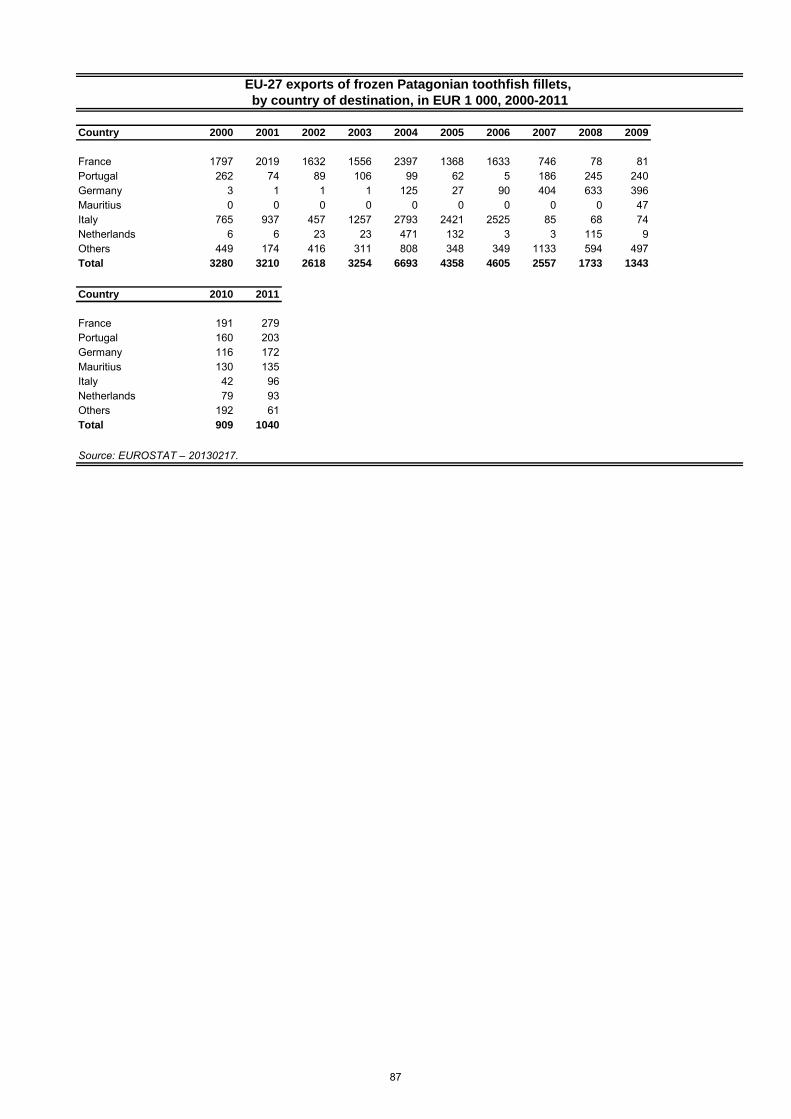
Country 2000 2001 2002 2003 2004 2005 2006 2007 2008 2009
France 1797 2019 1632 1556 2397 1368 1633 746 78 81Portugal 262 74 89 106 99 62 5 186 245 240Germany 3 1 1 1 125 27 90 404 633 396Mauritius 0 0 0 0 0 0 0 0 0 47Italy 765 937 457 1257 2793 2421 2525 85 68 74Netherlands 6 6 23 23 471 132 3 3 115 9Others 449 174 416 311 808 348 349 1133 594 497Total 3280 3210 2618 3254 6693 4358 4605 2557 1733 1343
Country 2010 2011
France 191 279Portugal 160 203Germany 116 172Mauritius 130 135Italy 42 96Netherlands 79 93Others 192 61Total 909 1040
Source: EUROSTAT – 20130217.
by country of destination, in EUR 1 000, 2000-2011
EU-27 exports of frozen Patagonian toothfish fillets,
87
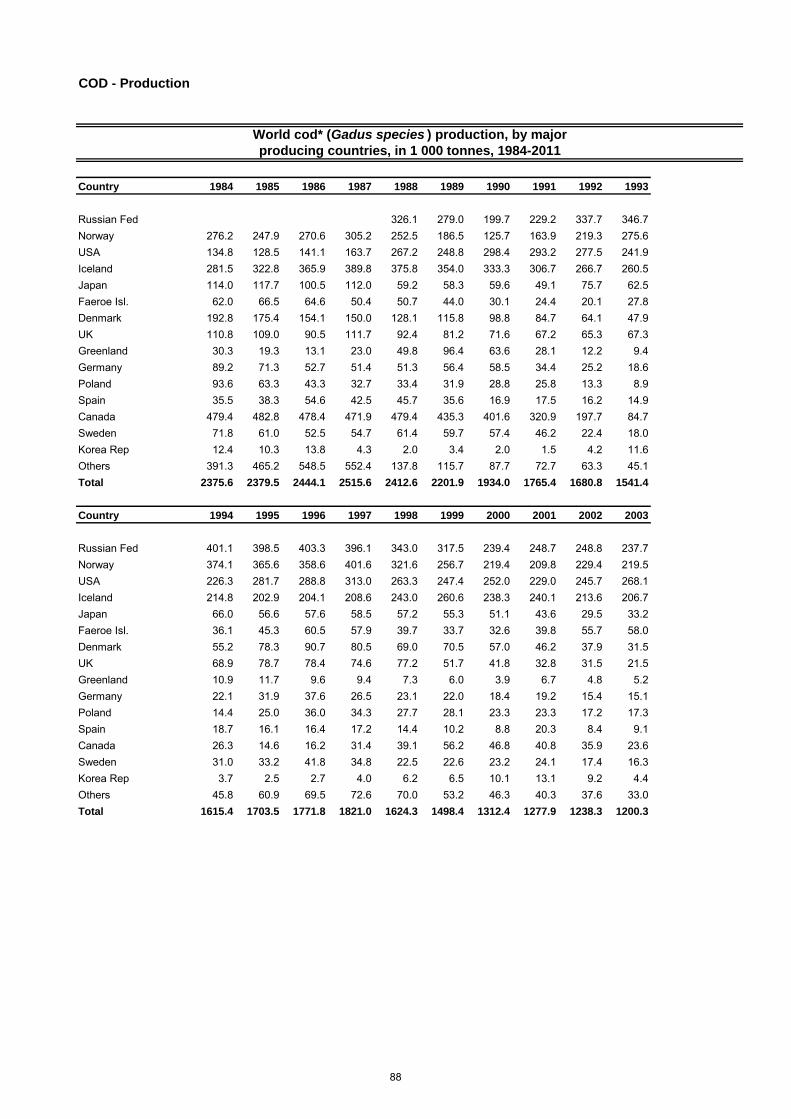
COD - Production
Country 1984 1985 1986 1987 1988 1989 1990 1991 1992 1993
Russian Fed 326.1 279.0 199.7 229.2 337.7 346.7Norway 276.2 247.9 270.6 305.2 252.5 186.5 125.7 163.9 219.3 275.6USA 134.8 128.5 141.1 163.7 267.2 248.8 298.4 293.2 277.5 241.9Iceland 281.5 322.8 365.9 389.8 375.8 354.0 333.3 306.7 266.7 260.5Japan 114.0 117.7 100.5 112.0 59.2 58.3 59.6 49.1 75.7 62.5Faeroe Isl. 62.0 66.5 64.6 50.4 50.7 44.0 30.1 24.4 20.1 27.8Denmark 192.8 175.4 154.1 150.0 128.1 115.8 98.8 84.7 64.1 47.9UK 110.8 109.0 90.5 111.7 92.4 81.2 71.6 67.2 65.3 67.3Greenland 30.3 19.3 13.1 23.0 49.8 96.4 63.6 28.1 12.2 9.4Germany 89.2 71.3 52.7 51.4 51.3 56.4 58.5 34.4 25.2 18.6Poland 93.6 63.3 43.3 32.7 33.4 31.9 28.8 25.8 13.3 8.9Spain 35.5 38.3 54.6 42.5 45.7 35.6 16.9 17.5 16.2 14.9Canada 479.4 482.8 478.4 471.9 479.4 435.3 401.6 320.9 197.7 84.7Sweden 71.8 61.0 52.5 54.7 61.4 59.7 57.4 46.2 22.4 18.0Korea Rep 12.4 10.3 13.8 4.3 2.0 3.4 2.0 1.5 4.2 11.6Others 391.3 465.2 548.5 552.4 137.8 115.7 87.7 72.7 63.3 45.1Total 2375.6 2379.5 2444.1 2515.6 2412.6 2201.9 1934.0 1765.4 1680.8 1541.4
Country 1994 1995 1996 1997 1998 1999 2000 2001 2002 2003
Russian Fed 401.1 398.5 403.3 396.1 343.0 317.5 239.4 248.7 248.8 237.7Norway 374.1 365.6 358.6 401.6 321.6 256.7 219.4 209.8 229.4 219.5USA 226.3 281.7 288.8 313.0 263.3 247.4 252.0 229.0 245.7 268.1Iceland 214.8 202.9 204.1 208.6 243.0 260.6 238.3 240.1 213.6 206.7Japan 66.0 56.6 57.6 58.5 57.2 55.3 51.1 43.6 29.5 33.2Faeroe Isl. 36.1 45.3 60.5 57.9 39.7 33.7 32.6 39.8 55.7 58.0Denmark 55.2 78.3 90.7 80.5 69.0 70.5 57.0 46.2 37.9 31.5UK 68.9 78.7 78.4 74.6 77.2 51.7 41.8 32.8 31.5 21.5Greenland 10.9 11.7 9.6 9.4 7.3 6.0 3.9 6.7 4.8 5.2Germany 22.1 31.9 37.6 26.5 23.1 22.0 18.4 19.2 15.4 15.1Poland 14.4 25.0 36.0 34.3 27.7 28.1 23.3 23.3 17.2 17.3Spain 18.7 16.1 16.4 17.2 14.4 10.2 8.8 20.3 8.4 9.1Canada 26.3 14.6 16.2 31.4 39.1 56.2 46.8 40.8 35.9 23.6Sweden 31.0 33.2 41.8 34.8 22.5 22.6 23.2 24.1 17.4 16.3Korea Rep 3.7 2.5 2.7 4.0 6.2 6.5 10.1 13.1 9.2 4.4Others 45.8 60.9 69.5 72.6 70.0 53.2 46.3 40.3 37.6 33.0Total 1615.4 1703.5 1771.8 1821.0 1624.3 1498.4 1312.4 1277.9 1238.3 1200.3
World cod* (Gadus species ) production, by major
producing countries, in 1 000 tonnes, 1984-2011
88
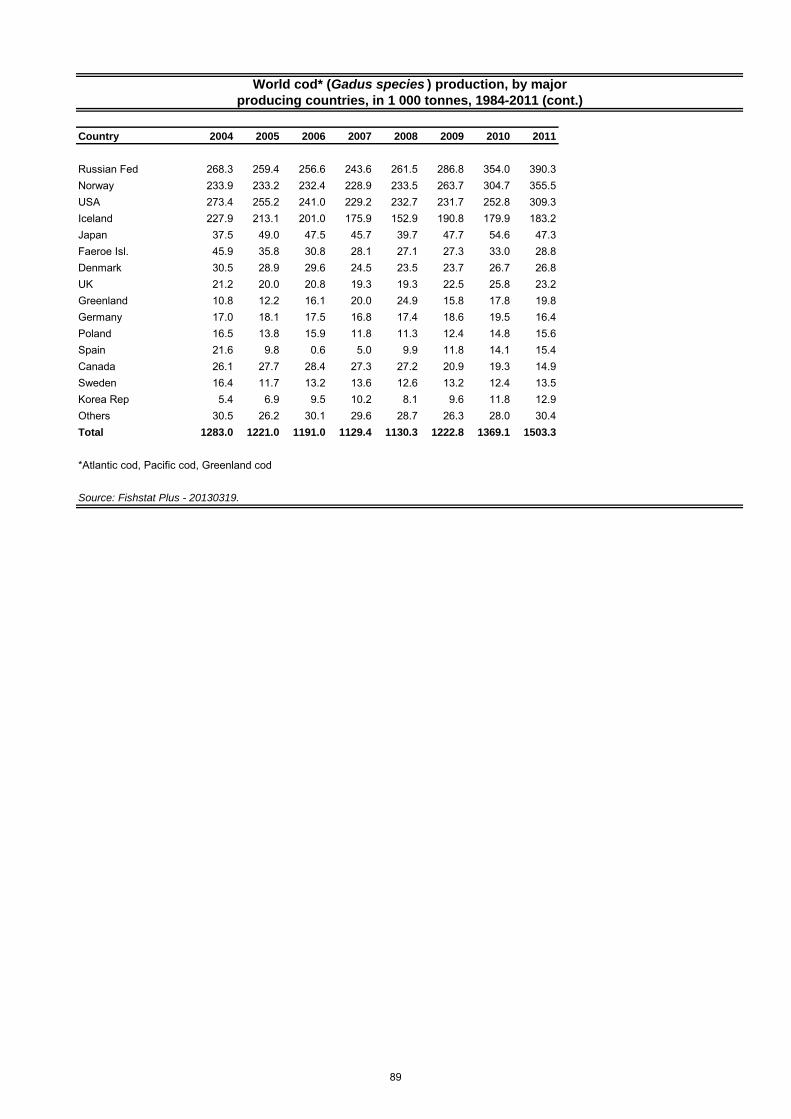
Country 2004 2005 2006 2007 2008 2009 2010 2011
Russian Fed 268.3 259.4 256.6 243.6 261.5 286.8 354.0 390.3Norway 233.9 233.2 232.4 228.9 233.5 263.7 304.7 355.5USA 273.4 255.2 241.0 229.2 232.7 231.7 252.8 309.3Iceland 227.9 213.1 201.0 175.9 152.9 190.8 179.9 183.2Japan 37.5 49.0 47.5 45.7 39.7 47.7 54.6 47.3Faeroe Isl. 45.9 35.8 30.8 28.1 27.1 27.3 33.0 28.8Denmark 30.5 28.9 29.6 24.5 23.5 23.7 26.7 26.8UK 21.2 20.0 20.8 19.3 19.3 22.5 25.8 23.2Greenland 10.8 12.2 16.1 20.0 24.9 15.8 17.8 19.8Germany 17.0 18.1 17.5 16.8 17.4 18.6 19.5 16.4Poland 16.5 13.8 15.9 11.8 11.3 12.4 14.8 15.6Spain 21.6 9.8 0.6 5.0 9.9 11.8 14.1 15.4Canada 26.1 27.7 28.4 27.3 27.2 20.9 19.3 14.9Sweden 16.4 11.7 13.2 13.6 12.6 13.2 12.4 13.5Korea Rep 5.4 6.9 9.5 10.2 8.1 9.6 11.8 12.9Others 30.5 26.2 30.1 29.6 28.7 26.3 28.0 30.4Total 1283.0 1221.0 1191.0 1129.4 1130.3 1222.8 1369.1 1503.3
Source: Fishstat Plus - 20130319.
*Atlantic cod, Pacific cod, Greenland cod
World cod* (Gadus species ) production, by major
producing countries, in 1 000 tonnes, 1984-2011 (cont.)
89
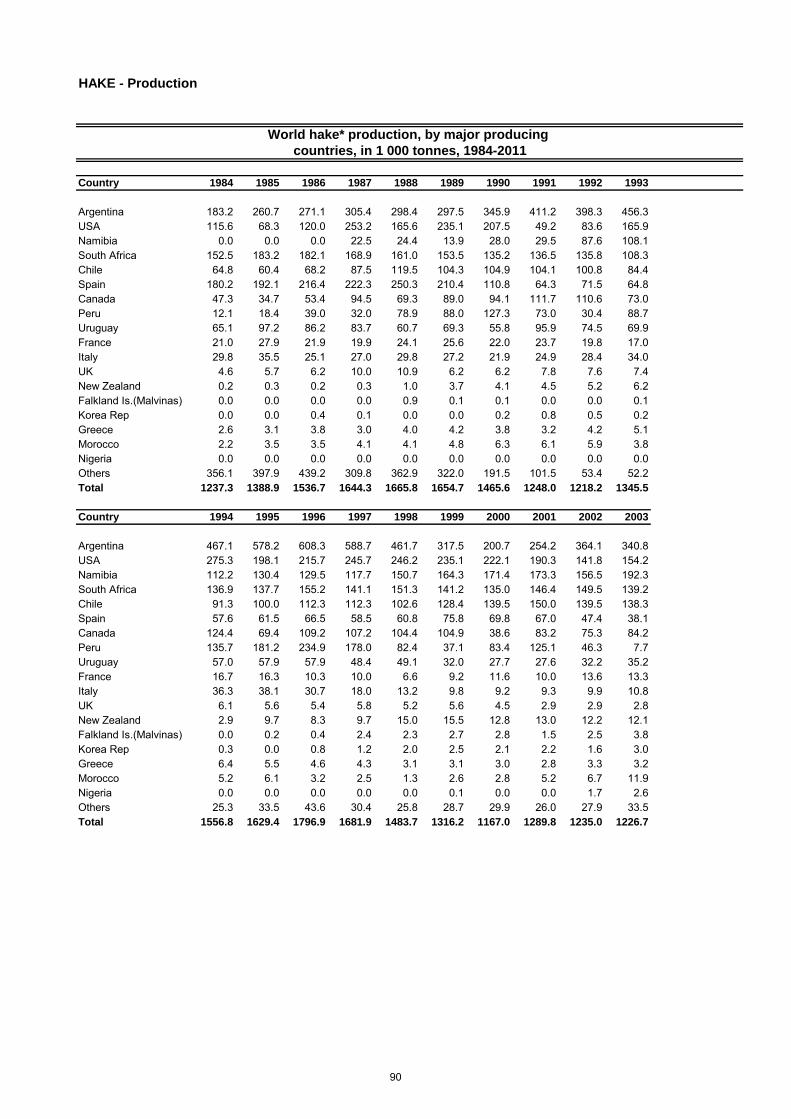
HAKE - Production
Country 1984 1985 1986 1987 1988 1989 1990 1991 1992 1993
Argentina 183.2 260.7 271.1 305.4 298.4 297.5 345.9 411.2 398.3 456.3USA 115.6 68.3 120.0 253.2 165.6 235.1 207.5 49.2 83.6 165.9Namibia 0.0 0.0 0.0 22.5 24.4 13.9 28.0 29.5 87.6 108.1South Africa 152.5 183.2 182.1 168.9 161.0 153.5 135.2 136.5 135.8 108.3Chile 64.8 60.4 68.2 87.5 119.5 104.3 104.9 104.1 100.8 84.4Spain 180.2 192.1 216.4 222.3 250.3 210.4 110.8 64.3 71.5 64.8Canada 47.3 34.7 53.4 94.5 69.3 89.0 94.1 111.7 110.6 73.0Peru 12.1 18.4 39.0 32.0 78.9 88.0 127.3 73.0 30.4 88.7Uruguay 65.1 97.2 86.2 83.7 60.7 69.3 55.8 95.9 74.5 69.9France 21.0 27.9 21.9 19.9 24.1 25.6 22.0 23.7 19.8 17.0Italy 29.8 35.5 25.1 27.0 29.8 27.2 21.9 24.9 28.4 34.0UK 4.6 5.7 6.2 10.0 10.9 6.2 6.2 7.8 7.6 7.4New Zealand 0.2 0.3 0.2 0.3 1.0 3.7 4.1 4.5 5.2 6.2Falkland Is.(Malvinas) 0.0 0.0 0.0 0.0 0.9 0.1 0.1 0.0 0.0 0.1Korea Rep 0.0 0.0 0.4 0.1 0.0 0.0 0.2 0.8 0.5 0.2Greece 2.6 3.1 3.8 3.0 4.0 4.2 3.8 3.2 4.2 5.1Morocco 2.2 3.5 3.5 4.1 4.1 4.8 6.3 6.1 5.9 3.8Nigeria 0.0 0.0 0.0 0.0 0.0 0.0 0.0 0.0 0.0 0.0Others 356.1 397.9 439.2 309.8 362.9 322.0 191.5 101.5 53.4 52.2Total 1237.3 1388.9 1536.7 1644.3 1665.8 1654.7 1465.6 1248.0 1218.2 1345.5
Country 1994 1995 1996 1997 1998 1999 2000 2001 2002 2003
Argentina 467.1 578.2 608.3 588.7 461.7 317.5 200.7 254.2 364.1 340.8USA 275.3 198.1 215.7 245.7 246.2 235.1 222.1 190.3 141.8 154.2Namibia 112.2 130.4 129.5 117.7 150.7 164.3 171.4 173.3 156.5 192.3South Africa 136.9 137.7 155.2 141.1 151.3 141.2 135.0 146.4 149.5 139.2Chile 91.3 100.0 112.3 112.3 102.6 128.4 139.5 150.0 139.5 138.3Spain 57.6 61.5 66.5 58.5 60.8 75.8 69.8 67.0 47.4 38.1Canada 124.4 69.4 109.2 107.2 104.4 104.9 38.6 83.2 75.3 84.2Peru 135.7 181.2 234.9 178.0 82.4 37.1 83.4 125.1 46.3 7.7Uruguay 57.0 57.9 57.9 48.4 49.1 32.0 27.7 27.6 32.2 35.2France 16.7 16.3 10.3 10.0 6.6 9.2 11.6 10.0 13.6 13.3Italy 36.3 38.1 30.7 18.0 13.2 9.8 9.2 9.3 9.9 10.8UK 6.1 5.6 5.4 5.8 5.2 5.6 4.5 2.9 2.9 2.8New Zealand 2.9 9.7 8.3 9.7 15.0 15.5 12.8 13.0 12.2 12.1Falkland Is.(Malvinas) 0.0 0.2 0.4 2.4 2.3 2.7 2.8 1.5 2.5 3.8Korea Rep 0.3 0.0 0.8 1.2 2.0 2.5 2.1 2.2 1.6 3.0Greece 6.4 5.5 4.6 4.3 3.1 3.1 3.0 2.8 3.3 3.2Morocco 5.2 6.1 3.2 2.5 1.3 2.6 2.8 5.2 6.7 11.9Nigeria 0.0 0.0 0.0 0.0 0.0 0.1 0.0 0.0 1.7 2.6Others 25.3 33.5 43.6 30.4 25.8 28.7 29.9 26.0 27.9 33.5Total 1556.8 1629.4 1796.9 1681.9 1483.7 1316.2 1167.0 1289.8 1235.0 1226.7
countries, in 1 000 tonnes, 1984-2011
World hake* production, by major producing
90
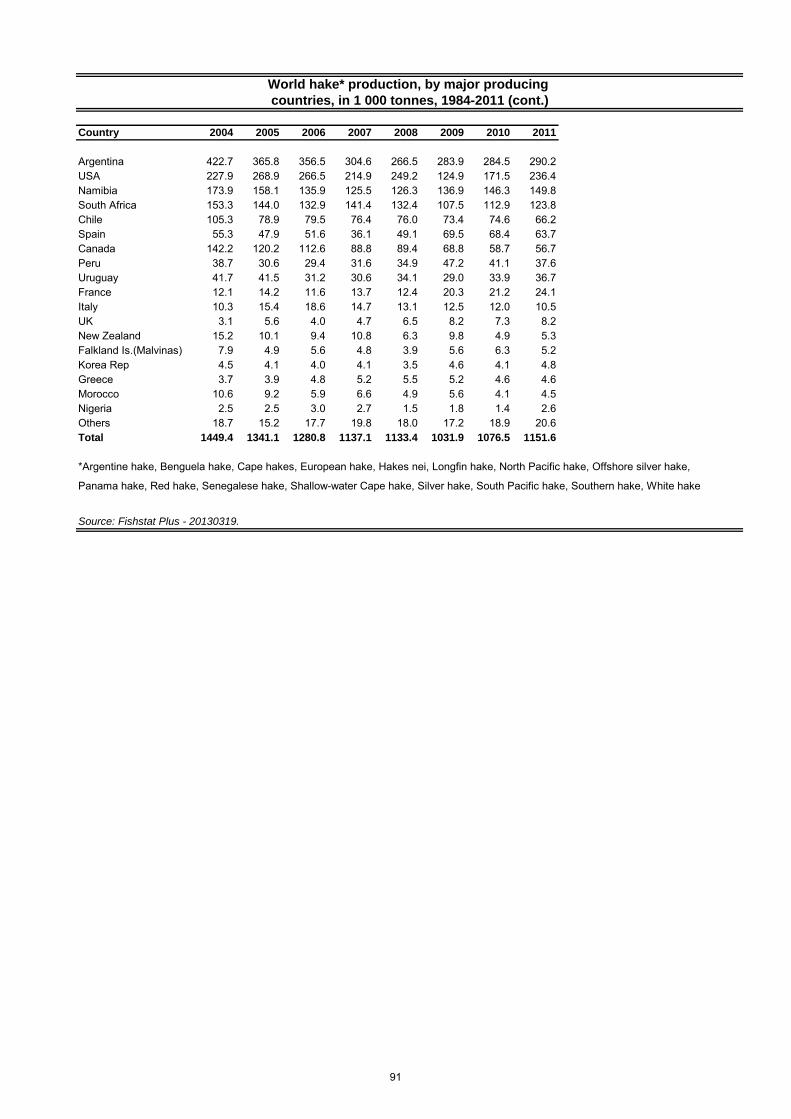
Country 2004 2005 2006 2007 2008 2009 2010 2011
Argentina 422.7 365.8 356.5 304.6 266.5 283.9 284.5 290.2USA 227.9 268.9 266.5 214.9 249.2 124.9 171.5 236.4Namibia 173.9 158.1 135.9 125.5 126.3 136.9 146.3 149.8South Africa 153.3 144.0 132.9 141.4 132.4 107.5 112.9 123.8Chile 105.3 78.9 79.5 76.4 76.0 73.4 74.6 66.2Spain 55.3 47.9 51.6 36.1 49.1 69.5 68.4 63.7Canada 142.2 120.2 112.6 88.8 89.4 68.8 58.7 56.7Peru 38.7 30.6 29.4 31.6 34.9 47.2 41.1 37.6Uruguay 41.7 41.5 31.2 30.6 34.1 29.0 33.9 36.7France 12.1 14.2 11.6 13.7 12.4 20.3 21.2 24.1Italy 10.3 15.4 18.6 14.7 13.1 12.5 12.0 10.5UK 3.1 5.6 4.0 4.7 6.5 8.2 7.3 8.2New Zealand 15.2 10.1 9.4 10.8 6.3 9.8 4.9 5.3Falkland Is.(Malvinas) 7.9 4.9 5.6 4.8 3.9 5.6 6.3 5.2Korea Rep 4.5 4.1 4.0 4.1 3.5 4.6 4.1 4.8Greece 3.7 3.9 4.8 5.2 5.5 5.2 4.6 4.6Morocco 10.6 9.2 5.9 6.6 4.9 5.6 4.1 4.5Nigeria 2.5 2.5 3.0 2.7 1.5 1.8 1.4 2.6Others 18.7 15.2 17.7 19.8 18.0 17.2 18.9 20.6Total 1449.4 1341.1 1280.8 1137.1 1133.4 1031.9 1076.5 1151.6
*Argentine hake, Benguela hake, Cape hakes, European hake, Hakes nei, Longfin hake, North Pacific hake, Offshore silver hake,
Panama hake, Red hake, Senegalese hake, Shallow-water Cape hake, Silver hake, South Pacific hake, Southern hake, White hake
Source: Fishstat Plus - 20130319.
World hake* production, by major producing
countries, in 1 000 tonnes, 1984-2011 (cont.)
91
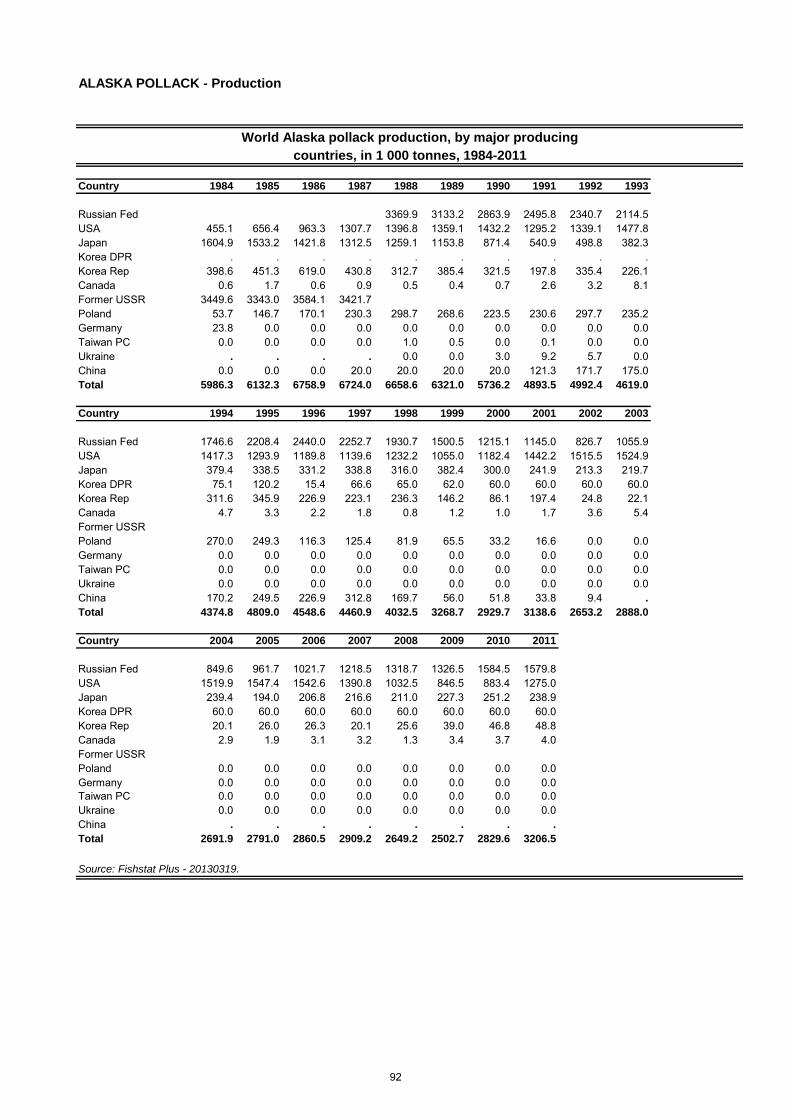
Country 1984 1985 1986 1987 1988 1989 1990 1991 1992 1993
Russian Fed 3369.9 3133.2 2863.9 2495.8 2340.7 2114.5USA 455.1 656.4 963.3 1307.7 1396.8 1359.1 1432.2 1295.2 1339.1 1477.8Japan 1604.9 1533.2 1421.8 1312.5 1259.1 1153.8 871.4 540.9 498.8 382.3Korea DPR . . . . . . . . . .Korea Rep 398.6 451.3 619.0 430.8 312.7 385.4 321.5 197.8 335.4 226.1Canada 0.6 1.7 0.6 0.9 0.5 0.4 0.7 2.6 3.2 8.1Former USSR 3449.6 3343.0 3584.1 3421.7Poland 53.7 146.7 170.1 230.3 298.7 268.6 223.5 230.6 297.7 235.2Germany 23.8 0.0 0.0 0.0 0.0 0.0 0.0 0.0 0.0 0.0Taiwan PC 0.0 0.0 0.0 0.0 1.0 0.5 0.0 0.1 0.0 0.0Ukraine . . . . 0.0 0.0 3.0 9.2 5.7 0.0China 0.0 0.0 0.0 20.0 20.0 20.0 20.0 121.3 171.7 175.0Total 5986.3 6132.3 6758.9 6724.0 6658.6 6321.0 5736.2 4893.5 4992.4 4619.0
Country 1994 1995 1996 1997 1998 1999 2000 2001 2002 2003
Russian Fed 1746.6 2208.4 2440.0 2252.7 1930.7 1500.5 1215.1 1145.0 826.7 1055.9USA 1417.3 1293.9 1189.8 1139.6 1232.2 1055.0 1182.4 1442.2 1515.5 1524.9Japan 379.4 338.5 331.2 338.8 316.0 382.4 300.0 241.9 213.3 219.7Korea DPR 75.1 120.2 15.4 66.6 65.0 62.0 60.0 60.0 60.0 60.0Korea Rep 311.6 345.9 226.9 223.1 236.3 146.2 86.1 197.4 24.8 22.1Canada 4.7 3.3 2.2 1.8 0.8 1.2 1.0 1.7 3.6 5.4Former USSRPoland 270.0 249.3 116.3 125.4 81.9 65.5 33.2 16.6 0.0 0.0Germany 0.0 0.0 0.0 0.0 0.0 0.0 0.0 0.0 0.0 0.0Taiwan PC 0.0 0.0 0.0 0.0 0.0 0.0 0.0 0.0 0.0 0.0Ukraine 0.0 0.0 0.0 0.0 0.0 0.0 0.0 0.0 0.0 0.0China 170.2 249.5 226.9 312.8 169.7 56.0 51.8 33.8 9.4 .
Total 4374.8 4809.0 4548.6 4460.9 4032.5 3268.7 2929.7 3138.6 2653.2 2888.0
Country 2004 2005 2006 2007 2008 2009 2010 2011
Russian Fed 849.6 961.7 1021.7 1218.5 1318.7 1326.5 1584.5 1579.8USA 1519.9 1547.4 1542.6 1390.8 1032.5 846.5 883.4 1275.0Japan 239.4 194.0 206.8 216.6 211.0 227.3 251.2 238.9Korea DPR 60.0 60.0 60.0 60.0 60.0 60.0 60.0 60.0Korea Rep 20.1 26.0 26.3 20.1 25.6 39.0 46.8 48.8Canada 2.9 1.9 3.1 3.2 1.3 3.4 3.7 4.0Former USSRPoland 0.0 0.0 0.0 0.0 0.0 0.0 0.0 0.0Germany 0.0 0.0 0.0 0.0 0.0 0.0 0.0 0.0Taiwan PC 0.0 0.0 0.0 0.0 0.0 0.0 0.0 0.0Ukraine 0.0 0.0 0.0 0.0 0.0 0.0 0.0 0.0China . . . . . . . .
Total 2691.9 2791.0 2860.5 2909.2 2649.2 2502.7 2829.6 3206.5
Source: Fishstat Plus - 20130319.
World Alaska pollack production, by major producing
countries, in 1 000 tonnes, 1984-2011
ALASKA POLLACK - Production
92
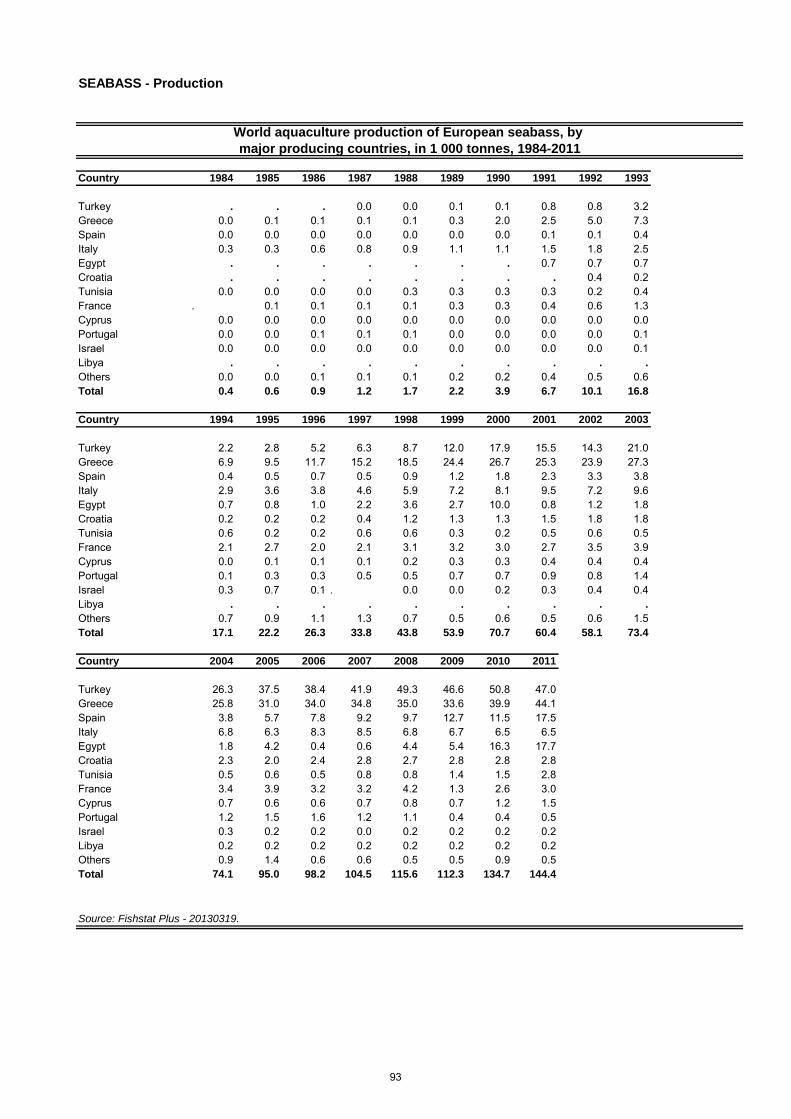
SEABASS - Production
Country 1984 1985 1986 1987 1988 1989 1990 1991 1992 1993
Turkey . . . 0.0 0.0 0.1 0.1 0.8 0.8 3.2Greece 0.0 0.1 0.1 0.1 0.1 0.3 2.0 2.5 5.0 7.3Spain 0.0 0.0 0.0 0.0 0.0 0.0 0.0 0.1 0.1 0.4Italy 0.3 0.3 0.6 0.8 0.9 1.1 1.1 1.5 1.8 2.5Egypt . . . . . . . 0.7 0.7 0.7Croatia . . . . . . . . 0.4 0.2Tunisia 0.0 0.0 0.0 0.0 0.3 0.3 0.3 0.3 0.2 0.4France . 0.1 0.1 0.1 0.1 0.3 0.3 0.4 0.6 1.3Cyprus 0.0 0.0 0.0 0.0 0.0 0.0 0.0 0.0 0.0 0.0Portugal 0.0 0.0 0.1 0.1 0.1 0.0 0.0 0.0 0.0 0.1Israel 0.0 0.0 0.0 0.0 0.0 0.0 0.0 0.0 0.0 0.1Libya . . . . . . . . . .
Others 0.0 0.0 0.1 0.1 0.1 0.2 0.2 0.4 0.5 0.6Total 0.4 0.6 0.9 1.2 1.7 2.2 3.9 6.7 10.1 16.8
Country 1994 1995 1996 1997 1998 1999 2000 2001 2002 2003
Turkey 2.2 2.8 5.2 6.3 8.7 12.0 17.9 15.5 14.3 21.0Greece 6.9 9.5 11.7 15.2 18.5 24.4 26.7 25.3 23.9 27.3Spain 0.4 0.5 0.7 0.5 0.9 1.2 1.8 2.3 3.3 3.8Italy 2.9 3.6 3.8 4.6 5.9 7.2 8.1 9.5 7.2 9.6Egypt 0.7 0.8 1.0 2.2 3.6 2.7 10.0 0.8 1.2 1.8Croatia 0.2 0.2 0.2 0.4 1.2 1.3 1.3 1.5 1.8 1.8Tunisia 0.6 0.2 0.2 0.6 0.6 0.3 0.2 0.5 0.6 0.5France 2.1 2.7 2.0 2.1 3.1 3.2 3.0 2.7 3.5 3.9Cyprus 0.0 0.1 0.1 0.1 0.2 0.3 0.3 0.4 0.4 0.4Portugal 0.1 0.3 0.3 0.5 0.5 0.7 0.7 0.9 0.8 1.4Israel 0.3 0.7 0.1 . 0.0 0.0 0.2 0.3 0.4 0.4Libya . . . . . . . . . .
Others 0.7 0.9 1.1 1.3 0.7 0.5 0.6 0.5 0.6 1.5Total 17.1 22.2 26.3 33.8 43.8 53.9 70.7 60.4 58.1 73.4
Country 2004 2005 2006 2007 2008 2009 2010 2011
Turkey 26.3 37.5 38.4 41.9 49.3 46.6 50.8 47.0Greece 25.8 31.0 34.0 34.8 35.0 33.6 39.9 44.1Spain 3.8 5.7 7.8 9.2 9.7 12.7 11.5 17.5Italy 6.8 6.3 8.3 8.5 6.8 6.7 6.5 6.5Egypt 1.8 4.2 0.4 0.6 4.4 5.4 16.3 17.7Croatia 2.3 2.0 2.4 2.8 2.7 2.8 2.8 2.8Tunisia 0.5 0.6 0.5 0.8 0.8 1.4 1.5 2.8France 3.4 3.9 3.2 3.2 4.2 1.3 2.6 3.0Cyprus 0.7 0.6 0.6 0.7 0.8 0.7 1.2 1.5Portugal 1.2 1.5 1.6 1.2 1.1 0.4 0.4 0.5Israel 0.3 0.2 0.2 0.0 0.2 0.2 0.2 0.2Libya 0.2 0.2 0.2 0.2 0.2 0.2 0.2 0.2Others 0.9 1.4 0.6 0.6 0.5 0.5 0.9 0.5Total 74.1 95.0 98.2 104.5 115.6 112.3 134.7 144.4
Source: Fishstat Plus - 20130319.
World aquaculture production of European seabass, by
major producing countries, in 1 000 tonnes, 1984-2011
93
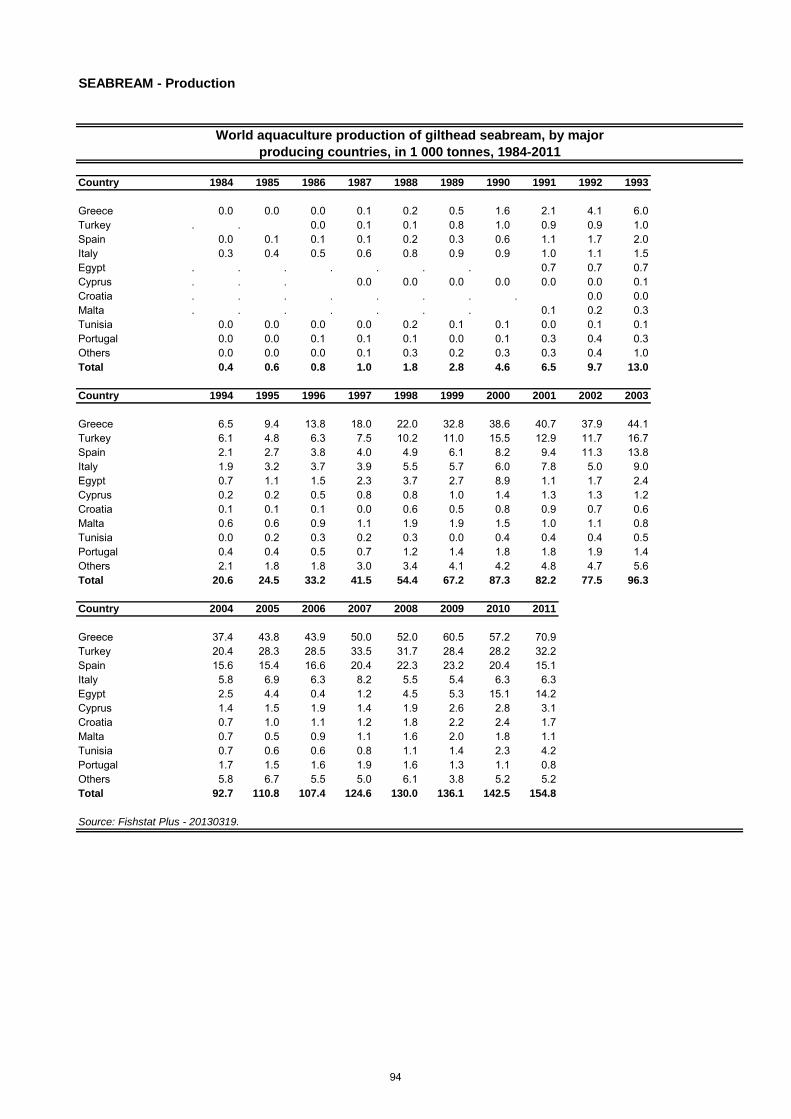
SEABREAM - Production
Country 1984 1985 1986 1987 1988 1989 1990 1991 1992 1993
Greece 0.0 0.0 0.0 0.1 0.2 0.5 1.6 2.1 4.1 6.0Turkey . . 0.0 0.1 0.1 0.8 1.0 0.9 0.9 1.0Spain 0.0 0.1 0.1 0.1 0.2 0.3 0.6 1.1 1.7 2.0Italy 0.3 0.4 0.5 0.6 0.8 0.9 0.9 1.0 1.1 1.5Egypt . . . . . . . 0.7 0.7 0.7Cyprus . . . 0.0 0.0 0.0 0.0 0.0 0.0 0.1Croatia . . . . . . . . 0.0 0.0Malta . . . . . . . 0.1 0.2 0.3Tunisia 0.0 0.0 0.0 0.0 0.2 0.1 0.1 0.0 0.1 0.1Portugal 0.0 0.0 0.1 0.1 0.1 0.0 0.1 0.3 0.4 0.3Others 0.0 0.0 0.0 0.1 0.3 0.2 0.3 0.3 0.4 1.0Total 0.4 0.6 0.8 1.0 1.8 2.8 4.6 6.5 9.7 13.0
Country 1994 1995 1996 1997 1998 1999 2000 2001 2002 2003
Greece 6.5 9.4 13.8 18.0 22.0 32.8 38.6 40.7 37.9 44.1Turkey 6.1 4.8 6.3 7.5 10.2 11.0 15.5 12.9 11.7 16.7Spain 2.1 2.7 3.8 4.0 4.9 6.1 8.2 9.4 11.3 13.8Italy 1.9 3.2 3.7 3.9 5.5 5.7 6.0 7.8 5.0 9.0Egypt 0.7 1.1 1.5 2.3 3.7 2.7 8.9 1.1 1.7 2.4Cyprus 0.2 0.2 0.5 0.8 0.8 1.0 1.4 1.3 1.3 1.2Croatia 0.1 0.1 0.1 0.0 0.6 0.5 0.8 0.9 0.7 0.6Malta 0.6 0.6 0.9 1.1 1.9 1.9 1.5 1.0 1.1 0.8Tunisia 0.0 0.2 0.3 0.2 0.3 0.0 0.4 0.4 0.4 0.5Portugal 0.4 0.4 0.5 0.7 1.2 1.4 1.8 1.8 1.9 1.4Others 2.1 1.8 1.8 3.0 3.4 4.1 4.2 4.8 4.7 5.6Total 20.6 24.5 33.2 41.5 54.4 67.2 87.3 82.2 77.5 96.3
Country 2004 2005 2006 2007 2008 2009 2010 2011
Greece 37.4 43.8 43.9 50.0 52.0 60.5 57.2 70.9Turkey 20.4 28.3 28.5 33.5 31.7 28.4 28.2 32.2Spain 15.6 15.4 16.6 20.4 22.3 23.2 20.4 15.1Italy 5.8 6.9 6.3 8.2 5.5 5.4 6.3 6.3Egypt 2.5 4.4 0.4 1.2 4.5 5.3 15.1 14.2Cyprus 1.4 1.5 1.9 1.4 1.9 2.6 2.8 3.1Croatia 0.7 1.0 1.1 1.2 1.8 2.2 2.4 1.7Malta 0.7 0.5 0.9 1.1 1.6 2.0 1.8 1.1Tunisia 0.7 0.6 0.6 0.8 1.1 1.4 2.3 4.2Portugal 1.7 1.5 1.6 1.9 1.6 1.3 1.1 0.8Others 5.8 6.7 5.5 5.0 6.1 3.8 5.2 5.2Total 92.7 110.8 107.4 124.6 130.0 136.1 142.5 154.8
Source: Fishstat Plus - 20130319.
World aquaculture production of gilthead seabream, by major
producing countries, in 1 000 tonnes, 1984-2011
94
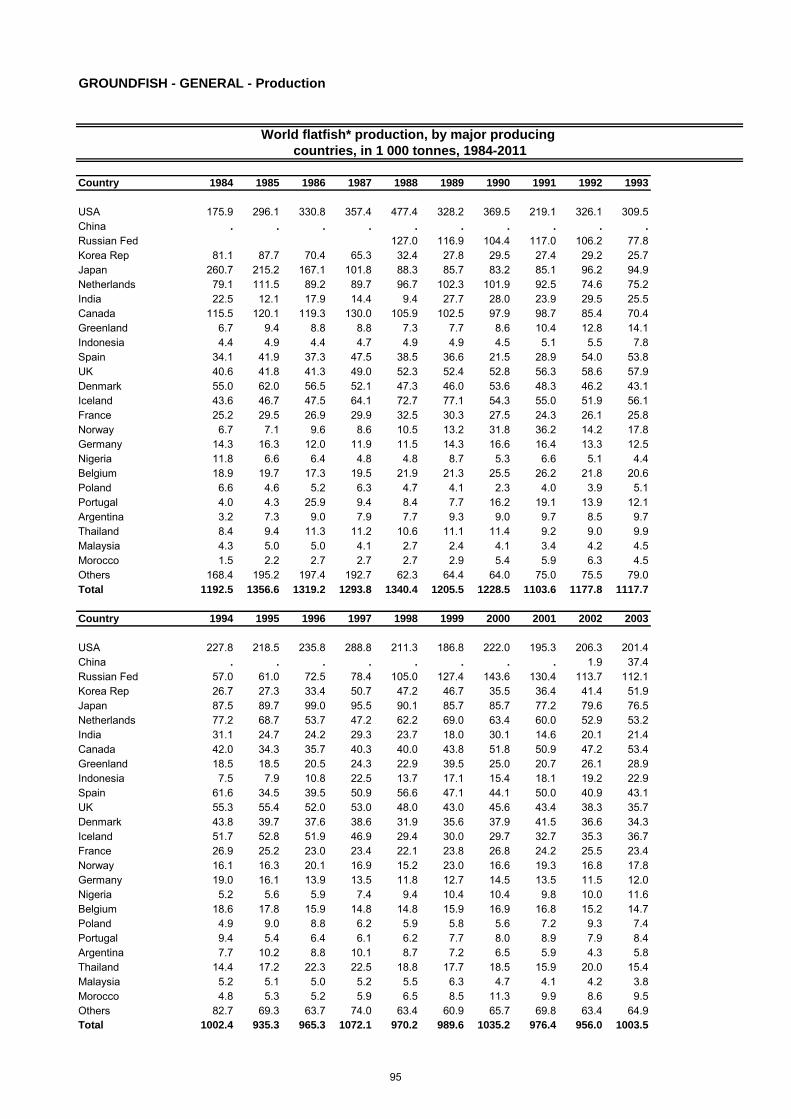
GROUNDFISH - GENERAL - Production
Country 1984 1985 1986 1987 1988 1989 1990 1991 1992 1993
USA 175.9 296.1 330.8 357.4 477.4 328.2 369.5 219.1 326.1 309.5China . . . . . . . . . .
Russian Fed 127.0 116.9 104.4 117.0 106.2 77.8Korea Rep 81.1 87.7 70.4 65.3 32.4 27.8 29.5 27.4 29.2 25.7Japan 260.7 215.2 167.1 101.8 88.3 85.7 83.2 85.1 96.2 94.9Netherlands 79.1 111.5 89.2 89.7 96.7 102.3 101.9 92.5 74.6 75.2India 22.5 12.1 17.9 14.4 9.4 27.7 28.0 23.9 29.5 25.5Canada 115.5 120.1 119.3 130.0 105.9 102.5 97.9 98.7 85.4 70.4Greenland 6.7 9.4 8.8 8.8 7.3 7.7 8.6 10.4 12.8 14.1Indonesia 4.4 4.9 4.4 4.7 4.9 4.9 4.5 5.1 5.5 7.8Spain 34.1 41.9 37.3 47.5 38.5 36.6 21.5 28.9 54.0 53.8UK 40.6 41.8 41.3 49.0 52.3 52.4 52.8 56.3 58.6 57.9Denmark 55.0 62.0 56.5 52.1 47.3 46.0 53.6 48.3 46.2 43.1Iceland 43.6 46.7 47.5 64.1 72.7 77.1 54.3 55.0 51.9 56.1France 25.2 29.5 26.9 29.9 32.5 30.3 27.5 24.3 26.1 25.8Norway 6.7 7.1 9.6 8.6 10.5 13.2 31.8 36.2 14.2 17.8Germany 14.3 16.3 12.0 11.9 11.5 14.3 16.6 16.4 13.3 12.5Nigeria 11.8 6.6 6.4 4.8 4.8 8.7 5.3 6.6 5.1 4.4Belgium 18.9 19.7 17.3 19.5 21.9 21.3 25.5 26.2 21.8 20.6Poland 6.6 4.6 5.2 6.3 4.7 4.1 2.3 4.0 3.9 5.1Portugal 4.0 4.3 25.9 9.4 8.4 7.7 16.2 19.1 13.9 12.1Argentina 3.2 7.3 9.0 7.9 7.7 9.3 9.0 9.7 8.5 9.7Thailand 8.4 9.4 11.3 11.2 10.6 11.1 11.4 9.2 9.0 9.9Malaysia 4.3 5.0 5.0 4.1 2.7 2.4 4.1 3.4 4.2 4.5Morocco 1.5 2.2 2.7 2.7 2.7 2.9 5.4 5.9 6.3 4.5Others 168.4 195.2 197.4 192.7 62.3 64.4 64.0 75.0 75.5 79.0Total 1192.5 1356.6 1319.2 1293.8 1340.4 1205.5 1228.5 1103.6 1177.8 1117.7
Country 1994 1995 1996 1997 1998 1999 2000 2001 2002 2003
USA 227.8 218.5 235.8 288.8 211.3 186.8 222.0 195.3 206.3 201.4China . . . . . . . . 1.9 37.4Russian Fed 57.0 61.0 72.5 78.4 105.0 127.4 143.6 130.4 113.7 112.1Korea Rep 26.7 27.3 33.4 50.7 47.2 46.7 35.5 36.4 41.4 51.9Japan 87.5 89.7 99.0 95.5 90.1 85.7 85.7 77.2 79.6 76.5Netherlands 77.2 68.7 53.7 47.2 62.2 69.0 63.4 60.0 52.9 53.2India 31.1 24.7 24.2 29.3 23.7 18.0 30.1 14.6 20.1 21.4Canada 42.0 34.3 35.7 40.3 40.0 43.8 51.8 50.9 47.2 53.4Greenland 18.5 18.5 20.5 24.3 22.9 39.5 25.0 20.7 26.1 28.9Indonesia 7.5 7.9 10.8 22.5 13.7 17.1 15.4 18.1 19.2 22.9Spain 61.6 34.5 39.5 50.9 56.6 47.1 44.1 50.0 40.9 43.1UK 55.3 55.4 52.0 53.0 48.0 43.0 45.6 43.4 38.3 35.7Denmark 43.8 39.7 37.6 38.6 31.9 35.6 37.9 41.5 36.6 34.3Iceland 51.7 52.8 51.9 46.9 29.4 30.0 29.7 32.7 35.3 36.7France 26.9 25.2 23.0 23.4 22.1 23.8 26.8 24.2 25.5 23.4Norway 16.1 16.3 20.1 16.9 15.2 23.0 16.6 19.3 16.8 17.8Germany 19.0 16.1 13.9 13.5 11.8 12.7 14.5 13.5 11.5 12.0Nigeria 5.2 5.6 5.9 7.4 9.4 10.4 10.4 9.8 10.0 11.6Belgium 18.6 17.8 15.9 14.8 14.8 15.9 16.9 16.8 15.2 14.7Poland 4.9 9.0 8.8 6.2 5.9 5.8 5.6 7.2 9.3 7.4Portugal 9.4 5.4 6.4 6.1 6.2 7.7 8.0 8.9 7.9 8.4Argentina 7.7 10.2 8.8 10.1 8.7 7.2 6.5 5.9 4.3 5.8Thailand 14.4 17.2 22.3 22.5 18.8 17.7 18.5 15.9 20.0 15.4Malaysia 5.2 5.1 5.0 5.2 5.5 6.3 4.7 4.1 4.2 3.8Morocco 4.8 5.3 5.2 5.9 6.5 8.5 11.3 9.9 8.6 9.5Others 82.7 69.3 63.7 74.0 63.4 60.9 65.7 69.8 63.4 64.9Total 1002.4 935.3 965.3 1072.1 970.2 989.6 1035.2 976.4 956.0 1003.5
World flatfish* production, by major producing
countries, in 1 000 tonnes, 1984-2011
95
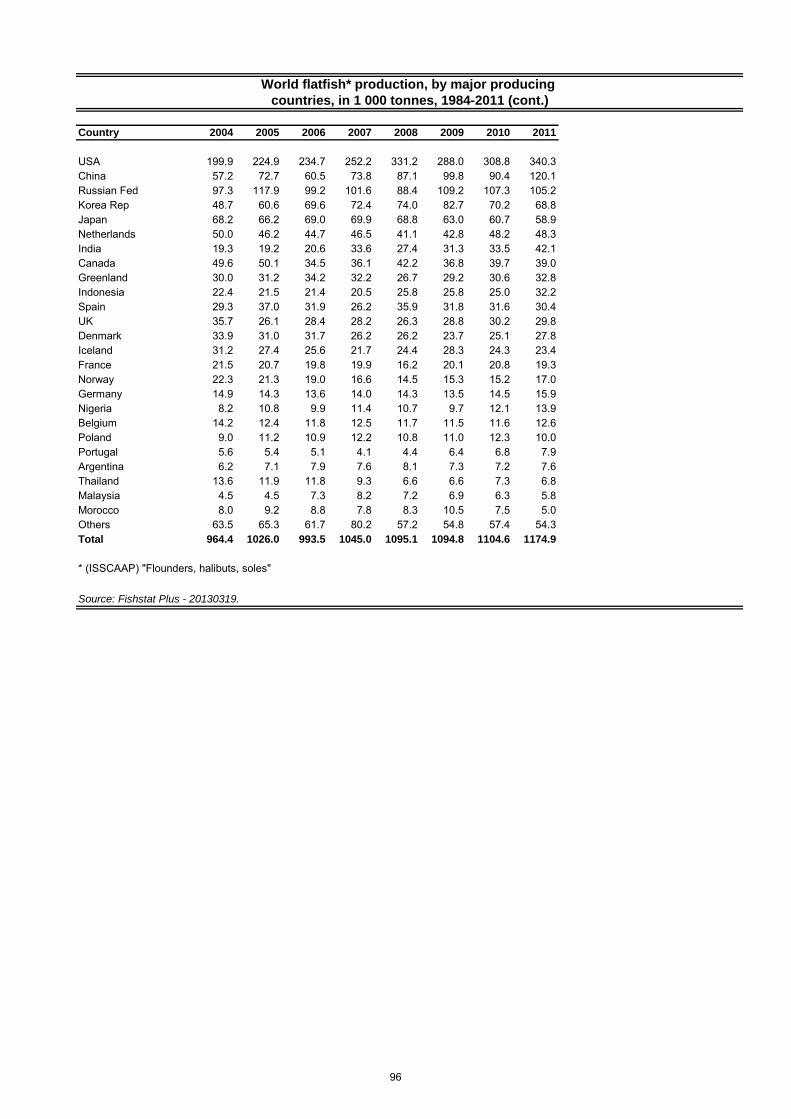
Country 2004 2005 2006 2007 2008 2009 2010 2011
USA 199.9 224.9 234.7 252.2 331.2 288.0 308.8 340.3China 57.2 72.7 60.5 73.8 87.1 99.8 90.4 120.1Russian Fed 97.3 117.9 99.2 101.6 88.4 109.2 107.3 105.2Korea Rep 48.7 60.6 69.6 72.4 74.0 82.7 70.2 68.8Japan 68.2 66.2 69.0 69.9 68.8 63.0 60.7 58.9Netherlands 50.0 46.2 44.7 46.5 41.1 42.8 48.2 48.3India 19.3 19.2 20.6 33.6 27.4 31.3 33.5 42.1Canada 49.6 50.1 34.5 36.1 42.2 36.8 39.7 39.0Greenland 30.0 31.2 34.2 32.2 26.7 29.2 30.6 32.8Indonesia 22.4 21.5 21.4 20.5 25.8 25.8 25.0 32.2Spain 29.3 37.0 31.9 26.2 35.9 31.8 31.6 30.4UK 35.7 26.1 28.4 28.2 26.3 28.8 30.2 29.8Denmark 33.9 31.0 31.7 26.2 26.2 23.7 25.1 27.8Iceland 31.2 27.4 25.6 21.7 24.4 28.3 24.3 23.4France 21.5 20.7 19.8 19.9 16.2 20.1 20.8 19.3Norway 22.3 21.3 19.0 16.6 14.5 15.3 15.2 17.0Germany 14.9 14.3 13.6 14.0 14.3 13.5 14.5 15.9Nigeria 8.2 10.8 9.9 11.4 10.7 9.7 12.1 13.9Belgium 14.2 12.4 11.8 12.5 11.7 11.5 11.6 12.6Poland 9.0 11.2 10.9 12.2 10.8 11.0 12.3 10.0Portugal 5.6 5.4 5.1 4.1 4.4 6.4 6.8 7.9Argentina 6.2 7.1 7.9 7.6 8.1 7.3 7.2 7.6Thailand 13.6 11.9 11.8 9.3 6.6 6.6 7.3 6.8Malaysia 4.5 4.5 7.3 8.2 7.2 6.9 6.3 5.8Morocco 8.0 9.2 8.8 7.8 8.3 10.5 7.5 5.0Others 63.5 65.3 61.7 80.2 57.2 54.8 57.4 54.3Total 964.4 1026.0 993.5 1045.0 1095.1 1094.8 1104.6 1174.9
* (ISSCAAP) "Flounders, halibuts, soles"
Source: Fishstat Plus - 20130319.
World flatfish* production, by major producing
countries, in 1 000 tonnes, 1984-2011 (cont.)
96
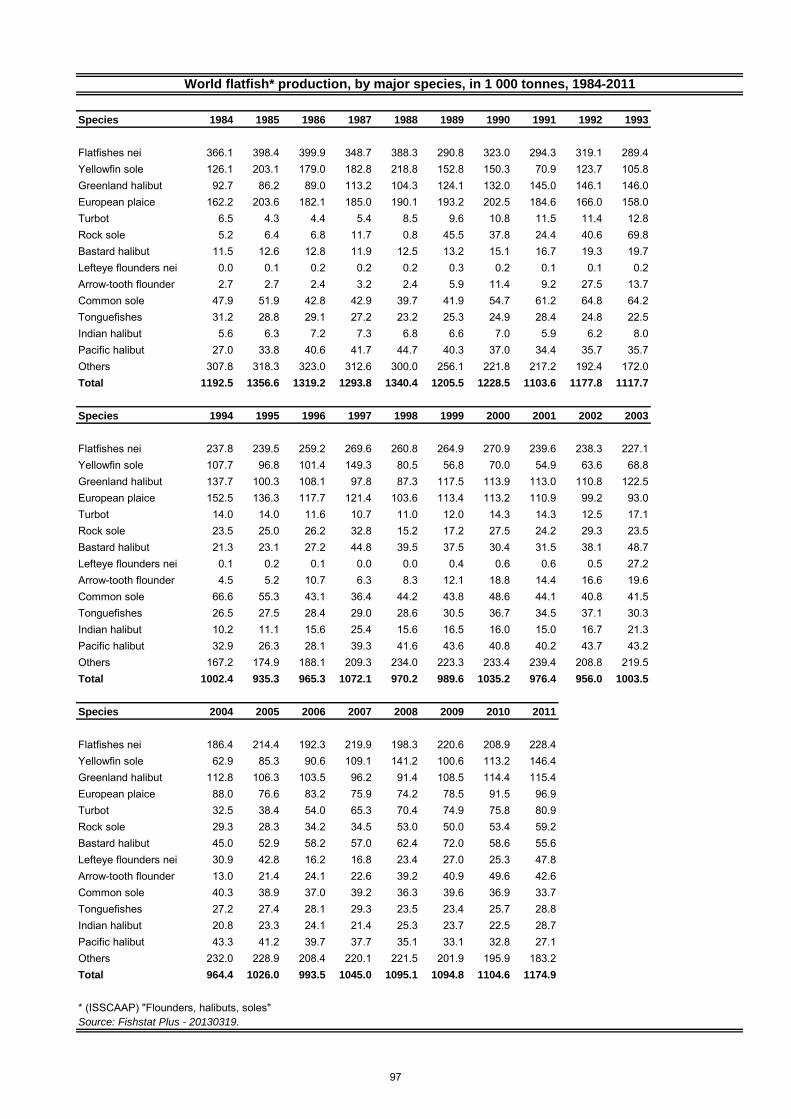
Species 1984 1985 1986 1987 1988 1989 1990 1991 1992 1993
Flatfishes nei 366.1 398.4 399.9 348.7 388.3 290.8 323.0 294.3 319.1 289.4Yellowfin sole 126.1 203.1 179.0 182.8 218.8 152.8 150.3 70.9 123.7 105.8Greenland halibut 92.7 86.2 89.0 113.2 104.3 124.1 132.0 145.0 146.1 146.0European plaice 162.2 203.6 182.1 185.0 190.1 193.2 202.5 184.6 166.0 158.0Turbot 6.5 4.3 4.4 5.4 8.5 9.6 10.8 11.5 11.4 12.8Rock sole 5.2 6.4 6.8 11.7 0.8 45.5 37.8 24.4 40.6 69.8Bastard halibut 11.5 12.6 12.8 11.9 12.5 13.2 15.1 16.7 19.3 19.7Lefteye flounders nei 0.0 0.1 0.2 0.2 0.2 0.3 0.2 0.1 0.1 0.2Arrow-tooth flounder 2.7 2.7 2.4 3.2 2.4 5.9 11.4 9.2 27.5 13.7Common sole 47.9 51.9 42.8 42.9 39.7 41.9 54.7 61.2 64.8 64.2Tonguefishes 31.2 28.8 29.1 27.2 23.2 25.3 24.9 28.4 24.8 22.5Indian halibut 5.6 6.3 7.2 7.3 6.8 6.6 7.0 5.9 6.2 8.0Pacific halibut 27.0 33.8 40.6 41.7 44.7 40.3 37.0 34.4 35.7 35.7Others 307.8 318.3 323.0 312.6 300.0 256.1 221.8 217.2 192.4 172.0Total 1192.5 1356.6 1319.2 1293.8 1340.4 1205.5 1228.5 1103.6 1177.8 1117.7
Species 1994 1995 1996 1997 1998 1999 2000 2001 2002 2003
Flatfishes nei 237.8 239.5 259.2 269.6 260.8 264.9 270.9 239.6 238.3 227.1Yellowfin sole 107.7 96.8 101.4 149.3 80.5 56.8 70.0 54.9 63.6 68.8Greenland halibut 137.7 100.3 108.1 97.8 87.3 117.5 113.9 113.0 110.8 122.5European plaice 152.5 136.3 117.7 121.4 103.6 113.4 113.2 110.9 99.2 93.0Turbot 14.0 14.0 11.6 10.7 11.0 12.0 14.3 14.3 12.5 17.1Rock sole 23.5 25.0 26.2 32.8 15.2 17.2 27.5 24.2 29.3 23.5Bastard halibut 21.3 23.1 27.2 44.8 39.5 37.5 30.4 31.5 38.1 48.7Lefteye flounders nei 0.1 0.2 0.1 0.0 0.0 0.4 0.6 0.6 0.5 27.2Arrow-tooth flounder 4.5 5.2 10.7 6.3 8.3 12.1 18.8 14.4 16.6 19.6Common sole 66.6 55.3 43.1 36.4 44.2 43.8 48.6 44.1 40.8 41.5Tonguefishes 26.5 27.5 28.4 29.0 28.6 30.5 36.7 34.5 37.1 30.3Indian halibut 10.2 11.1 15.6 25.4 15.6 16.5 16.0 15.0 16.7 21.3Pacific halibut 32.9 26.3 28.1 39.3 41.6 43.6 40.8 40.2 43.7 43.2Others 167.2 174.9 188.1 209.3 234.0 223.3 233.4 239.4 208.8 219.5Total 1002.4 935.3 965.3 1072.1 970.2 989.6 1035.2 976.4 956.0 1003.5
Species 2004 2005 2006 2007 2008 2009 2010 2011
Flatfishes nei 186.4 214.4 192.3 219.9 198.3 220.6 208.9 228.4Yellowfin sole 62.9 85.3 90.6 109.1 141.2 100.6 113.2 146.4Greenland halibut 112.8 106.3 103.5 96.2 91.4 108.5 114.4 115.4European plaice 88.0 76.6 83.2 75.9 74.2 78.5 91.5 96.9Turbot 32.5 38.4 54.0 65.3 70.4 74.9 75.8 80.9Rock sole 29.3 28.3 34.2 34.5 53.0 50.0 53.4 59.2Bastard halibut 45.0 52.9 58.2 57.0 62.4 72.0 58.6 55.6Lefteye flounders nei 30.9 42.8 16.2 16.8 23.4 27.0 25.3 47.8Arrow-tooth flounder 13.0 21.4 24.1 22.6 39.2 40.9 49.6 42.6Common sole 40.3 38.9 37.0 39.2 36.3 39.6 36.9 33.7Tonguefishes 27.2 27.4 28.1 29.3 23.5 23.4 25.7 28.8Indian halibut 20.8 23.3 24.1 21.4 25.3 23.7 22.5 28.7Pacific halibut 43.3 41.2 39.7 37.7 35.1 33.1 32.8 27.1Others 232.0 228.9 208.4 220.1 221.5 201.9 195.9 183.2Total 964.4 1026.0 993.5 1045.0 1095.1 1094.8 1104.6 1174.9
* (ISSCAAP) "Flounders, halibuts, soles"Source: Fishstat Plus - 20130319.
World flatfish* production, by major species, in 1 000 tonnes, 1984-2011
97
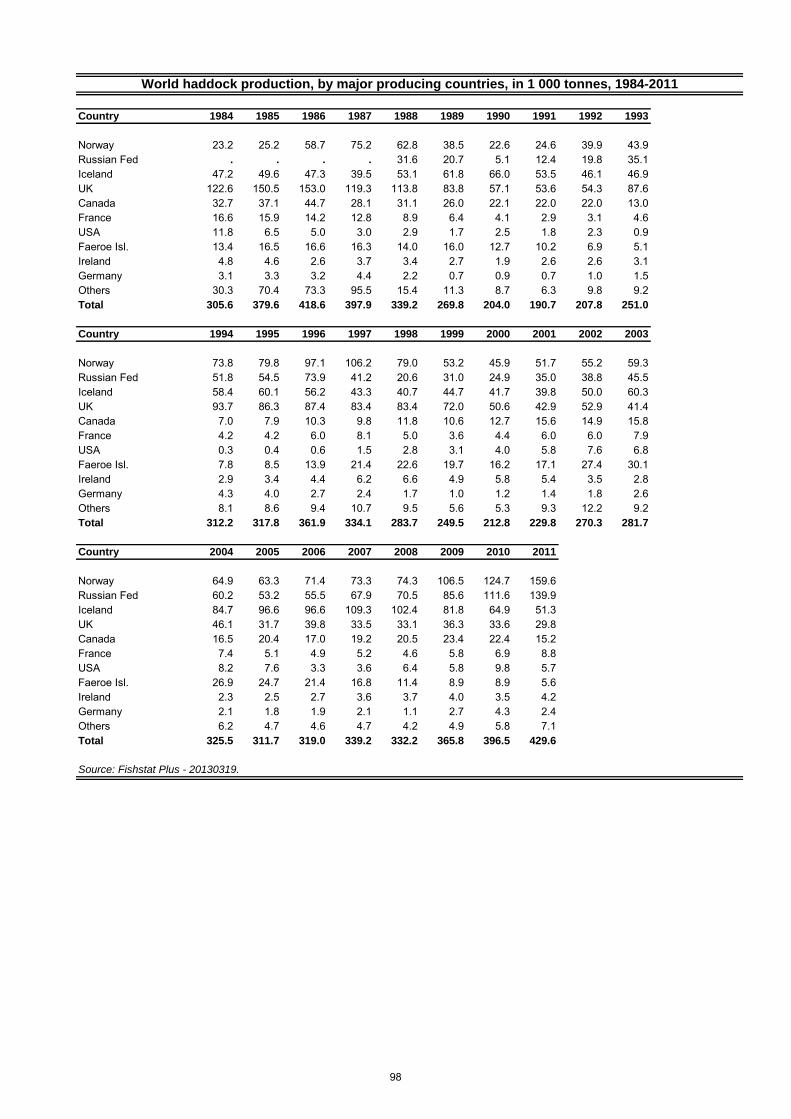
Country 1984 1985 1986 1987 1988 1989 1990 1991 1992 1993
Norway 23.2 25.2 58.7 75.2 62.8 38.5 22.6 24.6 39.9 43.9Russian Fed . . . . 31.6 20.7 5.1 12.4 19.8 35.1Iceland 47.2 49.6 47.3 39.5 53.1 61.8 66.0 53.5 46.1 46.9UK 122.6 150.5 153.0 119.3 113.8 83.8 57.1 53.6 54.3 87.6Canada 32.7 37.1 44.7 28.1 31.1 26.0 22.1 22.0 22.0 13.0France 16.6 15.9 14.2 12.8 8.9 6.4 4.1 2.9 3.1 4.6USA 11.8 6.5 5.0 3.0 2.9 1.7 2.5 1.8 2.3 0.9Faeroe Isl. 13.4 16.5 16.6 16.3 14.0 16.0 12.7 10.2 6.9 5.1Ireland 4.8 4.6 2.6 3.7 3.4 2.7 1.9 2.6 2.6 3.1Germany 3.1 3.3 3.2 4.4 2.2 0.7 0.9 0.7 1.0 1.5Others 30.3 70.4 73.3 95.5 15.4 11.3 8.7 6.3 9.8 9.2Total 305.6 379.6 418.6 397.9 339.2 269.8 204.0 190.7 207.8 251.0
Country 1994 1995 1996 1997 1998 1999 2000 2001 2002 2003
Norway 73.8 79.8 97.1 106.2 79.0 53.2 45.9 51.7 55.2 59.3Russian Fed 51.8 54.5 73.9 41.2 20.6 31.0 24.9 35.0 38.8 45.5Iceland 58.4 60.1 56.2 43.3 40.7 44.7 41.7 39.8 50.0 60.3UK 93.7 86.3 87.4 83.4 83.4 72.0 50.6 42.9 52.9 41.4Canada 7.0 7.9 10.3 9.8 11.8 10.6 12.7 15.6 14.9 15.8France 4.2 4.2 6.0 8.1 5.0 3.6 4.4 6.0 6.0 7.9USA 0.3 0.4 0.6 1.5 2.8 3.1 4.0 5.8 7.6 6.8Faeroe Isl. 7.8 8.5 13.9 21.4 22.6 19.7 16.2 17.1 27.4 30.1Ireland 2.9 3.4 4.4 6.2 6.6 4.9 5.8 5.4 3.5 2.8Germany 4.3 4.0 2.7 2.4 1.7 1.0 1.2 1.4 1.8 2.6Others 8.1 8.6 9.4 10.7 9.5 5.6 5.3 9.3 12.2 9.2Total 312.2 317.8 361.9 334.1 283.7 249.5 212.8 229.8 270.3 281.7
Country 2004 2005 2006 2007 2008 2009 2010 2011
Norway 64.9 63.3 71.4 73.3 74.3 106.5 124.7 159.6Russian Fed 60.2 53.2 55.5 67.9 70.5 85.6 111.6 139.9Iceland 84.7 96.6 96.6 109.3 102.4 81.8 64.9 51.3UK 46.1 31.7 39.8 33.5 33.1 36.3 33.6 29.8Canada 16.5 20.4 17.0 19.2 20.5 23.4 22.4 15.2France 7.4 5.1 4.9 5.2 4.6 5.8 6.9 8.8USA 8.2 7.6 3.3 3.6 6.4 5.8 9.8 5.7Faeroe Isl. 26.9 24.7 21.4 16.8 11.4 8.9 8.9 5.6Ireland 2.3 2.5 2.7 3.6 3.7 4.0 3.5 4.2Germany 2.1 1.8 1.9 2.1 1.1 2.7 4.3 2.4Others 6.2 4.7 4.6 4.7 4.2 4.9 5.8 7.1Total 325.5 311.7 319.0 339.2 332.2 365.8 396.5 429.6
Source: Fishstat Plus - 20130319.
World haddock production, by major producing countries, in 1 000 tonnes, 1984-2011
98
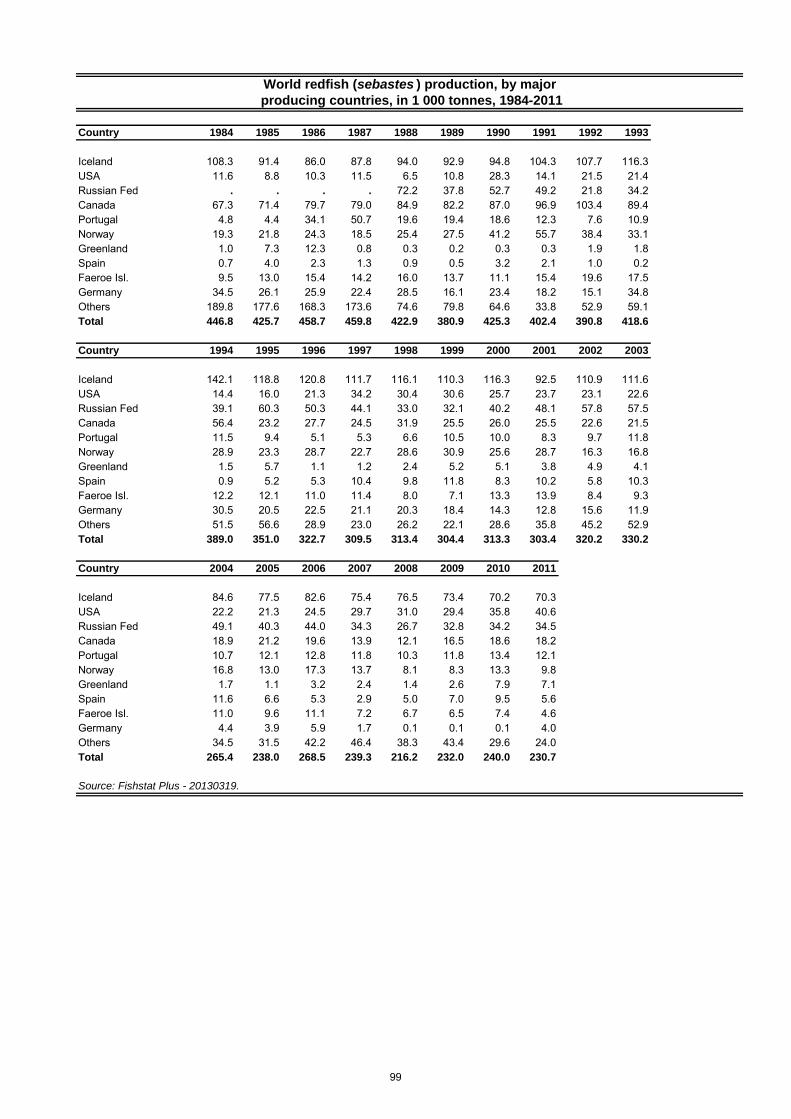
Country 1984 1985 1986 1987 1988 1989 1990 1991 1992 1993
Iceland 108.3 91.4 86.0 87.8 94.0 92.9 94.8 104.3 107.7 116.3USA 11.6 8.8 10.3 11.5 6.5 10.8 28.3 14.1 21.5 21.4Russian Fed . . . . 72.2 37.8 52.7 49.2 21.8 34.2Canada 67.3 71.4 79.7 79.0 84.9 82.2 87.0 96.9 103.4 89.4Portugal 4.8 4.4 34.1 50.7 19.6 19.4 18.6 12.3 7.6 10.9Norway 19.3 21.8 24.3 18.5 25.4 27.5 41.2 55.7 38.4 33.1Greenland 1.0 7.3 12.3 0.8 0.3 0.2 0.3 0.3 1.9 1.8Spain 0.7 4.0 2.3 1.3 0.9 0.5 3.2 2.1 1.0 0.2Faeroe Isl. 9.5 13.0 15.4 14.2 16.0 13.7 11.1 15.4 19.6 17.5Germany 34.5 26.1 25.9 22.4 28.5 16.1 23.4 18.2 15.1 34.8Others 189.8 177.6 168.3 173.6 74.6 79.8 64.6 33.8 52.9 59.1Total 446.8 425.7 458.7 459.8 422.9 380.9 425.3 402.4 390.8 418.6
Country 1994 1995 1996 1997 1998 1999 2000 2001 2002 2003
Iceland 142.1 118.8 120.8 111.7 116.1 110.3 116.3 92.5 110.9 111.6USA 14.4 16.0 21.3 34.2 30.4 30.6 25.7 23.7 23.1 22.6Russian Fed 39.1 60.3 50.3 44.1 33.0 32.1 40.2 48.1 57.8 57.5Canada 56.4 23.2 27.7 24.5 31.9 25.5 26.0 25.5 22.6 21.5Portugal 11.5 9.4 5.1 5.3 6.6 10.5 10.0 8.3 9.7 11.8Norway 28.9 23.3 28.7 22.7 28.6 30.9 25.6 28.7 16.3 16.8Greenland 1.5 5.7 1.1 1.2 2.4 5.2 5.1 3.8 4.9 4.1Spain 0.9 5.2 5.3 10.4 9.8 11.8 8.3 10.2 5.8 10.3Faeroe Isl. 12.2 12.1 11.0 11.4 8.0 7.1 13.3 13.9 8.4 9.3Germany 30.5 20.5 22.5 21.1 20.3 18.4 14.3 12.8 15.6 11.9Others 51.5 56.6 28.9 23.0 26.2 22.1 28.6 35.8 45.2 52.9Total 389.0 351.0 322.7 309.5 313.4 304.4 313.3 303.4 320.2 330.2
Country 2004 2005 2006 2007 2008 2009 2010 2011
Iceland 84.6 77.5 82.6 75.4 76.5 73.4 70.2 70.3USA 22.2 21.3 24.5 29.7 31.0 29.4 35.8 40.6Russian Fed 49.1 40.3 44.0 34.3 26.7 32.8 34.2 34.5Canada 18.9 21.2 19.6 13.9 12.1 16.5 18.6 18.2Portugal 10.7 12.1 12.8 11.8 10.3 11.8 13.4 12.1Norway 16.8 13.0 17.3 13.7 8.1 8.3 13.3 9.8Greenland 1.7 1.1 3.2 2.4 1.4 2.6 7.9 7.1Spain 11.6 6.6 5.3 2.9 5.0 7.0 9.5 5.6Faeroe Isl. 11.0 9.6 11.1 7.2 6.7 6.5 7.4 4.6Germany 4.4 3.9 5.9 1.7 0.1 0.1 0.1 4.0Others 34.5 31.5 42.2 46.4 38.3 43.4 29.6 24.0Total 265.4 238.0 268.5 239.3 216.2 232.0 240.0 230.7
Source: Fishstat Plus - 20130319.
producing countries, in 1 000 tonnes, 1984-2011
World redfish (sebastes ) production, by major
99
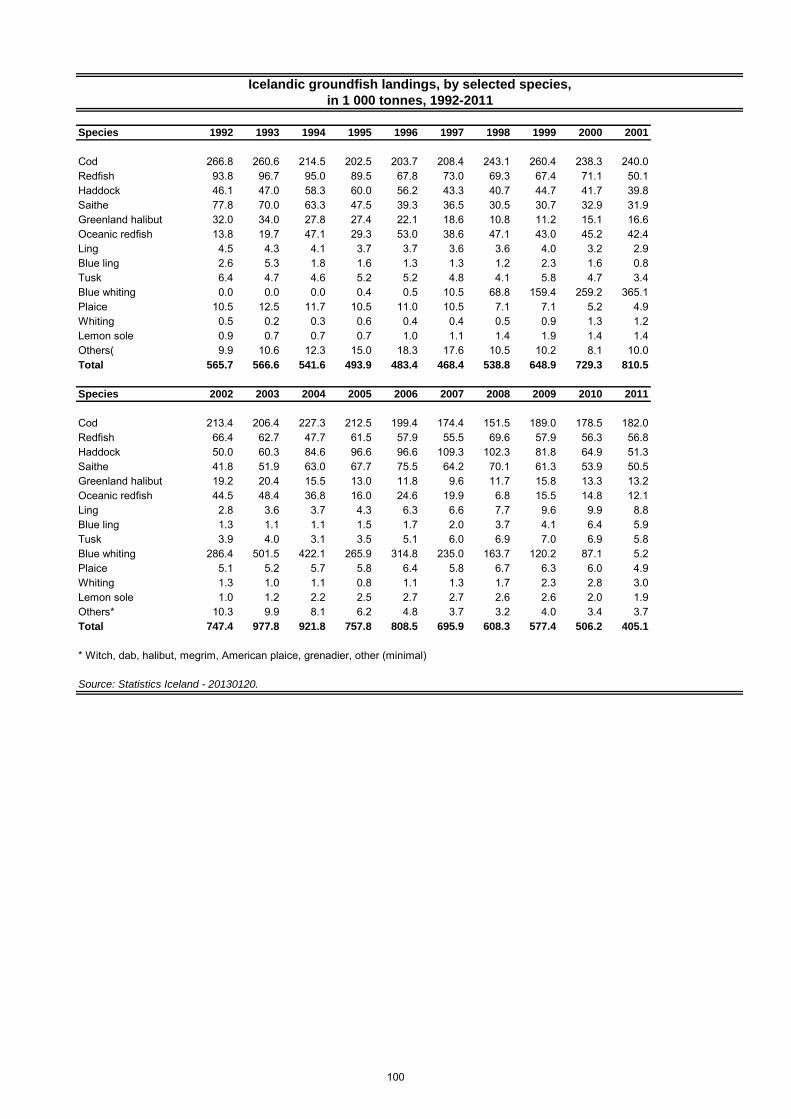
Species 1992 1993 1994 1995 1996 1997 1998 1999 2000 2001
Cod 266.8 260.6 214.5 202.5 203.7 208.4 243.1 260.4 238.3 240.0Redfish 93.8 96.7 95.0 89.5 67.8 73.0 69.3 67.4 71.1 50.1Haddock 46.1 47.0 58.3 60.0 56.2 43.3 40.7 44.7 41.7 39.8Saithe 77.8 70.0 63.3 47.5 39.3 36.5 30.5 30.7 32.9 31.9Greenland halibut 32.0 34.0 27.8 27.4 22.1 18.6 10.8 11.2 15.1 16.6Oceanic redfish 13.8 19.7 47.1 29.3 53.0 38.6 47.1 43.0 45.2 42.4Ling 4.5 4.3 4.1 3.7 3.7 3.6 3.6 4.0 3.2 2.9Blue ling 2.6 5.3 1.8 1.6 1.3 1.3 1.2 2.3 1.6 0.8Tusk 6.4 4.7 4.6 5.2 5.2 4.8 4.1 5.8 4.7 3.4Blue whiting 0.0 0.0 0.0 0.4 0.5 10.5 68.8 159.4 259.2 365.1Plaice 10.5 12.5 11.7 10.5 11.0 10.5 7.1 7.1 5.2 4.9Whiting 0.5 0.2 0.3 0.6 0.4 0.4 0.5 0.9 1.3 1.2Lemon sole 0.9 0.7 0.7 0.7 1.0 1.1 1.4 1.9 1.4 1.4Others( 9.9 10.6 12.3 15.0 18.3 17.6 10.5 10.2 8.1 10.0Total 565.7 566.6 541.6 493.9 483.4 468.4 538.8 648.9 729.3 810.5
Species 2002 2003 2004 2005 2006 2007 2008 2009 2010 2011
Cod 213.4 206.4 227.3 212.5 199.4 174.4 151.5 189.0 178.5 182.0Redfish 66.4 62.7 47.7 61.5 57.9 55.5 69.6 57.9 56.3 56.8Haddock 50.0 60.3 84.6 96.6 96.6 109.3 102.3 81.8 64.9 51.3Saithe 41.8 51.9 63.0 67.7 75.5 64.2 70.1 61.3 53.9 50.5Greenland halibut 19.2 20.4 15.5 13.0 11.8 9.6 11.7 15.8 13.3 13.2Oceanic redfish 44.5 48.4 36.8 16.0 24.6 19.9 6.8 15.5 14.8 12.1Ling 2.8 3.6 3.7 4.3 6.3 6.6 7.7 9.6 9.9 8.8Blue ling 1.3 1.1 1.1 1.5 1.7 2.0 3.7 4.1 6.4 5.9Tusk 3.9 4.0 3.1 3.5 5.1 6.0 6.9 7.0 6.9 5.8Blue whiting 286.4 501.5 422.1 265.9 314.8 235.0 163.7 120.2 87.1 5.2Plaice 5.1 5.2 5.7 5.8 6.4 5.8 6.7 6.3 6.0 4.9Whiting 1.3 1.0 1.1 0.8 1.1 1.3 1.7 2.3 2.8 3.0Lemon sole 1.0 1.2 2.2 2.5 2.7 2.7 2.6 2.6 2.0 1.9Others* 10.3 9.9 8.1 6.2 4.8 3.7 3.2 4.0 3.4 3.7Total 747.4 977.8 921.8 757.8 808.5 695.9 608.3 577.4 506.2 405.1
* Witch, dab, halibut, megrim, American plaice, grenadier, other (minimal)
Source: Statistics Iceland - 20130120.
Icelandic groundfish landings, by selected species,
in 1 000 tonnes, 1992-2011
100
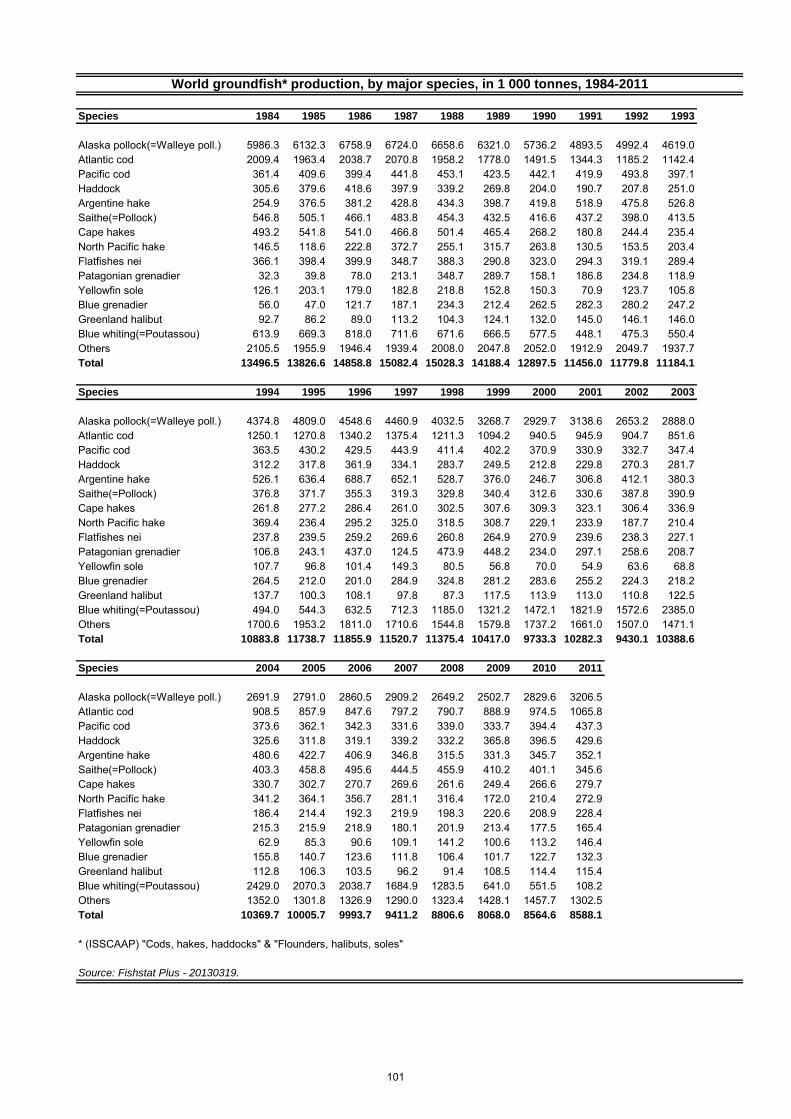
Species 1984 1985 1986 1987 1988 1989 1990 1991 1992 1993
Alaska pollock(=Walleye poll.) 5986.3 6132.3 6758.9 6724.0 6658.6 6321.0 5736.2 4893.5 4992.4 4619.0Atlantic cod 2009.4 1963.4 2038.7 2070.8 1958.2 1778.0 1491.5 1344.3 1185.2 1142.4Pacific cod 361.4 409.6 399.4 441.8 453.1 423.5 442.1 419.9 493.8 397.1Haddock 305.6 379.6 418.6 397.9 339.2 269.8 204.0 190.7 207.8 251.0Argentine hake 254.9 376.5 381.2 428.8 434.3 398.7 419.8 518.9 475.8 526.8Saithe(=Pollock) 546.8 505.1 466.1 483.8 454.3 432.5 416.6 437.2 398.0 413.5Cape hakes 493.2 541.8 541.0 466.8 501.4 465.4 268.2 180.8 244.4 235.4North Pacific hake 146.5 118.6 222.8 372.7 255.1 315.7 263.8 130.5 153.5 203.4Flatfishes nei 366.1 398.4 399.9 348.7 388.3 290.8 323.0 294.3 319.1 289.4Patagonian grenadier 32.3 39.8 78.0 213.1 348.7 289.7 158.1 186.8 234.8 118.9Yellowfin sole 126.1 203.1 179.0 182.8 218.8 152.8 150.3 70.9 123.7 105.8Blue grenadier 56.0 47.0 121.7 187.1 234.3 212.4 262.5 282.3 280.2 247.2Greenland halibut 92.7 86.2 89.0 113.2 104.3 124.1 132.0 145.0 146.1 146.0Blue whiting(=Poutassou) 613.9 669.3 818.0 711.6 671.6 666.5 577.5 448.1 475.3 550.4Others 2105.5 1955.9 1946.4 1939.4 2008.0 2047.8 2052.0 1912.9 2049.7 1937.7Total 13496.5 13826.6 14858.8 15082.4 15028.3 14188.4 12897.5 11456.0 11779.8 11184.1
Species 1994 1995 1996 1997 1998 1999 2000 2001 2002 2003
Alaska pollock(=Walleye poll.) 4374.8 4809.0 4548.6 4460.9 4032.5 3268.7 2929.7 3138.6 2653.2 2888.0Atlantic cod 1250.1 1270.8 1340.2 1375.4 1211.3 1094.2 940.5 945.9 904.7 851.6Pacific cod 363.5 430.2 429.5 443.9 411.4 402.2 370.9 330.9 332.7 347.4Haddock 312.2 317.8 361.9 334.1 283.7 249.5 212.8 229.8 270.3 281.7Argentine hake 526.1 636.4 688.7 652.1 528.7 376.0 246.7 306.8 412.1 380.3Saithe(=Pollock) 376.8 371.7 355.3 319.3 329.8 340.4 312.6 330.6 387.8 390.9Cape hakes 261.8 277.2 286.4 261.0 302.5 307.6 309.3 323.1 306.4 336.9North Pacific hake 369.4 236.4 295.2 325.0 318.5 308.7 229.1 233.9 187.7 210.4Flatfishes nei 237.8 239.5 259.2 269.6 260.8 264.9 270.9 239.6 238.3 227.1Patagonian grenadier 106.8 243.1 437.0 124.5 473.9 448.2 234.0 297.1 258.6 208.7Yellowfin sole 107.7 96.8 101.4 149.3 80.5 56.8 70.0 54.9 63.6 68.8Blue grenadier 264.5 212.0 201.0 284.9 324.8 281.2 283.6 255.2 224.3 218.2Greenland halibut 137.7 100.3 108.1 97.8 87.3 117.5 113.9 113.0 110.8 122.5Blue whiting(=Poutassou) 494.0 544.3 632.5 712.3 1185.0 1321.2 1472.1 1821.9 1572.6 2385.0Others 1700.6 1953.2 1811.0 1710.6 1544.8 1579.8 1737.2 1661.0 1507.0 1471.1Total 10883.8 11738.7 11855.9 11520.7 11375.4 10417.0 9733.3 10282.3 9430.1 10388.6
Species 2004 2005 2006 2007 2008 2009 2010 2011
Alaska pollock(=Walleye poll.) 2691.9 2791.0 2860.5 2909.2 2649.2 2502.7 2829.6 3206.5Atlantic cod 908.5 857.9 847.6 797.2 790.7 888.9 974.5 1065.8Pacific cod 373.6 362.1 342.3 331.6 339.0 333.7 394.4 437.3Haddock 325.6 311.8 319.1 339.2 332.2 365.8 396.5 429.6Argentine hake 480.6 422.7 406.9 346.8 315.5 331.3 345.7 352.1Saithe(=Pollock) 403.3 458.8 495.6 444.5 455.9 410.2 401.1 345.6Cape hakes 330.7 302.7 270.7 269.6 261.6 249.4 266.6 279.7North Pacific hake 341.2 364.1 356.7 281.1 316.4 172.0 210.4 272.9Flatfishes nei 186.4 214.4 192.3 219.9 198.3 220.6 208.9 228.4Patagonian grenadier 215.3 215.9 218.9 180.1 201.9 213.4 177.5 165.4Yellowfin sole 62.9 85.3 90.6 109.1 141.2 100.6 113.2 146.4Blue grenadier 155.8 140.7 123.6 111.8 106.4 101.7 122.7 132.3Greenland halibut 112.8 106.3 103.5 96.2 91.4 108.5 114.4 115.4Blue whiting(=Poutassou) 2429.0 2070.3 2038.7 1684.9 1283.5 641.0 551.5 108.2Others 1352.0 1301.8 1326.9 1290.0 1323.4 1428.1 1457.7 1302.5Total 10369.7 10005.7 9993.7 9411.2 8806.6 8068.0 8564.6 8588.1
* (ISSCAAP) "Cods, hakes, haddocks" & "Flounders, halibuts, soles"
Source: Fishstat Plus - 20130319.
World groundfish* production, by major species, in 1 000 tonnes, 1984-2011
101
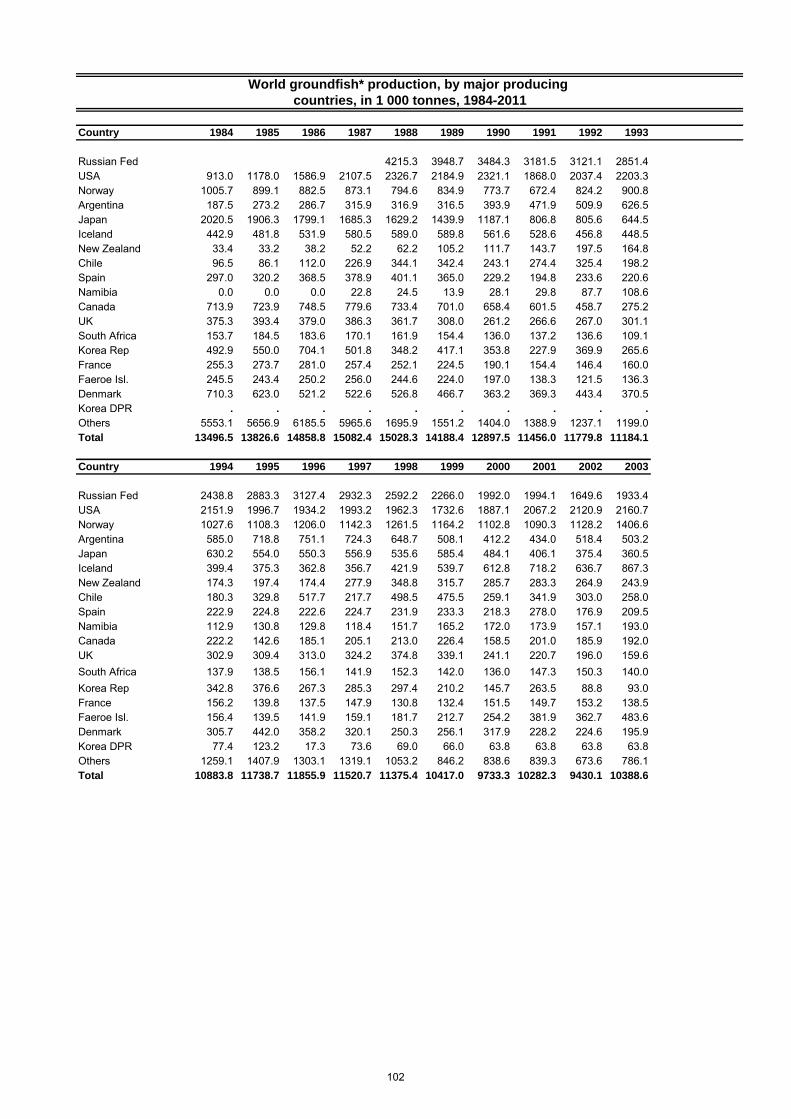
Country 1984 1985 1986 1987 1988 1989 1990 1991 1992 1993
Russian Fed 4215.3 3948.7 3484.3 3181.5 3121.1 2851.4USA 913.0 1178.0 1586.9 2107.5 2326.7 2184.9 2321.1 1868.0 2037.4 2203.3Norway 1005.7 899.1 882.5 873.1 794.6 834.9 773.7 672.4 824.2 900.8Argentina 187.5 273.2 286.7 315.9 316.9 316.5 393.9 471.9 509.9 626.5Japan 2020.5 1906.3 1799.1 1685.3 1629.2 1439.9 1187.1 806.8 805.6 644.5Iceland 442.9 481.8 531.9 580.5 589.0 589.8 561.6 528.6 456.8 448.5New Zealand 33.4 33.2 38.2 52.2 62.2 105.2 111.7 143.7 197.5 164.8Chile 96.5 86.1 112.0 226.9 344.1 342.4 243.1 274.4 325.4 198.2Spain 297.0 320.2 368.5 378.9 401.1 365.0 229.2 194.8 233.6 220.6Namibia 0.0 0.0 0.0 22.8 24.5 13.9 28.1 29.8 87.7 108.6Canada 713.9 723.9 748.5 779.6 733.4 701.0 658.4 601.5 458.7 275.2UK 375.3 393.4 379.0 386.3 361.7 308.0 261.2 266.6 267.0 301.1South Africa 153.7 184.5 183.6 170.1 161.9 154.4 136.0 137.2 136.6 109.1Korea Rep 492.9 550.0 704.1 501.8 348.2 417.1 353.8 227.9 369.9 265.6France 255.3 273.7 281.0 257.4 252.1 224.5 190.1 154.4 146.4 160.0Faeroe Isl. 245.5 243.4 250.2 256.0 244.6 224.0 197.0 138.3 121.5 136.3Denmark 710.3 623.0 521.2 522.6 526.8 466.7 363.2 369.3 443.4 370.5Korea DPR . . . . . . . . . .
Others 5553.1 5656.9 6185.5 5965.6 1695.9 1551.2 1404.0 1388.9 1237.1 1199.0Total 13496.5 13826.6 14858.8 15082.4 15028.3 14188.4 12897.5 11456.0 11779.8 11184.1
Country 1994 1995 1996 1997 1998 1999 2000 2001 2002 2003
Russian Fed 2438.8 2883.3 3127.4 2932.3 2592.2 2266.0 1992.0 1994.1 1649.6 1933.4USA 2151.9 1996.7 1934.2 1993.2 1962.3 1732.6 1887.1 2067.2 2120.9 2160.7Norway 1027.6 1108.3 1206.0 1142.3 1261.5 1164.2 1102.8 1090.3 1128.2 1406.6Argentina 585.0 718.8 751.1 724.3 648.7 508.1 412.2 434.0 518.4 503.2Japan 630.2 554.0 550.3 556.9 535.6 585.4 484.1 406.1 375.4 360.5Iceland 399.4 375.3 362.8 356.7 421.9 539.7 612.8 718.2 636.7 867.3New Zealand 174.3 197.4 174.4 277.9 348.8 315.7 285.7 283.3 264.9 243.9Chile 180.3 329.8 517.7 217.7 498.5 475.5 259.1 341.9 303.0 258.0Spain 222.9 224.8 222.6 224.7 231.9 233.3 218.3 278.0 176.9 209.5Namibia 112.9 130.8 129.8 118.4 151.7 165.2 172.0 173.9 157.1 193.0Canada 222.2 142.6 185.1 205.1 213.0 226.4 158.5 201.0 185.9 192.0UK 302.9 309.4 313.0 324.2 374.8 339.1 241.1 220.7 196.0 159.6South Africa 137.9 138.5 156.1 141.9 152.3 142.0 136.0 147.3 150.3 140.0Korea Rep 342.8 376.6 267.3 285.3 297.4 210.2 145.7 263.5 88.8 93.0France 156.2 139.8 137.5 147.9 130.8 132.4 151.5 149.7 153.2 138.5Faeroe Isl. 156.4 139.5 141.9 159.1 181.7 212.7 254.2 381.9 362.7 483.6Denmark 305.7 442.0 358.2 320.1 250.3 256.1 317.9 228.2 224.6 195.9Korea DPR 77.4 123.2 17.3 73.6 69.0 66.0 63.8 63.8 63.8 63.8Others 1259.1 1407.9 1303.1 1319.1 1053.2 846.2 838.6 839.3 673.6 786.1Total 10883.8 11738.7 11855.9 11520.7 11375.4 10417.0 9733.3 10282.3 9430.1 10388.6
countries, in 1 000 tonnes, 1984-2011
World groundfish* production, by major producing
102
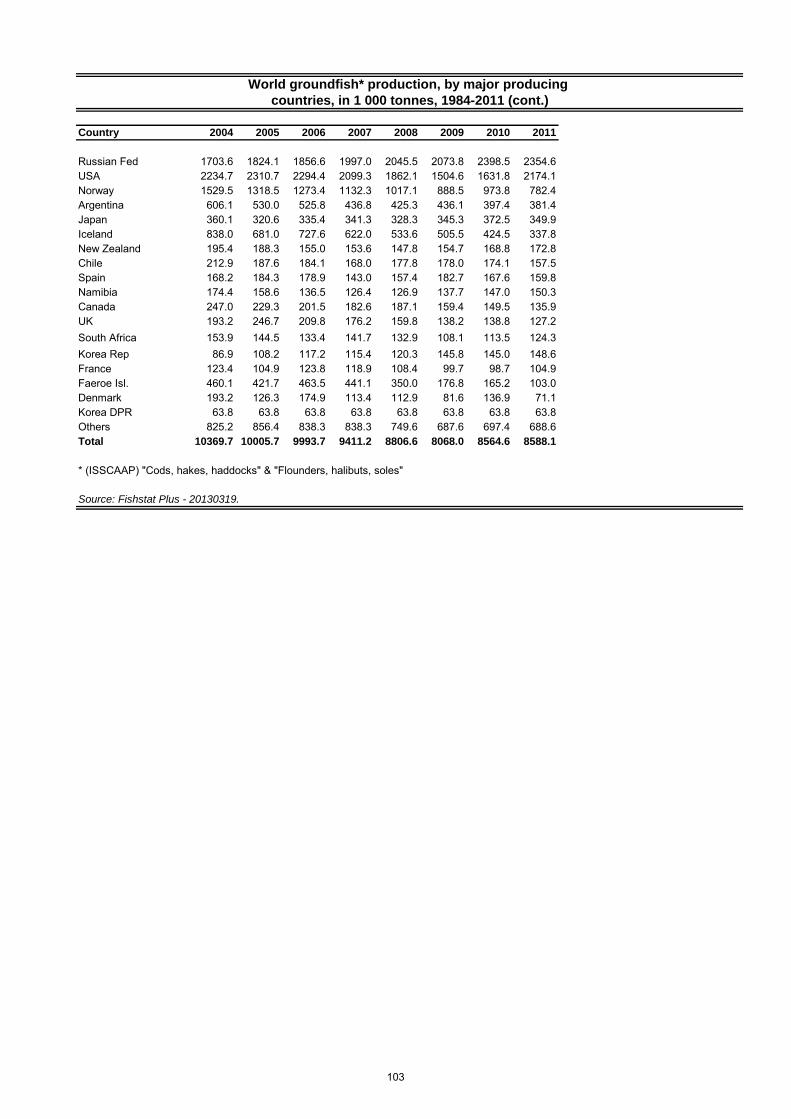
Country 2004 2005 2006 2007 2008 2009 2010 2011
Russian Fed 1703.6 1824.1 1856.6 1997.0 2045.5 2073.8 2398.5 2354.6USA 2234.7 2310.7 2294.4 2099.3 1862.1 1504.6 1631.8 2174.1Norway 1529.5 1318.5 1273.4 1132.3 1017.1 888.5 973.8 782.4Argentina 606.1 530.0 525.8 436.8 425.3 436.1 397.4 381.4Japan 360.1 320.6 335.4 341.3 328.3 345.3 372.5 349.9Iceland 838.0 681.0 727.6 622.0 533.6 505.5 424.5 337.8New Zealand 195.4 188.3 155.0 153.6 147.8 154.7 168.8 172.8Chile 212.9 187.6 184.1 168.0 177.8 178.0 174.1 157.5Spain 168.2 184.3 178.9 143.0 157.4 182.7 167.6 159.8Namibia 174.4 158.6 136.5 126.4 126.9 137.7 147.0 150.3Canada 247.0 229.3 201.5 182.6 187.1 159.4 149.5 135.9UK 193.2 246.7 209.8 176.2 159.8 138.2 138.8 127.2South Africa 153.9 144.5 133.4 141.7 132.9 108.1 113.5 124.3Korea Rep 86.9 108.2 117.2 115.4 120.3 145.8 145.0 148.6France 123.4 104.9 123.8 118.9 108.4 99.7 98.7 104.9Faeroe Isl. 460.1 421.7 463.5 441.1 350.0 176.8 165.2 103.0Denmark 193.2 126.3 174.9 113.4 112.9 81.6 136.9 71.1Korea DPR 63.8 63.8 63.8 63.8 63.8 63.8 63.8 63.8Others 825.2 856.4 838.3 838.3 749.6 687.6 697.4 688.6Total 10369.7 10005.7 9993.7 9411.2 8806.6 8068.0 8564.6 8588.1
* (ISSCAAP) "Cods, hakes, haddocks" & "Flounders, halibuts, soles"
Source: Fishstat Plus - 20130319.
World groundfish* production, by major producing
countries, in 1 000 tonnes, 1984-2011 (cont.)
103
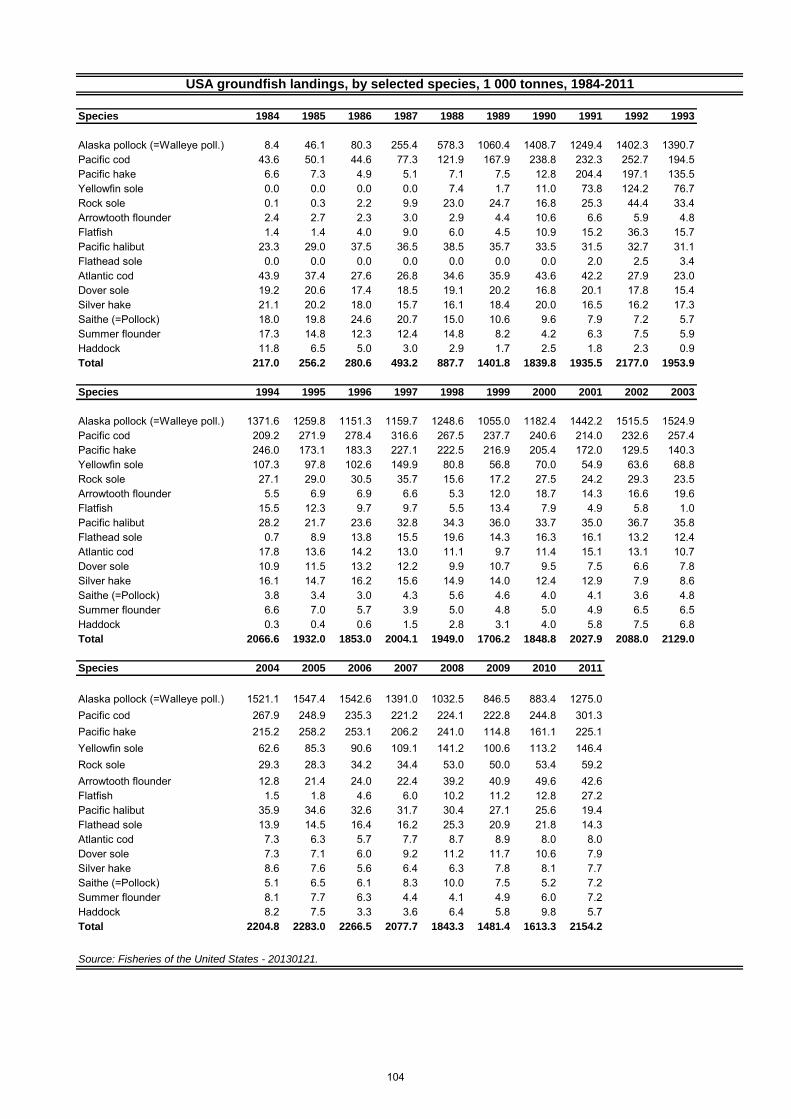
Species 1984 1985 1986 1987 1988 1989 1990 1991 1992 1993
Alaska pollock (=Walleye poll.) 8.4 46.1 80.3 255.4 578.3 1060.4 1408.7 1249.4 1402.3 1390.7Pacific cod 43.6 50.1 44.6 77.3 121.9 167.9 238.8 232.3 252.7 194.5Pacific hake 6.6 7.3 4.9 5.1 7.1 7.5 12.8 204.4 197.1 135.5Yellowfin sole 0.0 0.0 0.0 0.0 7.4 1.7 11.0 73.8 124.2 76.7Rock sole 0.1 0.3 2.2 9.9 23.0 24.7 16.8 25.3 44.4 33.4Arrowtooth flounder 2.4 2.7 2.3 3.0 2.9 4.4 10.6 6.6 5.9 4.8Flatfish 1.4 1.4 4.0 9.0 6.0 4.5 10.9 15.2 36.3 15.7Pacific halibut 23.3 29.0 37.5 36.5 38.5 35.7 33.5 31.5 32.7 31.1Flathead sole 0.0 0.0 0.0 0.0 0.0 0.0 0.0 2.0 2.5 3.4Atlantic cod 43.9 37.4 27.6 26.8 34.6 35.9 43.6 42.2 27.9 23.0Dover sole 19.2 20.6 17.4 18.5 19.1 20.2 16.8 20.1 17.8 15.4Silver hake 21.1 20.2 18.0 15.7 16.1 18.4 20.0 16.5 16.2 17.3Saithe (=Pollock) 18.0 19.8 24.6 20.7 15.0 10.6 9.6 7.9 7.2 5.7Summer flounder 17.3 14.8 12.3 12.4 14.8 8.2 4.2 6.3 7.5 5.9Haddock 11.8 6.5 5.0 3.0 2.9 1.7 2.5 1.8 2.3 0.9Total 217.0 256.2 280.6 493.2 887.7 1401.8 1839.8 1935.5 2177.0 1953.9
Species 1994 1995 1996 1997 1998 1999 2000 2001 2002 2003
Alaska pollock (=Walleye poll.) 1371.6 1259.8 1151.3 1159.7 1248.6 1055.0 1182.4 1442.2 1515.5 1524.9Pacific cod 209.2 271.9 278.4 316.6 267.5 237.7 240.6 214.0 232.6 257.4Pacific hake 246.0 173.1 183.3 227.1 222.5 216.9 205.4 172.0 129.5 140.3Yellowfin sole 107.3 97.8 102.6 149.9 80.8 56.8 70.0 54.9 63.6 68.8Rock sole 27.1 29.0 30.5 35.7 15.6 17.2 27.5 24.2 29.3 23.5Arrowtooth flounder 5.5 6.9 6.9 6.6 5.3 12.0 18.7 14.3 16.6 19.6Flatfish 15.5 12.3 9.7 9.7 5.5 13.4 7.9 4.9 5.8 1.0Pacific halibut 28.2 21.7 23.6 32.8 34.3 36.0 33.7 35.0 36.7 35.8Flathead sole 0.7 8.9 13.8 15.5 19.6 14.3 16.3 16.1 13.2 12.4Atlantic cod 17.8 13.6 14.2 13.0 11.1 9.7 11.4 15.1 13.1 10.7Dover sole 10.9 11.5 13.2 12.2 9.9 10.7 9.5 7.5 6.6 7.8Silver hake 16.1 14.7 16.2 15.6 14.9 14.0 12.4 12.9 7.9 8.6Saithe (=Pollock) 3.8 3.4 3.0 4.3 5.6 4.6 4.0 4.1 3.6 4.8Summer flounder 6.6 7.0 5.7 3.9 5.0 4.8 5.0 4.9 6.5 6.5Haddock 0.3 0.4 0.6 1.5 2.8 3.1 4.0 5.8 7.5 6.8Total 2066.6 1932.0 1853.0 2004.1 1949.0 1706.2 1848.8 2027.9 2088.0 2129.0
Species 2004 2005 2006 2007 2008 2009 2010 2011
Alaska pollock (=Walleye poll.) 1521.1 1547.4 1542.6 1391.0 1032.5 846.5 883.4 1275.0Pacific cod 267.9 248.9 235.3 221.2 224.1 222.8 244.8 301.3Pacific hake 215.2 258.2 253.1 206.2 241.0 114.8 161.1 225.1Yellowfin sole 62.6 85.3 90.6 109.1 141.2 100.6 113.2 146.4Rock sole 29.3 28.3 34.2 34.4 53.0 50.0 53.4 59.2Arrowtooth flounder 12.8 21.4 24.0 22.4 39.2 40.9 49.6 42.6Flatfish 1.5 1.8 4.6 6.0 10.2 11.2 12.8 27.2Pacific halibut 35.9 34.6 32.6 31.7 30.4 27.1 25.6 19.4Flathead sole 13.9 14.5 16.4 16.2 25.3 20.9 21.8 14.3Atlantic cod 7.3 6.3 5.7 7.7 8.7 8.9 8.0 8.0Dover sole 7.3 7.1 6.0 9.2 11.2 11.7 10.6 7.9Silver hake 8.6 7.6 5.6 6.4 6.3 7.8 8.1 7.7Saithe (=Pollock) 5.1 6.5 6.1 8.3 10.0 7.5 5.2 7.2Summer flounder 8.1 7.7 6.3 4.4 4.1 4.9 6.0 7.2Haddock 8.2 7.5 3.3 3.6 6.4 5.8 9.8 5.7Total 2204.8 2283.0 2266.5 2077.7 1843.3 1481.4 1613.3 2154.2
Source: Fisheries of the United States - 20130121.
USA groundfish landings, by selected species, 1 000 tonnes, 1984-2011
104
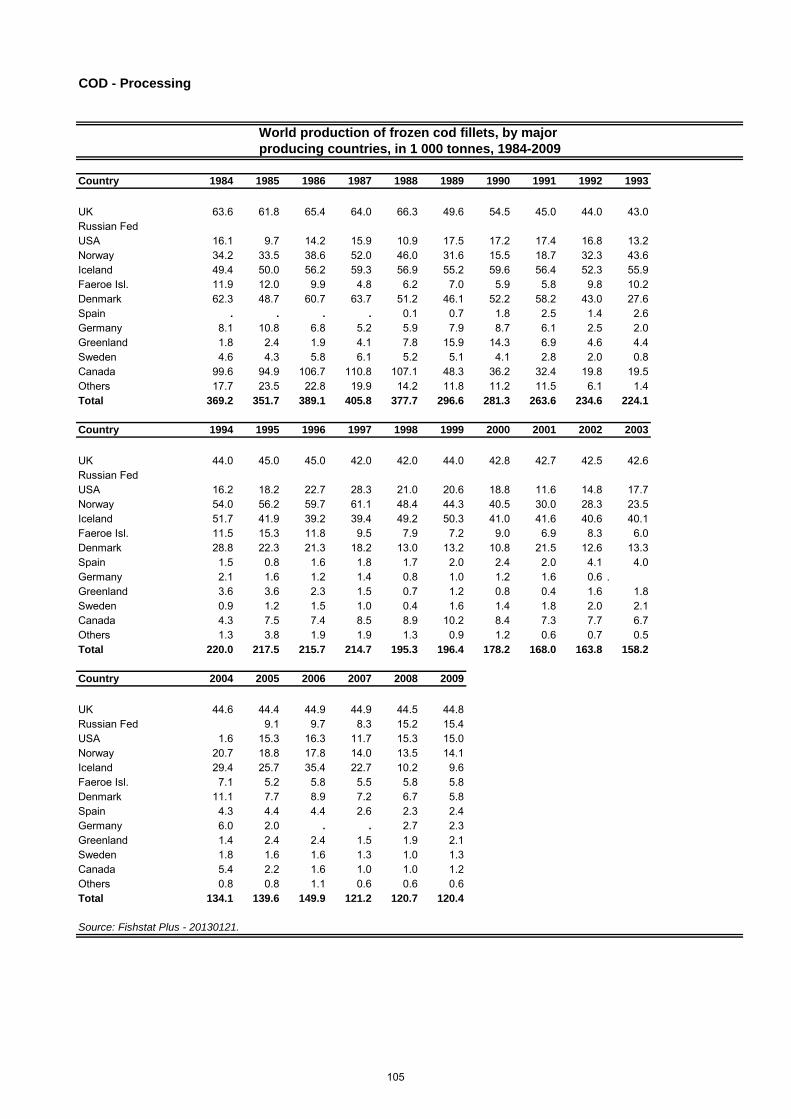
COD - Processing
Country 1984 1985 1986 1987 1988 1989 1990 1991 1992 1993
UK 63.6 61.8 65.4 64.0 66.3 49.6 54.5 45.0 44.0 43.0Russian FedUSA 16.1 9.7 14.2 15.9 10.9 17.5 17.2 17.4 16.8 13.2Norway 34.2 33.5 38.6 52.0 46.0 31.6 15.5 18.7 32.3 43.6Iceland 49.4 50.0 56.2 59.3 56.9 55.2 59.6 56.4 52.3 55.9Faeroe Isl. 11.9 12.0 9.9 4.8 6.2 7.0 5.9 5.8 9.8 10.2Denmark 62.3 48.7 60.7 63.7 51.2 46.1 52.2 58.2 43.0 27.6Spain . . . . 0.1 0.7 1.8 2.5 1.4 2.6Germany 8.1 10.8 6.8 5.2 5.9 7.9 8.7 6.1 2.5 2.0Greenland 1.8 2.4 1.9 4.1 7.8 15.9 14.3 6.9 4.6 4.4Sweden 4.6 4.3 5.8 6.1 5.2 5.1 4.1 2.8 2.0 0.8Canada 99.6 94.9 106.7 110.8 107.1 48.3 36.2 32.4 19.8 19.5Others 17.7 23.5 22.8 19.9 14.2 11.8 11.2 11.5 6.1 1.4Total 369.2 351.7 389.1 405.8 377.7 296.6 281.3 263.6 234.6 224.1
Country 1994 1995 1996 1997 1998 1999 2000 2001 2002 2003
UK 44.0 45.0 45.0 42.0 42.0 44.0 42.8 42.7 42.5 42.6Russian FedUSA 16.2 18.2 22.7 28.3 21.0 20.6 18.8 11.6 14.8 17.7Norway 54.0 56.2 59.7 61.1 48.4 44.3 40.5 30.0 28.3 23.5Iceland 51.7 41.9 39.2 39.4 49.2 50.3 41.0 41.6 40.6 40.1Faeroe Isl. 11.5 15.3 11.8 9.5 7.9 7.2 9.0 6.9 8.3 6.0Denmark 28.8 22.3 21.3 18.2 13.0 13.2 10.8 21.5 12.6 13.3Spain 1.5 0.8 1.6 1.8 1.7 2.0 2.4 2.0 4.1 4.0Germany 2.1 1.6 1.2 1.4 0.8 1.0 1.2 1.6 0.6 .Greenland 3.6 3.6 2.3 1.5 0.7 1.2 0.8 0.4 1.6 1.8Sweden 0.9 1.2 1.5 1.0 0.4 1.6 1.4 1.8 2.0 2.1Canada 4.3 7.5 7.4 8.5 8.9 10.2 8.4 7.3 7.7 6.7Others 1.3 3.8 1.9 1.9 1.3 0.9 1.2 0.6 0.7 0.5Total 220.0 217.5 215.7 214.7 195.3 196.4 178.2 168.0 163.8 158.2
Country 2004 2005 2006 2007 2008 2009
UK 44.6 44.4 44.9 44.9 44.5 44.8Russian Fed 9.1 9.7 8.3 15.2 15.4USA 1.6 15.3 16.3 11.7 15.3 15.0Norway 20.7 18.8 17.8 14.0 13.5 14.1Iceland 29.4 25.7 35.4 22.7 10.2 9.6Faeroe Isl. 7.1 5.2 5.8 5.5 5.8 5.8Denmark 11.1 7.7 8.9 7.2 6.7 5.8Spain 4.3 4.4 4.4 2.6 2.3 2.4Germany 6.0 2.0 . . 2.7 2.3Greenland 1.4 2.4 2.4 1.5 1.9 2.1Sweden 1.8 1.6 1.6 1.3 1.0 1.3Canada 5.4 2.2 1.6 1.0 1.0 1.2Others 0.8 0.8 1.1 0.6 0.6 0.6Total 134.1 139.6 149.9 121.2 120.7 120.4
Source: Fishstat Plus - 20130121.
World production of frozen cod fillets, by major
producing countries, in 1 000 tonnes, 1984-2009
105
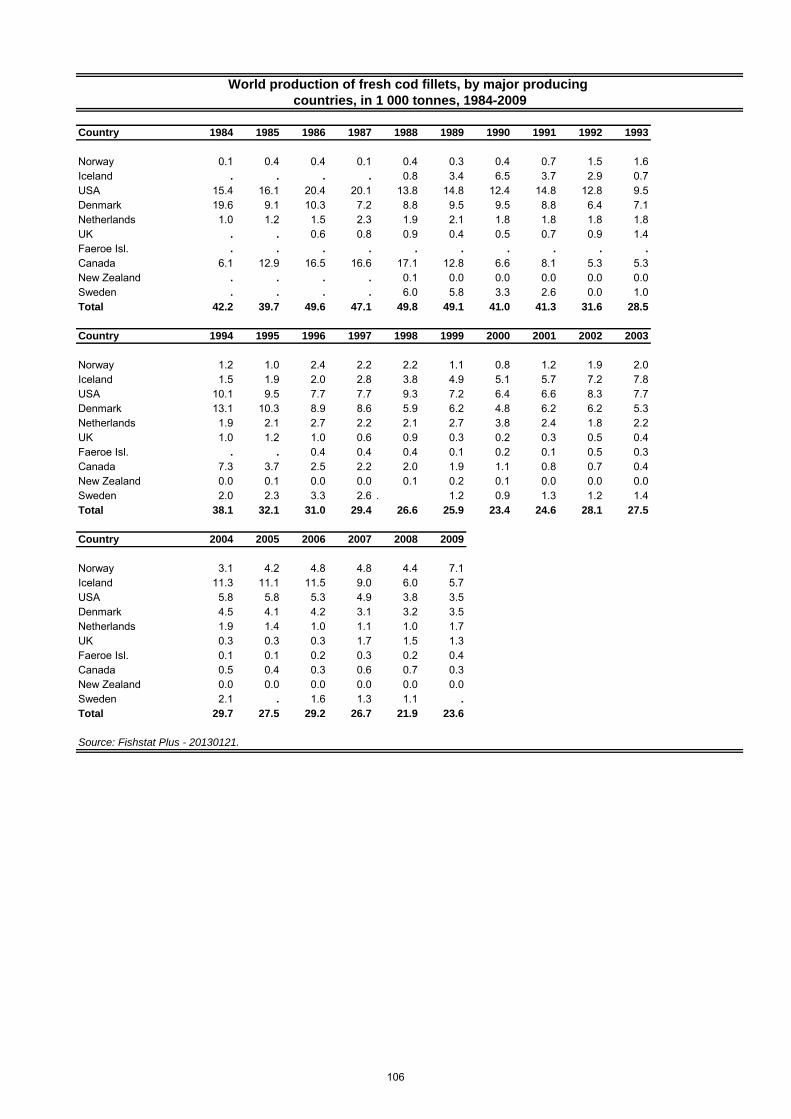
Country 1984 1985 1986 1987 1988 1989 1990 1991 1992 1993
Norway 0.1 0.4 0.4 0.1 0.4 0.3 0.4 0.7 1.5 1.6Iceland . . . . 0.8 3.4 6.5 3.7 2.9 0.7USA 15.4 16.1 20.4 20.1 13.8 14.8 12.4 14.8 12.8 9.5Denmark 19.6 9.1 10.3 7.2 8.8 9.5 9.5 8.8 6.4 7.1Netherlands 1.0 1.2 1.5 2.3 1.9 2.1 1.8 1.8 1.8 1.8UK . . 0.6 0.8 0.9 0.4 0.5 0.7 0.9 1.4Faeroe Isl. . . . . . . . . . .
Canada 6.1 12.9 16.5 16.6 17.1 12.8 6.6 8.1 5.3 5.3New Zealand . . . . 0.1 0.0 0.0 0.0 0.0 0.0Sweden . . . . 6.0 5.8 3.3 2.6 0.0 1.0Total 42.2 39.7 49.6 47.1 49.8 49.1 41.0 41.3 31.6 28.5
Country 1994 1995 1996 1997 1998 1999 2000 2001 2002 2003
Norway 1.2 1.0 2.4 2.2 2.2 1.1 0.8 1.2 1.9 2.0Iceland 1.5 1.9 2.0 2.8 3.8 4.9 5.1 5.7 7.2 7.8USA 10.1 9.5 7.7 7.7 9.3 7.2 6.4 6.6 8.3 7.7Denmark 13.1 10.3 8.9 8.6 5.9 6.2 4.8 6.2 6.2 5.3Netherlands 1.9 2.1 2.7 2.2 2.1 2.7 3.8 2.4 1.8 2.2UK 1.0 1.2 1.0 0.6 0.9 0.3 0.2 0.3 0.5 0.4Faeroe Isl. . . 0.4 0.4 0.4 0.1 0.2 0.1 0.5 0.3Canada 7.3 3.7 2.5 2.2 2.0 1.9 1.1 0.8 0.7 0.4New Zealand 0.0 0.1 0.0 0.0 0.1 0.2 0.1 0.0 0.0 0.0Sweden 2.0 2.3 3.3 2.6 . 1.2 0.9 1.3 1.2 1.4Total 38.1 32.1 31.0 29.4 26.6 25.9 23.4 24.6 28.1 27.5
Country 2004 2005 2006 2007 2008 2009
Norway 3.1 4.2 4.8 4.8 4.4 7.1Iceland 11.3 11.1 11.5 9.0 6.0 5.7USA 5.8 5.8 5.3 4.9 3.8 3.5Denmark 4.5 4.1 4.2 3.1 3.2 3.5Netherlands 1.9 1.4 1.0 1.1 1.0 1.7UK 0.3 0.3 0.3 1.7 1.5 1.3Faeroe Isl. 0.1 0.1 0.2 0.3 0.2 0.4Canada 0.5 0.4 0.3 0.6 0.7 0.3New Zealand 0.0 0.0 0.0 0.0 0.0 0.0Sweden 2.1 . 1.6 1.3 1.1 .
Total 29.7 27.5 29.2 26.7 21.9 23.6
Source: Fishstat Plus - 20130121.
World production of fresh cod fillets, by major producing
countries, in 1 000 tonnes, 1984-2009
106
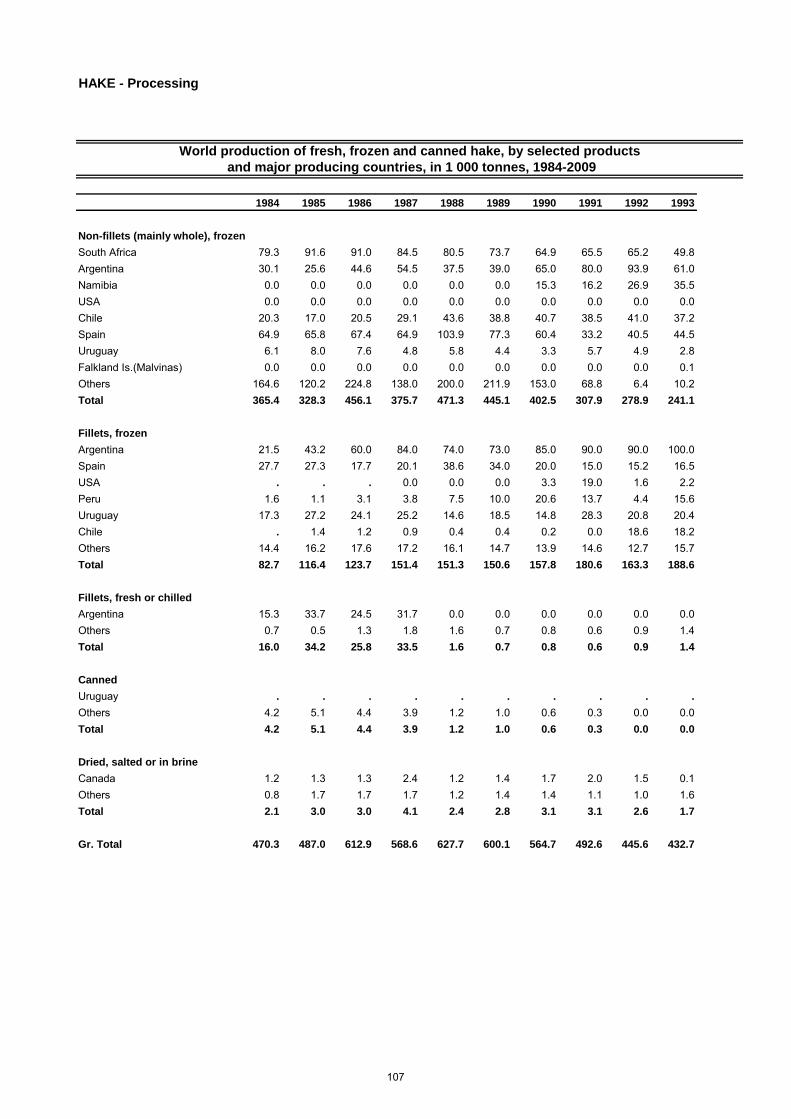
HAKE - Processing
1984 1985 1986 1987 1988 1989 1990 1991 1992 1993
Non-fillets (mainly whole), frozen
South Africa 79.3 91.6 91.0 84.5 80.5 73.7 64.9 65.5 65.2 49.8Argentina 30.1 25.6 44.6 54.5 37.5 39.0 65.0 80.0 93.9 61.0Namibia 0.0 0.0 0.0 0.0 0.0 0.0 15.3 16.2 26.9 35.5USA 0.0 0.0 0.0 0.0 0.0 0.0 0.0 0.0 0.0 0.0Chile 20.3 17.0 20.5 29.1 43.6 38.8 40.7 38.5 41.0 37.2Spain 64.9 65.8 67.4 64.9 103.9 77.3 60.4 33.2 40.5 44.5Uruguay 6.1 8.0 7.6 4.8 5.8 4.4 3.3 5.7 4.9 2.8Falkland Is.(Malvinas) 0.0 0.0 0.0 0.0 0.0 0.0 0.0 0.0 0.0 0.1Others 164.6 120.2 224.8 138.0 200.0 211.9 153.0 68.8 6.4 10.2Total 365.4 328.3 456.1 375.7 471.3 445.1 402.5 307.9 278.9 241.1
Fillets, frozen
Argentina 21.5 43.2 60.0 84.0 74.0 73.0 85.0 90.0 90.0 100.0Spain 27.7 27.3 17.7 20.1 38.6 34.0 20.0 15.0 15.2 16.5USA . . . 0.0 0.0 0.0 3.3 19.0 1.6 2.2Peru 1.6 1.1 3.1 3.8 7.5 10.0 20.6 13.7 4.4 15.6Uruguay 17.3 27.2 24.1 25.2 14.6 18.5 14.8 28.3 20.8 20.4Chile . 1.4 1.2 0.9 0.4 0.4 0.2 0.0 18.6 18.2Others 14.4 16.2 17.6 17.2 16.1 14.7 13.9 14.6 12.7 15.7Total 82.7 116.4 123.7 151.4 151.3 150.6 157.8 180.6 163.3 188.6
Fillets, fresh or chilled
Argentina 15.3 33.7 24.5 31.7 0.0 0.0 0.0 0.0 0.0 0.0Others 0.7 0.5 1.3 1.8 1.6 0.7 0.8 0.6 0.9 1.4Total 16.0 34.2 25.8 33.5 1.6 0.7 0.8 0.6 0.9 1.4
Canned
Uruguay . . . . . . . . . .
Others 4.2 5.1 4.4 3.9 1.2 1.0 0.6 0.3 0.0 0.0Total 4.2 5.1 4.4 3.9 1.2 1.0 0.6 0.3 0.0 0.0
Dried, salted or in brine
Canada 1.2 1.3 1.3 2.4 1.2 1.4 1.7 2.0 1.5 0.1Others 0.8 1.7 1.7 1.7 1.2 1.4 1.4 1.1 1.0 1.6Total 2.1 3.0 3.0 4.1 2.4 2.8 3.1 3.1 2.6 1.7
Gr. Total 470.3 487.0 612.9 568.6 627.7 600.1 564.7 492.6 445.6 432.7
and major producing countries, in 1 000 tonnes, 1984-2009
World production of fresh, frozen and canned hake, by selected products
107
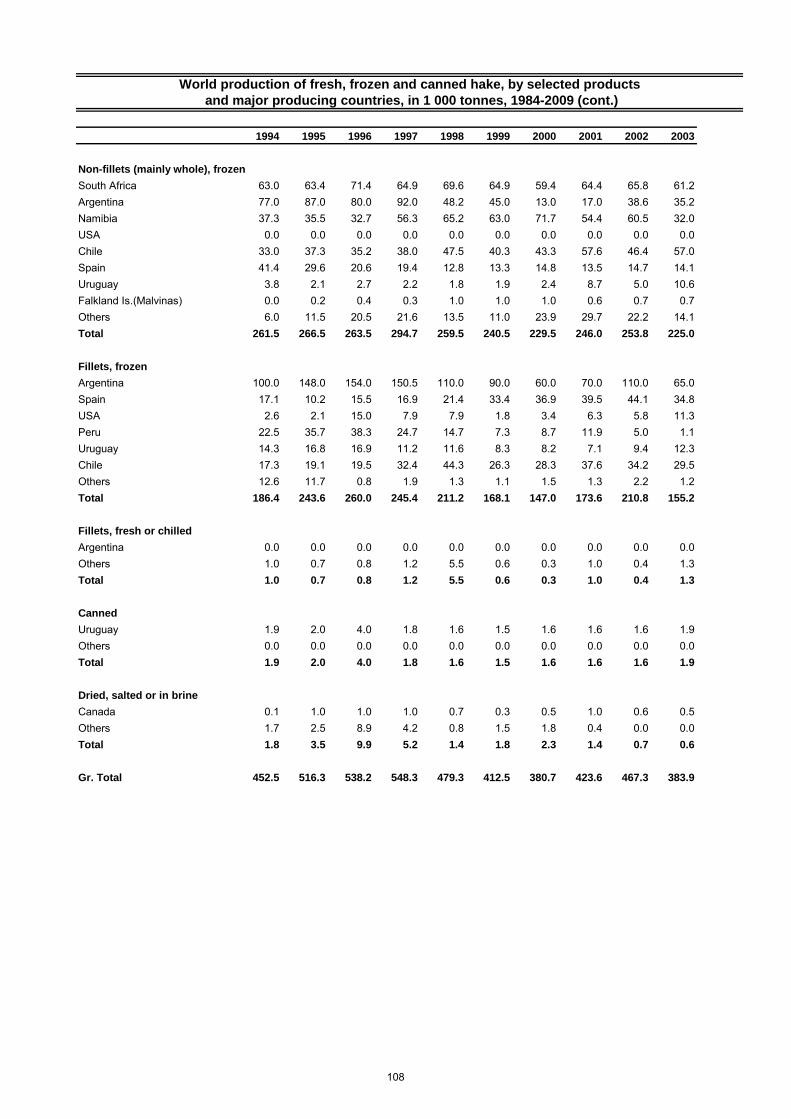
1994 1995 1996 1997 1998 1999 2000 2001 2002 2003
Non-fillets (mainly whole), frozen
South Africa 63.0 63.4 71.4 64.9 69.6 64.9 59.4 64.4 65.8 61.2Argentina 77.0 87.0 80.0 92.0 48.2 45.0 13.0 17.0 38.6 35.2Namibia 37.3 35.5 32.7 56.3 65.2 63.0 71.7 54.4 60.5 32.0USA 0.0 0.0 0.0 0.0 0.0 0.0 0.0 0.0 0.0 0.0Chile 33.0 37.3 35.2 38.0 47.5 40.3 43.3 57.6 46.4 57.0Spain 41.4 29.6 20.6 19.4 12.8 13.3 14.8 13.5 14.7 14.1Uruguay 3.8 2.1 2.7 2.2 1.8 1.9 2.4 8.7 5.0 10.6Falkland Is.(Malvinas) 0.0 0.2 0.4 0.3 1.0 1.0 1.0 0.6 0.7 0.7Others 6.0 11.5 20.5 21.6 13.5 11.0 23.9 29.7 22.2 14.1Total 261.5 266.5 263.5 294.7 259.5 240.5 229.5 246.0 253.8 225.0
Fillets, frozen
Argentina 100.0 148.0 154.0 150.5 110.0 90.0 60.0 70.0 110.0 65.0Spain 17.1 10.2 15.5 16.9 21.4 33.4 36.9 39.5 44.1 34.8USA 2.6 2.1 15.0 7.9 7.9 1.8 3.4 6.3 5.8 11.3Peru 22.5 35.7 38.3 24.7 14.7 7.3 8.7 11.9 5.0 1.1Uruguay 14.3 16.8 16.9 11.2 11.6 8.3 8.2 7.1 9.4 12.3Chile 17.3 19.1 19.5 32.4 44.3 26.3 28.3 37.6 34.2 29.5Others 12.6 11.7 0.8 1.9 1.3 1.1 1.5 1.3 2.2 1.2Total 186.4 243.6 260.0 245.4 211.2 168.1 147.0 173.6 210.8 155.2
Fillets, fresh or chilled
Argentina 0.0 0.0 0.0 0.0 0.0 0.0 0.0 0.0 0.0 0.0Others 1.0 0.7 0.8 1.2 5.5 0.6 0.3 1.0 0.4 1.3Total 1.0 0.7 0.8 1.2 5.5 0.6 0.3 1.0 0.4 1.3
Canned
Uruguay 1.9 2.0 4.0 1.8 1.6 1.5 1.6 1.6 1.6 1.9Others 0.0 0.0 0.0 0.0 0.0 0.0 0.0 0.0 0.0 0.0Total 1.9 2.0 4.0 1.8 1.6 1.5 1.6 1.6 1.6 1.9
Dried, salted or in brine
Canada 0.1 1.0 1.0 1.0 0.7 0.3 0.5 1.0 0.6 0.5Others 1.7 2.5 8.9 4.2 0.8 1.5 1.8 0.4 0.0 0.0Total 1.8 3.5 9.9 5.2 1.4 1.8 2.3 1.4 0.7 0.6
Gr. Total 452.5 516.3 538.2 548.3 479.3 412.5 380.7 423.6 467.3 383.9
World production of fresh, frozen and canned hake, by selected products
and major producing countries, in 1 000 tonnes, 1984-2009 (cont.)
108
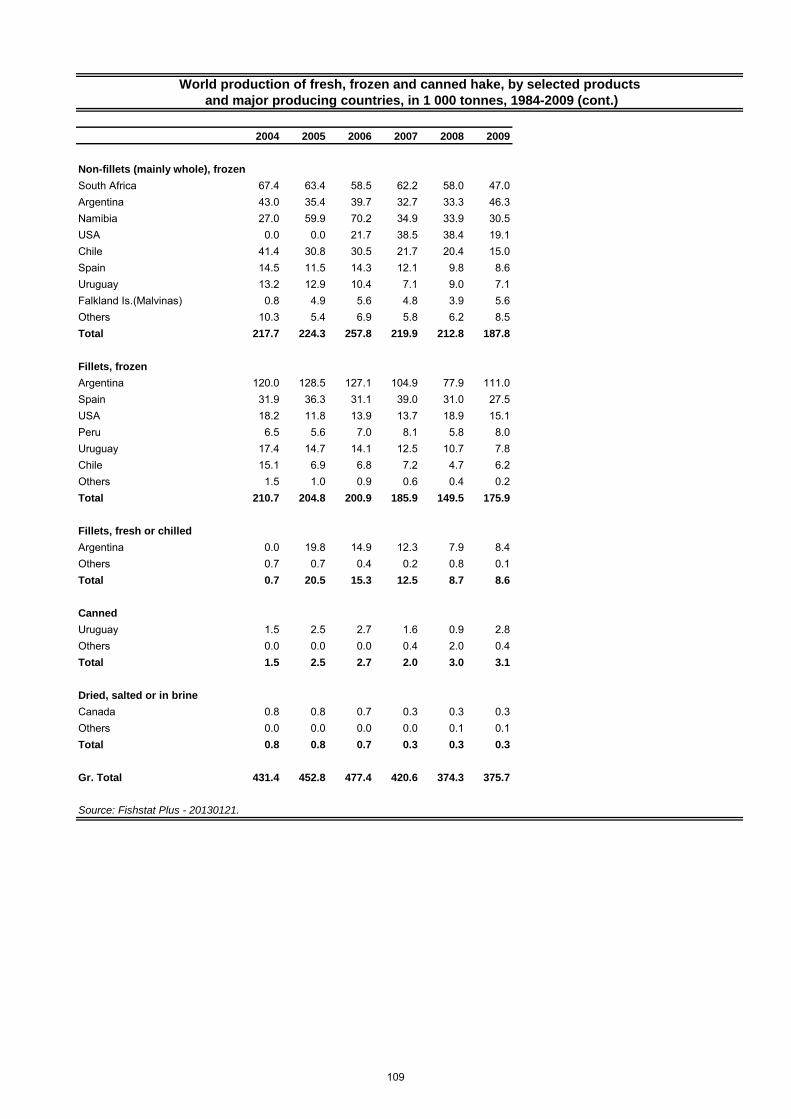
2004 2005 2006 2007 2008 2009
Non-fillets (mainly whole), frozen
South Africa 67.4 63.4 58.5 62.2 58.0 47.0Argentina 43.0 35.4 39.7 32.7 33.3 46.3Namibia 27.0 59.9 70.2 34.9 33.9 30.5USA 0.0 0.0 21.7 38.5 38.4 19.1Chile 41.4 30.8 30.5 21.7 20.4 15.0Spain 14.5 11.5 14.3 12.1 9.8 8.6Uruguay 13.2 12.9 10.4 7.1 9.0 7.1Falkland Is.(Malvinas) 0.8 4.9 5.6 4.8 3.9 5.6Others 10.3 5.4 6.9 5.8 6.2 8.5Total 217.7 224.3 257.8 219.9 212.8 187.8
Fillets, frozen
Argentina 120.0 128.5 127.1 104.9 77.9 111.0Spain 31.9 36.3 31.1 39.0 31.0 27.5USA 18.2 11.8 13.9 13.7 18.9 15.1Peru 6.5 5.6 7.0 8.1 5.8 8.0Uruguay 17.4 14.7 14.1 12.5 10.7 7.8Chile 15.1 6.9 6.8 7.2 4.7 6.2Others 1.5 1.0 0.9 0.6 0.4 0.2Total 210.7 204.8 200.9 185.9 149.5 175.9
Fillets, fresh or chilled
Argentina 0.0 19.8 14.9 12.3 7.9 8.4Others 0.7 0.7 0.4 0.2 0.8 0.1Total 0.7 20.5 15.3 12.5 8.7 8.6
Canned
Uruguay 1.5 2.5 2.7 1.6 0.9 2.8Others 0.0 0.0 0.0 0.4 2.0 0.4Total 1.5 2.5 2.7 2.0 3.0 3.1
Dried, salted or in brine
Canada 0.8 0.8 0.7 0.3 0.3 0.3Others 0.0 0.0 0.0 0.0 0.1 0.1Total 0.8 0.8 0.7 0.3 0.3 0.3
Gr. Total 431.4 452.8 477.4 420.6 374.3 375.7
Source: Fishstat Plus - 20130121.
and major producing countries, in 1 000 tonnes, 1984-2009 (cont.)
World production of fresh, frozen and canned hake, by selected products
109
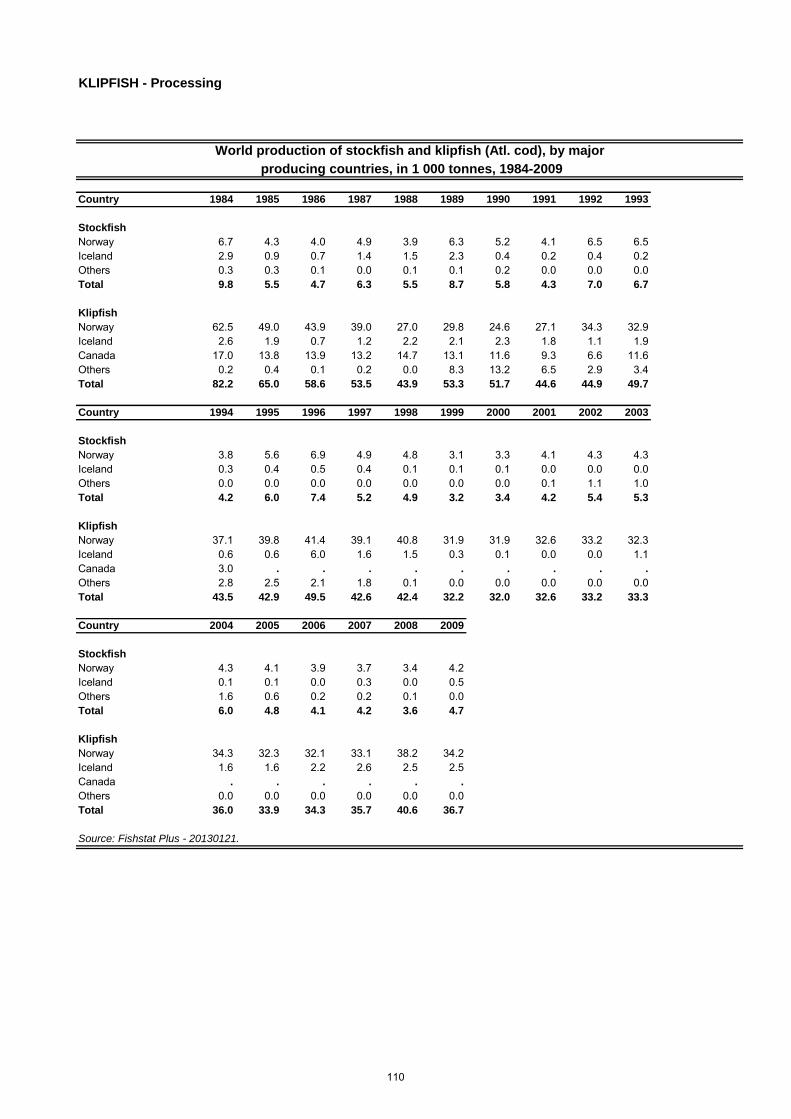
KLIPFISH - Processing
Country 1984 1985 1986 1987 1988 1989 1990 1991 1992 1993
Stockfish
Norway 6.7 4.3 4.0 4.9 3.9 6.3 5.2 4.1 6.5 6.5Iceland 2.9 0.9 0.7 1.4 1.5 2.3 0.4 0.2 0.4 0.2Others 0.3 0.3 0.1 0.0 0.1 0.1 0.2 0.0 0.0 0.0Total 9.8 5.5 4.7 6.3 5.5 8.7 5.8 4.3 7.0 6.7
Klipfish
Norway 62.5 49.0 43.9 39.0 27.0 29.8 24.6 27.1 34.3 32.9Iceland 2.6 1.9 0.7 1.2 2.2 2.1 2.3 1.8 1.1 1.9Canada 17.0 13.8 13.9 13.2 14.7 13.1 11.6 9.3 6.6 11.6Others 0.2 0.4 0.1 0.2 0.0 8.3 13.2 6.5 2.9 3.4Total 82.2 65.0 58.6 53.5 43.9 53.3 51.7 44.6 44.9 49.7
Country 1994 1995 1996 1997 1998 1999 2000 2001 2002 2003
Stockfish
Norway 3.8 5.6 6.9 4.9 4.8 3.1 3.3 4.1 4.3 4.3Iceland 0.3 0.4 0.5 0.4 0.1 0.1 0.1 0.0 0.0 0.0Others 0.0 0.0 0.0 0.0 0.0 0.0 0.0 0.1 1.1 1.0Total 4.2 6.0 7.4 5.2 4.9 3.2 3.4 4.2 5.4 5.3
Klipfish
Norway 37.1 39.8 41.4 39.1 40.8 31.9 31.9 32.6 33.2 32.3Iceland 0.6 0.6 6.0 1.6 1.5 0.3 0.1 0.0 0.0 1.1Canada 3.0 . . . . . . . . .
Others 2.8 2.5 2.1 1.8 0.1 0.0 0.0 0.0 0.0 0.0Total 43.5 42.9 49.5 42.6 42.4 32.2 32.0 32.6 33.2 33.3
Country 2004 2005 2006 2007 2008 2009
Stockfish
Norway 4.3 4.1 3.9 3.7 3.4 4.2Iceland 0.1 0.1 0.0 0.3 0.0 0.5Others 1.6 0.6 0.2 0.2 0.1 0.0Total 6.0 4.8 4.1 4.2 3.6 4.7
Klipfish
Norway 34.3 32.3 32.1 33.1 38.2 34.2Iceland 1.6 1.6 2.2 2.6 2.5 2.5Canada . . . . . .
Others 0.0 0.0 0.0 0.0 0.0 0.0Total 36.0 33.9 34.3 35.7 40.6 36.7
Source: Fishstat Plus - 20130121.
World production of stockfish and klipfish (Atl. cod), by major
producing countries, in 1 000 tonnes, 1984-2009
110

AnchoviesExtract from GLOBEFISH Databank Prices - Exports - Imports - Catches - Consumption
September 2009
COMMODITY UPDATE
Food and Agriculture Organization of the United NationsFishery Industries Division
Viale delle Terme di Caracalla00100 Rome, Italy
Tel.: +39 06 5705 5074Fax: +39 06 5705 5188
www.globefish.org