COMMODITY UPDATE COMMODITY update The COMMODITY UPDATE reports, issued for each commodity once a...
44
Lobster Extract from GLOBEFISH Databank Prices - Imports - Exports - Processing - Production August 2008 COMMODITY UPDATE Food and Agriculture Organization of the United Nations Fishery Industries Division Viale delle Terme di Caracalla 00153 Rome, Italy Tel.: +39 06 5705 5074 Fax: +39 06 5705 5188 www.globefish.org
Transcript of COMMODITY UPDATE COMMODITY update The COMMODITY UPDATE reports, issued for each commodity once a...
LobsterExtract from GLOBEFISH Databank Prices - Imports - Exports - Processing - Production
August 2008
COMMODITY UPDATE
Food and Agriculture Organization of the United NationsFishery Industries Division
Viale delle Terme di Caracalla00153 Rome, Italy
Tel.: +39 06 5705 5074Fax: +39 06 5705 5188
www.globefish.org
Lobster
COMMODITY
update
The COMMODITY UPDATE reports, issued for each commodity once a year, contain
information on prices, imports, exports and production by commodity. The information is taken
form the network of GLOBEFISH correspondents and the GLOBEFISH European Price Report,
INFOFISH Trade News, FAO FISHDAB, EUROSTAT and others.
The issues are scheduled approximately as follows:
FISHMEAL - FISH OIL –Spring CRAB - Autumn
BIVALVES - Spring LOBSTER - Autumn SALMON - Spring CEPHALOPODS - Winter FRESHWATER FISH - Spring GROUNDFISH - Winter
SHRIMP - Summer SMALL PELAGICS - Winter TUNA - Summer
For single issues For an annual subscription to
please contact the complete set please contact
GLOBEFISH EUROFISH
Vial.e delle Terme di Caracalla . H.C. Andersens Blvd. 44-46
00153 Rome . 1553 Copenhagen VITALY Denmark
Tel: ++39 0657056313 . Tel.: ++45 33377755
Fax: ++39 0657055188 . Fax: ++45 33377756
E - mail: globefish - [email protected] . E - mail: [email protected]
Web si.te: www.gl.obefi.sh.org . Web site: www. eurofish.dk
Prepared by Paola Sabatini and Greg Hart
Al l ri g hts re s e rve d.No part of FAO/GLOBEFISH COMMODITY UPDATE may be reproduced, stored in a retrieval system, or
transmitted in any form or by any means (electronic, mechanical, photocopying or otherwise), without the prior permission of FAO.
Requests for use of this material (including purpose and extent) should be addressed to the Director, Publications Division, Food
and Agriculture Organization of the United Nations, Viale delle Terme di Caracalla, 00153 Rome, Italy.
Layout, Tony Piccolo (GLOBEFISH).

MONTHLY MARKET REPORT
Lobster Market Report - February 2008 1
LOBSTER PRICES
Fresh lobster, wholesale prices, Mercabarna, Spain, Ptas/kg 9
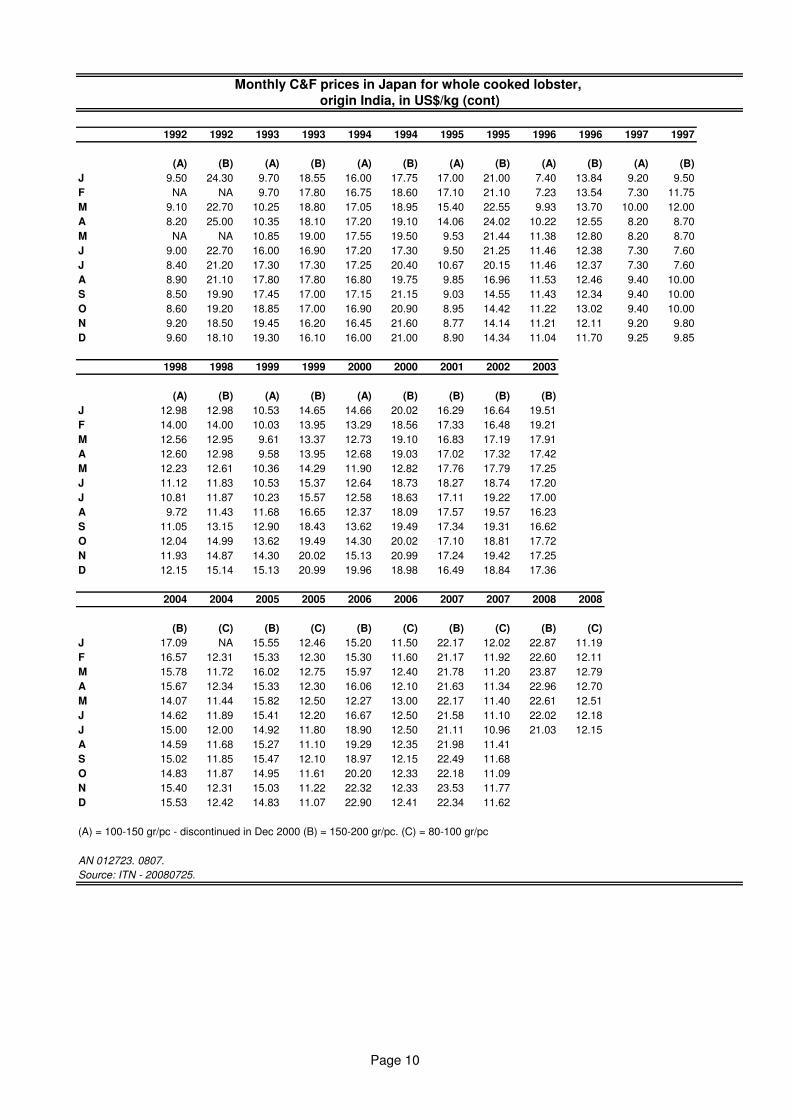
Monthly C&F prices in Japan for whole cooked lobster, origin India, in US$/kg 9
Monthly ex-warehouse prices of frozen lobster tails in USA (8-10 oz/pc),origin Australia and Brazil, in US$/lb 11
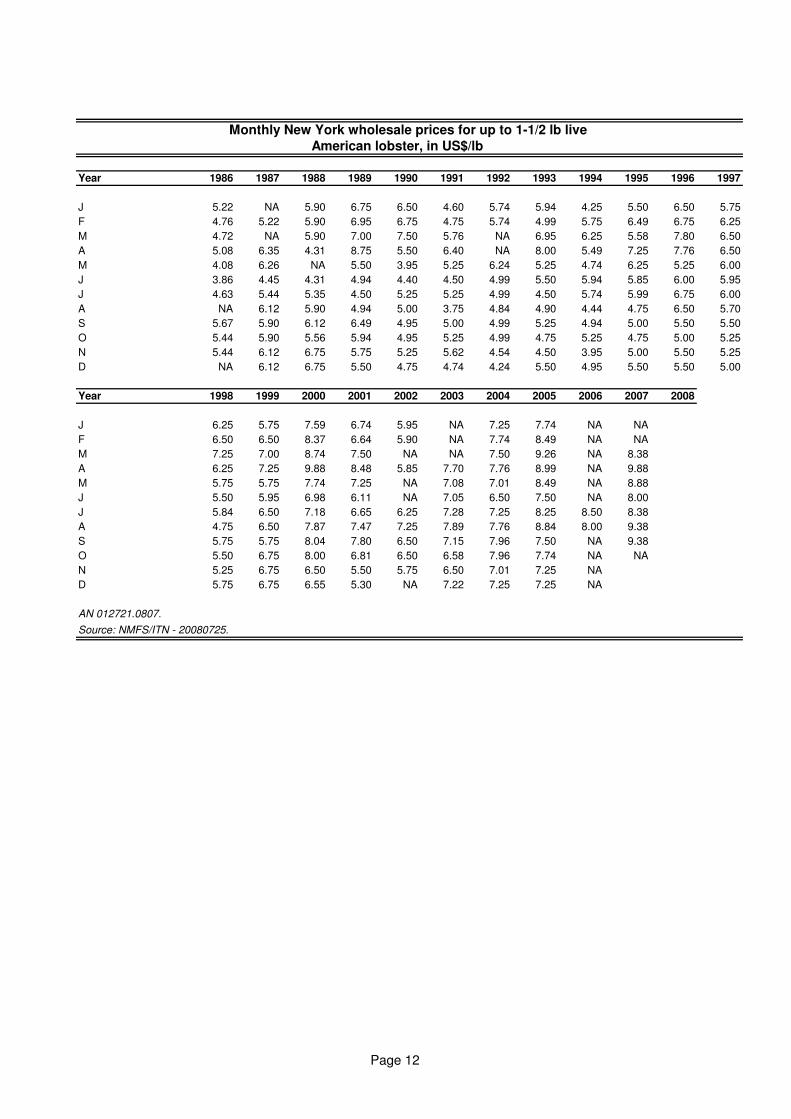
Monthly New York wholesale prices for 1-1/2 lb live American lobster, in US$/lb 12
LOBSTER IMPORTS
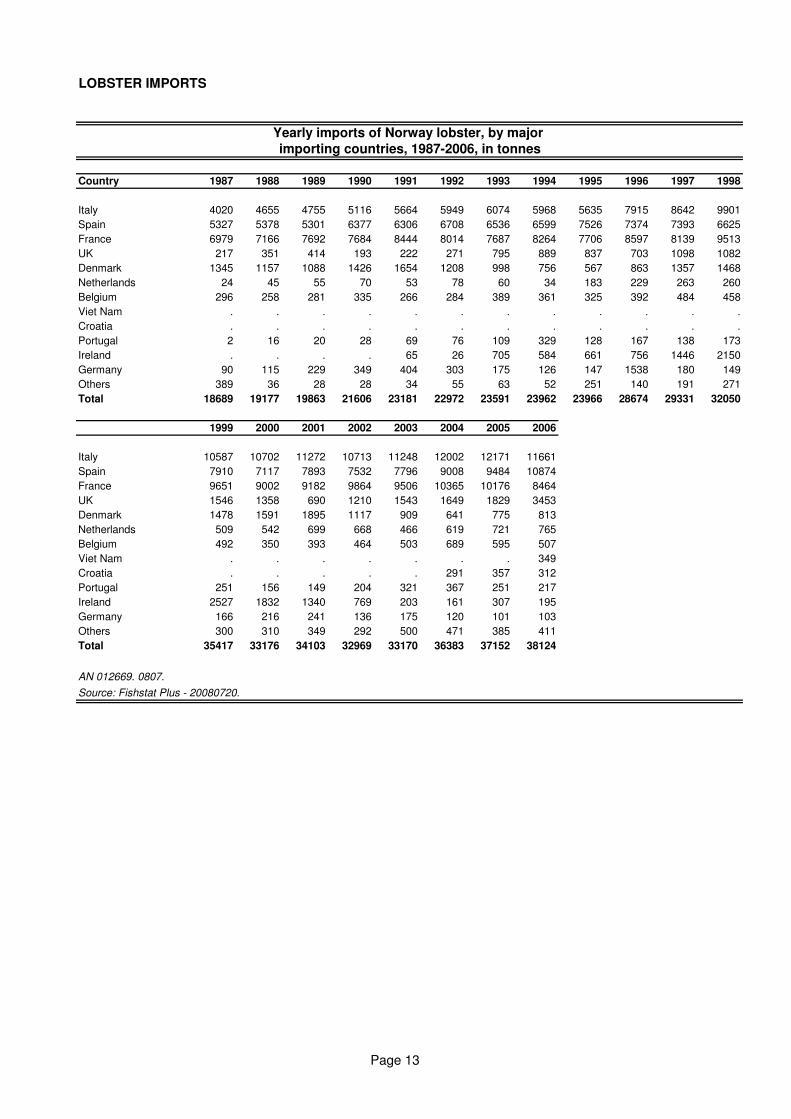
Yearly imports of Norway lobster, by major importing countries, 1987-2006, in tonnes 13
Yearly imports of Norway lobster, by major importing countries, 1987-2006, in 1000 US$ 14
Yearly imports of live, fresh, chilled lobster, by major importing countries, 1987-2004, in 1 000 tonnes 14
Yearly imports of live fresh, chilled lobster, by major importing countries, 1987-2004, in US$ million 15
Yearly imports of frozen lobster, by major importing countries, 1987-2004, in 1 000 tonnes 16
Yearly imports of frozen lobster, by major importing countries, 1987-2004, in US$ million 17
Total EU fresh, chilled, frozen, lobster imports, by country of origin, in tonnes 18
Yearly lobster imports into France, by product form, in tonnes 18
Yearly lobster imports into Germany, by product form, in tonnes 19
Yearly lobster imports into Italy, by product form, in tonnes 19
Yearly lobster imports into Spain, by product form, in tonnes 20
Yearly lobster imports into Japan, by origin country and product form, in tonnes 20
Yearly imports of lobster in the USA, by origin country and product form, in 1 000 tonnes 22
LOBSTER EXPORTS
Yearly exports of Norway lobster, by major exporting countries, 1987-2007, in 1000 US$ 24
Yearly exports of Norway lobster, by major exporting countries, 1987-2007, in tonnes 25
Yearly exports of live, fresh, chilled lobster, by major exporting countries, 1987-2006, in 1 000 tonnes 26
i
TABLE OF CONTENTS - LOBSTER
Yearly exports of live, fresh, chilled lobster, by major exporting countries, 1987-2006, in US$ million 27
Yearly exports of frozen lobster, by major exporting countries, 1987-2006 in 1 000 tonnes 28
Yearly exports of frozen lobster, by major exporting countries, 1987-2006 in US$ million 29
Total EU export of fresh, chilled, frozen lobsters, by country of destination, in tonnes 30
Total EU export of fresh, chilled, frozen lobsters, by country of destination, in Euro million 30
Australian Rock lobster exports, by product form, in tonnes 31
Canadian lobster exports, by product form, in tonnes 31
Canadian canned lobster exports, in 1 000 tonnes 32
Canadian lobster exports by country, in 1 000 tonnes 32
LOBSTER PROCESSING
Yearly world frozen lobster processed production, by major producing countries, in 1 000 tonnes 35
Yearly world lobster processed production, by product form, in 1 000 tonnes 36
Yearly Canadian lobster processed production, product weight, in tonnes 36
LOBSTER PRODUCTION
Yearly world lobster production (captures + aquaculture), by major species, in 1 000 tonnes 37
Yearly world lobster production (captures + aquaculture),by major producing countries, in 1 000 tonnes 37
Lobster, US commercial global production (captures + aquaculture), by species 38
ii
Page 1
HONG KONG / CHINA
Live Demand for spiny lobster after the Moon festival (mid August) strengthened partly due to the limited traditional supply channels and generally lower arrival condition of this year’s Mexican production. Prices of Mexican lobster started at USD$35 per kg CNF Hong Kong (mid September) while the cold water Jasus species from New Zealand and South Australia were fetching USD$58/kg CFR and more. By mid October, demand in Mainland China started to fall and by early November many importers were re-focusing on the cold water New Zealand and South Australian Jasus species. As the West Australian season opened (15 November) demand had stalled and prices soon plummeted particularly for 400 – 600g sizes: New Zealand prices dropped below the USD$40/kg for these sizes as the Western Rock Lobster entered the market at USD$34/kg for the same sizes. Interestingly large sizes, 800g – 1.5kg lobster of all species, varied little in price at this time. Generally poor demand continued throughout December leading up to Christmas with limited purchases of all origin smaller sizes. With pre-Christmas demand strengthening, prices rose $2 to $3 per kg on December averages and were expected to continue throughout January and early February in the approach to the Chinese New Year celebrations (this year February 8th). The upward price trend was assisted by the continued heavy rains and rough seas in Indonesia, India, Myanmar and Malaysia which heavily reduced lobster fishing for the warm water species (Panulirus sp.) from these regions by end 2007. (the outlook for early 2008 remains largely unchanged for these small size producing areas). Exporters are predicting similar highs to the previous year with prices forecast to reach over USD$50 for West Australian product (P. cygnus) and into the high $60’s for the Jasus species of New Zealand and Southern Australia. Frozen In general there was minimal growth noted in imported quantities of frozen lobster into Mainland China although with increased live lobster landings, the associated sales of frozen whole raw and raw tails resulting from mortalities is increasing. Even through prolonged periods of high live market prices, there seemed little movement towards frozen substitution from imports apart from the usual pre-Chinese New Year expectations. Speculation continues on increased frozen lobster consumption in China leading through to the Beijing Olympics although very few forward delivery contracts are noted to be in place. TAIWAN PROVINCE OF CHINA
Live From 15th September through mid November, Taiwan Province of China buyers were clearly focused on the opening season of live Mexican lobster starting near US$34/kg and, during peak landings, discounted to around US$28/kg CFR but with prices averaging near US$32/kg and rising towards US$40/kg by early January 2008. Mortality for Mexican lobster was notably higher than 2006 for reasonable periods and averaged between 10 – 15 % on landing into Taiwan Province of China. Mortality results into the further transit markets of Hong Kong/Shenzhen were higher again. Comparatively speaking, the demand in Taiwan Province of China Province of China for live lobster has continued to decline due to competition with substitutes of frozen lobster or other product types such as king crab. Frozen Taiwanese Province of China demand in 2007 shrunk considerably against the enormous demand of
Page 2
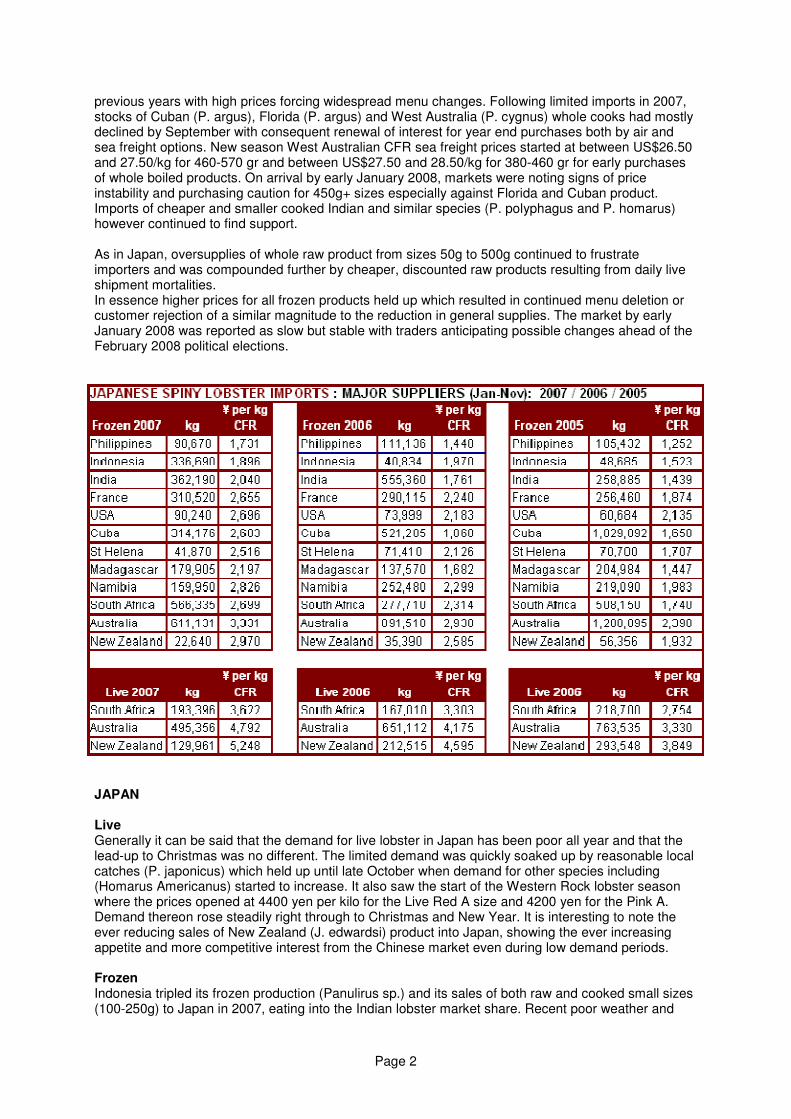
previous years with high prices forcing widespread menu changes. Following limited imports in 2007, stocks of Cuban (P. argus), Florida (P. argus) and West Australia (P. cygnus) whole cooks had mostly declined by September with consequent renewal of interest for year end purchases both by air and sea freight options. New season West Australian CFR sea freight prices started at between US$26.50 and 27.50/kg for 460-570 gr and between US$27.50 and 28.50/kg for 380-460 gr for early purchases of whole boiled products. On arrival by early January 2008, markets were noting signs of price instability and purchasing caution for 450g+ sizes especially against Florida and Cuban product. Imports of cheaper and smaller cooked Indian and similar species (P. polyphagus and P. homarus) however continued to find support. As in Japan, oversupplies of whole raw product from sizes 50g to 500g continued to frustrate importers and was compounded further by cheaper, discounted raw products resulting from daily live shipment mortalities. In essence higher prices for all frozen products held up which resulted in continued menu deletion or customer rejection of a similar magnitude to the reduction in general supplies. The market by early January 2008 was reported as slow but stable with traders anticipating possible changes ahead of the February 2008 political elections.
JAPAN
Live Generally it can be said that the demand for live lobster in Japan has been poor all year and that the lead-up to Christmas was no different. The limited demand was quickly soaked up by reasonable local catches (P. japonicus) which held up until late October when demand for other species including (Homarus Americanus) started to increase. It also saw the start of the Western Rock lobster season where the prices opened at 4400 yen per kilo for the Live Red A size and 4200 yen for the Pink A. Demand thereon rose steadily right through to Christmas and New Year. It is interesting to note the ever reducing sales of New Zealand (J. edwardsi) product into Japan, showing the ever increasing appetite and more competitive interest from the Chinese market even during low demand periods. Frozen Indonesia tripled its frozen production (Panulirus sp.) and its sales of both raw and cooked small sizes (100-250g) to Japan in 2007, eating into the Indian lobster market share. Recent poor weather and
Page 3
lower new season frozen production from Indonesia should provide welcome assistance for inventory holders. In the larger size category, imports of Cuban (p. argus) whole frozen production continued its dramatic slide of the past 3 years due to both poor catches and increased demand from EU and other markets with low inventories. It may be noted that Cuban landings finished 2007 just up on 2006 with 4600/4700 tonnes. African (j. lalandi) origin frozen shipments in total were well up on 2006 even with significantly reduced Namibian landings. In particular, an oversupply of whole raw product has been noted although there is still plenty of room and interest for new season cooked production. With escalating West Australian (P. cynus) frozen prices, Japanese demand shifted to focus on Red A type (380/460gr) which peaked at US$31-32/kg, with Pink A type prices of US$28-29/kg uncompetitive against Taiwanese Province of China buyer demands – a trend forecast to continue well into the future low production seasons of 2007/08 and 2008/09. As at early January 2008, the Japanese frozen lobster market was reported as slow but fair. UNITED STATES
Live There has been a notable increase in Asian style restaurants using live spiny lobster in the USA over 2007 for both domestic and imported species, however the overall quantity would still be considered to be only at niche level. Frozen The ripple effect of the sub prime mortgage crisis continues to have an impact throughout the seafood sector with the lobster sector said to be one of the major casualties. Stories of menu deletion or significant reductions in consumption are rife, however these could be overstated due to some panic selling by traders accustomed to the almost endless upward market movements of recent years. Warmwater tails buyers were unusually cautious as they observed later than normal volume offers following the 45 day delayed start to the Brazilian production season. Following the poor production of Caribbean lobsters (p. argus) in 2006 (specifically from Brazil) and low carry over US with inventory levels, prices opened and remained at record highs resulting in slow moving stocks and supplier diversions to non traditional or non core markets in bigger quantities. By late December 2007, major p. argus importers that had adjusted ex-store sale levels downward to remedy their positions were noting improved sales and inventory clearances although suffering from zero or only very minor margins. The outlook for early 2008 warmwater tail sales although now steady, remains somewhat cloudy. With volume diversions to other markets, major warmwater producing seasons now closed and continued lower global production, the US market may be fortunate to find a more positive outlook in 2008. Coldwater tails: with continued high target prices and weakening US demand, sales of African (P. gilchristi and J. lalandi) and West Australian (P. cygnus) tails were unable to hold in the volume production grades under 8 oz and as new seasons approached, US brokers worked hard to reduce inventories and re-work pricing accordingly. Inversely, inventories of larger sizes (8oz and bigger) were scarce and resulted in pre New Year air deliveries for immediate sale. The absence of many large scale tail procurement programs of recent years and changing menus have been widely reported. Lower forecasts for tail production and US targeted sales is expected to find a balance against the obvious demand reduction.
Page 4
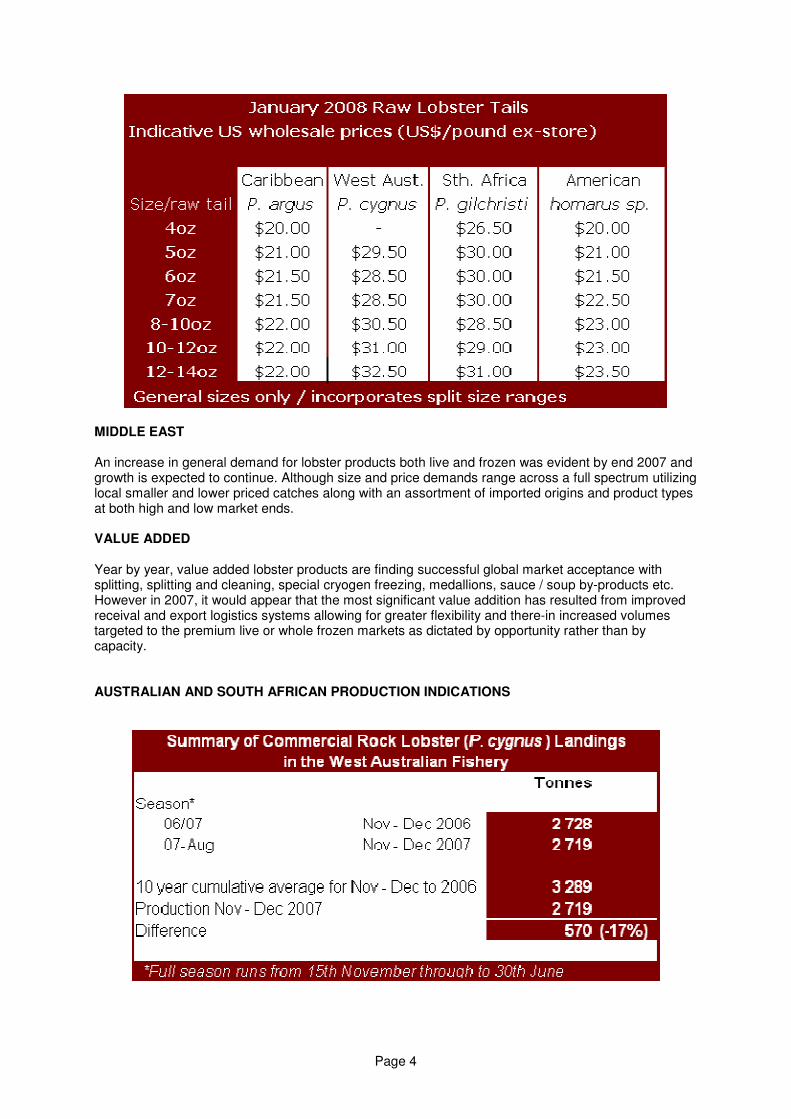
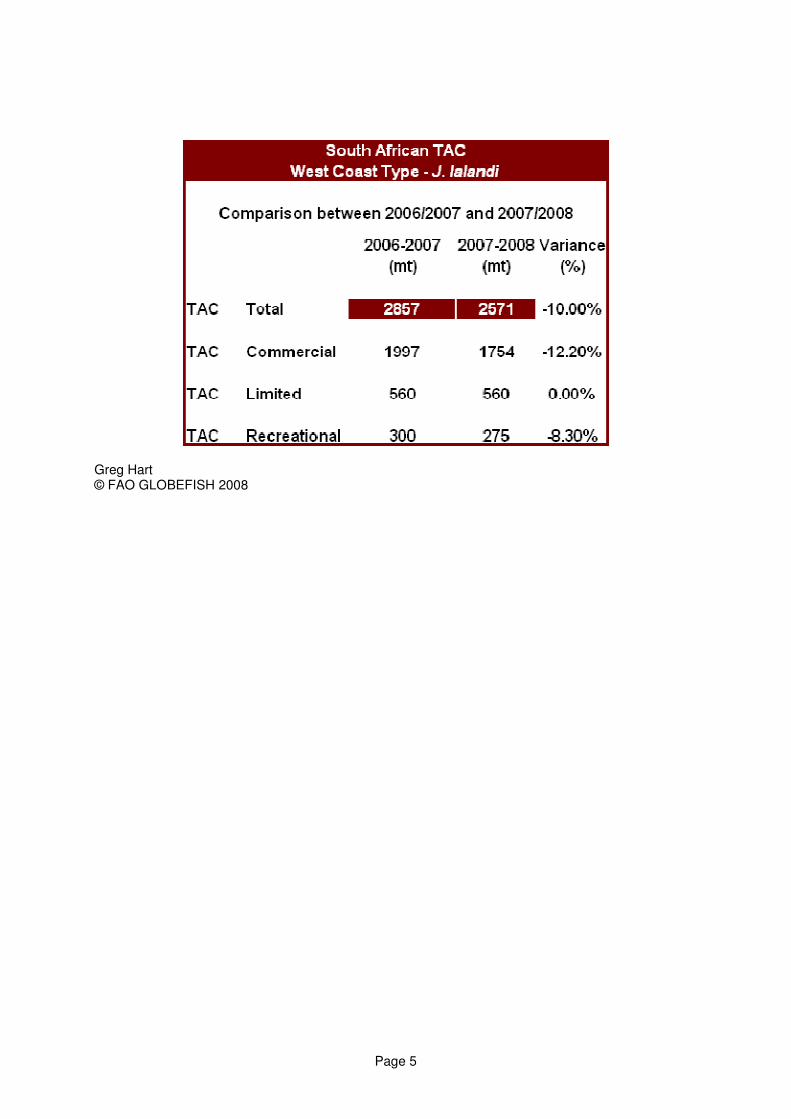
MIDDLE EAST An increase in general demand for lobster products both live and frozen was evident by end 2007 and growth is expected to continue. Although size and price demands range across a full spectrum utilizing local smaller and lower priced catches along with an assortment of imported origins and product types at both high and low market ends. VALUE ADDED Year by year, value added lobster products are finding successful global market acceptance with splitting, splitting and cleaning, special cryogen freezing, medallions, sauce / soup by-products etc. However in 2007, it would appear that the most significant value addition has resulted from improved receival and export logistics systems allowing for greater flexibility and there-in increased volumes targeted to the premium live or whole frozen markets as dictated by opportunity rather than by capacity. AUSTRALIAN AND SOUTH AFRICAN PRODUCTION INDICATIONS
Page 5
Greg Hart © FAO GLOBEFISH 2008

PRICES
IMPORTS
EXPORTS
PROCESSING
PRODUCTION

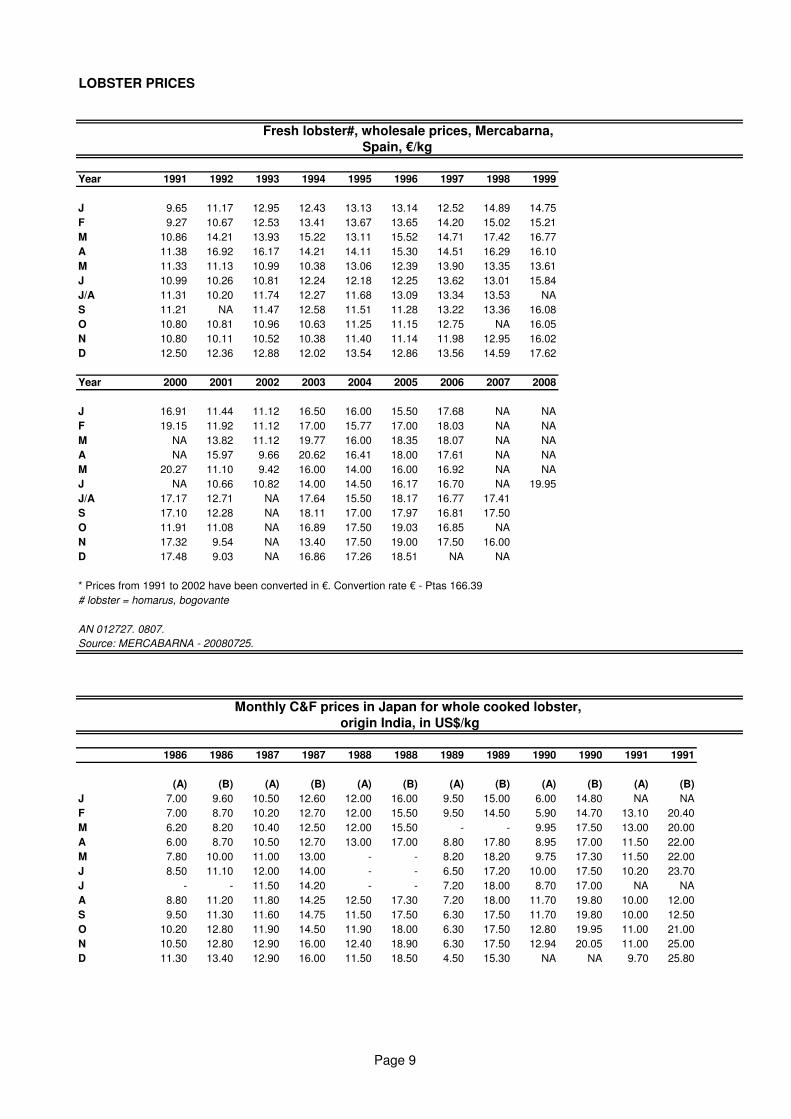
LOBSTER PRICES
Year 1991 1992 1993 1994 1995 1996 1997 1998 1999
J 9.65 11.17 12.95 12.43 13.13 13.14 12.52 14.89 14.75
F 9.27 10.67 12.53 13.41 13.67 13.65 14.20 15.02 15.21
M 10.86 14.21 13.93 15.22 13.11 15.52 14.71 17.42 16.77
A 11.38 16.92 16.17 14.21 14.11 15.30 14.51 16.29 16.10
M 11.33 11.13 10.99 10.38 13.06 12.39 13.90 13.35 13.61
J 10.99 10.26 10.81 12.24 12.18 12.25 13.62 13.01 15.84
J/A 11.31 10.20 11.74 12.27 11.68 13.09 13.34 13.53 NA
S 11.21 NA 11.47 12.58 11.51 11.28 13.22 13.36 16.08
O 10.80 10.81 10.96 10.63 11.25 11.15 12.75 NA 16.05
N 10.80 10.11 10.52 10.38 11.40 11.14 11.98 12.95 16.02
D 12.50 12.36 12.88 12.02 13.54 12.86 13.56 14.59 17.62
Year 2000 2001 2002 2003 2004 2005 2006 2007 2008
J 16.91 11.44 11.12 16.50 16.00 15.50 17.68 NA NA
F 19.15 11.92 11.12 17.00 15.77 17.00 18.03 NA NA
M NA 13.82 11.12 19.77 16.00 18.35 18.07 NA NA
A NA 15.97 9.66 20.62 16.41 18.00 17.61 NA NA
M 20.27 11.10 9.42 16.00 14.00 16.00 16.92 NA NA
J NA 10.66 10.82 14.00 14.50 16.17 16.70 NA 19.95
J/A 17.17 12.71 NA 17.64 15.50 18.17 16.77 17.41
S 17.10 12.28 NA 18.11 17.00 17.97 16.81 17.50
O 11.91 11.08 NA 16.89 17.50 19.03 16.85 NA
N 17.32 9.54 NA 13.40 17.50 19.00 17.50 16.00
D 17.48 9.03 NA 16.86 17.26 18.51 NA NA
* Prices from 1991 to 2002 have been converted in €. Convertion rate € - Ptas 166.39
# lobster = homarus, bogovante
AN 012727. 0807.
Source: MERCABARNA - 20080725.
1986 1986 1987 1987 1988 1988 1989 1989 1990 1990 1991 1991
(A) (B) (A) (B) (A) (B) (A) (B) (A) (B) (A) (B)
J 7.00 9.60 10.50 12.60 12.00 16.00 9.50 15.00 6.00 14.80 NA NA
F 7.00 8.70 10.20 12.70 12.00 15.50 9.50 14.50 5.90 14.70 13.10 20.40
M 6.20 8.20 10.40 12.50 12.00 15.50 - - 9.95 17.50 13.00 20.00
A 6.00 8.70 10.50 12.70 13.00 17.00 8.80 17.80 8.95 17.00 11.50 22.00
M 7.80 10.00 11.00 13.00 - - 8.20 18.20 9.75 17.30 11.50 22.00
J 8.50 11.10 12.00 14.00 - - 6.50 17.20 10.00 17.50 10.20 23.70
J - - 11.50 14.20 - - 7.20 18.00 8.70 17.00 NA NA
A 8.80 11.20 11.80 14.25 12.50 17.30 7.20 18.00 11.70 19.80 10.00 12.00
S 9.50 11.30 11.60 14.75 11.50 17.50 6.30 17.50 11.70 19.80 10.00 12.50
O 10.20 12.80 11.90 14.50 11.90 18.00 6.30 17.50 12.80 19.95 11.00 21.00
N 10.50 12.80 12.90 16.00 12.40 18.90 6.30 17.50 12.94 20.05 11.00 25.00
D 11.30 13.40 12.90 16.00 11.50 18.50 4.50 15.30 NA NA 9.70 25.80
Spain, €/kg
Fresh lobster#, wholesale prices, Mercabarna,
Monthly C&F prices in Japan for whole cooked lobster,
origin India, in US$/kg
Page 9
1992 1992 1993 1993 1994 1994 1995 1995 1996 1996 1997 1997
(A) (B) (A) (B) (A) (B) (A) (B) (A) (B) (A) (B)
J 9.50 24.30 9.70 18.55 16.00 17.75 17.00 21.00 7.40 13.84 9.20 9.50
F NA NA 9.70 17.80 16.75 18.60 17.10 21.10 7.23 13.54 7.30 11.75
M 9.10 22.70 10.25 18.80 17.05 18.95 15.40 22.55 9.93 13.70 10.00 12.00
A 8.20 25.00 10.35 18.10 17.20 19.10 14.06 24.02 10.22 12.55 8.20 8.70
M NA NA 10.85 19.00 17.55 19.50 9.53 21.44 11.38 12.80 8.20 8.70
J 9.00 22.70 16.00 16.90 17.20 17.30 9.50 21.25 11.46 12.38 7.30 7.60
J 8.40 21.20 17.30 17.30 17.25 20.40 10.67 20.15 11.46 12.37 7.30 7.60
A 8.90 21.10 17.80 17.80 16.80 19.75 9.85 16.96 11.53 12.46 9.40 10.00
S 8.50 19.90 17.45 17.00 17.15 21.15 9.03 14.55 11.43 12.34 9.40 10.00
O 8.60 19.20 18.85 17.00 16.90 20.90 8.95 14.42 11.22 13.02 9.40 10.00
N 9.20 18.50 19.45 16.20 16.45 21.60 8.77 14.14 11.21 12.11 9.20 9.80
D 9.60 18.10 19.30 16.10 16.00 21.00 8.90 14.34 11.04 11.70 9.25 9.85
1998 1998 1999 1999 2000 2000 2001 2002 2003
(A) (B) (A) (B) (A) (B) (B) (B) (B)
J 12.98 12.98 10.53 14.65 14.66 20.02 16.29 16.64 19.51
F 14.00 14.00 10.03 13.95 13.29 18.56 17.33 16.48 19.21
M 12.56 12.95 9.61 13.37 12.73 19.10 16.83 17.19 17.91
A 12.60 12.98 9.58 13.95 12.68 19.03 17.02 17.32 17.42
M 12.23 12.61 10.36 14.29 11.90 12.82 17.76 17.79 17.25
J 11.12 11.83 10.53 15.37 12.64 18.73 18.27 18.74 17.20
J 10.81 11.87 10.23 15.57 12.58 18.63 17.11 19.22 17.00
A 9.72 11.43 11.68 16.65 12.37 18.09 17.57 19.57 16.23
S 11.05 13.15 12.90 18.43 13.62 19.49 17.34 19.31 16.62
O 12.04 14.99 13.62 19.49 14.30 20.02 17.10 18.81 17.72
N 11.93 14.87 14.30 20.02 15.13 20.99 17.24 19.42 17.25
D 12.15 15.14 15.13 20.99 19.96 18.98 16.49 18.84 17.36
2004 2004 2005 2005 2006 2006 2007 2007 2008 2008
(B) (C) (B) (C) (B) (C) (B) (C) (B) (C)
J 17.09 NA 15.55 12.46 15.20 11.50 22.17 12.02 22.87 11.19
F 16.57 12.31 15.33 12.30 15.30 11.60 21.17 11.92 22.60 12.11
M 15.78 11.72 16.02 12.75 15.97 12.40 21.78 11.20 23.87 12.79
A 15.67 12.34 15.33 12.30 16.06 12.10 21.63 11.34 22.96 12.70
M 14.07 11.44 15.82 12.50 12.27 13.00 22.17 11.40 22.61 12.51
J 14.62 11.89 15.41 12.20 16.67 12.50 21.58 11.10 22.02 12.18
J 15.00 12.00 14.92 11.80 18.90 12.50 21.11 10.96 21.03 12.15
A 14.59 11.68 15.27 11.10 19.29 12.35 21.98 11.41
S 15.02 11.85 15.47 12.10 18.97 12.15 22.49 11.68
O 14.83 11.87 14.95 11.61 20.20 12.33 22.18 11.09
N 15.40 12.31 15.03 11.22 22.32 12.33 23.53 11.77
D 15.53 12.42 14.83 11.07 22.90 12.41 22.34 11.62
(A) = 100-150 gr/pc - discontinued in Dec 2000 (B) = 150-200 gr/pc. (C) = 80-100 gr/pc
AN 012723. 0807.
Source: ITN - 20080725.
Monthly C&F prices in Japan for whole cooked lobster,
origin India, in US$/kg (cont)
Page 10
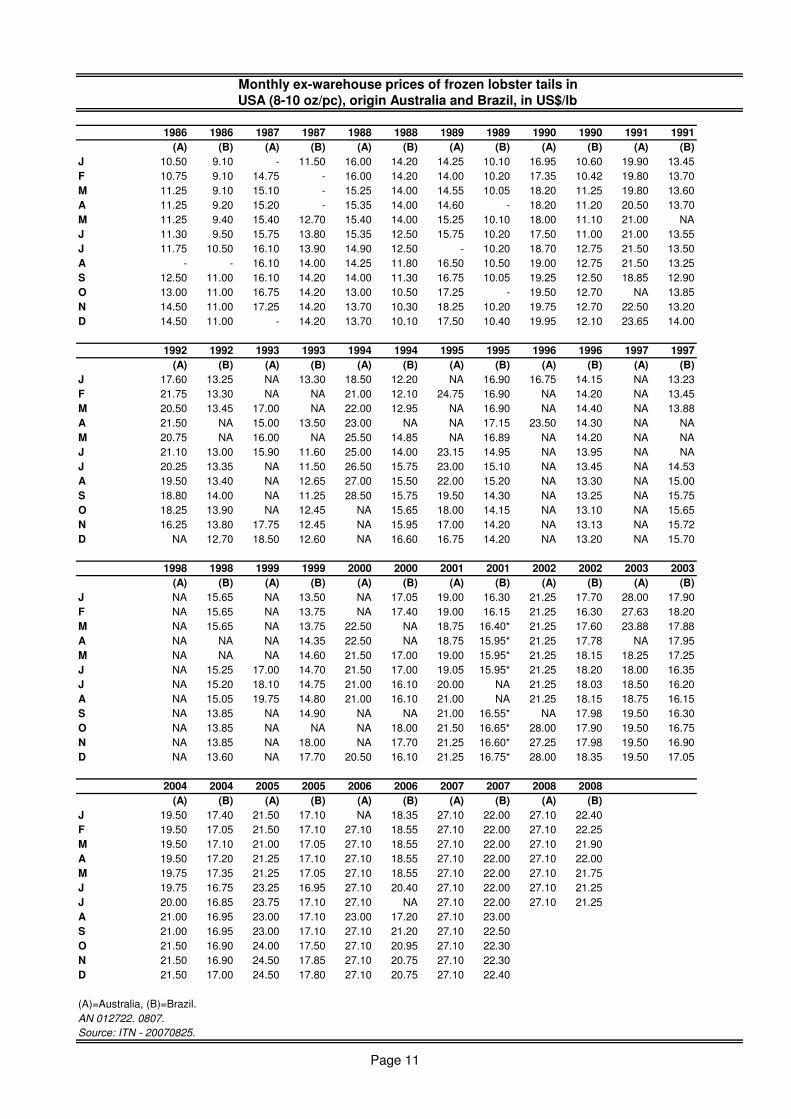
USA (8-10 oz/pc), origin Australia and Brazil, in US$/lb
1986 1986 1987 1987 1988 1988 1989 1989 1990 1990 1991 1991
(A) (B) (A) (B) (A) (B) (A) (B) (A) (B) (A) (B)
J 10.50 9.10 - 11.50 16.00 14.20 14.25 10.10 16.95 10.60 19.90 13.45
F 10.75 9.10 14.75 - 16.00 14.20 14.00 10.20 17.35 10.42 19.80 13.70
M 11.25 9.10 15.10 - 15.25 14.00 14.55 10.05 18.20 11.25 19.80 13.60
A 11.25 9.20 15.20 - 15.35 14.00 14.60 - 18.20 11.20 20.50 13.70
M 11.25 9.40 15.40 12.70 15.40 14.00 15.25 10.10 18.00 11.10 21.00 NA
J 11.30 9.50 15.75 13.80 15.35 12.50 15.75 10.20 17.50 11.00 21.00 13.55
J 11.75 10.50 16.10 13.90 14.90 12.50 - 10.20 18.70 12.75 21.50 13.50
A - - 16.10 14.00 14.25 11.80 16.50 10.50 19.00 12.75 21.50 13.25
S 12.50 11.00 16.10 14.20 14.00 11.30 16.75 10.05 19.25 12.50 18.85 12.90
O 13.00 11.00 16.75 14.20 13.00 10.50 17.25 - 19.50 12.70 NA 13.85
N 14.50 11.00 17.25 14.20 13.70 10.30 18.25 10.20 19.75 12.70 22.50 13.20
D 14.50 11.00 - 14.20 13.70 10.10 17.50 10.40 19.95 12.10 23.65 14.00
1992 1992 1993 1993 1994 1994 1995 1995 1996 1996 1997 1997
(A) (B) (A) (B) (A) (B) (A) (B) (A) (B) (A) (B)
J 17.60 13.25 NA 13.30 18.50 12.20 NA 16.90 16.75 14.15 NA 13.23
F 21.75 13.30 NA NA 21.00 12.10 24.75 16.90 NA 14.20 NA 13.45
M 20.50 13.45 17.00 NA 22.00 12.95 NA 16.90 NA 14.40 NA 13.88
A 21.50 NA 15.00 13.50 23.00 NA NA 17.15 23.50 14.30 NA NA
M 20.75 NA 16.00 NA 25.50 14.85 NA 16.89 NA 14.20 NA NA
J 21.10 13.00 15.90 11.60 25.00 14.00 23.15 14.95 NA 13.95 NA NA
J 20.25 13.35 NA 11.50 26.50 15.75 23.00 15.10 NA 13.45 NA 14.53
A 19.50 13.40 NA 12.65 27.00 15.50 22.00 15.20 NA 13.30 NA 15.00
S 18.80 14.00 NA 11.25 28.50 15.75 19.50 14.30 NA 13.25 NA 15.75
O 18.25 13.90 NA 12.45 NA 15.65 18.00 14.15 NA 13.10 NA 15.65
N 16.25 13.80 17.75 12.45 NA 15.95 17.00 14.20 NA 13.13 NA 15.72
D NA 12.70 18.50 12.60 NA 16.60 16.75 14.20 NA 13.20 NA 15.70
1998 1998 1999 1999 2000 2000 2001 2001 2002 2002 2003 2003
(A) (B) (A) (B) (A) (B) (A) (B) (A) (B) (A) (B)
J NA 15.65 NA 13.50 NA 17.05 19.00 16.30 21.25 17.70 28.00 17.90
F NA 15.65 NA 13.75 NA 17.40 19.00 16.15 21.25 16.30 27.63 18.20
M NA 15.65 NA 13.75 22.50 NA 18.75 16.40* 21.25 17.60 23.88 17.88
A NA NA NA 14.35 22.50 NA 18.75 15.95* 21.25 17.78 NA 17.95
M NA NA NA 14.60 21.50 17.00 19.00 15.95* 21.25 18.15 18.25 17.25
J NA 15.25 17.00 14.70 21.50 17.00 19.05 15.95* 21.25 18.20 18.00 16.35
J NA 15.20 18.10 14.75 21.00 16.10 20.00 NA 21.25 18.03 18.50 16.20
A NA 15.05 19.75 14.80 21.00 16.10 21.00 NA 21.25 18.15 18.75 16.15
S NA 13.85 NA 14.90 NA NA 21.00 16.55* NA 17.98 19.50 16.30
O NA 13.85 NA NA NA 18.00 21.50 16.65* 28.00 17.90 19.50 16.75
N NA 13.85 NA 18.00 NA 17.70 21.25 16.60* 27.25 17.98 19.50 16.90
D NA 13.60 NA 17.70 20.50 16.10 21.25 16.75* 28.00 18.35 19.50 17.05
2004 2004 2005 2005 2006 2006 2007 2007 2008 2008
(A) (B) (A) (B) (A) (B) (A) (B) (A) (B)
J 19.50 17.40 21.50 17.10 NA 18.35 27.10 22.00 27.10 22.40
F 19.50 17.05 21.50 17.10 27.10 18.55 27.10 22.00 27.10 22.25
M 19.50 17.10 21.00 17.05 27.10 18.55 27.10 22.00 27.10 21.90
A 19.50 17.20 21.25 17.10 27.10 18.55 27.10 22.00 27.10 22.00
M 19.75 17.35 21.25 17.05 27.10 18.55 27.10 22.00 27.10 21.75
J 19.75 16.75 23.25 16.95 27.10 20.40 27.10 22.00 27.10 21.25
J 20.00 16.85 23.75 17.10 27.10 NA 27.10 22.00 27.10 21.25
A 21.00 16.95 23.00 17.10 23.00 17.20 27.10 23.00
S 21.00 16.95 23.00 17.10 27.10 21.20 27.10 22.50
O 21.50 16.90 24.00 17.50 27.10 20.95 27.10 22.30
N 21.50 16.90 24.50 17.85 27.10 20.75 27.10 22.30
D 21.50 17.00 24.50 17.80 27.10 20.75 27.10 22.40
(A)=Australia, (B)=Brazil.
AN 012722. 0807.
Source: ITN - 20070825.
Monthly ex-warehouse prices of frozen lobster tails in
Page 11
Year 1986 1987 1988 1989 1990 1991 1992 1993 1994 1995 1996 1997
J 5.22 NA 5.90 6.75 6.50 4.60 5.74 5.94 4.25 5.50 6.50 5.75
F 4.76 5.22 5.90 6.95 6.75 4.75 5.74 4.99 5.75 6.49 6.75 6.25
M 4.72 NA 5.90 7.00 7.50 5.76 NA 6.95 6.25 5.58 7.80 6.50
A 5.08 6.35 4.31 8.75 5.50 6.40 NA 8.00 5.49 7.25 7.76 6.50
M 4.08 6.26 NA 5.50 3.95 5.25 6.24 5.25 4.74 6.25 5.25 6.00
J 3.86 4.45 4.31 4.94 4.40 4.50 4.99 5.50 5.94 5.85 6.00 5.95
J 4.63 5.44 5.35 4.50 5.25 5.25 4.99 4.50 5.74 5.99 6.75 6.00
A NA 6.12 5.90 4.94 5.00 3.75 4.84 4.90 4.44 4.75 6.50 5.70
S 5.67 5.90 6.12 6.49 4.95 5.00 4.99 5.25 4.94 5.00 5.50 5.50
O 5.44 5.90 5.56 5.94 4.95 5.25 4.99 4.75 5.25 4.75 5.00 5.25
N 5.44 6.12 6.75 5.75 5.25 5.62 4.54 4.50 3.95 5.00 5.50 5.25
D NA 6.12 6.75 5.50 4.75 4.74 4.24 5.50 4.95 5.50 5.50 5.00
Year 1998 1999 2000 2001 2002 2003 2004 2005 2006 2007 2008
J 6.25 5.75 7.59 6.74 5.95 NA 7.25 7.74 NA NA
F 6.50 6.50 8.37 6.64 5.90 NA 7.74 8.49 NA NA
M 7.25 7.00 8.74 7.50 NA NA 7.50 9.26 NA 8.38
A 6.25 7.25 9.88 8.48 5.85 7.70 7.76 8.99 NA 9.88
M 5.75 5.75 7.74 7.25 NA 7.08 7.01 8.49 NA 8.88
J 5.50 5.95 6.98 6.11 NA 7.05 6.50 7.50 NA 8.00
J 5.84 6.50 7.18 6.65 6.25 7.28 7.25 8.25 8.50 8.38
A 4.75 6.50 7.87 7.47 7.25 7.89 7.76 8.84 8.00 9.38
S 5.75 5.75 8.04 7.80 6.50 7.15 7.96 7.50 NA 9.38
O 5.50 6.75 8.00 6.81 6.50 6.58 7.96 7.74 NA NA
N 5.25 6.75 6.50 5.50 5.75 6.50 7.01 7.25 NA
D 5.75 6.75 6.55 5.30 NA 7.22 7.25 7.25 NA
AN 012721.0807.
Source: NMFS/ITN - 20080725.
Monthly New York wholesale prices for up to 1-1/2 lb live
American lobster, in US$/lb
Page 12
LOBSTER IMPORTS
Country 1987 1988 1989 1990 1991 1992 1993 1994 1995 1996 1997 1998
Italy 4020 4655 4755 5116 5664 5949 6074 5968 5635 7915 8642 9901
Spain 5327 5378 5301 6377 6306 6708 6536 6599 7526 7374 7393 6625
France 6979 7166 7692 7684 8444 8014 7687 8264 7706 8597 8139 9513
UK 217 351 414 193 222 271 795 889 837 703 1098 1082
Denmark 1345 1157 1088 1426 1654 1208 998 756 567 863 1357 1468
Netherlands 24 45 55 70 53 78 60 34 183 229 263 260
Belgium 296 258 281 335 266 284 389 361 325 392 484 458
Viet Nam . . . . . . . . . . . .
Croatia . . . . . . . . . . . .
Portugal 2 16 20 28 69 76 109 329 128 167 138 173
Ireland . . . . 65 26 705 584 661 756 1446 2150
Germany 90 115 229 349 404 303 175 126 147 1538 180 149
Others 389 36 28 28 34 55 63 52 251 140 191 271
Total 18689 19177 19863 21606 23181 22972 23591 23962 23966 28674 29331 32050
1999 2000 2001 2002 2003 2004 2005 2006
Italy 10587 10702 11272 10713 11248 12002 12171 11661
Spain 7910 7117 7893 7532 7796 9008 9484 10874
France 9651 9002 9182 9864 9506 10365 10176 8464
UK 1546 1358 690 1210 1543 1649 1829 3453
Denmark 1478 1591 1895 1117 909 641 775 813
Netherlands 509 542 699 668 466 619 721 765
Belgium 492 350 393 464 503 689 595 507
Viet Nam . . . . . . . 349
Croatia . . . . . 291 357 312
Portugal 251 156 149 204 321 367 251 217
Ireland 2527 1832 1340 769 203 161 307 195
Germany 166 216 241 136 175 120 101 103
Others 300 310 349 292 500 471 385 411
Total 35417 33176 34103 32969 33170 36383 37152 38124
AN 012669. 0807.
Source: Fishstat Plus - 20080720.
Yearly imports of Norway lobster, by major
importing countries, 1987-2006, in tonnes
Page 13
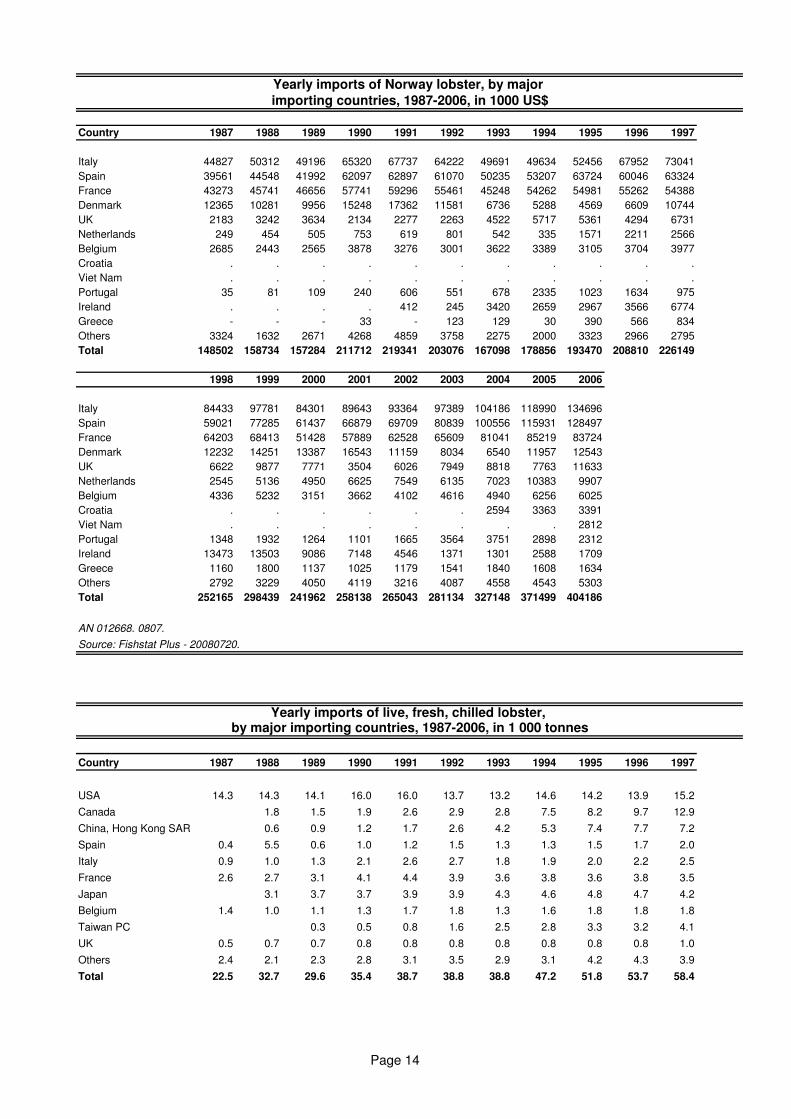
Country 1987 1988 1989 1990 1991 1992 1993 1994 1995 1996 1997
Italy 44827 50312 49196 65320 67737 64222 49691 49634 52456 67952 73041
Spain 39561 44548 41992 62097 62897 61070 50235 53207 63724 60046 63324
France 43273 45741 46656 57741 59296 55461 45248 54262 54981 55262 54388
Denmark 12365 10281 9956 15248 17362 11581 6736 5288 4569 6609 10744
UK 2183 3242 3634 2134 2277 2263 4522 5717 5361 4294 6731
Netherlands 249 454 505 753 619 801 542 335 1571 2211 2566
Belgium 2685 2443 2565 3878 3276 3001 3622 3389 3105 3704 3977
Croatia . . . . . . . . . . .
Viet Nam . . . . . . . . . . .
Portugal 35 81 109 240 606 551 678 2335 1023 1634 975
Ireland . . . . 412 245 3420 2659 2967 3566 6774
Greece - - - 33 - 123 129 30 390 566 834
Others 3324 1632 2671 4268 4859 3758 2275 2000 3323 2966 2795
Total 148502 158734 157284 211712 219341 203076 167098 178856 193470 208810 226149
1998 1999 2000 2001 2002 2003 2004 2005 2006
Italy 84433 97781 84301 89643 93364 97389 104186 118990 134696
Spain 59021 77285 61437 66879 69709 80839 100556 115931 128497
France 64203 68413 51428 57889 62528 65609 81041 85219 83724
Denmark 12232 14251 13387 16543 11159 8034 6540 11957 12543
UK 6622 9877 7771 3504 6026 7949 8818 7763 11633
Netherlands 2545 5136 4950 6625 7549 6135 7023 10383 9907
Belgium 4336 5232 3151 3662 4102 4616 4940 6256 6025
Croatia . . . . . . 2594 3363 3391
Viet Nam . . . . . . . . 2812
Portugal 1348 1932 1264 1101 1665 3564 3751 2898 2312
Ireland 13473 13503 9086 7148 4546 1371 1301 2588 1709
Greece 1160 1800 1137 1025 1179 1541 1840 1608 1634
Others 2792 3229 4050 4119 3216 4087 4558 4543 5303
Total 252165 298439 241962 258138 265043 281134 327148 371499 404186
AN 012668. 0807.
Source: Fishstat Plus - 20080720.
Country 1987 1988 1989 1990 1991 1992 1993 1994 1995 1996 1997
USA 14.3 14.3 14.1 16.0 16.0 13.7 13.2 14.6 14.2 13.9 15.2
Canada 1.8 1.5 1.9 2.6 2.9 2.8 7.5 8.2 9.7 12.9
China, Hong Kong SAR 0.6 0.9 1.2 1.7 2.6 4.2 5.3 7.4 7.7 7.2
Spain 0.4 5.5 0.6 1.0 1.2 1.5 1.3 1.3 1.5 1.7 2.0
Italy 0.9 1.0 1.3 2.1 2.6 2.7 1.8 1.9 2.0 2.2 2.5
France 2.6 2.7 3.1 4.1 4.4 3.9 3.6 3.8 3.6 3.8 3.5
Japan 3.1 3.7 3.7 3.9 3.9 4.3 4.6 4.8 4.7 4.2
Belgium 1.4 1.0 1.1 1.3 1.7 1.8 1.3 1.6 1.8 1.8 1.8
Taiwan PC 0.3 0.5 0.8 1.6 2.5 2.8 3.3 3.2 4.1
UK 0.5 0.7 0.7 0.8 0.8 0.8 0.8 0.8 0.8 0.8 1.0
Others 2.4 2.1 2.3 2.8 3.1 3.5 2.9 3.1 4.2 4.3 3.9
Total 22.5 32.7 29.6 35.4 38.7 38.8 38.8 47.2 51.8 53.7 58.4
Yearly imports of live, fresh, chilled lobster,
by major importing countries, 1987-2006, in 1 000 tonnes
Yearly imports of Norway lobster, by major
importing countries, 1987-2006, in 1000 US$
Page 14
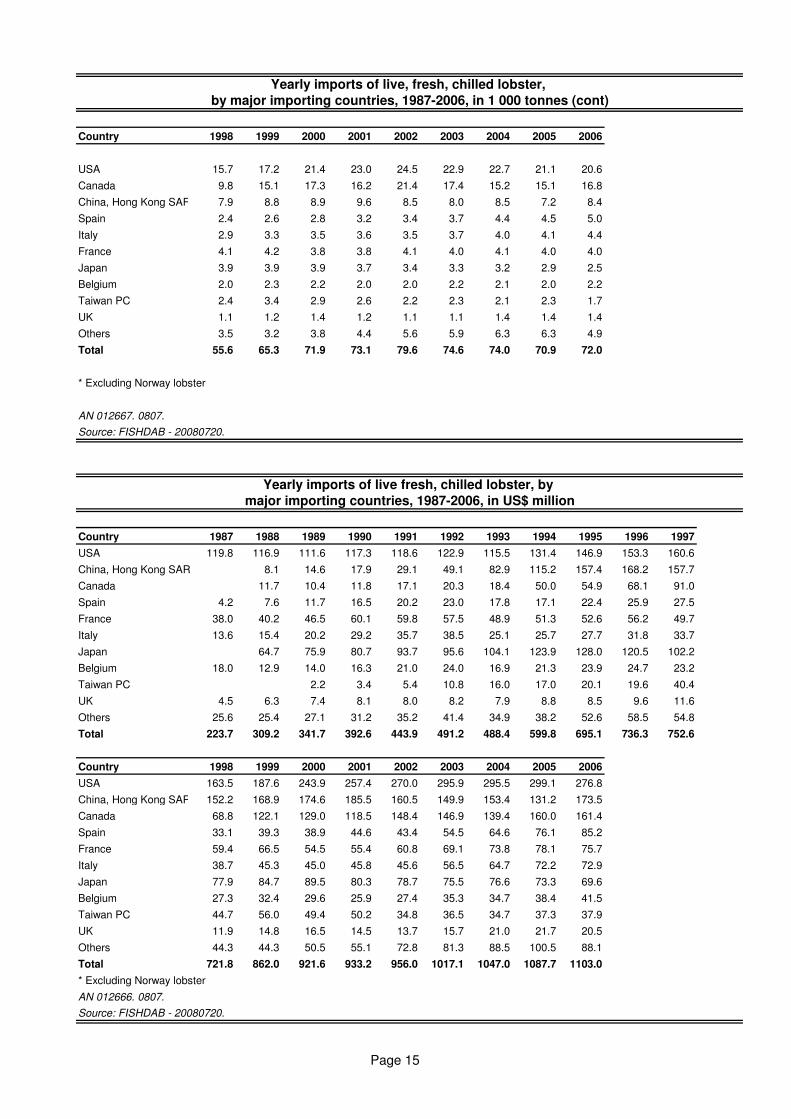
Country 1998 1999 2000 2001 2002 2003 2004 2005 2006
USA 15.7 17.2 21.4 23.0 24.5 22.9 22.7 21.1 20.6
Canada 9.8 15.1 17.3 16.2 21.4 17.4 15.2 15.1 16.8
China, Hong Kong SAR 7.9 8.8 8.9 9.6 8.5 8.0 8.5 7.2 8.4
Spain 2.4 2.6 2.8 3.2 3.4 3.7 4.4 4.5 5.0
Italy 2.9 3.3 3.5 3.6 3.5 3.7 4.0 4.1 4.4
France 4.1 4.2 3.8 3.8 4.1 4.0 4.1 4.0 4.0
Japan 3.9 3.9 3.9 3.7 3.4 3.3 3.2 2.9 2.5
Belgium 2.0 2.3 2.2 2.0 2.0 2.2 2.1 2.0 2.2
Taiwan PC 2.4 3.4 2.9 2.6 2.2 2.3 2.1 2.3 1.7
UK 1.1 1.2 1.4 1.2 1.1 1.1 1.4 1.4 1.4
Others 3.5 3.2 3.8 4.4 5.6 5.9 6.3 6.3 4.9
Total 55.6 65.3 71.9 73.1 79.6 74.6 74.0 70.9 72.0
* Excluding Norway lobster
AN 012667. 0807.
Source: FISHDAB - 20080720.
Country 1987 1988 1989 1990 1991 1992 1993 1994 1995 1996 1997
USA 119.8 116.9 111.6 117.3 118.6 122.9 115.5 131.4 146.9 153.3 160.6
China, Hong Kong SAR 8.1 14.6 17.9 29.1 49.1 82.9 115.2 157.4 168.2 157.7
Canada 11.7 10.4 11.8 17.1 20.3 18.4 50.0 54.9 68.1 91.0
Spain 4.2 7.6 11.7 16.5 20.2 23.0 17.8 17.1 22.4 25.9 27.5
France 38.0 40.2 46.5 60.1 59.8 57.5 48.9 51.3 52.6 56.2 49.7
Italy 13.6 15.4 20.2 29.2 35.7 38.5 25.1 25.7 27.7 31.8 33.7
Japan 64.7 75.9 80.7 93.7 95.6 104.1 123.9 128.0 120.5 102.2
Belgium 18.0 12.9 14.0 16.3 21.0 24.0 16.9 21.3 23.9 24.7 23.2
Taiwan PC 2.2 3.4 5.4 10.8 16.0 17.0 20.1 19.6 40.4
UK 4.5 6.3 7.4 8.1 8.0 8.2 7.9 8.8 8.5 9.6 11.6
Others 25.6 25.4 27.1 31.2 35.2 41.4 34.9 38.2 52.6 58.5 54.8
Total 223.7 309.2 341.7 392.6 443.9 491.2 488.4 599.8 695.1 736.3 752.6
Country 1998 1999 2000 2001 2002 2003 2004 2005 2006
USA 163.5 187.6 243.9 257.4 270.0 295.9 295.5 299.1 276.8
China, Hong Kong SAR 152.2 168.9 174.6 185.5 160.5 149.9 153.4 131.2 173.5
Canada 68.8 122.1 129.0 118.5 148.4 146.9 139.4 160.0 161.4
Spain 33.1 39.3 38.9 44.6 43.4 54.5 64.6 76.1 85.2
France 59.4 66.5 54.5 55.4 60.8 69.1 73.8 78.1 75.7
Italy 38.7 45.3 45.0 45.8 45.6 56.5 64.7 72.2 72.9
Japan 77.9 84.7 89.5 80.3 78.7 75.5 76.6 73.3 69.6
Belgium 27.3 32.4 29.6 25.9 27.4 35.3 34.7 38.4 41.5
Taiwan PC 44.7 56.0 49.4 50.2 34.8 36.5 34.7 37.3 37.9
UK 11.9 14.8 16.5 14.5 13.7 15.7 21.0 21.7 20.5
Others 44.3 44.3 50.5 55.1 72.8 81.3 88.5 100.5 88.1
Total 721.8 862.0 921.6 933.2 956.0 1017.1 1047.0 1087.7 1103.0
* Excluding Norway lobster
AN 012666. 0807.
Source: FISHDAB - 20080720.
Yearly imports of live fresh, chilled lobster, by
major importing countries, 1987-2006, in US$ million
Yearly imports of live, fresh, chilled lobster,
by major importing countries, 1987-2006, in 1 000 tonnes (cont)
Page 15
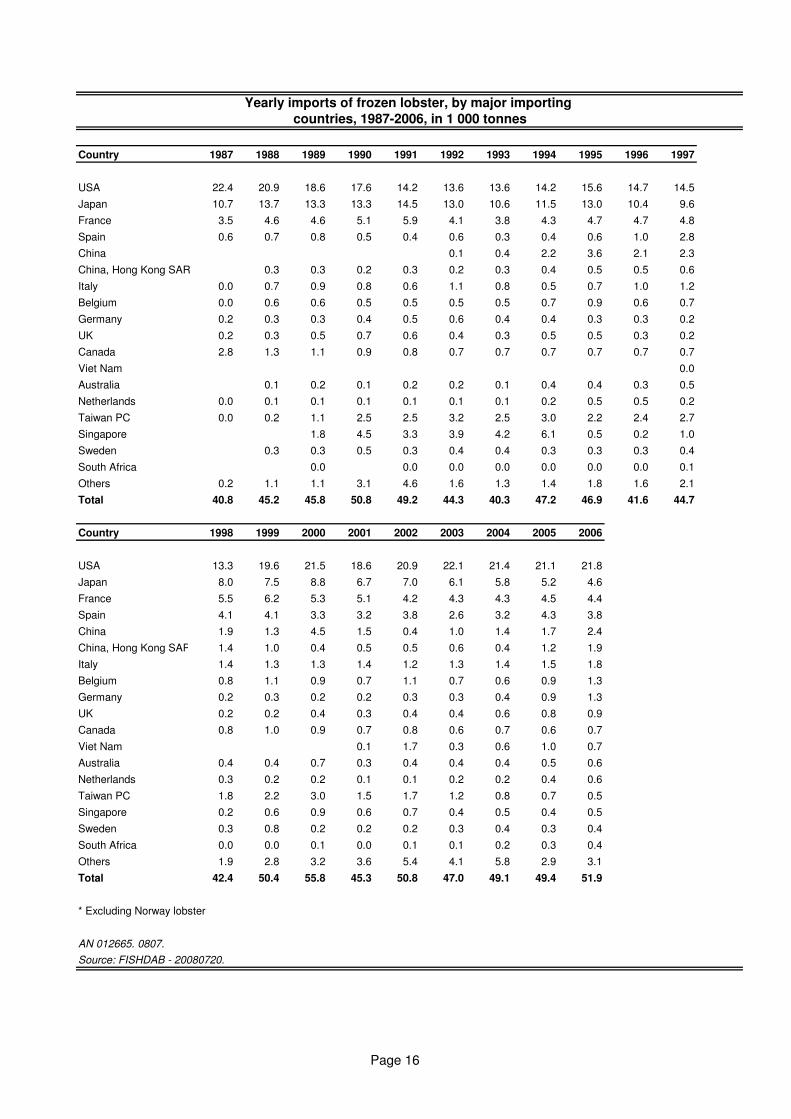
Country 1987 1988 1989 1990 1991 1992 1993 1994 1995 1996 1997
USA 22.4 20.9 18.6 17.6 14.2 13.6 13.6 14.2 15.6 14.7 14.5
Japan 10.7 13.7 13.3 13.3 14.5 13.0 10.6 11.5 13.0 10.4 9.6
France 3.5 4.6 4.6 5.1 5.9 4.1 3.8 4.3 4.7 4.7 4.8
Spain 0.6 0.7 0.8 0.5 0.4 0.6 0.3 0.4 0.6 1.0 2.8
China 0.1 0.4 2.2 3.6 2.1 2.3
China, Hong Kong SAR 0.3 0.3 0.2 0.3 0.2 0.3 0.4 0.5 0.5 0.6
Italy 0.0 0.7 0.9 0.8 0.6 1.1 0.8 0.5 0.7 1.0 1.2
Belgium 0.0 0.6 0.6 0.5 0.5 0.5 0.5 0.7 0.9 0.6 0.7
Germany 0.2 0.3 0.3 0.4 0.5 0.6 0.4 0.4 0.3 0.3 0.2
UK 0.2 0.3 0.5 0.7 0.6 0.4 0.3 0.5 0.5 0.3 0.2
Canada 2.8 1.3 1.1 0.9 0.8 0.7 0.7 0.7 0.7 0.7 0.7
Viet Nam 0.0
Australia 0.1 0.2 0.1 0.2 0.2 0.1 0.4 0.4 0.3 0.5
Netherlands 0.0 0.1 0.1 0.1 0.1 0.1 0.1 0.2 0.5 0.5 0.2
Taiwan PC 0.0 0.2 1.1 2.5 2.5 3.2 2.5 3.0 2.2 2.4 2.7
Singapore 1.8 4.5 3.3 3.9 4.2 6.1 0.5 0.2 1.0
Sweden 0.3 0.3 0.5 0.3 0.4 0.4 0.3 0.3 0.3 0.4
South Africa 0.0 0.0 0.0 0.0 0.0 0.0 0.0 0.1
Others 0.2 1.1 1.1 3.1 4.6 1.6 1.3 1.4 1.8 1.6 2.1
Total 40.8 45.2 45.8 50.8 49.2 44.3 40.3 47.2 46.9 41.6 44.7
Country 1998 1999 2000 2001 2002 2003 2004 2005 2006
USA 13.3 19.6 21.5 18.6 20.9 22.1 21.4 21.1 21.8
Japan 8.0 7.5 8.8 6.7 7.0 6.1 5.8 5.2 4.6
France 5.5 6.2 5.3 5.1 4.2 4.3 4.3 4.5 4.4
Spain 4.1 4.1 3.3 3.2 3.8 2.6 3.2 4.3 3.8
China 1.9 1.3 4.5 1.5 0.4 1.0 1.4 1.7 2.4
China, Hong Kong SAR 1.4 1.0 0.4 0.5 0.5 0.6 0.4 1.2 1.9
Italy 1.4 1.3 1.3 1.4 1.2 1.3 1.4 1.5 1.8
Belgium 0.8 1.1 0.9 0.7 1.1 0.7 0.6 0.9 1.3
Germany 0.2 0.3 0.2 0.2 0.3 0.3 0.4 0.9 1.3
UK 0.2 0.2 0.4 0.3 0.4 0.4 0.6 0.8 0.9
Canada 0.8 1.0 0.9 0.7 0.8 0.6 0.7 0.6 0.7
Viet Nam 0.1 1.7 0.3 0.6 1.0 0.7
Australia 0.4 0.4 0.7 0.3 0.4 0.4 0.4 0.5 0.6
Netherlands 0.3 0.2 0.2 0.1 0.1 0.2 0.2 0.4 0.6
Taiwan PC 1.8 2.2 3.0 1.5 1.7 1.2 0.8 0.7 0.5
Singapore 0.2 0.6 0.9 0.6 0.7 0.4 0.5 0.4 0.5
Sweden 0.3 0.8 0.2 0.2 0.2 0.3 0.4 0.3 0.4
South Africa 0.0 0.0 0.1 0.0 0.1 0.1 0.2 0.3 0.4
Others 1.9 2.8 3.2 3.6 5.4 4.1 5.8 2.9 3.1
Total 42.4 50.4 55.8 45.3 50.8 47.0 49.1 49.4 51.9
* Excluding Norway lobster
AN 012665. 0807.
Source: FISHDAB - 20080720.
Yearly imports of frozen lobster, by major importing
countries, 1987-2006, in 1 000 tonnes
Page 16

Country 1987 1988 1989 1990 1991 1992 1993 1994 1995 1996 1997
USA 456.1 429.7 349.3 331.7 314.1 318.3 270.5 324.6 352.5 299.7 327.6
France 50.3 69.2 55.2 63.1 95.6 65.0 50.9 66.3 84.1 70.8 75.3
Japan 144.2 195.1 192.6 206.8 272.5 244.3 171.4 209.0 250.0 196.3 178.6
Spain 5.2 7.0 8.3 7.3 6.3 8.4 3.9 7.1 9.1 14.8 37.3
Italy 0.4 9.3 11.1 9.3 8.4 13.5 7.9 5.2 8.2 13.1 13.6
Belgium 0.2 9.1 6.9 5.3 5.5 6.1 4.9 8.8 13.0 8.5 8.7
China, Hong Kong SAR 3.8 4.2 3.4 4.5 3.9 5.1 6.0 5.3 5.2 4.3
Canada 43.1 25.0 19.4 16.7 16.8 14.9 13.8 15.6 15.0 13.7 13.6
Germany 4.8 6.4 4.7 5.7 7.0 7.4 4.6 4.8 4.5 3.4 3.1
UK 2.3 3.8 4.4 6.4 6.3 4.4 3.1 5.4 5.7 4.7 2.9
Netherlands 0.3 1.3 1.3 1.5 1.3 1.0 1.1 3.9 13.6 6.6 1.7
Viet Nam 0.2
Australia 1.0 2.8 1.7 3.0 2.1 1.5 5.5 6.4 4.3 6.7
Korea Rep 0.2 0.6 0.3 0.5 1.1 1.0 1.2 1.4 2.4 3.1 3.7
China 1.0 2.6 16.2 16.8 12.3 6.1
Greece 0.0 0.2 0.2 0.7 0.2 0.4 0.4 0.4 0.9 1.6 1.7
Taiwan PC 0.3 1.3 8.2 17.2 18.1 23.0 17.1 20.4 15.2 17.1 22.3
United Arab Emirates 0.3 0.0 0.0
Others 1.9 13.3 23.1 28.4 39.0 41.0 39.0 48.7 29.5 20.0 27.0
Total 709.4 776.0 691.8 705.8 799.7 755.6 598.8 749.2 832.5 695.2 734.4
Country 1998 1999 2000 2001 2002 2003 2004 2005 2006
USA 319.6 449.4 537.6 477.6 556.1 596.1 591.0 614.9 651.1
France 85.3 96.8 89.5 76.5 73.4 85.5 89.5 105.5 108.6
Japan 119.0 109.5 158.4 113.9 128.2 104.8 98.3 94.2 90.2
Spain 50.6 57.1 48.4 45.4 57.3 41.0 46.8 59.3 54.8
Italy 14.9 14.8 16.3 17.8 14.4 17.2 19.6 20.9 28.3
Belgium 10.0 15.9 13.1 10.5 16.3 10.5 9.0 15.1 25.2
China, Hong Kong SAR 7.6 7.7 4.6 4.5 5.8 5.7 4.1 11.2 24.3
Canada 15.8 20.7 21.7 16.7 16.0 13.5 18.0 16.8 20.7
Germany 3.2 4.0 2.8 3.5 4.2 6.2 7.8 10.9 17.8
UK 3.4 3.1 6.0 4.3 4.5 5.8 7.2 11.2 16.3
Netherlands 4.2 2.2 4.4 2.1 2.4 4.2 3.2 6.4 9.9
Viet Nam 1.1 27.2 5.0 9.8 16.5 9.9
Australia 6.2 4.6 7.2 3.9 6.1 5.1 5.5 7.5 8.6
Korea Rep 1.5 2.5 5.1 6.2 6.7 4.9 5.6 6.1 7.1
China 4.5 3.1 3.9 1.9 1.3 2.0 4.7 5.4 7.1
Greece 2.4 2.9 3.2 5.1 4.2 5.0 5.8 4.6 6.5
Taiwan PC 19.7 17.3 24.1 13.6 14.0 9.7 6.4 5.7 6.4
United Arab Emirates 0.0 7.2 9.8 12.2 12.8 17.2 2.8 4.5 5.7
Others 21.9 31.3 24.9 22.8 29.7 28.5 36.5 31.9 38.1
Total 689.8 850.2 981.0 839.4 980.5 968.0 971.6 1048.6 1136.3
* Excluding Norway lobster
AN 012664. 0807.
Source: FISHDAB - 20080720.
Yearly imports of frozen lobster, by major importing
countries, 1987-2006 in US$ million
Page 17
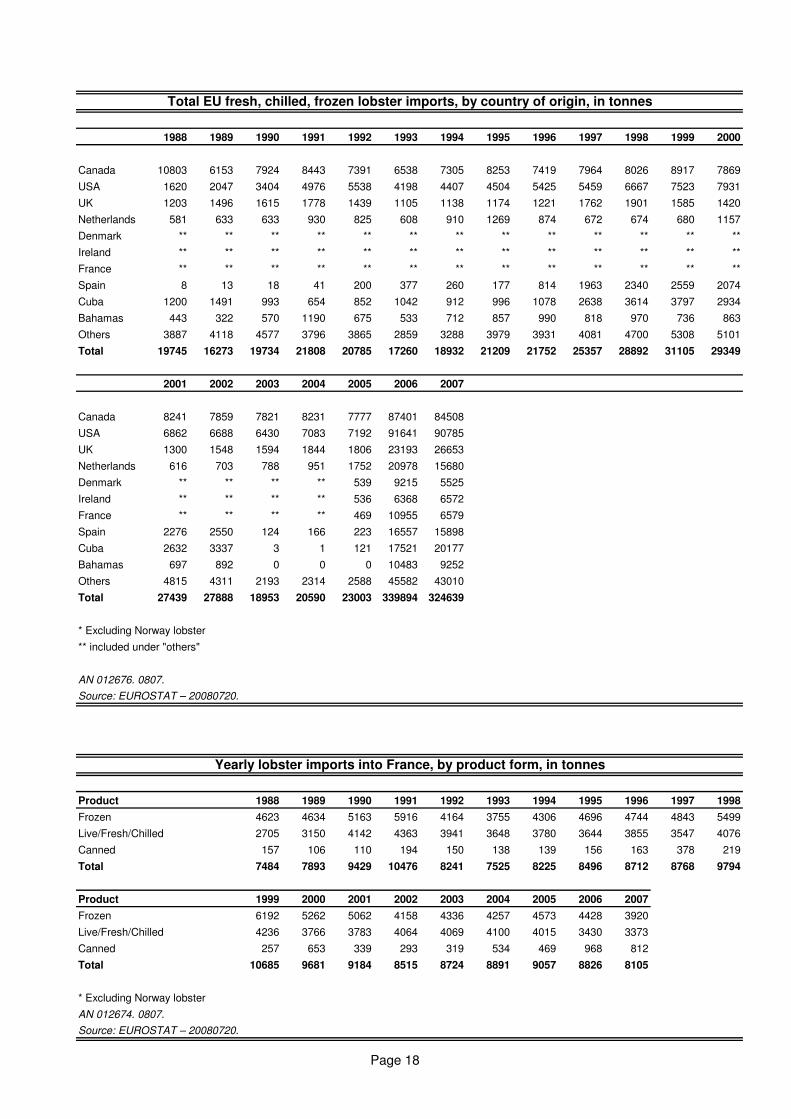
1988 1989 1990 1991 1992 1993 1994 1995 1996 1997 1998 1999 2000
Canada 10803 6153 7924 8443 7391 6538 7305 8253 7419 7964 8026 8917 7869
USA 1620 2047 3404 4976 5538 4198 4407 4504 5425 5459 6667 7523 7931
UK 1203 1496 1615 1778 1439 1105 1138 1174 1221 1762 1901 1585 1420
Netherlands 581 633 633 930 825 608 910 1269 874 672 674 680 1157
Denmark ** ** ** ** ** ** ** ** ** ** ** ** **
Ireland ** ** ** ** ** ** ** ** ** ** ** ** **
France ** ** ** ** ** ** ** ** ** ** ** ** **
Spain 8 13 18 41 200 377 260 177 814 1963 2340 2559 2074
Cuba 1200 1491 993 654 852 1042 912 996 1078 2638 3614 3797 2934
Bahamas 443 322 570 1190 675 533 712 857 990 818 970 736 863
Others 3887 4118 4577 3796 3865 2859 3288 3979 3931 4081 4700 5308 5101
Total 19745 16273 19734 21808 20785 17260 18932 21209 21752 25357 28892 31105 29349
2001 2002 2003 2004 2005 2006 2007
Canada 8241 7859 7821 8231 7777 87401 84508
USA 6862 6688 6430 7083 7192 91641 90785
UK 1300 1548 1594 1844 1806 23193 26653
Netherlands 616 703 788 951 1752 20978 15680
Denmark ** ** ** ** 539 9215 5525
Ireland ** ** ** ** 536 6368 6572
France ** ** ** ** 469 10955 6579
Spain 2276 2550 124 166 223 16557 15898
Cuba 2632 3337 3 1 121 17521 20177
Bahamas 697 892 0 0 0 10483 9252
Others 4815 4311 2193 2314 2588 45582 43010
Total 27439 27888 18953 20590 23003 339894 324639
* Excluding Norway lobster
** included under "others"
AN 012676. 0807.
Source: EUROSTAT – 20080720.
Product 1988 1989 1990 1991 1992 1993 1994 1995 1996 1997 1998
Frozen 4623 4634 5163 5916 4164 3755 4306 4696 4744 4843 5499
Live/Fresh/Chilled 2705 3150 4142 4363 3941 3648 3780 3644 3855 3547 4076
Canned 157 106 110 194 150 138 139 156 163 378 219
Total 7484 7893 9429 10476 8241 7525 8225 8496 8712 8768 9794
Product 1999 2000 2001 2002 2003 2004 2005 2006 2007
Frozen 6192 5262 5062 4158 4336 4257 4573 4428 3920
Live/Fresh/Chilled 4236 3766 3783 4064 4069 4100 4015 3430 3373
Canned 257 653 339 293 319 534 469 968 812
Total 10685 9681 9184 8515 8724 8891 9057 8826 8105
* Excluding Norway lobster
AN 012674. 0807.
Source: EUROSTAT – 20080720.
Total EU fresh, chilled, frozen lobster imports, by country of origin, in tonnes
Yearly lobster imports into France, by product form, in tonnes
Page 18
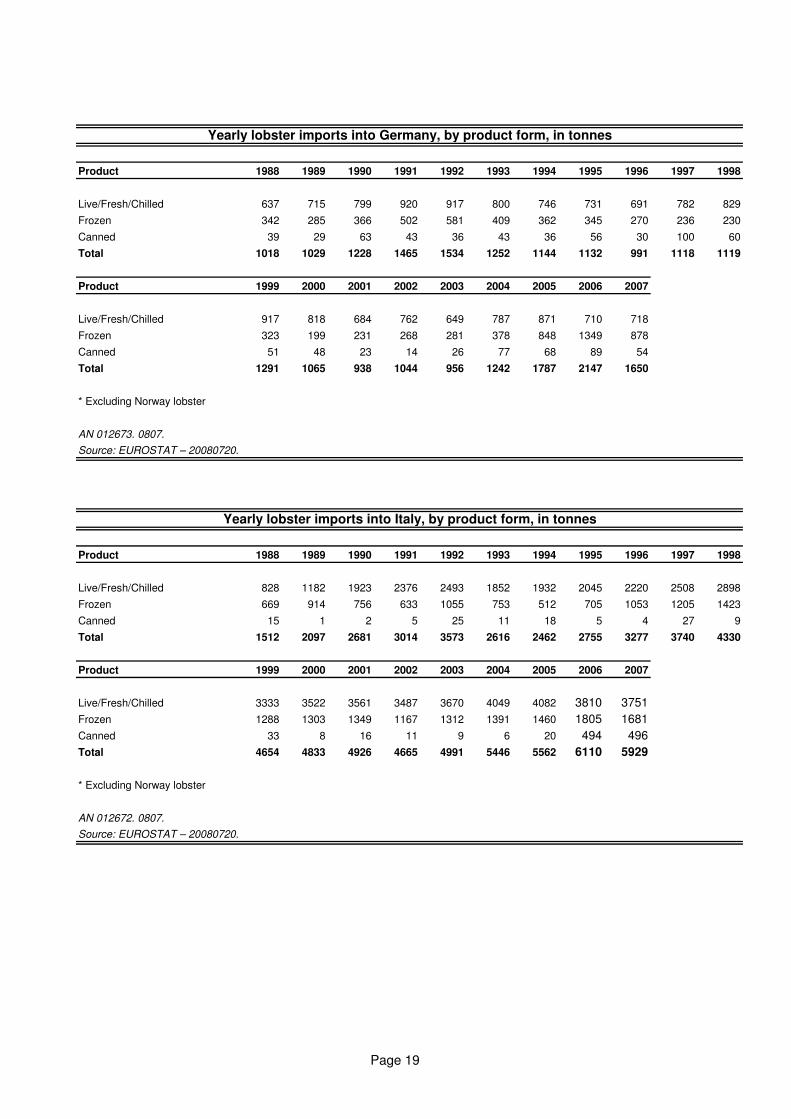
Product 1988 1989 1990 1991 1992 1993 1994 1995 1996 1997 1998
Live/Fresh/Chilled 637 715 799 920 917 800 746 731 691 782 829
Frozen 342 285 366 502 581 409 362 345 270 236 230
Canned 39 29 63 43 36 43 36 56 30 100 60
Total 1018 1029 1228 1465 1534 1252 1144 1132 991 1118 1119
Product 1999 2000 2001 2002 2003 2004 2005 2006 2007
Live/Fresh/Chilled 917 818 684 762 649 787 871 710 718
Frozen 323 199 231 268 281 378 848 1349 878
Canned 51 48 23 14 26 77 68 89 54
Total 1291 1065 938 1044 956 1242 1787 2147 1650
* Excluding Norway lobster
AN 012673. 0807.
Source: EUROSTAT – 20080720.
Product 1988 1989 1990 1991 1992 1993 1994 1995 1996 1997 1998
Live/Fresh/Chilled 828 1182 1923 2376 2493 1852 1932 2045 2220 2508 2898
Frozen 669 914 756 633 1055 753 512 705 1053 1205 1423
Canned 15 1 2 5 25 11 18 5 4 27 9
Total 1512 2097 2681 3014 3573 2616 2462 2755 3277 3740 4330
Product 1999 2000 2001 2002 2003 2004 2005 2006 2007
Live/Fresh/Chilled 3333 3522 3561 3487 3670 4049 4082 3810 3751
Frozen 1288 1303 1349 1167 1312 1391 1460 1805 1681
Canned 33 8 16 11 9 6 20 494 496
Total 4654 4833 4926 4665 4991 5446 5562 6110 5929
* Excluding Norway lobster
AN 012672. 0807.
Source: EUROSTAT – 20080720.
Yearly lobster imports into Italy, by product form, in tonnes
Yearly lobster imports into Germany, by product form, in tonnes
Page 19
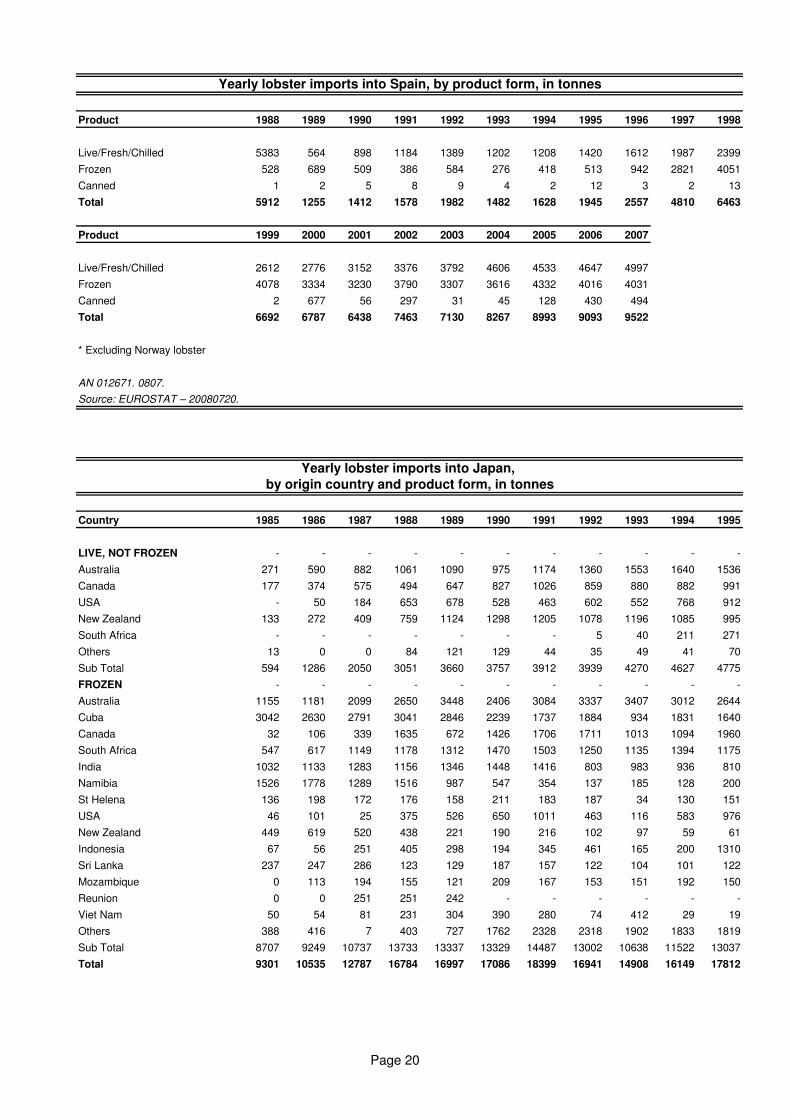
Product 1988 1989 1990 1991 1992 1993 1994 1995 1996 1997 1998
Live/Fresh/Chilled 5383 564 898 1184 1389 1202 1208 1420 1612 1987 2399
Frozen 528 689 509 386 584 276 418 513 942 2821 4051
Canned 1 2 5 8 9 4 2 12 3 2 13
Total 5912 1255 1412 1578 1982 1482 1628 1945 2557 4810 6463
Product 1999 2000 2001 2002 2003 2004 2005 2006 2007
Live/Fresh/Chilled 2612 2776 3152 3376 3792 4606 4533 4647 4997
Frozen 4078 3334 3230 3790 3307 3616 4332 4016 4031
Canned 2 677 56 297 31 45 128 430 494
Total 6692 6787 6438 7463 7130 8267 8993 9093 9522
* Excluding Norway lobster
AN 012671. 0807.
Source: EUROSTAT – 20080720.
Country 1985 1986 1987 1988 1989 1990 1991 1992 1993 1994 1995
LIVE, NOT FROZEN - - - - - - - - - - -
Australia 271 590 882 1061 1090 975 1174 1360 1553 1640 1536
Canada 177 374 575 494 647 827 1026 859 880 882 991
USA - 50 184 653 678 528 463 602 552 768 912
New Zealand 133 272 409 759 1124 1298 1205 1078 1196 1085 995
South Africa - - - - - - - 5 40 211 271
Others 13 0 0 84 121 129 44 35 49 41 70
Sub Total 594 1286 2050 3051 3660 3757 3912 3939 4270 4627 4775
FROZEN - - - - - - - - - - -
Australia 1155 1181 2099 2650 3448 2406 3084 3337 3407 3012 2644
Cuba 3042 2630 2791 3041 2846 2239 1737 1884 934 1831 1640
Canada 32 106 339 1635 672 1426 1706 1711 1013 1094 1960
South Africa 547 617 1149 1178 1312 1470 1503 1250 1135 1394 1175
India 1032 1133 1283 1156 1346 1448 1416 803 983 936 810
Namibia 1526 1778 1289 1516 987 547 354 137 185 128 200
St Helena 136 198 172 176 158 211 183 187 34 130 151
USA 46 101 25 375 526 650 1011 463 116 583 976
New Zealand 449 619 520 438 221 190 216 102 97 59 61
Indonesia 67 56 251 405 298 194 345 461 165 200 1310
Sri Lanka 237 247 286 123 129 187 157 122 104 101 122
Mozambique 0 113 194 155 121 209 167 153 151 192 150
Reunion 0 0 251 251 242 - - - - - -
Viet Nam 50 54 81 231 304 390 280 74 412 29 19
Others 388 416 7 403 727 1762 2328 2318 1902 1833 1819
Sub Total 8707 9249 10737 13733 13337 13329 14487 13002 10638 11522 13037
Total 9301 10535 12787 16784 16997 17086 18399 16941 14908 16149 17812
Yearly lobster imports into Japan,
by origin country and product form, in tonnes
Yearly lobster imports into Spain, by product form, in tonnes
Page 20
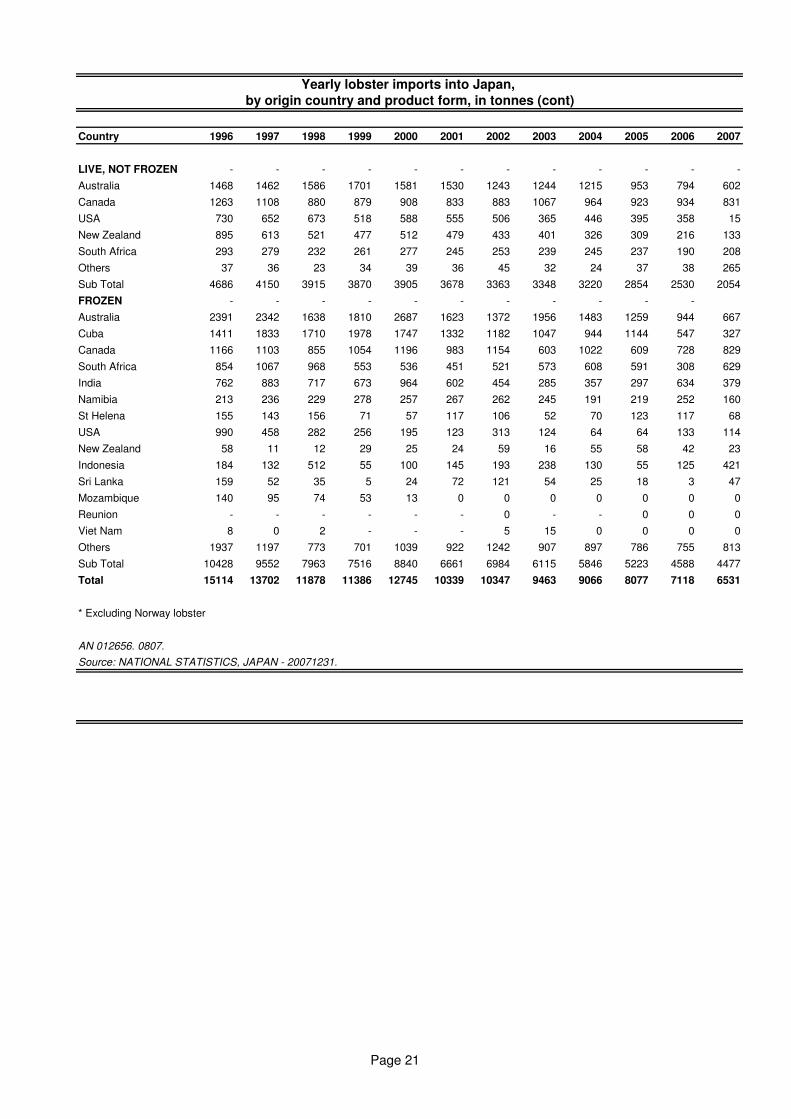
Country 1996 1997 1998 1999 2000 2001 2002 2003 2004 2005 2006 2007
LIVE, NOT FROZEN - - - - - - - - - - - -
Australia 1468 1462 1586 1701 1581 1530 1243 1244 1215 953 794 602
Canada 1263 1108 880 879 908 833 883 1067 964 923 934 831
USA 730 652 673 518 588 555 506 365 446 395 358 15
New Zealand 895 613 521 477 512 479 433 401 326 309 216 133
South Africa 293 279 232 261 277 245 253 239 245 237 190 208
Others 37 36 23 34 39 36 45 32 24 37 38 265
Sub Total 4686 4150 3915 3870 3905 3678 3363 3348 3220 2854 2530 2054
FROZEN - - - - - - - - - - -
Australia 2391 2342 1638 1810 2687 1623 1372 1956 1483 1259 944 667
Cuba 1411 1833 1710 1978 1747 1332 1182 1047 944 1144 547 327
Canada 1166 1103 855 1054 1196 983 1154 603 1022 609 728 829
South Africa 854 1067 968 553 536 451 521 573 608 591 308 629
India 762 883 717 673 964 602 454 285 357 297 634 379
Namibia 213 236 229 278 257 267 262 245 191 219 252 160
St Helena 155 143 156 71 57 117 106 52 70 123 117 68
USA 990 458 282 256 195 123 313 124 64 64 133 114
New Zealand 58 11 12 29 25 24 59 16 55 58 42 23
Indonesia 184 132 512 55 100 145 193 238 130 55 125 421
Sri Lanka 159 52 35 5 24 72 121 54 25 18 3 47
Mozambique 140 95 74 53 13 0 0 0 0 0 0 0
Reunion - - - - - - 0 - - 0 0 0
Viet Nam 8 0 2 - - - 5 15 0 0 0 0
Others 1937 1197 773 701 1039 922 1242 907 897 786 755 813
Sub Total 10428 9552 7963 7516 8840 6661 6984 6115 5846 5223 4588 4477
Total 15114 13702 11878 11386 12745 10339 10347 9463 9066 8077 7118 6531
* Excluding Norway lobster
AN 012656. 0807.
Source: NATIONAL STATISTICS, JAPAN - 20071231.
Yearly lobster imports into Japan,
by origin country and product form, in tonnes (cont)
Page 21
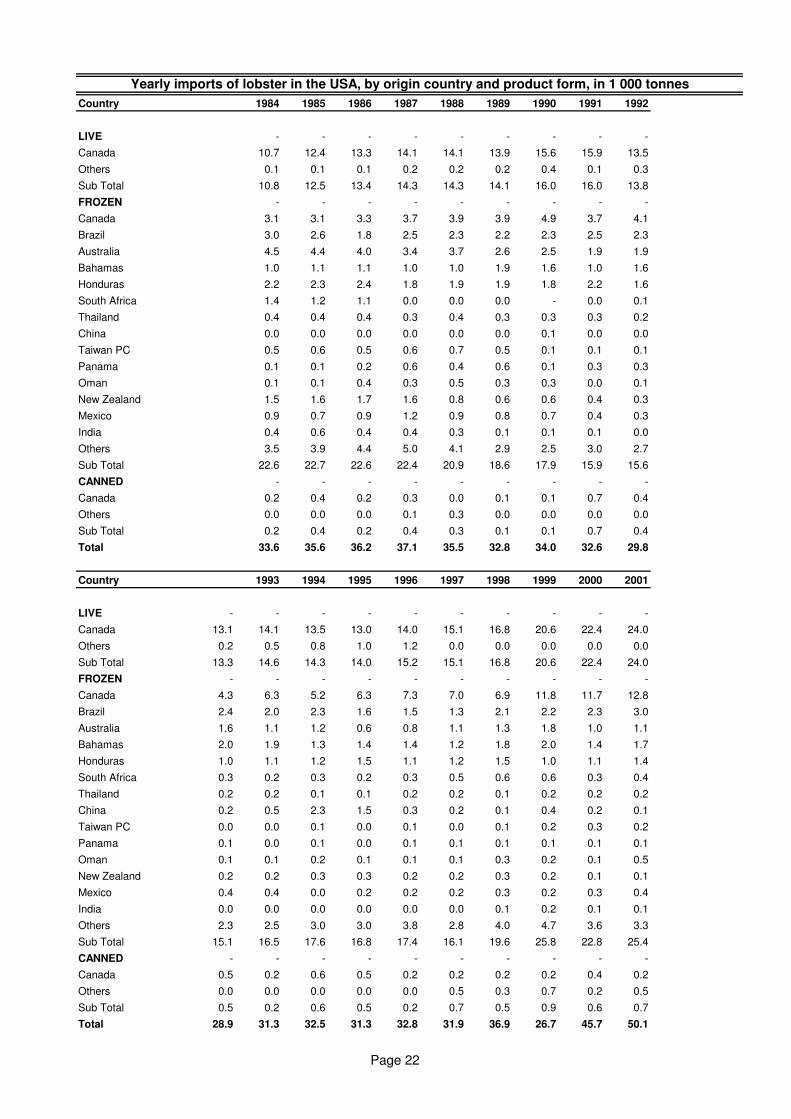
Country 1984 1985 1986 1987 1988 1989 1990 1991 1992
LIVE - - - - - - - - -
Canada 10.7 12.4 13.3 14.1 14.1 13.9 15.6 15.9 13.5
Others 0.1 0.1 0.1 0.2 0.2 0.2 0.4 0.1 0.3
Sub Total 10.8 12.5 13.4 14.3 14.3 14.1 16.0 16.0 13.8
FROZEN - - - - - - - - -
Canada 3.1 3.1 3.3 3.7 3.9 3.9 4.9 3.7 4.1
Brazil 3.0 2.6 1.8 2.5 2.3 2.2 2.3 2.5 2.3
Australia 4.5 4.4 4.0 3.4 3.7 2.6 2.5 1.9 1.9
Bahamas 1.0 1.1 1.1 1.0 1.0 1.9 1.6 1.0 1.6
Honduras 2.2 2.3 2.4 1.8 1.9 1.9 1.8 2.2 1.6
South Africa 1.4 1.2 1.1 0.0 0.0 0.0 - 0.0 0.1
Thailand 0.4 0.4 0.4 0.3 0.4 0.3 0.3 0.3 0.2
China 0.0 0.0 0.0 0.0 0.0 0.0 0.1 0.0 0.0
Taiwan PC 0.5 0.6 0.5 0.6 0.7 0.5 0.1 0.1 0.1
Panama 0.1 0.1 0.2 0.6 0.4 0.6 0.1 0.3 0.3
Oman 0.1 0.1 0.4 0.3 0.5 0.3 0.3 0.0 0.1
New Zealand 1.5 1.6 1.7 1.6 0.8 0.6 0.6 0.4 0.3
Mexico 0.9 0.7 0.9 1.2 0.9 0.8 0.7 0.4 0.3
India 0.4 0.6 0.4 0.4 0.3 0.1 0.1 0.1 0.0
Others 3.5 3.9 4.4 5.0 4.1 2.9 2.5 3.0 2.7
Sub Total 22.6 22.7 22.6 22.4 20.9 18.6 17.9 15.9 15.6
CANNED - - - - - - - - -
Canada 0.2 0.4 0.2 0.3 0.0 0.1 0.1 0.7 0.4
Others 0.0 0.0 0.0 0.1 0.3 0.0 0.0 0.0 0.0
Sub Total 0.2 0.4 0.2 0.4 0.3 0.1 0.1 0.7 0.4
Total 33.6 35.6 36.2 37.1 35.5 32.8 34.0 32.6 29.8
Country 1993 1994 1995 1996 1997 1998 1999 2000 2001
LIVE - - - - - - - - - -
Canada 13.1 14.1 13.5 13.0 14.0 15.1 16.8 20.6 22.4 24.0
Others 0.2 0.5 0.8 1.0 1.2 0.0 0.0 0.0 0.0 0.0
Sub Total 13.3 14.6 14.3 14.0 15.2 15.1 16.8 20.6 22.4 24.0
FROZEN - - - - - - - - - -
Canada 4.3 6.3 5.2 6.3 7.3 7.0 6.9 11.8 11.7 12.8
Brazil 2.4 2.0 2.3 1.6 1.5 1.3 2.1 2.2 2.3 3.0
Australia 1.6 1.1 1.2 0.6 0.8 1.1 1.3 1.8 1.0 1.1
Bahamas 2.0 1.9 1.3 1.4 1.4 1.2 1.8 2.0 1.4 1.7
Honduras 1.0 1.1 1.2 1.5 1.1 1.2 1.5 1.0 1.1 1.4
South Africa 0.3 0.2 0.3 0.2 0.3 0.5 0.6 0.6 0.3 0.4
Thailand 0.2 0.2 0.1 0.1 0.2 0.2 0.1 0.2 0.2 0.2
China 0.2 0.5 2.3 1.5 0.3 0.2 0.1 0.4 0.2 0.1
Taiwan PC 0.0 0.0 0.1 0.0 0.1 0.0 0.1 0.2 0.3 0.2
Panama 0.1 0.0 0.1 0.0 0.1 0.1 0.1 0.1 0.1 0.1
Oman 0.1 0.1 0.2 0.1 0.1 0.1 0.3 0.2 0.1 0.5
New Zealand 0.2 0.2 0.3 0.3 0.2 0.2 0.3 0.2 0.1 0.1
Mexico 0.4 0.4 0.0 0.2 0.2 0.2 0.3 0.2 0.3 0.4
India 0.0 0.0 0.0 0.0 0.0 0.0 0.1 0.2 0.1 0.1
Others 2.3 2.5 3.0 3.0 3.8 2.8 4.0 4.7 3.6 3.3
Sub Total 15.1 16.5 17.6 16.8 17.4 16.1 19.6 25.8 22.8 25.4
CANNED - - - - - - - - - -
Canada 0.5 0.2 0.6 0.5 0.2 0.2 0.2 0.2 0.4 0.2
Others 0.0 0.0 0.0 0.0 0.0 0.5 0.3 0.7 0.2 0.5
Sub Total 0.5 0.2 0.6 0.5 0.2 0.7 0.5 0.9 0.6 0.7
Total 28.9 31.3 32.5 31.3 32.8 31.9 36.9 26.7 45.7 50.1
Yearly imports of lobster in the USA, by origin country and product form, in 1 000 tonnes
Page 22
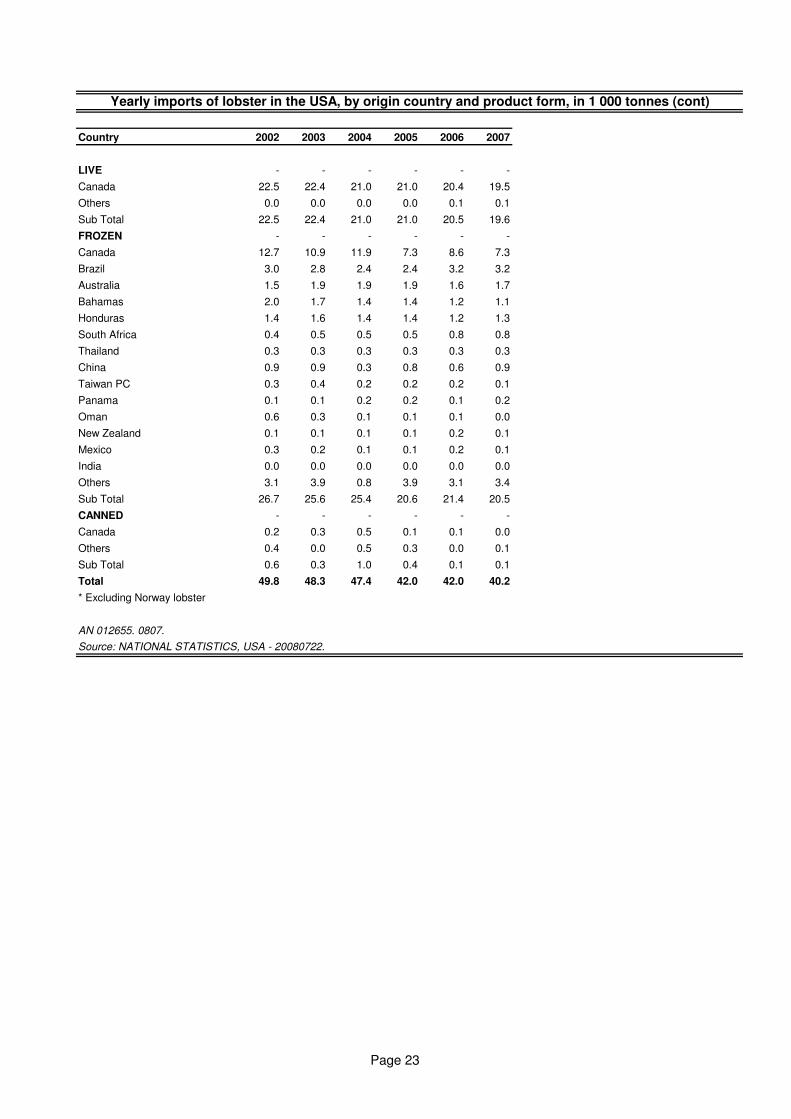
Country 2002 2003 2004 2005 2006 2007
LIVE - - - - - -
Canada 22.5 22.4 21.0 21.0 20.4 19.5
Others 0.0 0.0 0.0 0.0 0.1 0.1
Sub Total 22.5 22.4 21.0 21.0 20.5 19.6
FROZEN - - - - - -
Canada 12.7 10.9 11.9 7.3 8.6 7.3
Brazil 3.0 2.8 2.4 2.4 3.2 3.2
Australia 1.5 1.9 1.9 1.9 1.6 1.7
Bahamas 2.0 1.7 1.4 1.4 1.2 1.1
Honduras 1.4 1.6 1.4 1.4 1.2 1.3
South Africa 0.4 0.5 0.5 0.5 0.8 0.8
Thailand 0.3 0.3 0.3 0.3 0.3 0.3
China 0.9 0.9 0.3 0.8 0.6 0.9
Taiwan PC 0.3 0.4 0.2 0.2 0.2 0.1
Panama 0.1 0.1 0.2 0.2 0.1 0.2
Oman 0.6 0.3 0.1 0.1 0.1 0.0
New Zealand 0.1 0.1 0.1 0.1 0.2 0.1
Mexico 0.3 0.2 0.1 0.1 0.2 0.1
India 0.0 0.0 0.0 0.0 0.0 0.0
Others 3.1 3.9 0.8 3.9 3.1 3.4
Sub Total 26.7 25.6 25.4 20.6 21.4 20.5
CANNED - - - - - -
Canada 0.2 0.3 0.5 0.1 0.1 0.0
Others 0.4 0.0 0.5 0.3 0.0 0.1
Sub Total 0.6 0.3 1.0 0.4 0.1 0.1
Total 49.8 48.3 47.4 42.0 42.0 40.2
* Excluding Norway lobster
AN 012655. 0807.
Source: NATIONAL STATISTICS, USA - 20080722.
Yearly imports of lobster in the USA, by origin country and product form, in 1 000 tonnes (cont)
Page 23
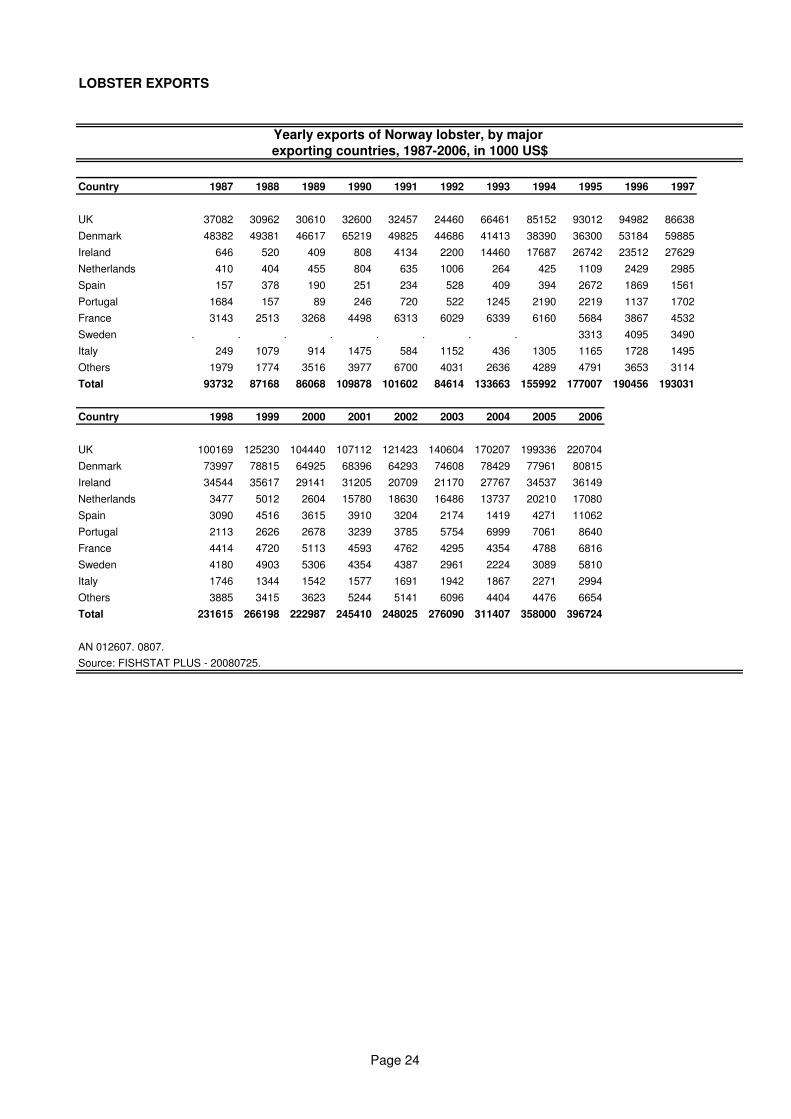
LOBSTER EXPORTS
Country 1987 1988 1989 1990 1991 1992 1993 1994 1995 1996 1997
UK 37082 30962 30610 32600 32457 24460 66461 85152 93012 94982 86638
Denmark 48382 49381 46617 65219 49825 44686 41413 38390 36300 53184 59885
Ireland 646 520 409 808 4134 2200 14460 17687 26742 23512 27629
Netherlands 410 404 455 804 635 1006 264 425 1109 2429 2985
Spain 157 378 190 251 234 528 409 394 2672 1869 1561
Portugal 1684 157 89 246 720 522 1245 2190 2219 1137 1702
France 3143 2513 3268 4498 6313 6029 6339 6160 5684 3867 4532
Sweden . . . . . . . . 3313 4095 3490
Italy 249 1079 914 1475 584 1152 436 1305 1165 1728 1495
Others 1979 1774 3516 3977 6700 4031 2636 4289 4791 3653 3114
Total 93732 87168 86068 109878 101602 84614 133663 155992 177007 190456 193031
Country 1998 1999 2000 2001 2002 2003 2004 2005 2006
UK 100169 125230 104440 107112 121423 140604 170207 199336 220704
Denmark 73997 78815 64925 68396 64293 74608 78429 77961 80815
Ireland 34544 35617 29141 31205 20709 21170 27767 34537 36149
Netherlands 3477 5012 2604 15780 18630 16486 13737 20210 17080
Spain 3090 4516 3615 3910 3204 2174 1419 4271 11062
Portugal 2113 2626 2678 3239 3785 5754 6999 7061 8640
France 4414 4720 5113 4593 4762 4295 4354 4788 6816
Sweden 4180 4903 5306 4354 4387 2961 2224 3089 5810
Italy 1746 1344 1542 1577 1691 1942 1867 2271 2994
Others 3885 3415 3623 5244 5141 6096 4404 4476 6654
Total 231615 266198 222987 245410 248025 276090 311407 358000 396724
AN 012607. 0807.
Source: FISHSTAT PLUS - 20080725.
Yearly exports of Norway lobster, by major
exporting countries, 1987-2006, in 1000 US$
Page 24
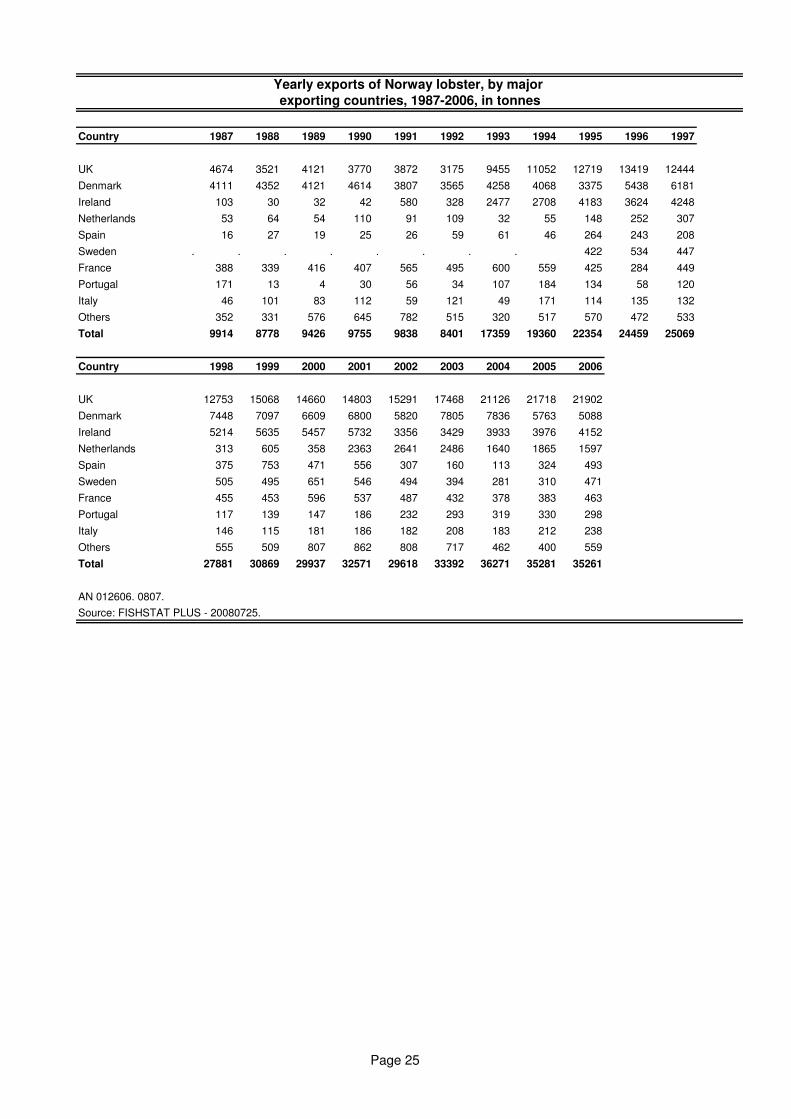
Country 1987 1988 1989 1990 1991 1992 1993 1994 1995 1996 1997
UK 4674 3521 4121 3770 3872 3175 9455 11052 12719 13419 12444
Denmark 4111 4352 4121 4614 3807 3565 4258 4068 3375 5438 6181
Ireland 103 30 32 42 580 328 2477 2708 4183 3624 4248
Netherlands 53 64 54 110 91 109 32 55 148 252 307
Spain 16 27 19 25 26 59 61 46 264 243 208
Sweden . . . . . . . . 422 534 447
France 388 339 416 407 565 495 600 559 425 284 449
Portugal 171 13 4 30 56 34 107 184 134 58 120
Italy 46 101 83 112 59 121 49 171 114 135 132
Others 352 331 576 645 782 515 320 517 570 472 533
Total 9914 8778 9426 9755 9838 8401 17359 19360 22354 24459 25069
Country 1998 1999 2000 2001 2002 2003 2004 2005 2006
UK 12753 15068 14660 14803 15291 17468 21126 21718 21902
Denmark 7448 7097 6609 6800 5820 7805 7836 5763 5088
Ireland 5214 5635 5457 5732 3356 3429 3933 3976 4152
Netherlands 313 605 358 2363 2641 2486 1640 1865 1597
Spain 375 753 471 556 307 160 113 324 493
Sweden 505 495 651 546 494 394 281 310 471
France 455 453 596 537 487 432 378 383 463
Portugal 117 139 147 186 232 293 319 330 298
Italy 146 115 181 186 182 208 183 212 238
Others 555 509 807 862 808 717 462 400 559
Total 27881 30869 29937 32571 29618 33392 36271 35281 35261
AN 012606. 0807.
Source: FISHSTAT PLUS - 20080725.
Yearly exports of Norway lobster, by major
exporting countries, 1987-2006, in tonnes
Page 25
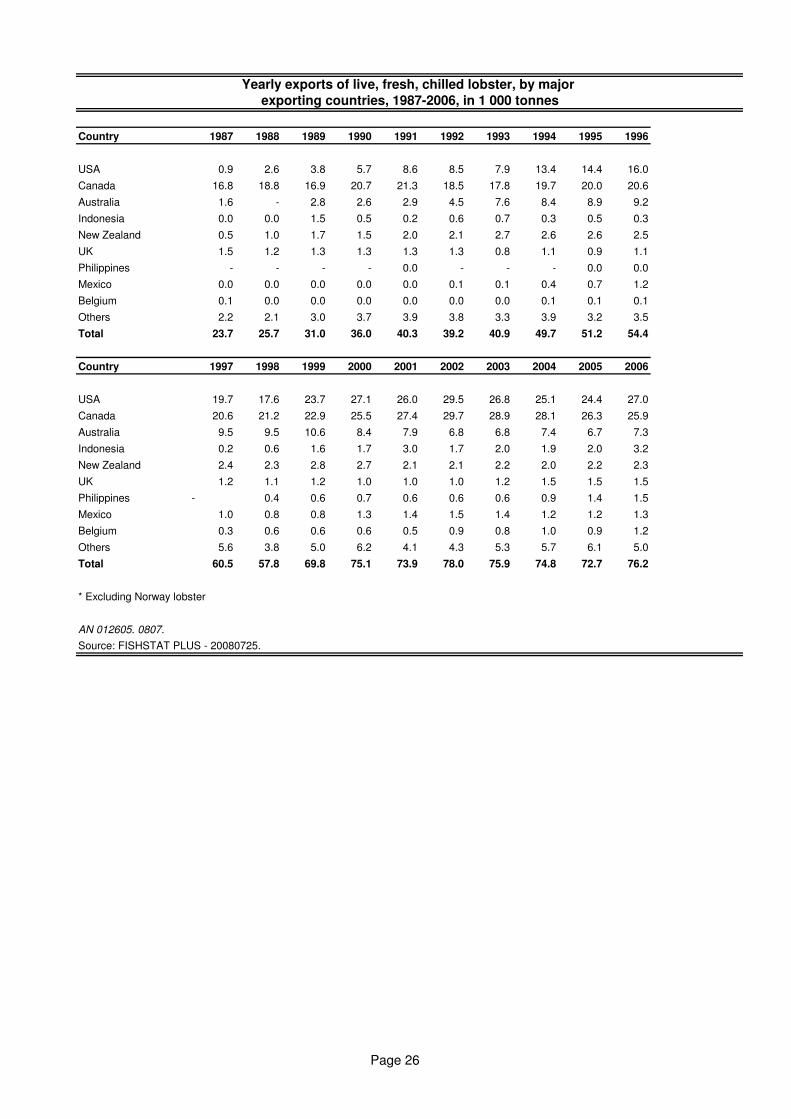
Country 1987 1988 1989 1990 1991 1992 1993 1994 1995 1996
USA 0.9 2.6 3.8 5.7 8.6 8.5 7.9 13.4 14.4 16.0
Canada 16.8 18.8 16.9 20.7 21.3 18.5 17.8 19.7 20.0 20.6
Australia 1.6 - 2.8 2.6 2.9 4.5 7.6 8.4 8.9 9.2
Indonesia 0.0 0.0 1.5 0.5 0.2 0.6 0.7 0.3 0.5 0.3
New Zealand 0.5 1.0 1.7 1.5 2.0 2.1 2.7 2.6 2.6 2.5
UK 1.5 1.2 1.3 1.3 1.3 1.3 0.8 1.1 0.9 1.1
Philippines - - - - 0.0 - - - 0.0 0.0
Mexico 0.0 0.0 0.0 0.0 0.0 0.1 0.1 0.4 0.7 1.2
Belgium 0.1 0.0 0.0 0.0 0.0 0.0 0.0 0.1 0.1 0.1
Others 2.2 2.1 3.0 3.7 3.9 3.8 3.3 3.9 3.2 3.5
Total 23.7 25.7 31.0 36.0 40.3 39.2 40.9 49.7 51.2 54.4
Country 1997 1998 1999 2000 2001 2002 2003 2004 2005 2006
USA 19.7 17.6 23.7 27.1 26.0 29.5 26.8 25.1 24.4 27.0
Canada 20.6 21.2 22.9 25.5 27.4 29.7 28.9 28.1 26.3 25.9
Australia 9.5 9.5 10.6 8.4 7.9 6.8 6.8 7.4 6.7 7.3
Indonesia 0.2 0.6 1.6 1.7 3.0 1.7 2.0 1.9 2.0 3.2
New Zealand 2.4 2.3 2.8 2.7 2.1 2.1 2.2 2.0 2.2 2.3
UK 1.2 1.1 1.2 1.0 1.0 1.0 1.2 1.5 1.5 1.5
Philippines - 0.4 0.6 0.7 0.6 0.6 0.6 0.9 1.4 1.5
Mexico 1.0 0.8 0.8 1.3 1.4 1.5 1.4 1.2 1.2 1.3
Belgium 0.3 0.6 0.6 0.6 0.5 0.9 0.8 1.0 0.9 1.2
Others 5.6 3.8 5.0 6.2 4.1 4.3 5.3 5.7 6.1 5.0
Total 60.5 57.8 69.8 75.1 73.9 78.0 75.9 74.8 72.7 76.2
* Excluding Norway lobster
AN 012605. 0807.
Source: FISHSTAT PLUS - 20080725.
Yearly exports of live, fresh, chilled lobster, by major
exporting countries, 1987-2006, in 1 000 tonnes
Page 26
Country 1987 1988 1989 1990 1991 1992 1993 1994 1995 1996
Canada 154.5 161.1 143.8 159.3 171.9 176.7 164.1 184.8 210.3 227.7
USA 7.3 23.5 35.0 49.9 71.0 83.5 76.0 119.6 138.8 157.0
Australia 24.4 - 47.6 46.0 61.2 100.8 152.4 170.4 198.5 211.2
New Zealand 9.3 16.7 26.7 28.2 39.0 41.5 55.9 62.8 66.5 73.6
UK 19.3 19.3 20.1 22.6 23.1 20.5 15.3 18.1 15.5 22.1
Mexico 0.6 0.4 0.1 0.1 0.3 1.0 1.4 6.2 11.7 21.2
South Africa - - - 8.5 5.3 5.1 5.6 9.5 9.6 9.2
Belgium 1.3 0.2 0.2 0.2 0.1 0.2 0.3 1.0 1.0 1.5
Netherlands 7.0 5.3 5.2 7.1 11.2 12.4 7.8 11.7 8.9 11.1
Others 29.0 28.8 38.7 43.7 40.7 38.4 31.4 37.9 40.5 40.6
Total 252.8 255.3 317.5 365.7 423.9 479.9 510.3 621.9 701.4 775.0
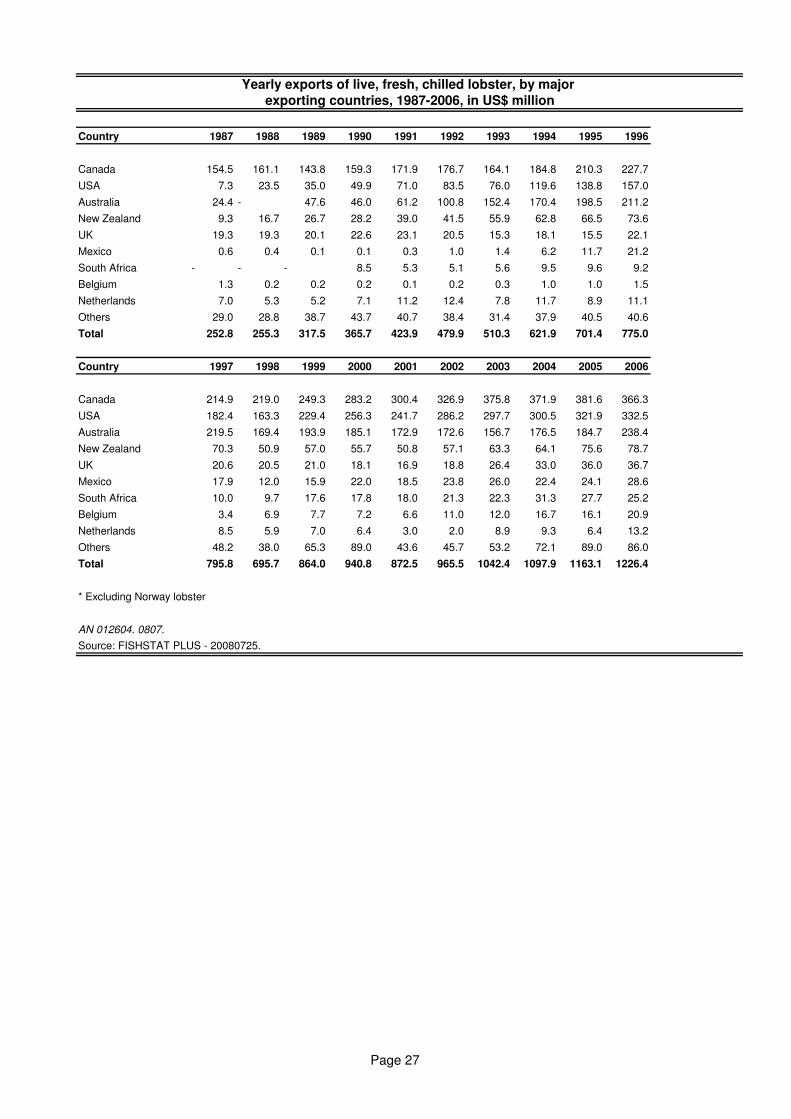
Country 1997 1998 1999 2000 2001 2002 2003 2004 2005 2006
Canada 214.9 219.0 249.3 283.2 300.4 326.9 375.8 371.9 381.6 366.3
USA 182.4 163.3 229.4 256.3 241.7 286.2 297.7 300.5 321.9 332.5
Australia 219.5 169.4 193.9 185.1 172.9 172.6 156.7 176.5 184.7 238.4
New Zealand 70.3 50.9 57.0 55.7 50.8 57.1 63.3 64.1 75.6 78.7
UK 20.6 20.5 21.0 18.1 16.9 18.8 26.4 33.0 36.0 36.7
Mexico 17.9 12.0 15.9 22.0 18.5 23.8 26.0 22.4 24.1 28.6
South Africa 10.0 9.7 17.6 17.8 18.0 21.3 22.3 31.3 27.7 25.2
Belgium 3.4 6.9 7.7 7.2 6.6 11.0 12.0 16.7 16.1 20.9
Netherlands 8.5 5.9 7.0 6.4 3.0 2.0 8.9 9.3 6.4 13.2
Others 48.2 38.0 65.3 89.0 43.6 45.7 53.2 72.1 89.0 86.0
Total 795.8 695.7 864.0 940.8 872.5 965.5 1042.4 1097.9 1163.1 1226.4
* Excluding Norway lobster
AN 012604. 0807.
Source: FISHSTAT PLUS - 20080725.
Yearly exports of live, fresh, chilled lobster, by major
exporting countries, 1987-2006, in US$ million
Page 27
Country 1987 1988 1989 1990 1991 1992 1993 1994 1995 1996 1997 1998
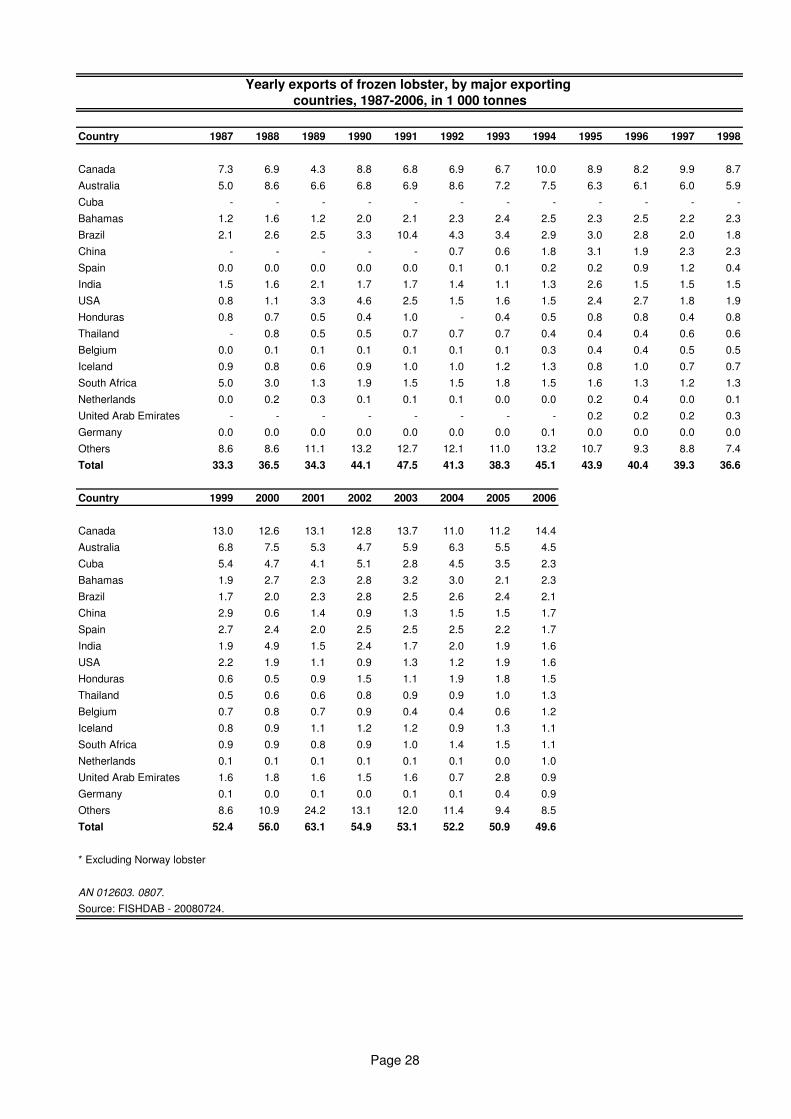
Canada 7.3 6.9 4.3 8.8 6.8 6.9 6.7 10.0 8.9 8.2 9.9 8.7
Australia 5.0 8.6 6.6 6.8 6.9 8.6 7.2 7.5 6.3 6.1 6.0 5.9
Cuba - - - - - - - - - - - -
Bahamas 1.2 1.6 1.2 2.0 2.1 2.3 2.4 2.5 2.3 2.5 2.2 2.3
Brazil 2.1 2.6 2.5 3.3 10.4 4.3 3.4 2.9 3.0 2.8 2.0 1.8
China - - - - - 0.7 0.6 1.8 3.1 1.9 2.3 2.3
Spain 0.0 0.0 0.0 0.0 0.0 0.1 0.1 0.2 0.2 0.9 1.2 0.4
India 1.5 1.6 2.1 1.7 1.7 1.4 1.1 1.3 2.6 1.5 1.5 1.5
USA 0.8 1.1 3.3 4.6 2.5 1.5 1.6 1.5 2.4 2.7 1.8 1.9
Honduras 0.8 0.7 0.5 0.4 1.0 - 0.4 0.5 0.8 0.8 0.4 0.8
Thailand - 0.8 0.5 0.5 0.7 0.7 0.7 0.4 0.4 0.4 0.6 0.6
Belgium 0.0 0.1 0.1 0.1 0.1 0.1 0.1 0.3 0.4 0.4 0.5 0.5
Iceland 0.9 0.8 0.6 0.9 1.0 1.0 1.2 1.3 0.8 1.0 0.7 0.7
South Africa 5.0 3.0 1.3 1.9 1.5 1.5 1.8 1.5 1.6 1.3 1.2 1.3
Netherlands 0.0 0.2 0.3 0.1 0.1 0.1 0.0 0.0 0.2 0.4 0.0 0.1
United Arab Emirates - - - - - - - - 0.2 0.2 0.2 0.3
Germany 0.0 0.0 0.0 0.0 0.0 0.0 0.0 0.1 0.0 0.0 0.0 0.0
Others 8.6 8.6 11.1 13.2 12.7 12.1 11.0 13.2 10.7 9.3 8.8 7.4
Total 33.3 36.5 34.3 44.1 47.5 41.3 38.3 45.1 43.9 40.4 39.3 36.6
Country 1999 2000 2001 2002 2003 2004 2005 2006
Canada 13.0 12.6 13.1 12.8 13.7 11.0 11.2 14.4
Australia 6.8 7.5 5.3 4.7 5.9 6.3 5.5 4.5
Cuba 5.4 4.7 4.1 5.1 2.8 4.5 3.5 2.3
Bahamas 1.9 2.7 2.3 2.8 3.2 3.0 2.1 2.3
Brazil 1.7 2.0 2.3 2.8 2.5 2.6 2.4 2.1
China 2.9 0.6 1.4 0.9 1.3 1.5 1.5 1.7
Spain 2.7 2.4 2.0 2.5 2.5 2.5 2.2 1.7
India 1.9 4.9 1.5 2.4 1.7 2.0 1.9 1.6
USA 2.2 1.9 1.1 0.9 1.3 1.2 1.9 1.6
Honduras 0.6 0.5 0.9 1.5 1.1 1.9 1.8 1.5
Thailand 0.5 0.6 0.6 0.8 0.9 0.9 1.0 1.3
Belgium 0.7 0.8 0.7 0.9 0.4 0.4 0.6 1.2
Iceland 0.8 0.9 1.1 1.2 1.2 0.9 1.3 1.1
South Africa 0.9 0.9 0.8 0.9 1.0 1.4 1.5 1.1
Netherlands 0.1 0.1 0.1 0.1 0.1 0.1 0.0 1.0
United Arab Emirates 1.6 1.8 1.6 1.5 1.6 0.7 2.8 0.9
Germany 0.1 0.0 0.1 0.0 0.1 0.1 0.4 0.9
Others 8.6 10.9 24.2 13.1 12.0 11.4 9.4 8.5
Total 52.4 56.0 63.1 54.9 53.1 52.2 50.9 49.6
* Excluding Norway lobster
AN 012603. 0807.
Source: FISHDAB - 20080724.
Yearly exports of frozen lobster, by major exporting
countries, 1987-2006, in 1 000 tonnes
Page 28
Country 1987 1988 1989 1990 1991 1992 1993 1994 1995 1996 1997
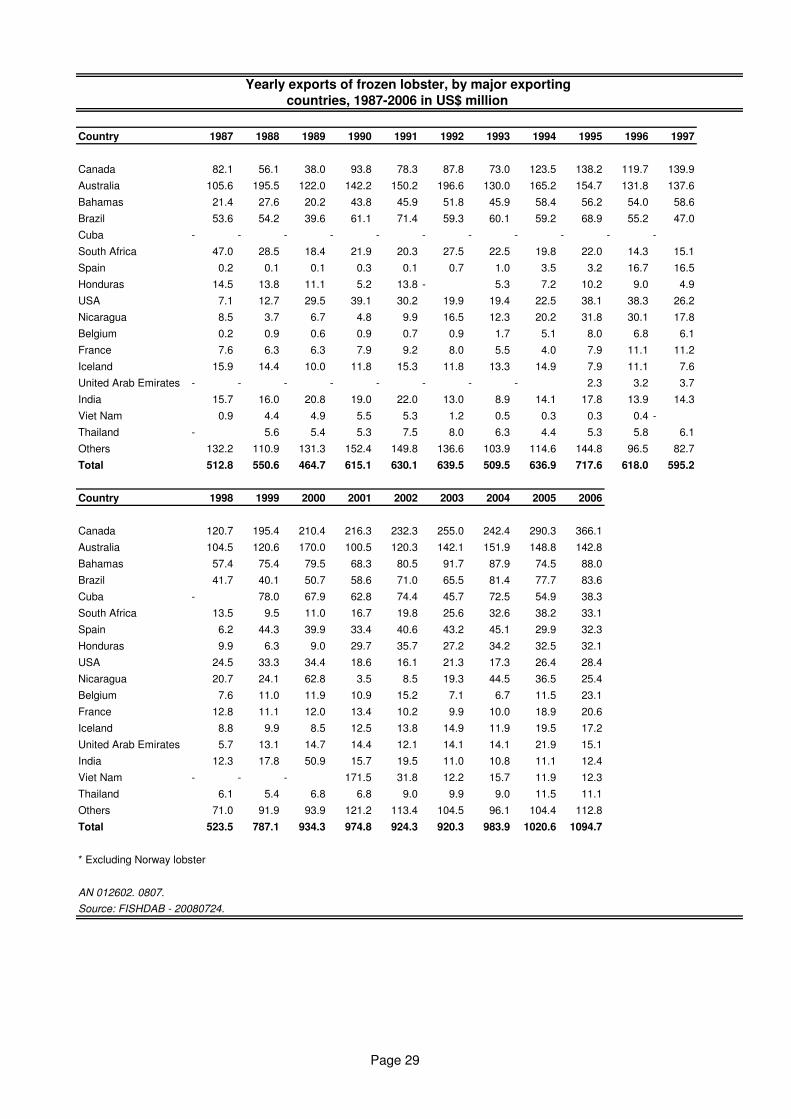
Canada 82.1 56.1 38.0 93.8 78.3 87.8 73.0 123.5 138.2 119.7 139.9
Australia 105.6 195.5 122.0 142.2 150.2 196.6 130.0 165.2 154.7 131.8 137.6
Bahamas 21.4 27.6 20.2 43.8 45.9 51.8 45.9 58.4 56.2 54.0 58.6
Brazil 53.6 54.2 39.6 61.1 71.4 59.3 60.1 59.2 68.9 55.2 47.0
Cuba - - - - - - - - - - -
South Africa 47.0 28.5 18.4 21.9 20.3 27.5 22.5 19.8 22.0 14.3 15.1
Spain 0.2 0.1 0.1 0.3 0.1 0.7 1.0 3.5 3.2 16.7 16.5
Honduras 14.5 13.8 11.1 5.2 13.8 - 5.3 7.2 10.2 9.0 4.9
USA 7.1 12.7 29.5 39.1 30.2 19.9 19.4 22.5 38.1 38.3 26.2
Nicaragua 8.5 3.7 6.7 4.8 9.9 16.5 12.3 20.2 31.8 30.1 17.8
Belgium 0.2 0.9 0.6 0.9 0.7 0.9 1.7 5.1 8.0 6.8 6.1
France 7.6 6.3 6.3 7.9 9.2 8.0 5.5 4.0 7.9 11.1 11.2
Iceland 15.9 14.4 10.0 11.8 15.3 11.8 13.3 14.9 7.9 11.1 7.6
United Arab Emirates - - - - - - - - 2.3 3.2 3.7
India 15.7 16.0 20.8 19.0 22.0 13.0 8.9 14.1 17.8 13.9 14.3
Viet Nam 0.9 4.4 4.9 5.5 5.3 1.2 0.5 0.3 0.3 0.4 -
Thailand - 5.6 5.4 5.3 7.5 8.0 6.3 4.4 5.3 5.8 6.1
Others 132.2 110.9 131.3 152.4 149.8 136.6 103.9 114.6 144.8 96.5 82.7
Total 512.8 550.6 464.7 615.1 630.1 639.5 509.5 636.9 717.6 618.0 595.2
Country 1998 1999 2000 2001 2002 2003 2004 2005 2006
Canada 120.7 195.4 210.4 216.3 232.3 255.0 242.4 290.3 366.1
Australia 104.5 120.6 170.0 100.5 120.3 142.1 151.9 148.8 142.8
Bahamas 57.4 75.4 79.5 68.3 80.5 91.7 87.9 74.5 88.0
Brazil 41.7 40.1 50.7 58.6 71.0 65.5 81.4 77.7 83.6
Cuba - 78.0 67.9 62.8 74.4 45.7 72.5 54.9 38.3
South Africa 13.5 9.5 11.0 16.7 19.8 25.6 32.6 38.2 33.1
Spain 6.2 44.3 39.9 33.4 40.6 43.2 45.1 29.9 32.3
Honduras 9.9 6.3 9.0 29.7 35.7 27.2 34.2 32.5 32.1
USA 24.5 33.3 34.4 18.6 16.1 21.3 17.3 26.4 28.4
Nicaragua 20.7 24.1 62.8 3.5 8.5 19.3 44.5 36.5 25.4
Belgium 7.6 11.0 11.9 10.9 15.2 7.1 6.7 11.5 23.1
France 12.8 11.1 12.0 13.4 10.2 9.9 10.0 18.9 20.6
Iceland 8.8 9.9 8.5 12.5 13.8 14.9 11.9 19.5 17.2
United Arab Emirates 5.7 13.1 14.7 14.4 12.1 14.1 14.1 21.9 15.1
India 12.3 17.8 50.9 15.7 19.5 11.0 10.8 11.1 12.4
Viet Nam - - - 171.5 31.8 12.2 15.7 11.9 12.3
Thailand 6.1 5.4 6.8 6.8 9.0 9.9 9.0 11.5 11.1
Others 71.0 91.9 93.9 121.2 113.4 104.5 96.1 104.4 112.8
Total 523.5 787.1 934.3 974.8 924.3 920.3 983.9 1020.6 1094.7
* Excluding Norway lobster
AN 012602. 0807.
Source: FISHDAB - 20080724.
Yearly exports of frozen lobster, by major exporting
countries, 1987-2006 in US$ million
Page 29
Country 1988 1989 1990 1991 1992 1993 1994 1995 1996 1997 1998 1999 2000
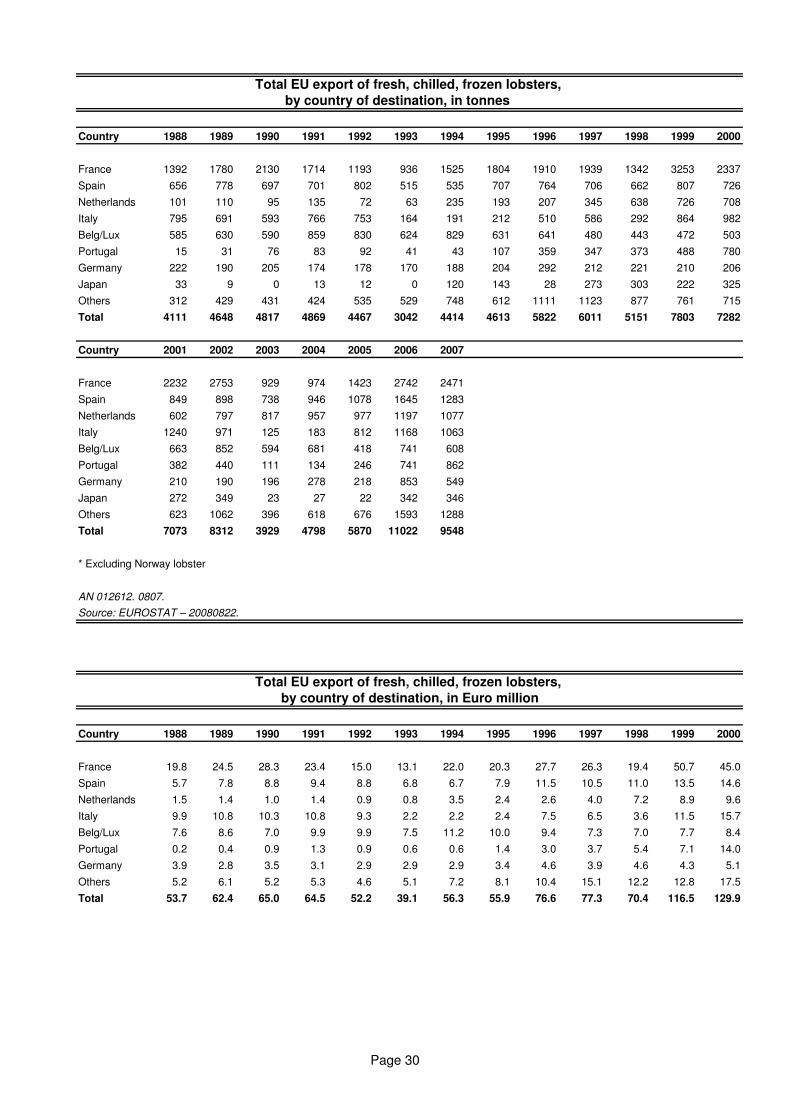
France 1392 1780 2130 1714 1193 936 1525 1804 1910 1939 1342 3253 2337
Spain 656 778 697 701 802 515 535 707 764 706 662 807 726
Netherlands 101 110 95 135 72 63 235 193 207 345 638 726 708
Italy 795 691 593 766 753 164 191 212 510 586 292 864 982
Belg/Lux 585 630 590 859 830 624 829 631 641 480 443 472 503
Portugal 15 31 76 83 92 41 43 107 359 347 373 488 780
Germany 222 190 205 174 178 170 188 204 292 212 221 210 206
Japan 33 9 0 13 12 0 120 143 28 273 303 222 325
Others 312 429 431 424 535 529 748 612 1111 1123 877 761 715
Total 4111 4648 4817 4869 4467 3042 4414 4613 5822 6011 5151 7803 7282
Country 2001 2002 2003 2004 2005 2006 2007
France 2232 2753 929 974 1423 2742 2471
Spain 849 898 738 946 1078 1645 1283
Netherlands 602 797 817 957 977 1197 1077
Italy 1240 971 125 183 812 1168 1063
Belg/Lux 663 852 594 681 418 741 608
Portugal 382 440 111 134 246 741 862
Germany 210 190 196 278 218 853 549
Japan 272 349 23 27 22 342 346
Others 623 1062 396 618 676 1593 1288
Total 7073 8312 3929 4798 5870 11022 9548
* Excluding Norway lobster
AN 012612. 0807.
Source: EUROSTAT – 20080822.
Country 1988 1989 1990 1991 1992 1993 1994 1995 1996 1997 1998 1999 2000
France 19.8 24.5 28.3 23.4 15.0 13.1 22.0 20.3 27.7 26.3 19.4 50.7 45.0
Spain 5.7 7.8 8.8 9.4 8.8 6.8 6.7 7.9 11.5 10.5 11.0 13.5 14.6
Netherlands 1.5 1.4 1.0 1.4 0.9 0.8 3.5 2.4 2.6 4.0 7.2 8.9 9.6
Italy 9.9 10.8 10.3 10.8 9.3 2.2 2.2 2.4 7.5 6.5 3.6 11.5 15.7
Belg/Lux 7.6 8.6 7.0 9.9 9.9 7.5 11.2 10.0 9.4 7.3 7.0 7.7 8.4
Portugal 0.2 0.4 0.9 1.3 0.9 0.6 0.6 1.4 3.0 3.7 5.4 7.1 14.0
Germany 3.9 2.8 3.5 3.1 2.9 2.9 2.9 3.4 4.6 3.9 4.6 4.3 5.1
Others 5.2 6.1 5.2 5.3 4.6 5.1 7.2 8.1 10.4 15.1 12.2 12.8 17.5
Total 53.7 62.4 65.0 64.5 52.2 39.1 56.3 55.9 76.6 77.3 70.4 116.5 129.9
Total EU export of fresh, chilled, frozen lobsters,
by country of destination, in tonnes
Total EU export of fresh, chilled, frozen lobsters,
by country of destination, in Euro million
Page 30
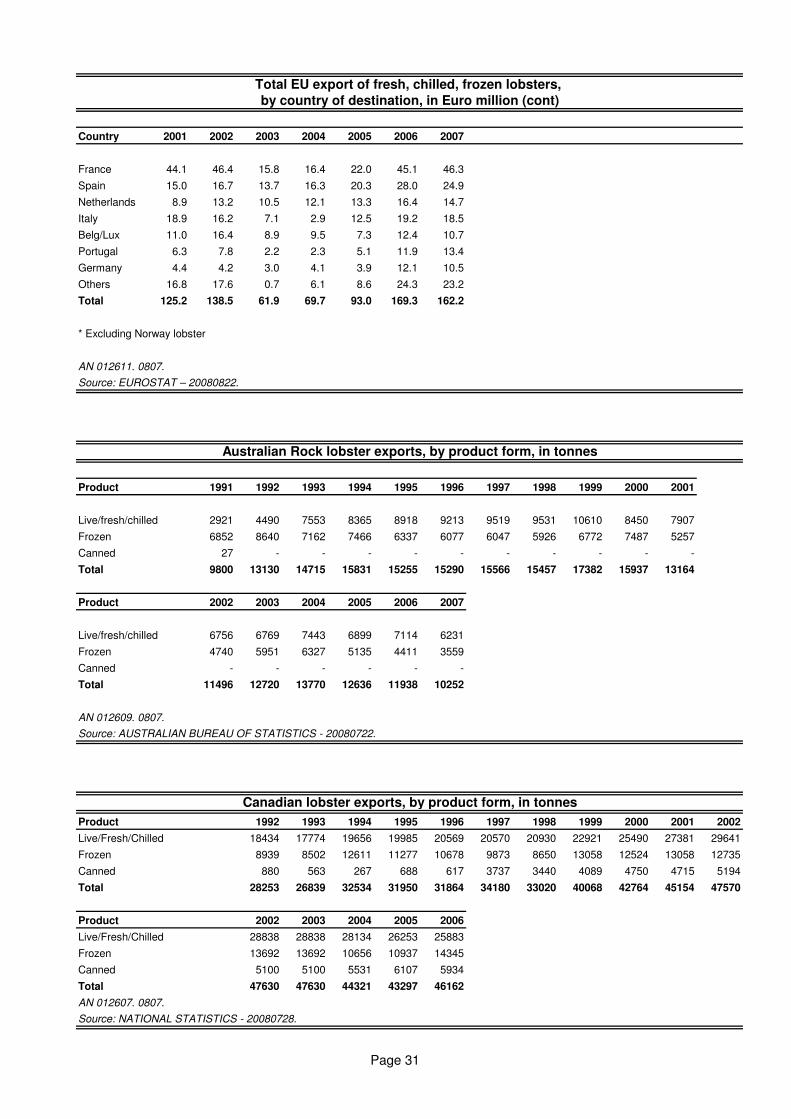
Country 2001 2002 2003 2004 2005 2006 2007
France 44.1 46.4 15.8 16.4 22.0 45.1 46.3
Spain 15.0 16.7 13.7 16.3 20.3 28.0 24.9
Netherlands 8.9 13.2 10.5 12.1 13.3 16.4 14.7
Italy 18.9 16.2 7.1 2.9 12.5 19.2 18.5
Belg/Lux 11.0 16.4 8.9 9.5 7.3 12.4 10.7
Portugal 6.3 7.8 2.2 2.3 5.1 11.9 13.4
Germany 4.4 4.2 3.0 4.1 3.9 12.1 10.5
Others 16.8 17.6 0.7 6.1 8.6 24.3 23.2
Total 125.2 138.5 61.9 69.7 93.0 169.3 162.2
* Excluding Norway lobster
AN 012611. 0807.
Source: EUROSTAT – 20080822.
Product 1991 1992 1993 1994 1995 1996 1997 1998 1999 2000 2001
Live/fresh/chilled 2921 4490 7553 8365 8918 9213 9519 9531 10610 8450 7907
Frozen 6852 8640 7162 7466 6337 6077 6047 5926 6772 7487 5257
Canned 27 - - - - - - - - - -
Total 9800 13130 14715 15831 15255 15290 15566 15457 17382 15937 13164
Product 2002 2003 2004 2005 2006 2007
Live/fresh/chilled 6756 6769 7443 6899 7114 6231
Frozen 4740 5951 6327 5135 4411 3559
Canned - - - - - -
Total 11496 12720 13770 12636 11938 10252
AN 012609. 0807.
Source: AUSTRALIAN BUREAU OF STATISTICS - 20080722.
Product 1992 1993 1994 1995 1996 1997 1998 1999 2000 2001 2002
Live/Fresh/Chilled 18434 17774 19656 19985 20569 20570 20930 22921 25490 27381 29641
Frozen 8939 8502 12611 11277 10678 9873 8650 13058 12524 13058 12735
Canned 880 563 267 688 617 3737 3440 4089 4750 4715 5194
Total 28253 26839 32534 31950 31864 34180 33020 40068 42764 45154 47570
Product 2002 2003 2004 2005 2006
Live/Fresh/Chilled 28838 28838 28134 26253 25883
Frozen 13692 13692 10656 10937 14345
Canned 5100 5100 5531 6107 5934
Total 47630 47630 44321 43297 46162
AN 012607. 0807.
Source: NATIONAL STATISTICS - 20080728.
Total EU export of fresh, chilled, frozen lobsters,
by country of destination, in Euro million (cont)
Australian Rock lobster exports, by product form, in tonnes
Canadian lobster exports, by product form, in tonnes
Page 31
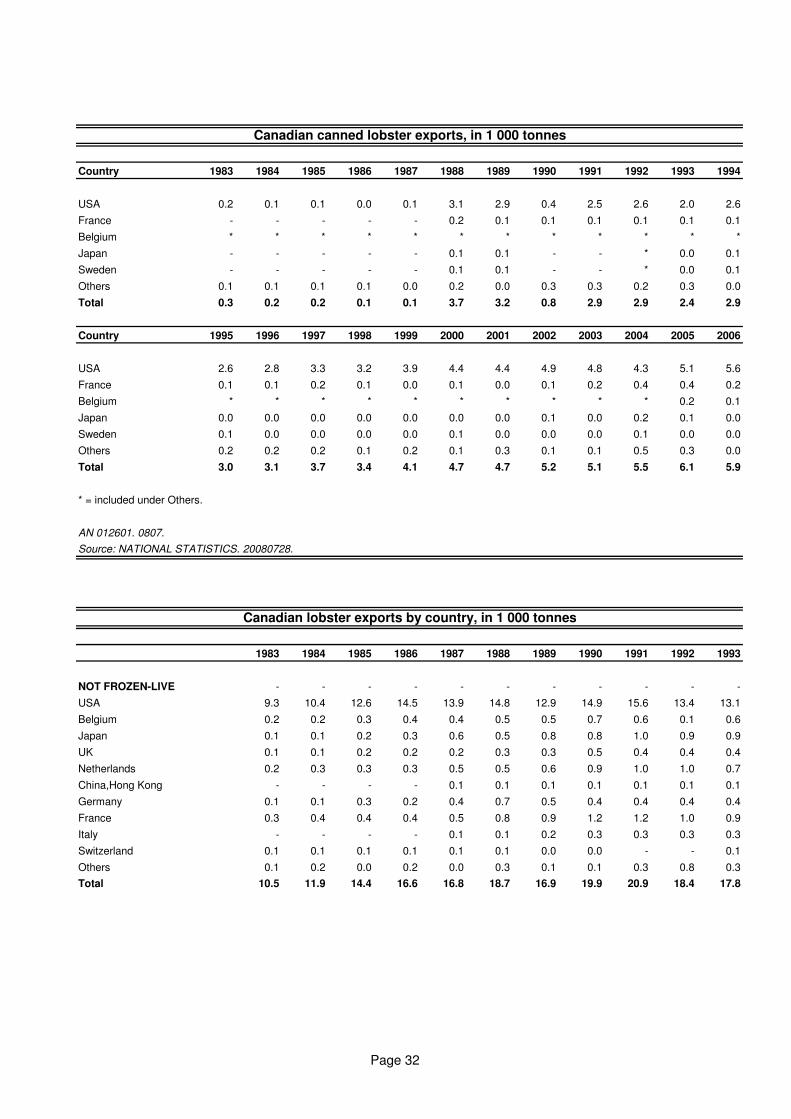
Country 1983 1984 1985 1986 1987 1988 1989 1990 1991 1992 1993 1994
USA 0.2 0.1 0.1 0.0 0.1 3.1 2.9 0.4 2.5 2.6 2.0 2.6
France - - - - - 0.2 0.1 0.1 0.1 0.1 0.1 0.1
Belgium * * * * * * * * * * * *
Japan - - - - - 0.1 0.1 - - * 0.0 0.1
Sweden - - - - - 0.1 0.1 - - * 0.0 0.1
Others 0.1 0.1 0.1 0.1 0.0 0.2 0.0 0.3 0.3 0.2 0.3 0.0
Total 0.3 0.2 0.2 0.1 0.1 3.7 3.2 0.8 2.9 2.9 2.4 2.9
Country 1995 1996 1997 1998 1999 2000 2001 2002 2003 2004 2005 2006
USA 2.6 2.8 3.3 3.2 3.9 4.4 4.4 4.9 4.8 4.3 5.1 5.6
France 0.1 0.1 0.2 0.1 0.0 0.1 0.0 0.1 0.2 0.4 0.4 0.2
Belgium * * * * * * * * * * 0.2 0.1
Japan 0.0 0.0 0.0 0.0 0.0 0.0 0.0 0.1 0.0 0.2 0.1 0.0
Sweden 0.1 0.0 0.0 0.0 0.0 0.1 0.0 0.0 0.0 0.1 0.0 0.0
Others 0.2 0.2 0.2 0.1 0.2 0.1 0.3 0.1 0.1 0.5 0.3 0.0
Total 3.0 3.1 3.7 3.4 4.1 4.7 4.7 5.2 5.1 5.5 6.1 5.9
* = included under Others.
AN 012601. 0807.
Source: NATIONAL STATISTICS. 20080728.
1983 1984 1985 1986 1987 1988 1989 1990 1991 1992 1993
NOT FROZEN-LIVE - - - - - - - - - - -
USA 9.3 10.4 12.6 14.5 13.9 14.8 12.9 14.9 15.6 13.4 13.1
Belgium 0.2 0.2 0.3 0.4 0.4 0.5 0.5 0.7 0.6 0.1 0.6
Japan 0.1 0.1 0.2 0.3 0.6 0.5 0.8 0.8 1.0 0.9 0.9
UK 0.1 0.1 0.2 0.2 0.2 0.3 0.3 0.5 0.4 0.4 0.4
Netherlands 0.2 0.3 0.3 0.3 0.5 0.5 0.6 0.9 1.0 1.0 0.7
China,Hong Kong - - - - 0.1 0.1 0.1 0.1 0.1 0.1 0.1
Germany 0.1 0.1 0.3 0.2 0.4 0.7 0.5 0.4 0.4 0.4 0.4
France 0.3 0.4 0.4 0.4 0.5 0.8 0.9 1.2 1.2 1.0 0.9
Italy - - - - 0.1 0.1 0.2 0.3 0.3 0.3 0.3
Switzerland 0.1 0.1 0.1 0.1 0.1 0.1 0.0 0.0 - - 0.1
Others 0.1 0.2 0.0 0.2 0.0 0.3 0.1 0.1 0.3 0.8 0.3
Total 10.5 11.9 14.4 16.6 16.8 18.7 16.9 19.9 20.9 18.4 17.8
Canadian canned lobster exports, in 1 000 tonnes
Canadian lobster exports by country, in 1 000 tonnes
Page 32
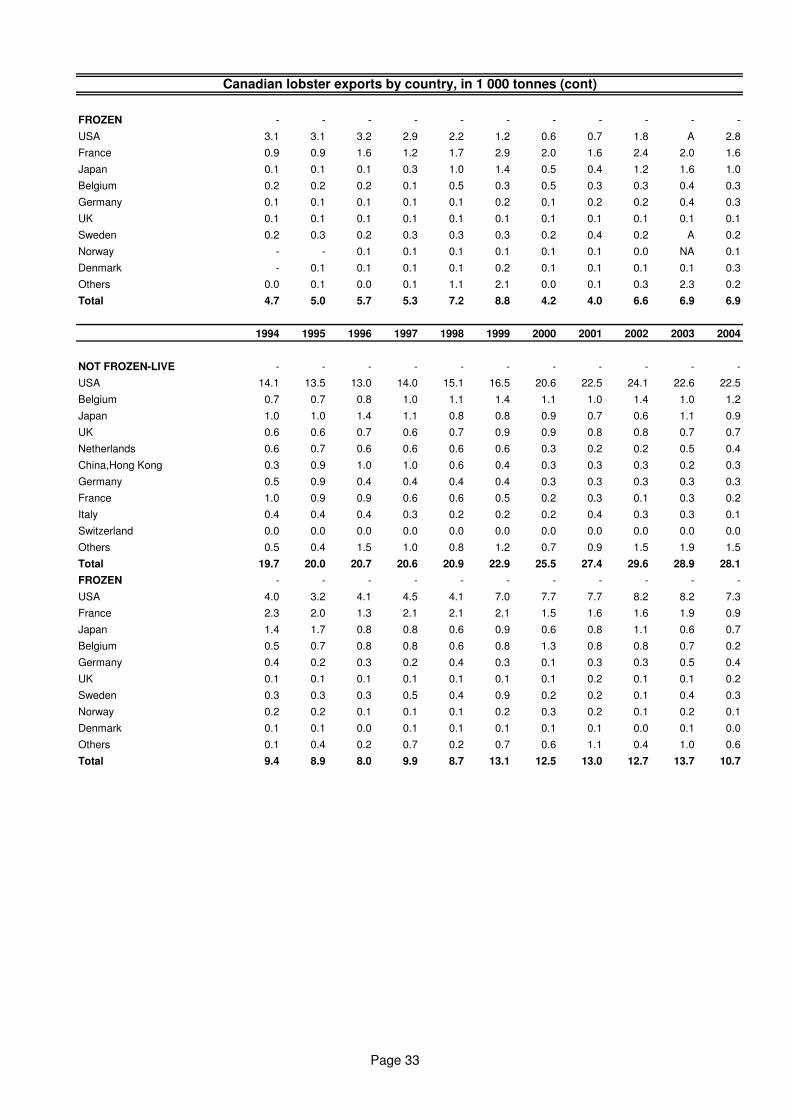
FROZEN - - - - - - - - - - -
USA 3.1 3.1 3.2 2.9 2.2 1.2 0.6 0.7 1.8 A 2.8
France 0.9 0.9 1.6 1.2 1.7 2.9 2.0 1.6 2.4 2.0 1.6
Japan 0.1 0.1 0.1 0.3 1.0 1.4 0.5 0.4 1.2 1.6 1.0
Belgium 0.2 0.2 0.2 0.1 0.5 0.3 0.5 0.3 0.3 0.4 0.3
Germany 0.1 0.1 0.1 0.1 0.1 0.2 0.1 0.2 0.2 0.4 0.3
UK 0.1 0.1 0.1 0.1 0.1 0.1 0.1 0.1 0.1 0.1 0.1
Sweden 0.2 0.3 0.2 0.3 0.3 0.3 0.2 0.4 0.2 A 0.2
Norway - - 0.1 0.1 0.1 0.1 0.1 0.1 0.0 NA 0.1
Denmark - 0.1 0.1 0.1 0.1 0.2 0.1 0.1 0.1 0.1 0.3
Others 0.0 0.1 0.0 0.1 1.1 2.1 0.0 0.1 0.3 2.3 0.2
Total 4.7 5.0 5.7 5.3 7.2 8.8 4.2 4.0 6.6 6.9 6.9
1994 1995 1996 1997 1998 1999 2000 2001 2002 2003 2004
NOT FROZEN-LIVE - - - - - - - - - - -
USA 14.1 13.5 13.0 14.0 15.1 16.5 20.6 22.5 24.1 22.6 22.5
Belgium 0.7 0.7 0.8 1.0 1.1 1.4 1.1 1.0 1.4 1.0 1.2
Japan 1.0 1.0 1.4 1.1 0.8 0.8 0.9 0.7 0.6 1.1 0.9
UK 0.6 0.6 0.7 0.6 0.7 0.9 0.9 0.8 0.8 0.7 0.7
Netherlands 0.6 0.7 0.6 0.6 0.6 0.6 0.3 0.2 0.2 0.5 0.4
China,Hong Kong 0.3 0.9 1.0 1.0 0.6 0.4 0.3 0.3 0.3 0.2 0.3
Germany 0.5 0.9 0.4 0.4 0.4 0.4 0.3 0.3 0.3 0.3 0.3
France 1.0 0.9 0.9 0.6 0.6 0.5 0.2 0.3 0.1 0.3 0.2
Italy 0.4 0.4 0.4 0.3 0.2 0.2 0.2 0.4 0.3 0.3 0.1
Switzerland 0.0 0.0 0.0 0.0 0.0 0.0 0.0 0.0 0.0 0.0 0.0
Others 0.5 0.4 1.5 1.0 0.8 1.2 0.7 0.9 1.5 1.9 1.5
Total 19.7 20.0 20.7 20.6 20.9 22.9 25.5 27.4 29.6 28.9 28.1
FROZEN - - - - - - - - - - -
USA 4.0 3.2 4.1 4.5 4.1 7.0 7.7 7.7 8.2 8.2 7.3
France 2.3 2.0 1.3 2.1 2.1 2.1 1.5 1.6 1.6 1.9 0.9
Japan 1.4 1.7 0.8 0.8 0.6 0.9 0.6 0.8 1.1 0.6 0.7
Belgium 0.5 0.7 0.8 0.8 0.6 0.8 1.3 0.8 0.8 0.7 0.2
Germany 0.4 0.2 0.3 0.2 0.4 0.3 0.1 0.3 0.3 0.5 0.4
UK 0.1 0.1 0.1 0.1 0.1 0.1 0.1 0.2 0.1 0.1 0.2
Sweden 0.3 0.3 0.3 0.5 0.4 0.9 0.2 0.2 0.1 0.4 0.3
Norway 0.2 0.2 0.1 0.1 0.1 0.2 0.3 0.2 0.1 0.2 0.1
Denmark 0.1 0.1 0.0 0.1 0.1 0.1 0.1 0.1 0.0 0.1 0.0
Others 0.1 0.4 0.2 0.7 0.2 0.7 0.6 1.1 0.4 1.0 0.6
Total 9.4 8.9 8.0 9.9 8.7 13.1 12.5 13.0 12.7 13.7 10.7
Canadian lobster exports by country, in 1 000 tonnes (cont)
Page 33
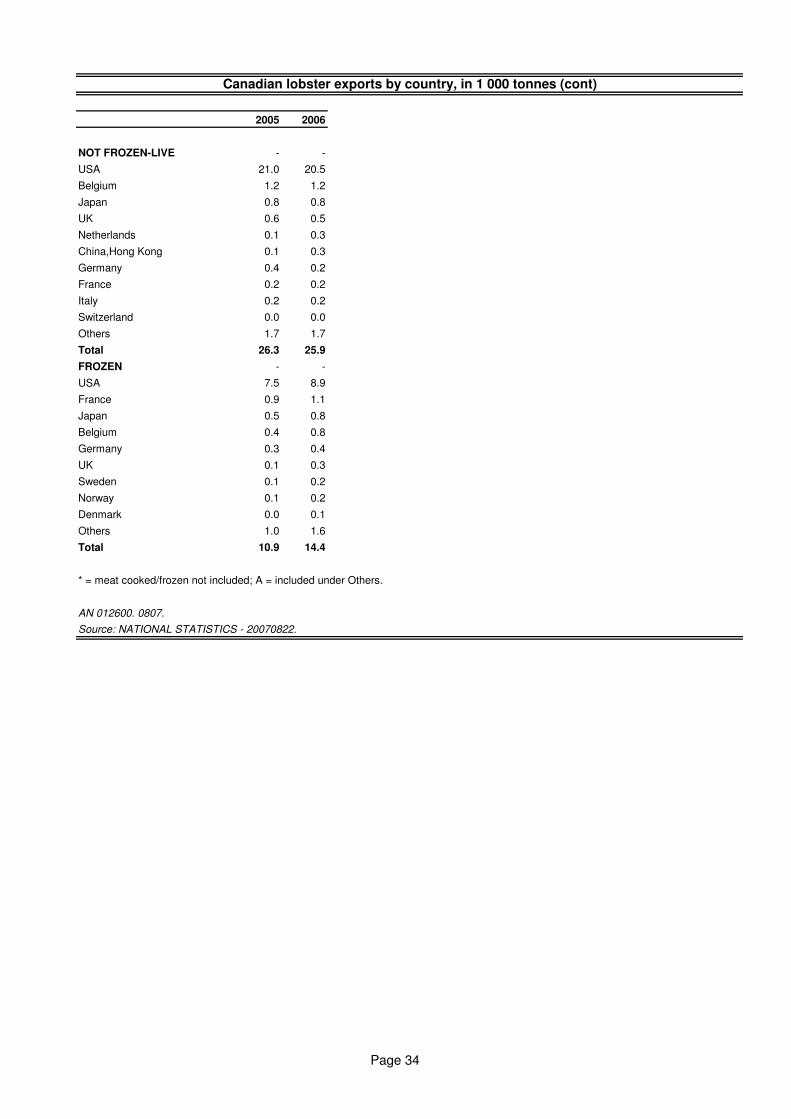
2005 2006
NOT FROZEN-LIVE - -
USA 21.0 20.5
Belgium 1.2 1.2
Japan 0.8 0.8
UK 0.6 0.5
Netherlands 0.1 0.3
China,Hong Kong 0.1 0.3
Germany 0.4 0.2
France 0.2 0.2
Italy 0.2 0.2
Switzerland 0.0 0.0
Others 1.7 1.7
Total 26.3 25.9
FROZEN - -
USA 7.5 8.9
France 0.9 1.1
Japan 0.5 0.8
Belgium 0.4 0.8
Germany 0.3 0.4
UK 0.1 0.3
Sweden 0.1 0.2
Norway 0.1 0.2
Denmark 0.0 0.1
Others 1.0 1.6
Total 10.9 14.4
* = meat cooked/frozen not included; A = included under Others.
AN 012600. 0807.
Source: NATIONAL STATISTICS - 20070822.
Canadian lobster exports by country, in 1 000 tonnes (cont)
Page 34
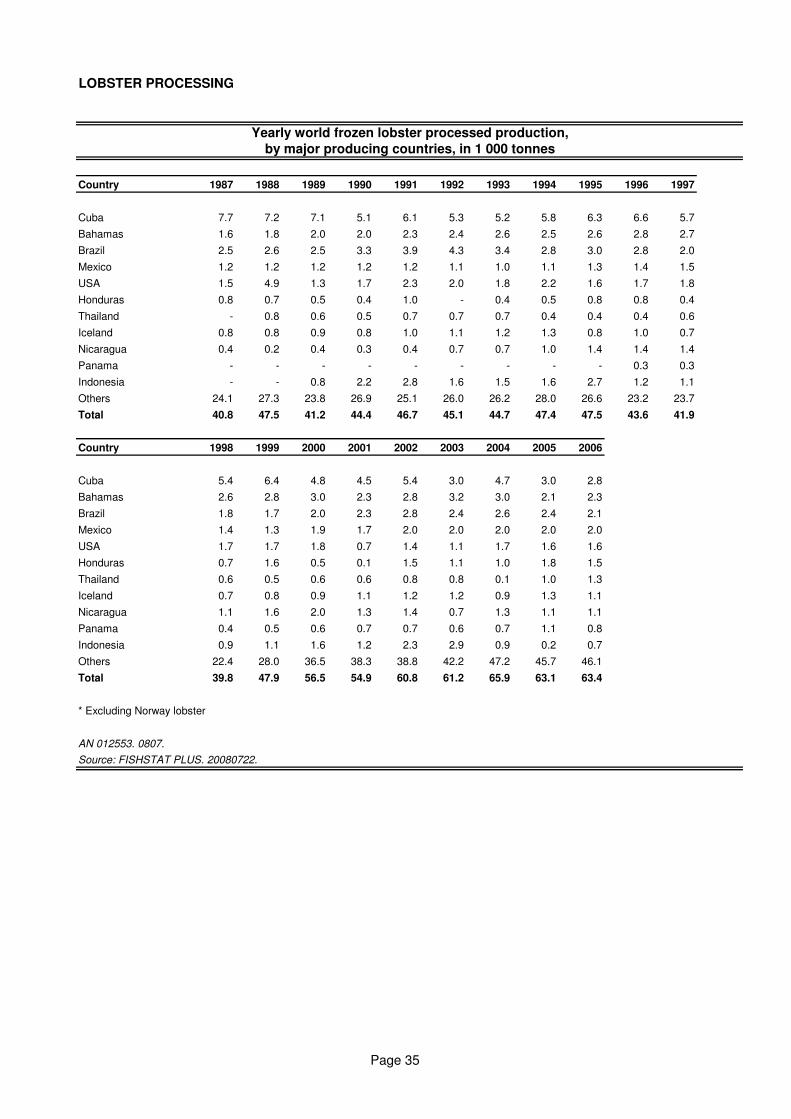
LOBSTER PROCESSING
Country 1987 1988 1989 1990 1991 1992 1993 1994 1995 1996 1997
Cuba 7.7 7.2 7.1 5.1 6.1 5.3 5.2 5.8 6.3 6.6 5.7
Bahamas 1.6 1.8 2.0 2.0 2.3 2.4 2.6 2.5 2.6 2.8 2.7
Brazil 2.5 2.6 2.5 3.3 3.9 4.3 3.4 2.8 3.0 2.8 2.0
Mexico 1.2 1.2 1.2 1.2 1.2 1.1 1.0 1.1 1.3 1.4 1.5
USA 1.5 4.9 1.3 1.7 2.3 2.0 1.8 2.2 1.6 1.7 1.8
Honduras 0.8 0.7 0.5 0.4 1.0 - 0.4 0.5 0.8 0.8 0.4
Thailand - 0.8 0.6 0.5 0.7 0.7 0.7 0.4 0.4 0.4 0.6
Iceland 0.8 0.8 0.9 0.8 1.0 1.1 1.2 1.3 0.8 1.0 0.7
Nicaragua 0.4 0.2 0.4 0.3 0.4 0.7 0.7 1.0 1.4 1.4 1.4
Panama - - - - - - - - - 0.3 0.3
Indonesia - - 0.8 2.2 2.8 1.6 1.5 1.6 2.7 1.2 1.1
Others 24.1 27.3 23.8 26.9 25.1 26.0 26.2 28.0 26.6 23.2 23.7
Total 40.8 47.5 41.2 44.4 46.7 45.1 44.7 47.4 47.5 43.6 41.9
Country 1998 1999 2000 2001 2002 2003 2004 2005 2006
Cuba 5.4 6.4 4.8 4.5 5.4 3.0 4.7 3.0 2.8
Bahamas 2.6 2.8 3.0 2.3 2.8 3.2 3.0 2.1 2.3
Brazil 1.8 1.7 2.0 2.3 2.8 2.4 2.6 2.4 2.1
Mexico 1.4 1.3 1.9 1.7 2.0 2.0 2.0 2.0 2.0
USA 1.7 1.7 1.8 0.7 1.4 1.1 1.7 1.6 1.6
Honduras 0.7 1.6 0.5 0.1 1.5 1.1 1.0 1.8 1.5
Thailand 0.6 0.5 0.6 0.6 0.8 0.8 0.1 1.0 1.3
Iceland 0.7 0.8 0.9 1.1 1.2 1.2 0.9 1.3 1.1
Nicaragua 1.1 1.6 2.0 1.3 1.4 0.7 1.3 1.1 1.1
Panama 0.4 0.5 0.6 0.7 0.7 0.6 0.7 1.1 0.8
Indonesia 0.9 1.1 1.6 1.2 2.3 2.9 0.9 0.2 0.7
Others 22.4 28.0 36.5 38.3 38.8 42.2 47.2 45.7 46.1
Total 39.8 47.9 56.5 54.9 60.8 61.2 65.9 63.1 63.4
* Excluding Norway lobster
AN 012553. 0807.
Source: FISHSTAT PLUS. 20080722.
Yearly world frozen lobster processed production,
by major producing countries, in 1 000 tonnes
Page 35
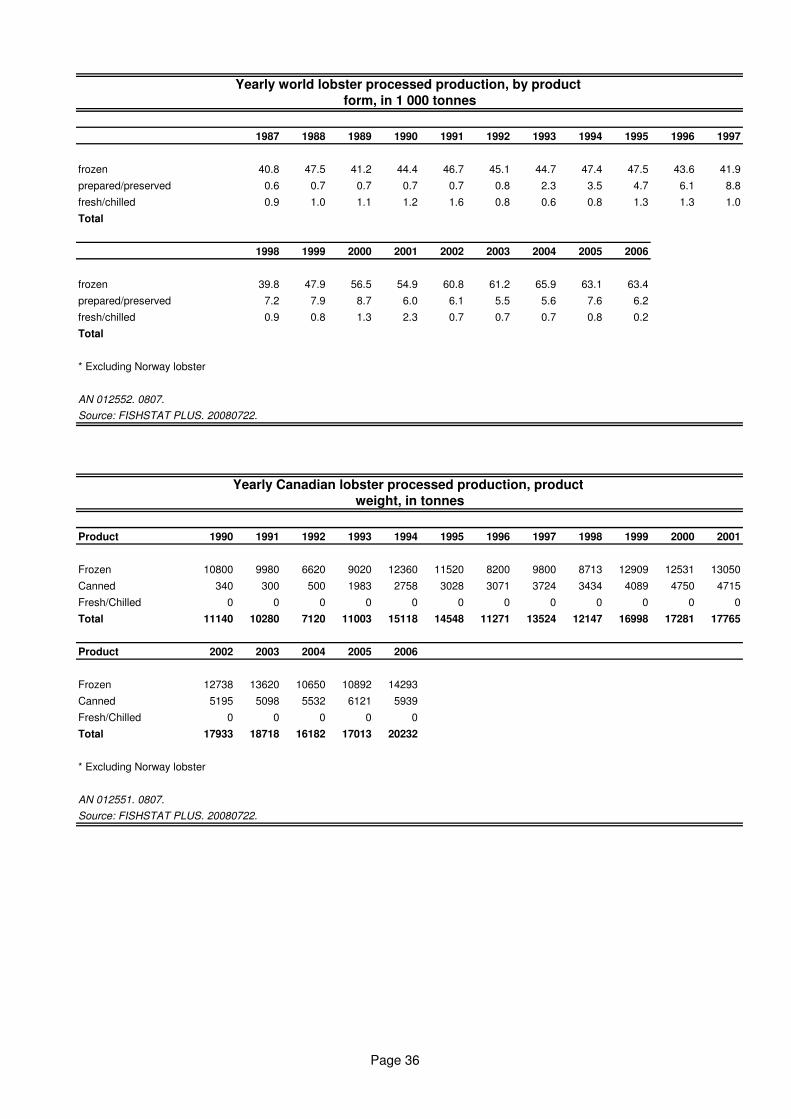
1987 1988 1989 1990 1991 1992 1993 1994 1995 1996 1997
frozen 40.8 47.5 41.2 44.4 46.7 45.1 44.7 47.4 47.5 43.6 41.9
prepared/preserved 0.6 0.7 0.7 0.7 0.7 0.8 2.3 3.5 4.7 6.1 8.8
fresh/chilled 0.9 1.0 1.1 1.2 1.6 0.8 0.6 0.8 1.3 1.3 1.0
Total
1998 1999 2000 2001 2002 2003 2004 2005 2006
frozen 39.8 47.9 56.5 54.9 60.8 61.2 65.9 63.1 63.4
prepared/preserved 7.2 7.9 8.7 6.0 6.1 5.5 5.6 7.6 6.2
fresh/chilled 0.9 0.8 1.3 2.3 0.7 0.7 0.7 0.8 0.2
Total
* Excluding Norway lobster
AN 012552. 0807.
Source: FISHSTAT PLUS. 20080722.
Product 1990 1991 1992 1993 1994 1995 1996 1997 1998 1999 2000 2001
Frozen 10800 9980 6620 9020 12360 11520 8200 9800 8713 12909 12531 13050
Canned 340 300 500 1983 2758 3028 3071 3724 3434 4089 4750 4715
Fresh/Chilled 0 0 0 0 0 0 0 0 0 0 0 0
Total 11140 10280 7120 11003 15118 14548 11271 13524 12147 16998 17281 17765
Product 2002 2003 2004 2005 2006
Frozen 12738 13620 10650 10892 14293
Canned 5195 5098 5532 6121 5939
Fresh/Chilled 0 0 0 0 0
Total 17933 18718 16182 17013 20232
* Excluding Norway lobster
AN 012551. 0807.
Source: FISHSTAT PLUS. 20080722.
Yearly Canadian lobster processed production, product
weight, in tonnes
Yearly world lobster processed production, by product
form, in 1 000 tonnes
Page 36
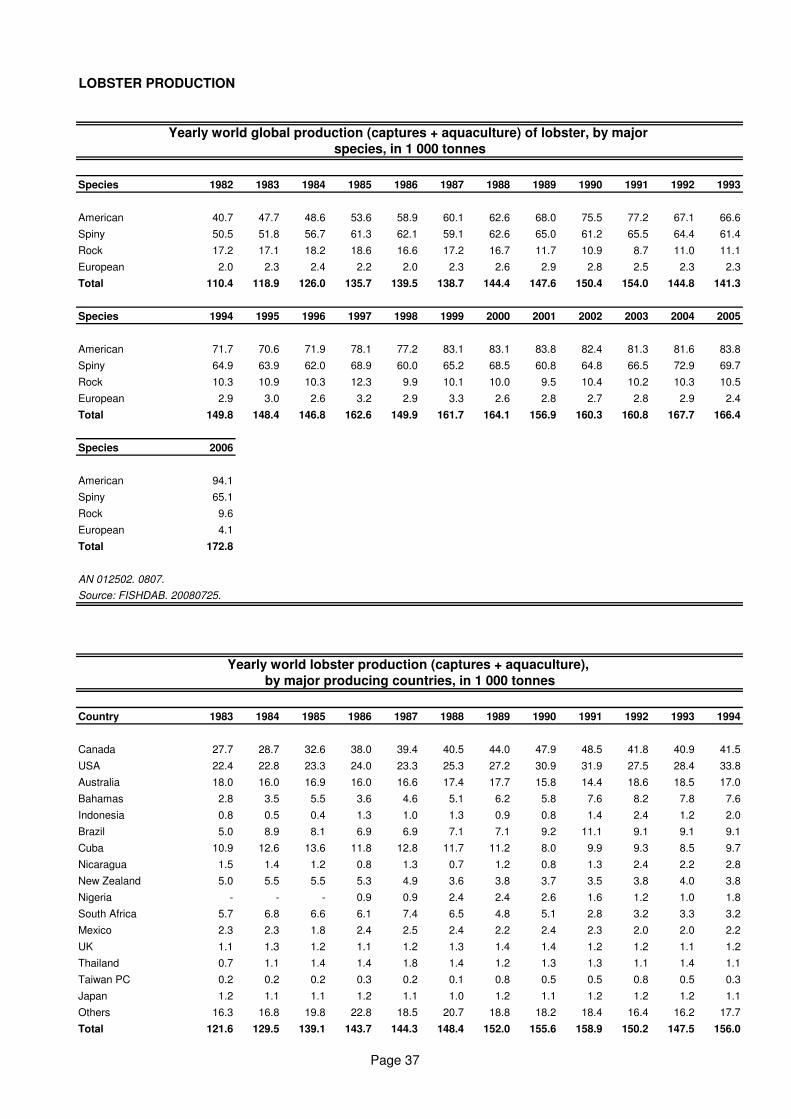
LOBSTER PRODUCTION
Species 1982 1983 1984 1985 1986 1987 1988 1989 1990 1991 1992 1993
American 40.7 47.7 48.6 53.6 58.9 60.1 62.6 68.0 75.5 77.2 67.1 66.6
Spiny 50.5 51.8 56.7 61.3 62.1 59.1 62.6 65.0 61.2 65.5 64.4 61.4
Rock 17.2 17.1 18.2 18.6 16.6 17.2 16.7 11.7 10.9 8.7 11.0 11.1
European 2.0 2.3 2.4 2.2 2.0 2.3 2.6 2.9 2.8 2.5 2.3 2.3
Total 110.4 118.9 126.0 135.7 139.5 138.7 144.4 147.6 150.4 154.0 144.8 141.3
Species 1994 1995 1996 1997 1998 1999 2000 2001 2002 2003 2004 2005
American 71.7 70.6 71.9 78.1 77.2 83.1 83.1 83.8 82.4 81.3 81.6 83.8
Spiny 64.9 63.9 62.0 68.9 60.0 65.2 68.5 60.8 64.8 66.5 72.9 69.7
Rock 10.3 10.9 10.3 12.3 9.9 10.1 10.0 9.5 10.4 10.2 10.3 10.5
European 2.9 3.0 2.6 3.2 2.9 3.3 2.6 2.8 2.7 2.8 2.9 2.4
Total 149.8 148.4 146.8 162.6 149.9 161.7 164.1 156.9 160.3 160.8 167.7 166.4
Species 2006
American 94.1
Spiny 65.1
Rock 9.6
European 4.1
Total 172.8
AN 012502. 0807.
Source: FISHDAB. 20080725.
Country 1983 1984 1985 1986 1987 1988 1989 1990 1991 1992 1993 1994
Canada 27.7 28.7 32.6 38.0 39.4 40.5 44.0 47.9 48.5 41.8 40.9 41.5
USA 22.4 22.8 23.3 24.0 23.3 25.3 27.2 30.9 31.9 27.5 28.4 33.8
Australia 18.0 16.0 16.9 16.0 16.6 17.4 17.7 15.8 14.4 18.6 18.5 17.0
Bahamas 2.8 3.5 5.5 3.6 4.6 5.1 6.2 5.8 7.6 8.2 7.8 7.6
Indonesia 0.8 0.5 0.4 1.3 1.0 1.3 0.9 0.8 1.4 2.4 1.2 2.0
Brazil 5.0 8.9 8.1 6.9 6.9 7.1 7.1 9.2 11.1 9.1 9.1 9.1
Cuba 10.9 12.6 13.6 11.8 12.8 11.7 11.2 8.0 9.9 9.3 8.5 9.7
Nicaragua 1.5 1.4 1.2 0.8 1.3 0.7 1.2 0.8 1.3 2.4 2.2 2.8
New Zealand 5.0 5.5 5.5 5.3 4.9 3.6 3.8 3.7 3.5 3.8 4.0 3.8
Nigeria - - - 0.9 0.9 2.4 2.4 2.6 1.6 1.2 1.0 1.8
South Africa 5.7 6.8 6.6 6.1 7.4 6.5 4.8 5.1 2.8 3.2 3.3 3.2
Mexico 2.3 2.3 1.8 2.4 2.5 2.4 2.2 2.4 2.3 2.0 2.0 2.2
UK 1.1 1.3 1.2 1.1 1.2 1.3 1.4 1.4 1.2 1.2 1.1 1.2
Thailand 0.7 1.1 1.4 1.4 1.8 1.4 1.2 1.3 1.3 1.1 1.4 1.1
Taiwan PC 0.2 0.2 0.2 0.3 0.2 0.1 0.8 0.5 0.5 0.8 0.5 0.3
Japan 1.2 1.1 1.1 1.2 1.1 1.0 1.2 1.1 1.2 1.2 1.2 1.1
Others 16.3 16.8 19.8 22.8 18.5 20.7 18.8 18.2 18.4 16.4 16.2 17.7
Total 121.6 129.5 139.1 143.7 144.3 148.4 152.0 155.6 158.9 150.2 147.5 156.0
Yearly world global production (captures + aquaculture) of lobster, by major
species, in 1 000 tonnes
Yearly world lobster production (captures + aquaculture),
by major producing countries, in 1 000 tonnes
Page 37
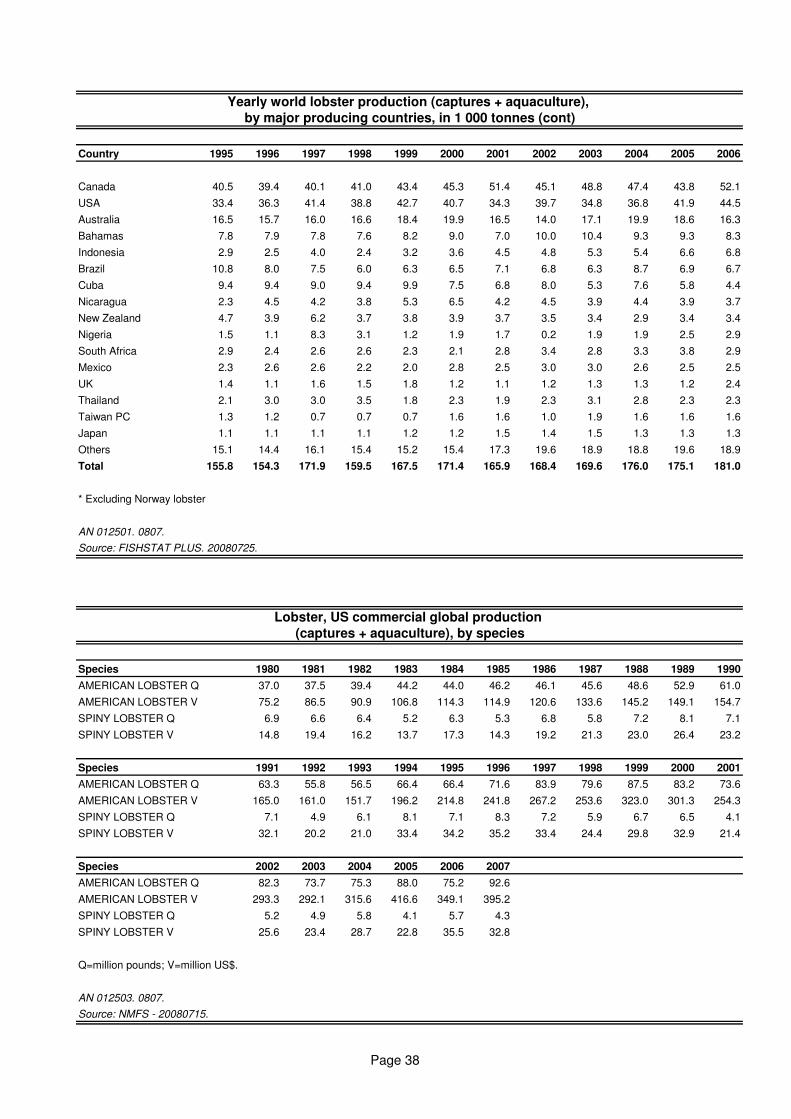
Country 1995 1996 1997 1998 1999 2000 2001 2002 2003 2004 2005 2006
Canada 40.5 39.4 40.1 41.0 43.4 45.3 51.4 45.1 48.8 47.4 43.8 52.1
USA 33.4 36.3 41.4 38.8 42.7 40.7 34.3 39.7 34.8 36.8 41.9 44.5
Australia 16.5 15.7 16.0 16.6 18.4 19.9 16.5 14.0 17.1 19.9 18.6 16.3
Bahamas 7.8 7.9 7.8 7.6 8.2 9.0 7.0 10.0 10.4 9.3 9.3 8.3
Indonesia 2.9 2.5 4.0 2.4 3.2 3.6 4.5 4.8 5.3 5.4 6.6 6.8
Brazil 10.8 8.0 7.5 6.0 6.3 6.5 7.1 6.8 6.3 8.7 6.9 6.7
Cuba 9.4 9.4 9.0 9.4 9.9 7.5 6.8 8.0 5.3 7.6 5.8 4.4
Nicaragua 2.3 4.5 4.2 3.8 5.3 6.5 4.2 4.5 3.9 4.4 3.9 3.7
New Zealand 4.7 3.9 6.2 3.7 3.8 3.9 3.7 3.5 3.4 2.9 3.4 3.4
Nigeria 1.5 1.1 8.3 3.1 1.2 1.9 1.7 0.2 1.9 1.9 2.5 2.9
South Africa 2.9 2.4 2.6 2.6 2.3 2.1 2.8 3.4 2.8 3.3 3.8 2.9
Mexico 2.3 2.6 2.6 2.2 2.0 2.8 2.5 3.0 3.0 2.6 2.5 2.5
UK 1.4 1.1 1.6 1.5 1.8 1.2 1.1 1.2 1.3 1.3 1.2 2.4
Thailand 2.1 3.0 3.0 3.5 1.8 2.3 1.9 2.3 3.1 2.8 2.3 2.3
Taiwan PC 1.3 1.2 0.7 0.7 0.7 1.6 1.6 1.0 1.9 1.6 1.6 1.6
Japan 1.1 1.1 1.1 1.1 1.2 1.2 1.5 1.4 1.5 1.3 1.3 1.3
Others 15.1 14.4 16.1 15.4 15.2 15.4 17.3 19.6 18.9 18.8 19.6 18.9
Total 155.8 154.3 171.9 159.5 167.5 171.4 165.9 168.4 169.6 176.0 175.1 181.0
* Excluding Norway lobster
AN 012501. 0807.
Source: FISHSTAT PLUS. 20080725.
Species 1980 1981 1982 1983 1984 1985 1986 1987 1988 1989 1990
AMERICAN LOBSTER Q 37.0 37.5 39.4 44.2 44.0 46.2 46.1 45.6 48.6 52.9 61.0
AMERICAN LOBSTER V 75.2 86.5 90.9 106.8 114.3 114.9 120.6 133.6 145.2 149.1 154.7
SPINY LOBSTER Q 6.9 6.6 6.4 5.2 6.3 5.3 6.8 5.8 7.2 8.1 7.1
SPINY LOBSTER V 14.8 19.4 16.2 13.7 17.3 14.3 19.2 21.3 23.0 26.4 23.2
Species 1991 1992 1993 1994 1995 1996 1997 1998 1999 2000 2001
AMERICAN LOBSTER Q 63.3 55.8 56.5 66.4 66.4 71.6 83.9 79.6 87.5 83.2 73.6
AMERICAN LOBSTER V 165.0 161.0 151.7 196.2 214.8 241.8 267.2 253.6 323.0 301.3 254.3
SPINY LOBSTER Q 7.1 4.9 6.1 8.1 7.1 8.3 7.2 5.9 6.7 6.5 4.1
SPINY LOBSTER V 32.1 20.2 21.0 33.4 34.2 35.2 33.4 24.4 29.8 32.9 21.4
Species 2002 2003 2004 2005 2006 2007
AMERICAN LOBSTER Q 82.3 73.7 75.3 88.0 75.2 92.6
AMERICAN LOBSTER V 293.3 292.1 315.6 416.6 349.1 395.2
SPINY LOBSTER Q 5.2 4.9 5.8 4.1 5.7 4.3
SPINY LOBSTER V 25.6 23.4 28.7 22.8 35.5 32.8
Q=million pounds; V=million US$.
AN 012503. 0807.
Source: NMFS - 20080715.
Lobster, US commercial global production
(captures + aquaculture), by species
Yearly world lobster production (captures + aquaculture),
by major producing countries, in 1 000 tonnes (cont)
Page 38
AD/I/Y5503E/1/7.04/5000