GLOBAL VIDEO INDEX - Ooyala | Imagine Tomorrow's...
26
GLOBAL VIDEO INDEX Q2 2017
Transcript of GLOBAL VIDEO INDEX - Ooyala | Imagine Tomorrow's...

GLOBALVIDEOINDEXQ2 2017

2 OOYALA GLOBAL VIDEO INDEX Q2 2017

POINT OF VIEW ························································································ 4
GLOBAL LONG-FORM CONTENT VIEWING HABITS ·················· 8
TABLET AND SMARTPHONE VIDEO TRENDS ·····························12
GLOBAL MOBILE CONSUMPTION TRENDS ·································15
ENGAGEMENT TRENDS ·······································································19
VIDEO ADVERTISING TRENDS ··························································21
ABOUT OOYALA’S GLOBAL VIDEO INDEX ··································26
TABLE OF CONTENTS
OOYALA GLOBAL VIDEO INDEX Q2 2017 3

Original content carries a heck of a price tag: Apple plans to spend $1 billion in 2018 alone. Amazon plans on spending more and Netflix has more than $15 billion in content spending obligation over the next couple of years. In terms of scale, the $9 billion it’s expected to spend next year is more than the gross domestic product (GDP) of 67 countries, including some I’d like to visit this winter (the Bahamas has a $8.51 billion GDP, and Bermuda, $5.6 billion GDP). That’s in addition to Monaco ($7.1 billion), Greenland ($2.4 billion) and, well, you get the picture.
And that doesn’t include spending that’ll be coming from Hulu, Facebook, Snapchat et al.
There are roughly 100 SVOD services in the United States and thousands more around the world. Double that if you want to add in ad-supported platforms, not to mention the content being provided by broadcast TV, cable nets and virtual MVPDS.
The content world is exploding as operators (traditional and new), broadcasters (over the air and online) and content providers of all ilks look to feed the seemingly insatiable appetite of today’s video consumers who want content when, where and on any device they choose.
New SVOD and AVOD service launches are coming hot and heavy:
♦ Lionsgate and Hemisphere Media Group have officially launched a new Spanish-language video streaming service in the U.S. named Pantaya.
♦ Viacom is developing its own subscription video-on-demand services with the launch of Paramount in the Nordic region.
♦ AMC launched an ad-free streaming service in June — one that is limited to Comcast Xfinity customers. But how long that stays inside the walled garden is up in the air because the OTT market for AMC shows like The Walking Dead and Better Call Saul is a lot bigger than just Comcast’s subset of Xfinity subscribers.
♦ NBC Sports in June said it would stream 130 live Premier League football matches to U.S. consumers for a subscription price of $50 with the start of the league’s season in August.
♦ Turner, in turn, in August said it would launch an SVOD service featuring UEFA Champions League, Europe’s top club football competition. Turner plans to stream 80% of the champions league games after it won English-language rights in February.
♦ CBS, during its Q2 2017 earning call, said its CBS All Access and Showtime SVOD services each were over two million subscribers, and said it would be launching an all-sports SVOD network soon.
♦ That, of course, wasn’t the news Disney was hoping to hear, as it plans to launch ESPN over-the-top in an effort to stem the sports network’s substantial subscriber bleed — it was in 2.9 million fewer households in May 2016 than it was a year earlier, according to Nielsen.
POINT OF VIEWJIM O’NEILL, PRINCIPAL ANALYST & STRATEGIC MEDIA CONSULTANT
4 OOYALA GLOBAL VIDEO INDEX Q2 2017

OOYALA GLOBAL VIDEO INDEX Q2 2017 5

♦ And, Disney itself set off a media storm when it said it was cutting its ties to Netflix (at least for the U.S. market), the service that had used Disney’s content for kids to enrapture millions of little ones. Disney will now launch its own direct-to-consumer (D2C) service… something we’re likely to see more studios do, whether Netflix or Amazon or other service partners, as they realize the value of a D2C business.
The list goes on and on and on…
The Golden Age of Television may have come and gone, but the Golden Age of Content — where the consumer really is king (as I’ve been saying for years) — is upon us.
A brief counterpoint: Pivotal Research Analyst Brian Wieser earlier this year released a report that said of the 120 TV and cable channels he tracks, only 16 grew subscriber numbers in May.
The biggest losers? Time Warner’s Boomerang channel, which lost nearly 10% of its subscribers (9.6%), Viacom’s CMT (also down 9.6%), MTV Class (down 8%) and Spike (down 6.6%). Boomerang, it’s worth noting, also is available as an SVOD service.
And, yes, traditional pay-TV providers also are feeling the pressure that OTT services are bringing to bear.
In Q2, traditional pay-TV providers lost nearly one million subscribers (941,000 according to analyst Craig Moffett). That followed a first quarter that saw nearly a half million subscribers opt out of the big bundle ecosystem. In fact, Q1 2017 was the first time operators have ever seen a drop in subscribers during that quarter. And, the rate of subscriber loss also is increasing, from 2.5% in Q1 to 2.7% in Q2.
While it hasn’t been a 1-for-1 swap to OTT, Leichtman Research Group in August pointed out that Netflix U.S. subscribers outnumber subscribers from the top six pay-TV services combined, another first.
We all know where this is headed — and Ooyala will do its best to help you get there.
This quarter’s edition of the Video Index delivers deep insights about the business of streaming that only Ooyala can provide.
Among our long-form consumption findings:
♦ Consumers are more likely to watch more long-form video (44 minutes) on tablets than on desktop computers or smartphones.
♦ For shorter long-form video (20–30 minutes), viewing on tablets averages 17.2 minutes.
POINT OF VIEW
6 OOYALA GLOBAL VIDEO INDEX Q2 2017

♦ Tablets also see the most time watched for content 31–60 minutes long: 23.2 minutes.
♦ Desktop viewers, on average, watch long-form video for the shortest amount of time.
Mobile video trends:
♦ For the 23rd consecutive quarter, the share of video plays on mobile devices increased, reaching 56.7%.
♦ The 0.4% Q/Q growth was the smallest increase in mobile plays in several quarters.
♦ Y/Y growth still was significant at 12%, but represents the smallest Y/Y growth we’ve seen.
♦ Plays on smartphones declined slightly while tablet plays saw good growth.
Regional mobile video trends:
♦ Mobile plays in Asia Pacific made up nearly three quarters of all plays (72%), the highest in the world.
♦ EMEA, at 57.7%, was higher than Latin America (56.1%) and North America (50.1%).
♦ EMEA (12.6%) and Asia Pacific (14.1%) saw the highest percentage of tablet plays.
Time watched by device and video length:
♦ For the second consecutive quarter, long-form video made up the majority of time watched on all devices: smartphones, tablets, connected TVs and computers.
♦ Connected TVs continued to see long-form content make up the most time watched — more than 96% — as users turn to the biggest screen for premium content.
♦ Time spent watching short-form content continued to decline on all devices as more premium content moved online, diluting the short-form effect.
Video advertising trends:
♦ Advertising spend on Desktop continues to figure in brands’ attempts to reach consumers through online video ads.
♦ Mid-roll advertisements deliver completion rates exceeding 98% on broadcast platforms.
♦ Pre-roll ads perform significantly better on broadcaster platforms than on publisher platforms.
♦ On publisher platforms, mid-roll ads are completed much more often on tablets than on smartphones.
OOYALA GLOBAL VIDEO INDEX Q2 2017 7

GLOBAL LONG-FORM CONTENT VIEWING HABITSIn Q1 and Q2 of 2017, long-form video (video that is 20+ minutes long) has become the dominant form of video in terms of time watched. On every device, more time is spent with long-form video than with any other.
But how’s it being watched? For how long on each device? And, is it being watched differently in different regions of the world?
The rise of long-form last quarter — the first ever to see long-form content dominate every device — prompted those questions from us (and from a number of customers and readers of the Global Video Index).
We drilled down into how viewers on tablets, smartphones and desktops watch video in every region of the world. The answers are as varied as you’d expect.
GLOBAL LONG-FORM CONSUMPTION
Tablets, the most portable “big screen,” tended to draw the longest engagements, with viewers watching all long-form video for an average of 44 minutes.
Global smartphone viewers engaged with content for the second-longest period, averaging 38.5 minutes. Personal computers saw the least engaged long-form viewers, with an average engagement lasting just 25.3 minutes.
The tendency to watch longer on tablets isn’t a surprise; the high-res screens and generous screen sizes are ideally suited for watching TV episodes, movies, even live sporting events, especially on the go. Many viewers transition
from the big screen to a more personal screen near bedtime.
More surprising was the average viewing time on smartphones, which, despite generally larger screens of late, would seem to be less enjoyable than a tablet or even a laptop. But the ultimate portable device plays a major role in consumers’ continued push toward anywhere-anytime viewing.
It isn’t really a surprise that computers, whether laptop or desktop, tended to have shorter average engagement. Even laptops can be too big for casual viewing of long-form content when you’re relaxing in an easy chair.
THREE ‘BUCKETS’ OF CONTENT BY LENGTH
What we all call “long” content ranges from episodic TV to movies to sports and live events. Obviously, they produce different viewing data.
Rather than divide content by type, we chose to look at how length impacts device choice and length of viewing. Our three content “buckets” included:
♦ Short long-form: content 20 to 30 minutes long — essentially the shortest of episodic TV sitcoms and the like
♦ Medium long-form: content 31 to 60 minutes long, which represents longer episodic TV and some live events
♦ Long long-form: content 61 minutes and longer
8 OOYALA GLOBAL VIDEO INDEX Q2 2017

LONG-FORM CONTENTAVERAGE ENGAGEMENT: BREAKDOWNQ2 2017
PC PHONE TABLET
60
45
30
15
0
60
45
30
15
0
LONG-FORM CONTENTAVERAGE ENGAGEMENTQ2 2017
PC PHONE TABLET
AVERAGE ENGAGEMENT
MIN
UTE
SM
INU
TES
20–30 MINUTE CONTENT31–60 MINUTE CONTENT
61+ MINUTE CONTENT
OOYALA GLOBAL VIDEO INDEX Q2 2017 9

Short long-form content
For “short” long-form content, consumers showed a preference for mobile devices. Tablets (17.2 minutes average viewing time) were followed by smartphones (15.6 minutes) and, finally, desktops (11.2 minutes).
Medium long-form content
Here consumers maintained their preference for tablets (23.2 minutes), followed by smartphones (22.1 minutes) and desktop computers (13.4 minutes).
Long long-form content
Tablets (56.3 minutes), were again ahead of smartphones (50.4 minutes) and desktop computers (47.4 minutes) for this longest content.
LONG-FORM CONTENT VIEWING BY REGIONS
If there’s one thing you can count on when you begin drilling down into online video data, it’s that video viewing lengths will vary greatly by region. Such is the case with long-form video.
For example, short long-form video viewing in EMEA and APAC was done most often on tablets: 18.3 minutes and 16.8 minutes respectively. In North America and Latin America, tablets were the second most-used device behind smartphones, with smartphones seeing 17.4 minutes and 11.9 minutes respectively — just ahead of tablets in each region.
Desktop was used least to watch 20–30 minute content, for about 10 minutes in all regions except North America, where the average was 12.5 minutes.
For “medium” long-form, meanwhile, tablet was the device of choice — again, ahead of smartphones — in EMEA (31.7 minutes), APAC (18.2 minutes) and Latin America (29.4 minutes). Only North America showed a preference for viewing on smartphones
10 OOYALA GLOBAL VIDEO INDEX Q1 2017 10 OOYALA GLOBAL VIDEO INDEX Q2 2017
GLOBAL LONG-FORM CONTENT VIEWING HABITS

(21.6 minutes) compared to tablets (17.1 minutes). Again, desktop was the least-used screen.
When it comes to “long” long-form content, no surprise: tablets dominated across the board. EMEA (66.7 minutes), APAC (30.9 minutes), North America (36.4 minutes) and Latin America (62.0 minutes) all opted for the biggest mobile screen.
Desktops again were least likely to be used everywhere but in LatAm, where smartphones (47.2 minutes) surprisingly finished behind desktops (58.3 minutes). Part of that may be higher prices for mobile bandwidth, and could also be due to a preponderance of low-priced Android smartphones in the market with fewer bells and whistles than higher priced models.
THE BOTTOM LINE
Long-form streaming has become common on all devices in all regions of the world.
Despite a slowdown in the number of tablets being shipped globally — one that’s been ongoing for several quarters — consumers still gravitate to the device as a natural evolution of the traditional TV experience. Tablets offer high-quality images and audio and are as portable as smartphones but have larger screens.
Across the globe, tablets and smartphones are the go-to devices for video consumption, especially among the Millennial audience that’s been behind the rise of online video.
In every region, longer-form video is viewed on mobile devices between 2.4 and 3.3 times more often than on personal computers. Obviously, while it still remains worthwhile to make sure content is accessible on browsers, it’s significantly more important to make sure video is optimized for mobile devices — the choice of your audience.
EMEAAPAC
NORTH AMERICALATAM
SHORT LONG-FORMQ2 2017
20
5
10
15
0PC PHONE TABLET
MIN
UTE
S
MEDIUM LONG-FORMQ2 2017
40
10
20
30
0PC PHONE TABLET
MIN
UTE
S
LONG LONG-FORMQ2 2017
70
35
0PC PHONE TABLET
MIN
UTE
S
OOYALA GLOBAL VIDEO INDEX Q2 2017 11

TABLET AND SMARTPHONE VIDEO TRENDSAfter 22 quarters of solid quarter-over-quarter (Q/Q) growth, 14 of them in the double digits, video consumption on mobile devices stayed essentially flat in the second quarter of 2017. Tablets — surprisingly and for the first time ever — saw greater Q/Q growth in their share of video plays than did smartphones.
Regardless, mobile devices retained the lion’s share of video plays at 56.7%, up from 56.5% in the first quarter. That’s the smallest Q/Q increase since we’ve tracked device share starting in Q3 2011.
Before we declare the rise of mobile video fini, it’s important to note that the flattening of its growth curve doesn’t mean growth is done; it simply indicates that the segment may be nearing saturation, or, more likely, is simply gathering itself for another push forward.
Among the factors we anticipate will provide catalysts for more growth:
♦ An increase in the number of older consumers who begin watching video on mobile devices more regularly.
♦ Rising smartphone adoption in developing regions as device prices continue to moderate and even decline for some older models.
♦ Continued decline in the cost of mobile bandwidth and an expansion of next-gen networks like 5G in developed markets.
♦ A new spate of smartphones — including Samsung’s Galaxy 8 and Apple’s iPhone 8 — will make watching online video even more
enjoyable as screens and audio improve. And, finally...
♦ An increase in the amount of premium content available on mobile devices globally as more services offer subscription- and ad-supported video.
The four quarters before this one averaged 4.3% growth in mobile plays per quarter. We expect to see that rate continue in the next two quarters, which will push mobile devices’ share of online video plays past 60%.
SMARTPHONES
Q2 2017 saw something akin to the rarity of a solar eclipse: smartphone’s share of video plays declined. The loss was miniscule: just 86 basis points to 46.04%, compared to 46.9% in Q1 2017.
Still, smartphone plays increased a healthy 8% from Q2 2016, and are up nearly 150% since 2013.
Q2 2017 isn’t the first time smartphone plays declined Q/Q. For two consecutive quarters — Q4 2015 and Q1 2016 — growth also stalled, first dipping 37 basis points to 39.35% and then another 14 basis points respectively. Aside from those instances, smartphones have seen relentless growth since we started tracking them in 2011.
As mentioned above, we don’t expect the slide in smartphone mobile plays to continue. Industry forecasts over the next several years see smartphone subscriptions increasing rapidly, especially in developing markets like APAC and LatAm, where smartphones often are consumers’ primary screens.
12 OOYALA GLOBAL VIDEO INDEX Q2 2017

SECTION HEADERSUBHEADER
Lorem ipsum dolor sit amet, consectetur adipiscing elit. Maecenas rhoncus ex eget laoreet interdum. Duis quis mi nisl. Curabitur commodo dictum metus sit amet pulvinar. Etiam sed dignissim lorem. Proin sit amet augue neque. Donec placerat tellus sagittis posuere facilisis. Suspendisse blandit efficitur vestibulum. Curabitur quis quam sit amet dolor pretium consequat varius eu tellus. Duis varius, quam at finibus scelerisque, turpis sapien tristique nisi, eget pharetra diam elit at tellus. Quisque non justo urna.
Curabitur quis hendrerit dui. Nunc eget arcu est. Vestibulum ac nisi maximus, placerat mi sed, venenatis erat. Suspendisse potenti. Vestibulum ante ipsum primis in faucibus orci luctus et ultrices posuere cubilia Curae; Fusce auctor enim et ex suscipit rhoncus. Cras luctus auctor libero sit amet venenatis. Nam dapibus dapibus arcu in molestie. Etiam sodales, mi et sagittis scelerisque, odio magna tristique nulla, sed convallis massa eros non elit. Proin mauris enim, consequat luctus massa a, blandit dapibus metus.
Lorem ipsum dolor sit amet, consectetur adipiscing elit. Pellentesque maximus nunc quis nunc pellentesque interdum. Ut volutpat finibus odio et consequat. Duis cursus diam eu justo ullamcorper tristique. Nam diam diam, accumsan eu odio vel, tempor aliquet ex. Donec tristique a quam eu bibendum. Nullam condimentum, enim sed viverra molestie, massa tortor porttitor mauris, ut vulputate libero sem non felis. Vestibulum vel nisi orci. Nulla facilisi. Fusce quis lacinia arcu. Sed lacus nisl, sagittis quis mi vel, scelerisque molestie lorem. Nulla mollis turpis
accumsan orci ornare consequat. Nullam luctus faucibus egestas.
In orci nibh, elementum ultricies volutpat ac, fermentum vel augue. Duis fermentum faucibus convallis. Donec consectetur magna augue, vitae lobortis est molestie eu. Mauris efficitur, diam eget convallis commodo, purus massa volutpat nunc, quis fringilla velit felis at arcu. Nulla eget lacus in nibh elementum tristique. Nam sollicitudin lobortis sem nec porta. Suspendisse potenti. Morbi sed felis non est tempus volutpat.
Sed sodales ex nibh, vitae hendrerit libero tincidunt ut. Maecenas orci sem, fringilla ac ipsum vitae, ultricies aliquam odio. Aliquam imperdiet, eros in placerat ullamcorper, leo lectus congue sem, non congue nunc lectus a purus. Cras tincidunt tempus eleifend. Suspendisse ultricies cursus urna at bibendum. Sed auctor consequat nulla, non tincidunt odio tempus quis. Aliquam mollis vestibulum volutpat. Sed eleifend turpis non magna consequat, eget egestas eros porttitor.
60%
45%
30%
15%
0%
JUL2013
JAN2014
JUL2014
JAN2015
JUL2015
JAN2016
JUL2016
JUN2017
JAN2017
SHARE OF PHONE VIDEO PLAYSSHARE OF TABLET VIDEO PLAYS
SUM OF PHONE + TABLET VIDEO PLAYS
THE RISE OF MOBILE VIDEOQ2 2017
OOYALA GLOBAL VIDEO INDEX Q2 2017 13

According to Ericsson’s mid-year Mobility Report, more than 107 million new mobile subscriptions launched in Q1, bringing the global total to 7.6 billion. That number is expected to exceed 9 billion by 2022.
The report points out that mobile broadband subscriptions, meanwhile, are growing by 25% annually, up more than 240 million in Q1 alone. There are more mobile subscriptions in APAC — 1.51 billion, not even including China (1.35 billion) or India (1.17 billion) — than in North America and all of Europe combined (1.49 billion).
Operators increasingly are looking to wireless as a means of growing their footprint, a much less expensive alternative than building out fixed broadband access. Lower-cost smartphones also are expected to accelerate growth in the market from 3.9 billion subscriptions in 2016 to more than 6.8 billion in 2022.
TABLETS
Tablet plays reached 10.6% of all video plays in the second quarter, their highest share ever. This is up from 9.6% in Q1 2017, which also was a record at the time.
As a percentage of mobile plays only, tablet plays topped 19%, the highest since Q1 2015 (19%) and Q3 2014 (21%).
But if the growth of tablet shipments globally continues to erode, how can tablets’ share of plays go up?
Two things, really.
One, tablets have remained a popular second screen in many homes, with about 41% of tablets owners saying they watch streaming video on the device, according to a study from SNL Kagan.
And, two, although tablet shipments are no longer growing, manufacturers still shipped more than 189 million of the devices globally in 2016, with several forecasts saying more than 145 million will be shipped each year through 2021.
As we’ve seen, tablets have a long replacement cycle, perhaps even longer than televisions. With little innovation occurring in the category, it’s not surprising sales have declined. But we’re still seeing a steady build in the number of tablets in the market, devices that have become a regular screen for video consumption.
Apple remains the leader in market share, with about 30% of tablet households using an iteration of the iPad. Samsung is second with a 16% share. Amazon, meanwhile, has moved to fourth in the market on the back of its $50 Fire tablet, a device it introduced in 2015.
Apple surprisingly brought iPad sales back to life in Q2 this year, reporting a 15% surge in August to about 11.4 million units. Of course, that’s less than 30% of the ~41 million iPhones Apple sold in the same quarter.
What’s that mean for tablets (and video viewing) in the future?
“The second quarter was a slight righting of the ship and there is still much to be hopeful about in the back half of 2017. New product launches from Microsoft and Apple are generally accompanied by subsequent quarters of inflated shipments, the reintroduction of Windows to the ARM platform could help remedy the aforementioned hollowing of the middle of the market, and we expect a proliferation of Chrome OS-based detachables in time for the holidays,” said IDC’s Research Director Linn Huan.
Clearly there remains life in the tablet market.
THE BOTTOM LINE
Despite a plateau in mobile video share growth, there’s little doubt that mobile will continue to be the nexus between online video adoption and younger viewers globally. While connected televisions continue to gain traction in the United States, in developing regions like Latin America and Asia — especially India — mobile will be the way forward.
Zenith’s Online Video Forecast 2017 posits that online video viewing time globally will increase nearly 20% this year, with mobile viewing on smartphones and tablets increasing by 35% and on fixed devices by just 2%.
The moral of the story: make sure that a viewer’s experience on smartphones and tablets is as enjoyable and intuitive as on fixed screens like connected TVs and computers.
For companies in developing regions, a “mobile first” strategy will be key, but for any company contemplating an online play, bringing premium content online — along with an engine to drive recommendations and to collect data that can be used to generate immediate business insights — will help guarantee success.
14 OOYALA GLOBAL VIDEO INDEX Q2 2017
TABLET AND SMARTPHONE
VIDEO TRENDS

EMEA
While overall mobile growth was relatively flat, EMEA saw mobile’s share of video plays increase to 57.7% in the quarter from 54.1% in Q1 2017.
Both smartphone plays (45.1%) and tablets plays (12.6%) increased, 6.5% and 7.1% respectively. The increase likely was due to more major operators offering unlimited or discounted data plans, similar to wireless carriers in the United States.
EMEA also is seeing growth in LTE networks and already has one operator offering a 5G network trial.
GLOBAL MOBILE CONSUMPTION TRENDS
DESKTOP VS. MOBILE SHAREEMEA Q2 2017
75%
25%
50%
0%Q1 2016 Q2 2016 Q3 2016 Q4 2016 Q1 2017 Q2 2017
DESKTOPMOBILE
OOYALA GLOBAL VIDEO INDEX Q2 2017 15

APAC
Mobile video plays in the Asia Pacific region are reminiscent of the growth the rest of the world was seeing just a few quarters ago. But where users in North America and EMEA — and even Latin America to a point — have tended to spread their consumption across multiple screens, APAC is rapidly becoming unequivocally mobile with 72% of plays being on mobile devices.
In Q2, the region’s mobile plays increased 17%, a gain that followed on the heels of Q1’s 13%. Where the star of Q1 was tablet views (up 34%), smartphones remain the driver this quarter with an increase of more than 19%.
APAC has seen increased demand for 4G smartphones. Emerging Asia Pacific markets were second only to China in terms of smartphone sales in Q2 2017, according to Gartner. Consumers in emerging markets — primarily in Indonesia, India and the Southeast Asian countries — bought more than 78.2 million smartphones, second only to China’s 101.5 million.
DESKTOP VS. MOBILE SHAREAPAC Q2 2017
75%
25%
50%
0%Q1 2016 Q2 2016 Q3 2016 Q4 2016 Q1 2017 Q2 2017
DESKTOPMOBILE
16 OOYALA GLOBAL VIDEO INDEX Q2 2017
GLOBAL MOBILE CONSUMPTION
TRENDS

DESKTOP VS. MOBILE SHARENORTH AMERICA Q2 2017
75%
25%
50%
0%Q1 2016 Q2 2016 Q3 2016 Q4 2016 Q1 2017 Q2 2017
DESKTOPMOBILE
NORTH AMERICA
Mobile plays made up more than 50% of all Q2 plays in North America… barely. But the 50.1% share for smartphones and tablets marks the fourth consecutive quarter that mobile has held the lion’s share of video starts in Canada and the United States.
Smartphone sales in North America were flat during the quarter as market saturation and a paucity of new devices impacted sales. New models from Samsung and Apple due out in Q3 and Q4 could spark consumption of video. Apple saw an increase in iPad sales during Q2, which likely played a role in the increase in tablet plays, which averaged nearly 20% of all mobile plays in the quarter.
The second half of 2017 could be a big one for mobile plays in North America as new devices — and an increase in services bringing premium content online — spark increased consumption. CBS’s All Access debut of Star Trek: Discovery, the latest iteration of the famous franchise, is an OTT play that targets Millennials and their mobile viewing habits specifically.
OOYALA GLOBAL VIDEO INDEX Q2 2017 17
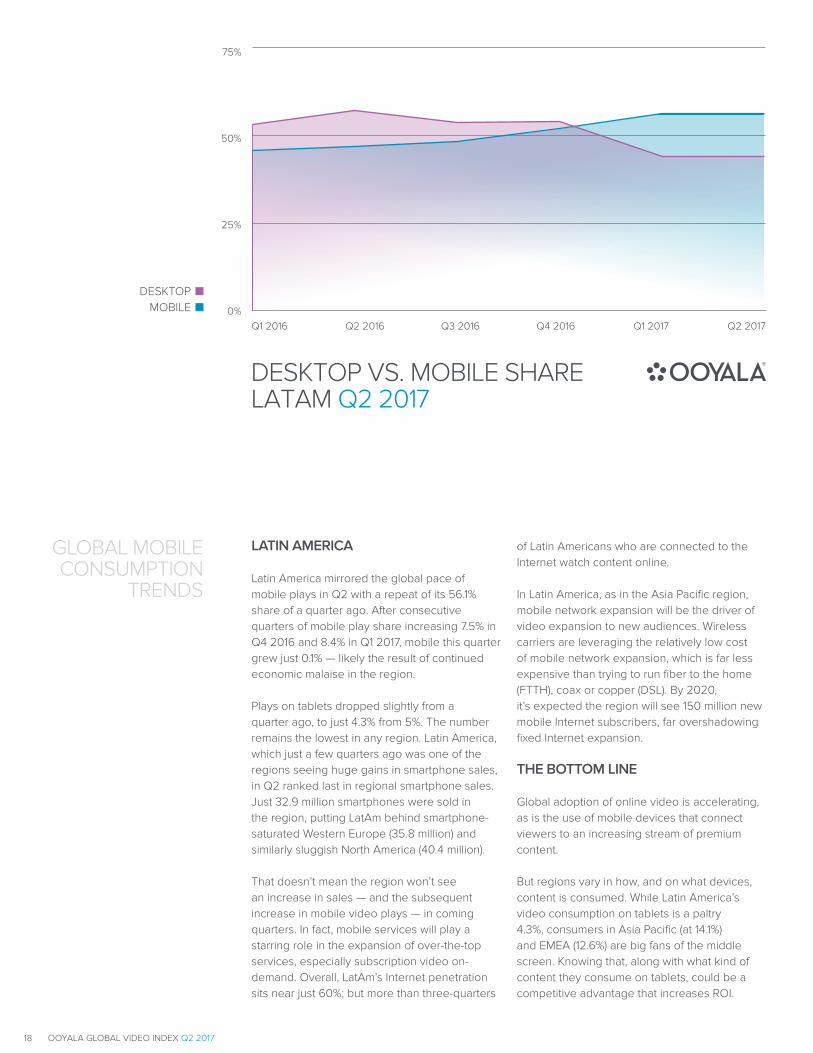
LATIN AMERICA
Latin America mirrored the global pace of mobile plays in Q2 with a repeat of its 56.1% share of a quarter ago. After consecutive quarters of mobile play share increasing 7.5% in Q4 2016 and 8.4% in Q1 2017, mobile this quarter grew just 0.1% — likely the result of continued economic malaise in the region.
Plays on tablets dropped slightly from a quarter ago, to just 4.3% from 5%. The number remains the lowest in any region. Latin America, which just a few quarters ago was one of the regions seeing huge gains in smartphone sales, in Q2 ranked last in regional smartphone sales. Just 32.9 million smartphones were sold in the region, putting LatAm behind smartphone-saturated Western Europe (35.8 million) and similarly sluggish North America (40.4 million).
That doesn’t mean the region won’t see an increase in sales — and the subsequent increase in mobile video plays — in coming quarters. In fact, mobile services will play a starring role in the expansion of over-the-top services, especially subscription video on-demand. Overall, LatAm’s Internet penetration sits near just 60%; but more than three-quarters
of Latin Americans who are connected to the Internet watch content online.
In Latin America, as in the Asia Pacific region, mobile network expansion will be the driver of video expansion to new audiences. Wireless carriers are leveraging the relatively low cost of mobile network expansion, which is far less expensive than trying to run fiber to the home (FTTH), coax or copper (DSL). By 2020, it’s expected the region will see 150 million new mobile Internet subscribers, far overshadowing fixed Internet expansion.
THE BOTTOM LINE
Global adoption of online video is accelerating, as is the use of mobile devices that connect viewers to an increasing stream of premium content.
But regions vary in how, and on what devices, content is consumed. While Latin America’s video consumption on tablets is a paltry 4.3%, consumers in Asia Pacific (at 14.1%) and EMEA (12.6%) are big fans of the middle screen. Knowing that, along with what kind of content they consume on tablets, could be a competitive advantage that increases ROI.
DESKTOP VS. MOBILE SHARELATAM Q2 2017
75%
25%
50%
0%Q1 2016 Q2 2016 Q3 2016 Q4 2016 Q1 2017 Q2 2017
DESKTOPMOBILE
18 OOYALA GLOBAL VIDEO INDEX Q2 2017
GLOBAL MOBILE CONSUMPTION
TRENDS

LONG FORM
In Q1 2017, we reported that long-form content (video 20 minutes or longer in length) made up more than 50% of time watched on every device, from the biggest screen — connected TVs — to the smallest, smartphones. It was a first for the Video Index.
In Q2, we’ve seen a repeat of Q1.
Long-form content made up more than 96% of time watched on Connected TVs (CTV), down marginally from 98% in Q1; it made up 82% of time watched on tablets (81% in Q1), 53% on smartphones (55% in Q1), and 53% on computers (down from 65% in Q1).
As in the first quarter, the dominance of long-form time watched on all devices — especially mobile — comes from several factors.
One, an increasing number of users — across all demographics — are as comfortable watching longer form content on smaller screens as they
are watching it on big screens. And they’re simply watching more content in general.
Two, content owners increasingly are pushing premium content, often in the form of episodic TV, comedy specials, movies and, increasingly, sports, over-the-top. Sports are especially well suited to being streamed to a mobile device because they remain one of the last bastions of appointment television. It’s content that has the most value in its immediacy. Being able to stream to your smartphone or tablet, for example, the Mayweather–McGregor fight as a pay-per-view special while away from home is more rewarding than catching highlights or a replay a week later. That availability is crucial.
And, three, bandwidth to mobile devices is increasing, meaning less buffering, fewer dropped connections and an easier viewing experience. AT&T in the U.S. has aggressively pushed into next-gen network trials, and the 5G services they’ll offer will be equal to, and in many cases better than, the bandwidth many homes get from fixed networks.
ENGAGEMENT TRENDS
SHARE OF TIME WATCHEDBY DEVICE AND VIDEO LENGTH Q2 2017
100%
25%
50%
75%
0%PC PHONE TABLET CTV
SHORT-FORM(0–5 MINUTES)
MID-FORM(5–20 MINUTES)
LONG-FORM(20 MINUTES OR MORE)
OOYALA GLOBAL VIDEO INDEX Q2 2017 19

SHORT FORM
It wasn’t very long ago that it was popular to point to the growth and adoption of online video by making fun of the user-generated content (UGC) that populated industry pioneer YouTube: skateboard-riding dogs, drunken cats and the like. The usual phrasing was, “online video no longer is just a collection of (fill in the blank) videos.” The new video industry was making inroads with news and sports highlights, movie trailers and the like.
In fact, just two years ago, in Ooyala’s Q2 2015 Video Index, we wrote:
“Mobile phones maintain their dominance as the devices more suited to snacking on content, with users spending 67% of their time with content less than 10 minutes long… Desktop devices also saw a sizable piece of the share of time watched with video less than 10 minutes long, about 60%.”
Even a year ago, short-form still dominated the share of viewing time on smartphones at 55%.
How times have changed. This quarter, short-form content (0–5 minutes long) makes up just 36% of time watched on smartphones, 35% on PCs, 13% on tablets and just 2% on CTVs.
MEDIUM FORM
Time watched for medium-form content (5–20 minutes in length) was strongest on computers during Q2, with a share of just more than 12%.
Not unexpectedly, smartphones were next highest with just under 11% of time watched, followed by tablets (5.1%) and CTVs (1.7%). Just a year ago, tablets, smartphones and computers saw medium-form video viewing times in the range of 18–20%.
THE BOTTOM LINE
It’s not likely we’ll ever return to the days where UGC or short-form content dominates the total time watched on any device. The belief that consumers, especially Millennial consumers, are most desirous of short, bite-sized nuggets of content is just flat-out wrong. Both Verizon’s Go90 mobile video service and NBCUniversal’s comedy SVOD service, Seeso, have learned that lesson the hard way.
While there obviously is a place for snippets of entertainment, sports highlights, news reports, even skateboard-riding dogs, they need to be supported by high-end, longer content that provides an experience similar to the best available on traditional broadcast and pay-TV.
It’s not the content that’s being redefined by online video, it’s simply how it’s consumed.
20 OOYALA GLOBAL VIDEO INDEX Q2 2017
ENGAGEMENT TRENDS

Online video advertising, much like online video itself, has struggled with finding the right pace of growth to respond to its customers’ needs. It has had its own growing pains.
Ad blockers, ad fraud and the advent of programmatic ad trading all have created hurdles — and opportunities — for the video industry. Education of brands and agencies has increased understanding of how programmatic trading works and how it can be more efficient and cost effective; it’s growing up very quickly. Meanwhile, platforms have found ways to deal with ad blocking software, and ad fraud is decreasing.
In 2018, on the strength of consumer adoption of mobile video and its expected growth, Zenith forecasts that mobile video ad spend will surpass fixed online video ad spend, reaching nearly $18 billion.
Global Internet ad spend overall is expected to reach $205 billion, and many forecasts expect 2017 to be the year that more money will be spent on Internet advertising than on traditional television advertising ($192 billion) globally.
IAB reported that video now represents more than 50% of brands’ digital/mobile ad spend, and said programmatic now accounts for 45% of all digital video ad dollars.
And, as original digital video spend increases, so, too, has ad spending on originals, nearly doubling between 2015 and 2016. That growth is expected to continue with three quarters of video advertisers telling IAB they expect online digital video to be as important as TV to brands and consumers by 2020.
VIDEO ADVERTISING TRENDS
OOYALA GLOBAL VIDEO INDEX Q2 2017 21

PRE-ROLL IMPRESSIONS
Pre-roll ad impressions have gotten shorter and, hence, are less onerous to viewers than they were just a year ago. A number of major brands — many of them focused on younger viewers — have adopted the format as a way to (partially) appease viewers’ more obvious distaste of advertising online.
And it shows in the distribution broadcasters and publishers have adopted during the quarter. A year ago, there was an obvious trend toward pushing pre-roll (and even mid-roll) ads to mobile devices, primarily to reach the growing number of consumers that had begun watching video on smartphones and tablets.
A year later — as more users have adopted ad blockers on mobile devices and on browsers — brand share has begun a more varied distribution.
Among broadcasters, impressions on PCs have declined to 37% from just under 50% a year ago. Tablet impressions are flat at 13% compared to 15% in 2016, smartphone impressions have actually increased to 29% from 20%, and impressions on CTVs were at 21% compared to 15%.
Brands split their pre-roll impressions on publishers, with PCs accounting for 52% (compared to 50% in 2016), smartphones at 38% (32% in 2016) and tablets at 10% (18% in 2016).
PRE-ROLLIMPRESSIONSQ2 2017
PCPHONETABLET
CTV
29%
37%13%
21%
BROADCASTERS
52%38%
10%
PUBLISHERS
22 OOYALA GLOBAL VIDEO INDEX Q2 2017

MID-ROLL IMPRESSIONS
Advertisers on both broadcast and publishing platforms followed a similar strategy in Q2 2017 as they did a year ago, splitting their mid-roll ads between PCs and mobile devices.
Broadcasters made PCs their number-one target with 46% of their ads on computers. CTVs were second at 22%, while smartphones and tablets split the remaining mid-rolls with 16% each.
Publishers saw mid-rolls gain a slightly higher share, 52%, with smartphones garnering 45% of mid-roll impressions and tablets a scant 2.4%.
MID-ROLLIMPRESSIONSQ2 2017
PCPHONETABLET
CTV
52%45%
2%
PUBLISHERS
16%
46%
16%
22%
BROADCASTERS
OOYALA GLOBAL VIDEO INDEX Q2 2017 23

PRE-ROLL COMPLETION RATESBY MARKET SEGMENT Q2 2017
BR
OA
DC
AST
ERPU
BLI
SHER
0% 25% 50% 75% 100%
0% 25% 50% 75% 100%
PCPHONETABLET
CTV
PRE-ROLL COMPLETIONS
Conventional wisdom — borne out by data — has ad completion rates significantly higher for broadcasters than for publishers. The reason? Consumers tend to graze publisher sites, finding occasional video they may be interested in, while they intentionally go to broadcaster sites to consume video. Once on a broadcast platform, they’re more tolerant of pre-roll, mid-roll and even post-roll ads in the premium content they’ve chosen to watch. Ad abandonment has generally been higher on publisher sites.
The second quarter did nothing to change those assumptions.
Pre-roll completion on broadcaster sites remains high, in excess of 86% for all devices. As expected, CTVs saw the highest completion rate (92%), followed by PCs (89%), tablets (86%) and smartphones (86%).
Publisher platforms saw pre-roll completion rates top out at 82% for PCs, 82% on smartphones and 69% on tablets.
MID-ROLL COMPLETIONS
Mid-roll ads perform well on both broadcaster and publisher platforms, but broadcasters deliver near 100% completion rates as, again, the premium content on those platforms tends to engage viewers more.
Mid-roll ads that stream on broadcaster platforms to connected TVs delivered completion rates in excess of 98%, while rates on computers (97%), smartphones (95%) and tablets (95%) weren’t very far behind. Consumers appear ready to accept limited ads in formats they’re used to in exchange for access to premium content.
Brands relying on publisher ad placement, meanwhile, see better completion rates for mid-rolls than they do for pre-rolls, but still see high abandonment rates. On publisher platforms, ad completion rates on tablets (81%) are significantly better than on smartphones (74%), but impressions on tablets make up only 2.4% of placement; fully 97.6% of mid-roll impressions are on smartphones and PCs. PCs deliver completion rates of 88%.
VIDEO ADVERTISING
TRENDS
24 OOYALA GLOBAL VIDEO INDEX Q2 2017

MID-ROLL COMPLETION RATESBY MARKET SEGMENT Q2 2017
BR
OA
DC
AST
ERPU
BLI
SHER
0% 25% 50% 75% 100%
0% 25% 50% 75% 100%
PCPHONETABLETCTV
THE BOTTOM LINE
OTT is being adopted rapidly across a wide demographic range, but it still is heavily influenced by Millennials, an audience that traditional television just doesn’t reach as effectively.
Mobile should become a focus of your video advertising strategy. But for the moment, desktop should also remain in your plans. Two-thirds of consumers in the U.S. watch video on their smartphones every day, and 60% count smartphones as a “can’t live without” device. Slightly more consumers, about 70%, say they watch online video daily on their laptop or desktop computer. In emerging markets, where ad-supported services are more popular, those numbers are even higher for smartphone owners.
Consider the attention span of your customers and the nature of your video. Ad loads are a hotly debated topic and where you put your ads will have a big impact on user experience. Mid-rolls, for example, are much more tolerable for consumers than pre-rolls. But, if your content is exclusive or carries some other premium, our research shows that consumers are usually willing to watch both.
Keeping with that theme, consider offering shorter ads — especially in pre-roll positions. Facebook, YouTube and others are finding that 6–second ads — very common on Millennial-heavy gaming sites as well — are tolerated well and have high completion rates.
OOYALA GLOBAL VIDEO INDEX Q2 2017 25

This report reflects the anonymized online video metrics of the vast majority of Ooyala’s 500+ customers, whose collective audience of hundreds of millions of viewers spans nearly every country in the world. This report does not document the online video consumption patterns of the Internet as a whole. But the size of the Ooyala video and advertising footprint, along with the variety of our customers, results in a representative view of global consumption and engagement trends.
Ooyala is a leading provider of software and services that simplify the complexity of producing, streaming and monetizing video. Providing a set of Integrated Video Platform solutions (IVPs™), Ooyala’s comprehensive suite of offerings includes one of the world’s largest premium video platforms, a leading ad decisioning platform and media logistics solution that improves video production workflows. Built with superior analytics capabilities for advanced business intelligence,
Ooyala’s solutions help broadcasters, operators, media and production companies get content to market faster, build more engaging and personalized experiences across every screen, and maximize return for any video business.
Vudu, Star India, Sky Sports (U.K.), ITV Studios (U.K.), RTL Group (Germany), TV4 (Sweden), Mediaset (Spain), America Television (Peru), and Media Prima (Malaysia): these are just a few of the hundreds of broadcasters and media companies who choose Ooyala.
Headquartered in Silicon Valley, Ooyala has offices in Chennai, Cologne, Dallas, Guadalajara, London, Madrid, New York, Paris, Singapore, Stockholm, Sydney, Tokyo, and sales operations in many other countries across the globe.
For more information, visit www.ooyala.com.
ABOUT OOYALA’S GLOBAL VIDEO INDEX
OOYALA GLOBAL VIDEO INDEX Q2 2017 26