GLOBAL VIDEO INDEX - Ooyala | Imagine Tomorrow's...
30
GLOBAL VIDEO INDEX Q3 2016
Transcript of GLOBAL VIDEO INDEX - Ooyala | Imagine Tomorrow's...

GLOBALVIDEOINDEXQ3 2016

2 OOYALA GLOBAL VIDEO INDEX Q3 2016

POINT OF VIEW ························································································ 4
MOBILE: SMARTPHONES AND TABLETS ········································ 8
ENGAGEMENT PATTERNS BY DEVICE ···········································12
VIDEO ADVERTISING TRENDS ·························································· 14
SPOTLIGHT ON EUROPE ··································································· 20
MAXIMIZING FAN ENGAGEMENT ····················································26
HOW PIRACY IMPACTS VIDEO SERVICE PROVIDERS ··············28
ABOUT OOYALA’S GLOBAL VIDEO INDEX ··································30
TABLE OF CONTENTS
OOYALA GLOBAL VIDEO INDEX Q3 2016 3
A recent study from a consumer research firm found an astonishing 41% of U.S. adults said they’d be shaving — or cutting — the pay-TV cord in the next 12 months. They also found satisfaction with OTT was higher than with pay TV and that they were more likely to recommend an OTT service to a friend or family member than a pay-TV service.
And, of course, Millennials were the highest adopters of OTT, with 84% saying they regularly use streaming services. Older users said they, too, streamed, with nearly three quarters of Gen X (74%) and well more than half (60%) of Baby Boomers watching online.
But we all knew that, right? After all, even though some pundits predicted that Netflix would struggle when it raised its prices across the board last year, losing some subscribers and repelling others, that just didn’t happen.
Price, it appears, becomes less critical when you offer a good product (especially when it’s just a fraction of what a traditional pay-TV bill is).
MOBILE A CRUCIAL COMPONENT OF GROWTH AND STRATEGY
Mobile continues to be a significant driver of online video adoption, according to Ericsson’s latest ConsumerLab study. In fact, according to the report, mobile video viewing has increased four hours a week in the past four years globally, while traditional TV viewing time has decreased 1.5 hours. Yes, Millennials are behind much of that growth as well — not surprising considering they’re the world’s largest demographic.
Of course, here at Ooyala, we’ve been flagging mobile as a crucial part of the OTT ecosystem for a long time. Last quarter, mobile video views topped 50% of all views for the first time after hovering near the mark for a couple of quarters. As we expected, it grew even more in Q3, but more on that later.
By the time you read this report, AT&T should have launched its own major play designed to attract Millennials and other cord nevers and cord cutters: DirecTV Now, which offers 100 channels for just $35.
AT&T already has weathered the total disruption of its landline business by mobile telephones, pivoting to become the second-largest wireless carrier in the U.S. It’s looking to do the same with DirecTV Now. CEO Randall Stephenson has acknowledged that he expects DirecTV Now to heavily cannibalize AT&T’s existing U-verse and DirecTV pay-TV businesses. And, he said, that’s fine because, “that means you’ve found something the market really, really wants.”
Verizon, meanwhile, which is hoping to rebound from the underwhelming traction of its own mobile TV play — Go90 — is bracing for major changes. CEO Lowell McAdam recently told a conference audience that, if he had a choice, the only thing Verizon would offer would be skinny bundles.
“The 300-channel bundle is going to go away,” said McAdam. “Customers don’t want it.”
POINT OF VIEWJIM O’NEILL, PRINCIPAL ANALYST & VIDEOMIND EDITOR
4 OOYALA GLOBAL VIDEO INDEX Q3 2016

OOYALA GLOBAL VIDEO INDEX Q3 2016 5

SERVICES TARGET MILLENNIALS
Meanwhile, Millennial catchers abound. Sling TV. CBS All Access. HBO Now. Even the NFL has gotten into the game, partnering with Twitter to stream its Thursday Night Football broadcasts.
But, all of these Millennial catchers are seeing an interesting side effect: They’re attracting more than just the 18- to 34-year-old viewers they were targeting.
In the U.K., eight months after YouView launched with a connected DVR, children’s programs Peppa Pig and Mickey Mouse Clubhouse were two of the most-streamed shows.
Similarly, Sony PlayStation Vue CEO Dwayne Benefield said recently that Vvue also was engaging with families more often, noting that Mickey Mouse Clubhouse is one of its most watched programs, too.
And, as one poster on a Sony Vue message board recently wrote: “Oldster here with Millennial kids and Roku father’s day gift (w/MLB subscription!). Learning curve has been short and enjoyable and trading cable bill of $115 for $35 Vue is great.”
Sling TV CEO Roger Lynch has repeatedly said the streaming service is chasing the 21 million homes in the U.S. without a pay-TV service, about 5 million of whom are cord cutters. But pay-TV operators are seeing their subscriber base decay at more than 1% annually, creating an increasingly appealing audience for OTT.
“We see that shift as a large opportunity for us,” Lynch said.
So, increasingly, do other players in the space.
As CBS chief Les Moonves said during the company’s Q3 earnings call, the network plans to grow its audience by appearing on as many OTT services as possible (including its own) because, “the more people are exposed to these platforms, the more they like them. We’re growing our audience by delivering our content in the way that viewers want it.”
In Ooyala’s Q3 2016 Video Index, in addition to providing you with our most current research about the business of streaming video, we also drill down into how mobile video is performing in Europe, take a look at how wins and losses affect the number of video plays a popular European sports club sees on its platform every week, and share data with you on the cost of piracy from one of our technology partners, content protection specialist Irdeto.
Among the highlights:
♦ Europe continues to have higher-than-average viewing on mobile devices, but the rest of the world is catching up quickly. The Netherlands and Belgium have the highest percentage of mobile plays (65% and 59% respectively), and the region remains ahead of the rest of the world in terms of video plays on tablets, seeing 20% growth in the past year alone.
♦ Mobile plays a major role in sports viewing in Europe. Great Britain and Ireland are at the tip of the spear. Nearly 60% of sports videos are on mobile devices in Great Britain, with Ireland coming in at 57%. Both are significantly above the world’s average of just under 50%.
♦ Sports fans can be a fickle bunch. Our research shows a whopping disparity in the amount of video plays on a team’s platform the day after the win or loss.
♦ Ooyala’s been saying for 20 quarters that mobile devices are ideal for watching online video. Our latest data shows steady growth in the amount of medium- and long-form content being consumed on portable devices.
♦ There aren’t too many consumers who look forward to advertising interrupting their video entertainment, but mid-roll ads appear to be far more acceptable to consumers than pre-rolls. Especially for broadcasters, completion rates are high.
Stay tuned.
POINT OF VIEW
6 OOYALA GLOBAL VIDEO INDEX Q3 2016

OOYALA GLOBAL VIDEO INDEX Q3 2016 7

MOBILE: SMARTPHONES AND TABLETSMobile video views continued to increase during the third quarter. This quarter had few new offerings in the form of devices and services, making it clear that the continued growth of mobile video consumption was more organic than device or service driven. Simply put, consumers globally find video on mobile devices — whether it’s short-form comedy, sports highlights or full-length movies — hard to resist.
More than 52% of all video views this quarter were on mobile devices. Although the year-over-year increase in video views was a modest 16%, and the quarterly gain was just 3%, it was the second straight quarter that saw more than half of all video plays start on mobile devices (and the first where every month in the quarter surpassed 50%). It was also the 20th consecutive quarter of mobile-plays growth seen in the Video Index.
Since Q3 2013, mobile video views have increased more than 233%, outpacing the growing penetration rate of mobile devices globally as viewers spend more time watching video on the small screen.
Tablet plays remained at roughly 15% of all mobile plays, steady for the past four quarters.
The growth of mobile isn’t going to slow down. As the United Kingdom’s telecom regulator Ofcom recently reported, 41% of older teens own a smartphone, up from 35% a year ago. Ofcom also said children increasingly are “using portable devices for more focused, solitary viewing.”
“Children’s lives are increasingly digital, with tablets and smartphones commanding more attention than ever,” said Jane Rumble, Ofcom Director of Market Intelligence.
That attention is continuing to take time away from traditional television viewing, Ofcom said. It reported that young viewers spent less time in front of the television — 72 minutes less — this year than last.
Germany, too, is seeing more time spent with video on mobile devices. eMarketer forecasts that in 2017, for the first time, German adults will spend more time with digital content online than with traditional TV, and more than half of that online time will be on mobile devices.
“We’re already seeing a shift in viewing patterns, as more TV content migrates to digital platforms,” said Karin von Abrams, an eMarketer analyst. “So a steady increase in time spent with digital is definitely in the cards.”
In the U.S., meanwhile, Nielsen points out that the amount of time consumers spend on mobile devices daily increased to 189 minutes from 126 minutes between Q1 2015 and Q1 2016.
Much of that increase, of course, was due to the increasing impact Millennials are having on every facet of society.
Recent research from eMarketer notes that 78 million Millennials will watch mobile video in 2016, with 34% watching a complete episode of a television show and 18% watching an entire movie on either a smartphone or tablet.
Deloitte found that Millennials value their smartphones above any other device in their household and nearly two-thirds own tablets as well.
8 OOYALA GLOBAL VIDEO INDEX Q3 2016

60%
45%
30%
15%
0%
JUL2013
JAN2014
JUL2014
JAN2015
JUL2015
JAN2016
JUN2016
SEP2016
SHARE OF PHONE VIDEO PLAYSSHARE OF TABLET VIDEO PLAYS
SUM OF PHONE + TABLET VIDEO PLAYS
THE RISE OF MOBILE VIDEOQ3 2016
OOYALA GLOBAL VIDEO INDEX Q3 2016 9

How we consume content has changed. Where Baby Boomers were reared watching TV in a communal environment, Millennials have comfortably adopted an on-the-go approach that’s perfect for mobile devices.
Millennials stream 2.9 hours of on-demand TV shows weekly, according to the latest report from Ericsson’s ConsumerLab, and watch about 1.1 hours of live events weekly; both numbers are higher than for members of Gen X and Baby Boomer generations. But, those older generations are watching too: an estimated 1.4 hours and 0.7 hours respectively.
A huge portion of that is on mobile devices, with ConsumerLab reporting that over the past four years watching video on mobile devices has increased by nearly 210 hours annually, or about 4 hours every week. In contrast, viewing on traditional TV sets has fallen by more than 130 hours, or about 2.5 hours a week.
So it’s no surprise that AT&T’s streaming play, DirecTV Now, will have a significant mobile footprint, nor will it be unexpected that the service is taking aim at Millennials and younger users.
THE BOTTOM LINE
AT&T and other operators, broadcasters and content owners, are ramping up mobile video initiatives as viewers continue to watch more content — of all kinds — on mobile devices.
That’s had a considerable impact on — and will continue to have impact on — traditional business models. Legacy broadcasters and operators need to develop new businesses to supplement — or replace — existing ones. The need to adapt and evolve will only increase in the coming years as more content goes over the top, a large percentage of it to mobile devices.
Mobile video streaming is having as much of an impact on legacy players in the space as wireless phones had on Ma Bell and all of her progeny.
MOBILE: SMARTPHONES
AND TABLETS
10 OOYALA GLOBAL VIDEO INDEX Q3 2016

OOYALA GLOBAL VIDEO INDEX Q3 2016 11

More and more content owners, operators and broadcasters are putting their best content online, whether in a live setting, via subscription video on-demand services or advertising video on-demand services. That migration of premium content online is dramatically impacting how content is being watched on nearly every device. While smartphones increasingly are generating huge number of video views, this quarter clearly proves what we’ve been saying for the past several reports: The favorite screen is the one consumers have at hand, whether it’s a smartphone, computer, tablet or connected TV.
That’s especially true for content that’s considered medium- or long-form (over 5 minutes in length) where, over the past year, the time spent watching it has climbed steadily on virtually every device in the household.
On computers, time spent watching medium- and long-form content has routinely been nearly 40% of all video watched. But, in the past year, it’s climbed steadily every quarter, reaching 57% in Q3 2016. That’s an increase of nearly 43% year-over-year.
Smartphones also have seen an increase in medium- and long-form viewing as more users routinely watch full episodes of TV shows and even full-length movies on their phones. During the quarter, nearly half (48%) of all time watched on smartphones was medium- and long-form content, up more than 23% from a year ago.
As you’d expect, connected TV’s share of medium- and long-form content also increased during the quarter, due in large part to two factors: the availability of more premium content and the increasing number of connected TVs —
whether via streaming media players, game consoles or Smart TVs — in households. During the quarter, 93% of content on connected TVs consisted of medium and long form. That’s up from 73% a year ago.
Interestingly, only tablet’s share of time watched for medium- and long-form content remained, essentially, flat over the past year; there the share of medium- to long-form content time watched has been about 60% to 65% for the past five quarters.
Breaking long-form content out reveals that, even there, screen size matters less and less.
Connected TVs and long-form content go hand-in-hand, with 90% of time watched being long-form content. But, tablets came in at a very respectable 43%, with desktops (42%) and smartphones (30%) showing just how comfortable we are watching longer, premium content on any screen.
For short-form content, video that’s less than five minutes long, mobile (52%) is the device of choice as viewers still watch sports highlights, news, events and content designed specifically for the smallest screen most often there. Desktops (43%), tablets (40%) and connected TVs (7%) follow.
We’ve long believed in the democratization of screens, the idea that it’s the proximity, not the size of the screen, that determines when and how it’s used; the nearest screen on hand is the one that’s used first. Though the personal computer was the first (only?) choice for early online video consumers (generally YouTube viewers), other devices have moved
ENGAGEMENT PATTERNS BY DEVICE
12 OOYALA GLOBAL VIDEO INDEX Q3 2016

SHARE OF TIME WATCHEDBY DEVICE AND VIDEO LENGTH Q3 2016
100%
25%
50%
75%
0%PC PHONE TABLET CTV
SHORT-FORM(0–5 MINUTES)
MID-FORM(5–20 MINUTES)
LONG-FORM(20 MINUTES OR MORE)
to the forefront as more streaming content has arrived online. Smartphones quickly gained views, followed by tablets when the iPad was introduced in 2010.
All remain significant players in the ecosystem.
In the earlier days of online video, the TV screen was, largely, left behind. Even after Internet-ready TVs came to market in 2010, only about 1 in 4 actually were actually connected to the Internet.
No more.
In the U.S., according to Leichtman Research Group, nearly two-thirds (65%) of all Internet households had at least one television connected to the Internet in 2016. That’s up from 44% in 2014 and just 24% in 2010, thanks in large part to devices like Roku, Apple TV, Amazon Fire TV, Google Chromecast and game consoles that made it easier to connect.
THE BOTTOM LINE
Content owners, broadcasters and operators need content watchable on any screen, from five inches across to more than 100 inches. And, with diverse demographic groups all adopting streaming video — 63% of U.S. Internet households subscribe to at least one video service and the gap between how much Millennials watch and how much Boomers watch is shrinking — it’s crucial that the industry develop a strategy for delivery to an array of devices. There is no longer any low-hanging fruit; all audiences are in play.
OOYALA GLOBAL VIDEO INDEX Q3 2016 13

Digital video advertising is hot, with digital ad spend expected to pass ad spend on traditional television by the end of this year. In the United States, ad sales on TV are expected to reach $71.29 billion while digital ad spend is forecast to top $72.09.
It’s not just in the U.S.
In Australia, mobile ad spending alone is expected to outpace the ad spend on TV, with marketers laying down $2.71 billion — more than a quarter of the total marketing spend in the country — compared to $2.58 billion for TV.
The shift, according to eMarketer, isn’t just the result of brands moving away from traditional TV. It’s also due to new opportunities being created as AVOD services develop trackable audiences that allow marketers to better target ad spend. As Magna Global’s Director of Global Forecasting Vincent Letang said, the shift is a “powerful symbol” of the direction in which the ad market is trending. “TV global growth is diminishing,” he said. “In most major developed markets, TV growth is slowing and in some cases stagnating.”
VIDEO ADVERTISING TRENDS
14 OOYALA GLOBAL VIDEO INDEX Q3 2016

PRE-ROLL IMPRESSIONS
In Q2 2016, brands began to spend more money on mobile advertising campaigns, something that continued into Q3.
The allure of youngers audiences, specifically Millennials that seemingly are never without a mobile device, has prompted some 62% of agency and marketing professionals to say they plan to increase their spending on mobile video ads this year.
eMarketer forecasts that mobile spending would increase 80% in 2016 to $4.35 billion and to $6.72 billion next year, an increase of more than 54%. That follows on the heels of 2015’s impressive 114% increase over 2014 revenues.
Broadcasters saw mobile pre-roll ad impressions in Q3 spike to nearly 29% in the quarter, and, when combined with tablet pre-roll ad impression (15%), the two delivered 44% of all broadcaster ad impressions, on par with the share of impressions delivered on desktop and laptop computers (44%). Connected TVs delivered the remaining 12% of impressions.
Publishers saw a slightly different mix, with mobile (27.5%) and tablet (12.2%) combining for a 39.7% share of ad impressions, compared to 60.2% of ad impressions for computers.
OOYALA GLOBAL VIDEO INDEX Q3 2016 15
PRE-ROLLAD IMPRESSIONSQ3 2016
PCPHONETABLET
CTV
44%
29%
15%
12%
BROADCASTERS
60%28%
12%
PUBLISHERS
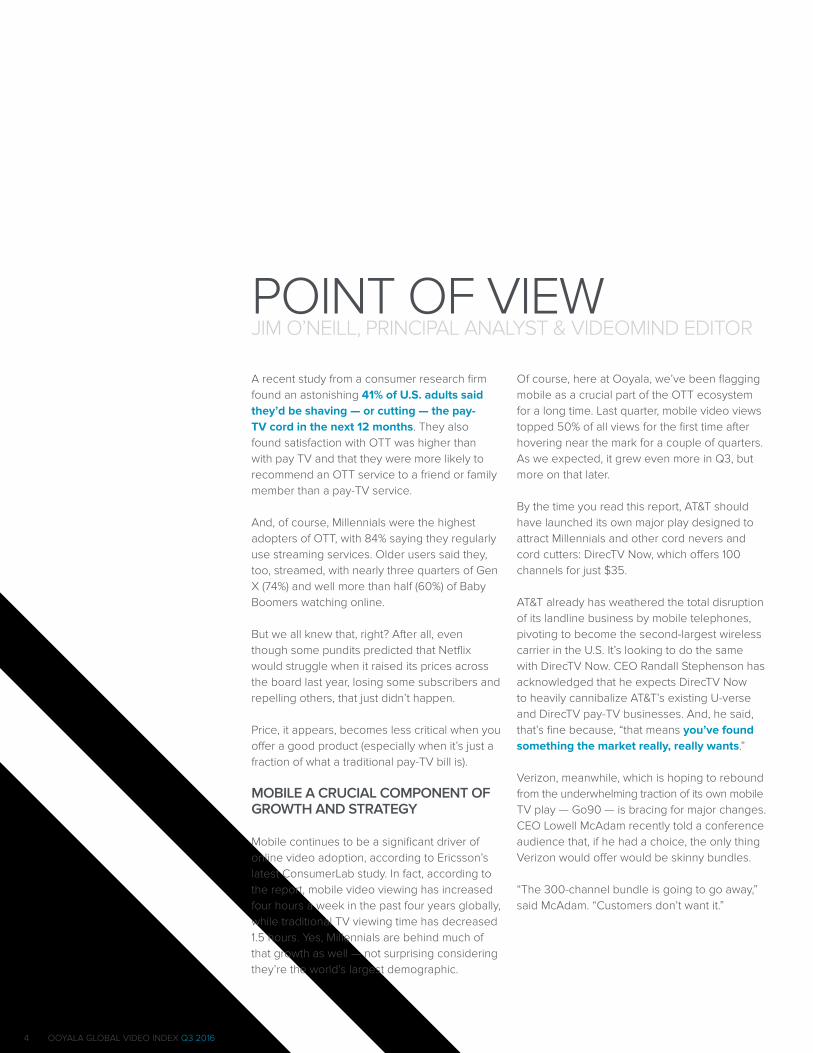
MID-ROLL IMPRESSIONS
Consumers generally watch longer content on tablets and computers than they do on mobile devices, which remain the domain of short-form content like news items, highlights and trailers. For that reason, it’s not surprising that there are significantly more mid-roll ads on tablets than on smartphones.
In Q3, the share of ad impressions on tablet devices was nearly 38%, more than 3X the number of ad impressions on smartphones (11.2%). The two together easily eclipse ad impressions from laptop and desktop computers (42.2%) and connected TVs (8.6%).
Publishers, meanwhile, generated more ad impressions on computers (68%) than on smartphones (30%) or tablets (2%).
MID-ROLLAD IMPRESSIONSQ3 2016
PCPHONETABLET
CTV
42%
12%
38%
9%
BROADCASTERS
68%30%
2%
PUBLISHERS
16 OOYALA GLOBAL VIDEO INDEX Q3 2016

PRE-ROLL COMPLETION RATESBY MARKET SEGMENT Q3 2016
BR
OA
DC
AST
ERPU
BLI
SHER
0% 25% 50% 75% 100%
0% 25% 50% 75% 100%
PCPHONETABLETCTV
PRE-ROLL COMPLETION RATES
Broadcasters generally saw the highest completion rates for pre-roll ads, averaging better than 85% for pre-rolls on computers, smartphones and tablets, and even reached 94% on connected TVs.
Publishers, meanwhile, saw completion rates that were considerably lower. Smart TV completion rates were highest for publishers at 83%, followed by computers (72%), smartphones (70%) and tablets (69%).
Broadcasters likely see higher completion rates for pre-rolls because viewers often are going to those platforms for a piece of premium long-form content that they’ve specifically requested. Thus, they may be more willing to sit through a pre-roll ad segment.
VIDEO ADVERTISING TRENDS
OOYALA GLOBAL VIDEO INDEX Q3 2016 17

MID-ROLL COMPLETION RATESBY MARKET SEGMENT Q3 2016
BR
OA
DC
AST
ERPU
BLI
SHER
0% 25% 50% 75% 100%
0% 25% 50% 75% 100%
PCPHONETABLET
CTV
MID-ROLL COMPLETION RATES
As strong as completion rates are for pre-roll ads on broadcasters’ platforms, they’re eclipsed by the completion rates for mid-rolls, which averaged 97% across all devices: computers (98%), smartphones (96%), tablets (96%) and connected TVs (98%).
Publishers, too, see an increase in mid-roll completion rates compared to pre-rolls. Computers have the highest mid-roll completion rates (87%), followed closely by tablets (86%) and smartphones (78%).
Again, the likelihood that consumers go to a broadcaster’s platform for a specific piece of content may account for higher completion rates in mid-roll ads when compared to broadcasters.
VIDEO ADVERTISING
TRENDS
18 OOYALA GLOBAL VIDEO INDEX Q3 2016

THE BOTTOM LINE
Mid-roll ads are quickly taking share from pre-roll ads. At the beginning of 2015, pre-rolls made up 75% of video ad inventory; by the middle of this year, that share had eroded to 60%. Mid-rolls have grown to 33% of available inventory from just 20% at the start of 2015.
The reason is simple: By the time viewers move several minutes into a video, they’re more likely to tolerate an advertisement than if they’re hit with one before they’ve engaged with content.
But, even if consumers are more likely to tolerate mid-roll ads because they have time to engage with content, it’s important to know at what point they drop off during ad breaks to help determine appropriate ad loads. It’s also very important that providers guard against laziness with mid-rolls, making sure there is a variety of ads available, so viewers aren’t shown the same thing over and over again.
And, traditional 30-second TV ads may not play well with online video consumers.
A study earlier this year, for example, showed that while older viewers were willing to watch 30-second spots on their mobile devices, Millennials were more accepting of several 10-second ads. To best execute your brand’s strategy, you need to know your audience and deliver your message in line with their preferences.
On top of this shift in ad position we also see broadcasters varying their ad loads by device. We recently surveyed a number of our broadcaster clients and the majority are placing more ads on bigger screens given the higher completion rates, as shown in the tables above.
OOYALA GLOBAL VIDEO INDEX Q3 2016 19

There’s a certain amount of truth in the Disney song “It’s a Small World (After All)” — written, interestingly, following the Cuban Missile Crisis in 1962. It was a time when our TVs were small boxes with even smaller black and white screens that had — if you were lucky — a couple of the (then) Big 3 Broadcast Networks, ABC, CBS or NBC and, if you were lucky, PBS.
The Internet, obviously, has turned our world into a much smaller place than it was back in the ‘60s; Netflix, with the simultaneous launch of its global cloud TV “network” to 130 countries in January, has made it easier to share content to nearly every country in the world. A number of major operators and technology companies are looking for ways to launch virtual cloud TV services that could rival Netflix for scale, with Amazon Prime Instant Video specifically mentioned in recent rumors.
For the past several quarters we’ve been taking deeper dives into data from different parts of the world to see how they compare. A year ago, in our Q3 2015 Video Index, we drilled down into online video consumption in the United Kingdom, Ireland, some of the largest markets in Western Europe, and Sweden in the Nordics.
It’s our litmus test, of sorts, to see just how similar — or different — the trends we see globally appear in different regions. What we discovered this year is that, well, it really is a small world (after all).
SPOTLIGHT ON EUROPE
20 OOYALA GLOBAL VIDEO INDEX Q3 2016

60%
45%
30%
15%
0%
SHARE OF PLAYS ON PORTABLE DEVICES,EUROPE VS. REST OF WORLDQ3 2015/Q3 2016
PHONE2015 2016
TABLET2015 2016
PHONE + TABLET2015 2016
EUROPEGLOBAL
OOYALA GLOBAL VIDEO INDEX Q3 2016 21

MOBILE VIDEO CONSUMPTIONBY DEVICE TYPE, EUROPE Q3 2016
80%
20%
40%
60%
0%
FRANCE
GERMANY
SPAIN
UK
IRELAND
SWEDEN
ITALY
NETHERLANDS
BELGIUM
SWITZERLAND
NORWAY
DENMARK
FINLAND
PHONETABLET
SUM OF PHONE + TABLET
MOBILE VIEWING
A year ago: Mobile plays in Europe were significantly higher at more than 53% than the rest of the world (ROW). While plays on smartphones and tablets stood at a then-record 45% globally, Europe saw mobile plays near 45% on smartphones alone and got a big bump from tablets, which added more than 8%.
Europe also is somewhat more tablet-centric than the ROW. Globally, tablet plays made up less than 12% of all mobile plays, while in Europe, tablet plays were 16% of all mobile plays.
More than two-thirds of video plays in Ireland and Great Britain were on smartphones and tablets, far above any other country; that was more than double the amount of mobile plays in Sweden and France, where desktops dominated online video plays.
Germany and Spain saw about 40% to 45% of their video plays on portable devices, on par with ROW.
Great Britain, meanwhile, had the highest number of tablet plays, 10%, nearly 2X the average for ROW.
Today: The rest of the world has essentially caught up to Europe, with more than 52% of video views occurring on mobile devices; that’s an increase of nearly 16% from a year ago. Europe has seen slower growth in reaching the 54% it stands at today, up just 2% over the past 12 months.
In Europe, smartphone plays are, essentially, unchanged from a year ago. Tablets plays have increased more than 20% to 10.1% of all video plays, and are the engine behind any growth in the region over the past 12 months.
In the ROW, meanwhile, tablets have played a larger part in growth than in Europe, with plays increasing 48% in the past 12 months to reach 8% of all plays. Smartphones also saw strong growth of more than 11%, and make up more than 44% of all video plays.
SPOTLIGHT ON EUROPE
22 OOYALA GLOBAL VIDEO INDEX Q3 2016

SHARE OF TIME WATCHEDBY DEVICE AND VIDEO LENGTH,EUROPE Q3 2016
100%
25%
50%
75%
0%PC PHONE TABLET CTV
SHORT-FORM(0–5 MINUTES)
MID-FORM(5–20 MINUTES)
LONG-FORM(20 MINUTES OR MORE)
The Netherlands (65%) and Belgium (59%) replaced Ireland and Great Britain at the top of the mobile heap in Europe, with Spain (56%) close on their heels. Ireland and Great Britain? A far more pedestrian 50% and 46% respectively.
So does Europe’s slowing mobile growth suggest that there’s a roof on the growth of mobile video plays? Not really. It’s more likely due to a lull in new device introductions during Q3, a maturing market and mobile data caps. As for the ROW, much of the growth is attributable to rapidly expanding mobile markets in APAC, MENA and LatAm.
SHARE OF TIME WATCHED BY DEVICE
A year ago: In Europe, as in ROW, bigger screens are more popular for watching longer content. For medium- and long-form content, connected TVs had an 81% share, more than ROW (73%). Tablets, meanwhile had a 45% share, smartphones 22% and desktops 18%. In ROW, tablets had a 63% share, smartphones 39% and desktops 40%.
For short-form content (five minutes and less), Europe was partial to desktop computers (81%) and smartphones (78%). Viewers in ROW, meanwhile, used desktops and smartphones to watch short-form content, too, but to a much lesser degree: 59% and 60% respectively.
Today: In Q3, connected TVs in Europe have an even bigger share of medium- and long-form content watched at 87%. Tablet share (44%) has stayed virtually the same over the past 12 months but desktop’s share has increased to 44% as well, more than double its Q3 2015 share of 18%. Smartphones (30%) also are up strongly from 22%.
In ROW, connected TV’s share was 93%, tablets 60%, desktops 57% and smartphones 48%.
The peaks and valleys of device share of time watched for short-form content in Europe, meanwhile, have flattened considerably. While almost no short-form is watched on connected TVs, smartphones have a 70% share and tablets and desktops each have 56%, essentially similar in distribution to the ROW.
OOYALA GLOBAL VIDEO INDEX Q3 2016 23

THE BOTTOM LINE
In Europe, as in the ROW, watching medium- and long-form content still is an activity that is most prevalent on the biggest screen available. But growth, some of it significant, has occurred on all other screens as well as more premium content has been made available.
What it means is that viewers really don’t discriminate based on screen size; they watch any content available to them on the screen that’s closest at hand.
Tablets remain an ideal format for delivering premium content in a more personal manner, but even smartphones are regularly used to view episodic television and movies, as their 36% increase in medium- and long-form plays attest.
EUROPEAN VS. ROW SPORTS VIDEO CONSUMPTION
Live sports have a universal appeal, and matches often are the focus of viewing parties, either at home or in the local pub. But for every hour of actual competition being consumed there’s a greater amount of video around it that’s often being viewed on mobile screens in the form of highlights, player and coach interviews or other content that isn’t always available on the big screen.
Millennials have had an impact there, as well. As the world of sports is discovering, reaching Millennials often means connecting with them through mobile devices.
Last year, our look at how sports is consumed in Europe revealed some interesting similarities… as well as a few differences in the region. In the past 12 months, there’ve been a few subtle changes as well.
Q3 2015: Smartphones and tablets, as expected, saw big numbers last year, especially in Great Britain and Ireland where those devices saw more than 45% of all sports plays. Ireland had more sports plays on mobile devices, 51%, than any other country. Surprisingly, the United States and Europe’s largest markets underperformed in comparison, with just 39% of sports plays on mobile devices.
Today: Engagement with sports video on mobile devices has soared globally with smartphones especially taking center stage in terms of sports video views.
A year ago, Ireland was the only market that saw the share of sports video views on mobile devices pass 50%. Today, 50% or better is the norm globally.
Great Britain now sees more sports video plays than other European countries on mobile devices, at a whopping 59%. Ireland, which saw the most mobile plays in our last study, saw significant gains in sports plays, increasing 12% year over year to finish Q3 with more than 57% of sports video views on mobile devices.
Europe and the U.S., however, showed the greatest percentage gains over the past year. Sports views on mobile devices in Europe’s biggest markets grew more than 38% to finish the quarter at 54%. The U.S. saw year over year growth top 33% in reaching 52% sports views on mobile in Q3.
Tablets played a significant role in the growth of sports plays on mobile devices in several markets, but contributed the most in Europe, where they made up 19.4% of the mobile total, followed by Great Britain (18.9%) and Ireland (15.8%).
SPOTLIGHT ON EUROPE
24 OOYALA GLOBAL VIDEO INDEX Q3 2016

SPORTS-RELATED ONLINE VIDEO PLAYSBY DEVICE TYPE Q3 2016
60%
15%
30%
45%
0%
EUROPE GLOBAL IRELAND GREAT BRITAIN U.S.
PCPHONETABLET
OOYALA GLOBAL VIDEO INDEX Q3 2016 25

Few content deals have generated the big dollars that sports rights have. Many of these deals routinely call for multi-billion dollar payments over several years.
In Europe, football is king, as evidenced by the Premier League’s global broadcast rights contract signed in February, which guarantees the 20 top-flight teams some $10.31 billion (£8.3 billion) through 2019, a 50% increase over the previous deal. The league also just signed a deal for TV rights in China that starts in 2019, adding another $233 million (£188 million) annually. On top of that, are the domestic rights worth $6.39 billion (£5.14 billion). That the cash for regular-season matches that’s pooled and split by the clubs.
There’s another wellspring of revenue that’s even more readily available, one that clubs increasingly are dipping into: the video that surrounds a club and gives it “personality” and more direct contact with fans. Features on players and coaches, interviews, talks about play and strategy, highlights from matches and even workouts and skill demonstrations all serve to engage fans, near and far, and are an excellent source of potential incremental revenue streams for clubs.
A year ago, we looked at the performance of one popular club’s video platform over a span of 45 days in Q3. We revisited that platform this year. This sports club, as is typical with individual clubs, can distribute and monetize video content relating to live matches, but not the live
YEAR OVER YEAR GROWTH FOR DAILY,PEAK TRAFFIC Q3 2015/Q3 2016
220%
165%
110%
55%
0%PEAK TRAFFIC DAILY TRAFFIC
REFERENCE YEAR 2015GROWTH 2016
MAXIMIZING FAN ENGAGEMENT
26 OOYALA GLOBAL VIDEO INDEX Q3 2016
streams of games themselves, which are subject to league distribution policies.
The changes year over year are a testament to how careful analysis of an online video platform can drive its growth.
Year over year, the average daily baseline of video plays increased nearly 70%, with the maximum number of plays during the 45-day period we studied more than doubling. The club we studied has used content not only to build relationships between fans and players, but also between club and community. It regularly posts highlights, skills-builder videos featuring its players, analysis and previews as well as a number of interactive videos for fans to dive into.
Similar to a year ago, fan behavior was reasonably predictable.
A year ago, on days prior to matches, fans played 75% more video than the average daily baseline. This year, plays were virtually the same, about 72% more than the now-higher baseline, meaning more videos watched overall.
On the day following matches, fan behavior is closely tied to wins, losses and draws. Fan loyalty, it seems, can be somewhat fickle.
Following a win, video plays increased an average of nearly 100%, similar to a year ago, as fans visited looking for highlights from the game, interviews with players and coaches and any tidbit that could further connect them with the club.
After a win against an historic rival, video plays jumped more than 230% following the game (plays on the day of the match also were up significantly, nearly doubling game day norms).
Fan behavior following draws and losses was significantly off the daily baseline. In fact, there is a fairly marked “hangover” effect for up to four days following a dropped match, with video plays off as much as 70% (but averaging closer to 50%). The afterglow following a win? A bit shorter… three days, on average, when plays increased an average 110%. The big win against a rival? The glow lasts four days, increasing video play 147%.
THE BOTTOM LINE
Fans are fickle, and you need to make certain — whether you’re a professional sports club, a broadcaster or content creator — that you’re getting the data you need to leverage those “wins” you have, whether in the form of a big game, a breaking news story or any other killer piece of content.
More content, obviously, is almost always better. For sports clubs, it may be content you’ve already got but have overlooked, historical wins, features on that legendary player or coach, an insider’s look at how you’ve created your club. And, of course, highlights before and after the game, regardless of the outcome.
OOYALA GLOBAL VIDEO INDEX Q3 2016 27

What do pirates love? Content... your content.
We reached out to Irdeto, digital platform security provider and content protection specialist, for some insight on what movies and TV shows were pirated most often in Q3 2016, and to get its take on trends in piracy and anti-piracy technology.
Irdeto, with researcher SNL Kagan, recently conducted a survey of some 500 video service providers to gauge the future of 4K UHD content. 4K is programming that Irdeto believes could be a high-value target for pirates who will be looking to trade off the expected 10-30% premium the content likely will carry for pay-TV and SVOD subscribers. And, it believes the most valuable — and most likely to be pirated content — will be live sports.
Irdeto also asked the industry to rate the most effective methods for protecting 4K content. There was no clear winner, and the survey showed that most video service providers and content producers would likely use more than a single method to repel pirates, including Internet piracy analytics, piracy detective services, content protection, watermarking, content fingerprinting, investigation and enforcement service and DarkNet monitoring.
Interestingly, in the Americas and EMEA, piracy intelligence analytics are most popular, while in APAC, providers and producers rely more on Internet piracy detection services.
SNL Kagan estimates content producers have “lost hundreds of millions of dollars to piracy,” and expect video service providers and content producers to redouble their efforts to protect
their content, especially with the increased revenue expected to be generated by 4K content as the format ramps up in the next three years (some 96% of survey respondents said they expect consumers and service providers to adopt 4K UHD TV by 2020).
THE BOTTOM LINE
Most consumers are likely to be willing to pay for the content they consume, but some of the most highly valued content — both live and VOD — will always create demand for cheaper, pirated copies.
While all of your content has value, some carries a higher price tag, whether because of its cost or its potential revenues.
With 4K, even old fashioned pirates with a smartphone or video camera can make quality copies of video from a TV screen, and even be able to live stream sporting events with only a slight lag and minimal degradation of quality.
It’s important for content owners to combat piracy by implementing a comprehensive and strategic anti-piracy strategy that include real-time intelligence, online piracy detection and rights enforcement, and forensic watermarking. This end-to-end solution is critical to protect the highest quality content and most valuable experience available to consumers.
A flexible — and responsive — action plan to stop your content from being pirated could add a significant revenue stream to your company. At the very least, it will help maintain the value of your content.
HOW PIRACY IMPACTS VIDEO SERVICE PROVIDERS
28 OOYALA GLOBAL VIDEO INDEX Q3 2016

Courtesy: Irdeto
*Percentage of overall piracy activity that occurred involving each title in Q3 2016
TOP FIVE PIRATED MOVIES Q3 2016
Deadpool 4.2%Batman v Superman:Dawn of Justice 3.7%Captain America:Civil War 3.0%
Warcraft 2.7%
Zootopia 2.6%
PERCENT OF TOTALINFRINGEMENTS*
TOP FIVE PIRATED SHOWS Q3 2016
Game of Thrones 13.9%The Flash 4.7%
Suits 4.6%
Arrow 4.5%
Vikings 4.2%
PERCENT OF TOTALINFRINGEMENTS*
OOYALA GLOBAL VIDEO INDEX Q3 2016 29

This report reflects the anonymized online video metrics of the vast majority of Ooyala’s 500+ customers, whose collective audience of hundreds of millions of viewers spans nearly every country in the world. This report does not document the online video consumption patterns of the Internet as a whole. But the size of the Ooyala video and advertising footprint, along with the variety of our customers, results in a representative view of global consumption and engagement trends.
Vudu, Sky Sports, Foxtel, NBCUniversal, RTL (Germany), M6 (France), TV4 (Sweden), Mediaset (Spain), STV (UK) and Singapore’s Mediacorp: these are just a few of the hundreds of broadcasters and media companies who choose Ooyala.
Ooyala is a subsidiary of Telstra, the largest telecommunications company in Australia, providing fixed and mobile services to millions of consumers, as well as advanced network applications and services to enterprise clients in Australia and overseas.
Headquartered in Silicon Valley, Ooyala has offices in New York, London, Stockholm, Sydney, Tokyo, Singapore, Cologne, Paris, Madrid, Chennai and Guadalajara, and sales operations in dozens of other countries across the globe.
For more information, visit www.ooyala.com.
ABOUT OOYALA’S GLOBAL VIDEO INDEX
OOYALA GLOBAL VIDEO INDEX Q3 2016 30


![VIDEO INDEX REPORT - Ooyalago.ooyala.com/rs/OOYALA/images/Ooyala-Video-Index-Report... · 2020. 10. 1. · *VUULJ[LK ;= KL]PJLZ HUK NHTL JVUZVSLZ HYL [HRPUN VMM. Video plays tripled](https://static.fdocuments.us/doc/165x107/6082a6a4b545de41905f7274/video-index-report-2020-10-1-vuuljlk-klpjlz-huk-nhtl-jvuzvslz-hyl-hrpun.jpg)