A Message From Ooyalago.ooyala.com/rs/OOYALA/images/Ooyala-Global-Video... · GLOBAL VIDEO INDEX:...
27
Transcript of A Message From Ooyalago.ooyala.com/rs/OOYALA/images/Ooyala-Global-Video... · GLOBAL VIDEO INDEX:...


2GLOBAL VIDEO INDEX: 2012 YEAR IN REVIEW
A Message From Ooyala
2012 was another historic year in online television.
The world watched a man jump to the Earth from outer space, the London
Olympics broke online records, and the first video to hit a billion views
on YouTube taught us all how to dance “Gangnam Style.”
Live streaming for major sporting, political, and music events became the
norm, as people tuned in to Wimbledon, the Tour de France, and the U.S.
Presidential debates online. Throngs of connected viewers also watched
the monumental “12.12.12” Benefit for Hurricane Sandy Relief.
Tablet TV continued to surge as mobile, social and video converged on
a growing number of smart screens built for personal media consumption.
Data from this report reveals the share of tablet video viewing more than
doubled last year.
People streamed more movies and TV shows through game consoles than ever
before. Microsoft reported that Xbox users spend more time watching video
than playing games on the device. New findings in this Video Index show how
viewing patterns on gaming systems and Smart TVs change seasonally.
Online video revenue increased along with viewer engagement in the last
four quarters. Video ads were the fastest-growing category of online
advertising in 2012, with U.S. ad spend increasing 46 percent to
$2.9 billion*. While that’s still a far cry from traditional TV ad budgets,
marketers and brands continue to move aggressively into the online video
space. Expect even more of this growth in the coming year as audience
insights become more sophisticated and financial returns more apparent.
Ooyala was founded five years ago to help media companies, marketers,
brands and TV networks earn more money from online media and connect
with their viewers around the world. Driven by a vision of personalized media,
simplified discovery, advanced social sharing, and robust analytics, Ooyala
is committed to keeping our customers ahead of the technology curve.
There’s still a lot of work to do. The industry has yet to agree on standards
for online video ad measurement, making it difficult to demonstrate the
efficacy of paid streaming content. Network speeds and data-caps also create
institutional barriers between viewers and videos. In order for “online video”
to fully transition to “online television,” media and technology companies
must work together to find common ground in this new media landscape.
As always, thanks for watching!
Bismarck Lepe
Co-Founder and President of Products, Ooyala
*Source: eMarketer September 2012
Table of contentsABOUT OOYALA’S GLOBAL VIDEO INDEX .................................... 3
EXECUTIVE SUMMARY ............................................................. 4
BRANDED VIDEO CONSUMPTION SURGES BETWEEN BLACK FRIDAY AND CHRISTMAS DAY ..................... 6
Q4 ENGAGEMENT: CONNECTED TVS & GAMING CONSOLES ...... 7
TABLET VIDEO VIEWING SPIKES ON CHRISTMAS .................... 8
WANT TO ENGAGE VIEWERS ONLINE? GO LIVE! ...................... 9
RAPID INCREASE IN TABLET + MOBILE VIDEO IN 2012 ........ 10
THE PHONE WARS: iOS VS. ANDROID ................................. 11
LONG-FORM VIDEO .......................................................... 12
VIEWER BEHAVIOR & ENGAGEMENT BY DEVICE ................... 14
TURNING INFORMATION INTO INSIGhTS ................................. 11
APPENDIX ............................................................................. 12

About Ooyala’s Global Video Index
Ooyala measures the anonymized viewing habits of nearly 200 million unique viewers in 130 countries every month. We process billions of video analytics events each day. Our market-leading video analytics help media companies and consumer brands grow their audiences and earn more money from mobile, multi-screen broadcasting.
Ooyala works with TV networks, cable and satellite providers, movie studios and online media companies to put premium video content on tablets, smart phones, connected TVs and PCs all over the world. One in every four Americans watch video on an Ooyala player, and more than half of our traffic comes from outside of the U.S.
About Ooyala Video Publishers
Ooyala video publishers include hundreds of forward-thinking brands, broadcasters and operators like Bloomberg, ESPN, Telefonica, The North Face, Rolling Stone, Dell, Pac-12 Network, Sephora, Caracol TV, CJ Entertainment, and Yahoo! Japan.
This report reflects the anonymized online video metrics of these publishers. It does not document the online video consumption patterns of the Internet as a whole. But the size of the Ooyala video footprint, along with the variety of our customers, means this report offers a statistically representative view of the overall
state of online video.

Executive SummaryKey findings from Ooyala’s 2012 Year In Review Global Video Index include:
Branded Video Viewing SurgeS Between Black Friday and chriStmaS
Conversion rates for branded videos jumped 91% from the start of the quarter to their peak in mid-December.
There’s a huge opportunity for retailers, e-tailers and consumer brands to connect with online audiences between Black Friday and Christmas Day.
rapid increaSe in taBlet + moBile Video in 2012
Measured together, the share of all hours spent watching streaming video on tablets and mobile phones increased 100% in 2012.
want to engage ViewerS online? go liVe! On desktops, viewers watched live video
18 times longer than VOD content in Q4.
premium content ruleS About one third of the total time spent
watching tablet video last quarter was with premium, long-form content running more than 60 minutes.
The percentage of time spent watching long-form video (over 10 minutes) on tablets increased 37% from Q1 to Q4 in 2012.
the phone warS: ioS VS. android Although Android phones are outselling
iPhones globally, last year Apple users watched twice as much online video on their mobile phones.
home (and online) For the holidayS Short-form video* viewing spikes on
Black Friday and Christmas, presumably because people are unpacking and tinkering with new connected devices.
The amount of time people spent watching short-form video on Connected TVs & Gaming Consoles increased 500% in the two days following Christmas.
The share of time spent watching online video on tablets jumped 73% on Christmas Day, compared to the Q4 average.
* Video less than 10 minutes.

6GLOBAL VIDEO INDEX: 2012 YEAR IN REVIEW
the Bottom line
Video drives online purchases
and gives consumers confidence
in their purchases. Viewers who
watch a product video online are
up to 85% more likely* to make
a purchase.
In order to maximize revenue,
brands should ensure they have
high quality, relevant video content
available across all screens to drive
impressions and sales.
Branded Video Consumption Surges Between Black Friday and Christmas DayWe wanted to better understand the impact of the gift-giving season on video viewing habits.
Do people watch more video on tablets and gaming consoles during the winter holidays?
Does desktop viewing dip when people leave the office for winter break? And how do people use
branded video to research gifts online?
After collecting anonymized data from 150 leading consumer brands, we found that the conversion
rate (the ratio of plays to displays) for branded videos began to rise sharply on Black Friday,
and peaked in mid-December. At its zenith, one out of every two viewers who were presented with
a branded video online clicked the play button.
Branded video conversion rate Q4 2012
Pla
y/D
ispl
ay C
onve
rsio
n R
ate
0%
20%
40%
60%
Oct Nov Dec
BLACK FRIDAY
Branded video conversion
rates peaked on December 16
at 54%—a 91% increase
from the start of the quarter.
*Source: Internet Retailer, April 2010

7GLOBAL VIDEO INDEX: 2012 YEAR IN REVIEW
the Bottom line
Viewer behavior changes seasonally.
Publishers need sophisticated
analytics for viewer engagement
to identify audience trends and
deliver the content that is most
relevant to individual viewers.
Q4 Engagement: Connected TVs and Gaming ConsolesThe amount of time viewers spent watching short-form videos* on Connected TVs and Gaming
Consoles (CTV&GCs) increased in November and December, months when people purchase, gift,
and test-drive new TV tech.
The average share of short-form content watched on Connected TVs and Gaming Consoles was 8%
from July 1 to October 31, 2012. From December 25 to 27, the average share of time spent watching
short-form video jumped to 40%—a 500% increase.
*Videos less than 10 minutes.
less than 1 min6-10 min
Percent of time watched by video length: CTV & GC Q3, Q4 20121-3 mingreater than 10 min
3-6 min
Sha
re o
f ti
me
spen
t
0%
10%
20%
40%
30%
50%
Jul Aug Sep Oct Nov Dec
Dec 17 Dec 19 Dec 21 Dec 23 Dec 25 Dec 27 Dec 29 Dec 31
5%
10%
15%
20%
25%
40%
45%
30%
35%
50%
The percentage of time spent viewing videos
10 minutes or less on Connected TVs & Gaming
Consoles increased 500% after Christmas,
presumably because people were “test-driving”
new devices and playing shorter video clips.

8GLOBAL VIDEO INDEX: 2012 YEAR IN REVIEW
Tablet Video Viewing Spikes on ChristmasTablet video usage also increased noticeably on Christmas Day. Tablet video viewers watched 5.33%
of all online video consumed on December 25, 2012—up from a fourth-quarter average tablet share of 3%.
Share of Total Hours Watched: Tablet Christmas 2012
Sha
re o
f to
tal h
ours
wat
ched
0%
1%
2%
4%
5%
3%
6%
MON TUE WED THU FRI SAT SUN SAT SUNMON TUE WED THU FRI MON17 18 19 20 21 26 27 28 29 30 312422 23
AVG=3%
The share of time spent
watching video on tablets
increased 73% on
Christmas, with respect
to the Q4 average.

9GLOBAL VIDEO INDEX: 2012 YEAR IN REVIEW
Want to Engage Viewers Online? Go Live! Whether it’s a live sporting event, concert, fashion show, or breaking news, live video has an
immediacy and urgency that leads to longer viewing times across all devices.
As more TV content and live streams are put online, the more “online video” will become “online
television,” with real-time analytics informing personalized ads that target specific viewers, devices
and locations.
We’ve reported on this trend before, and it shows no signs of abating any time soon.
the Bottom line
Media companies and consumer
brands looking to engage their
audiences online should employ live
video as part of a comprehensive
digital video strategy. Bonus points
for delivering live video to tablets
and smart phones to maximize
exposure and ad impressions.
Time per play by device Q4 2012
Min
utes
0
10
5
20
15
30
35
30
25
45
Desktop Mobile Tablet CTV & GC
Live VOD
50
Tablet video viewers watched live video
5x longer than VOD content.
Live mobile video was viewed for almost
4x as long as VOD content.
Viewers watched live streaming video
on Gaming Consoles and Connected
TVs for an average of 45 minutes.
Desktop viewers averaged over
41 minutes of live video viewing.

10GLOBAL VIDEO INDEX: 2012 YEAR IN REVIEW
Rapid Increase in Tablet + Mobile Video in 2012The way people watch TV is changing. There are more videos being watched on more tablets
and smart phones than ever before. The share* of tablet video viewing increased 110% in 2012,
while the share of mobile online video viewing grew by 87% last year.
Measured together, the share of all hours spent watching online video on tablets and mobile phones
grew 100% in 2012. Tablet and mobile video share grew from 4% in January to 8% in December.
As more tablets and smart phones enter the market, expect tablet and mobile video consumption
to continue to grow rapidly. New Cisco data reveals that video will make up 66% of the world’s
mobile data traffic* in four years.
*This is a median share of hours watched by device (as opposed to the mean measured in previous reports). Looking at the median reduces the volatility caused by publisher-dependant effects on the data, and also lessens the impact of outliers on the results. We still see the same overall trends, but the numbers reported here are slightly higher compared to the mean.
the Bottom line
It isn’t enough to just put your
content online anymore. You need
to know where it’s being watched —
in real time—to maximize
engagement and digital revenue.
Smart video publishers will deliver
streaming media to tablets and
phones that is personalized for each
viewer, screen, time, and location.
Share of all hours watched online: mobile and tablet 2012
Sha
re o
f ho
urs
wat
ched
0%
2%
4%
6%
10%
8%
OctSepAugJulJunMayAprMarFebJan Nov Dec
Share of all hours watched online: mobile, tablet 2012
Per
cent
of
tim
e w
atch
ed
0%
1%
3%
2%
5%
4%
Tablet Mobile
OctSepAugJulJunMayAprMarFebJan Nov Dec
*Source: The Cisco® Visual Networking Index (VNI) Global Mobile Data Traffic Forecast Update, 2012 - 2017

11GLOBAL VIDEO INDEX: 2012 YEAR IN REVIEW
Phone Wars: iOS vs. Androidhatfield vs. McCoy. Tupac vs. Biggie. Alexander hamilton vs. Aaron Burr.
history is full of iconic feuds, and the battle between iOS and Android is shaping up to be a mobile
operating system grudge match for the ages.
We measured the share of time played on mobile phones for 2012 to see if Google or Apple was
winning the war for mobile video.
the Bottom line
Publishers must have detailed
mobile video analytics to ensure
that their streams are optimized for
delivery to all devices. Mobile video
ads should target specific phones for
maximum impact.
Android
Share of mobile video time played: Android vs. iOS 2012iOS
33% 67% 68%
(other)
19%
2012 MARKET SHARE
Although Android outsold the iPhone globally last year,
iPhone owners consumed roughly twice as much video
on their phones in 2012.
Source: IDC Worldwide Quarterly Mobile Phone Tracker

12GLOBAL VIDEO INDEX: 2012 YEAR IN REVIEW
Long-Form VideoWhile the percentage of time spent watching short and mid-form videos increased across all device
categories last quarter, connected viewers still spent a significant percentage of their time viewing
long-form videos* online in Q4.
82% of the total online video viewing time on Connected TVs & Gaming Consoles (CTV&GCs) was
spent watching long-form video content. Tablet video viewers spent 63% of their total viewing time
watching videos longer than ten minutes.
* Videos over 10 minutes long.
the Bottom line
Video publishers must customize
their online monetization strategies
for specific devices. For example,
deploy more mid-rolls for content
played on SmartTVs and Gaming
Consoles. Device-specific ad
strategies optimize revenue against
engagement.
less than 1 min6-10 min
Time watched by video length and device Q4 20121-3 mingreater than 10 min
3-6 minP
erce
nt o
f ti
me
wat
ched
0%
25%
75%
50%
100%
Desktop Mobile Tablet CTV & GC
Long-form video viewing accounted
for 57% of the total time spent
watching online video on personal
computers last quarter.

Long-Form Video
13GLOBAL VIDEO INDEX: 2012 YEAR IN REVIEW
the Bottom line
More viewers tuning in to long-form
content means more opportunities
for mid-roll advertising, and also
points to the shift from “online
video” to “online television.”
Smart video publishers will optimize
the placement and frequency of
their ads to ensure high brand
engagement—and higher ad
revenues—across all devices.
When we look closer at long-form video viewing habits, we find viewers tuning in to long-form content
like movies and TV shows across all connected screens.
Nearly 25% of total desktop viewing time was spent watching content that ran 60+ minutes.
Long-form viewing by device Q4 2012
Per
cent
of
tim
e w
atch
ed
0%
25%
75%
50%
100%
Less than 10 mingreater than 60 min
10-30 min 30-60 min
CTV & GCTabletMobileDesktop
Time spent watching long-form video by device 2012
Per
cent
of
tim
e w
atch
ed
0%
25%
75%
50%
100%
Q1 Q2 Q3 Q4
CTV & GCTabletMobileDesktop
32% of the total time spent
watching tablet video last quarter
was with content running more
than one hour long.
The percentage of time spent
watching long-form video
on tablets increased 37%
from Q1 to Q4 in 2012.
14GLOBAL VIDEO INDEX: 2012 YEAR IN REVIEW
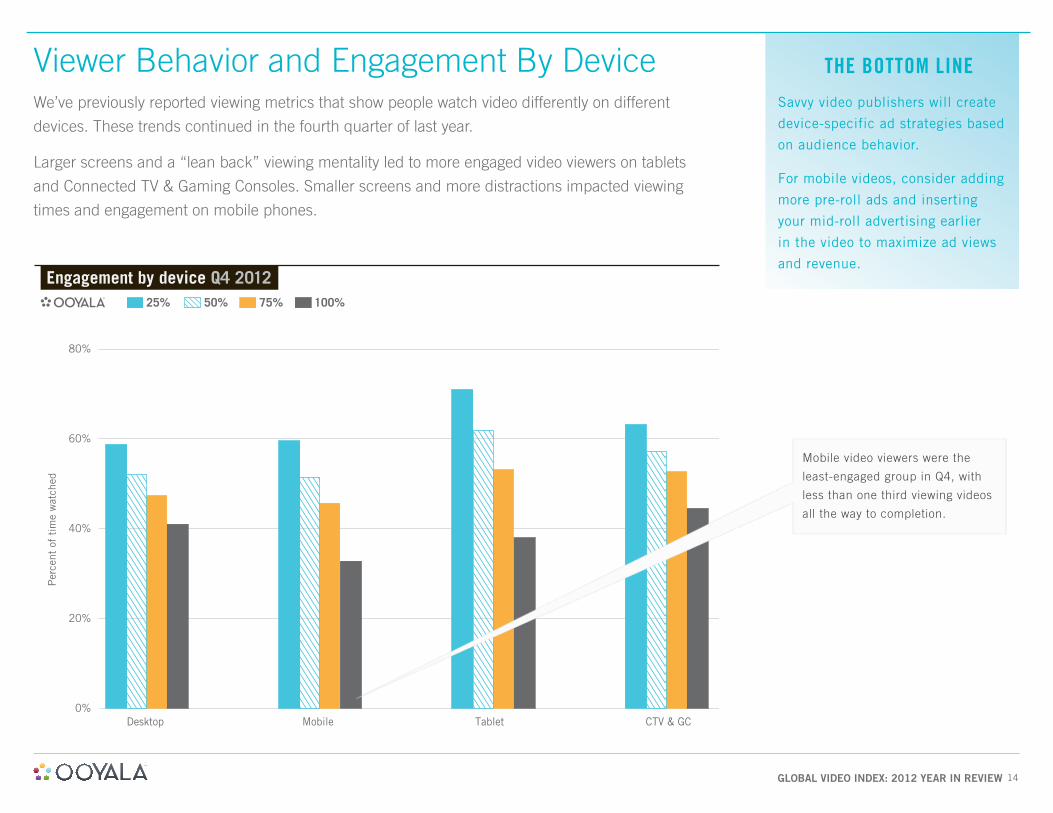
Viewer Behavior and Engagement By DeviceWe’ve previously reported viewing metrics that show people watch video differently on different
devices. These trends continued in the fourth quarter of last year.
Larger screens and a “lean back” viewing mentality led to more engaged video viewers on tablets
and Connected TV & Gaming Consoles. Smaller screens and more distractions impacted viewing
times and engagement on mobile phones.
the Bottom line
Savvy video publishers will create
device-specific ad strategies based
on audience behavior.
For mobile videos, consider adding
more pre-roll ads and inserting
your mid-roll advertising earlier
in the video to maximize ad views
and revenue.Engagement by device Q4 2012
Per
cent
of
tim
e w
atch
ed
0%
20%
60%
40%
80%
25% 50% 75% 100%
CTV & GCTabletMobileDesktop
Mobile video viewers were the
least-engaged group in Q4, with
less than one third viewing videos
all the way to completion.

Viewer Behavior and Engagement By Device
15GLOBAL VIDEO INDEX: 2012 YEAR IN REVIEW
the Bottom line
Video publishers looking to earn
additional revenue from online
video should add more mid-roll ads
to longer videos, especially when
they are played on larger connected
screens. Mid-roll video ads also have
higher completion rates, on average,
which means more viewers stay
engaged with paid content longer,
which leads to more revenue.
Online video analytics help media
companies, networks, brands and
broadcasters understand how
audiences watch TV online today.
These real-time insights inform
innovative and profitable online
video strategies that maximize
revenue and viewer engagement
across all connected screens.
The same engagement patterns emerge when we factor in device type and video length.
When people watch a video on a gaming console, connected TV, or tablet, they are
more likely to watch it to completion. Our data shows this is true for short-form, mid-form
and long-form videos.
Playthrough by device and video length Q4 2012
Com
plet
ion
rate
0%
20%
60%
40%
80%
CTV & GCTabletMobileDesktop
less than 1 min6-10 min
1-3 mingreater than 10 min
3-6 min

Turning Information Into Insights
When you optimize digital revenue strategies for each viewer, device and location, you deliver more relevant ads to the right screen at the right time.
The result is more money for online video publishers.
Ooyala uses Big Data and real-time video analytics to help you understand your audience like never before, and connect with them in meaningful ways.
Only Ooyala delivers a more personalized and profitable media experience that benefits viewers and content publishers alike.
That is the power of information. That is the power of Ooyala.

Appendix: Data Tables
17GLOBAL VIDEO INDEX: 2012 YEAR IN REVIEW
Branded Video Conversion Rate
26.03% 100.00%29.00% 111.42%29.53% 113.45%32.46% 124.71%42.40% 162.88%26.92% 103.43%
Branded Video Content
- Q4 2012
10/01 - 10/1610/17 - 10/3111/01 - 11/1511/16 - 11/3012/1/ - 12/1612/17 - 12/31
Average Conversion Rate (Plays/
Displays)
Growth of Conversion
Rate
Branded Video Content
- Q4 2012
Oct 1, 2012Nov 22, 2012Dec 16, 2012Dec 17, 2012Dec 24, 2012
Conversion Rate
Gain With Respect to Oct 1, 2012
28.71% 0.00%31.40% 9.35%54.84% 90.98%33.97% 18.31%19.87% -30.80%
28.71%26.44%25.01%28.04%29.04%23.43%26.32%24.44%24.63%23.83%25.82%27.97%24.75%26.71%25.20%26.13%24.21%27.80%29.07%24.01%
Branded Video
Conversion Rate, Q4 2012
Plays/Displays
Oct 1, 2012Oct 2, 2012Oct 3, 2012Oct 4, 2012Oct 5, 2012Oct 6, 2012Oct 7, 2012Oct 8, 2012Oct 9, 2012Oct 10, 2012Oct 11, 2012Oct 12, 2012Oct 13, 2012Oct 14, 2012Oct 15, 2012Oct 16, 2012Oct 17, 2012Oct 18, 2012Oct 19, 2012Oct 20, 2012
Nov 7, 2012Nov 8, 2012Nov 9, 2012
25.25%26.79%27.77%28.73%31.24%34.01%28.56%30.66%32.95%29.10%34.91%27.55%31.35%23.60%24.25%30.59%30.50%
Oct 21, 2012Oct 22, 2012Oct 23, 2012Oct 24, 2012Oct 25, 2012Oct 26, 2012Oct 27, 2012Oct 28, 2012Oct 29, 2012Oct 30, 2012Oct 31, 2012Nov 1, 2012Nov 2, 2012Nov 3, 2012Nov 4, 2012Nov 5, 2012Nov 6, 2012
30.78%29.55%34.67%
Nov 10, 2012Nov 11, 2012Nov 12, 2012Nov 13, 2012Nov 14, 2012Nov 15, 2012Nov 16, 2012Nov 17, 2012Nov 18, 2012Nov 19, 2012Nov 20, 2012Nov 21, 2012Nov 22, 2012Nov 23, 2012Nov 24, 2012Nov 25, 2012Nov 26, 2012Nov 27, 2012Nov 28, 2012Nov 29, 2012
33.79%32.17%29.66%29.40%27.63%27.47%33.11%33.46%32.55%29.25%29.34%29.17%31.40%29.72%31.39%32.06%38.12%35.83%33.34%31.91%
Nov 30, 2012Dec 1, 2012Dec 2, 2012Dec 3, 2012Dec 4, 2012Dec 5, 2012Dec 6, 2012Dec 7, 2012Dec 8, 2012Dec 9, 2012Dec 10, 2012Dec 11, 2012
52.03%44.11%48.76%49.01%54.84%33.97%33.86%34.92%
36.26%43.82%30.33%36.81%32.51%37.50%42.97%38.59%40.98%49.10%38.24%38.76%
Dec 12, 2012Dec 13, 2012Dec 14, 2012Dec 15, 2012Dec 16, 2012Dec 17, 2012Dec 18, 2012Dec 19, 2012
20.41%22.03%22.62%29.90%19.87%26.60%24.23%24.93%27.28%27.74%31.45%24.04%
Dec 20, 2012Dec 21, 2012Dec 22, 2012Dec 23, 2012Dec 24, 2012Dec 25, 2012Dec 26, 2012Dec 27, 2012Dec 28, 2012Dec 29, 2012Dec 30, 2012Dec 31, 2012

Appendix: Data Tables
18GLOBAL VIDEO INDEX: 2012 YEAR IN REVIEW
Connected TVs & Gaming Consoles: Percentage of Time Watched by Video Length
Sep 3, 2012
0.37%2.35%2.22%2.36%
92.70%
Sep 10, 2012 Sep 17, 2012 Sep 24, 2012 Oct 1, 2012
0.35% 0.33% 0.29% 0.23%2.46% 2.30% 1.87% 2.21%2.12% 2.03% 1.85% 2.68%2.81% 2.70% 2.66% 5.12%
92.25% 92.65% 93.33% 89.76%
Oct 8, 2012 Oct 15, 2012 Oct 22, 2012 Oct 29, 2012
0.34% 0.41%2.63% 2.26%2.81% 2.92%5.87% 6.58%
88.34% 87.84%
Nov 5, 2012
0.83%5.03%4.87%4.63%
84.63%
Nov 12, 2012 Nov 19, 2012
1.02% 1.45%7.28% 12.97%6.07% 4.56%4.60% 7.07%
81.03% 73.96%
Nov 26, 2012 Dec 3, 2012 Dec 10, 2012 Dec 17, 2012
1.71% 1.21% 1.54% 2.26%11.56% 6.67% 9.42%4.73% 3.32% 4.18%7.87% 4.05% 4.85%
74.12% 84.75% 80.01%
Dec 24, 2012
3.60%13.30% 19.54%5.26% 5.01%5.95% 6.59%
73.23% 65.26%
Dec 31, 2012
2.29%12.06%3.80%5.67%
76.17%
% Of All Hours Watched, CTV&GC Q3, Q4 2012
Jul 2, 2012 Jul 9, 2012 Jul 16, 2012 Jul 23, 2012 Jul 30, 2012
less than 11 to 33 to 66 to 10greater than 10
0.27% 0.22% 0.23% 0.34% 0.29%2.31% 1.91% 1.87% 2.31% 1.72%2.35% 1.93% 1.58% 1.46% 1.28%2.57% 2.64% 2.11% 2.25% 1.61%
92.49% 93.30% 94.22% 93.65% 95.10%
Aug 6, 2012
0.28%1.86%1.55%2.26%
94.05%
Aug 13, 2012 Aug 20, 2012 Aug 27, 2012
0.24% 0.21% 0.32%1.44% 2.31% 2.40%1.46% 1.93% 2.33%2.58% 2.32% 3.14%
94.28% 93.22% 91.80%
less than 11 to 33 to 66 to 10greater than 10
0.59%3.40%3.87%3.97%
88.18%
0.32%2.49%2.79%5.10%
89.30%
less than 11 to 33 to 66 to 10greater than 10
% Of All Hours Watched, CTV&GC Q3, Q4 2012
% Of All Hours Watched, CTV&GC Q3, Q4 2012

Appendix: Data Tables
19GLOBAL VIDEO INDEX: 2012 YEAR IN REVIEW
Connected TVs & Gaming Consoles: Percent of Time Watched by Video Length, December 2012
CTV&GC % Of Time Watched by Length (Minutes)less than 11 to 33 to 66 to 10greater than 10
Dec 17, 2012 Dec 18, 2012 Dec 19, 2012 Dec 20, 2012 Dec 21, 2012 Dec 22, 2012 Dec 23, 2012 Dec 24, 2012
2.64% 1.44% 2.46% 4.36% 2.51% 1.59% 1.46% 4.91%14.36% 10.56% 14.85% 18.67% 15.24% 11.22% 10.53% 10.44%8.80% 4.90% 7.72% 4.84% 4.03% 3.23% 3.55% 3.93%5.98% 5.05% 6.78% 5.19% 6.80% 7.07% 5.40% 6.48%
68.22% 78.05% 68.19% 66.94% 71.42% 76.89% 79.05% 74.24%
Dec 25, 2012 Dec 26, 2012 Dec 27, 2012 Dec 28, 2012 Dec 29, 2012 Dec 30, 2012 Dec 31, 2012
3.42% 4.00%24.27% 23.44%5.60% 4.73%7.85% 6.50%
58.87% 61.33%
4.24% 3.30% 3.19% 3.05% 2.87%22.20% 22.64% 18.55% 16.60% 17.47%5.34% 5.95% 5.09% 4.76% 5.36%6.65% 8.03% 6.28% 4.64% 6.82%
61.57% 60.09% 66.89% 70.94% 67.48%
Average share of Short form content
July 1st- October 31st
Average share of Short form content Dec 25 - 27
7.97% 39.41%

Appendix: Data Tables
20GLOBAL VIDEO INDEX: 2012 YEAR IN REVIEW
Tablet Video: Share of Total Hours Watched, Christmas 2012
Tablet Share of Total Hours
Watched
Tablet Video Share, Q4 Average
Dec 17, 2012Dec 18, 2012Dec 19, 2012Dec 20, 2012Dec 21, 2012Dec 22, 2012Dec 23, 2012Dec 24, 2012Dec 25, 2012Dec 26, 2012Dec 27, 2012Dec 28, 2012Dec 29, 2012Dec 30, 2012Dec 31, 2012
2.64% 3.07%2.82% 3.07%2.49% 3.07%2.27% 3.07%2.29% 3.07%3.59% 3.07%4.24% 3.07%3.82% 3.07%5.33% 3.07%3.89% 3.07%3.34% 3.07%3.41% 3.07%4.97% 3.07%4.82% 3.07%3.64% 3.07%
Desktop TabletNet Change in Share% change
-3.46% 2.25%
-3.65% 73.23%
Appendix: Data Tables
21GLOBAL VIDEO INDEX: 2012 YEAR IN REVIEW
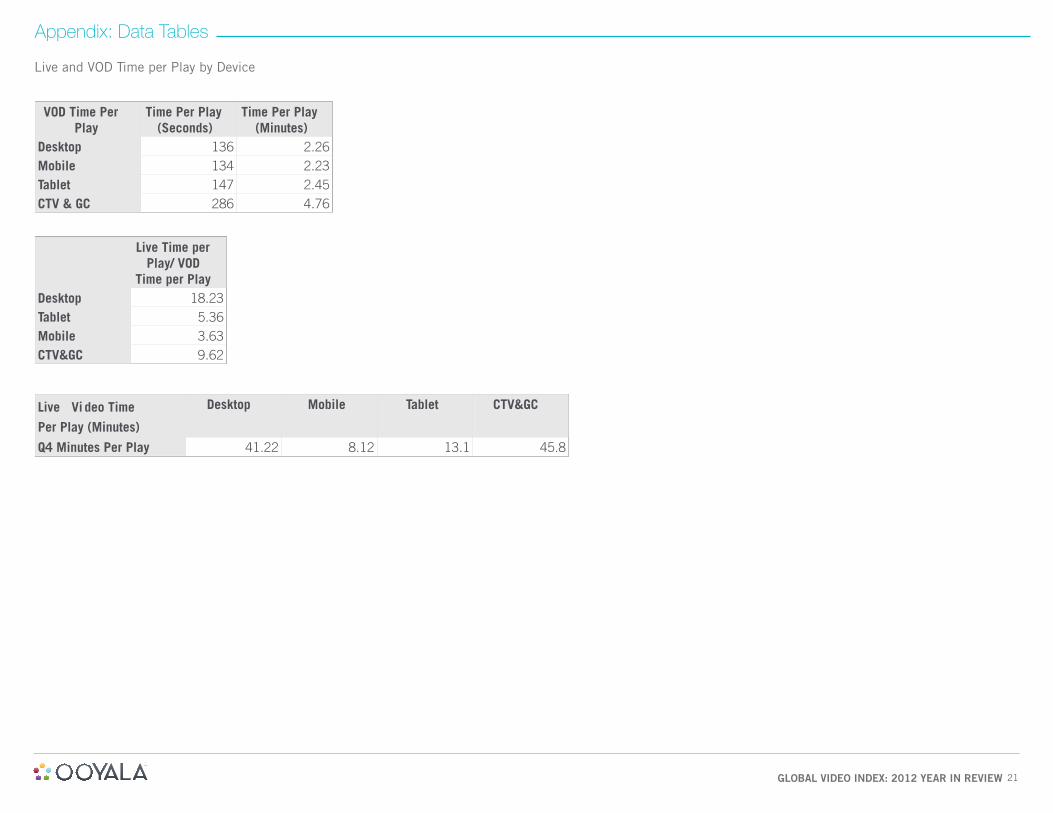
Live and VOD Time per Play by Device
VOD Time Per Play
Time Per Play (Seconds)
Time Per Play (Minutes)
DesktopMobileTabletCTV & GC
136 2.26134 2.23147 2.45286 4.76
DesktopTabletMobileCTV&GC
Live Time per Play/ VOD
Time per Play18.235.363.639.62
Live Vi deo Time
Per Play (Minutes)
Desktop Mobile Tablet CTV&GC
Q4 Minutes Per Play 41.22 8.12 13.1 45.8

Appendix: Data Tables
22GLOBAL VIDEO INDEX: 2012 YEAR IN REVIEW
Mobile and Tablet Video Share of All Hours Watched Online, 2012
Mobile 110.09%Tablet 86.62%
Devic rowth of Median Share
of Time Watched from
January to December
2012
e g Median Share by Device (Top 150
Providers)
Tablet Mobile Tablet + Mobile
JanuaryFebruaryMarchAprilMayJuneJulyAugustSeptemberOctoberNovemberDecember
1.99% 2.16% 4.15%2.49% 2.70% 5.19%2.26% 3.02% 5.28%2.72% 3.61% 6.33%2.85% 3.63% 6.48%3.35% 3.91% 7.27%3.88% 4.22% 8.10%3.39% 4.32% 7.72%3.70% 4.27% 7.96%3.50% 4.00% 7.50%3.14% 4.29% 7.43%3.71% 4.54% 8.25%

Appendix: Data Tables
23GLOBAL VIDEO INDEX: 2012 YEAR IN REVIEW
Mobile Video: Android vs. iOS Share of Time Played Online, 2012
Mobile Video Android vs.
iOS
Median Android Share of
Mobile Video Time Played
Median iOS Share of
Mobile Video Time Played
Jan 2, 2012Jan 9, 2012Jan 16, 2012Jan 23, 2012Jan 30, 2012Feb 6, 2012Feb 13, 2012Feb 20, 2012Feb 27, 2012Mar 5, 2012Mar 12, 2012Mar 19, 2012Mar 26, 2012Apr 2, 2012Apr 9, 2012Apr 16, 2012Apr 23, 2012
32.88%32.87%33.17%29.29%31.71%34.93%31.36%33.95%33.97%35.62%32.49%32.83%31.53%30.78%35.93%35.77%33.23%
67.12%67.13%66.83%70.71%68.29%65.07%68.64%66.05%66.03%64.38%67.51%67.17%68.47%69.22%64.07%64.23%66.77%
Apr 30, 2012May 7, 2012May 14, 2012May 21, 2012May 28, 2012Jun 4, 2012Jun 11, 2012Jun 18, 2012Jun 25, 2012Jul 2, 2012Jul 9, 2012Jul 16, 2012Jul 23, 2012Jul 30, 2012Aug 6, 2012Aug 13, 2012Aug 20, 2012
36.56%34.91%34.60%31.98%36.13%31.92%33.89%32.54%33.08%31.76%34.15%31.42%34.00%34.24%36.58%33.98%34.80%
63.44%65.09%65.40%68.02%63.87%68.08%66.11%67.46%66.92%68.24%65.85%68.58%66.00%65.76%63.42%66.02%65.20%
Aug 27, 2012Sep 3, 2012Sep 10, 2012Sep 17, 2012Sep 24, 2012Oct 1, 2012Oct 8, 2012Oct 15, 2012Oct 22, 2012Oct 29, 2012Nov 5, 2012Nov 12, 2012Nov 19, 2012Nov 26, 2012Dec 3, 2012Dec 10, 2012Dec 17, 2012Dec 24, 2012Dec 31, 2012
31.68%31.06%31.73%33.97%33.45%37.07%35.60%35.29%34.32%32.71%34.22%29.39%30.61%31.41%29.40%33.96%34.97%35.70%33.87%
68.32%68.94%68.27%66.03%66.55%62.93%64.40%64.71%65.68%67.29%65.78%70.61%69.39%68.59%70.60%66.04%65.03%64.30%66.13%

Appendix: Data Tables
24GLOBAL VIDEO INDEX: 2012 YEAR IN REVIEW
Time Watched By Video Length & Device, Q4 2012
% Of All Hours Watched by
Length (Minutes) Q4 2012
Desktop Mobile Tablet CTV&GC
less than 11 to 33 to 66 to 10greater than 10less than 10 minutes10 to 3030 to 60greater than 60
3.52% 4.03% 3.33% 1.25%16.48% 24.90% 15.53% 7.61%15.81% 17.86% 11.20% 3.91%7.24% 9.58% 6.96% 5.57%
56.95% 43.64% 62.98% 81.66%43.05% 56.36% 37.02% 18.34%
11.88% 14.70% 9.89% 16.87%20.76% 15.59% 21.45% 27.66%24.31% 13.34% 31.65% 37.12%
53.9%
Percent of Long Form Video Views by Device
Desktop Mobile Tablet CTV&GC
Q1 2012Q2 2012Q3 2012Q4 2012
41.1% 46% 88.5%62% 48% 67% 93%
59.9% 47.6% 71.2% 93.8%57.0% 43.6% 63.0% 81.7%

Appendix: Data Tables
25GLOBAL VIDEO INDEX: 2012 YEAR IN REVIEW
Viewer Engagement by Device
Engagement by Device, Q4
2012
25% 50% 75% 100%
DesktopMobileTabletCTV & GC
58.85% 52.17% 47.45% 41.10%59.62% 51.55% 45.76% 32.88%71.05% 62.01% 53.19% 38.06%63.27% 57.29% 52.78% 44.61%
Playthrough by Device, Length -
Q4, 2012DesktopMobileTabletCTV & GC
< 1 min1 - 3 min3 - 6 min6 - 10 min> 10 min
63.98% 52.08% 31.66% 43.37% 26.80%51.08% 43.86% 32.78% 31.19% 22.34%71.62% 59.46% 46.98% 46.76% 39.24%76.93% 73.10% 62.36% 62.32% 35.30%

Appendix: Methodology
26GLOBAL VIDEO INDEX: 2012 YEAR IN REVIEW
methodology
DATA SOURCES & SAMPLE SIZE
The data sample used in this report covers 2012, from January 1 through December 31. All data was taken from an anonymous cross-section of Ooyala’s global customer and partner database—an array of broadcasters, studios, cable operators, print publications, online media companies and consumer brands.
These firms broadcast video to over 130 different countries from more than 6,000 unique domains. Nearly 200 million unique viewers watch an Ooyala-powered video every month.
This data sample is not intended to represent the entire Internet, or all online video viewers.
DATA COLLECTION
Ooyala’s video analytics technology collects all anonymized video data in real time.
During playback, Ooyala’s video player gathers information continuously and relays it to an analytics module, which then stores the data in a distributed file system, Hadoop.
Viewer statistics are then compiled and stored in a Cassandra data cluster, where the information is made readily available for analysis.
ANALYSIS & METRICS
Ooyala’s video analytics module tracks a range of standard variables, such as:
Displays, plays and time watched
Viewer engagement and video completion rates
Sharing by social network
Geography (region, state, city, Designated Marketing Areas)
Device type (mobile, desktop, tablet, connected TV devices and game consoles)
Operating system (Windows, Android, iOS)
Browser (Safari, Chrome, Firefox, Internet Explorer)
Appendix: Glossary/Disclaimers & Assumptions
27GLOBAL VIDEO INDEX: 2012 YEAR IN REVIEW
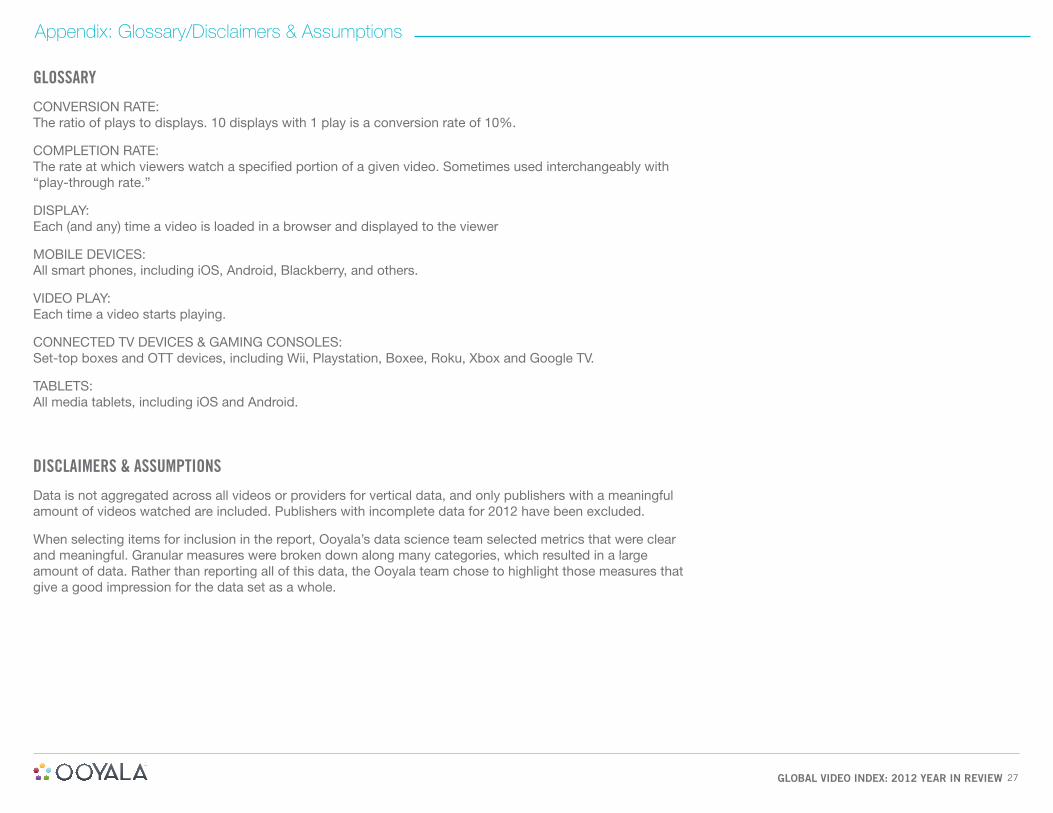
gloSSary
CONVERSION RATE: The ratio of plays to displays. 10 displays with 1 play is a conversion rate of 10%.
COMPLETION RATE: The rate at which viewers watch a specified portion of a given video. Sometimes used interchangeably with “play-through rate.”
DISPLAY: Each (and any) time a video is loaded in a browser and displayed to the viewer
MOBILE DEVICES: All smart phones, including iOS, Android, Blackberry, and others.
VIDEO PLAY: Each time a video starts playing.
CONNECTED TV DEVICES & GAMING CONSOLES: Set-top boxes and OTT devices, including Wii, Playstation, Boxee, Roku, Xbox and Google TV.
TABLETS: All media tablets, including iOS and Android.
diSclaimerS & aSSumptionS
Data is not aggregated across all videos or providers for vertical data, and only publishers with a meaningful amount of videos watched are included. Publishers with incomplete data for 2012 have been excluded.
When selecting items for inclusion in the report, Ooyala’s data science team selected metrics that were clear and meaningful. Granular measures were broken down along many categories, which resulted in a large amount of data. Rather than reporting all of this data, the Ooyala team chose to highlight those measures that give a good impression for the data set as a whole.
![VIDEO INDEX REPORT - Ooyalago.ooyala.com/rs/OOYALA/images/Ooyala-Video-Index-Report... · 2020. 10. 1. · *VUULJ[LK ;= KL]PJLZ HUK NHTL JVUZVSLZ HYL [HRPUN VMM. Video plays tripled](https://static.fdocuments.us/doc/165x107/6082a6a4b545de41905f7274/video-index-report-2020-10-1-vuuljlk-klpjlz-huk-nhtl-jvuzvslz-hyl-hrpun.jpg)