The Economic Impact of Licensed Commercialized Inventions ...
Upload
piers-dennisCategory
view
219download
0
Global Status of Commercialized Biotech/GM
Crops 2010
Clive James, Chair, ISAAA
Randy A. Hautea, Global Coordinator, ISAAAand Director, ISAAA SEAsiaCenter
Public Forum on Science Communication, April 6, 2011, Biopolis, Singapore
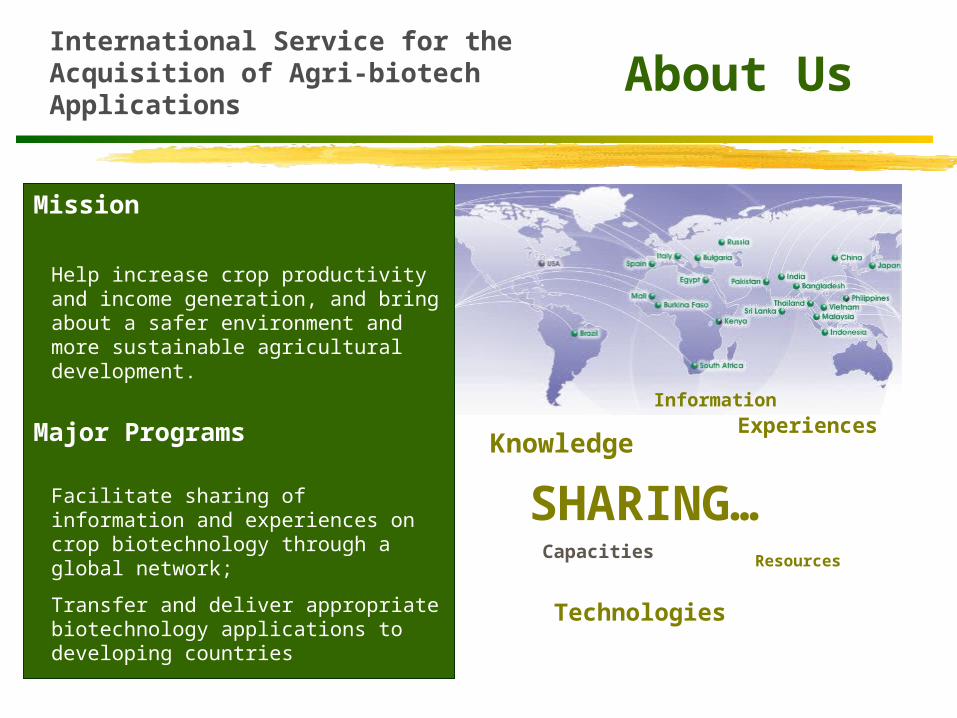
Mission
Help increase crop productivity and income generation, and bring about a safer environment and more sustainable agricultural development.
Major Programs
Facilitate sharing of information and experiences on crop biotechnology through a global network;
Transfer and deliver appropriate biotechnology applications to developing countries
About Us International Service for the Acquisition of Agri-biotech Applications
KnowledgeExperiences
Technologies
Capacities
SHARING…Resources
Information
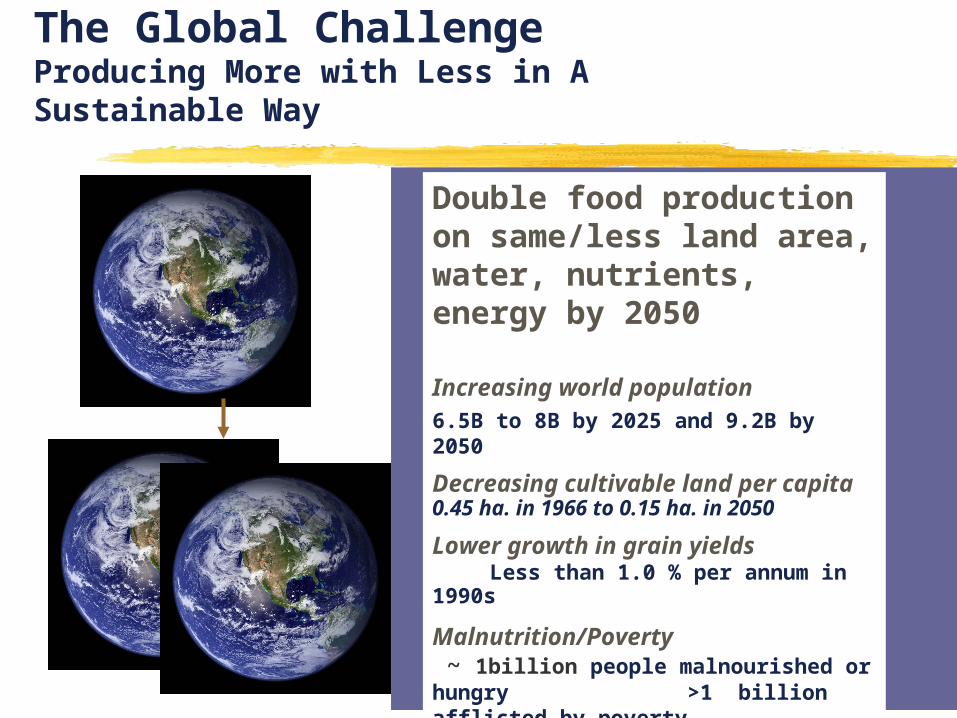
Double food production on same/less land area, water, nutrients, energy by 2050
Increasing world population
6.5B to 8B by 2025 and 9.2B by 2050
Decreasing cultivable land per capita0.45 ha. in 1966 to 0.15 ha. in 2050
Lower growth in grain yields Less than 1.0 % per annum in 1990s
Malnutrition/Poverty ~ 1billion people malnourished or hungry >1 billion afflicted by poverty
Climate change Limited water availability New pests and diseases
The Global ChallengeProducing More with Less in A Sustainable Way
0
200
400
600
800
1000
1200
Janu
ary F M A M
J20
06 J A S O N D
Janu
ary F M A M
J20
07 J A S O N D
Janu
ary F M A M
J20
08 J A S O N
DJa
nuar
y F M A MJ
200
9 J A S O N D
Janu
ary F M A M
J20
10 J A S O N D
Rice
, Whe
at, M
aize
, Soy
bean
in U
S$/m
il to
n,
Co
tton
in U
S$ c
ents
/pou
nd
0
20
40
60
80
100
120
140
Crud
e O
il Pr
ice
in U
S$/B
arre
l
Rice Soybean Wheat Maize Cotton Crude Oil Price
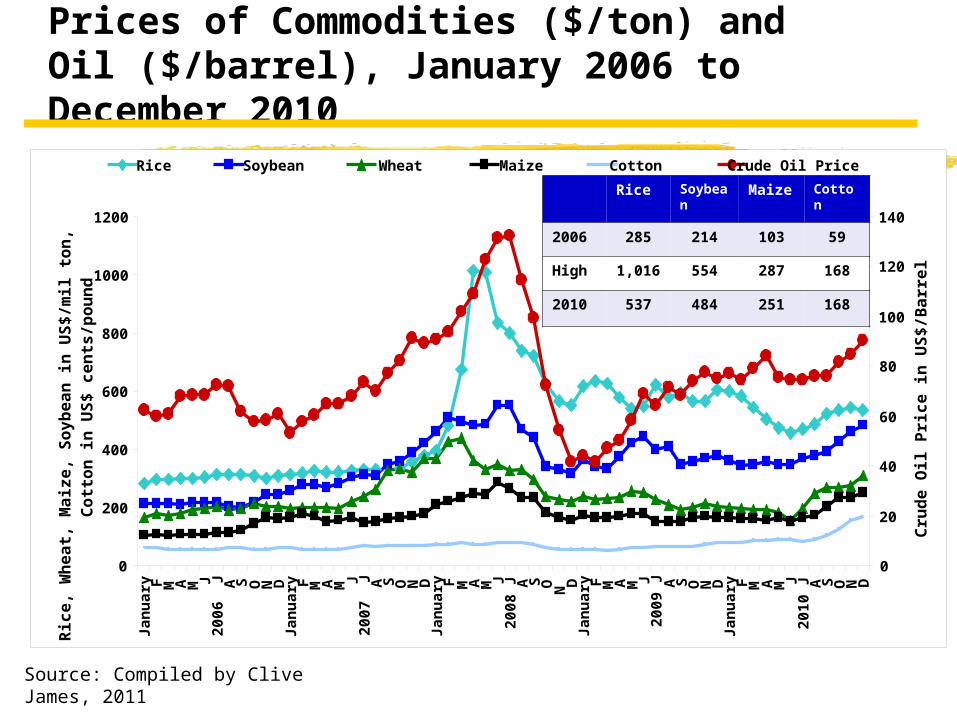
Source: Compiled by Clive James, 2011
Rice Soybean
Maize
Cotton
2006 285 214 103 59
High 1,016
554 287 168
2010 537 484 251 168
Prices of Commodities ($/ton) and Oil ($/barrel), January 2006 to December 2010
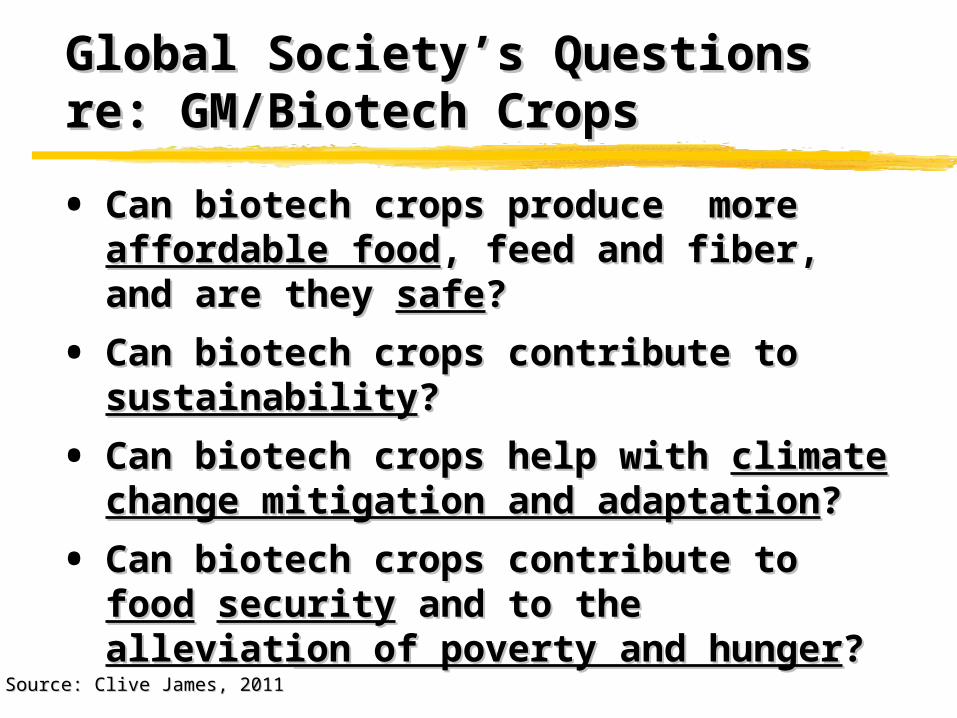
• Can biotech crops produce more Can biotech crops produce more affordable affordable foodfood, feed and fiber, and are they , feed and fiber, and are they safesafe??
• Can biotech crops contribute to Can biotech crops contribute to sustainabilitysustainability? ?
• Can biotech crops help with Can biotech crops help with climate change climate change mitigation and adaptationmitigation and adaptation??
• Can biotech crops contribute to Can biotech crops contribute to foodfood securitysecurity and to the and to the alleviation of poverty and alleviation of poverty and hungerhunger? ?
Global Society’s Questions re: Global Society’s Questions re: GM/Biotech CropsGM/Biotech Crops
Source: Clive James, 2011Source: Clive James, 2011
ADOPTIONADOPTION
OFOF
BIOTECH CROPSBIOTECH CROPS
1996 - 20101996 - 2010
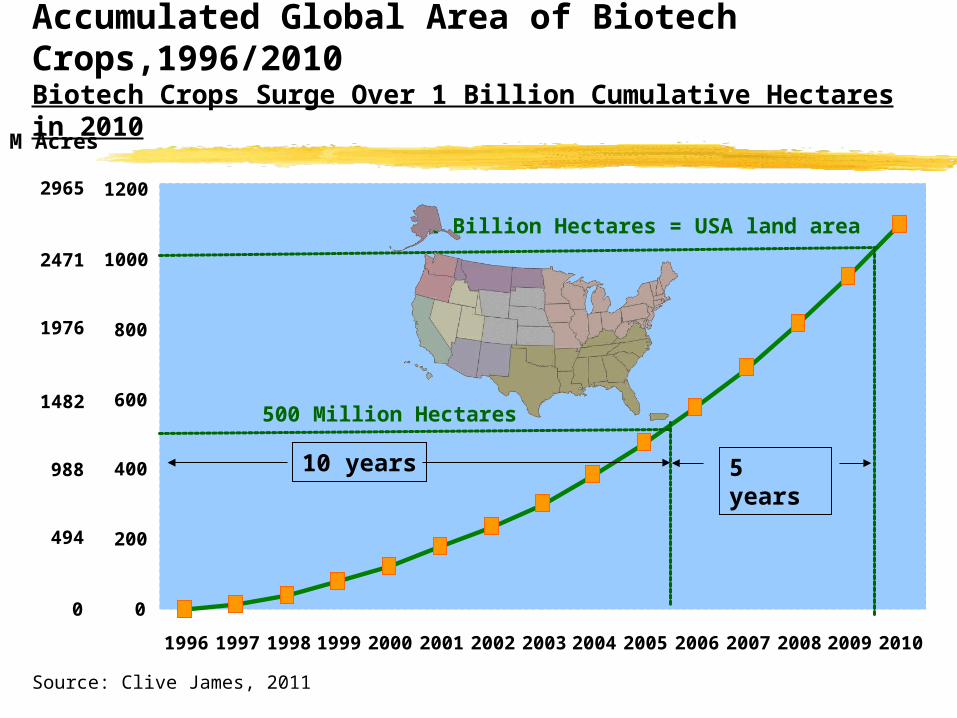
Accumulated Global Area of Biotech Crops,1996/2010Biotech Crops Surge Over 1 Billion Cumulative Hectares in 2010
Source: Clive James, 2011
0
200
400
600
800
1000
1200
1996 1997 1998 1999 2000 2001 2002 2003 2004 2005 2006 2007 2008 2009 2010
0
494
988
1482
2471
1976
2965
M Acres
500 Million Hectares
1 Billion Hectares = USA land area
10 years 5 years

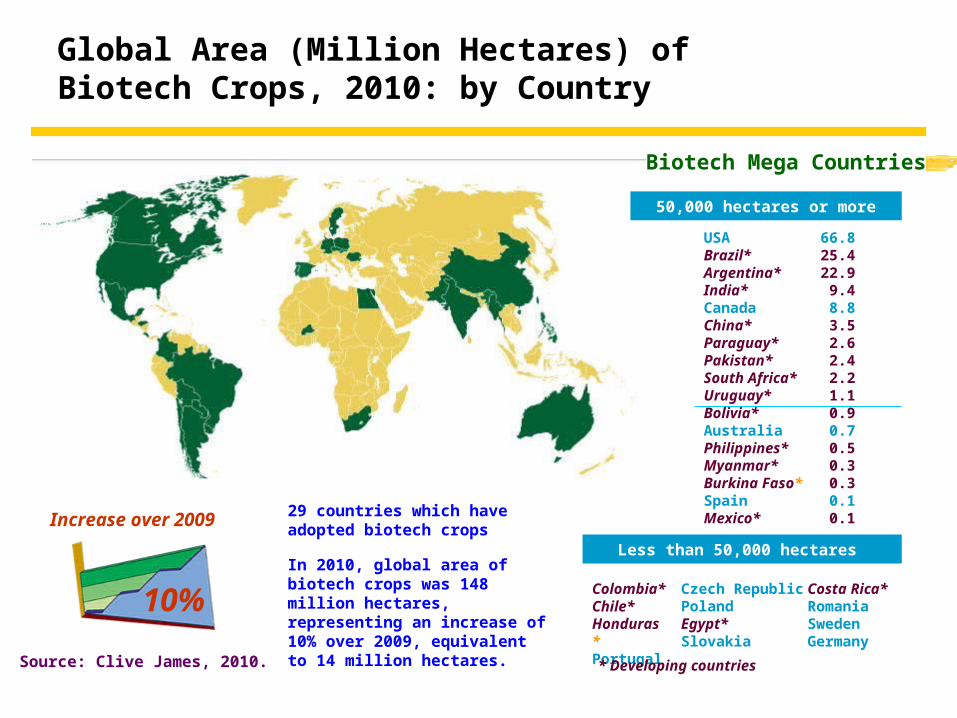
Increase over 2009 29 countries which have adopted biotech crops
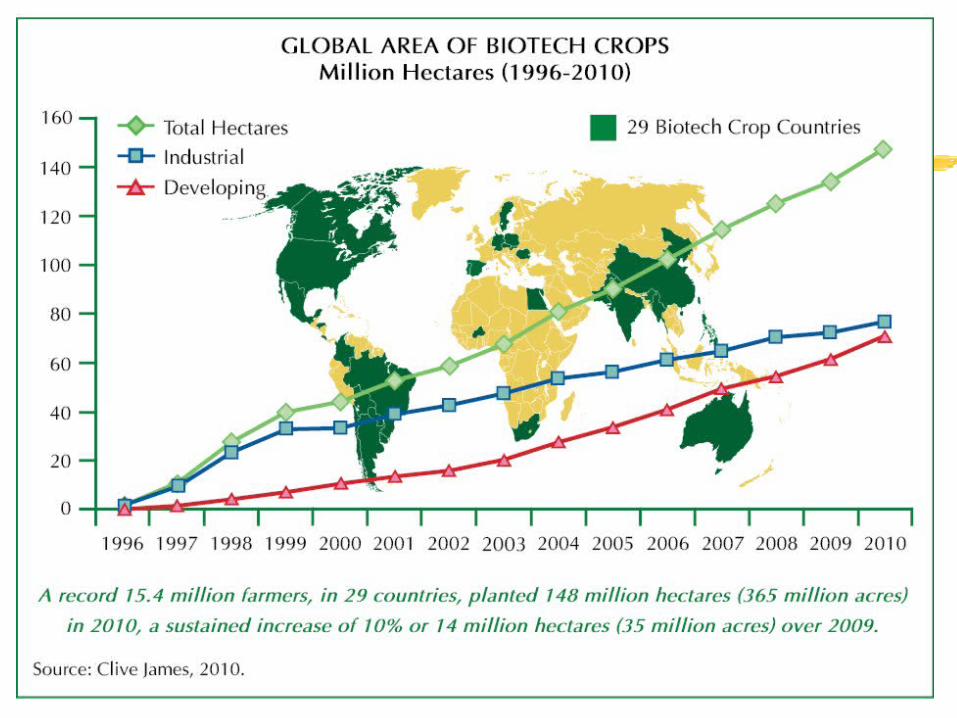
In 2010, global area of biotech crops was 148 million hectares, representing an increase of 10% over 2009, equivalent to 14 million hectares.
Source: Clive James, 2010.
Biotech Mega Countries
50,000 hectares or more
USABrazil*Argentina*India*CanadaChina*Paraguay*Pakistan*South Africa*Uruguay*Bolivia*AustraliaPhilippines*Myanmar*Burkina Faso*SpainMexico*
66.825.422.9
9.48.83.52.62.42.21.10.90.70.50.30.30.10.1
Less than 50,000 hectares
Colombia*Chile*Honduras*Portugal
Czech RepublicPolandEgypt*Slovakia
* Developing countries
Costa Rica*RomaniaSwedenGermany
Global Area (Million Hectares) of Biotech Crops, 2010: by Country
10%
Source: Clive James, 2010
0
20
40
60
80
100
120
140
160
180
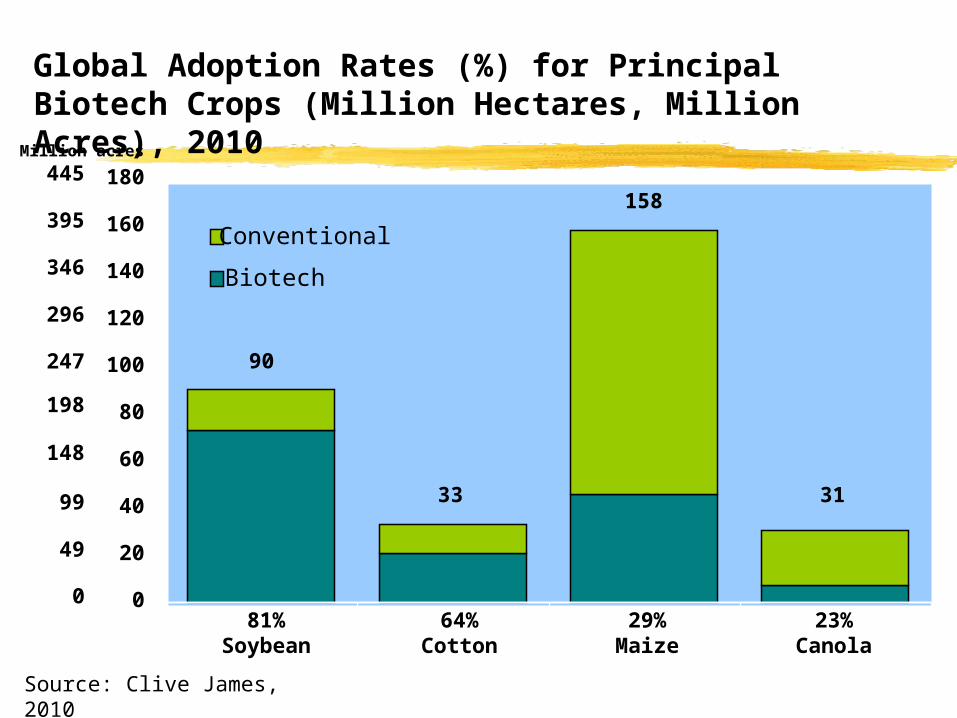
81%Soybean
64%Cotton
29%Maize
23%Canola
90
33
158
31
Conventional
Biotech
0
49
99
148
198
247
296
346
395
445Million acres
Global Adoption Rates (%) for PrincipalBiotech Crops (Million Hectares, Million Acres), 2010
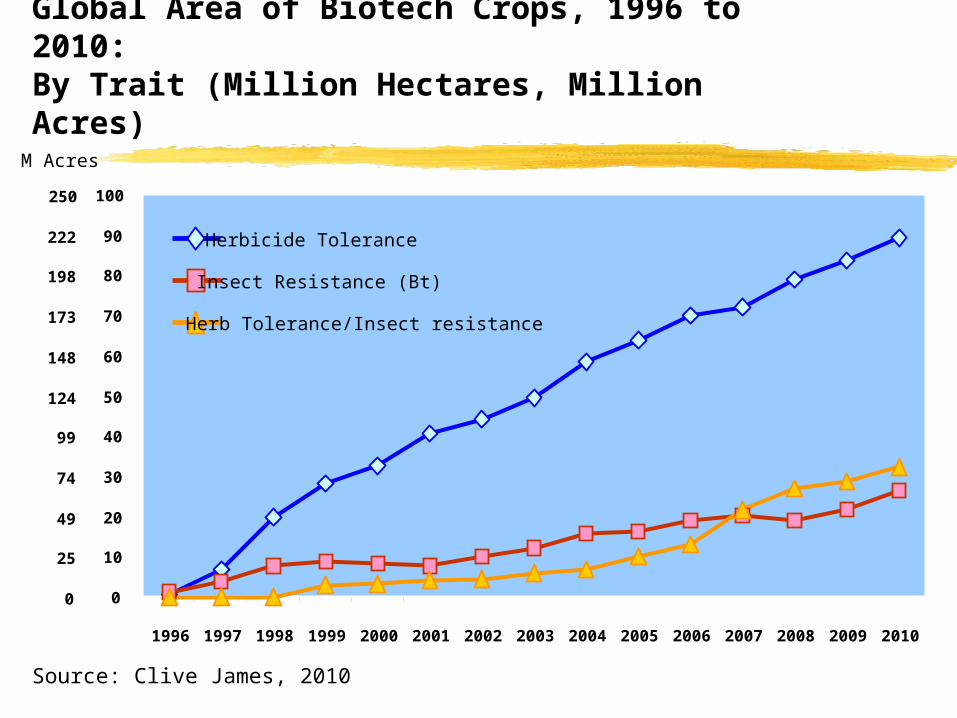
Global Area of Biotech Crops, 1996 to 2010:By Trait (Million Hectares, Million Acres)
Source: Clive James, 2010
0
10
20
30
40
50
60
70
80
90
100
1996 1997 1998 1999 2000 2001 2002 2003 2004 2005 2006 2007 2008 2009 2010
0
25
49
74
99
124
148
173
198
222
250
Herbicide Tolerance
Insect Resistance (Bt)
Herb Tolerance/Insect resistance
M Acres
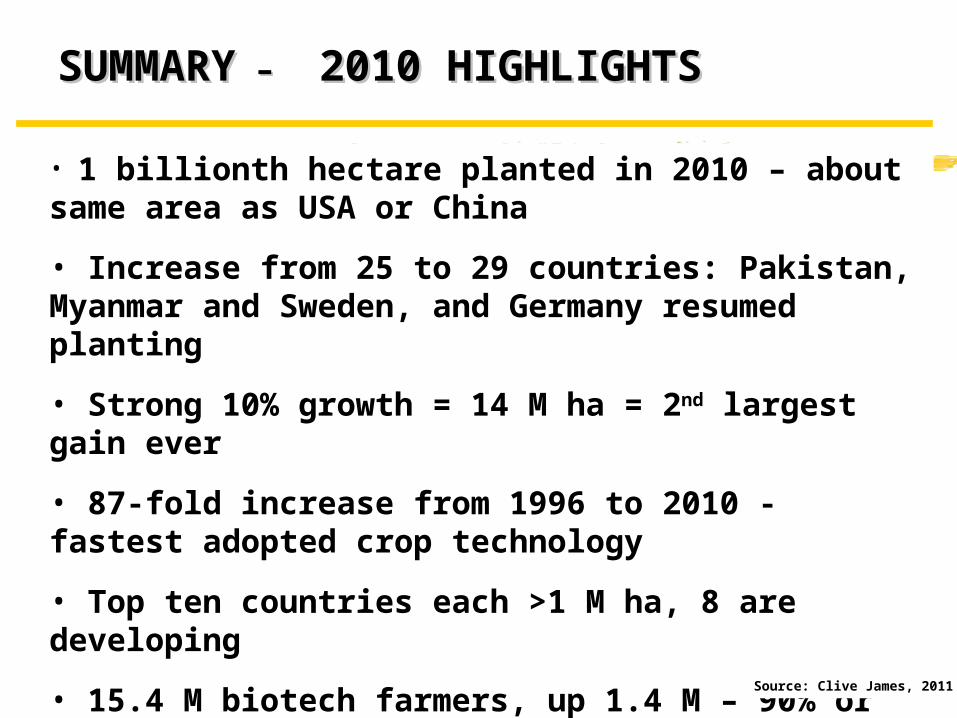
• 1 billionth hectare planted in 2010 – about same area as USA or China
• Increase from 25 to 29 countries: Pakistan, Myanmar and Sweden, and Germany resumed planting
• Strong 10% growth = 14 M ha = 2nd largest gain ever
• 87-fold increase from 1996 to 2010 - fastest adopted crop technology
• Top ten countries each >1 M ha, 8 are developing
• 15.4 M biotech farmers, up 1.4 M – 90% or 14.4 million were small and resource-poor farmers
• Stacked traits – 11 countries, 32 M ha (22%)
SUMMARYSUMMARY –– 2010 HIGHLIGHTS 2010 HIGHLIGHTS
Source: Clive James, 2011
IMPACT OF GM/BIOTECH IMPACT OF GM/BIOTECH CROPS CROPS
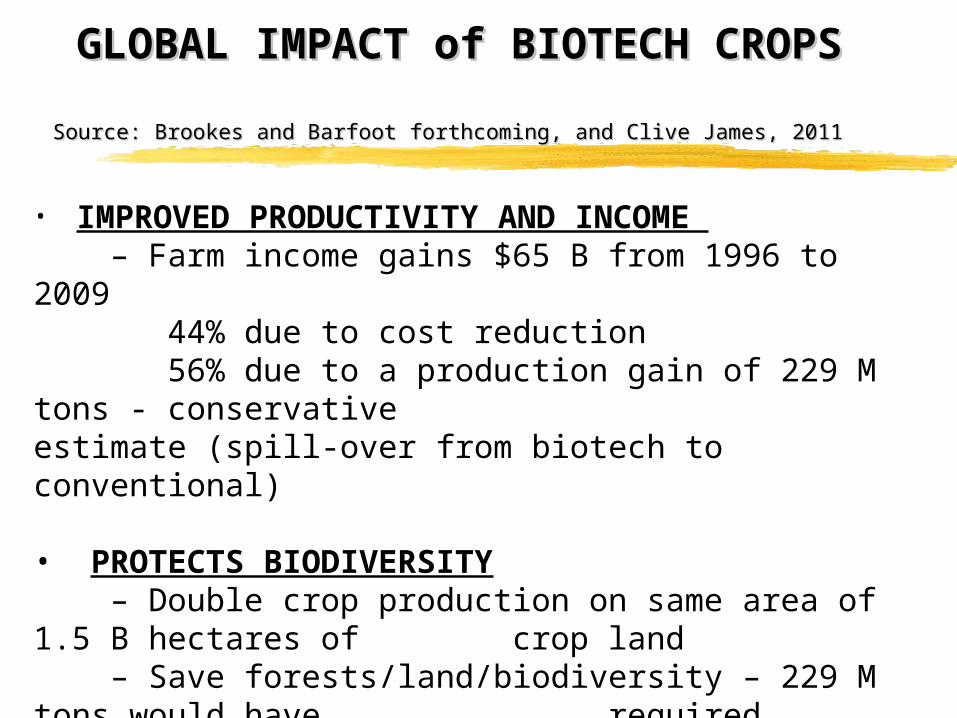
• IMPROVED PRODUCTIVITY AND INCOME – Farm income gains $65 B from 1996 to 2009 44% due to cost reduction 56% due to a production gain of 229 M tons - conservative estimate (spill-over from biotech to conventional) • PROTECTS BIODIVERSITY – Double crop production on same area of 1.5 B hectares of
crop land – Save forests/land/biodiversity – 229 M tons would have
required additional 75 M ha of land to till– Enhanced farm ecology
GLOBAL IMPACT of BIOTECH CROPS GLOBAL IMPACT of BIOTECH CROPS Source: Brookes and Barfoot forthcoming, and Clive James, 2011Source: Brookes and Barfoot forthcoming, and Clive James, 2011
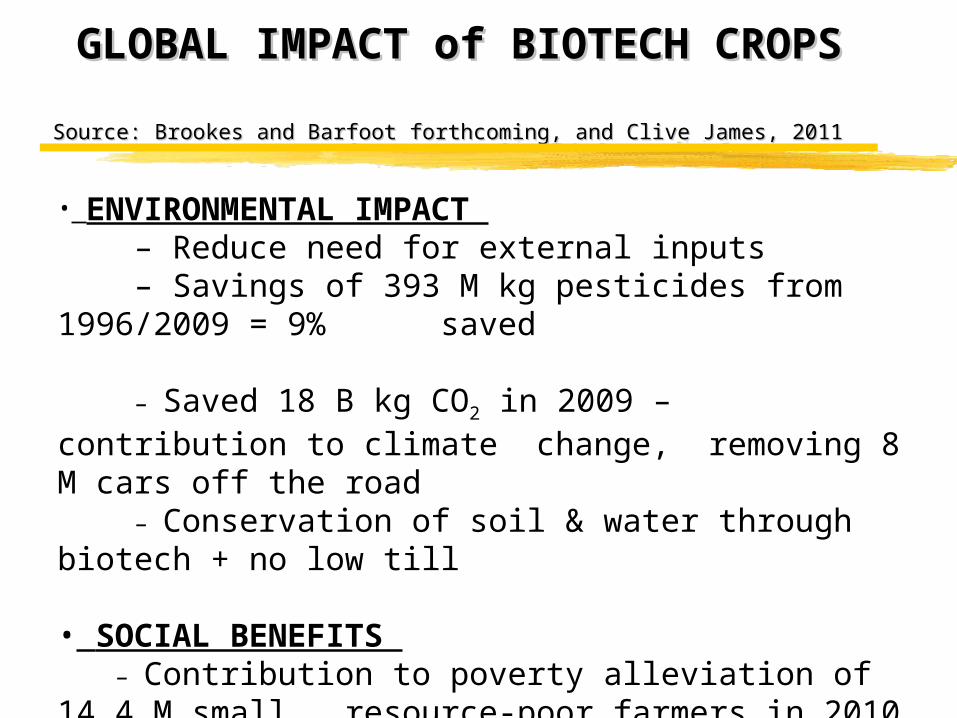
• ENVIRONMENTAL IMPACT – Reduce need for external inputs – Savings of 393 M kg pesticides from 1996/2009 = 9% saved – Saved 18 B kg CO2 in 2009 – contribution to climate
change, removing 8 M cars off the road – Conservation of soil & water through biotech + no low till
• SOCIAL BENEFITS – Contribution to poverty alleviation of 14.4 M small resource-poor farmers in 2010 & welfare benefits emerging.
GLOBAL IMPACT of BIOTECH CROPS GLOBAL IMPACT of BIOTECH CROPS Source: Brookes and Barfoot forthcoming, and Clive James, 2011Source: Brookes and Barfoot forthcoming, and Clive James, 2011
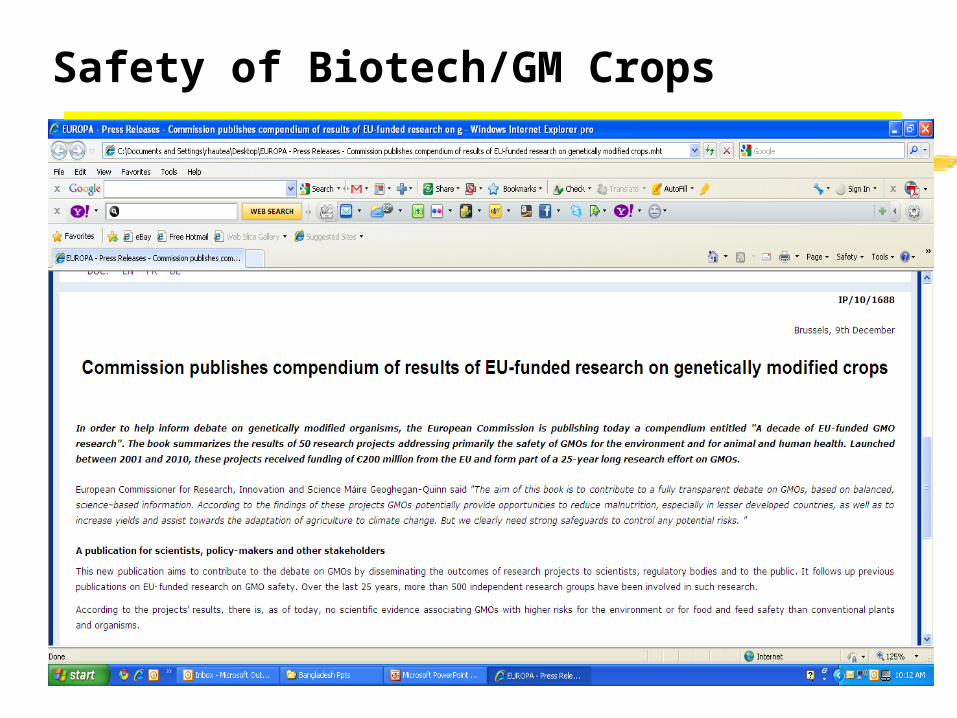
Safety of Biotech/GM Crops
THE FUTURETHE FUTURE
2011 - 2015, 2011 - 2015,
THE REMANING FIVE YEARS OF THE THE REMANING FIVE YEARS OF THE SECOND DECADE OF SECOND DECADE OF
COMMERCIALIZATION COMMERCIALIZATION
2015, The Millennium Development Goals Year2015, The Millennium Development Goals Year
Key Requirements for SuccessKey Requirements for Success
• POLITICAL WILL POLITICAL WILL
• ACCESS TO NEW & IMPROVED ACCESS TO NEW & IMPROVED BIOTECH CROPSBIOTECH CROPS
• APPROPRIATE AND EFFICIENT APPROPRIATE AND EFFICIENT REGULATION IN DEV. COUNTRIESREGULATION IN DEV. COUNTRIES
TheThe Future –Future – 2011-15 2011-15
Source: Clive James, 2011Source: Clive James, 2011
• Many new crop/trait options will be ready before 2015 Many new crop/trait options will be ready before 2015
• Drought tolerance – principal traitDrought tolerance – principal trait –– maize in US 2012 maize in US 2012
• Biotech rice Biotech rice –– major crop, up to 1 billion beneficiaries major crop, up to 1 billion beneficiaries
• Quality traits Quality traits –– Golden Rice in 2013, omega-3, others Golden Rice in 2013, omega-3, others
• More biotech crops developed by countries from the More biotech crops developed by countries from the South in public inst. – more South-South cooperation South in public inst. – more South-South cooperation
• Biotech applications for “Speeding the breeding”Biotech applications for “Speeding the breeding” –– MAS and biotech crops, to provide a faster response MAS and biotech crops, to provide a faster response to more severe and rapid changes in climate changeto more severe and rapid changes in climate change
• Asia will grow more in 2nd decade than first decadeAsia will grow more in 2nd decade than first decade
The Future The Future –– 2011-2015. A WAVE OF 2011-2015. A WAVE OF NEW & IMPROVED BIOTECH CROPSNEW & IMPROVED BIOTECH CROPS
Source: Clive James, 2011Source: Clive James, 2011
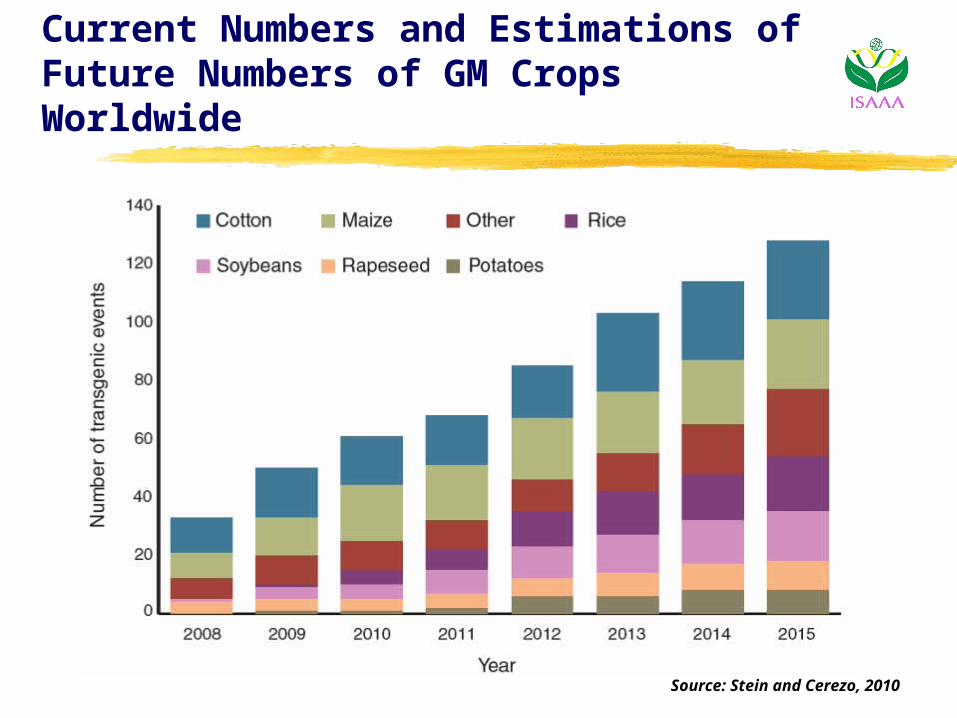
Current Numbers and Estimations of Future Numbers of GM Crops Worldwide
Source: Stein and Cerezo, 2010
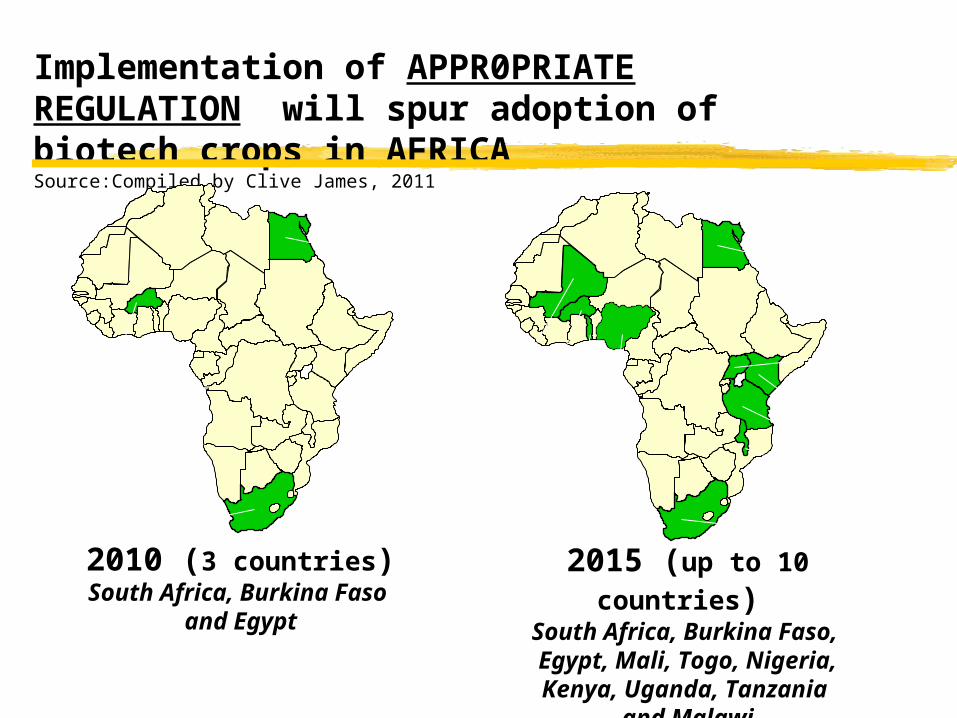
Implementation of APPR0PRIATE REGULATION will spur adoption of biotech crops in AFRICA Source:Compiled by Clive James, 2011
2010 (3 countries)South Africa, Burkina Faso
and Egypt
2015 (up to 10 countries) South Africa, Burkina Faso, Egypt, Mali, Togo, Nigeria, Kenya, Uganda, Tanzania
and Malawi
EGYPT
BURKINAFASO
SOUTHAFRICA
NIGERIA
KENYA
UGANDA
MALAWI
BURKINAFASO
TOGO
SOUTHAFRICA
EGYPT
TANZANIA
MALI
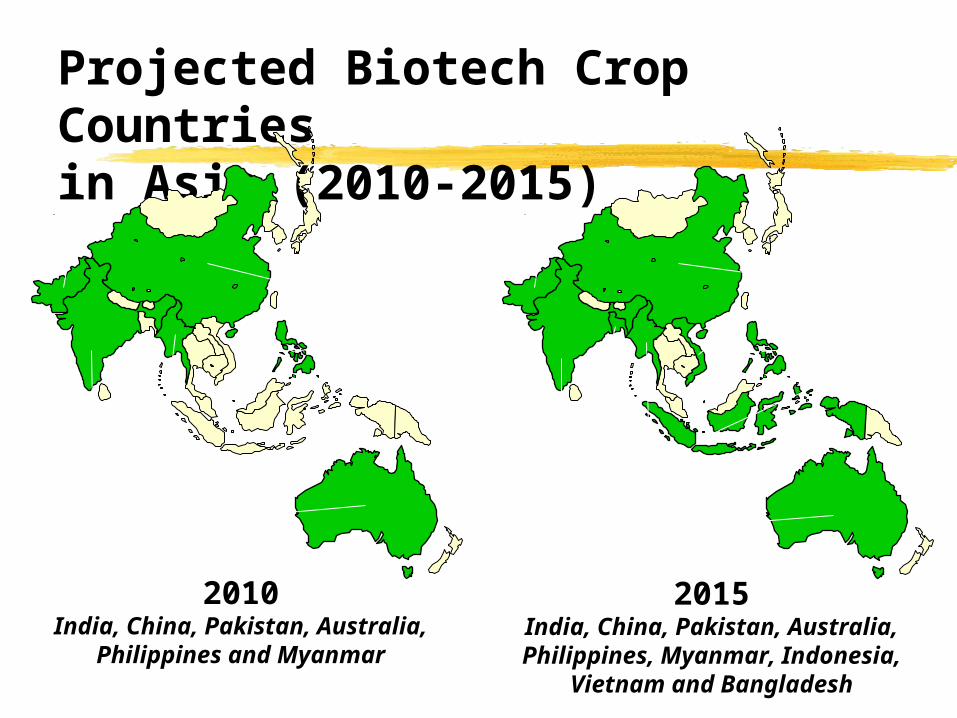
Projected Biotech Crop Countriesin Asia (2010-2015)
2010India, China, Pakistan, Australia,
Philippines and Myanmar
CHINA
PHILIPPINES
AUSTRALIA
MYANMARINDIA
PAKISTAN
2015India, China, Pakistan, Australia, Philippines, Myanmar, Indonesia,
Vietnam and Bangladesh
CHINA
PHILIPPINES
AUSTRALIA
MYANMAR
INDIA
PAKISTAN
BANGLADESH
VIETNAM
INDONESIA
Source: Clive James, 2011
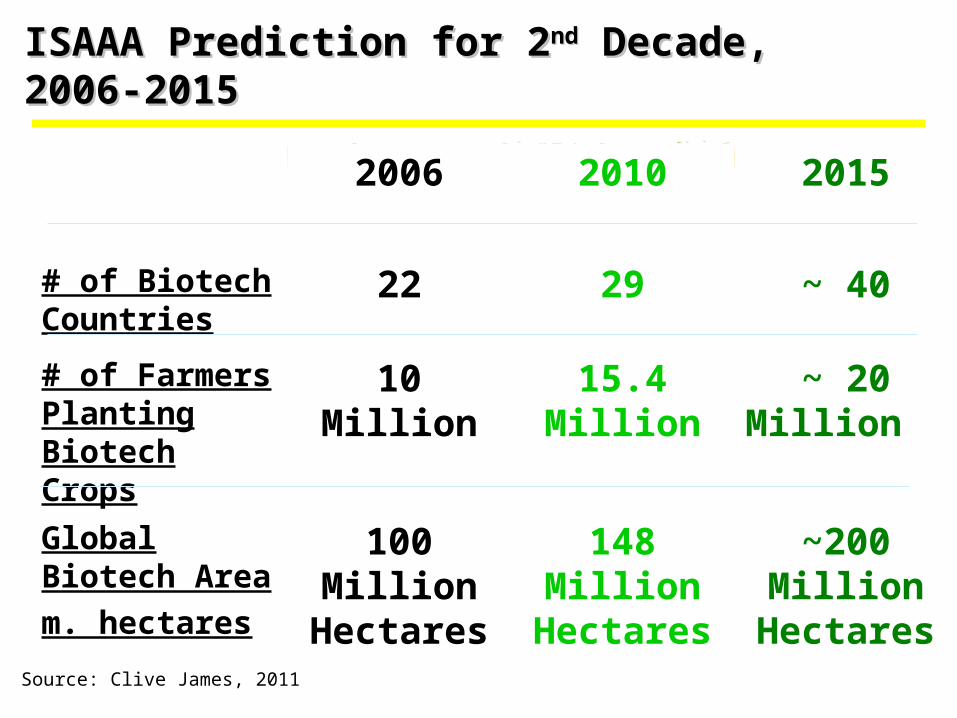
ISAAA Prediction for 2ISAAA Prediction for 2ndnd Decade, 2006-2015 Decade, 2006-2015
2006 2010 2015
# of Biotech Countries
22 29 ~ 40
# of Farmers Planting Biotech Crops
10 Million 15.4 Million ~ 20 Million
Global Biotech Area
m. hectares
100 Million Hectares
148 Million Hectares
~200 Million
Hectares