The Economic Impact of Licensed Commercialized Inventions ...
53
The Economic Impact of Licensed Commercialized Inventions Originating in University Research, 1996-2007 Final Report to the Biotechnology Industry Organization September 3, 2009 Project Team: David Roessner, Jennifer Bond, Sumiye Okubo, Mark Planting
Transcript of The Economic Impact of Licensed Commercialized Inventions ...

The Economic Impact of Licensed Commercialized Inventions Originating in University Research, 1996-2007
Final Report 8/31/09 Page 0
The Economic Impact of Licensed
Commercialized Inventions
Originating in University Research,
1996-2007
Final Report to the Biotechnology Industry Organization September 3, 2009
Project Team: David Roessner, Jennifer Bond, Sumiye Okubo, Mark Planting

The Economic Impact of Licensed Commercialized Inventions Originating in University Research, 1996-2007
Final Report 9/3/09 Page 1
Table of Contents
Table of Contents .......................................................................................................................1
Project Team ..............................................................................................................................2
Acknowledgments ......................................................................................................................2
EXECUTIVE SUMMARY................................................................................................................3
Project Overview ......................................................................................................................10
Economic Significance of University Research: History and Trends ..........................................12
Empirical Evidence of the Economic Impact of University Research and Licensing ..................20
Estimating the Economic Impact of University Licensing .........................................................22
Using the I-O Model to Assess the Impact of University Licensing ..........................................22
Estimating the Total Annual Economic Impact of University-Licensed Products .....................23
The Data ...............................................................................................................................25
Results ......................................................................................................................................32
Impact Estimates, Basic Model ..............................................................................................32
GDP Impact Estimates, Accounting for Product Substitution Effects ......................................36
Summary and Discussion ..........................................................................................................38
References ................................................................................................................................42
Appendix A Empirical Evidence of the Economic Impact of University Research and Licensing:
an Overview of the Literature ..................................................................................................45
Appendix B The Bureau of Economic Analysis National Input-Output Model: a Brief
Description ..............................................................................................................................50

The Economic Impact of Licensed Commercialized Inventions Originating in University Research, 1996-2007
Final Report 9/3/09 Page 2
Project Team
This project was conducted by a small group of consultants headed by Dr. David Roessner, Professor of Public Policy Emeritus, Georgia Institute of Technology and Associate Director, Science and Technology Policy Program, SRI International. Other key project team members include Ms. Jennifer Bond, Senior Advisor for International Affairs for the Council on Competitiveness and former Director of the Science & Engineering Indicators Program at the National Science Foundation; Dr. Sumiye Okubo, former Associate Director for Industry Accounts at the Commerce Department’s Bureau of Economic Analysis; and Mr. Mark Planting, former chief of research on the use and development of U.S. input-output accounts at the Bureau of Economic Analysis.
Acknowledgments
We owe substantial debts of gratitude to many people who made this project possible, especially to AUTM members and staff who helped us obtain estimates of royalty rates charged on deals based on product sales. They include Janna Tom, Anne Chasser, Pat Jones, Dana Bostrom, Lori Pressman, Ashley Stevens, John Fraser, Richard Kordal, Kevin Cullen and Richard Colman. We also thank the respondents from university technology transfer offices who provided information on the royalty rates they charge. Others who helped in a number of other ways include Patricia Cotton, Brian Wright, Maryann Feldman, and Steve Merrill. We are also grateful to Joe Allen and John Ritter, who were instrumental in moving an idea to reality, for introducing us to key staff at BIO, and for their continuing advice and encouragement. Finally, we thank Ted Buckley, Lila Feisee, Tom Dilenge, Margarita Noriega and their colleagues at BIO who provided financial support, encouragement, and hard questions that made this project better than it otherwise would have been. However, all errors of fact or interpretation in this report are ours.

The Economic Impact of Licensed Commercialized Inventions Originating in University Research, 1996-2007
Final Report 9/3/09 Page 3
EXECUTIVE SUMMARY
Study Objectives
University research and research-related activities contribute in many important ways to the
national economy, notably through increased productivity of applied R&D in industry due to
university-developed new knowledge and technical know-how, provision of highly valued
human capital embodied in faculty and students, development of equipment and
instrumentation used by industry in production and research, and creation of concepts and
prototypes for new products and processes. These benefits are enabled primarily through
publications, conferences, information exchange via consulting and collaborative research, and
hiring of trained students. This report develops estimates of the economic impact of just one of
these research-related activities, licensing of university intellectual property, clearly an impact of
major significance for the economy but by no means the largest source of the total impact of
university research.
Methods and Data
There are several relatively sophisticated methods that could be used to estimate the economic
value to the nation of innovations based in university research (e.g. consumer surplus estimates
for specific innovations), but most would require costly data collection and/or threaten the
proprietary interests of innovating firms. This report presents the results of a modest yet
rigorous approach that makes use of existing Association of University Technology Managers
(AUTM) annual survey data and relatively straightforward economic calculations. Using data
from annual AUTM surveys of U.S. universities, it is possible to develop systematic,
conservative estimates of the economic impacts on the United States of twelve years of
university-industry research collaborations. Although “deals” between university technology
licensing offices and private firms take many forms, such as one-time flat fees, taking equity
positions in university-based start-ups, and even in some rare cases donating intellectual
property (IP) to nonprofits for charitable purposes, in many cases universities base licensing
fees on the percentage of sales of new products developed using the university-based IP.
Annual AUTM survey data are available on the licensing income from universities responding to
the survey, typically numbering about 140. Licensing income data by reporting institution are
available from 1996 through 2007. With these data as a base, we combine the AUTM survey
results with other data and employ the Commerce Department’s Bureau of Economic Analysis
(BEA) Input-Output (I-O) model to develop estimates of the annual national economic impact of
university licensed products that have been commercialized and generated sales. These impact
estimates take two forms: the change in gross output of all industries due to the university

The Economic Impact of Licensed Commercialized Inventions Originating in University Research, 1996-2007
Final Report 9/3/09 Page 4
licensed products in the marketplace, and the impact on Gross Domestic Product (GDP) of
university licensed products.
Figure S-1, below, provides a schematic representation of how we calculated annual estimates
of the impact of university-licensed products on the U.S. GDP. Verbally, it is the sum of the
estimated direct impact of university licensed products and the direct impact of university
expenditures of their total (gross) licensing income. The direct impact of university licensed
products is, in turn, derived from the ratio of university licensing income from “running
royalties” to the royalty rates (based on percentage of product sales) charged by universities.
This ratio yields an annual estimate of the additional revenues to firms generated from sales of
products based on university-licensed intellectual property. The I-O model converts this figure
into the changes in income (compensation, indirect business taxes, and gross operating
surplus—i.e., profits) of companies operating under sales-based university licensing
agreements, which together constitutes the contribution to GNP. Also, university expenditures
attributable to licensing income have direct impacts on the economy in two ways: first, via
expenditures of gross royalty income (for salaries, equipment, overhead costs, etc.) and second,
via expenditures of research income from firms that contract for R&D with the university as a
direct consequence of the licensing agreement. This is accounted for by the second term in the
model.

The Economic Impact of Licensed Commercialized Inventions Originating in University Research, 1996-2007
Final Report 9/3/09 Page 5
Figure S-1: Estimating the Total Annual Economic Impact of University-Licensed Products
Where
And
Figure S-2 shows how we estimated the change in gross output of all industries due to the
university licensing of products. Gross output is a measure of economic activity, but is not GDP.
The impact is the sum of sales of companies generated by the licensing agreements plus the
change in output at universities (additional income from licensing plus additional research
funds attributable to the licensing) plus the changes in gross output of all other industries that
directly and indirectly provide inputs to the universities. Note that “institutional expenditures”
represent university licensing income that national accountants classify as consumption
expenditures.
=
=
ADDITIONAL
REVENUES TO
MANUFACTURING
FIRMS RESULTING
FROM SALES OF
PRODUCTS BASED
ON UNIVERSITY
LICENSES
ESTIMATED TOTAL
ANNUAL ECONOMIC
IMPACT OF
UNIVERSITY-
LICENSED
PRODUCTS
ESTIMATED DIRECT
ANNUAL ECONOMIC
IMPACT OF
UNIVERSITY-
LICENSED
PRODUCTS
ESTIMATED DIRECT
ANNUAL ECONOMIC
IMPACT OF
UNIVERSITY
LICENSING
= +
ESTIMATED DIRECT
ANNUAL ECONOMIC
IMPACT OF
UNIVERSITY-
LICENSED
PRODUCTS
=
UNIVERSITY
LICENSING INCOME
FROM RUNNING
ROYALTIES
“TYPICAL” ROYALTY
RATE (% OF PRODUCT
SALES) CHARGED BY
UNIVERSITIES
+
GROSS
ANNUAL
UNIVERSITY
LICENSING
INCOME
I-O
MODEL
CONTRIBU-
TION TO
GDP
ANNUAL
VALUE OF
RESEARCH
CONTRACTS
DUE TO
PRIOR
LICENSES
ESTIMATED DIRECT
ANNUAL ECONOMIC
IMPACT OF
UNIVERSITY
LICENSING

The Economic Impact of Licensed Commercialized Inventions Originating in University Research, 1996-2007
Final Report 9/3/09 Page 6
Figure S-2: Estimating the Annual Impact of University-Licensed Products on Industry Gross
Outputs
Where
And
=
+
GROSS
ANNUAL
UNIVERSITY
LICENSING
INCOME
ANNUAL
VALUE OF
RESEARCH
CONTRACTS
DUE TO
PRIOR
LICENSES
=
ESTIMATED TOTAL
ANNUAL IMPACT OF
UNIVERSITY-
LICENSED PRODUCTS
ON INDUSTRY GROSS
OUTPUT
INSTITUTIONAL
EXPENDITURES
ESTIMATED INDIRECT
ANNUAL ECONOMIC
IMPACT OF
UNIVERSITY LICENSING
ON OTHER INDUSTRIES
= +
INSTITUTIONAL
EXPENDITURES
x
UNIVERSITY OUTPUT
MULTIPLIER(S) FROM BEA
INPUT/OUTPUT TABLES
ESTIMATED INDIRECT
ANNUAL ECONOMIC
IMPACT OF
UNIVERSITY LICENSING
ON OTHER INDUSTRIES
GROSS
ANNUAL
UNIVERSITY
LICENSING
INCOME
ANNUAL
VALUE OF
RESEARCH
CONTRACTS
DUE TO
PRIOR
LICENSES
+
Results1
Impact of University Licensing on GDP. The model generates annual values for sales revenues
with a range of assumptions about royalty rates: 2%, 5%, and 10%; outputs from the I-O model
under these three assumptions; and estimates of the total change in GDP due to university-
licensed product sales under the three royalty rate assumptions. No assumptions are made
here about product substitution rates, and the additional impact generated from university
income from license-related contract R&D is not included in the calculations. Under a
moderately conservative assumption (conservative from the perspective of the magnitude of
model’s impact estimate), a 5% royalty rate, over the 12-year range of our data university
licensing based on product sales contributed $2.6 billion to the U.S. GDP in 1996, and $16.8
1 Tabulations of the data and results summarized here are presented in Tables 4 and 5, pages 32 and 34, of the full report.

The Economic Impact of Licensed Commercialized Inventions Originating in University Research, 1996-2007
Final Report 9/3/09 Page 7
billion in 2007. Under a less conservative but realistic assumption (2% royalty rate), the annual
contribution to GDP ranged from $5.9 billion in 1996 to more than $38.8 billion in 2007.
Without accounting for product substitution effects, we estimate that over the period 1996 to
2007, university licensing agreements based on product sales contributed at least $47 billion
and as much as $187 billion to the U.S. GDP. A moderately conservative estimate based on
5% royalty rates yields a total contribution to GDP for this period of more than $82 billion.
The large range of these estimates illustrates clearly the high sensitivity of our results to
assumptions about the royalty rates charged by universities on license agreements based on
product sales. These results are depicted graphically below.
Impact of University Licensing on Industry Gross Output. Using the model depicted in Figure S-
2, which generates estimates of the contribution to industry gross output due to university-
licensed products, we calculated the total output produced annually by university licensing
revenues, the direct employment generated by these revenues, and the total change in
industry gross outputs due to this licensing activity. We again calculated a range of estimates
based on the royalty rates charged in sales-based licensing agreements. Under a moderately
conservative assumption (5% royalty rates), as a result of university licensing annual industrial
output increased by $6.3 billion in 1996 and by $39.7 billion in 2007. Using a less conservative
assumption (2% royalty rates),2 the annual contribution to industry output grew from $14.7
2 Note that because royalty rates are in the denominator of the model’s calculations, a lower royalty rate yields higher estimated product sales and thus higher economic impact.

The Economic Impact of Licensed Commercialized Inventions Originating in University Research, 1996-2007
Final Report 9/3/09 Page 8
billion in 1996 to nearly $94.9 billion in 2007. Summing over the entire 12 years for which we
have data, we estimate that the total contribution of university licensing to gross industry
output at least $108.5 billion and as much as $457.1 billion (again without accounting for
product substitution effects). A moderately conservative estimate based on 5% royalty rates
yields an estimated impact of university licensing on total industry output over 1996-2007 of
$195.6 billion.
Impact of University Licensing on Employment. The national I-O model, based on empirical
data, also calculates the number of jobs directly created per million dollars of final purchases
and thus provides estimates of the total number of jobs created annually due to university-
licensed products. This ranged from about 9,000 jobs in 1996 to 41,000 in 2007. We estimate
that over the entire 12-year period, university-licensed products created more than 279,000
jobs.
Accounting for Product Substitution Effects in the GDP Impact Estimates. In principle, product
displacement effects could range from 0 percent, when the new product displaces no existing
products or services, to 100 percent, when it completely displaces them. These ranges (rather
than misleading “typical” or “average” values) provide a way to generate conservative
estimates of the increase in GDP due to university licensing of intellectual property, accounting
for the wide range of royalty rates charged by universities and for substitution effects when
new products are first introduced into the marketplace. Given that there are standard ways to
estimate substitution rates for a large portfolio of new products, we used three assumptions:

The Economic Impact of Licensed Commercialized Inventions Originating in University Research, 1996-2007
Final Report 9/3/09 Page 9
5%, 10%, and 50% substitution, with the latter probably excessively conservative. Under a
conservative royalty rate assumption, 5%, the estimated total change in GDP over the 12 year
period ranges from $41.1 billion to $78.1 billion, depending upon the substitution rate
assumed. Using a 2% royalty rate assumption, the estimated total change in GDP ranges
from $93.3 billion to $177.2 billion. We do not show the similar calculations for contribution to
changes in total industry output or employment under these different assumptions, but of
course the results are proportionately similar.
Observations
Our approach to estimating the impact of university licensing employs a number of features
that we believe provide far more valid and complete estimates of national economic impact
than have previously been available, while at the same time incorporating many assumptions
that lead to conservative results. Our model is relatively simple and transparent, and affords
users the opportunity to enter their own best estimates of appropriate royalty rates, to which
the model results are highly sensitive. As far as the validity of our estimates is concerned, our
approach employs a national input-output model that accounts for the fact that sales revenue
estimates do not themselves represent economic impact. Sales revenue estimates, however
generated, include the industry purchases of intermediate inputs; further, they do not account
for the expenditures of those revenues for multiple purposes before having a final impact on
value added or GDP. Our approach accounts for the fact that university expenditures of their
licensing income has significant direct and induced economic impact and thus should be
included in any national (or, for that matter, regional) impact estimates. Indeed, our model can
be used with regional input-output models and royalty data from individual universities to
generate estimates of the economic impact of individual universities. Finally, although we were
unable to obtain consistent data on university income from license-related R&D contracts,
these too add to the economic impact of university licensing.
The Economic Impact of Licensed Commercialized Inventions Originating in University Research, 1996-2007
Final Report 9/3/09 Page 10
Project Overview
It is widely known that university-industry research interactions and collaborations have grown
substantially over the past several decades. Collaborations take many forms, ranging from
university licensing of inventions based in federally funded research, to industry participation in
major federally-funded university-based research consortia, to direct industry support of
university-based research projects. New companies also are frequently formed around
innovations based on university research. Private firms increasingly have recognized that
research partnerships with universities provide a wide range of benefits, only some of which
take specific economic forms such as new and improved products, processes, and services;
other benefits are access to students and graduates with specialized knowledge who can be
interns, employees, or consultants. While only a fraction of industry-university research
collaborations result in intellectual property (IP) that is successfully commercialized by private
firms, universities also own intellectual property rights to inventions derived from billions of
dollars annually of federal funding. They seek to maximize the public benefits of this research
by licensing these discoveries to private firms to ensure maximum access to the technology by
the general public.
There are several relatively sophisticated methods that could be used to estimate the economic
value to the nation of innovations based in university research (e.g. consumer surplus estimates
for specific innovations), but most would require costly data collection and/or threaten the
proprietary interests of innovating firms. We present here the results of a modest approach
that makes use of existing Association of University Technology Managers (AUTM) annual
survey data and relatively straightforward economic calculations. Using data from annual
AUTM surveys of U.S. universities, it is possible to develop systematic, conservative estimates
of the economic impacts on the United States of twelve years of university-industry research
collaborations. Although “deals” between university technology licensing offices and private
firms take many forms, such as one-time flat fees, taking equity positions in university-based
start-ups, and even in some rare cases donating IP to nonprofits for charitable purposes, in
many cases universities base licensing fees on the percentage of sales of new products
developed using the university-based IP. Annual AUTM survey data are available on the
licensing income from all U.S. universities responding to the survey, typically numbering about
140. Licensing income data by reporting institution are available from 1996 through 2007.
With these data as a base, we combine the AUTM survey results with other data and employ
the Commerce Department’s Bureau of Economic Analysis (BEA) Input-Output (I-O) model to
The Economic Impact of Licensed Commercialized Inventions Originating in University Research, 1996-2007
Final Report 9/3/09 Page 11
develop estimates of the annual national economic impact of university licensed products that
have been commercialized and generated sales. These impact estimates take two forms: the
change in gross output of all industries due to the university licensed products in the
marketplace, and the impact on Gross Domestic Product (GDP) of university licensed products.
The “core” of this report describes the data used to generate these estimates, the models used
to develop the estimates, and the results obtained. However, it is important to place these
results in context, since the economic impact of university licensing of products is only one of
the many economic impacts of university research and education, and almost certainly not the
largest one. In addition to placing this particular type of university output in the context of
other outputs with significant economic impact, it is also necessary to place the impact of
university licensing of intellectual property in historical context. Thus the next section of this
report presents historical trends in university licensing of intellectual property and related
outputs. The subsequent section shifts the focus to the results of empirical studies of the
impact of university research generally and of university licensing particularly. Then, we
present the details of our work: the data used in our model, the model itself, and the results.
The final section discusses our results, noting especially the assumptions and caveats that
should be kept in mind in interpreting them.

The Economic Impact of Licensed Commercialized Inventions Originating in University Research, 1996-2007
Final Report 9/3/09 Page 12
Economic Significance of University Research: History and Trends
Although the intellectual property aspects of university-industry relationships have assumed
salience recently in policy debates about the appropriate role of universities in technology
commercialization, university-based applied research in areas of interest to industry is not new.
During the latter part of the 19th century and well into the 20th, much university research was
actually oriented toward the economic interests of the states in which they resided (and from
which they drew their primary support). A small number of elite, private institutions struggled
to increase the amount of basic research done on campus, as their counterparts in Europe had
been doing for some time. It was not until the period following World War II that American
research universities assumed the role as the primary performers of the nation’s basic research
(Geiger, 1986; Rosenberg and Nelson, 1994; Mowery and Rosenberg, 1989; Atkinson and
Blanpied, 2008).
The direct commercial value of knowledge generated from university research is only one of a
wide range of outputs that have economic significance. In a synthesis of prior research,
Goldstein, Maier, and Luger (1995) list eight outputs of research universities that can lead to
economic impacts:
1. Generation of new knowledge;
2. Creation of human capital;
3. Transfer of existing know-how (tacit knowledge);
4. Technological innovation;
5. Capital investment;
6. Regional leadership;
7. Production of knowledge infrastructure; and
8. Influence on the regional milieu.
In their recent review of methods for assessing the economic impacts of universities, Drucker
and Goldstein (2007) expand on several of the more significant (and more easily characterized)
of these outputs. They note that, since their origins in the Middle Ages, universities’ primary
reason for existence has been the formulation and dissemination of knowledge and wisdom.
Research-intensive universities have recognized that development of human capital has been
an accompanying objective, difficult to separate from the research function itself. “The
development of human capital is intrinsic in the process of establishing new knowledge as
faculty, students, and researchers develop their own intellectual and technical skills; [it] also
occurs through activities such as distance learning, industrial extension, and community
The Economic Impact of Licensed Commercialized Inventions Originating in University Research, 1996-2007
Final Report 9/3/09 Page 13
education programs.” (p. 22) Knowledge and technology transfer focus on application of
existing knowledge to solve problems and improvement of products and processes, functions
that initially (in the U.S.) were central to land grant universities but are now recognized as
highly important for all research universities, public and private. The creation of technological
innovations at the university frequently leads to patenting, licensing, and the formation of
start-up companies by faculty and students.
Obviously, the economic implications of some of these outputs are more easily measured and
assessed than others. Traditional approaches have focused on the regional impacts of direct
spending and regional investments of universities; others have extended this to include the
effects of human capital creation and induced regional migration. More recent approaches
have considered the effects of knowledge creation, knowledge infrastructure development,
technological innovation, and technology transfer.
Sampat (2003) provides a similar but shorter list that focuses more sharply on the more readily
recognized and assessed economic outputs of university research:
Creation of economically useful scientific and technological information, which helps
increase the efficiency of applied R&D in industry;
Provision of skills or human capital to students and faculty members and helping to
create networks of scientific and technological capabilities;
Development of equipment and instrumentation used by firms in production or
research;
Creation of prototypes for new products and processes. (pp. 55-56)
Sampat makes several points that are relevant to the purposes of this report. He notes that the
relative importance of the different channels through which these outputs diffuse (or are
“transferred”) to industry has varied by industry and over time. Such channels include hiring of
students and faculty, consulting relationships between faculty and firms, publications,
conference presentations, informal interactions with industry researchers, university start-up
companies, and licensing of university patents. Recent studies show that both faculty and
private firms in most industries consider the primary channels through which learning occurs to
be publications, conferences, and informal information exchange (Cohen, Nelson, and Walsh,
2002; Agrawal and Henderson, 2002). Also, several studies of the benefits that companies
derive from membership in National Science Foundation-funded university-industry research
centers (e.g., Engineering Research Centers, Industry/University Cooperative Research Centers)
show that access to students and faculty and to new ideas and research results, rather than
technology per se, are consistently the most frequently cited benefits of center membership

The Economic Impact of Licensed Commercialized Inventions Originating in University Research, 1996-2007
Final Report 9/3/09 Page 14
(Feller, Ailes, and Roessner, 2002; Roessner, 2000). So, although the focus of this report is
clearly on the economic impact of university licensing, this represents only one of many outputs
from university research that are highly valued in the economy.
Despite the “ivory tower” label sometimes attached to U.S. universities, this is now a gross
misrepresentation of reality. In fact, our research universities have been among the most
important economic institutions of the twentieth century (Atkinson and Blanpied, 2008).
“Most economic historians agree that the rise of American technological and economic
leadership in the postwar era was based in large part on the strength of the American university
system” (Sampat, 2003: 56). Many other countries viewed the university-industry
collaborations found in the United States as a competitive advantage and sought to duplicate
the underlying conditions supporting these trends (Neal, Smith and McCormick, 2008).
Patenting of university research outputs is by no means a phenomenon of the past few decades
only. Although growth in university patenting accelerated dramatically beginning in the 1980s,
the history of university patenting extends back to the 1920s (see Figures 1 and 2). Indicators
of academic patenting are mixed in recent years. The U.S. Patent and Trademark Office reports
that patent grants to universities have declined since 2002, but other indicators suggest
continued expansion of activities related to patents and patent/licensing revenues, such as
invention disclosures, patent applications, and revenue-generating licenses. For example,
Figure 2 shows that the number of new university license agreements/options have grown
steadily in recent years from 1,079 in 1991 to 4,201 in 2005.

The Economic Impact of Licensed Commercialized Inventions Originating in University Research, 1996-2007
Final Report 9/3/09 Page 15
Figure 1: Patents Issued to U.S. Research Universities, 1925-1995
Source: Sampat (2003), page 60.
Source: AUTM annual surveys, various years, and National Science Board, 2008.

The Economic Impact of Licensed Commercialized Inventions Originating in University Research, 1996-2007
Final Report 9/3/09 Page 16
Until the latter part of the twentieth century, however, universities generally did not wish to
engage directly in the patenting and licensing process, largely because they viewed such
activities as possibly compromising their commitments to openness and knowledge
dissemination. In these early years, most universities avoided intellectual property issues, and
the few that did become involved either contracted out their patent management activities to
third party organizations such as the Research Corporation (founded in 1912), or set up
separate, non-profit foundations such as the Wisconsin Alumni Research Foundation (created in
1924). Beginning with MIT in 1937 and continuing into the post WWII period, universities
signed “invention administration agreements” (IAA) with Research Corporation, specifying that
all necessary services would be provided by Research Corporation, for which the Corporation
would retain a portion of royalty income, with the remainder going to the university. Figure 3,
below, shows the proportion of Carnegie research universities that had such agreements
between 1940 and 1980.
Figure 3: Proportion of Carnegie Research Universities with IAAs with Research
Corporation, 1940-1980
Source: Sampat (2003): page 58.
A number of forces beginning in the 1970s brought about significant changes in university
patent policies, manifested most obviously in the decision by many research universities to
establish internal technology transfer offices, thus internalizing the functions previously
performed by the Research Corporation. Figure 4 shows the number of additional universities
The Economic Impact of Licensed Commercialized Inventions Originating in University Research, 1996-2007
Final Report 9/3/09 Page 17
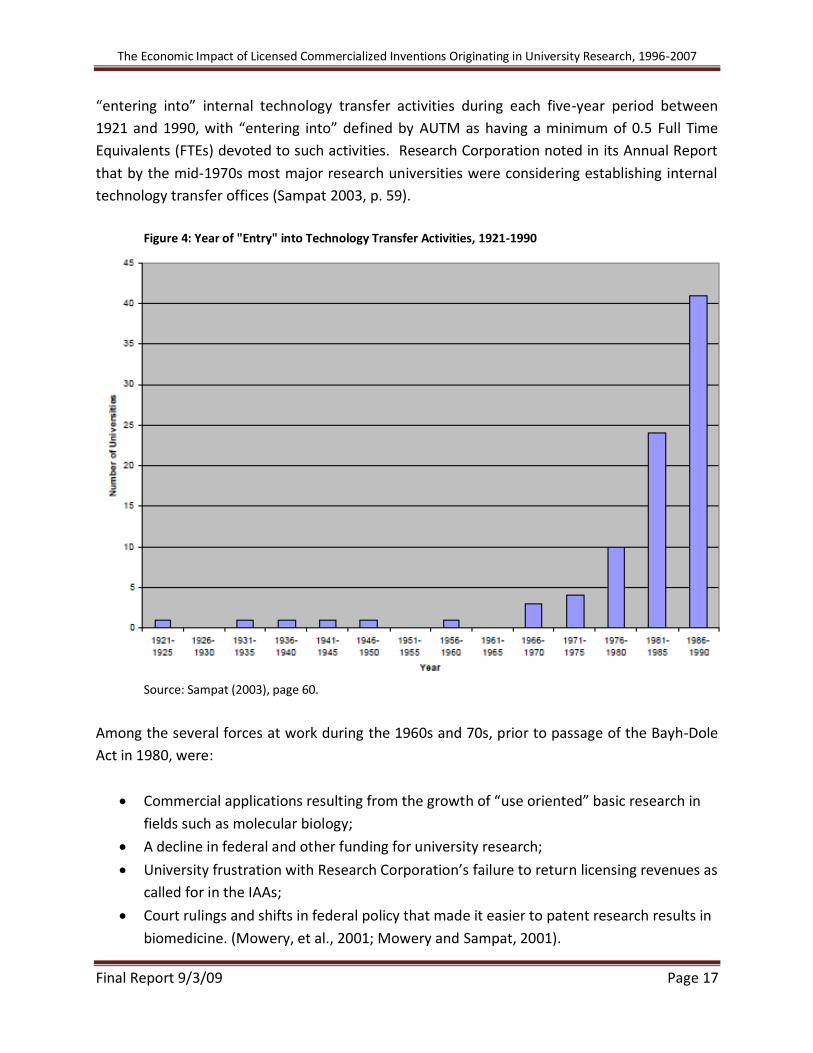
“entering into” internal technology transfer activities during each five-year period between
1921 and 1990, with “entering into” defined by AUTM as having a minimum of 0.5 Full Time
Equivalents (FTEs) devoted to such activities. Research Corporation noted in its Annual Report
that by the mid-1970s most major research universities were considering establishing internal
technology transfer offices (Sampat 2003, p. 59).
Figure 4: Year of "Entry" into Technology Transfer Activities, 1921-1990
Source: Sampat (2003), page 60.
Among the several forces at work during the 1960s and 70s, prior to passage of the Bayh-Dole
Act in 1980, were:
Commercial applications resulting from the growth of “use oriented” basic research in
fields such as molecular biology;
A decline in federal and other funding for university research;
University frustration with Research Corporation’s failure to return licensing revenues as
called for in the IAAs;
Court rulings and shifts in federal policy that made it easier to patent research results in
biomedicine. (Mowery, et al., 2001; Mowery and Sampat, 2001).

The Economic Impact of Licensed Commercialized Inventions Originating in University Research, 1996-2007
Final Report 9/3/09 Page 18
According to Mowery, et al. (2001), beginning in the 1960s important federal research agencies
began to allow universities to patent and license results from federally-funded research. The
Department of Defense allowed universities to retain title to patents resulting from DOD
research, provided that DOD retained control of the patents for military application. Both HEW
and NSF negotiated Institutional Patent Agreements (IPA) with individual universities, which
eliminated the need for case-by-case reviews of the disposition of individual academic
inventions. The universities whose patent filings were increasing during this period were
participants in these IPA agreements (J. Allen, personal communication, March 23, 2009). In
addition, the Court of Appeals for the Federal Circuit (CAFC) was established in 1982 to “serve
as the court of final appeal for patent cases throughout the federal judiciary . . . the CAFC soon
emerged as a strong champion of patentholder rights” (p. 103). The IPAs were, in a sense, an
administrative form of many of the agency-wide provisions of the Bayh-Dole Act, enacted in
1980 and implemented in 1981. In any event, as Mowery et al. (2002) note, “growth during
the 1970s in patenting, licensing, licensing income, or in the establishment of independent
technology transfer offices, was dwarfed by the surge in all of these activities after 1981.” (p.
104)
Time-series data on a variety of indicators of the level of activities related to
commercialization of university research consistently show that, while universities engaged in
such actions as early as the 1920s, an enormous surge in the rate of activity took place after the
Bayh-Dole Act became law in 1980. Although the trend data may suggest, prima facie, that
Bayh-Dole is to a significant extent responsible for the economic consequences of university-
based technology transfer and commercialization activities during the past twenty-five years,
there is currently considerable debate about this. Mowery and his colleagues, for example, are
skeptical of the causal links, arguing that there is little empirical evidence that Bayh-Dole
substantially increased the contributions of university research to the U.S. economy. Based on
national university patenting data and detailed historical data from Columbia, Stanford, and
Berkeley, they argue that commercialization activity would have grown in the absence of Bayh-
Dole, that the evidence on low rates of commercialization before passage of Bayh-Dole is weak,
and that patenting and licensing frequently are not necessary for the development and
commercialization of publicly funded, university-based inventions (Mowery, et al., 2004, pp.
183-184). However, these conclusions and those of other skeptics concerning the apparent
economic significance of Bayh-Dole have been challenged strongly in a recently published
article by Bremer, Allen, and Latker (2009). They conclude that “Reams of objective data exist
supporting the conclusion that the Bayh-Dole Act greatly improved the commercialization of
federally-funded research . . . and that the public sector-private sector partnerships which were
generated under the Act are essential both to the well being and the competitive position of

The Economic Impact of Licensed Commercialized Inventions Originating in University Research, 1996-2007
Final Report 9/3/09 Page 19
the United States” (p. 2). Our concern here, however, is not the contribution that the Bayh-
Dole Act did or did not make to the economic impact of university-based licensing of
technology, but rather to estimate quantitatively the contribution that one component of the
output of university-based research makes to our national economy.
The Economic Impact of Licensed Commercialized Inventions Originating in University Research, 1996-2007
Final Report 9/3/09 Page 20
Empirical Evidence of the Economic Impact of University Research and Licensing
In 2003 the National Academy of Engineering issued a report titled The Impact of Academic
Research on Industrial Performance (NAE, 2003). The study sought to assess and document the
contribution that university research made to five diverse industries: network systems and
communications; financial services; medical devices and equipment; transportation,
distribution, and logistics services; and aerospace. These industries illustrate the wide range of
contributions of academic research to industrial performance: trained graduates; new
knowledge emerging from research; and development of tools, prototypes, and products. They
also illustrate different patterns of collaboration with universities and different mechanisms for
taking advantage of academic contributions. The study concluded that “Academic research has
made substantial contributions to all five industries, ranging from graduates at all levels trained
in modern research techniques to fundamental concepts and key ideas based on basic and
applied research to the development of tools, prototypes, and marketable products, processes,
and services” (p. 2). The study also noted that quantitative evidence of the impact of university
research on industrial performance was largely lacking. A number of efforts are ongoing to
improve metrics of innovation outputs, technology transfer, and commercialization of R&D
results including those at the National Science Foundation (NSF), the Association of Public and
Land-Grant Universities (APLU—formerly NASULGC), the Association of American Universities
(AAU), AUTM, and the Organisation for Economic Co-operation and Development (OECD). In
response to the need to provide qualitative as well as quantitative information on the economic
and social contributions of university R&D, AUTM has also launched The Better World Project,
which provides case studies of examples such as Taxol, Alegra, Google, holograms, etc. The
latest report, 2009 Better World Report, focuses on health (AUTM, 2009).
There is considerable evidence that the most important contribution that universities make to
industry is through their outputs of research results and well-trained scientists and engineers,
which increase the productivity of industrial R&D (Nelson, 1986; Rosenberg and Nelson, 1994;
Klevorick et al., 1995).3 Industrial scientists rely primarily on the existing stock of knowledge in
carrying out their research, so are likely to use existing knowledge at least as much as new
knowledge. Sometimes, though, advances in basic science lead fairly quickly to new products
and processes, with biotechnology (employing knowledge of the principles of recombinant
DNA, for example) an obvious case. Mansfield (1991) surveyed R&D executives from 76 major
U.S. firms, asking them to estimate the proportion of new products and processes their firms
had produced over a ten-year period that could not have been developed (without substantial
3 For a concise review of the literature on the contributions of academic research to industrial innovation, see Chapter 8 in National Science Board, Science and Engineering Indicators 1996.

The Economic Impact of Licensed Commercialized Inventions Originating in University Research, 1996-2007
Final Report 9/3/09 Page 21
delay) without the results of academic research that had been conducted during the previous
15 years. The responses indicated that about 11 percent of new products and 9 percent of new
processes could not have been developed without the results of academic research. Using
these results together with information on the value of sales of new products and the cost
savings associated with use of new processes, Mansfield estimated that the social return to
investment in academic research was 28 percent.
There is also evidence that academic research is increasingly important to industry. A survey of
1,478 industry R&D lab managers conducted in 1994 by Carnegie Mellon University researchers
found that two-thirds of the industries surveyed showed that university research was at least
“moderately important” to their R&D. Also, as we saw in an earlier section of this report, the
number of patents granted to universities has increased dramatically over the past several
decades, as have start-up companies based in university research. Disclosures filed with
university technology management offices grew from 13,700 in 2003 to 15,400 in 2005.
Likewise, new U.S. patent applications filed by respondents to annual AUTM surveys also
increased, from 7,200 in 2003 to 9,500 in 2004 and 9,300 in 2005. The annual number of
startup companies established as a result of university-based inventions rebounded after 2
years of downturns in 2002 and 2003 to more than 400 in both 2004 and 2005, and were
reported at 555 in the 2007 AUTM survey (National Science Board, 2008; AUTM, 2007).
There is a substantial literature on the broader economic impact of universities (only some
studies consider the impact of research as a separate activity), but it consists largely of studies
of the impact that universities have had on their regional economies. National impact studies
are rare, and the few that have been done focus on the impact of publicly-funded (usually
federal) research on the national economy, and most do not separate out university research
impacts. In Appendix A we summarize selected studies to illustrate typical approaches used
and results obtained to provide a broader context for the specific impact estimates of university
licensing we have developed. We stress that licensing of intellectual property is only a minor
portion of the activities engaged in by universities that have economic value, so that the total
economic impact of universities greatly exceeds that generated through licensing. Appendix A
is not intended to be a full literature review; rather, it illustrates the various types of studies
that have been done and helps place this report and its results into context.

The Economic Impact of Licensed Commercialized Inventions Originating in University Research, 1996-2007
Final Report 9/3/09 Page 22
Estimating the Economic Impact of University Licensing
The BEA national I-O model and data from AUTM provided the basis for our estimates of the
national economic impact of university licensing. Two estimates of impacts are made. One
measures the impact of university licensing on gross domestic product (GDP), and the other, its
impact on other industries’ production (gross output). Our estimates cover a 12-year period,
1996–2007.
The national I-O model allows users to assess the impact of specified events on economic
activity. The model shows the relationship between final demand and industry production, and
may be used to evaluate the interrelationships among industries and the relationships between
industries and the commodities they use and produce. It is used to derive input-output
requirement tables. These requirements tables show the level of industry gross output or
employment required to produce a specified level of final uses.4
Using the I-O Model to Assess the Impact of University Licensing
The I-O model is used to measure two different but equally important impacts of university
licensing on the economy: the impact on GDP and the impact on other industries production
(gross output).
The first is the direct impact of university-licensed products on GDP. It takes into account both
licensing receipts of universities and output resulting from licensing agreements. University
licensing receipts are part of the output of universities, and include additional license-related
sponsored research. It is assumed that all licensing receipts are spent, for example, on
additional research equipment and materials, graduate student support, and faculty salaries.
These licensing receipts are added to output resulting from licensing agreements. Firms
generate sales of new products – goods and services – based on the licensed technology. The
contribution to GDP from the sales of these products is the value added of the industries
producing them. This contribution is estimated using the ratio of value added to gross output
(or sales) of the products produced under the licensing agreements. These ratios are derived
from the input-output tables.
The second impact measures that of university licensing on industry gross output or production.
It includes the direct effect of expenditures of university royalty receipts (including additional
4 A more complete discussion of the Input-Output model can be found in Appendix B.

The Economic Impact of Licensed Commercialized Inventions Originating in University Research, 1996-2007
Final Report 9/3/09 Page 23
sponsored research for the university generated by its licenses), and the indirect effect on the
output or employment of universities as well as all other industries. These university
expenditures require other industries that supply goods and services to the universities to
increase their output. Licensing and license-related research income is multiplied by the I-O
total requirements multipliers to estimate the gross output of all other industries required to
support the additional expenditures resulting from licensing and license-related research
income.
Estimating the Total Annual Economic Impact of University-Licensed Products
Figure 5, below, provides a schematic representation of how we calculated annual estimates of
the impact of university licensed products on the U.S. GDP. Verbally, it is the sum of the
estimated direct impact of university licensed products and the direct impact of university
expenditures of their total (gross) licensing income. The direct impact of university licensed
products is, in turn, derived from the ratio of university licensing income from “running
royalties”5 to the royalty rates (based on percentage of product sales) charged by universities.
This ratio yields an annual estimate of the additional revenues to firms generated from sales of
products based on university-licensed intellectual property. The I-O model converts this figure
into the changes in income (compensation, indirect business taxes, and gross operating
surplus—i.e., profits) of companies operating under sales-based university licensing
agreements, which together constitutes the contribution to GNP. Also, university expenditures
attributable to licensing income have direct impacts on the economy in two ways: first, via
expenditures of gross royalty income (for salaries, equipment, overhead costs, etc.) and second,
via expenditures of research income from firms that contract for R&D with the university as a
direct consequence of the licensing agreement. This is accounted for by the second term in the
model.
5 AUTM defines running royalties as royalties earned on and tied to the sale of products. Excluded from this
number are license issue fees, payments under options, termination payments, and the amount of annual
minimums not supported by sales. Also excluded from this amount is cashed-in equity. Many universities take
equity positions in start-ups in lieu of royalties. The exclusion of these equity payments in our model adds to the
conservative nature of our estimates.

The Economic Impact of Licensed Commercialized Inventions Originating in University Research, 1996-2007
Final Report 9/3/09 Page 24
Figure 5: Estimating the Total Annual Economic Impact of University-Licensed Products
Where
And
Figure 6 shows how we estimated the change in gross output of all industries due to the
university licensing of products. Gross output is a measure of economic activity, but is not GDP.
The impact is the sum of sales of companies generated by the licensing agreements plus the
change in output at universities (additional income from licensing plus additional research
funds attributable to the licensing) plus the changes in gross output of all other industries that
directly and indirectly provide inputs to the universities. Note that “institutional expenditures”
represent university licensing income that national accountants classify as consumption
expenditures.
=
=
ADDITIONAL
REVENUES TO
MANUFACTURING
FIRMS RESULTING
FROM SALES OF
PRODUCTS BASED
ON UNIVERSITY
LICENSES
ESTIMATED TOTAL
ANNUAL ECONOMIC
IMPACT OF
UNIVERSITY-
LICENSED
PRODUCTS
ESTIMATED DIRECT
ANNUAL ECONOMIC
IMPACT OF
UNIVERSITY-
LICENSED
PRODUCTS
ESTIMATED DIRECT
ANNUAL ECONOMIC
IMPACT OF
UNIVERSITY
LICENSING
= +
ESTIMATED DIRECT
ANNUAL ECONOMIC
IMPACT OF
UNIVERSITY-
LICENSED
PRODUCTS
=
UNIVERSITY
LICENSING INCOME
FROM RUNNING
ROYALTIES
“TYPICAL” ROYALTY
RATE (% OF PRODUCT
SALES) CHARGED BY
UNIVERSITIES
+
GROSS
ANNUAL
UNIVERSITY
LICENSING
INCOME
I-O
MODEL
CONTRIBU-
TION TO
GDP
ANNUAL
VALUE OF
RESEARCH
CONTRACTS
DUE TO
PRIOR
LICENSES
ESTIMATED DIRECT
ANNUAL ECONOMIC
IMPACT OF
UNIVERSITY
LICENSING

The Economic Impact of Licensed Commercialized Inventions Originating in University Research, 1996-2007
Final Report 9/3/09 Page 25
Figure 6: Estimating the Annual Impact of University-Licensed Products on Industry Gross
Outputs
Where
And
=
+
GROSS
ANNUAL
UNIVERSITY
LICENSING
INCOME
ANNUAL
VALUE OF
RESEARCH
CONTRACTS
DUE TO
PRIOR
LICENSES
=
ESTIMATED TOTAL
ANNUAL IMPACT OF
UNIVERSITY-
LICENSED PRODUCTS
ON INDUSTRY GROSS
OUTPUT
INSTITUTIONAL
EXPENDITURES
ESTIMATED INDIRECT
ANNUAL ECONOMIC
IMPACT OF
UNIVERSITY LICENSING
ON OTHER INDUSTRIES
= +
INSTITUTIONAL
EXPENDITURES
x
UNIVERSITY OUTPUT
MULTIPLIER(S) FROM BEA
INPUT/OUTPUT TABLES
ESTIMATED INDIRECT
ANNUAL ECONOMIC
IMPACT OF
UNIVERSITY LICENSING
ON OTHER INDUSTRIES
GROSS
ANNUAL
UNIVERSITY
LICENSING
INCOME
ANNUAL
VALUE OF
RESEARCH
CONTRACTS
DUE TO
PRIOR
LICENSES
+
The Data
We used data from AUTM annual surveys to estimate the impact of royalty-related income of
universities and sales from products produced from the licensing agreements. AUTM surveys
provide information for the years 1996-2007 on:
Gross royalty income paid to universities from licensing; and
Running royalties paid to the universities based on product sales.
The royalty-related income paid to universities multiplied by the total requirements multiplier
for educational institutions gives the value of gross output in all industries necessary to satisfy
the university expenditures of licensing-related income; this is the indirect impact of university

The Economic Impact of Licensed Commercialized Inventions Originating in University Research, 1996-2007
Final Report 9/3/09 Page 26
licensing. Employment multipliers can be multiplied times these expenditures to estimate the
total impact of royalty income on employment.
A separate, but equally important impact is the contribution of the new products created by the
university licensing program to industry value added, or GDP. The value of annual sales of
products produced as a result of licensing university technologies is estimated using
information on the royalty rates paid to universities based on the annual sales of products, and
AUTM survey data on running royalty income received by universities based on product sales.
Because of data limitations, a range of sales is estimated, based on information on royalty rates
we obtained with the cooperation of AUTM members and staff. Royalty rates based on product
sales differ among universities and by industrial sector; also, the derived sales estimates do not
take into account the effect that new products have on sales of substitute goods already on the
market. Hence, several scenarios are assumed. Royalty rates charged by universities typically
range from 2% to 10%, depending on the industry involved and other factors. In principle,
product displacement effects could range from 0 percent, when the new product displaces no
existing products or services, to 100 percent, when it completely displaces them. These ranges
(rather than misleading “typical” or “average” values) provide a way to generate conservative
estimates of the increase in GDP due to university licensing of intellectual property, accounting
for the wide range of royalty rates charged by universities and for substitution effects when
new products are first introduced into the marketplace.
To develop information about “typical” royalty rates charged by universities on which to base
our impact estimates, we enlisted the aid of a number of individual university technology
transfer officers from various regions of the country and current and former members of the
AUTM Public Policy Committee. With their help, we obtained royalty rate information from
twelve research universities representing a range of sizes, types (public and private), and
geographic locations. The following table (Table 1) summarizes the results of this effort.
The Economic Impact of Licensed Commercialized Inventions Originating in University Research, 1996-2007
Final Report 9/3/09 Page 27
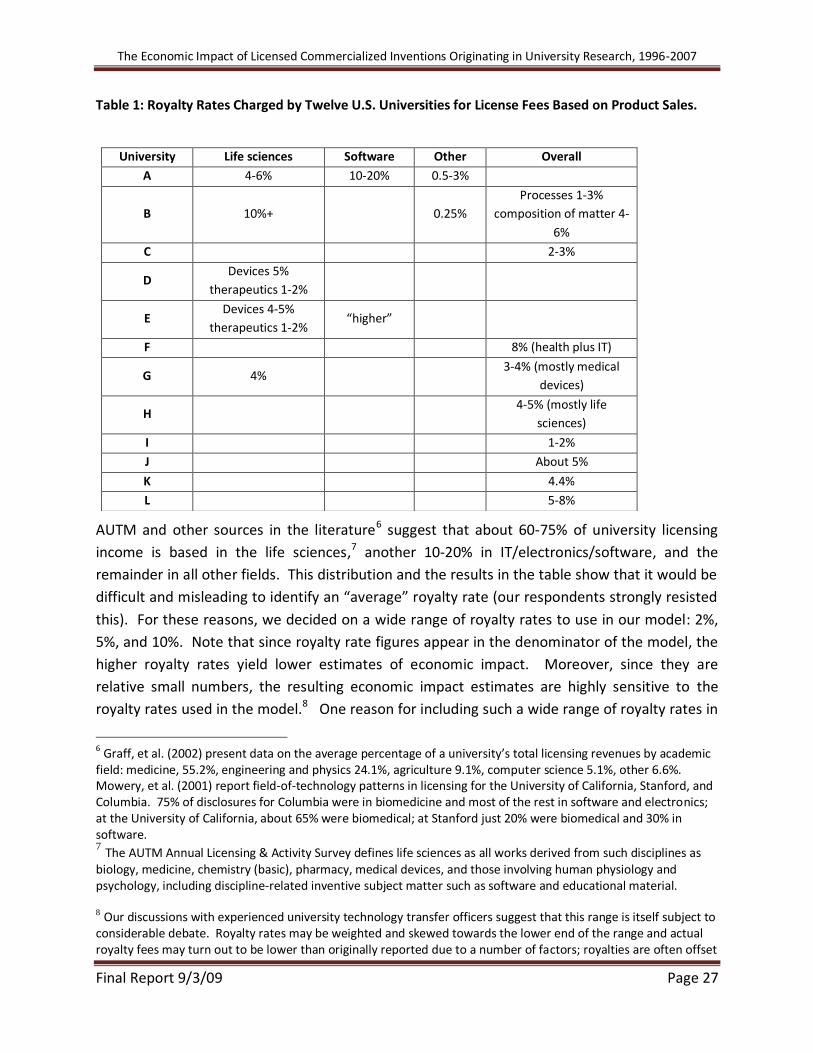
Table 1: Royalty Rates Charged by Twelve U.S. Universities for License Fees Based on Product Sales.
AUTM and other sources in the literature6 suggest that about 60-75% of university licensing
income is based in the life sciences,7 another 10-20% in IT/electronics/software, and the
remainder in all other fields. This distribution and the results in the table show that it would be
difficult and misleading to identify an “average” royalty rate (our respondents strongly resisted
this). For these reasons, we decided on a wide range of royalty rates to use in our model: 2%,
5%, and 10%. Note that since royalty rate figures appear in the denominator of the model, the
higher royalty rates yield lower estimates of economic impact. Moreover, since they are
relative small numbers, the resulting economic impact estimates are highly sensitive to the
royalty rates used in the model.8 One reason for including such a wide range of royalty rates in
6 Graff, et al. (2002) present data on the average percentage of a university’s total licensing revenues by academic field: medicine, 55.2%, engineering and physics 24.1%, agriculture 9.1%, computer science 5.1%, other 6.6%. Mowery, et al. (2001) report field-of-technology patterns in licensing for the University of California, Stanford, and Columbia. 75% of disclosures for Columbia were in biomedicine and most of the rest in software and electronics; at the University of California, about 65% were biomedical; at Stanford just 20% were biomedical and 30% in software. 7 The AUTM Annual Licensing & Activity Survey defines life sciences as all works derived from such disciplines as
biology, medicine, chemistry (basic), pharmacy, medical devices, and those involving human physiology and psychology, including discipline-related inventive subject matter such as software and educational material. 8 Our discussions with experienced university technology transfer officers suggest that this range is itself subject to considerable debate. Royalty rates may be weighted and skewed towards the lower end of the range and actual royalty fees may turn out to be lower than originally reported due to a number of factors; royalties are often offset
University Life sciences Software Other Overall
A 4-6% 10-20% 0.5-3%
B 10%+ 0.25%
Processes 1-3%
composition of matter 4-
6%
C 2-3%
D Devices 5%
therapeutics 1-2%
E Devices 4-5%
therapeutics 1-2% “higher”
F 8% (health plus IT)
G 4% 3-4% (mostly medical
devices)
H 4-5% (mostly life
sciences)
I 1-2%
J About 5%
K 4.4%
L 5-8%
The Economic Impact of Licensed Commercialized Inventions Originating in University Research, 1996-2007
Final Report 9/3/09 Page 28
our calculations is that users of our model can get a rough feel for the differences in impact that
industry sector makes; for example, the data in Table 1 suggest that the 10% rate is appropriate
for only very limited industry sectors, sectors that represent only a small proportion of most
university licensing portfolios.
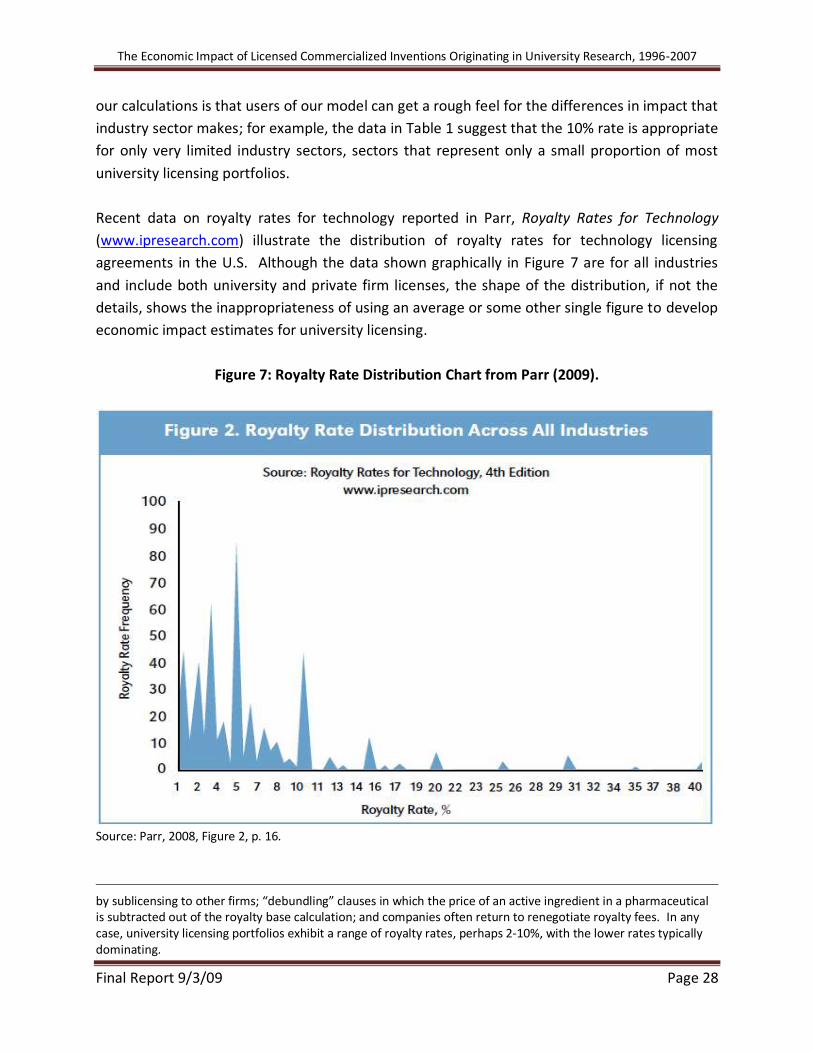
Recent data on royalty rates for technology reported in Parr, Royalty Rates for Technology
(www.ipresearch.com) illustrate the distribution of royalty rates for technology licensing
agreements in the U.S. Although the data shown graphically in Figure 7 are for all industries
and include both university and private firm licenses, the shape of the distribution, if not the
details, shows the inappropriateness of using an average or some other single figure to develop
economic impact estimates for university licensing.
Figure 7: Royalty Rate Distribution Chart from Parr (2009).
Source: Parr, 2008, Figure 2, p. 16.
by sublicensing to other firms; “debundling” clauses in which the price of an active ingredient in a pharmaceutical is subtracted out of the royalty base calculation; and companies often return to renegotiate royalty fees. In any case, university licensing portfolios exhibit a range of royalty rates, perhaps 2-10%, with the lower rates typically dominating.

The Economic Impact of Licensed Commercialized Inventions Originating in University Research, 1996-2007
Final Report 9/3/09 Page 29
For displacement or substitution effects, there is no standard approach. Under these
circumstances, we made what we believe to be a set of reasonable assumptions in order to
arrive at a plausible range of product displacement rates:
1. It is highly unlikely that the effect of these new products, when first introduced, will have
substantial displacement effects on existing products over the short run. They more frequently
are highly innovative products, new to the marketplace, and sometimes result in entirely new
industries or changes in behavior rather than merely improvements over or direct substitutes
for existing ones, and therefore unlikely to directly displace something in widespread current
use. This assumption would lead toward estimates below 50% substitution.
2. A 0% assumption means no market substitution effects whatever on existing products,
which also seems unrealistic. Yet small perturbations over a reasonably short period (say 5
years) seem most likely, and this also points to use of substitution rates toward the lower end.
We therefore used substitution rate estimates of 5, 10, and 50 percent in our calculations.
Anyone wishing to use alternative assumptions using our base estimates can of course do so
easily.
The following two pairs of tables (Tables 2 and 3) and charts (Figures 8 and 9) show the annual
AUTM data on running royalties and total royalty income for U.S. universities for the years
1996-2007.9
Table 2: Running Royalties for U.S. Universities, 1996-2007, in millions
1996 1997 1998 1999 2000 2001 2002 2003 2004 2005 2006 2007
Millions $282.11 $314.75 $390.33 $475.04 $558.96 $636.56 $786.74 $829.26 $810.15 $855.94 $968.57 $1,806.97
N= 125 122 124 133 138 136 150 158 154 150 153 153
Source: AUTM annual surveys
9 The increase in royalty income in 2007 is a real increase and is primarily due to the sale by New York University of their worldwide royalty interest in Remicade(R) to Royalty Pharma for $650 million in cash up-front plus additional payments should yearly sales of Remicade(R) exceed certain agreed sales hurdles. NYU retains the portion of the Remicade(R) royalty interest payable to the NYU researchers who are responsible for the development of Remicade(R). So the dramatic increase in 2007 represents royalty income based on estimated future sales that normally would be apportioned in future years, based on the agreed-upon royalty rates. There are likely to be similar agreements with less dramatic effects reflected in the royalty income data for other years and other universities.

The Economic Impact of Licensed Commercialized Inventions Originating in University Research, 1996-2007
Final Report 9/3/09 Page 30
Table 3: Licensing Income Received by U.S. Universities, 1996-2007, millions of dollars
1996 1997 1998 1999 2000 2001 2002 2003 2004 2005 2006 2007
Millions $365.22 $482.79 $613.55 $675.47 $1,099.89 $868.28 $997.83 $1,033.61 $1,088.47 $1,774.97 $1,511.58 $2,098.78
N= 125 122 124 133 138 136 150 158 154 150 153 153
Source: AUTM annual surveys.
Unfortunately, consistent and complete annual data for 1996-2007 are not available from
AUTM on the value of research contracts received by universities that were directly related to
previous licensing agreements signed between the university and the contracting companies.

The Economic Impact of Licensed Commercialized Inventions Originating in University Research, 1996-2007
Final Report 9/3/09 Page 31
Omitting this element in the calculations is another indication that the impact estimates we
calculated are on the conservative side.

The Economic Impact of Licensed Commercialized Inventions Originating in University Research, 1996-2007
Final Report 9/3/09 Page 32
Results
Impact Estimates, Basic Model
Table 4, below, shows the calculated values resulting from application of the model
represented in Figure 5, above. The model generates annual values for sales revenues with a
range of assumptions about royalty rates: 2%, 5%, and 10%; outputs from the I-O model under
these three assumptions; and estimates of the total change in GDP due to university-licensed
product sales under the three royalty rate assumptions. No assumptions are made here about
product substitution rates, and the additional impact generated from university income from
license-related contract R&D is not included in the calculations. Under a moderately
conservative assumption (conservative from the perspective of the magnitude of model’s
impact estimate), a 5% royalty rate, over the 12-year range of our data university licensing
based on product sales contributed $2.6 billion to the U.S. GDP in 1996, and $16.8 billion in
2007. Under a less conservative but realistic assumption (2% royalty rate), the annual
contribution to GDP ranged from $5.9 billion in 1996 to more than $38.8 billion in 2007.
Without accounting for product substitution effects, we estimate that over the period 1996 to
2007, university licensing agreements based on product sales contributed at least $47 billion
and as much as $187 billion to the U.S. GDP. A moderately conservative estimate based on
5% royalty rates yields a total contribution to GDP for this period of more than $82 billion.
The large range of these estimates illustrates clearly the high sensitivity of our results to
assumptions about the royalty rates charged by universities on license agreements based on
product sales.

The Economic Impact of Licensed Commercialized Inventions Originating in University Research, 1996-2007
Final Report 8/31/09 Page 33
Table 4: Annual Change in U.S. GDP due to University-licensed Products, Selected Royalty Rates, 1996-2007
running royalty
sales revenues
(2% royalty rate)
sales revenues
(5% royalty rate)
sales revenues
(10% royalty rate)
Value added ratio from
U.S. I-O tables
Income from I-O model
(2% royalty rate)
Income from I-O model
(5% royalty rate)
Income from I-O
model (10 % royalty
rate)
total licensing income
total change in GDP (2% royalty rate)
total change in GDP
(5% royalty rate)
total change in GDP (10%
royalty rate)
Year millions millions millions millions millions millions millions millions millions millions millions
1996 $282.11 $14,106 $5,642 $2,821 0.39 $5,485 $2,194 $1,097 $365.22 $5,851 $2,559 $1,462
1997 $314.75 $15,737 $6,295 $3,147 0.39 $6,120 $2,448 $1,224 $482.79 $6,603 $2,931 $1,707
1998 $390.33 $19,517 $7,807 $3,903 0.40 $7,849 $3,139 $1,570 $613.55 $8,462 $3,753 $2,183
1999 $475.04 $23,752 $9,501 $4,750 0.40 $9,482 $3,793 $1,896 $675.47 $10,158 $4,468 $2,572
2000 $558.96 $27,948 $11,179 $5,590 0.40 $11,159 $4,463 $2,232 $1,099.89 $12,258 $5,563 $3,332
2001 $636.56 $31,828 $12,731 $6,366 0.40 $12,576 $5,030 $2,515 $868.28 $13,444 $5,899 $3,383
2002 $786.74 $39,337 $15,735 $7,867 0.41 $16,123 $6,449 $3,225 $997.83 $17,121 $7,447 $4,223
2003 $829.26 $41,463 $16,585 $8,293 0.40 $16,507 $6,603 $3,301 $1,033.61 $17,541 $7,637 $4,335
2004 $810.15 $40,508 $16,203 $8,102 0.40 $16,371 $6,548 $3,274 $1,088.47 $17,460 $7,637 $4,363
2005 $855.94 $42,797 $17,119 $8,559 0.39 $16,495 $6,598 $3,299 $1,774.97 $18,270 $8,373 $5,074
2006 $968.57 $48,429 $19,371 $9,686 0.40 $19,143 $7,657 $3,829 $1,511.58 $20,654 $9,169 $5,340
2007 $1,806.97 $90,349 $36,139 $18,070 0.41 $36,652 $14,661 $7,330 $2,098.78 $38,750 $16,759 $9,429
Total $435,770 $174,308 $87,154 $186,572 $82,195 $47,403
Note: Value added ratio = 0.3774 from 2005 I-O table for manufacturing.

The Economic Impact of Licensed Commercialized Inventions Originating in University Research, 1996-2007
Final Report 8/31/09 Page 34
Using the model depicted in Figure 6, above, which generates estimates of the contribution to
industry gross output due to university-licensed products, we calculated the total output
produced annually by university licensing revenues, the direct employment generated by these
revenues, and the total change in industry gross outputs due to this licensing activity (Table 5).
We again calculated a range of estimates based on the royalty rates charged in sales-based
licensing agreements. Under a moderately conservative assumption (5% royalty rates), as a
result of university licensing annual industrial output increased by $6.3 billion in 1996 and by
$39.7 billion in 2007. Using a less conservative assumption (2% royalty rates), the annual
contribution to industry output grew from $14.7 billion in 1996 to nearly $94.9 billion in 2007.
Summing over the entire 12 years for which we have data, we estimate that the total
contribution of university licensing to gross industry output at least $108.5 billion and as
much as $457.1 billion (again without accounting for product substitution effects). A
moderately conservative estimate based on 5% royalty rates yields an estimated impact of
university licensing on total industry output over 1996-2007 of $195.6 billion.
The I-O model also calculates the number of jobs directly created per million dollars of final
purchases and thus provides estimates of the total number of jobs created annually due to
university-licensed products. This ranged from about 9,000 jobs in 1996 to 41,000 in 2007. We
estimate that over the entire 12-year period, university-licensed products created more than
279,000 jobs.

The Economic Impact of Licensed Commercialized Inventions Originating in University Research, 1996-2007
Final Report 8/31/09 Page 35
Table 5: Annual Change in U.S. Industry Output due to University-licensed Products for Selected Royalty Rates, 1996-2007
licensing income
output multiplier from U.S. I-O tables
output of other
industries total
output
employment multiplier
from U.S. IO tables
employ-ment
sales revenues
(2% royalty rate)
sales revenues
(5% royalty rate)
sales revenues
(10% royalty rate)
total change
in output (2%
royalty rate)
total change
in output (5%
royalty rate)
total change in
output (10%
royalty rate)
year millions millions millions thousands millions millions millions millions millions millions
1996 $365.22 0.72 $263 $628 0.026 9 $14,106 $5,642 $2,821 $14,734 $6,270 $3,449
1997 $482.79 0.72 $348 $830 0.026 13 $15,737 $6,295 $3,147 $16,568 $7,125 $3,978
1998 $613.55 0.69 $424 $1,038 0.026 16 $19,517 $7,807 $3,903 $20,554 $8,844 $4,941
1999 $675.47 0.69 $467 $1,142 0.025 17 $23,752 $9,501 $4,750 $24,894 $10,643 $5,892
2000 $1,099.89 0.72 $788 $1,888 0.024 27 $27,948 $11,179 $5,590 $29,836 $13,067 $7,478
2001 $868.28 0.71 $614 $1,482 0.024 21 $31,828 $12,731 $6,366 $33,310 $14,213 $7,848
2002 $997.83 0.68 $678 $1,675 0.023 23 $39,337 $15,735 $7,867 $41,013 $17,410 $9,543
2003 $1,033.61 0.67 $697 $1,731 0.022 23 $41,463 $16,585 $8,293 $43,194 $18,316 $10,023
2004 $1,088.47 0.67 $727 $1,815 0.021 23 $40,508 $16,203 $8,102 $42,323 $18,018 $9,917
2005 $1,774.97 0.69 $1,225 $3,000 0.021 37 $42,797 $17,119 $8,559 $45,797 $20,119 $11,559
2006 $1,511.58 0.69 $1,044 $2,556 0.020 30 $48,429 $19,371 $9,686 $50,984 $21,927 $12,241
2007 $2,098.78 0.69 $1,444 $3,543 0.020 41 $90,349 $36,139 $18,070 $93,891 $39,682 $21,612
Total 279 $457,097 $195,636 $108,482
Notes: Output multiplier is millions of dollars of indirect output per million dollars of final purchases of education services. Employment multiplier is the
number of jobs (thousands) per million dollars of final purchases. Multipliers are for education. Employment multiplier = 0.021; output multiplier = 0.73.

The Economic Impact of Licensed Commercialized Inventions Originating in University Research, 1996-2007
Final Report 8/31/09 Page 36
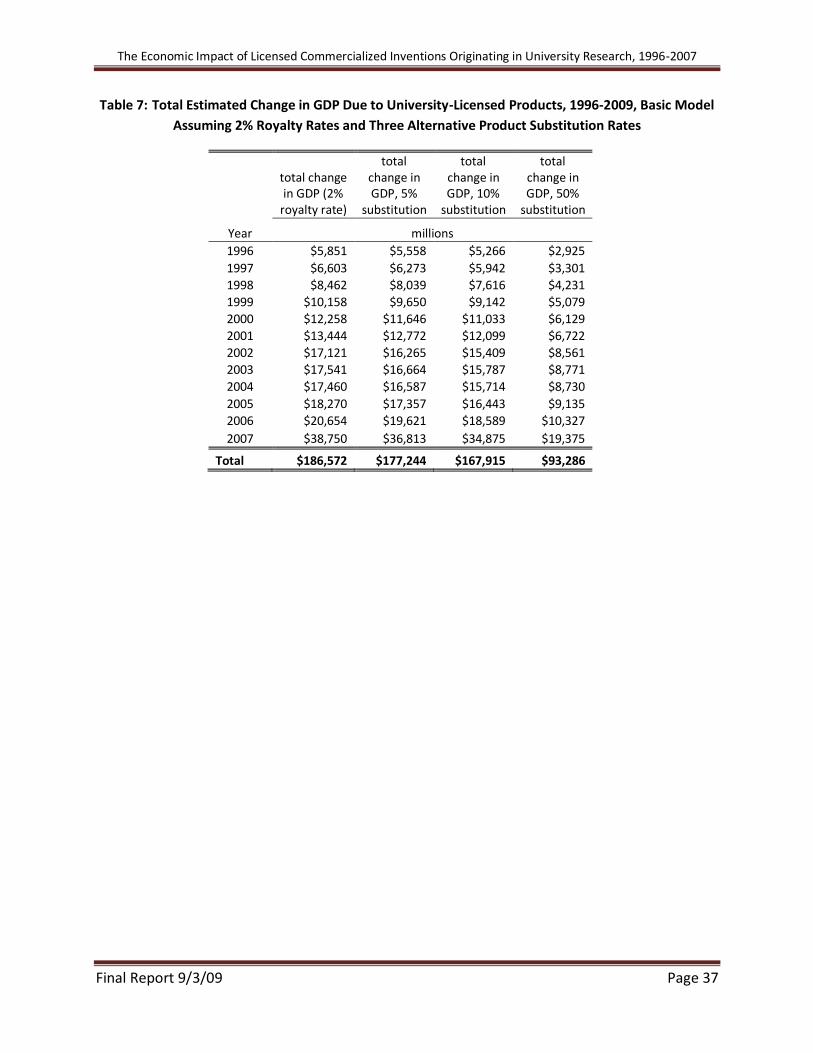
GDP Impact Estimates, Accounting for Product Substitution Effects
In this section we calculate the effects of product substitution on estimates of GDP impact. As
noted in the previous section, we use three “reasonable” assumptions: 5%, 10%, and 50%
substitution, with the latter probably excessively conservative. The results are shown below in
Tables 6 and 7, with Table 6 calculated with a conservative 5% royalty rate assumed, and Table
7 with a 2% assumption. Under a conservative royalty rate assumption, 5%, the estimated total
change in GDP over the 12 year period ranges from $41.1 billion to $78.1 billion, depending
upon the substitution rate assumed. Using a 2% royalty rate assumption, the estimated total
change in GDP ranges from $93.3 billion to $177.2 billion. We do not show the similar
calculations for contribution to changes in total industry output or employment under these
different assumptions, but of course the results are proportionately similar.
Table 6: Total Estimated Change in GDP Due to University-Licensed Products, 1996-2009, Basic Model
Assuming 5% Royalty Rates and Three Alternative Product Substitution Rates
total change in GDP (5%
royalty rate)
total change in GDP, 5%
substitution
total change in GDP, 10%
substitution
total change in GDP, 50%
substitution
Year millions
1996 $2,559 $2,431 $2,303 $1,280
1997 $2,931 $2,784 $2,638 $1,465
1998 $3,753 $3,565 $3,378 $1,877
1999 $4,468 $4,245 $4,022 $2,234
2000 $5,563 $5,285 $5,007 $2,782
2001 $5,899 $5,604 $5,309 $2,949
2002 $7,447 $7,075 $6,702 $3,724
2003 $7,637 $7,255 $6,873 $3,818
2004 $7,637 $7,255 $6,873 $3,818
2005 $8,373 $7,954 $7,536 $4,187
2006 $9,169 $8,710 $8,252 $4,584
2007 $16,759 $15,921 $15,083 $8,380
Total $82,195 $78,085 $73,976 $41,098
Note: 0.3774 value added ratio from 2005 I-O table for manufacturing
The Economic Impact of Licensed Commercialized Inventions Originating in University Research, 1996-2007
Final Report 9/3/09 Page 37
Table 7: Total Estimated Change in GDP Due to University-Licensed Products, 1996-2009, Basic Model
Assuming 2% Royalty Rates and Three Alternative Product Substitution Rates
total change in GDP (2%
royalty rate)
total change in GDP, 5%
substitution
total change in GDP, 10%
substitution
total change in GDP, 50%
substitution
Year millions
1996 $5,851 $5,558 $5,266 $2,925
1997 $6,603 $6,273 $5,942 $3,301
1998 $8,462 $8,039 $7,616 $4,231
1999 $10,158 $9,650 $9,142 $5,079
2000 $12,258 $11,646 $11,033 $6,129
2001 $13,444 $12,772 $12,099 $6,722
2002 $17,121 $16,265 $15,409 $8,561
2003 $17,541 $16,664 $15,787 $8,771
2004 $17,460 $16,587 $15,714 $8,730
2005 $18,270 $17,357 $16,443 $9,135
2006 $20,654 $19,621 $18,589 $10,327
2007 $38,750 $36,813 $34,875 $19,375
Total $186,572 $177,244 $167,915 $93,286
The Economic Impact of Licensed Commercialized Inventions Originating in University Research, 1996-2007
Final Report 9/3/09 Page 38
Summary and Discussion
University research and research-related activities contribute in many important ways to the
national economy, notably through increased productivity of applied R&D in industry due to
university-developed new knowledge and technical know-how, provision of highly valued
human capital embodied in faculty and students, development of equipment and
instrumentation used by industry in production and research, and creation of concepts and
prototypes for new products and processes. These benefits are enabled primarily through
publications, conferences, information exchange via consulting and collaborative research, and
hiring of trained students. This report documents the economic impact of just one of these
research-related activities, licensing of university intellectual property, clearly an impact of
major significance for the economy but by no means the largest source of the total impact of
university research.
Although some are inclined to consider the “entrepreneurial university” as a relatively sudden,
almost discontinuous feature of recent academic life, in fact the economic significance of
universities has been recognized since the late 19th century; only the relative importance and
sheer size of the various outputs listed above have changed. One especially obvious change is
evidenced by the trends in university patenting and licensing of intellectual property, which
began in the 1920s but accelerated dramatically in the last twenty-five years. In the 1970s
most large, research-intensive universities took steps to manage their intellectual property
internally rather than contract it out, so that now university offices of technology transfer are a
common feature of university administrative structures. Although there is widespread
agreement that university licensing of intellectual property has considerable economic
significance, there is very little published, well-documented empirical evidence of its actual
impact.
Our review of the literature found few examples of studies that sought to estimate the impact
of university research on the U.S. national economy. However, a Canadian study used input-
output modeling to estimate that an annual investment (1994-5) of $4.8 billion in university
research added $1.5 billion to Canada’s GDP and created 13,000 jobs. Accounting for the
effects of university research over the long-term using total factor productivity methods yielded
a total contribution to GDP of $15.5 billion. Most U.S. studies do not single out the impact of
university research, but rather estimate the regional economic impact of all university activities,
treating them primarily as sources of additional expenditures in the region. Some studies
identify separately the (relatively modest) impact of university-based start-ups on the regional
economy and employment. A typical example of the former is a study of the impact of Cornell
University on the state of New York for the academic year 2004-5. The results were an
The Economic Impact of Licensed Commercialized Inventions Originating in University Research, 1996-2007
Final Report 9/3/09 Page 39
estimated impact of $3.3 billion in additional economic activity in the state, a direct or indirect
impact of 36,000 jobs, and $173 million in state and local tax revenues. As an example of the
latter, a University of Washington study cited data on the impact of university-related start-ups
for 2000; it reported a cumulative figure of 150 start-ups, 7100 jobs created, generation of $1.5
billion in sales revenues, and $25 billion in stock market capitalization.
In one of the rare studies that focused on the economic impact of university licensing, staff of
the MIT licensing office surveyed a sample of MIT licensees in 1993 to obtain information on
pre-production investment and jobs created. Projecting their results to the entire MIT
portfolio, they estimated an induced investment of $922 million and an employment impact of
about 2,300 FTEs. They then used AUTM data to project their results to the national level using
two methods. One method resulted in a national impact estimate of $2.5 billion in pre-
production investment; the second resulted in an estimate of $5 billion. These investment
levels were estimated to contribute employment gains of between 20,000 and 40,000.
An AUTM internal study conducted in 1993 used an approach similar to ours in that it resulted
in an estimated $17 billion in product sales attributable to university-based licenses, with a
related estimate of 137,000 jobs “supported.” AUTM used the same approach in 2002 with
2000 data. They assumed a range of 2-4% royalty rates and calculated estimates of sales
increases of between $17 billion and 35 billion, 125,000-250,000 jobs supported, and tax
payments of $2.5-5 billion. These AUTM calculations did not employ standard measures of
economic performance such as value added or GDP (sales revenue estimates alone include
purchases of intermediate inputs used to produce the outputs). Nor did they apply I-O
employment output multipliers to data on total industry output estimates generated by
licensing income, instead apparently estimating employment impact by calculating the number
of jobs that could be supported (loaded average salary) by the total sales revenues generated
by products based in university licenses.
Our approach to estimating the impact of university licensing employs a number of features
that we believe provide considerably more valid and complete estimates of national economic
impact, while at the same time incorporating many assumptions that lead to very conservative
results. As far as the validity of our estimates is concerned, our approach employs a national
input-output model that accounts for the fact that sales revenue estimates do not themselves
represent economic impact. As noted above, sales revenue estimates, however generated,
include the industry purchases of intermediate inputs; and they do not account for the
expenditures of those revenues for multiple purposes before having a final impact on value
added or GDP. Furthermore, our approach accounts for the fact that university expenditures of
their licensing income has significant direct and induced economic impact and thus should be
included in any national (or, for that matter, regional) impact estimates. Finally, although we
The Economic Impact of Licensed Commercialized Inventions Originating in University Research, 1996-2007
Final Report 9/3/09 Page 40
were unable to obtain consistent data on university income from license-related R&D contracts,
these too add to the total university economic impact of licensing.
We have been very careful to employ conservative assumptions at all points requiring that
some judgments be made. First, we used ranges rather than average or median values for key
parameters for which there are no reliable data, or for which the distribution of data within the
range are unknown but almost certainly skewed. Second, we provided a means for accounting
for product substitution effects using a wide range of reasonable rates. Finally, we have made
the model and calculations as simple and transparent as possible, so that anyone with a
spreadsheet can take our model and the data and enter their own set of assumptions. This
seems to be the most appropriate way to generate estimates, since choice of the assumptions
should be up to the user.
There are a number of refinements and next steps that would further enhance these estimates.
They depend largely on access to data that either do not now exist or are not publicly available.
Probably the most important step would be to obtain detailed, representative data on the
licensing portfolios of U.S. universities. This would enable more accurate assumptions to be
made about the range of royalty rates to enter into the model, thereby reducing the wide range
of impact estimates generated. Second, we know that impact estimates will vary by economic
sector, so that as sectoral breakdown data become available, even using very broad categories,
they can be introduced into the model to generate sector-specific impacts. Ideally, sectoral
breakdowns are desirable for ranges of royalty rates charged and for total licensing income and
running royalties. Then, I-O output and employment multipliers can be adjusted to reflect
more accurately the contribution of industries involved. Third, more complete and internally
consistent annual data on the contract R&D income generated by university licenses would be
highly desirable and could easily be entered into the calculations called for in our model.
Although somewhat outside the scope of our effort, models similar to ours could be
constructed for estimating the national economic impact of pre-production investments in
university-licensed technology. This would require sizeable effort and expense, given that the
data must be acquired at individual universities, but it may be feasible to develop a
representative sample of universities and follow the Pressman, et al. approach, combined with
our approach to estimating impact on GDP and employment, to generate national economic
impact estimates of pre-production investments. Adding these results to ours would yield even
more accurate estimates of university licensing’s important contribution to the national
economy. Additionally, in the absence of detailed data on which licenses are exclusive vs.
nonexclusive, we could not account for the fact that in some cases (e.g. nonexclusive licenses)
the university IP may not be fully responsible for the new product and its sales. Of course,
additional research on the economic impact of other manifestations of the value of university
The Economic Impact of Licensed Commercialized Inventions Originating in University Research, 1996-2007
Final Report 9/3/09 Page 41
IP, notably start-ups and the taking of equity positions, would further expand our knowledge of
the economic impact of university research and licensing. Finally, it should be noted that our
model can be used to estimate the regional economic impact of single universities by
employing a regional input-output model and the university’s own data on licensing income and
range of royalty rates. Since individual universities have a much better idea of the range of
royalty rates they use and the distribution of licenses by industry, they can generate a narrower
range of impact estimates than we have been able to do with national data and widely ranging
assumptions concerning royalty rates.

The Economic Impact of Licensed Commercialized Inventions Originating in University Research, 1996-2007
Final Report 9/3/09 Page 42
References
Agrawal, A. and Henderson, R. “Putting Patents in Context: Exploring Knowledge Transfer from MIT.” Management Science 48, 1 (2002):44-60.
Appleseed, Inc. Cornell University: Economic Impact on New York State. February 2007.
Appleseed, Inc. Engines of Economic Growth: The Economic Impact of Boston’s Eight Research Universities on the Metropolitan Boston Area. Report Summary, no date. www.masscolleges.org.
Atkinson, Richard C., and William A. Blanpied. “Research Universities: Core of the U.S. Science and Technology System”; Technology in Society, 30, pp. 30-48, 2008.
AUTM Annual Licensing & Activity Survey, FY2007 Survey Summary.
AUTM, 2009 Better World Report, AUTM, 2009.
Bremer, H., Allen, J., and Latker, N.J. “The Bayh-Dole Act and Revisionism Redux,” Patent,
Trademark & Copyright Journal, 8/14/09.
Cohen, W., Florida, R., Randazzese, L., and Walsh, J. “Industry and the Academy: Uneasy Partners in the Case of Technological Advance,” in R. Noll, ed., Challenges to Research Universities, Brookings, 1998.
Cohen, W.M, Nelson, R.R., at al. “Links and Impacts: The Influence of Public Research on Industrial R&D.” Management Science 48, 1 (2002): 1-23.
Connecticut Center for Economic Analysis, The Economic Impact of Research at the University of Connecticut and the University Health Center, April 2005. http://ccea.uconn.edu.
Drucker, J. and Goldstein, H. “Assessing the Regional Economic Development Impacts of Universities: A Review of Current Approaches,” International Regional Science Review 30, 1 (January 2007): 20-46.
Feller, Irwin, Catherine P. Ailes, and David Roessner, “Impacts of Research Universities on Technological Innovation in Industry: Evidence from Engineering Research Centers,” Research Policy, 31, 3 (2002): 457-474
Geiger, R. To Advance Knowledge: The Growth of American Research Universities, 1900-1940, New York: Oxford University Press, 1986.
Goldstein, H.A., Maier, G., and Luger, M.I. “The University as an Instrument for Economic and Business Development: U.S. and European Comparisons.” In D.D. Dill and B. Sporn, eds. Emerging Patterns of Social Demand and University Reform: Through a Glass Darkly. Elmsford, NY: Pergamon, 1995.
The Economic Impact of Licensed Commercialized Inventions Originating in University Research, 1996-2007
Final Report 9/3/09 Page 43
Graff, G., Heiman, A., and Zilberman, D. “University Research and Offices of Technology Transfer,” California Management Review 45 (2002): 88-115.
Horowitz, Karen J. and Mark A. Planting, Concepts and Methods of the Input-Output Accounts, U.S. Bureau of Economic Analysis, U.S. Department of Commerce (September 2006). Klevorick, A, Levin, R., Nelson, R.R., and Winter, S. “On the Sources and Significance of Interindustry Differences in Technological Opportunities,” Research Policy 24 (1995): 185-205. Kramer, P.B., Scheibe, S.L., Reavis, D.Y., and Berneman, L.P., “Induced Investments and Jobs Produced by Exclusive Patent Licenses—A Conformatory Study.” AUTM Journal, 9 (1997): 43-56.
Mansfield. E. “Academic Research and Industrial Innovation,” Research Policy 20 (1991): 1-12.
Martin, F. “The Economic Impact of Canadian University R&D,” Research Policy 27 (1998): 677-687.
Martin, F. and Trudeau, M. “The Economic Impact of University Research,” Research File, 2, 3 (March 1998).
Mowery, David C. and Rosenberg, Nathan. Technology and the Pursuit of Economic Growth. Cambridge University Press, 1989.
Mowery, D., Nelson, R. R., Sampat, B.N., and Ziedonis, A.A., Ivory Tower and Industrial
Innovation: University-Industry Technology Transfer before and after the Bayh-Dole Act.
Stanford University Press, 2004.
Mowery, D.C., Nelson, R.R., Sampat, B.N., and Ziedonis, A.A. “The Growth of Patenting and Licensing by U.S. Universities: An Assessment of the Effects of the Bayh-Dole Act of 1980.” Research Policy 30 (2001): 99-119.
Mowery, D.C., and Sampat, B.N. “University Patents, Patent Policies, and Patent Policy Debates, 1925-1980.” Industrial and Corporate Change 10 (2001): 781-814.
National Academy of Engineering, The Impact of Academic Research on Industrial Performance. National Academies Press, 2003.
National Science Board, Science and Engineering Indicators 2008. National Science Foundation, 2008.
National Science Board, Research and Development: Essential Foundation for U.S. Competitiveness in a Global Economy, NSB, January, 2008.
Neal, Homer A., Smith, Tobin L. and McCormick, Jennifer B. Beyond Sputnik: U.S. Science Policy in the 21st Century. The University of Michigan Press, 2008.

The Economic Impact of Licensed Commercialized Inventions Originating in University Research, 1996-2007
Final Report 9/3/09 Page 44
Nelson, R.R. “Institutions Supporting Technical Advance in Industry,” American Economic Review 76 (1986): 186-189.
Organisation for Economic Co-operation and Development (OECD). “Blue Sky II 2006”; What Indicators for Science, Technology and Innovation Policies in the 21st Century?
Parr, Russell I. “Royalty Rates & License Fees for Technology,” les Nouvelles, March 2009: 15 17.
Roessner, David. Outcomes and Impacts of the State/Industry University Cooperative Research Centers (S/IUCRC) Program. Arlington, VA: SRI International, October 2000. Final Report to the National Science Foundation Engineering Education and Centers Division.
Rosenberg, Nathan, and Nelson, Richard. “American Universities and Technical Advance in Industry,” Research Policy, 23 (1994): 325-348.
Sampat, B.V. “Recent Changes in Patent Policy and the ‘Privatization’ of Knowledge: Causes, Consequences, and Implications for Developing Countries.” In Knowledge Flows and Knowledge Collectives: Understanding the Role of Science and Technology Policies in Development, Consortium for Science, Policy and Outcomes, Arizona State University, 2003.
Pressman, L. “What is Known and Knowable about the Economic Impact of University Technology Transfer Programs?” presented at the 2002 annual meeting of the National Association of State Universities and Land Grant Colleges, Chicago, IL, 2002.
Pressman, L., Guterman, S.K., Abrams, I., Geist, D.E., and Nelsen, L.L. “Pre-Production Investment and Jobs Induced by MIT Exclusive Patent Licenses: A Preliminary Model to Measure the Economic Impact of University Licensing,” AUTM Journal, 7 (1995): 28-48.
Rosenberg, N. and Nelson, R.R. “American Universities and Technical Advance in Industry,” Research Policy 23 (1994): 323-348.
University of Washington, University of Washington: Engine of the Knowledge-Based Economy, nd.

The Economic Impact of Licensed Commercialized Inventions Originating in University Research, 1996-2007
Final Report 9/3/09 Page 45
Appendix A
Empirical Evidence of the Economic Impact of University Research and Licensing:
an Overview of the Literature
An interesting and, possibly, unique study of the national economic impact of university
research was done by Canadian researchers and applied to their own country (Martin, 1998;
Martin and Trudeau, 1998). Martin and Trudeau first estimated the gross static impact of
university research spending using a standard input-output model. The results showed that an
annual investment of $4.8 billion in university research (AY 1994-95) “sustained” $5 billion in
GDP and supported 81,000 full-time jobs. The authors note that this procedure overestimates
the impact because it does not take into account the alternative use of resources. When
sources of overestimation were eliminated, the net addition to GDP was $1.5 billion and 13,000
jobs in 1994-95. Martin and Trudeau then point out that input-output models treat all
expenditures as having equal impact on the economy—a sports stadium would produce the
same static impact as would equal expenditures on genetics or new materials research. But
research results--new knowledge--affect industrial productivity over the long term. Accounting
for the effects of university research on total factor productivity yielded a total net contribution
of university R&D to Canadian GDP of $15.5 billion, corresponding to 150,000 to 200,000 jobs.10
Drucker and Goldstein (2007) identify and review four methodological approaches to
investigating the impacts of universities on regional economies: single-university impact
studies, surveys, knowledge-production functions, and cross-sectional and quasi-experimental
designs. They conclude that “the majority of empirical analyses do demonstrate that the
impacts of university activities on regional economic development are considerable” (p. 40). A
typical example of a single-university impact study is the report on the economic impact of
research at the University of Connecticut conducted by the Connecticut Center for Economic
Analysis (2005). Using a standard approach to estimating regional impact (input-output
modeling and research-related output counts), about $188 million in external funding flowed
into UConn programs in FY 2003. Through multiplier effects, expenditure of these funds for
salaries and equipment created 5,113 jobs, added $397 million in new Gross State Product, and
generated $283 million in new personal income in the long run. In addition, spin-off firms
created about 150 new jobs.
10 Martin and Trudeau simply divided $15.5 billion by a range of average loaded salary figures to obtain these “supported” employment estimates. They do not represent an estimate of actual employment increase.

The Economic Impact of Licensed Commercialized Inventions Originating in University Research, 1996-2007
Final Report 9/3/09 Page 46
Using a similar approach, Appleseed, Inc., studied the economic impact of Cornell University on
the state of New York (Appleseed, 2007), reporting that the university’s direct and indirect
expenditures during the academic year 2004-5 generated more than $3.3 billion in economic
activity in the state, directly or indirectly accounted for 36,000 jobs, and generated $173 million
in state and local tax revenues. In addition, research activity led to creation of 28 spin-off
companies. Appleseed (which specializes in these kinds of studies) was commissioned by eight
major research universities in the Boston area to estimate their collective impact on the
regional economy. Expenditures of $3.9 billion had a collective regional economic impact of
more than $7 billion in 2000. The institutions employed nearly 49,000 people, and their
spending supported an additional 37,000 jobs. The eight universities assisted in the start-up of
41 new companies and granted 280 licenses to private ventures; licensing of technologies by
these eight universities in 2000 generated $44.5 million in income. Focusing on the economic
impact of university-related start-up companies alone, a University of Washington report cited
data from the year 2000 for a cumulative 150 start-ups: 7100 direct jobs created, $1.5 billion in
sales revenues, and $25 billion in stock market capitalization (U. of Washington, nd).
A shortcoming of these kinds of impact studies is that universities are, for impact estimate
purposes, treated no differently than any organization that generates expenditures in the
regional economy. The unique roles of universities in creating new knowledge and human
capital are largely ignored, yet it is just these research-related activities and outputs that are of
interest to us in this report. The problem is that converting the value of these outputs into
monetized form is difficult, at best. Still, it is essential to acknowledge explicitly the enormous
value to the economy of university research and human capital outputs in order to provide the
appropriate context for our own impact estimates of university licensing is to be presented.
Indeed, the economic impact of all university knowledge and technology transfer activities is
considerably larger than the impact of licensed intellectual property alone.
Licensing income to universities based on ownership of intellectual property is, of course, an
obvious indicator of the economic value of university research. Patent income to U.S.
universities grew from about $200 million in 1991 to over $1.2 billion in 2000 (Graff, et al.,
2002). However, it is important to re-emphasize a point made earlier, namely that patenting
and licensing is just one channel through which research knowledge is transferred to industry,
and likely not among the most important ones. The Carnegie Mellon survey of industrial lab
managers referred to above (Cohen, et al., 1998) showed that only 10 percent of those
responding said that licensing agreements with universities were “moderately” or “very”
important to their R&D activities; more important were publications, informal channels, public
meetings and conferences, consulting, and contract research.

The Economic Impact of Licensed Commercialized Inventions Originating in University Research, 1996-2007
Final Report 9/3/09 Page 47
In a rare effort to estimate the economic impact of university licensing, Pressman and her
colleagues (Pressman, et al., 1995) at the MIT Technology Licensing Office surveyed a sample of
MIT licensees to obtain information on pre-production investment and jobs created, as a
complement to prior estimates of post-production economic impacts by AUTM staff of product
sales and jobs created based on 1993 data from the AUTM survey on royalty income.11 The
authors defined pre-production investment as “Money spent developing new products and
efficient ways to produce and market these products. It excludes the costs of producing (or
investment required to produce) mature products” (p. 30). The information collected from
licensees pertained to a sample of MIT’s 1993 portfolio of 205 active, exclusive licenses—18 in
the physical sciences and 19 in the biotech sample. The total self-reported investment by the
sample licensees was $205 million, and the total number of full time equivalents (FTEs)
generated was 470. The authors then extrapolated the sample results to the entire portfolio,
yielding an induced investment estimate of $922 million and employment estimate of about
2,300 FTEs. The authors then went one step further and extrapolated from the MIT license
data to university licenses as a whole, using AUTM data. They used two methods: one based on
the MIT results of induced investment per license per year, and a second based on induced
investment compared with licensing revenue to the university. This first method yielded an
estimate of $2.5 billion for pre-production investment associated with all university licenses per
year. The second method yielded an estimate to total induced investment nationally of $5
billion in 1993. These investment levels were, in turn, estimated to contribute 20,000 to 40,000
jobs to the national economy—before sales of licensed products.
In a confirmatory study to the MIT effort published in 1997, counterparts to the MIT TLO staff
at the University of Pennsylvania’s Center for Technology Transfer used the same approach to
estimate the induced investments and jobs produced by exclusive patent licenses. The Penn
portfolio consisted of 43 exclusive, active, patent licenses generated $151 million in induced
investments and created 242 full-time jobs. Their extrapolation to all universities using 1995
AUTM data yielded a national estimate of induced investments of $4.6 billion and 27,000 jobs
created (Kramer, et al., 1997).
The 1993 AUTM estimate of the post-production economic impact of university licensing cited
above appears to employ an approach that includes elements of the one we developed for this
study. Although details of the method are not published, evidently AUTM used estimates of
average royalty rates for 1993 to estimate product sales for that year generated from AUTM
data on licensing revenues received by member organizations. To estimate the number of jobs
11
The post-production study referred to in Pressman, et al., 1995 has not been published. The results yielded estimates of $17 billion in new product sales and 137,000 jobs in 1993. This study used royalty rate data to estimate new product sales attributable to university-based licensing, and in that respect used a portion of the approach we describe in this report.

The Economic Impact of Licensed Commercialized Inventions Originating in University Research, 1996-2007
Final Report 9/3/09 Page 48
supported (not created) by these additional sales, they used Census data on total industrial
research expenditures and engineers employed doing R&D to obtain an average figure for the
loaded cost of an R&D engineer. Then the ratio of sales to average loaded salary of an R&D
engineer produced a figure for jobs supported by those sales. In a 2002 presentation made at
the annual meeting of the National Association of State Universities and Land Grant Colleges,
Lori Pressman (2002) provided more recent estimates using this method for licensing impact
“guesstimates” for the year 2000. Using an average royalty rate of 2% yielded pre-production
impacts of about $5 billion and product sales of about $35 billion, 250,000 jobs supported, and
tax payments of about $5 billion. Use of a 4% average royalty rate yielded impact estimates of
about half these amounts.
The National Science Board’s Science and Engineering Indicator report series has traditionally
incorporated indicators of academic outputs and impacts—including numbers of science and
engineering (S&E) students graduated at various levels, trends in S&E literature, and patenting
and licensing activities of universities. The following Appendix Table A-1 provides some of the
patenting and licensing activity data presented in Science and Engineering Indicators 2008.

The Economic Impact of Licensed Commercialized Inventions Originating in University Research, 1996-2007
Final Report 8/31/09 Page 49
Appendix table A-1
Academic patenting and licensing activities: 1991–2005
Activity indicator
1991 (98)
1992 (98)
1993 (117)
1994 (120)
1995 (127)
1996 (131)
1997 (132)
1998 (132)
1999 (139)
2000 (142)
2001 (139)
2002 (156)
2003 (165)
2004 (164)
2005 (158)
Millions of dollars
Net royaltiesa NA NA 195.0 217.4 239.1 290.1 391.1 517.3 583.0 1,012.0 753.9 868.9 866.8 924.8 1,588.1
Gross royaltiesa 130.0 172.4 242.3 265.9 299.1 365.2 482.8 613.6 675.5 1,108.9 868.3 997.8 1,033.6 1,088.4 1,775.0
Royalties paid to others NA NA 19.5 20.8 25.6 28.6 36.2 36.7 34.5 32.7 41.0 38.8 65.5 54.4 67.8
Unreimbursed legal fees expended 19.3 22.2 27.8 27.7 34.4 46.5 55.5 59.6 58.0 64.2 73.4 90.1 101.3 109.2 119.1
Number
Invention disclosures received 4,880 5,700 6,598 6,697 7,427 8,119 9,051 9,555 10,052 10,802 11,259 12,638 13,718 15,002 15,371
New U.S. patent applications filed 1,335 1,608 1,993 2,015 2,373 2,734 3,644 4,140 4,871 5,623 5,784 6,509 7,203 9,462 9,306
U.S. patents granted NA NA 1,307 1,596 1,550 1,776 2,239 2,681 3,079 3,272 3,179 3,109 3,450 3,268 2,944
Startup companies formed NA NA NA 175 169 184 258 279 275 368 402 364 348 425 418
Revenue-generating licenses/options 2,210 2,809 3,413 3,560 4,272 4,958 5,659 6,006 6,663 7,562 7,715 8,490 8,976 9,543 10,251
New licenses/options executedb 1,079 1,461 1,737 2,049 2,142 2,209 2,707 3,078 3,295 3,569 3,300 3,660 3,855 4,087 4,201
Equity licenses/options NA NA NA NA 99 113 203 210 181 296 328 373 316 318 278
NA = not available aOne-year spikes in royalty data reflect extraordinary one-time payments. bData prior to 2004 may not be comparable with data for 2004 and beyond due to change in survey wording. NOTES: Number of institutions reporting given in parentheses. Data from nonuniversity hospitals and medical institutes not included. SOURCE: Association of University Technology Managers, AUTM Licensing Survey (various years) and Science and Engineering Indicators 2008

The Economic Impact of Licensed Commercialized Inventions Originating in University Research, 1996-2007
Final Report 8/31/09 Page 50
Appendix B
The Bureau of Economic Analysis National Input-Output Model:
a Brief Description
The national I-O model allows users to assess the impact of specified events on economic
activity. There are two broad applications of the basic model. The first is the economic
accounting model and the other is the analytical model. The accounting model provides a
framework for examining the relationship between final purchases (equivalent to gross
domestic product, or GDP) and industry gross output. It shows the relationship between the
producing sectors, final demand, and income by industry. It also shows industry purchases of
goods and services that are used as inputs to produce goods and services commodities. These
commodities in turn are inputs for other industries, or are purchases by final users.12 As
employed in this study, the accounting model is used to estimate the impact of university
licensing on GDP.
The easiest way to see how the model can be used to analyze this impact is first to look at what
national economic accountants call the “Input-Output Table” (Table B-1). The main section of
this table, section F, illustrates the commodities (goods and services) that are used by industries
in the economy.
Table B-1.—Sample Input-Output Table
Industries Final Uses Total Output
Industries
F Y X
Value Added V
Total Output X
Gross output (sections X), the principal I-O measure of output, includes the value of what is
produced and subsequently used by other industries in their production processes
(intermediate products or inputs), as well as the value of what is produced and sold to final
users (i.e., final products). Gross output is sometimes referred to as “gross duplicated domestic
output,” because it counts both the industry output that is recorded as final product and the
12 See Horowitz and Planting, 2006, and www.bea.gov, Industry Accounts.

The Economic Impact of Licensed Commercialized Inventions Originating in University Research, 1996-2007
Final Report 9/3/09 Page 51
industry output that is purchased by other industries for use as inputs to their production
processes.
Industry “value added” (section V) is defined as the value of an industry’s sales to other
industries and to final users minus the value of its purchases to produce its output (section F);
its purchases from other industries are called intermediate inputs in the accounts. Value added
is a non-duplicative measure of production that, when aggregated across all industries, equals
the gross domestic product (GDP) for the economy. This measure for industries can be seen in
section V of Table B-1. Value added is the sum of: compensation of employees, taxes on
production and imports, less subsidies, and gross operating surplus (or more commonly known
as profits). Value added or GDP excludes intermediate purchases. Another way to measure
GDP is to sum all final uses, represented in section Y of Table B-1. This sum includes: personal
consumption expenditures; private fixed investment; changes in inventories; exports of goods
and services; imports of goods and services; and government consumption expenditures and
gross investment. The sum of the final uses equals the sum of all industries’ value added.
The second application of the I-O framework is an analytical model that is derived from the
accounting model. It is used to show the relationship between final demand and industry
production. Industry production is usually measured in terms of gross output, income, or
employment. The model may be used to evaluate the interrelationships among industries and
the relationships between industries and the commodities they use and produce. The
analytical model is derived from the input-output table, usually referred to as the total
requirements tables; a brief description of the calculation of the total requirements is shown in
Table B-2. The input-output requirements tables are analytical tables designed to show the
level of industry gross output or employment required to produce a specified level of final uses.

The Economic Impact of Licensed Commercialized Inventions Originating in University Research, 1996-2007
Final Report 9/3/09 Page 52
Table B-2. Derivation of the Total Requirements Multipliers
Step
Definitions X -- column in I-O matrix representing industry gross output
Y – column in I-O matrix representing final uses of industry output
F – Intermediate portion of the use table (inputs to industries)
A – matrix of industry inputs as a portion of total industry output (direct requirements matrix)
Direct requirements A = Fx-1 where x is a matrix with gross output on the
main diagonal of the matrix.
Total requirements X – AX = Y
(I-A)X = Y
X = (I-A)-1 Y