Global Journal of esearch Business
140
Global Journal of Business R esearch VOLUME 7 NUMBER 5 2013 CONTENTS The Evolution of Regional Wage Differentials in a Transition Economy: Evidence from Poland 1 Vera A. Adamchik & Thomas J. Hyclak Efficiency of the Eastern Caribbean Securities Exchange 15 Kirwins Charles, Bruce Niendorf & Kristine Beck Determinants of Economic Success in the Middle East and North Africa 25 Felina B. Duncan & Zulal S. Denaux Global Stock Price Linkages around the US Financial Crisis: Evidence from Indonesia 35 Aldrin Herwany & Erie Febrian Leadership Styles and Organizational Effectiveness in Small Construction Businesses in Puebla, Mexico 47 Rafaela Martínez Méndez, José Gerardo Serafín Vera Muñoz & María Antonieta Monserrat Vera Muñoz The Impact of Microcredit on Women-Owned Small and Medium Enterprises: Evidence from Kenya 57 Clemencia Osa Ouma & Charles M. Rambo The Impact of Credit Union Financial Intermediation on Economic Growth: A Multi-Country Analysis 71 Michael Adusei & Samuel Kofi Afrane E-Governance in Arab Countries: Status and Challenges 79 Alaa-Aldin Abdul Rahim A. Al Athmay The Complementarity of Corporate Social Responsibility and Innovation: Evidence from Belgian Firms 99 Ferauge Perrine Extreme Programming Project Performance Management by Statistical Earned Value Analysis 115 Wei Lu & Li Lu What Do Experts Expect from Human Resource Practices 121 Jocelyne Abraham, Lucie Morin, Stephane Renaud, Jean-Yves Saulquin & Richard Soparnot
Transcript of Global Journal of esearch Business

Global Journal of Business Research
VOLUME 7 NUMBER 5 2013
CONTENTS
The Evolution of Regional Wage Differentials in a Transition Economy: Evidence from Poland 1Vera A. Adamchik & Thomas J. Hyclak
Efficiency of the Eastern Caribbean Securities Exchange 15Kirwins Charles, Bruce Niendorf & Kristine Beck
Determinants of Economic Success in the Middle East and North Africa 25Felina B. Duncan & Zulal S. Denaux
Global Stock Price Linkages around the US Financial Crisis: Evidence from Indonesia 35Aldrin Herwany & Erie Febrian
Leadership Styles and Organizational Effectiveness in Small Construction Businesses in Puebla, Mexico 47Rafaela Martínez Méndez, José Gerardo Serafín Vera Muñoz & María Antonieta Monserrat Vera Muñoz
The Impact of Microcredit on Women-Owned Small and Medium Enterprises: Evidence from Kenya 57Clemencia Osa Ouma & Charles M. Rambo
The Impact of Credit Union Financial Intermediation on Economic Growth: A Multi-Country Analysis 71Michael Adusei & Samuel Kofi Afrane
E-Governance in Arab Countries: Status and Challenges 79Alaa-Aldin Abdul Rahim A. Al Athmay
The Complementarity of Corporate Social Responsibility and Innovation: Evidence from Belgian Firms 99Ferauge Perrine
Extreme Programming Project Performance Management by Statistical Earned Value Analysis 115Wei Lu & Li Lu
What Do Experts Expect from Human Resource Practices 121Jocelyne Abraham, Lucie Morin, Stephane Renaud, Jean-Yves Saulquin & Richard Soparnot


GLOBAL JOURNAL OF BUSINESS RESEARCH ♦ VOLUME 7 ♦ NUMBER 5 ♦ 2013
1
THE EVOLUTION OF REGIONAL WAGE DIFFERENTIALS IN A TRANSITION ECONOMY:
EVIDENCE FROM POLAND Vera A. Adamchik, University of Houston-Victoria
Thomas J. Hyclak, Lehigh University
ABSTRACT
This paper uses micro data from the Labor Force Surveys to examine regional wage differentials and their dynamics in Poland over 1994-2007. We find that controlling for observed worker characteristics reduces regional wage disparity by 30-50 percent, but remaining wage differentials persist and seem to intensify over time. JEL: J31, P23, R23 KEYWORDS: Regions, Wage Differentials, Transition Economies INTRODUCTION
conomic and social cohesion has been one of the major priorities of the European Union since its inception in the 1950s. The mission of the EU cohesion policy was first defined in the preamble of the Rome Treaty (1957) as the need to ensure “harmonious development by reducing the
differences existing between the various regions and the backwardness of the less favoured regions.” The Single European Act (1986) established a European Community policy of economic and social cohesion, and the Lisbon Treaty (2007) recognized ‘territorial cohesion’ as a general political objective in addition to economic and social cohesion. The EU regional policy gained in importance after 2004 with the accession of 12 new member countries which all had relatively low levels of economic development (Bulgaria, Cyprus, Czech Republic, Estonia, Hungary, Latvia, Lithuania, Malta, Poland, Romania, Slovakia and Slovenia). Financial resources for cohesion policy increased significantly and now constitute the second largest outlay in the EU budget after the Common Agricultural Policy. For instance, the Structural and Cohesion Funds amounted to €213 billion for EU-15 and €21.7 billion for the 10 new Member States in the 2000-2006 planning period and to €347 billion in the 2007-2013 planning period. This constitutes over one third of the EU budget and about 0.4 percent of the total GDP of the EU. In 2007-2013 Poland was the main beneficiary country (€67.3 billion), followed by Spain (€35.2 billion), Italy (€28.8 billion), Czech Republic (€26.7 billion), Germany (€26.3 billion), Hungary (€25.3 billion), Portugal (€21.5 billion), and Greece (€20.4 billion) (EC, 2008, pp. 21, 25). Notwithstanding these huge expenditures, the impact of the EU regional policy on regional development and convergence is not clear-cut (see Busillo et al., 2010 for an overview). Interestingly enough, both converging and diverging tendencies are being reported for the EU area: while regional disparities between the EU countries have been narrowing, regional disparities within member countries – particularly the new ones – have widened (EC, 2003, p. 3; Monfort, 2008, pp. 5-6; EC, 2010a, pp. 13-14; EC, 2010b, pp. 57-58). For instance, EC (2010b) reports that the extent of regional dispersion in GDP per capita (as measured by the logarithmic deviation index) across the EU-25 declined from 8.3 in 1995 to 6.3 in 2006. At the same time, the index of regional dispersion increased from 4.9 to 5.5 across the sub-group of the 10 new members. The regional dispersion also widened within the Czech Republic (from 2.5 to 5.3), Hungary (from 4.0 to 8.5), Slovakia (from 5.9 to 8.0) and Poland (from 1.4 to 3.1).
E

V. A. Adamchik & T. J. Hyclak | GJBR ♦ Vol. 7 ♦ No. 5 ♦ 2013
2
These empirical findings should be treated with caution, though. Many of these analyses employed aggregate regional data, typically GDP per capita or wage per person. However, GDP is a measure of market production and not a good measure of well-being (Stiglitz et al., 2008, p. 8). What is more important is that all aggregate approaches are flawed in their failure to account for regional heterogeneity. They implicitly assume regional homogeneity, meaning that individual differences average out in large populations, and regional macro metrics converge upon some common value. In reality, however, regions differ in their demographic, social and economic structures. For this reason, “aggregate approaches barely say anything about the “how” and even less about the “why” of regional inequalities” (Duranton and Monastiriotis, 2002, p. 223). Duranton and Monastiriotis call for a disaggregated approach (i.e., use of micro data) in the analyses of regional dynamics because measures of regional differences that take into account regional heterogeneity may be quite different to measures that ignore it. This paper examines the evolution of regional wage disparities within Poland in 1994-2007. We estimate the size of regional wage differentials at a particular date and over time and focus on whether there is any evidence that regional wage disparities are reduced over time. The paper contributes to the literature in five ways. First, it analyzes regional disparities in Poland over a long time span (1994-2007), covering both an early and mature stages of economic transformation as well as Poland’s membership in the EU. Second, we use workers’ compensation (wages) which is considered to be a better than GDP measure of both economic and social aspects of development. Third, we examine regional wage disparities for men and women separately. Fourth, we employ micro data in order to determine whether regional disparities still exist after controlling for a number of worker and regional characteristics. Fifth, the paper adds to our understanding of regional wage differentials in transition economies, a subject on which studies are scarce. The paper is organized in the following way. The next section provides a brief overview of the theoretical literature on the causes of regional wage differentials. The “Data and Methodology” section describes the data set used for this study as well as the analytical framework. The following section presents and discusses our results; and the final section summarizes and concludes. LITERATURE REVIEW The basic neoclassical model predicts that if information is perfect, transportation costs are moderate, and labor and capital can move freely, then wages of workers with similar human capital characteristics will be equalized across regions (Goldfarb and Yezer, 1976). The empirical evidence, however, suggests that regional pay differentials persist even in highly mobile developed economies. In order to explain equilibrium wage disparities, the simple neoclassical model was extended by bringing into the fold a variety of non-wage factors affecting the location decision of workers (suppliers of labor) and firms (demanders of labor). For workers, it is hypothesized that they consider both wage and non-wage factors and maximize their overall utility rather than their wages (Roback, 1982, 1988; Rosen, 1986; Gyourko and Tracy, 1989). These unique features are collectively referred to as ‘amenities’ and may include topography, climate and environment, cost of living, fiscal conditions, family considerations, availability and quality of public services, etc. If workers place a high value on regional amenities, they will tend to move to high-amenity areas, the supply of labor in those areas will increase leading to lower wages. On the other hand, the supply of labor in the areas with severe climate conditions, air pollution, poor public services and other negative regional attributes will decrease leading to higher wages. For firms, the neoclassical approach asserts that they act as profit maximizers and will pay a wage equal to the marginal productivity of labor (to be more specific, a nominal wage equal to the marginal revenue product of labor); hence, wages are assumed to be determined by labor productivity. If the regional characteristics – such as skilled labor, proximity to major markets, good transportation networks, favorable local economic conditions, etc. – increase productivity, the demand for labor in those areas will increase leading to higher wages. Conversely, the low productivity-enhancing regional characteristics will decrease the demand for labor and thereby decrease wages in those regions (Beeson and Eberts, 1989). Overall, neoclassical
GLOBAL JOURNAL OF BUSINESS RESEARCH ♦ VOLUME 7 ♦ NUMBER 5 ♦ 2013
3
theory contends that if workers and firms take into account regional non-wage factors when making location decisions, wages will not necessarily be equalized across regions even in the competitive market. A competing model – the efficiency wage hypothesis – offers a further understanding of persistent regional earnings disparities. Unlike neoclassical theory, the efficiency wage model hypothesizes that workers with identical productive characteristics may receive different wages if firms pay premiums in order to minimize turnover, shirking and adverse selection and increase worker loyalty (Katz, 1986). Farber and Newman (1989) show that efficiency wage models may be appropriate for explaining inter-regional wage differentials if the relationship between wages and productivity differs across regions and if inter-regional conditions necessitate regional efficiency premiums. According to this view, regional efficiency wage premiums may also be a source of persistent gaps in regional wages in addition to the productivity and amenity components. Most recently, the neoclassical theory of wage determination was augmented with the new economic geography approach pioneered by Krugman (1991a,b). As mentioned above, the standard neoclassical model asserts that each region has a specific set of site characteristics which determine its high or low productivity value to firms. In other words, the region-specific productivity factors are taken as given (i.e., exogenous). In contrast, the new approach posits that productivity differences across regional markets are endogenously determined by the level of economic activity (i.e., agglomeration economies) in that region. Moretti (2010, p. 1286) identifies the three most relevant explanations for the agglomeration of economic activity: “(1) advantages deriving from thick labor markets; (2) advantages deriving from proximity to providers of intermediate non-tradable goods and services; (3) localized knowledge spillovers” and explains how the existence of agglomeration economies can generate multiple regional equilibria, some with low economic activity and low nominal wages, and some with high economic activity and high nominal wages. For instance, a thicker labor market in a particular region may produce higher quality worker-firm matches resulting in higher productivity and higher wages in that region. When many firms locate in a dense region, they share a larger and wider regional supply of inputs, which may cause an increase in productivity as well as wages. The agglomeration of human capital creates regional clusters of high-skilled workers and may generate important knowledge spillovers that increase productivity and efficiency and allow for higher wages. Furthermore, economic agglomeration may create congestion costs, and firms in agglomerated regions must pay workers higher nominal wages. Finally, institutional factors and regulatory restrictions on labor and firm mobility offer additional explanations for persisting regional pay differentials. Institutional factors typically include such non-competitive forces of wage determination as unionization levels, collective bargaining, contract duration, wage discrimination, market concentration (monopoly or monopsony power), etc. For instance, the studies on the effects of unionization and bargaining on wage inequality show that weak unions as well as more decentralized and uncoordinated collective bargaining typically coincide with more pronounced regional wage differences (OECD, 2004; Dell’Aringa and Pagani, 2007; Vamvakidis, 2008). Restrictions on geographic labor mobility also represent a source of persistent inter-regional pay disparities (Topel, 1986; Dickie and Gerking, 1998). A broad range of empirical studies have analyzed regional wage differentials for a number of developed countries. For transition economies (and particularly Poland), studies on regional wage differentials are scarce. We found only a few papers for Poland: Gora and Sztanderska (1998), Duffy and Walsh (2000, 2002), Sibley and Walsh (2002), Rogut (2007), Adamczyk et al. (2009), Bogumil (2009), Czyz and Hauke (2011). While the empirical evidence is far from conclusive (estimates of regional wage differentials vary considerably as a result of variations in methodologies used as well as data sources), the majority of studies find that significant inter-regional pay differentials do exist. However, it has been proven difficult to disentangle their sources and to explain their persistence and stability over time.

V. A. Adamchik & T. J. Hyclak | GJBR ♦ Vol. 7 ♦ No. 5 ♦ 2013
4
DATA AND METHODOLOGY Labor Force Surveys conducted by the Polish Central Statistical Office in May of 1994-2007 constitute the data source for this paper. We restrict our attention to full-time hired employees because only this category reported their earnings in the survey. We further narrowed our sample of full-time hired workers by deleting those individuals who did not report their earnings, who were full-time students, or handicapped, or younger than 18, or older than 60 (the retirement age for women) or 65 (the retirement age for men). Furthermore, for consistency we controlled if an employee worked 40 and more hours per week on a regular basis. After all these adjustments, we had samples of about 5,000-9,000 full-time hired male employees and 4,000-7,000 full-time hired female employees for each year in 1994-2007. Since the 14th century, a ‘voivodship’ (‘województwo’ in Polish) has been the major territorial division in Poland. At the outset of the transition, in the early 1990s there were 49 voivodships, but in 1999 the Polish local government reform reduced the number of territorial units to 16. The aim of the reform was to create territorial units which would comply with the criteria defined by the Assembly of European Regions: common economic goals and inner economic integration, democratically elected political representation, inner social links built on shared social and territorial identity, and direct submission to central governmental level (Kozak et al., 2000, p. 47; Sagan and Lee, 2005, p. 166). Polish voivodships are equivalent to provinces and correspond to the NUTS 2 level according to the EU Nomenclature of Territorial Units for Statistics. We use two different measures – the weighted average absolute regional wage differential and the standard deviation of regional wage differentials – to assess the overall dispersion of regional wages. To control for observed heterogeneity of workers, we use the Mincerian ‘human capital earnings function’ (Mincer, 1974) and apply the restricted least squares estimation procedure developed by Haisken-DeNew and Schmidt (1997). The following section provides further explanations and formulae. RESULTS We first calculate the overall “raw” regional wage differentials (deltas) for men and women separately using current wages in Zlotys:
11 −=∑=
r
n
i
ir
r nwwr
δ , (1)
where Rr ,...,1= ; R is the number of regions (i.e., 16 voivodships); rni ,...,1= ; rn is the number of workers in region r ; irw is the wage of worker i in region r ; w is the average wage in the national economy. We use two different measures to measure the overall dispersion of regional wages: the weighted average absolute regional wage differential
|||| rr
rAVG δωδ ∑= and (2)
the standard deviation of regional wage differentials
∑=r
rrSD 2)( δωδ , (3)

GLOBAL JOURNAL OF BUSINESS RESEARCH ♦ VOLUME 7 ♦ NUMBER 5 ♦ 2013
5
where Nnr
r =ω is the share of each region in the total number of workers ( N ).
As expected, Mazowieckie voivodship (with the capital city of Warsaw) exhibits the largest positive deviations from the national average: for instance, 9% and 15% for men and 15% and 25% for women in 1994 and 2007, respectively. As expected, the regions in the Eastern part of Poland typically exhibit the largest negative deviations from the national average wage. Our dispersion measures drawn from these average wage data are summarized in Columns (c) and (f) in Table 1. Over all 16 regions, for men the AVG|delta| measure was 9.0% in 1994 and 7.9% in 2007. The SD(delta) measure shows a similar drop in regional wage dispersion for men from 10.9% to 9.1% over these years. Our measures for women, however, suggest sharply rising regional wage dispersion. The AVG|delta| for women rose from 4.9% to 6.9% and the SD(delta) from 6.9% to 9.8%. Of course, these statistics do not control for differences across regions in the characteristics of workers. To control for observed heterogeneity of workers, we used the well-known Mincerian ‘human capital earnings function’ (Mincer, 1974) in its traditional semi-log form:
i
R
rririi DXW εδβα +++= ∑
=1
ln (4)
where iWln is the natural logarithm of monthly earnings of a full-time hired employee i ; iX is a vector of observed characteristics other than the region of residence; riD is a regional dummy which assumes the value of 1 if worker i resides in region r and 0 otherwise, Rr ,...,1= , 16=R ; rδβα ,, are the coefficients to be estimated; and iε is an error term assumed to be ),0( εσN . Equation (4) assumes that β ’s do not vary by region. While not beyond reproach, this assumption is quite common in empirical regional studies (see, for example, Maier and Weiss, 1986; Azzoni and Servo, 2002; Combes et al., 2007; Beenstock and Felsenstein, 2008). Compared to other papers on the Polish wage structure, the specification of the earnings equation in our study is one of the most comprehensive with 63 individual socio-economic characteristics. In addition to the 16 regional dummies we include: 6 city/town/rural dummies, 5 educational dummies, marital status (married or divorced vs single as a reference group), whether the worker heads a household, private sector (vs public sector as a reference group), 13 industry dummies, potential experience and potential experience squared, tenure at the current workplace and tenure squared, 8 occupational dummies, permanent job (vs temporary job as a reference group), recent (within the past 12 months) graduate, whether the worker holds a second job, whether the worker is looking for another job in accordance with his/her qualifications, and whether the worker has an additional non-wage source of income. It is worth noting that dummy variables for each of the 16 regions were included in the regression (that is, there is no reference group for this category), and the restricted least squares (RLS) procedure was applied to estimate Equation (4). As noted in Freguglia and Menezes-Filho (2012, p. 22), “the advantage of the restricted least squares (RLS) procedure (…) is that all (…) dummy coefficients and standard errors are reported, i.e., the results are independent of the choice of the reference category. This procedure corrects the problems of the traditional methodology of overstating differential standard errors and understating the overall dispersion. The coefficients can be interpreted as percentage-point deviations from the states’ weighted average wages.”

V. A. Adamchik & T. J. Hyclak | GJBR ♦ Vol. 7 ♦ No. 5 ♦ 2013
6
Table 1: Summary Measures of the Overall Dispersion of Regional Wages: AVG|delta| and SD(delta)
Year N obs AVG|delta| SD(delta)
Using Actual Wages
Using RLS Coefficients
Reduction in Dispersion, % (d/c-1)*100%
Using Actual Wages
Using RLS Coefficients
Reduction in Dispersion, % (g/f-1)*100%
(a) (b) (c) (d) (e) (f) (g) (h)
MEN
1994 8501 0.0903 0.0542 -39.9 0.1095 0.0631 -42.3
1995 8555 0.0771 0.0445 -42.3 0.0877 0.0498 -43.3
1996 8220 0.0728 0.0428 -41.2 0.0861 0.0473 -45.1
1997 8246 0.0662 0.0363 -45.1 0.0772 0.0393 -49.1
1998 8236 0.0726 0.0477 -34.3 0.0856 0.0537 -37.3
1999 7383 0.0572 0.0414 -27.7 0.0699 0.0471 -32.7
2000 5356 0.0729 0.0465 -36.3 0.0963 0.0574 -40.4
2001 5266 0.0851 0.0480 -43.5 0.1024 0.0577 -43.7
2002 4757 0.0826 0.0390 -52.9 0.0987 0.0483 -51.1
2003 4440 0.0656 0.0425 -35.3 0.0761 0.0488 -35.8
2004 4623 0.0557 0.0313 -43.8 0.0662 0.0361 -45.5
2005 4483 0.0654 0.0308 -52.9 0.0790 0.0357 -54.8
2006 4642 0.0732 0.0431 -41.1 0.0844 0.0513 -39.2
2007 4722 0.0790 0.0560 -29.2 0.0908 0.0658 -27.5
WOMEN
1994 6440 0.0490 0.0291 -40.7 0.0686 0.0351 -48.8
1995 6690 0.0480 0.0260 -45.9 0.0718 0.0372 -48.2
1996 6488 0.0421 0.0229 -45.5 0.0621 0.0313 -49.6
1997 6320 0.0384 0.0219 -43.1 0.0587 0.0282 -52.0
1998 6364 0.0412 0.0289 -29.7 0.0641 0.0359 -44.0
1999 5929 0.0465 0.0336 -27.9 0.0683 0.0426 -37.5
2000 4243 0.0593 0.0312 -47.4 0.0873 0.0385 -55.9
2001 4195 0.0732 0.0475 -35.2 0.1144 0.0598 -47.7
2002 3879 0.0653 0.0454 -30.5 0.1105 0.0631 -42.9
2003 3600 0.0442 0.0417 -5.7 0.0626 0.0537 -14.3
2004 3493 0.0458 0.0372 -18.8 0.0651 0.0454 -30.3
2005 3441 0.0524 0.0358 -31.7 0.0649 0.0374 -42.5
2006 3505 0.0637 0.0401 -37.0 0.0952 0.0508 -46.6
2007 3669 0.0691 0.0466 -32.5 0.0978 0.0600 -38.7
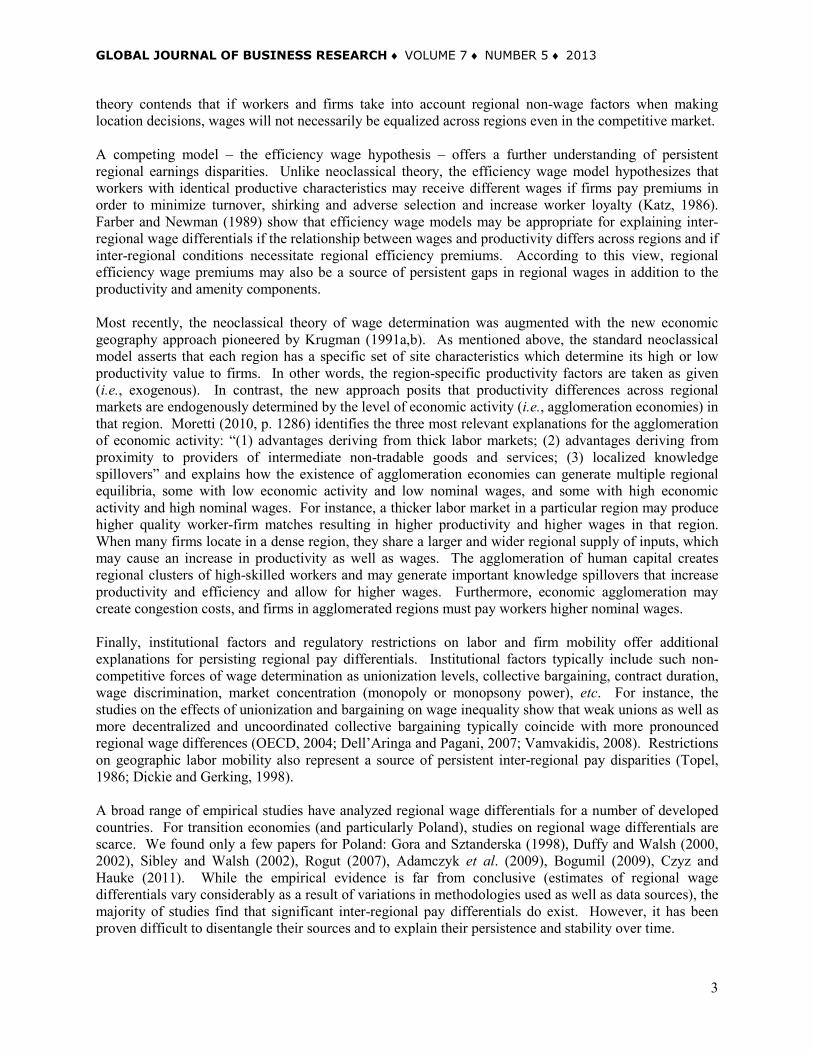
The table shows the weighted average absolute regional wage differential (AVG|delta|) and the standard deviation of regional wage differentials (SD(delta)), where deltas are regional wage differentials measured as deviations from the average wage in the national economy. The wage regression (4) was estimated for each of the 14 years within the 1994-2007 period. The estimated coefficients on the regional dummy variables ( rδ̂ ) are interpreted as the regional differences in wages that still exist after controlling for the compositional mix of the work force as well as different socio-economic characteristics. The Salter graphs (Figure 1) shows the estimated regional coefficients. To construct these graphs, we first rank all regions according to their wage coefficients in the base year
GLOBAL JOURNAL OF BUSINESS RESEARCH ♦ VOLUME 7 ♦ NUMBER 5 ♦ 2013
7
(1994) and place them in this order along the horizontal axis. Keeping the base year rank positions of regions constant on the horizontal axis, we show the estimated RLS wage coefficients for 1994 and all Figure 1: RLS Regional Wage Coefficients for Men (upper) and Women (lower): Salter Graph
The graphs show the estimated RLS regional (16 voivodships) wage coefficients for male and female workers. The 0.0 line represents a benchmark (i.e., the average wage in the national economy). The thick line represents the regional wage coefficients in the base year, 1994. The fine lines show the wage coefficients for each voivodship in 1995-2007. The overall pattern emerging in each graph helps us identify low-wage and high-wage regions as well as those regions that widened or narrowed their wage gap with respect to the national average after 1994. subsequent years on the vertical axis. The Salter graph helps us visualize any significant changes in the regional disparity of wages as well as identify low-wage and high-wage regions. Similar to the findings
-0.15
-0.10
-0.05
0.00
0.05
0.10
0.15
0.20
-0.15
-0.10
-0.05
0.00
0.05
0.10
0.15
0.20

V. A. Adamchik & T. J. Hyclak | GJBR ♦ Vol. 7 ♦ No. 5 ♦ 2013
8
reported for the “raw” wage differentials, Mazowieckie voivodship (with the capital city of Warsaw) shows the largest positive deviations of wages from the national average, and the eastern regions show the largest negative deviations of wages from the national average. For both men and women there is a significantly negative delta for the four eastern regions of Podlaskie, Lubelskie, Swietokrzystkie and Podkarpacie that appears to be more negative in 2007 than in 1994. Western regions like Pomorskie, Wielkopolskie, Zachodiopomorskie along with Mazowieckie, which contains Warsaw, and Malopolskie, which contains Krakow, have large positive regional wage deltas that appear to have risen over time. Our next observation from the Salter graphs is that there seems to be some tendency towards the horizontality of the series for men, which implies that there was a general decrease (or, at least, no increase) in regional wage disparities. For men, we observe some sort of a “catching up” process when low-wage regions (in the low end of the graph) move upward, and high-wage regions (in the high end of the graph) move downward. For women, though, the regional wage disparity seems to worsen, especially due to the fact that Mazowieckie voivodship significantly widened its positive wage gap as compared to the national average. In order to examine individual movements within the regional wage distribution shown in the Salter graphs, we employ the Markov chain analysis and construct transition probability matrices (Table 2). We choose 5 classes and select the following class limits: less than -0.06, from -0.06 to -0.02, from -0.02 to 0.02, from 0.02 to 0.06, 0.06 and above. Table 2 shows the proportion of regions belonging to each class in 1994 and the proportion of regions that moved from class i in 1994 to class j in 2007. The stability index (Pellegrini, 2002) is computed as:
dPTrS )(
= (5)
where )(PTr is the trace of the transition matrix P , i.e., the sum of the elements of the main diagonal, and d is the matrix dimension. For both men and women, the stability index is very low (0.53 and 0.58, respectively), indicating that there had been significant movements of regions among the classes. The transition matrix for men is ergodic, i.e., the absolute value of its second eigenvalue ( 2λ ) is strictly smaller than 1 (for men, 0.836). It means that the transition probability matrix converges to its steady state; and the speed of this movement can be evaluated by the half-life indicator showing the amount of time periods it will take to cover half of the distance between the current and stationary distributions (Shorrocks, 1978):
||ln2ln
2λ−
=HL . (6)
For men, a half-life is 7.8, indicating that convergence towards the stationary distribution is extremely slow, i.e., 7.8 periods of 14 years. For women, the second eigenvalue of their transition probability matrix is equal to 1, the stationary distribution does not exist, and HL is infinity. It is worth noting, however, that our transition matrices summarize an overall change in the regional wage distributions between the first (1994) and the last (2007) years of the period under examination and fail to capture movements within the period. As shown by the Salter graphs, rapid movements did take place within the distribution over 1994-2007. Hence, our results for S and HL should be treated with caution. To further investigate the dynamics of the regional wage distributions, it would be beneficial to split 1994-2007 into sub-periods and analyze whether the dynamics changed from one sub-period to the other. Also, in the subsequent paragraph, we compute the summary measures of regional wage dispersion, which take into account all annual (14) measures of dispersion and, hence, provide a more comprehensive picture of the dynamics of regional wage differentials.

GLOBAL JOURNAL OF BUSINESS RESEARCH ♦ VOLUME 7 ♦ NUMBER 5 ♦ 2013
9
Table 2: Transition Probability Matrix
RLS Wage Coefficient Percentage of Regions in
1994
The Proportion of Regions (Percent) That Moved from Class i in 1994 to Class j in 2007
Less Than -0.06
from -0.06 to -0.02
from -0.02 to 0.02
from 0.02 to 0.06
0.06 and above
Total
MEN less than -0.06 18.8 100.0 100.0 from -0.06 to -0.02 18.8 66.7 33.3 100.0 from -0.02 to 0.02 25.0 75.0 25.0 100.0 from 0.02 to 0.06 18.8 33.3 33.3 33.3 100.0 0.06 and above 18.8 33.3 66.7 100.0 WOMEN less than -0.06 6.3 100.0 100.0 from -0.06 to -0.02 25.0 25.0 25.0 50.0 100.0 from -0.02 to 0.02 37.5 33.3 16.7 50.0 100.0 from 0.02 to 0.06 25.0 50.0 50.0 100.0 0.06 and above 6.3 100.0 100.0
The table shows the proportion of the Polish voivodships belonging to each class in 1994 and the proportion of voivodships that moved from class i in 1994 to class j in 2007. The shaded cells indicate the proportion of voivodships that belonged to class i in 1994 and remained in the same class in 2007. The summary measures of regional wage dispersion were calculated using Eqs. (2) and (3). The latter, however, needed to be augmented (see Eq. 7). The estimated coefficients on the regional dummy variables from the RLS regressions were used to compute AVG|delta| and SD(delta):
∑ ∑−=r r
rrrrSD 22ˆ)( σωδωδ , (7)
where 2
rσ is the variance of rδ̂ . The results are summarized in Columns (d) and (g) in Table 1. Again, the summary measures of dispersion suggest sharply different time series patterns for male and female workers. Looking at the time series of data on AVG|delta| we see that for men there was a gradual downward trend in measured regional dispersion from 1994 to 2005 followed by a sharp increase in the last two years in the figure. For women AVG|delta| increased significantly in 2001; paralleling the data for men in the years following that year. The dynamics of SD(delta) shows a similar pattern, perhaps emphasizing the extent of the rise in regional wage disparity in 2006 and 2007 a bit more. When we compare 1994 and 2007, we see that for men AVG|delta| equaled about 5.5% and SD(delta) 6.5% for both years. For women, AVG|delta| rose from 2.9% to 4.7% and SD(delta) from 3.5% to 6.0% from 1994 to 2007. The test for equality of the variances in 1994 and 2007 – using the T2 statistic proposed by Carree and Klomp (1997) – was rejected for women but not for men. Columns (e) and (h) of Table 1 indicate that controlling for observed worker heterogeneity reduced measured inter-regional wage disparity by 30-50%. For instance, in Mazowieckie voivodship (with the capital city of Warsaw) in 2007 deltas reduce from 15% (“raw”) to 11% (RLS) for men and from 25% (“raw”) to 14% (RLS) for women. Our further comparison of the two approaches to measuring regional wage disparity, i.e., actual wages vs RLS coefficients, produces an interesting result. For men, regional wage dispersion as measured by AVG|delta| decreased by 12.4% (from 9.0% in 1994 to 7.9% in 2007) when using actual wages, but increased by 3.3% (from 5.4% to 5.6%) when using RLS coefficients. The pattern is similar for SD(delta): a decrease by 17% (from 10.9% to 9.1%) when using actual wages, but an increase by 4.3% (from 6.3% to 6.6%) when using RLS coefficients. For women, both methods show an increase in regional wage disparity in 2007 as compared to 1994, but the increase is much greater if using the RLS coefficients: 60.2% vs 40.9% for AVG|delta| and 70.8% vs 42.6% for SD(delta). We conclude that controlling for observed worker heterogeneity does reduce regional wage disparity in

V. A. Adamchik & T. J. Hyclak | GJBR ♦ Vol. 7 ♦ No. 5 ♦ 2013
10
Poland, but wage differentials still exist, albeit smaller. Moreover, not only do these remaining wage differentials persist, but they seem to intensify over time. Our results are consistent with the studies that have reported regional wage differentials for Poland (see the references in the “Literature Review” section). Generally, the studies found important inter-regional wage differentials with a persistent gap between western and eastern Poland and between Mazowiecki voivodship (with the fast-growing capital city of Warsaw) and the rest of the country. Our analysis reveals that significant wage disparities between the Polish regions remain even after controlling for a number of observed socio-demographic characteristics of workers. What forces cause persistent regional wage disparity in Poland is unclear. To our knowledge, so far no study analyzed the relative contribution of different region-specific factors (such as, amenity, productivity, efficiency wage premiums, agglomeration economies, institutional and regulatory restrictions, etc.) to the remaining (i.e., unexplained by the worker characteristics) portion of the regional wage gaps. Some researchers believe that these disparities is a sign of the lack of mechanisms for spatial coordination when growth is not regionally balanced. Growth was (and still is) disproportionately concentrated in a few regions, particularly in Mazowieckie voivodship (with the capital city of Warsaw), which is the richest region in Poland, and in the western regions. This east-west divide, often referred to as Poland A and Poland B, is a result of long-term inherited trends in institutional development, sectoral specializations, and educational attainment (Gorzelak, 2006; Piasecki, 2006). Some researchers argue that the usual mechanisms of regional equalization (such as migration) in Poland are ineffective, and labor-market adjustments typically take place through changes in the labor force participation rather than through wage flexibility (Bogumil, 2009). A closer investigation is definitely needed to uncover the impact of different geographical, political, institutional and regulatory factors on inter-regional wage differentials in Poland. CONCLUDING COMMENTS The goal of this paper was to provide some preliminary evidence documenting the existence and evolution of regional wage differentials in a transition economy. Using micro-data drawn from the 1994-2007 Polish Labor Force Surveys, we show that regional wage disparities in Poland are present and persistent. The findings indicate that the wages were higher in the western regions when compared to the eastern regions for both male and female workers. Furthermore, for both genders, the results reveal increasing disparities between Mazowiecki voivodship (with the fast-growing capital city of Warsaw) and the rest of the country. To control for observed heterogeneity of workers, we use the standard Mincerian earnings function and apply the restricted least squares estimation procedure. The results show that a large part of regional pay differentials (30-50 percent) can be attributed to individual observed socio-demographic characteristics of workers; however, the remaining earnings differentials are still noticeable and seem to intensify during the period under examination. Further research will attempt to disentangle the relative contribution of different region-specific factors (such as, amenity, productivity, efficiency wage premiums, agglomeration economies, institutional and regulatory restrictions, etc.) to this remaining portion of the regional wage gaps in Poland. REFERENCES Adamczyk, A. , Tokarski, T., and Wlodarczyk, R. (2009). Przestrzenne zróznicowanie plac w Polsce [Regional wage differences in Poland]. Gospodarka Narodowa [National Economy], 20, 87-109. Azzoni, C., and Servo, L. (2002). Education, cost of living and regional wage inequality in Brazil. Papers in Regional Science, 81, 157-175. Beenstock, M., and Felsenstein, D. (2008). Regional heterogeneity, conditional convergence and regional inequality. Regional Studies, 42, 475-488.

GLOBAL JOURNAL OF BUSINESS RESEARCH ♦ VOLUME 7 ♦ NUMBER 5 ♦ 2013
11
Beeson, P., and Eberts, R. (1989). Identifying productivity and amenity effects in interurban wage differentials. Review of Economics and Statistics, 71, 443-452. Bogumil, P. (2009). Regional disparities in Poland. ECFIN Country Focus, 6 (4), 1-7. Busillo, F., Muccigrosso, T., Pellegrini, G., Tarola, O., and Terribile, F. (2010). Measuring the impact of the European Regional Policy on economic growth: A regression discontinuity design approach. Sapienza Universita di Roma Working Paper No. 6/2010. Carree, M., and Klomp, L. (1997). Testing the convergence hypothesis: A comment. Review of Economics and Statistics, 79, 683-686. Combes, P., Duranton, G., and Gobillon, L. (2007). Spatial wage disparities: Sorting matters! Journal of Urban Economics, 63, 723-742. Czyż, T., and Hauke, J. (2011). Evolution of regional disparities in Poland. Quaestiones Geographicae, 30, 35-48. Dell’Aringa, C., and Pagani, L. (2007). Collective bargaining and wage dispersion in Europe. British Journal of Industrial Relations, 45, 29-54. Dickie, M., and Gerking, S. (1998). Interregional wage disparities, relocation costs, and labor mobility in Canada. Journal of Regional Science, 38, 61-87. Duffy, F., and Walsh, P. (2000). A regional analysis of wage determination in Poland. LICOS Centre for Transition Economics Discussion Paper No. 87/2000. Duffy, F., and Walsh, P. (2002). Individual pay and outside options: Evidence from the Polish Labour Force Survey. Centre for Economic Reform and Transformation Discussion Paper No. 2002/01. Duranton, G., and Monastiriotis, V. (2002). Mind the gaps: The evolution of regional earnings inequalities in the UK, 1982-1997. Journal of Regional Science, 42, 219-256. EC [European Commission]. (2003). Second progress report on economic and social cohesion: Unity, solidarity, diversity for Europe, its people and its territory. Summary and conclusions of Document COM(2003) 34. Brussels. EC [European Commission]. (2008). EU Cohesion Policy 1988-2008: Investing in Europe’s future. Panorama Magazine, No. 26 (June). EC [European Commission]. (2010a). Investing in Europe’s future. Fifth report on economic, social, and territorial cohesion. Brussels. EC [European Commission]. (2010b). Ex post evaluation of Cohesion Policy Programmes 2000-2006 financed by the European Regional Development Fund in Objective 1 and 2 Regions: Synthesis Report. Brussels.

V. A. Adamchik & T. J. Hyclak | GJBR ♦ Vol. 7 ♦ No. 5 ♦ 2013
12
Farber, S., and Newman, R. (1989). Regional wage differentials and the spatial convergence of worker characteristic prices. Review of Economics and Statistics, 71, 224-231. Freguglia, R. and Menezes-Filho, N. (2012). Inter-regional wage differentials with individual heterogeneity: Evidence from Brazil. Annals of Regional Science, 49, 17-34. Gyourko, J., and Tracy, J. (1989). The importance of local fiscal conditions in analyzing local labor markets. Journal of Political Economy, 97, 1208-1231. Gora, M., and Sztanderska, U. (1998). Regional differences in labour market adjustment in Poland: Earnings, unemployment flows and rates. Ifo-Institut für Wirtschaftsforschung Diskussionsbeiträge No. 48. Goldfarb, R., and Yezer, M. (1976). Evaluating alternative theories of intercity and interregional wage differentials. Journal of Regional Science,16, 345-363. Gorzelak, G. (2006). Poland’s regional policy and disparities in the Polish space. Regional and Local Studies, 1(special issue), 39-74. Haisken-DeNew, J., and Schmidt, C. (1997). Inter-industry and inter-region differentials: Mechanics and interpretation. Review of Economics and Statistics, 79, 516-521. Katz, L. (1986). Efficiency wage theories: A partial evaluation. In S. Fischer (Ed.), NBER Macroeconomics Annual (pp. 235-275). Cambridge, MA: MIT Press. Kozak, M., Pyszkowski, A., and Szewczyk, R. (2000). Slownik rozwoju regionalnego [Dictionary of regional development]. Warsaw: Polish Agency for Regional Development. Krugman, P. (1991a). Geography and trade. Cambridge, MA: MIT Press. Krugman, P. (1991b). Increasing returns and economic geography. Journal of Political Economy, 99, 483-499. Maier, G., and Weiss, P. (1986). The importance of regional factors in the determination of earnings: The Case of Austria. International Regional Science Review, 10, 211-220. Mincer, J. (1974). Schooling, experience and earnings. New York: National Bureau for Economic Research. Monfort, P. (2008). Convergence of EU regions: Measures and evolution. The EC Directorate-General for Regional Policy Working Paper No. 01/2008. Moretti, E. (2010). Local labor markets. In O. Ashenfelter and D. Card (Eds.), Handbook of labor economics, Vol. 4B (pp. 1237-1313). Amsterdam: Elsevier. OECD (2004). Wage-setting institutions and outcomes. Chapter 3 of OECD Employment Outlook 2004. Paris. Pellegrini, G. (2002). Proximity, polarization, and local labor market performances. Networks and Spatial Economics, 2, 151-173.
GLOBAL JOURNAL OF BUSINESS RESEARCH ♦ VOLUME 7 ♦ NUMBER 5 ♦ 2013
13
Piasecki, R. (2006). Regional policy of Poland: Report prepared for CIFE. Warsaw. Roback, J. (1982). Wages, rents, and the quality of life. Journal of Political Economy, 90, 1257-1278. Roback, J. (1988). Wages, rents, and amenities: Differences among workers and regions. Economic Inquiry, 26, 23-41. Rogut, A. (2007). The wage curve in Poland in 1995-2005. Proceedings of the 2nd Central European Conference in Regional Science (CERS), 868-893. Rosen, S. (1986). The theory of equalizing differences. In O. Ashenfelter and R. Layard (Eds.), Handbook of labor economics, Vol. 1 (pp. 641-692). Amsterdam: Elsevier. Sagan, I., and Lee, R. (2005). Spatialities of regional transformation in Central Europe and the administrative spaces of the EU. In I. Sagan and H. Halkier (Eds.), Regionalism contested: Institution, society and governance (pp. 163-176). Aldershot: Ashgate Publishing. Shorrocks, A. (1978). The measurement of mobility, Econometrica, 46, 1013-1024. Sibley, C., and Walsh, P. (2002). Earnings inequality and transition: A regional analysis of Poland. IZA Discussion Paper No. 441. Stiglitz, J., Sen, A., and Fitoussi, J.-P. (2008). Issues Paper. Commission on the Measurement of Economic Performance and Social Progress (CMEPSP)-Issues Paper- 25/07/08. Topel, R. (1986). Local labor markets. Journal of Political Economy, 94, 111-143. Vamvakidis, A. (2008). Regional wage differentiation and wage bargaining systems in the EU. IMF Working Paper No. WP/08/43. BIOGRAPHY Vera A. Adamchik is Associate Professor of Economics at the University of Houston-Victoria, Texas. Her research on unemployment and wages in transition economies in the 1990s-2000s appears in journals such as Oxford Bulletin of Economics and Statistics, Labour Economics, Economics of Transition, International Journal of Manpower. She can be reached at University of Houston-Victoria, 14000 University Blvd., Sugar Land, TX, 77479 USA, [email protected]. Thomas J. Hyclak is Professor of Economics at Lehigh University, Pennsylvania. His recent research appears in Industrial Relations, Economics Letters, Industry and Higher Education, and Journal of Computing in Higher Education. He can be reached at Lehigh University, College of Business and Economics, 621 Taylor Street, Bethlehem, PA 18015 USA, [email protected].


GLOBAL JOURNAL OF BUSINESS RESEARCH ♦ VOLUME 7 ♦ NUMBER 5 ♦ 2013
15
EFFICIENCY OF THE EASTERN CARIBBEAN SECURITIES EXCHANGE
Kirwins Charles, Carleton University Bruce Niendorf, University of Wisconsin Oshkosh
Kristine Beck, University of Wisconsin Oshkosh
ABSTRACT
This study examines the weak-form efficiency of the Eastern Caribbean Securities Exchange, which opened on October 19, 2001, by conducting tests for the day-of-the-week effect on the individual stocks listed on the Eastern Caribbean Securities Exchange. Weak-form efficiency means that current security prices reflect all past public information including past prices, rates of return, and trading volume data. Given the enormous amounts being invested in emerging markets, those countries that can maintain efficient markets may attract billions of dollars of capital to the businesses in their countries. This paper is the first to test firms listed on the Eastern Caribbean Securities Exchange for weak-form efficiency. The results of evaluating Monday returns, Friday returns and other day of the week returns are consistent with weak-form efficiency, while the results of runs tests find some evidence of weak-form inefficiency in the securities trading on the Eastern Caribbean Securities Exchange.
JEL: G150 KEYWORDS: Market Efficiency, ECSE
INTRODUCTION
eveloping countries with their own stock exchanges have great interest in the efficiency of their markets. One reason for a developing country to have an exchange is to make it easier for businesses located in the country to attract the capital they need to grow, and international
investors have shown themselves to be hungry for emerging market growth opportunities. In 2010, for example, U.S. investors put more than $60 billion into emerging market equity funds while also pulling $74 billion out of developed market stock funds (Steverman 2010). In 2009 emerging market investment captured 26 percent of global equity investment versus only seven percent in 2004 (Choi 2009). A recent article in the Financial Times suggests this growth may continue, “For many people the future of investing can be summed up in two words: emerging markets” (Oakley and Meyer 2009). One concern of investors in emerging markets, however, is being taken advantage of in a market perceived to be stacked against “outsiders”. Given the enormous amounts being invested in emerging markets, those countries that can maintain efficient markets may attract billions of dollars of capital to the businesses in their countries. Thus, studies of emerging market efficiency have been of great interest to academics, regulators, and practitioners alike. The most fundamental level of efficiency, weak-form efficiency, requires the market price of a security to reflect all publicly available historical information. If a market is weak-form efficient, it is not possible to earn excess returns using trading rules or patterns identified through the study of historical stock prices. As Akdeniz (2000) notes: “it is evident that much has to be done to understand the nature of stock returns in emerging markets.” Although there have been studies of the efficiency of many emerging markets, including, for example the Jamaican, Botswana, and the Bahrain exchanges (Robinson 2005, Mollah 2007, and Asiri 2008), there has never been a published study of the efficiency of the Eastern Caribbean Securities Exchange (ECSE). The Eastern Caribbean Securities Exchange (ESCE) was established by the Eastern Caribbean Central Bank to serve the eight countries that form the Eastern Caribbean territory: Anguilla, Antigua and Barbuda, Dominica, Grenada, Montserrat, St. Kitts and Nevis, St. Lucia, and St. Vincent and the
D

K. Charles et al | GJBR ♦ Vol. 7 ♦ No. 5 ♦ 2013
16
Grenadines. The exchange began on October 19, 2001 with the trade of its first listed stock, Bank of Nevis, and is open to companies in the Caribbean region. As of December 2012, the U.S. dollar-denominated ECSE had listed twelve more companies from countries including Barbados, Dominica, Grenada, Jamaica, St. Kitts & Nevis, St. Lucia, and Trinidad. This study is the first to test the efficiency of trading in the stocks listed on the ECSE. Section 2 provides a literature review regarding previous work that addresses the efficiency of emerging stock markets. Section 3 identifies the methodology used in this study and Section 4 describes our results. Finally, Section 5 provides our conclusions. LITERATURE REVIEW Fama (1965, 1970) began the tidal wave of academic research on market efficiency. Fama (1970) defines three different levels of market efficiency: weak, semi-strong, and strong-form efficiency. The first and most fundamental level is weak-form efficiency. If the market in a stock is weak-form efficient, the current price of the stock reflects all publicly available historical information about the stock. This implies that investors cannot make consistent excess returns using only historical data. While semi-strong and strong-form efficiency place more stringent requirements on the information contained in stock prices, for a market to be semi-strong or strong-form efficient it must first be weak-form efficient. Semi-strong form efficiency focuses on the efficiency with which the market reflects all publicly available information while strong-form focuses on the efficiency with which the market reflects all information: historical, public, and private. Market efficiency is of great importance to companies seeking capital and investors. As described by Robinson (2005), academics have focused on looking for predictable patterns in stock returns to test for weak-form market efficiency. The existence of predictable patterns in stock returns would be inconsistent with weak-form efficiency since these patterns represent information which should already be reflected in stock returns in an efficient market. If stock prices follow a random walk, there should be no discernible patterns in stock prices. The presence of patterns in cross-sectional returns, returns across time, or returns associated with calendar timing points such as the beginning or end of the year, month, or week have provided much insight into the weak-form efficiency of the market being studied in previous studies of the weak-form efficiency of emerging markets. The results of these studies have varied. Across emerging markets, day-of-the-week and turn of year effects have been the source of some of the most serious past findings of violations of weak-form efficiency. Though Robinson’s (2005) tests of stocks trading on the Jamaican Stock Exchange find no evidence of weak-form inefficiency in forty-six of the fifty-eight stocks tested when testing for day-of-week and turn of the year effects, he does reject the hypothesis of weak-form efficiency using autocorrelation and runs tests. Asiri (2008) studies the weak-form efficiency of the forty companies listed on the Bahrain Stock Exchange using both cross-sectional and time series methods. Asiri finds that returns follow a random walk with no drift or trend. Further, autocorrelation and exponential smoothing tests are also consistent with the weak-form efficiency of the Bahrain market. Thus, Asiri finds no evidence of inefficiency in the Bahrain market. Loc, Lanjouw, and Lensink (2010) use the runs test to examine the thinly traded securities in the Vietnamese Stock Trading Centre and reject the hypothesis of weak-form efficiency. Mollah (2007) finds evidence of serial autocorrelation in the returns on an index of the Botswana Stock Exchange – a violation of weak-form efficiency. Hassan, Abdullah, and Shah (2007) study the time series and distributional characteristics of the Karachi Stock Exchange 100 Index. Though they find no violations of weak-form efficiency in monthly returns, they find significant evidence of weak-form inefficiency in returns over shorter periods. Canestrelli and Ziemba (2000) find that stock returns are significantly higher in January than any other months of the year for the Milan Stock Exchange, and Comoli and Ziemba (2000) find similar January effect results for the Japanese Stock Exchange.

GLOBAL JOURNAL OF BUSINESS RESEARCH ♦ VOLUME 7 ♦ NUMBER 5 ♦ 2013
17
This study follows the lead provided by French (1980), who looks at day-of-the-week effects in the United States, and tests for day-of-the-week effects in individual stock returns on the ECSE. In addition, we use runs tests similar to Loc, Lanjouw, and Lensink (2010) to further test the returns of the individual securities that trade on the ECSE for weak-form efficiency. The extreme thin trading on the ECSE has major implications for our methodology, as described in the following section, which leads us to expect results consistent with the nature of inefficient markets as described by Claessens and Gooptu (1993). They find that emerging markets are frequently characterized by thin trading, high transactions costs, inefficient information flows, and inefficient market making. These are characteristics which are generally associated with a market that is weak-form inefficient. DATA AND METHODOLOGY This study uses the daily stock prices for thirteen of the fourteen companies listed on the Eastern Caribbean Securities Exchange (ECSE) as of December 31, 2010. In these tests, we omitted one of the fourteen listed companies, First Caribbean International Bank, since its first trading date of January 5, 2009 and its subsequent seven total trades through the end of 2010 left too few trading days for our analysis. We conduct efficiency tests on the individual stocks rather than on an ECSE market index as a whole as Harvey (1993) finds that the use of individual stocks for efficiency tests provides better results than the testing of a market index. To test the weak-form efficiency of the ECSE market, we include the daily closing prices of each of the companies beginning the day it was first traded on the ECSE. The first company to trade on the ECSE was the Bank of Nevis, which began trading on the day the ECSE opened, October 19, 2001. We obtained daily closing prices from the official website of the ECSE: www.ecseonline.com. Stocks on the ECSE are very thinly traded. The most frequently traded stock, East Caribbean Financial Holding company Ltd. traded on just under one day out of five while the most infrequently traded stock, St. Lucia Electricity Services Ltd. traded on just 1.9 percent of trading days. Due to this thin trading, tests of the autocorrelation structure of returns have little meaning since we cannot assume returns are independent and identically distributed. Instead, we test for ECSE efficiency using a runs test including Miller, Muthuswamy, and Whaley’s (1994) correction for thin trading, and day-of-the-week tests using Fama’s (1965) natural log of daily prices. First we test for ECSE weak-form efficiency using a runs test (Bradley 1968) before and after correcting for thin trading. The runs test examines whether average returns are different at different points in the sequence, i.e. whether returns are random. We use methodology similar to Loc, Lanjouw & Lensink (2010) to determine three types of runs, up, down, or flat, to test the following hypothesis:
Ho: returns of ECSE listed stocks are random; the ECSE is weak-form efficient H1: returns of ECSE listed stocks are not random; the ECSE is not weak-form efficient.
The runs test statistic is calculated as: 𝑍 = 𝑅±0.5−𝑚
𝜎𝑚, (1)
where the total expected number of runs is
𝑚 = �𝑁(𝑁+1)−∑ 𝑛𝑖23
𝑖=1 �𝑁
, (2) and the standard error of the expected number of runs is

K. Charles et al | GJBR ♦ Vol. 7 ♦ No. 5 ♦ 2013
18
𝜎𝑚 = ��∑ 𝑛𝑖2(∑ 𝑛𝑖
2+𝑁(𝑁+1))−2𝑁∑ 𝑛𝑖3−𝑁33
𝑖=13𝑖=1
3𝑖=1
𝑁2(𝑁−1)�. (3)
We also use Miller, Muthuswamy, and Whaley’s (1994) correction for thin trading to adjust for bias in the runs test due to infrequent returns. Miller’s model estimates the number of non-trading days using the residuals from a first-order autoregressive model to adjust returns, AR(1) model Rt = α0 + α1Rt−1 + εt. (4) The residuals from the regression are used to generate estimates of changes, et� = εt
1−α1 , (5)
which are then substituted for the observed returns. This process substantially reduces negative first-order autocorrelation. Second, we perform day-of-the-week tests on the first differences of the natural logarithms of the daily prices. Fama (1965) identifies several reasons for using changes in log price rather than simple price changes including that the change in log price is the yield, with continuous compounding, from holding the security for that day. Also, Moore (1962) shows that using logarithms seems to neutralize most of the problem that price changes for a given stock is an increasing function of the price level of the stock. Daily returns, rt for each day t were calculated consistent with Fama (1965) for each of the ten stocks as:
𝑟𝑡 = ln(𝑃𝑡)− ln(𝑃𝑡−1) (non dividend days) (6) 𝑟𝑡 = ln(𝑃𝑡 + 𝑑) − ln(𝑃𝑡−1) (on dividend days), (7)
where Pt and Pt-1 are the closing stock price on days t and t-1, d is the dividend paid, and ln is the natural log function. None of the listed companies had stock splits during the sample period. Given the thin trading on the ECSE relative to more developed exchanges, the stocks on the ECSE experience many nontrading days. Fama’s (1965) method of calculating returns for these days merely results in a zero return for those days. One implication of weak-form market efficiency is that returns should not demonstrate any calendar effects. If the market in a stock is weak-form efficient, daily mean stock returns should not differ significantly across the days of the week. Thus to test the weak-form efficiency of each company on the ECSE, we test whether the mean return for Mondays is different from the mean returns for the rest of the week, whether the mean return for Fridays is different from the mean return for the other days of the week, and whether the mean return for Mondays is different from the mean return for Fridays. If the ECSE is weak-form efficient, there should be no significant differences between any of these mean returns. Specifically, the null and alternative hypotheses are:
Ho: (µ1-µ2) = 0; ECSE is weak-form efficient H1: (µ1-µ2) ≠ 0; ESCE is not weak-form efficient.
In our first test, µ1 represents the mean Monday return and µ2 represents the mean return for Tuesday through Friday. In our second test, µ1 represents the mean Friday return and µ2 represents the mean return for Monday through Thursday. Finally, in our third test, µ1 represents the mean Monday return and µ2 represents the mean Friday return. In these tests, four of the fourteen listed companies were omitted as their relatively recent beginning trading dates left too few trading days for our analysis.
GLOBAL JOURNAL OF BUSINESS RESEARCH ♦ VOLUME 7 ♦ NUMBER 5 ♦ 2013
19
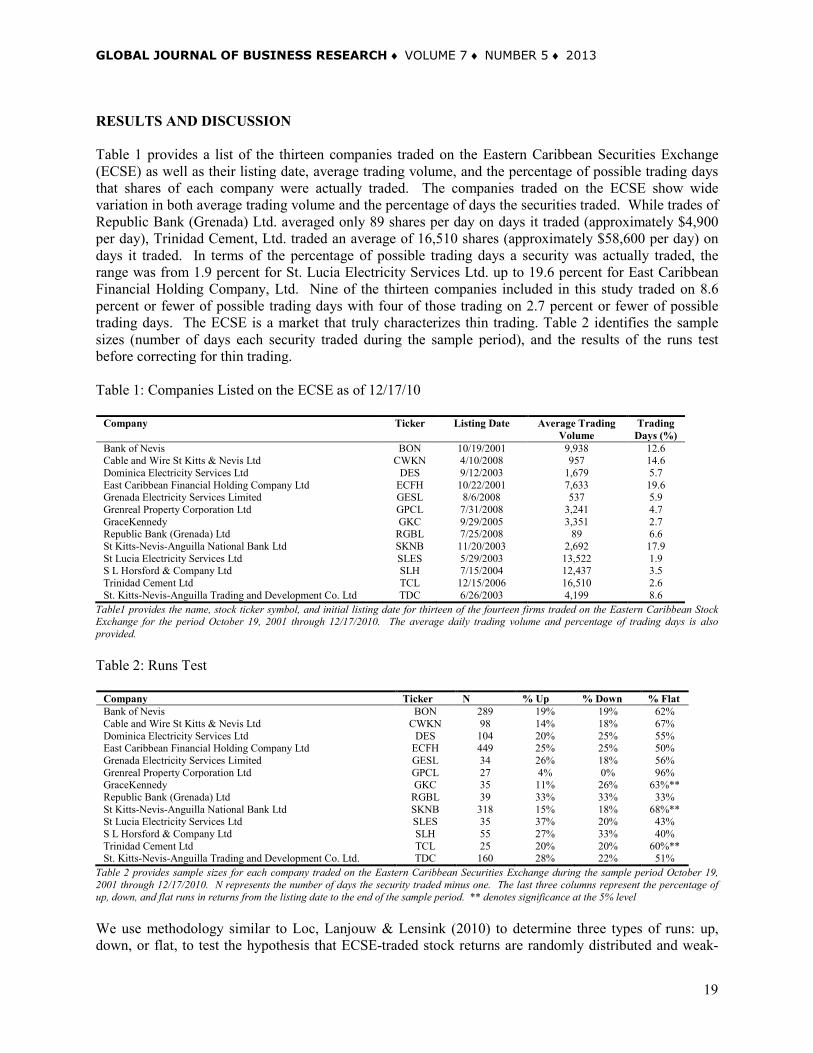
RESULTS AND DISCUSSION Table 1 provides a list of the thirteen companies traded on the Eastern Caribbean Securities Exchange (ECSE) as well as their listing date, average trading volume, and the percentage of possible trading days that shares of each company were actually traded. The companies traded on the ECSE show wide variation in both average trading volume and the percentage of days the securities traded. While trades of Republic Bank (Grenada) Ltd. averaged only 89 shares per day on days it traded (approximately $4,900 per day), Trinidad Cement, Ltd. traded an average of 16,510 shares (approximately $58,600 per day) on days it traded. In terms of the percentage of possible trading days a security was actually traded, the range was from 1.9 percent for St. Lucia Electricity Services Ltd. up to 19.6 percent for East Caribbean Financial Holding Company, Ltd. Nine of the thirteen companies included in this study traded on 8.6 percent or fewer of possible trading days with four of those trading on 2.7 percent or fewer of possible trading days. The ECSE is a market that truly characterizes thin trading. Table 2 identifies the sample sizes (number of days each security traded during the sample period), and the results of the runs test before correcting for thin trading. Table 1: Companies Listed on the ECSE as of 12/17/10
Company Ticker Listing Date Average Trading
Volume Trading
Days (%) Bank of Nevis BON 10/19/2001 9,938 12.6 Cable and Wire St Kitts & Nevis Ltd CWKN 4/10/2008 957 14.6 Dominica Electricity Services Ltd DES 9/12/2003 1,679 5.7 East Caribbean Financial Holding Company Ltd ECFH 10/22/2001 7,633 19.6 Grenada Electricity Services Limited GESL 8/6/2008 537 5.9 Grenreal Property Corporation Ltd GPCL 7/31/2008 3,241 4.7 GraceKennedy GKC 9/29/2005 3,351 2.7 Republic Bank (Grenada) Ltd RGBL 7/25/2008 89 6.6 St Kitts-Nevis-Anguilla National Bank Ltd SKNB 11/20/2003 2,692 17.9 St Lucia Electricity Services Ltd SLES 5/29/2003 13,522 1.9 S L Horsford & Company Ltd SLH 7/15/2004 12,437 3.5 Trinidad Cement Ltd TCL 12/15/2006 16,510 2.6 St. Kitts-Nevis-Anguilla Trading and Development Co. Ltd TDC 6/26/2003 4,199 8.6
Table1 provides the name, stock ticker symbol, and initial listing date for thirteen of the fourteen firms traded on the Eastern Caribbean Stock Exchange for the period October 19, 2001 through 12/17/2010. The average daily trading volume and percentage of trading days is also provided. Table 2: Runs Test
Company Ticker N % Up % Down % Flat Bank of Nevis BON 289 19% 19% 62% Cable and Wire St Kitts & Nevis Ltd CWKN 98 14% 18% 67% Dominica Electricity Services Ltd DES 104 20% 25% 55% East Caribbean Financial Holding Company Ltd ECFH 449 25% 25% 50% Grenada Electricity Services Limited GESL 34 26% 18% 56% Grenreal Property Corporation Ltd GPCL 27 4% 0% 96% GraceKennedy GKC 35 11% 26% 63%** Republic Bank (Grenada) Ltd RGBL 39 33% 33% 33% St Kitts-Nevis-Anguilla National Bank Ltd SKNB 318 15% 18% 68%** St Lucia Electricity Services Ltd SLES 35 37% 20% 43% S L Horsford & Company Ltd SLH 55 27% 33% 40% Trinidad Cement Ltd TCL 25 20% 20% 60%** St. Kitts-Nevis-Anguilla Trading and Development Co. Ltd. TDC 160 28% 22% 51%
Table 2 provides sample sizes for each company traded on the Eastern Caribbean Securities Exchange during the sample period October 19, 2001 through 12/17/2010. N represents the number of days the security traded minus one. The last three columns represent the percentage of up, down, and flat runs in returns from the listing date to the end of the sample period. ** denotes significance at the 5% level We use methodology similar to Loc, Lanjouw & Lensink (2010) to determine three types of runs: up, down, or flat, to test the hypothesis that ECSE-traded stock returns are randomly distributed and weak-

K. Charles et al | GJBR ♦ Vol. 7 ♦ No. 5 ♦ 2013
20
form efficient. Using this test, we identify three companies with non-random returns and thus reject the null hypothesis of weak-form efficiency for GraceKennedy, St. Kitts-Nevis-Anguilla National Bank Ltd., and Trinidad Cement Ltd. In Table 3 we provide the results of runs tests using both raw returns and returns adjusted for thin trading using the methodology of Miller, Muthuswamy, and Whaley (1994) to adjust for bias in the runs test due to infrequent returns. Before correcting for thin trading, we reject the null hypothesis of independent returns for three of the thirteen companies on the ECSE. After adjusting for thin trading, we reject the null hypothesis of independent returns for eight of the thirteen companies. These results are consistent with weak-form inefficiency of the ECSE. Table 3: Runs Test Raw and after Adjusting for Thin Trading
Company
Ticker
Z Test Statistic Raw
Z Test Statistic Adjusted
Bank of Nevis BON 0.62 5.84** Cable and Wire St Kitts & Nevis Ltd CWKN -1.59 0.64 Dominica Electricity Services Ltd DES -0.57 4.02** East Caribbean Financial Holding Company Ltd ECFH 0.50 11.29** Grenada Electricity Services Limited GESL -0.59 5.62** Grenreal Property Corporation Ltd GPCL -1.63 2.17** GraceKennedy GKC -2.96** -0.68 Republic Bank (Grenada) Ltd RBGL 1.57 1.71 St Kitts-Nevis-Anguilla National Bank Ltd SKNB -2.81** 0.45 St Lucia Electricity Services Ltd SLES 0.81 1.81 S L Horsford & Company Ltd SLH 1.55 2.97** Trinidad Cement Ltd TCL -2.30** 8.95** St. Kitts-Nevis-Anguilla Trading and Development Company Ltd TDC 1.11 5.41**
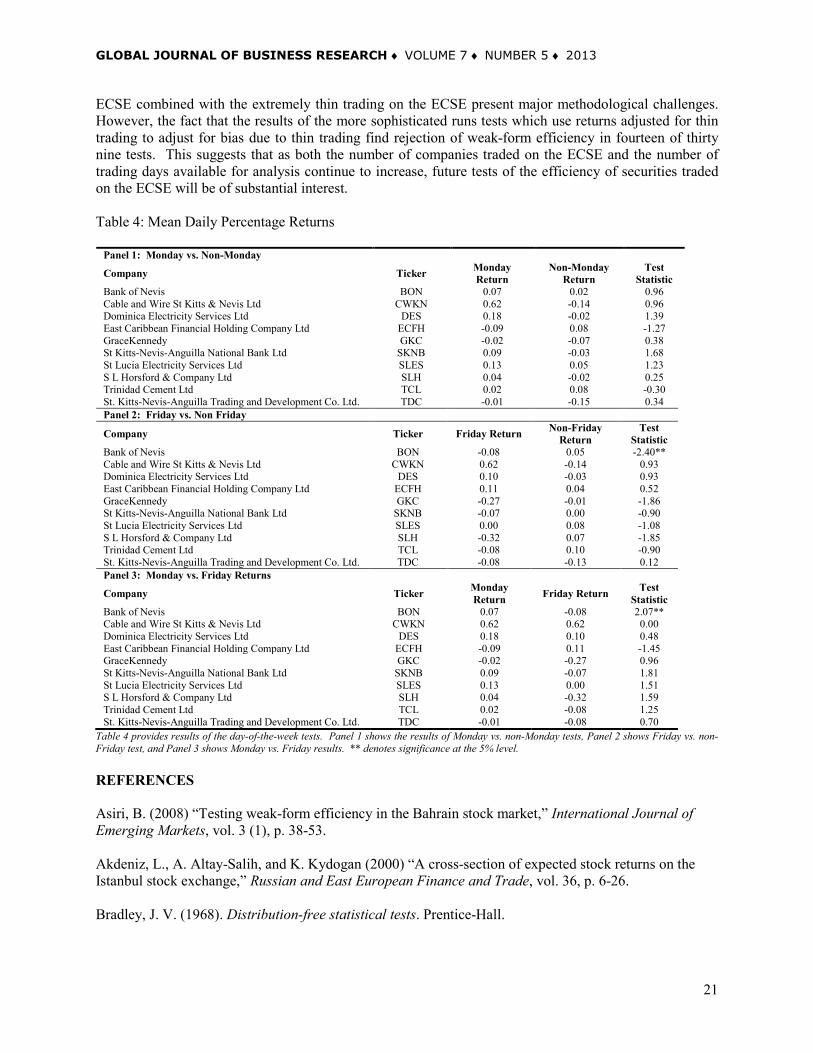
Table 3 provides results of the runs test before and after adjusting for thin trading using the methodology of Miller, et. al. (1994). The adjustment reduces bias in the runs test due to infrequent returns. The third and fourth columns give test statistics for the runs test for raw and adjusted returns. ** denotes significance at the 5% level Finally, Table 4 shows the results of our day-of-the-week tests in Panels 1, 2, and 3. Panel 1 shows the results of tests of Monday vs. non-Monday returns. For all ten companies we fail to reject the null hypothesis of weak-form market efficiency at a significance level of .05. Panel 2 shows the results of tests of Friday vs. non-Friday returns. In all cases except for the Bank of Nevis, we fail to reject the null hypothesis of weak-form market efficiency at a significance level of .05. Finally, Panel 3 of Table 2 shows the results of tests of Monday vs. Friday mean returns. For all cases except the Bank of Nevis, we fail to reject the null hypothesis of weak-form market efficiency at a significance level of .05. The results suggest that returns are spread out evenly across trading days. Rejecting the null hypothesis of weak-form efficiency in only two out of 30 tests provides support for the conclusion that the ECSE is weak-form efficient. Therefore, the results are consistent with weak-form efficiency of the ECSE. CONCLUDING COMMENTS Though many studies have been conducted on the efficiency of developed stock markets, relatively little research has been done concerning the efficiency of emerging stock markets. Given the massive amounts of capital being invested in emerging markets, 26 percent of total 2009 global equity invested, there is a need for empirical research on emerging markets. This is the first study of the weak-form efficiency of the stocks that trade on the Eastern Caribbean Stock Exchange (ECSE). This study conducts tests of the weak-form efficiency of the ECSE, which is characterized by very thin trading, using runs tests and day-of-the-week tests on thirteen of the fourteen individual stocks trading on the ECSE as of December 2010. In twenty five of thirty nine total runs tests (including up, down, and flat runs), and in all but two cases out of thirty day-of-the-week tests, we fail to reject the hypothesis that the market for the stocks on the ECSE is weak-form efficient. Thus we do not conclude that the ECSE itself is weak-form inefficient in general. The few companies trading on the
GLOBAL JOURNAL OF BUSINESS RESEARCH ♦ VOLUME 7 ♦ NUMBER 5 ♦ 2013
21
ECSE combined with the extremely thin trading on the ECSE present major methodological challenges. However, the fact that the results of the more sophisticated runs tests which use returns adjusted for thin trading to adjust for bias due to thin trading find rejection of weak-form efficiency in fourteen of thirty nine tests. This suggests that as both the number of companies traded on the ECSE and the number of trading days available for analysis continue to increase, future tests of the efficiency of securities traded on the ECSE will be of substantial interest. Table 4: Mean Daily Percentage Returns
Panel 1: Monday vs. Non-Monday
Company Ticker Monday Return
Non-Monday Return
Test Statistic
Bank of Nevis BON 0.07 0.02 0.96 Cable and Wire St Kitts & Nevis Ltd CWKN 0.62 -0.14 0.96 Dominica Electricity Services Ltd DES 0.18 -0.02 1.39 East Caribbean Financial Holding Company Ltd ECFH -0.09 0.08 -1.27 GraceKennedy GKC -0.02 -0.07 0.38 St Kitts-Nevis-Anguilla National Bank Ltd SKNB 0.09 -0.03 1.68 St Lucia Electricity Services Ltd SLES 0.13 0.05 1.23 S L Horsford & Company Ltd SLH 0.04 -0.02 0.25 Trinidad Cement Ltd TCL 0.02 0.08 -0.30 St. Kitts-Nevis-Anguilla Trading and Development Co. Ltd. TDC -0.01 -0.15 0.34 Panel 2: Friday vs. Non Friday
Company Ticker Friday Return Non-Friday Return
Test Statistic
Bank of Nevis BON -0.08 0.05 -2.40** Cable and Wire St Kitts & Nevis Ltd CWKN 0.62 -0.14 0.93 Dominica Electricity Services Ltd DES 0.10 -0.03 0.93 East Caribbean Financial Holding Company Ltd ECFH 0.11 0.04 0.52 GraceKennedy GKC -0.27 -0.01 -1.86 St Kitts-Nevis-Anguilla National Bank Ltd SKNB -0.07 0.00 -0.90 St Lucia Electricity Services Ltd SLES 0.00 0.08 -1.08 S L Horsford & Company Ltd SLH -0.32 0.07 -1.85 Trinidad Cement Ltd TCL -0.08 0.10 -0.90 St. Kitts-Nevis-Anguilla Trading and Development Co. Ltd. TDC -0.08 -0.13 0.12 Panel 3: Monday vs. Friday Returns
Company Ticker Monday Return Friday Return Test
Statistic Bank of Nevis BON 0.07 -0.08 2.07** Cable and Wire St Kitts & Nevis Ltd CWKN 0.62 0.62 0.00 Dominica Electricity Services Ltd DES 0.18 0.10 0.48 East Caribbean Financial Holding Company Ltd ECFH -0.09 0.11 -1.45 GraceKennedy GKC -0.02 -0.27 0.96 St Kitts-Nevis-Anguilla National Bank Ltd SKNB 0.09 -0.07 1.81 St Lucia Electricity Services Ltd SLES 0.13 0.00 1.51 S L Horsford & Company Ltd SLH 0.04 -0.32 1.59 Trinidad Cement Ltd TCL 0.02 -0.08 1.25 St. Kitts-Nevis-Anguilla Trading and Development Co. Ltd. TDC -0.01 -0.08 0.70
Table 4 provides results of the day-of-the-week tests. Panel 1 shows the results of Monday vs. non-Monday tests, Panel 2 shows Friday vs. non-Friday test, and Panel 3 shows Monday vs. Friday results. ** denotes significance at the 5% level. REFERENCES Asiri, B. (2008) “Testing weak-form efficiency in the Bahrain stock market,” International Journal of Emerging Markets, vol. 3 (1), p. 38-53. Akdeniz, L., A. Altay-Salih, and K. Kydogan (2000) “A cross-section of expected stock returns on the Istanbul stock exchange,” Russian and East European Finance and Trade, vol. 36, p. 6-26. Bradley, J. V. (1968). Distribution-free statistical tests. Prentice-Hall.

K. Charles et al | GJBR ♦ Vol. 7 ♦ No. 5 ♦ 2013
22
Canestrelli, E., and W. Ziemba (2000) “Seasonal anomalies in the Italian stock market,” Cambridge: Cambridge University Press, p. 337-363. Choi, J. (2009) “Emerging markets’ share of private equity investment continues to grow,” Emerging Markets Private Equity Association. Claessens, S. and Gooptu, S. (eds.) (1993) “Portfolio investments in developing countries,” World Bank Discussion Papers, 228. Comoli, L.R. and W.T. Ziemba (2000) “Japanese security market regularities,” in D. Keim and W. Ziemba, eds., Security imperfections in world-wide equity markets, Cambridge: Cambridge University Press, p. 458-491. Fama, E.F. (1970) “Efficient Capital Markets: A review of theory and empirical work, “Journal of Finance, vol. 25, p. 383-417. Fama, E. F. (1965) “The behavior of stock prices, “Journal of Business, p. 34-105. French, K. (1980) “Stock returns and the weekend effect,” Journal of Financial Economics, vol. 8, p. 55-69. Harvey, C. (1993) “The risk and predictability of international equity returns, “Review of Financial Studies, vol. 6, p. 527-566. Hassan, A., M.S. Abdullah, and Z.A. Shah (2007) “Testing of random walks and market efficiency in an emerging market: An empirical analysis of Karachi stock exchange,” The Business Review, December, p. 271-280. Loc, T. D., G. Lanjouw, and R. Lensink (2010) “Stock market efficiency in thin-trading markets: The case of the Vietnamese stock market, “Applied Economics, vol. 42, p. 3519-3532. Miller, M., J. Muthuswamy, and R. H. Whaley (1994) “Mean reversion of Standard & Poor’s 500 Index basis changes: Arbitrage-induced or statistical illusion?” Journal of Finance, vol. 49 (2), p. 479-513. Mollah, A.S. (2007) “Testing weak-form market efficiency in emerging markets: Evidence from Botswana stock exchange,” International Journal of Theoretical and Applied Finance, vol. 10 (6), p. 1077-1094. Moore, A. (1962) “A statistical analysis of common-stock prices,” Unpublished Ph.D. dissertation, Graduate School of Business, University of Chicago. Oakley, D. and M. Gregory (2009) “Star is rising for emerging markets,” Financial Times, October 5, 2009. Robinson, J. (2005) “Stock price behavior in emerging markets: Tests for weak-form market efficiency on the Jamaican stock exchange,” Social and Economic Studies, vol. 54 (2), June, p. 51-69. Steverman, B. (2010) “Emerging-market stocks: How much is too much?” Businessweek, October 24, 2010.

GLOBAL JOURNAL OF BUSINESS RESEARCH ♦ VOLUME 7 ♦ NUMBER 5 ♦ 2013
23
BIOGRAPHY Kirwins Charles earned a B.A. in Finance and a Masters in Public Administration from the University of Wisconsin Oshkosh. He is currently a doctoral student in Public Policy at Carleton University. His primary research area is the effectiveness of policies towards the improvement of quality of life. Kirwins can be reached at Carleton University, School of Public Policy and Administration, 5224 River Building, Ottawa, ON K15 5B6, [email protected]. Dr. Bruce Niendorf earned his B.S. from the University of Wisconsin Madison, his M.B.A. from the University of Wisconsin Oshkosh and his Ph.D. from Florida State University. His areas of teaching and research include: Financial Management, Investments, International Finance, and Financial Modeling using distributed artificial intelligence. Dr. Niendorf taught at the University of Montana prior to joining the University of Wisconsin Oshkosh. He can be reached at Department of Finance and Business Law, College of Business, University of Wisconsin Oshkosh, Oshkosh, Wisconsin 54901, [email protected]. Dr. Kristine Beck earned a B.S. in Economics from California Polytechnic State University San Luis Obispo and a Ph.D. in Finance from Florida State University. Dr. Beck taught at the University of Denver and worked in the banking industry prior to joining the faculty at the University of Wisconsin Oshkosh. Professor Beck is also the Director of the Wisconsin Financial Services Institute. Her research interests include international finance, investments, and methodological issues. She can be reached at Department of Finance and Business Law, College of Business, University of Wisconsin Oshkosh. Oshkosh, Wisconsin 54901, [email protected].


GLOBAL JOURNAL OF BUSINESS RESEARCH ♦ VOLUME 7 ♦ NUMBER 5 ♦ 2013
25
DETERMINANTS OF ECONOMIC SUCCESS IN THE MIDDLE EAST AND NORTH AFRICA
Felina B. Duncan, Valdosta State University Zulal S. Denaux, Valdosta State University
ABSTRACT
Periodically referred to as the “cradle of civilization”, an adage reflecting its past economic success and growth, the Middle East and North Africa region continues to serve as an international focal point, albeit a disappointing one in light of its economic potential. Therefore, the purpose of this study is to utilize regression analysis to reexamine the impact of initial conditions, human capital, the investment ratio, macroeconomic performance, trade openness, life expectancy, and natural resource abundance on the growth of the Middle East and North Africa region’s real GDP per capita in light of recent events, namely the widespread civilian protests, demonstrations, and toppled dictatorships across the Arab World where high unemployment, security states, a weak private sector, volatile external revenues, and a disproportionate concentration of power in the hands of a few have been the norm for decades. JEL: O11, O15, C23 KEYWORDS: Economic Growth, MENA Region, Human Capital, Panel Estimation INTRODUCTION
iven the Middle East and North Africa (MENA) region’s valuable coastal access and high levels of urbanization, the relatively unchanged economic discrepancy between the region and the high-income nations of the world from 1913 to the present is a somewhat disconcerting reality (Pamuk,
2006). In fact, the entire regional paradigm has maintained a sort of status quo over the past one hundred plus years; unearned income streams continue to supply an all pervasive state that stifles long term economic growth by engaging in patronage over production. However, this longstanding continuum, threatened by the region’s young, educated, and increasingly female labor force, recently faced a sizeable crisis (Malik & Awadallah, 2011). On December 18, 2010 a series of revolutions known as the Arab Spring Uprising began in Tunisia —where unemployment among university graduates was approaching fifty percent (Mihailovich & Sommer, 2011)— before erupting all over the MENA region and overthrowing the entrenched governmental powers in Tunisia, Egypt, Libya, and Yemen (Central Intelligence Agency, 2012). According to the World Bank (2012), GDP in several of the net oil-importing countries in the MENA region contracted by more than six percent in the first quarter of 2011 due in large part to the turmoil that followed the initial protests before returning to its previous levels by the end of 2011; GDP declines were less dramatic for countries not experiencing large scale protests. Similarly, for oil exporting countries that experienced ample political turmoil like Libya and Yemen, rising oil prices in 2011 did not lead to a higher economic growth (Charafeddine, 2011). Additionally, industrial production in countries that faced major protests in 2010 and subsequent political change in 2011, like Tunisia and Egypt, suffered considerably; the situation has since improved, although the development has been much more volatile in Egypt (World Bank, 2012). Finally, the Arab Spring contributed to unprecedented declines in tourism —which is an important source of income for many countries in the MENA region— and a significant loss of life (World Bank, 2012; The Economist, 2011).
G
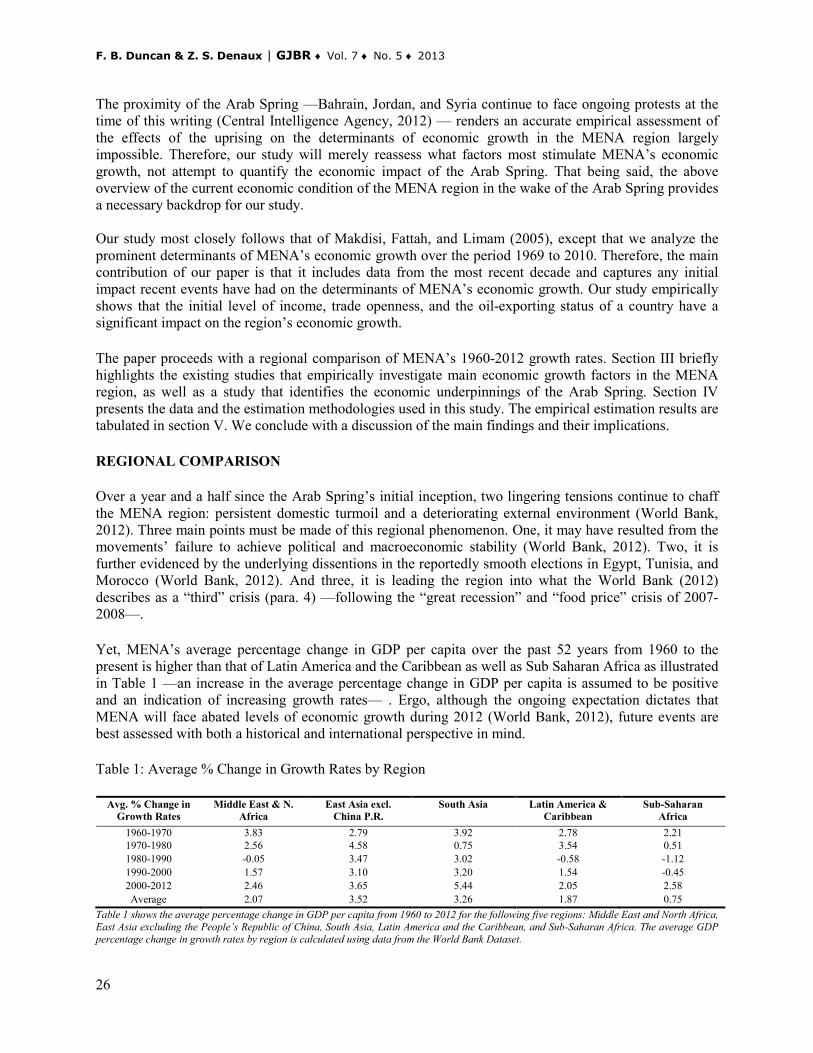
F. B. Duncan & Z. S. Denaux | GJBR ♦ Vol. 7 ♦ No. 5 ♦ 2013
26
The proximity of the Arab Spring —Bahrain, Jordan, and Syria continue to face ongoing protests at the time of this writing (Central Intelligence Agency, 2012) — renders an accurate empirical assessment of the effects of the uprising on the determinants of economic growth in the MENA region largely impossible. Therefore, our study will merely reassess what factors most stimulate MENA’s economic growth, not attempt to quantify the economic impact of the Arab Spring. That being said, the above overview of the current economic condition of the MENA region in the wake of the Arab Spring provides a necessary backdrop for our study. Our study most closely follows that of Makdisi, Fattah, and Limam (2005), except that we analyze the prominent determinants of MENA’s economic growth over the period 1969 to 2010. Therefore, the main contribution of our paper is that it includes data from the most recent decade and captures any initial impact recent events have had on the determinants of MENA’s economic growth. Our study empirically shows that the initial level of income, trade openness, and the oil-exporting status of a country have a significant impact on the region’s economic growth.
The paper proceeds with a regional comparison of MENA’s 1960-2012 growth rates. Section III briefly highlights the existing studies that empirically investigate main economic growth factors in the MENA region, as well as a study that identifies the economic underpinnings of the Arab Spring. Section IV presents the data and the estimation methodologies used in this study. The empirical estimation results are tabulated in section V. We conclude with a discussion of the main findings and their implications.
REGIONAL COMPARISON
Over a year and a half since the Arab Spring’s initial inception, two lingering tensions continue to chaff the MENA region: persistent domestic turmoil and a deteriorating external environment (World Bank, 2012). Three main points must be made of this regional phenomenon. One, it may have resulted from the movements’ failure to achieve political and macroeconomic stability (World Bank, 2012). Two, it is further evidenced by the underlying dissentions in the reportedly smooth elections in Egypt, Tunisia, and Morocco (World Bank, 2012). And three, it is leading the region into what the World Bank (2012) describes as a “third” crisis (para. 4) —following the “great recession” and “food price” crisis of 2007-2008—.
Yet, MENA’s average percentage change in GDP per capita over the past 52 years from 1960 to the present is higher than that of Latin America and the Caribbean as well as Sub Saharan Africa as illustrated in Table 1 —an increase in the average percentage change in GDP per capita is assumed to be positive and an indication of increasing growth rates— . Ergo, although the ongoing expectation dictates that MENA will face abated levels of economic growth during 2012 (World Bank, 2012), future events are best assessed with both a historical and international perspective in mind.
Table 1: Average % Change in Growth Rates by Region
Avg. % Change in Growth Rates
Middle East & N. Africa
East Asia excl. China P.R.
South Asia Latin America & Caribbean
Sub-Saharan Africa
1960-1970 3.83 2.79 3.92 2.78 2.21 1970-1980 2.56 4.58 0.75 3.54 0.51 1980-1990 -0.05 3.47 3.02 -0.58 -1.12 1990-2000 1.57 3.10 3.20 1.54 -0.45 2000-2012 2.46 3.65 5.44 2.05 2.58 Average 2.07 3.52 3.26 1.87 0.75
Table 1 shows the average percentage change in GDP per capita from 1960 to 2012 for the following five regions: Middle East and North Africa, East Asia excluding the People’s Republic of China, South Asia, Latin America and the Caribbean, and Sub-Saharan Africa. The average GDP percentage change in growth rates by region is calculated using data from the World Bank Dataset.

GLOBAL JOURNAL OF BUSINESS RESEARCH ♦ VOLUME 7 ♦ NUMBER 5 ♦ 2013
27
From 1960-1970 MENA’s average percentage change in GDP per capita was at least 1.04 percentage points higher than either East Asia —excluding the People’s Republic of China for the purposes of this study—, Latin American and the Caribbean, or Sub-Saharan Africa, and only 0.08 points lower than that of South Asia. Subsequently from 1970-1980, MENA lagged behind East Asia by 2.02 points and from Latin America and the Caribbean by 0.98 points while staying ahead of South Asia and Sub-Saharan Africa by at least 1.82 points. Moreover, for the period 1980-1990, MENA actually experienced a negative average growth rate, falling at least 3.07 points behind East and South Asia. However, during this same period MENA surged ahead of Latin America and the Caribbean by 0.52 points and Sub-Saharan Africa by 1.06 points –two regions that also experienced negative average growth rates–. Consequently, as illustrated in Figure 1, the 1980-1990 decade witnessed the greatest standard deviation between the average percentage changes in GDP per capita among the sample regions.
Figure 1: Standard Deviation between Regional Growth Rates
Figure 1 shows the standard deviation between the average percentage change in GDP per capita from 1960-2012 for the following five` regions: Middle East and North Africa, East Asia excluding the People’s Republic of China, South Asia, Latin America and the Caribbean, and Sub-Saharan Africa. The standard deviation of the average GDP percentage change in growth rates is calculated using data from the World Bank Dataset.
From 1990-2000, MENA regained vitality and its average percentage change in GDP per capita increased by 1.62 points, trailing East and South Asia by only 0.54, nearly half of the previous discrepancy. Latin American and the Caribbean, and Sub Saharan Africa meanwhile approached MENA’s average, trailing only by 0.30 points, an improvement of three and a half times compared to the previous decade. Then from 2000 to the present MENA fell behind Sub-Saharan Africa for the first time in the 52-year period surveyed. The MENA region also fell behind East and South Asia by 1.19 and 2.98 respectively. That being said, MENA remained ahead of Latin America and the Caribbean by 0.41 percentage points and is expected to experience a considerable increase in GDP per capita in 2013 (World Bank, 2012).
LITERATURE REVIEW
Malik and Awadallah (2011), in detailing the economics behind the Arab Spring, poignantly describe the Arab economies as being “greased through oil, aid, and remittances” (p. 27) in agreement with Pamuk’s (2006) judgment that the MENA region cannot grow without first dealing with the negative effects of oil revenues on economic institutions and politics. However, Malik and Awadallah (2011) also argue that the debilitating combination of aid and oil has stifled MENA’s economic and political incentives to take such preliminary action, creating a disadvantageous initial condition. The study by Hoekman and Messerlin (2002) further substantiates that the initial conditions present in the MENA region have a significant impact on the economic growth of the region. According to their study,
0
0.5
1
1.5
2
2.5
1960-1970 1970-1980 1980-1990 1990-2000 2000-2012
Stan
dard
Dev
iatio
n
Year

F. B. Duncan & Z. S. Denaux | GJBR ♦ Vol. 7 ♦ No. 5 ♦ 2013
28
integration based on merchandise trade liberalization that proved successful in Europe is inhibited in MENA by three unique initial conditions; one, the markets are small; two, the export concentration caused by a comparative advantage in natural resources would necessitate geographical diversification of exports beyond the region in order to sufficiently limit risk; and three, as indicated by Malik and Awadallah (2011), large Arab countries lack the incentive to pursue merchandise trade-based economic integration while smaller countries that have the incentive lack the leverage to act upon it. Additionally, according to Makdisi, Fattah, and Lima’s (2005) study, investment and initial level of income are the most influential determinants of MENA’s economic growth, human capital contributes to the relative underperformance of the region —which Salehi-Isfahani’s (2005) study on MENA’s urban households validates—, and trade openness has a low impact on MENA’s economic growth; this supports Yanikkaya’s (2002) finding that trade barriers are significantly and positively associated with economic growth in developing countries. Makdisi, Fattah, and Lima (2005) further delineate that several factors, namely human and physical capital, the influence of the state, institutions, and external and internal shocks —for instance, Rzigui (2005) found that around 28.37% of the long run variability in Tunisia’s real GDP is attributable to external shocks—merit a more extensive analysis than their research provides. In a later study, Nabli (2007) identifies human capital and physical infrastructure as the most significant determinants of economic growth for the region, followed by macroeconomic and external stability. Specifically, improvements in primary education, the road network, and the health conditions of the population contributed the most to the growth performance of the MENA region during the 1990’s (Nabli, 2007). Taken as a whole, the GDP per capita annual growth rate in the MENA countries would have been 0.8 percent in the 1990’s instead of 1.7 percent if human capital had not advanced during that decade; human capital’s impact was even higher in Iran, Syria, and Algeria due to a wider initial gap in primary schooling (Nabli, 2007). Similarly, physical infrastructures’ contribution to economic growth in the form of telephone lines was the highest in Iran and Syria out of a sample of forty-four developing countries in the Middle East and North Africa due to their low initial level of infrastructure (Nabli, 2007). Additionally, Nabli’s (2007) analysis of structural reform on growth produced two seemingly contradictory findings. First, in an increasingly volatile environment, high levels of structural reform accentuated the effects of macroeconomic instability. Secondly, macroeconomic reform led to economic growth even in the absence of structural reforms. Consequently, the structural reform variable was only statistically significant as a multiplicative term and Nabli (2007) concluded that an economy needs to be stabilized before it can be reformed. Malik and Awadallah (2011) identify the economic underpinnings of the Arab Spring as follows; poverty, unemployment, and a lack of economic opportunity. Furthermore, in addition to Nabli’s (2007) findings about the need for stability, Malik and Awadallah (2011) write that structural reform in MENA is also a political problem. Whether the new governments in Tunisia, Egypt, Libya, and Yemen take advantage of their regions’ potential sources of growth as identified in the literature, such as the benefits of macroeconomic stability, has yet to be seen. However, the data continue to indicate that the MENA region has the potential to grow substantially. DATA AND EMPIRICAL ESTIMATION METHODOLOGY In order to reassess the prominent determinants of MENA’s economic growth, this study gathers yearly data on the initial conditions, human capital, investment ratio, macroeconomic performance, openness, and natural resource abundance. The variables are a reflection of the existing literature as referenced in the exposition of this study. Moreover, with the exception of human capital, all of the variables utilized in this study are obtained from the World Bank Dataset over the period of 1969-2010; data on human capital is obtained from the Barro-Lee Educational Attainment Dataset over the period 1970-2010. The sample consists of seven MENA countries: Algeria, Egypt, Jordan, Morocco, Saudi Arabia, Syria, and Tunisia. Unfortunately, the unavailability of data has prevented the inclusion of the remaining MENA countries in
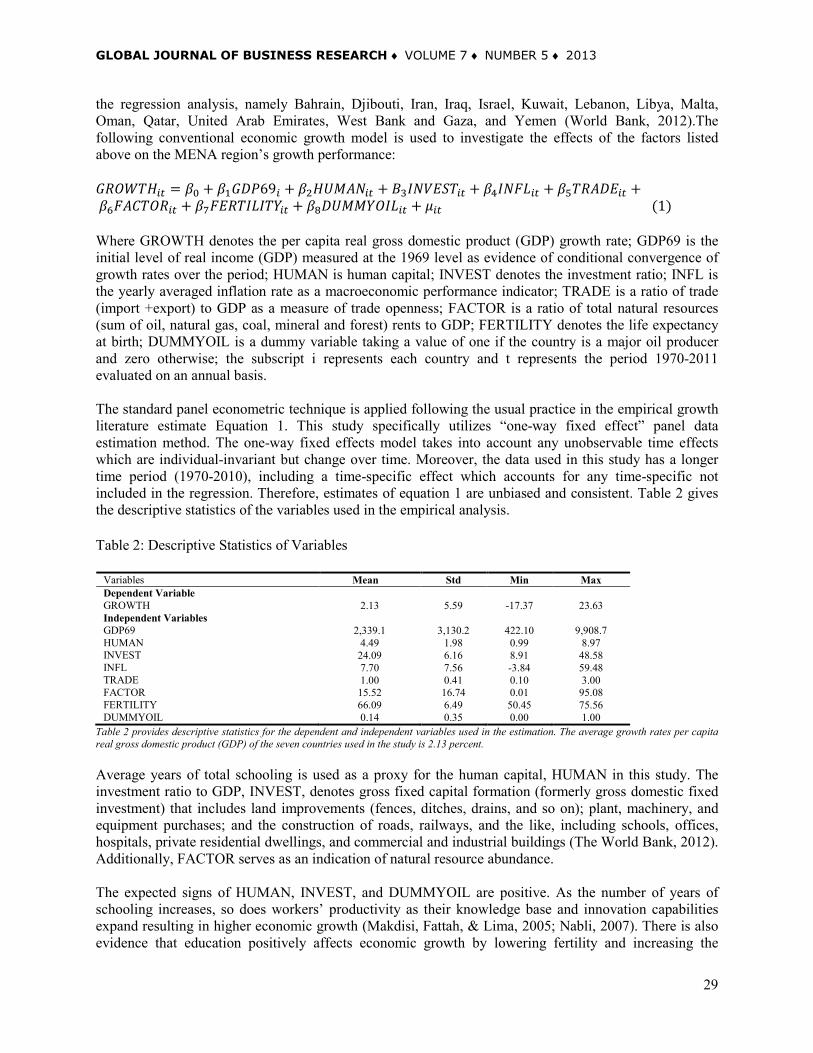
GLOBAL JOURNAL OF BUSINESS RESEARCH ♦ VOLUME 7 ♦ NUMBER 5 ♦ 2013
29
the regression analysis, namely Bahrain, Djibouti, Iran, Iraq, Israel, Kuwait, Lebanon, Libya, Malta, Oman, Qatar, United Arab Emirates, West Bank and Gaza, and Yemen (World Bank, 2012).The following conventional economic growth model is used to investigate the effects of the factors listed above on the MENA region’s growth performance: 𝐺𝑅𝑂𝑊𝑇𝐻𝑖𝑡 = 𝛽0 + 𝛽1𝐺𝐷𝑃69𝑖 + 𝛽2𝐻𝑈𝑀𝐴𝑁𝑖𝑡 + 𝐵3𝐼𝑁𝑉𝐸𝑆𝑇𝑖𝑡 + 𝛽4𝐼𝑁𝐹𝐿𝑖𝑡 + 𝛽5𝑇𝑅𝐴𝐷𝐸𝑖𝑡 + 𝛽6𝐹𝐴𝐶𝑇𝑂𝑅𝑖𝑡 + 𝛽7𝐹𝐸𝑅𝑇𝐼𝐿𝐼𝑇𝑌𝑖𝑡 + 𝛽8𝐷𝑈𝑀𝑀𝑌𝑂𝐼𝐿𝑖𝑡 + 𝜇𝑖𝑡 (1)
Where GROWTH denotes the per capita real gross domestic product (GDP) growth rate; GDP69 is the initial level of real income (GDP) measured at the 1969 level as evidence of conditional convergence of growth rates over the period; HUMAN is human capital; INVEST denotes the investment ratio; INFL is the yearly averaged inflation rate as a macroeconomic performance indicator; TRADE is a ratio of trade (import +export) to GDP as a measure of trade openness; FACTOR is a ratio of total natural resources (sum of oil, natural gas, coal, mineral and forest) rents to GDP; FERTILITY denotes the life expectancy at birth; DUMMYOIL is a dummy variable taking a value of one if the country is a major oil producer and zero otherwise; the subscript i represents each country and t represents the period 1970-2011 evaluated on an annual basis. The standard panel econometric technique is applied following the usual practice in the empirical growth literature estimate Equation 1. This study specifically utilizes “one-way fixed effect” panel data estimation method. The one-way fixed effects model takes into account any unobservable time effects which are individual-invariant but change over time. Moreover, the data used in this study has a longer time period (1970-2010), including a time-specific effect which accounts for any time-specific not included in the regression. Therefore, estimates of equation 1 are unbiased and consistent. Table 2 gives the descriptive statistics of the variables used in the empirical analysis. Table 2: Descriptive Statistics of Variables
Variables Mean Std Min Max Dependent Variable GROWTH 2.13 5.59 -17.37 23.63 Independent Variables GDP69 2,339.1 3,130.2 422.10 9,908.7 HUMAN 4.49 1.98 0.99 8.97 INVEST 24.09 6.16 8.91 48.58 INFL 7.70 7.56 -3.84 59.48 TRADE 1.00 0.41 0.10 3.00 FACTOR 15.52 16.74 0.01 95.08 FERTILITY 66.09 6.49 50.45 75.56 DUMMYOIL 0.14 0.35 0.00 1.00
Table 2 provides descriptive statistics for the dependent and independent variables used in the estimation. The average growth rates per capita real gross domestic product (GDP) of the seven countries used in the study is 2.13 percent.
Average years of total schooling is used as a proxy for the human capital, HUMAN in this study. The investment ratio to GDP, INVEST, denotes gross fixed capital formation (formerly gross domestic fixed investment) that includes land improvements (fences, ditches, drains, and so on); plant, machinery, and equipment purchases; and the construction of roads, railways, and the like, including schools, offices, hospitals, private residential dwellings, and commercial and industrial buildings (The World Bank, 2012). Additionally, FACTOR serves as an indication of natural resource abundance. The expected signs of HUMAN, INVEST, and DUMMYOIL are positive. As the number of years of schooling increases, so does workers’ productivity as their knowledge base and innovation capabilities expand resulting in higher economic growth (Makdisi, Fattah, & Lima, 2005; Nabli, 2007). There is also evidence that education positively affects economic growth by lowering fertility and increasing the

F. B. Duncan & Z. S. Denaux | GJBR ♦ Vol. 7 ♦ No. 5 ♦ 2013
30
productivity of private investment (Barro, 1991). In the same way, increased investment in physical capital (INVEST) causes higher levels of production which in turn augments economic growth (Levine & Renelt, 1992; Nabli, 2007). Moreover, DUMMYOIL is included to capture if the country is major oil producer because it is expected that MENA oil producers enjoy higher levels of economic growth because of rich oil endowments (Abderrezak, 2004). The expected signs of GDP69, INFL, FERTILITY and FACTOR are negative. The initial level of real GDP (GDP69) determines the length of time each country needs to reach its own long-run economic growth. Moreover, aside from inherently affecting growth by raising interest rates and subsequently making investments more expensive, inflation (INF) is one of several factors that leaves the region more susceptible to external shocks (Makdisi, Fattah, & Lima, 2005). There is also evidence that lower mortality rates will lead to an increase in population size, swelling the workforce and straining a youth unemployment rate that is already one of the largest in the world (Cervellati & Sunde, 2011; Malik & Awadallah, 2011); for example, in Jordan the youth unemployment rate —the unemployed under thirty years of age— was 70% in December 2011. Therefore, it is expected that lower mortality rates or higher life expectancy translates into lower economic growth. However, the study by Cervellati and Sunde (2011) empirically found that higher life expectancy leads to faster economic growth; this study anticipates that the negative effects of FERTILITY will outweigh the positive effects because the youth unemployment rate is currently so unprecedented in the MENA region. Finally, although MENA countries use oil export revenues to invest in infrastructure, education, and health care (Nabli, 2007), we expect FACTOR to negatively impact GROWTH in accordance with Makdisi, Fattah, and Lima’s 2005 findings. The negative impact has been partially attributed to the tendency of natural resource abundance to overvalue the national currency and hinder the growth of non-oil exports (Makdisi, Fattah, & Lima, 2005; Guetat, 2006). The relationship between trade openness and economic growth has been extensively investigated by cross-country empirical studies. The majority of these studies find that trade openness has a strong and statistically significant positive effect on economic growth (Harrison, 1996; Lee et al., 2004, to name a few). However, this relationship is not always apparent, especially in the case of the MENA oil exporting countries that generally have high trade ratios associated with their level of oil abundance. What’s more, oil abundance may be detrimental to the economic growth of the MENA region due to weaker intuitional quality if it encourages rent seeking and corruption (Sachs & Warner, 1995; Sala-i-Martin & Subramanian, 2003). In addition, countries that have high trade ratios simultaneously maintain highly restrictive trade policies (Makdisi, Fattah, & Lima, 2005). Therefore, for this study, TRADE as proxy for openness is expected to have a negative effect on economic growth, GROWTH. Table 3 summarizes the theoretical expected signs of the coefficients in Equation 1. Table 3: Expected Signs of Coefficients
Coefficients
Expected Sign
<0 >0 >0 <0 <0 <0 <0 >0
Table 3 shows the expected signs of coefficients of variables, namely GDP69, HUMAN, INVEST, INFL, TRADE, FACTOR, FERTILITY, and DUMMYOIL, respectively. EMPIRICAL ESTIMATION RESULTS Equation 1 is estimated using Ordinary Least Square employing panel data from the seven MENA countries listed above for the period 1969-2010. The empirical estimation results are reported in Table 4. The null hypothesis of no fixed specific-time effect is rejected at 1% significance level.

GLOBAL JOURNAL OF BUSINESS RESEARCH ♦ VOLUME 7 ♦ NUMBER 5 ♦ 2013
31
Table 4: OLS Panel Regression Estimation Results
Variables Coefficient Estimates
T-Statistics Coefficient Estimates
T-Statistics
INTERCEPT 0.0687 0.87 0.0545 2.17***
GDP69 -0.00003 -2.58*** -0.00002 -2.43***
HUMAN 0.0034 0.37
INVEST 0.0007 0.08
INFL 0 0.11
TRADE -0.0153 -1.71* -0.016 -1.85*
FACTOR 0.0003 0.79
FERTELITY -0.0007 -0.6
DUMMYOIL 0.202 2.34*** 0.1465 2.22***
Adjusted R2 0.3 Adjusted R2 0.3
No. of Obs. 287 No. of Obs. 287
Table 4 shows the regression estimates of the equation: 𝐺𝑅𝑂𝑊𝑇𝐻𝑖𝑡 = 𝛽0 + 𝛽1𝐺𝐷𝑃69𝑖 + 𝛽2𝐻𝑈𝑀𝐴𝑁𝑖𝑡 + 𝐵3𝐼𝑁𝑉𝐸𝑆𝑇𝑖𝑡 + 𝛽4𝐼𝑁𝐹𝐿𝑖𝑡 +𝛽5𝑇𝑅𝐴𝐷𝐸𝑖𝑡 + 𝛽6𝐹𝐴𝐶𝑇𝑂𝑅𝑖𝑡 + 𝛽7𝐹𝐸𝑅𝑇𝐼𝐿𝐼𝑇𝑌𝑖𝑡 + 𝛽8𝐷𝑈𝑀𝑀𝑌𝑂𝐼𝐿𝑖𝑡 + 𝜇𝑖𝑡. The second column of Table 4 tabulates the coefficient estimates of independent variables used in the regression estimation. The third and last columns in Table 4 present the t-statistics. *, **, *** represent significance at 10, 5, and 1 percent levels, respectively. As shown in Table 4, initial income (GDP69) is negative and significant at the 1 % significance level, suggesting conditional convergence of growth rates over the year. Both TRADE as proxy for trade openness and DUMMYOIL, dummy variable if the country is major oil producer, are statistically significant and their signs are consistent with the predictions of this paper. Trade openness (TRADE) has a negative effect on economic growth in the MENA region but is statistically significant at the 10% level. A one percent point increase in the TRADE reduces growth 0.0153 percentage points. However, this is not surprising given that trade openness is measured as a ratio of trade (import + export) to GDP; MENA’s entrenched ideology and economic structure relies heavily on fuel export rents, which Malik and Awadallah (2011) insightfully define as the region’s “original sin” (p. 5). Because of this reliance on natural resource exports and subsequent restriction on imports, the innovation and production emphasis present in developed countries remains largely absent in the MENA region. DUMMYOIL’s positive effect on GROWTH and high level of statistical significance at the 1% level can be attributed to the way oil revenues are distributed in most MENA countries; they often provide for the improvement of welfare and help finance investment infrastructure and human capital (Makdisi, Fattah, & Lima, 2005). For instance, in January 2012 the World Bank issued a report revealing that Algeria used part of their rising oil and gas revenues to raise public-sector wages, support employment and housing, and to mitigate the pressure on living standards from escalating food and fuel prices. However, this extensive reliance on oil revenues has also been seen to negatively affect growth due to the volatility of oil prices. (Makdisi, Fattah, & Lima, 2005; Malik & Awadallah, 2011). Several factors can account for the statistical insignificance of HUMAN, INVEST, and INFL, FACTOR, and FERTELITY, but perhaps the most important is that the MENA region is characterized by macroeconomic volatility and political instability (Neaime, 2005). Consequently, data is limited and not always reliable. What’s more, specifically with regards to human capital (HUMAN), although educational attainment has increased exponentially across the MENA region during the last forty years, labor markets remain distorted in that jobs are awarded based on connection rather than competition (Malik &

F. B. Duncan & Z. S. Denaux | GJBR ♦ Vol. 7 ♦ No. 5 ♦ 2013
32
Awadallah, 2011; Salehi-Isfahani, 2005). In other words, the region lacks a vibrant private sector that permits increased education to translate into increased productivity (Malik & Awadallah, 2011; Salehi-Isfahani, 2005). Therefore, while a higher quantity and quality of observations may render more variables statistically significant, the very nature of the MENA regions’ economic structure could be the cause of the statistical insignificance. Finally, this study tests whether the coefficients estimates of above panel-time effect OLS tabulated in the second column of Table 4 are sensitive to excluding insignificant variables. Column (4) of Table 4 reports the coefficient estimates with those insignificant variables excluded from the regression. The parameters estimates on initial income (GDP69), trade openness (TRADE) and DUMMYOIL, dummy variable if the country is major oil producer, are statistically significant and their signs are unchanged. Therefore, the earlier results are robust with respect to excluding any insignificant variable. CONCLUSION This study reassesses the determinants of economic growth in the Middle East and North Africa region during the period 1969-2010. Because of the unavailability of data, this study only includes seven MENA countries, namely Algeria, Egypt, Jordan, Morocco, Saudi Arabia, Syria, and Tunisia. By utilizing a one-way (time-dummies) fixed panel estimation method, this study found that initial income (GDP69) and TRADE as proxy for trade openness have a negative impact on economic growth in the MENA region, while DUMMYOIL, dummy variable if the country is major oil producer, has a positive impact. Our remaining variables, HUMAN as a proxy for human capital, the investment ratio (INVEST), INFL as a macroeconomic performance indicator, FACTOR as a measure of natural resource abundance, and life expectancy at birth (FERTILITY) were statistically insignificant. The MENA region has experienced a great deal of volatility over the past forty years, even witnessing negative growth rates between 1980 and 1990. More recently, continuing domestic disturbances indicate that the economic underpinnings of the Arab Spring have yet to be ameliorated (World Bank, 2012). Unemployment is at an all-time high, which has increased the high-risk aversion of international investors (Malik & Awadallah, 2011; World Bank, 2012). Finally, the uncertainty and vulnerability in the region is amplified by a languishing external environment (World Bank, 2012). This is hardly a recipe for economic success. So what will springboard the MENA region into a period of sustained economic growth? While our study indicates that DUMMYOIL positively affects MENA’s per capita real GDP growth rate, that very dependence on oil exports could also be the cause of TRADE’s negative impact. Therefore, further research is required to answer this pressing question. Specifically, political stability should be empirically assessed for the most recent decade using Guetat’s (2006) proxy REVCOUP, in addition to an alternative proxy for trade openness. Even more imperative, however, is the need for reliable data from the remaining MENA countries. Finally, additional time is paramount to accurately measuring the impact of the Arab Spring on the determinants of MENA’s economic growth and concluding once and for all whether a youth revolution was really the springboard MENA needed to achieve its economic potential. REFERENCES Abderrezak, A. (2004) “Colonization’s Long-Lasting Influence on Economic Growth: Evidence from the MENA Region” The Journal of North African Studies, 9(3).

GLOBAL JOURNAL OF BUSINESS RESEARCH ♦ VOLUME 7 ♦ NUMBER 5 ♦ 2013
33
Barro, R. (1991) “Economic Growth in a Cross-Section of Countries” Quarterly Journal Of Economics, 106(2), 407-443. Central Intelligence Agency. (2012) “The World Factbook” Retrieved from https://www.cia.gov Cervellati, M. & Sunde, U. (2011) “Life Expectancy and Economic Growth: The Role of the Demographic Transition” Journal of Economic Growth, 16(2), 99-133. Charafeddine, R.H. (2011) “The Economic and Financial Impacts of the Arab Awakening” Retrieved from Harvard University Belfer Center website: belfercenter.ksg.harvard.edu Guetat, I. (2006. “The Effects of Corruption on the Growth Performance of the MENA Countries”, Journal of Economics and Finance, 30(2). Harrison, A.E. (1996) “Openness and growth: A time-series, cross-country analysis for developing countries”, Journal of Developmental Economics, 48(2). Hoekman, B. & Messerlin, P. (2002) “Initial Conditions and Incentives for Arab Economic Integration: Can the European Community’s Success Be Emulated?,” The World Bank: Policy Research Working Paper Series, No. 2921. Retrieved from http://econ.worldbank.org/files/20935_wps2921.pdf Lee, H.Y., L.A. Ricci, and R. Rigobon. (2004) “Once again, is openness good for growth?” Journal of Development Economics, volume 75, 451-472. Levine, R. & Renelt, D. (2007) “A Sensitivity Analysis of Cross-Country Growth Regressions”, The American Economic Review, 82(4). Makdisi, S., Fattah, Z., & Lima, I. (2005). “The Determinants of Economic Growth in the MENA Region”, North Holland/Elsevier Contributions to Economic Analysis. Retrieved from http://depot.gdnet.org/newkb/submissions/makdisi_mena_growth.pdf Malik, A. & Awadallah, B. (2011) “The Economics of the Arab Spring”, Center for the Study of African Economies. Retrieved from http://www.csae.ox.ac.uk/workingpapers/pdfs/csae-wps-2011-23.pdf Mihailovich, D. & Sommer, N. (2011, June 17) “How a slap sparked Tunisia's revolution”, 60 Minutes. Retrieved from http://www.cbsnews.com Nabli, M.K. (2007) “Breaking the Barriers to Higher Economic Growth: Better Reforms and Deeper Reforms in the Middle East and North Africa”, Washington, DC: The World Bank. Neaime, S. (2005) “Financial Market Integration and Macroeconomic Volatility in the MENA Region: An Empirical Investigation”, Review of Middle East Economics and Finance, 3(3). Pamuk, Ș. (2006) “Estimating Economic Growth in the Middle East Since 1820”, The Journal of Economic History, 66(3). Rzigui, L. (2005) “External Shocks and Economic Fluctuations: Evidence from Tunisia”, Munich Personal RePEc Archive, No. 630. Retrieved from http://mpra.ub.uni-muenchen.de/630/ Sachs, J.D. & Warner, A.M. (1995) “Natural Resource Abundance and Economic Growth” National Bureau of Economic Research, No. 5398. Retrieved from http://www.nber.org/papers/w5398.pdf

F. B. Duncan & Z. S. Denaux | GJBR ♦ Vol. 7 ♦ No. 5 ♦ 2013
34
Sala-i-Martin, X. & Subramanian, A. (2003) “Addressing the Natural Resource Curse: An Illustration from Nigeria”, Retrieved from http://www.econ.upf.edu/docs/papers/downloads/685.pdf Salehi-Isfahani, D. (2005) “Microeconomics of growth in MENA: the role of households”, Contributions to Economic Analysis, Vol. 278. doi: 10.1016/S0573-8555(06)78006-3 The Economist. (2011) “The Arab spring death toll. The price of protest so far”, Retrieved from http://www.economist.com/blogs/dailychart/2011/07/arab-spring-death-toll The World Bank. (2012). Data. Retrieved from http://data.worldbank.org World Bank. (2012) “Middle East and North Africa Region” Retrieved from http:// Development Economics siteresources.worldbank.org/INTPROSPECTS/Resources/334934-1322593305595/8287139-1326374900917/GEP12a_MNA_Regional_Annex.pdf Yanikkaya, H. (2002) “Trade Openness and Economic Growth: A Cross-Country Empirical Investigation”, Journal of Developmental Economics, 72(1), 57-89. ACKNOWLEDGEMENT This research was supported by the Rae and Lillian Steel 2012 Summer Stipend, Harley Langdale Jr. College of Business, Valdosta State University. BIOGRAPHY Felina Duncan is a senior honor student majoring international business and economics, and minoring Spanish at Valdosta State University. She can be contacted at Harley Langdale Jr. College of Business, Department of Marketing and Economics, 1500 N. Patterson Street, Valdosta, GA 31698, Email: [email protected]. Dr. Zulal S. Denaux, corresponding Author, is a Professor of Economics at Valdosta State University. Her research appears in journals such as Applied Economics, Economics Bulletin, Journal of International Finance and Economics, and Atlantic Economic Journal. She can be contacted at Harley Langdale Jr. College of Business, Department of Marketing and Economics, 1500 N. Patterson Street, Valdosta, GA 31698, Email: [email protected].
GLOBAL JOURNAL OF BUSINESS RESEARCH ♦ VOLUME 7 ♦ NUMBER 5 ♦ 2013
35
GLOBAL STOCK PRICE LINKAGES AROUND THE US FINANCIAL CRISIS: EVIDENCE FROM INDONESIA
Aldrin Herwany, Universitas Padjadjaran, Indonesia Erie Febrian, Universitas Padjadjaran, Indonesia
ABSTRACT
Monetary authorities in Indonesia, as well as some academicians believe the absence of a long run relation between the Indonesian stock market and developed markets prevents this emerging market from being deeply affected by the US downturn. Nevertheless, this hypothesis may not apply to the domestic financial industry as these firms are involved in cross-country financial investments. This study examines the global linkage of Indonesian Financial Sector stock prices during the US downturn using co-integration tests and vector autoregression. This study examines linkages between the Indonesian Financial Industry with the same industry in the US, UK and four developed Asian markets, i.e., Tokyo, Hong Kong, Singapore, and Kuala Lumpur stock exchanges. We also conduct tests using pre-US-crisis data to show the linkage change magnitude. We find that financial sector stock prices in the Indonesian market are cointegrated with the six observed markets before and during the crisis. Nevertheless, Indonesian financial stock prices are relatively invulnerable to pressures coming from other observed markets Thus, fund managers can gain diversification benefit from a portfolio containing financial industry stocks of these markets either in the long or short run. JEL: G01, G11, G15 KEYWORDS: Financial Sector, Financial Crisis, Market Co-integration INTRODUCTION
round the US financial crisis, global financial markets experienced tight liquidity, and international USD-based capital returned to the US, strengthening the USD against all world currencies. The reversing capital triggered a sharp decline in many stock markets, especially
emerging markets like the Indonesia Stock Exchange (ISX). In October 2008, ISX index fell to 1,111.39 and suffered a significant market capitalization decrease by IDR 453 trillion. To avoid further contagious impact on domestic banking and financial industries, monetary authorities in Indonesia enacted some policies. For the banking industry, authorities raised the deposit insurance ceiling from IDR 100 million to IDR 2,000 million. The authorities also issued policies to govern the stock market, including a short-selling transaction ban, trading suspension, and lower-limit auto-rejection. The banking industry policy has been effective in maintaining public trust and preventing bank runs. However, that was not the case in the stock market. The ISX index declined by 31.4% month-to-month in October 2008. The daily transaction value dropped by 35%-50% during October 2008. The US crisis also put significant pressure on Indonesian bonds. Despite showing conducive fundamentals like a low expected inflation rate and well controlled fiscal circumstances, SUN (Indonesian Government Bond) lost its financial attractiveness in all tenures. According to the monthly Bank Indonesia report, asymmetric buy-sell pressure on the bond made price in some series not well formed. The average SUN yield in all tenures was 17.14% (end of period), which was higher by 432 bps than that of previous month (September 2008). Thus, the high-low yield spread increase in 2008 was 12.23%. In the second quarter of 2009, the ISX seemed to slightly recover. The Indonesian central bank reported that foreign investors recorded net buying of USD 501.63 million. About 37% of foreign cash inflow
A
A. Herway & E. Febrian | GJBR ♦ Vol. 7 ♦ No. 5 ♦ 2013
36
(USD 3.18 billion) was invested in a stock portfolio. Meanwhile, yield spread between Indonesian government bonds and that of the US Treasury was the highest in Asia, which made the bond relatively attractive in the market. Foreign cash inflow allocated with the bond was USD 748.33 million. These facts show the early recovery demonstrates the absence of a long run relation between the Indonesian stock market and developed markets. However, it is expected that such a relationship may be different in the financial sector. Financial investments are borderless transactions. Investors, portfolio managers, and policy makers expect to deal with cross-country financial investments, which lead to highly cointegrated financial markets worldwide. This paper identifies the linkage between the Indonesian Financial Industry with the same industry in US, UK markets and four developed Asian markets, i.e. Tokyo, Hongkong, Singapore, and Kuala Lumpur stock exchanges. The analysis uses time series data. Also, the study investigates the linkage among the observed markets.The rest of the paper is organized as follows. The next section provides a brief discussion of the relevant literature on cointegration studies and on linkage of markets. Section 3 provides a description of the data used and methodology adopted in this study. Section 4 discusses the results, while Section 5 concludes the paper and provides suggestions for future study. LITERATURE REVIEW Academicians, practitioners and decision makers seek a model that can prove linkages across financial markets, especially between developing and developed markets. The model provides them better perspectives on market movements. In doing so it allows them to appropriately manage their assets and the respective derivatives, as well as to diversify the associated portfolio risks. Cointegration analysis is the most popular method used by academicians and stock market researchers in developing such a linkage model. Cointegration analysis was introduced by Granger (1981), Engle & Granger (1987), and Granger & Hallman (1991). The analysis shows regular stochastic tendencies in financial time series data and is useful for long-run investment analysis. The analysis considers the integrated I(1) − I(0) type of cointegration in which linear permutations of two or more I(1) variables are I(0) (Christensen & Nielsen, 2003). In the bivariate case, if yt and xt are I(1) and hence nonstationary (unit root) processes, but there exists a process et which is I (0) and a fixed β such that : yt = β’xt + et, then xt and yt are defined as cointegrated. Thus, the nonstationary series shift together in the sense that a linear permutation of them is stationary and therefore a regular stochastic trend is shared.
Granger & Hallman (1991) prove that investment decisions merely-based on short-term asset returns are inadequate, as the long-term relationship of asset prices is not considered. They also show that hedging strategies, developed based on correlation, require frequent rebalancing of portfolios, whereas those developed strictly based on cointegration do not require rebalancing. Lucas (1997) and Alexander (1999), using applications of cointegration analysis to portfolio asset allocation and trading strategies, show that Index tracking and portfolio optimization based on cointegration rather than correlation alone may result in higher asset returns. Meanwhile, Duan and Pliska (1998), by developing a theory of option valuation with cointegrated asset prices, reveal that cointegration methods can have a considerable impact on spread option price volatilities. Cointegration approach complements correlation analysis, as correlation analysis is appropriate for short-term investment decisions, while cointegration based strategies are necessary for long-term investment. In the context of crisis, In et al (2002), using Vector Autoregression (VAR) Models, find that markets become more closely linked during financial crisis. Observing various economic indicators before and during the crisis, they prove that all observed markets, except for the Malaysian market, experience significant impact. They also reveal that investor decisions are influenced by geographical distance, which may limit diversification options. In et al (2001) finds more specific results, in which news in one country stimulates reaction in other country. Using data from the 1997-1998 crisis and a volatility model,

GLOBAL JOURNAL OF BUSINESS RESEARCH ♦ VOLUME 7 ♦ NUMBER 5 ♦ 2013
37
they demonstrate that local news in one country may be responded to by investors or decision makers in the adjacent markets only in days. Their study reveals that two-way volatility transmission occurs in the relationship between markets of Korea-Hongkong, Korea-Thailand and Hongkong-Thailand. Conducting similar study in Latin America, Dianmantis (2009), however, showed that despite the existence of cointegration, there are only limited long-run advantages from cross-country portfolio diversification as stock prices adjust very slowly to the common trends. This suggestion partly corrects the recommendation from a study in Latin America done by Christofi and Pericli (1999). Christofi and Pericli (1999) suggest the potential of portfolio diversification using regional market stocks.Masih and Masih (1999) investigate contagion effects of a crisis by comparing data of OECD and emerging markets. They find significant cointegration between markets in the OECD region and emerging markets, both in the short and long run. In their study, markets in the US and UK are the leading factors to the relationship significance, which stimulates contagion effects among the observed markets. DATA AND METHODOLOGY OF THE STUDY This study employs data from the financial sector of several world stock markets, i.e. in the US, UK, Japan, Hongkong, Singapore, and Malaysia, in addition to data from ISX. The financial sector data includes stock price data of listed banks, insurance companies, multifinance companies, mutual fund, and other financial institutions. The data includes daily stock prices from 2 January 2007 to 30 December 2010. The data has been adjusted for stock split, mergers & acquisition and other financial information. The observation is conducted in two periods of observation, i.e., pre crisis period (2 January 2007 - 14 September 2008) and crisis period (15 September 2008 - 30 December 2010). The period cut off is decided based on study done by Tsai and Chan (2010). The number of total stocks from the seven markets in the observed periods is initially 3,290. Stock markets of Hongkong, Japan, Indonesia, Malaysia, Singapore, UK and US contribute 325, 335, 95, 127, 96, 982 and 1330 stocks, respectively. Due to missing data, the number of stocks is then reduced to 2,524 or 76.72% of the previous sample. This study examines the long-term equilibrium relationship as well as the short-term dynamics between ISX and the six stock markets using the Johansen and Juselius (1990) model. If the indices share a common stochastic trend, then they are considered cointegrated (Christensen & Nielsen, 2003). The presence of cointegration relation forms the basis of the Vector Error Correction (VEC) specification. Below is vector auto-regressive (VAR) model of order p:
∑= − +=p
i ttt AXX1 1 εµ (1)
where, Xt is a column vector of variables, here, the log price indices, µ, is a vector of constants, and εt is a vector of innovations, random errors usually assumed to be contemporaneously correlated but not autocorrelated, and p is the number of lags of variables in the system. If the variables in the vector X, are integrated of order, say one, 1(1), and are also cointegrated, that cointegration restriction has to be included in the VAR identified by equation (1). The Granger Representation Theorem (Engle and Granger, 1987) states that variables, individually determined by permanent shocks, are cointegrated, if and only if there is a vector error correction representation of the time series data. With this restriction imposed, a VAR model is referred to as VEC. Variables in the model enter the equation in their first derivatives, and the error correction terms are added to the model. The VEC representation of equation (2), following Johansen and Juselius (JJ) is:
∑= −− +′+Γ∆+=∆p
i tttt XXX1 11 εβαµ (2)

A. Herway & E. Febrian | GJBR ♦ Vol. 7 ♦ No. 5 ♦ 2013
38
where, Γ are (m x m) coefficient matrices (i = 1,2, ...., k), α, β are (m x r) matrices, so that 0 < r < m, r is the number of linear combinations of the elements in Xt that are affected only by transitory shocks. Matrix β is the cointegrating matrix of r cointegrating vectors, β1 β2,...., βi. The β vectors represent estimates of the long-run cointegrating relationship between the variables in the system. The error correction terms, B' Xt-1, are the mean reverting weighted sums of cointegrating vectors. The matrix a is the matrix of error correction coefficients that measure the speed at which the variables adjust to their equilibrium values. It is obvious that the model in equation 3 is the standard VAR in the first differencing of Xt, augmented by the error correction terms, a B' Xt. The JJ method provides maximum likelihood estimates of a and B'. EMPIRICAL RESULTS AND FINDINGS
As indicated in Table 1, in the long period (Full Period) observation, stock prices in Hongkong, Indonesia, Malaysia and Singapore result in positive returns. Financial stocks in Indonesia provide the highest average rate of return, i.e., 0.00066, while those in Japan record the lowest average rate of return at - 0.0006. The highest standard deviation is also recorded by Indonesian financial stocks, i.e., 0.038, while the lowest is formed by stocks in the UK market. This Table shows that stock price data of all observed financial markets is normally distributed, since the Jarque Bera test results indicate the probability of each market data is lower than the significance level of 5%. Table 1: Returns in Natural Logs (Full Period)
HK INA JP MY SG UK US Mean 0.0001 0.0007 -0.0006 0.0005 0.0001 -0.0001 -0.0001 Median 0.0011 0.0000 0.000 0.0009 0.0006 0.0006 0.000 Maximum 0.0701 0.2877 0.0841 0.0492 0.0677 0.0513 0.1417 Minimum -0.0981 -0.1719 -0.125 -0.098 -0.111 -0.058 -0.123 Std. Dev. 0.0174 0.0384 0.0184 0.010351 0.0145 0.0097 0.0186 Skewness -0.4603 0.797 -0.525 -16.251 -0.428 -0.561 0.684 Kurtosis 6.595 8.127 8.753 18.582 8.898 8.066 15.5
Jarque-Bera 566.9*** 1186.7*** 1407.9*** 10429*** 1462*** 1108.1*** 6509.1*** Probability 0.000 0.001 0.002 0.003 0.004 0.005 0.006
Sum 0.0687 0.6485 -0.617 0.456374 0.115054 -0.081 -0.064 Sum Sq. Dev. 0.2981 1.457 0.333 0.1057 0.2087 0.0925 0.3409 Observations 988 988 988 988 988 988 988
This table shows return of financial stocks in the observed markets using stock-price data from 2 January 2007 to 30 December 2010 (Full Period). All prices are in natural log at the first differencing. ***, **, and * indicate significance at the 1, 5, and 10 percent levels respectively.
Table 2 shows that none of the observed financial stock price data was normally distributed, since the Jarque Bera test results indicate that the respective probability is higher than the significance level of 5%. Table 2 also shows that mean returns in all markets were negative; indicating that weakening performance of financial sector stocks had started since 2007. Financial stocks in the US show the highest mean return, i.e., -0.0001, while those in Indonesia show the lowest, i.e., -0.0017. Table 3 shows the highest correlation coefficient was 0.27, i.e., between Hongkong and Singapore, implying that diversification involving both markets before the crisis would provide little benefit. The correlation coefficient of Hongkong-US is the lowest at -0.00165, reflecting potential diversification involving the two markets. Table 4 shows that during-crisis data (from 16 September 2008 to 30 December 2010) consists of total 570 observations. Results of the Jarque Bera test on each market show that none of the market data is normally distributed. In this observation period, financial sector stocks in Indonesian markets record the highest standard deviation, i.e., 0.038, implying that fluctuation rates of stock prices in the financial sector during the crisis is the highest among the observed markets. The Malaysian financial sector market data shows the least risky stocks during the crisis, indicated by the lowest standard deviation, 0.008.

GLOBAL JOURNAL OF BUSINESS RESEARCH ♦ VOLUME 7 ♦ NUMBER 5 ♦ 2013
39
Table 2: Descriptive Statistic of Return (Pre-Crisis)
HK INA JP MY SG UK US Mean -0.0002 -0.0017 -0.0014 -0.0001 -0.0006 -0.0008 -0.0001 Median 0.0014 0.000 -0.0007 0.0001 0 -0.0006 -0.0003 Maximum 0.0696 0.2877 0.0611 0.0487 0.055 0.027 0.0397 Minimum -0.0981 -0.1484 -0.067 -0.0699 -0.0538 -0.0335 -0.0422 Std. Dev. 0.0178 0.0391 0.018 0.0129 0.0138 0.0082 0.0105 Skewness -0.4456 1.378 -0.1495 -0.9046 -0.211 -0.073 0.1754 Kurtosis 5.857 12.06 4.061 8.785 4.387 3.92 4.597 Jarque-Bera 155.6*** 1557.2*** 21.12*** 638.3*** 36.52*** 15.13*** 46.43*** Probability 0.00 0.00 0.00 0.00 0.00 0.0005 0.00
Sum -0.0817 -0.7097 -0.5968 -0.0491 -0.2662 -0.3137 -0.0441 Sum Sq. Dev. 0.1324 0.6374 0.1351 0.0696 0.0789 0.0279 0.0454 Observations 417 417 417 417 417 417 417
This table shows return of financial stocks in the observed markets using stock-price data from 2 January 2007 to 14 September 2008 (Pre Crisis Period). All prices are in natural log at the first differencing. ***, **, and * indicate significance at the 1, 5, and 10 percent levels respectively. Table 3: Correlation Matrix of Log Return (Pre-Crisis)
HK INA JP MY SG UK US HK 1.00 0.1145 0.1593 0.0542 0.2731 0.0713 -0.0017 INA 0.1145 1.00 0.0664 -0.069 -0.013 -0.0665 -0.0309 JP 0.1593 0.0664 1.00 0.1194 -0.011 -0.094 0.0029
MY 0.0542 -0.0691 0.1194 1.00 0.2432 0.0608 0.0093 SG 0.2731 -0.013 -0.011 0.2432 1.00 0.175 0.215 UK 0.0713 -0.0665 -0.094 0.0608 0.175 1.00 0.0779 US -0.0017 -0.031 0.0029 0.0093 0.215 0.0779 1.00
This table presents correlation coefficients between markets based on stock-price data from 2 January 2007 to 14 September 2008 (Pre Crisis Period). All prices are in natural log at the first differencing. Table 4: Descriptive Statistic of Log Return (During Crisis)
HK INA JP MY SG UK US
Mean 0.0003 0.0024 0.000 0.0009 0.0006 0.0005 0.000 Median 0.0009 0.000 0.0004 0.0012 0.0007 0.001 -0.0005 Maximum 0.0701 0.1417 0.0841 0.0492 0.0677 0.0513 0.1417 Minimum -0.0977 -0.1719 -0.1247 -0.0979 -0.1109 -0.0582 -0.1229 Std. Dev. 0.0171 0.0379 0.0187 0.0079 0.015 0.0105 0.0228 Skewness -0.467 0.3441 -0.7786 -314.6 -0.5762 -0.752 0.6293 Kurtosis 7.205 5.0891 11.82 48.196 11.29 8.898 11.753 Jarque-Bera 440.7 114.9 1905.7 49453.4 1665.4 879.8 1857.3 Probability 0.000 0.000 0.000 0.000 0.000 0.000 0.000 Sum 0.1448 1.34 -0.0246 0.5189 0.3503 0.2644 -0.0233 Sum Sq. Dev. 0.1657 0.8157 0.1978 0.0357 0.1285 0.0632 0.2954 Observations 570 570 570 570 570 570 570
This table shows return of financial stocks in the observed markets based on stock-price data from 15 September 2008 to 30 December 2010 (During-Crisis Period). All prices are in natural log at the first differencing. Table 4 also shows that financial sector returns during the crisis vary across the observed markets. Financial sector markets of Hongkong, Indonesia, Malaysia, Singapore and UK showed positive returns, while those of Japan and US recorded negative returns. The highest mean return is recorded by financial sector stocks in the Indonesian market, i.e., 0.0023, while the lowest is recorded by financial sector stocks in Japan. Table 5 shows that the highest correlation coefficient was 0.3, between Malaysia and UK, implying that diversification involving both markets during the crisis provides a non-significant benefit. The correlation coefficient between Indonesia-US is the lowest, at 0.007, indicating that diversification using financial sector stocks in the two markets may provide effective result.

A. Herway & E. Febrian | GJBR ♦ Vol. 7 ♦ No. 5 ♦ 2013
40
Table 5: Correlation Matrix of Log Return (During-Crisis)
HK INA JP MY SG UK US HK 1.00 -0.0177 0.0685 0.1649 0.1167 0.2192 0.0695 INA -0.0177 1.00 -0.0452 0.0796 0.0476 -0.0428 0.007 JP 0.0685 -0.0452 1.00 0.2127 0.093 0.2228 0.136
MY 0.1649 0.0796 0.2127 1.00 0.1827 0.3067 0.1424 SG 0.1167 0.0476 0.093 0.1827 1.00 0.2456 0.171 UK 0.2192 -0.0428 0.2228 0.3067 0.2456 1.00 0.1371 US 0.0695 0.007 0.136 0.1424 0.171 0.1371 1.00
This table presents correlation coefficients between markets based on stock-price data from 15 September 2008 to 30 December 2010 (During-Crisis Period). All prices are in natural log at the first differencing. The initial phase in the estimation process is to decide the order of integration of the individual market prices in natural log levels. The log of prices in each market, denoted as HK, INA, JP, MY, SG, UK and US, are then tested for unit roots using the augmented Dickey-Fuller (ADF) (1979) test. The result is indicated by Schwarz Bayesian Information Criterion (SBIC). The p-values used for the tests are the MacKinnon (1996) one-sided p-values. The test results in Table 6 indicate that the null hypothesis that price in log levels contains a unit root, can not be rejected for each of the seven price series. Then, unit root tests are performed on each price series in first log differencing. The null hypothesis of a unit root can be rejected for each of the time series. No further tests are performed, since each of the series is found to be stationary in the first log differencing. The finding that each price series is non-stationary implies that each of the observed markets is weakly efficient. After completing the ADF Unit Root Test, we conduct cointegration estimation with the following equation:
tttt LUSlUKlSGlMYIlJPlINAlHK εααα +++++++= 210 (3) All the observed financial sectors were found to be cointegrated in the three different observation periods, at the significance level of 5%. This indicates that an investor might not form an efficient portfolio if he/she included the observed financial sector stocks in his/her portfolio, as the intended diversification may not be achieved. The JJ estimation procedure that uses the maximum likelihood method was then employed. The cointegration tests assumed there was no deterministic trends in the series and used lag intervals 1 to 1 as suggested by the SBIC for appropriate lag lengths. However, it would not have made any difference if we had chosen the AIC (Akaike Information Criterion) because both the AIC and SBIC suggested the same lag length as well as the assumptions for the test. The assumptions of the test were that the price series in log levels had no deterministic trends and the cointegrating equation had an intercept, but no intercept in the VAR. The trace test, which tests the null hypothesis of r cointegrating relations against k cointegrating relations, where k is the number of endogenous variables, for r = 0,1, ……k. If there are k cointegrating relations, it implies that there is no cointegration between each pair of the seven series. The maximum eigenvalue test, which examines the null hypothesis of r cointegrating relations against the alternative of r + 1 cointegrating relations, results in one cointegrating equation at the 5% percent level of significance. The critical values used from Osterwald-lenum (1992) are slightly different from those reported in JJ (1990). We tested for market indices cointegration between the pairs, and found that all the pairs were cointegrated. The test results are not presented, as our focus was the relationship among the seven financial sector markets. The finding that the market indices were cointegrated meant that there was one linear combination of the seven price series that forced these markets to have a long-term equilibrium relationship even though the markets might wander away from each other in the short-run. It also implies that returns on the markets were correlated in the long-term. The message for long-term international investors is that it would not matter, in terms of portfolio returns, whether investors in the observed markets held a fully diversified portfolio of stocks contained in all of the seven financial sector markets or held portfolios consisting of all stocks of only one financial sector market.

GLOBAL JOURNAL OF BUSINESS RESEARCH ♦ VOLUME 7 ♦ NUMBER 5 ♦ 2013
41
Table 6: Results of Augmented Dickey Fuller (ADF) Unit Root Test
Daily Closing Price Indices
Period Lag Test Statistic SIC Values
HK
Pre-Crisis
1
-19.331
-5.189
INA Pre-Crisis 1 -18.184 -3.627 JP Pre-Crisis 1 -17.935 -5.186
MY Pre-Crisis 1 -16.392 -5.878 SG Pre-Crisis 1 -17.797 -5.724 UK Pre-Crisis 1 -21.284 -6.745 US Pre-Crisis 1 -18.572 -6.265
HK
During Crisis
1
-22.365
-5.319
INA During Crisis 1 -23.046 -3.678 JP During Crisis 1 -9.355 -5.151
MY During Crisis 1 -9.153 -6.874 SG During Crisis 1 -12.604 -5.596 UK During Crisis 1 -21.312 -6.268 US During Crisis 1 -24.782 -4.705
This table displays the results of Augmented Dickey Fuller (ADF) Unit Root Test of Financial Sector Stock Price in the seven markets, both before and during the crisis. The final phase was the estimation of the three-variable VEC model. In terms of this study analysis, the estimated vector error-correction model of price indices has the following form:
ttiiiititit ZlUSlUKlSGlMYlJPlINAlKHK ελββββββα ++∆+∆+∆+∆+∆+∆+=∆ −∑∑∑∑∑∑ 116543210 (4) where l∆ are the first log differencing of the seven markets lagged p periods, 1−tZ are the equilibrium errors or the residuals of the cointegrating equations, lagged one period, and iλ are the coefficients of the error-correction term. The lag lengths for the series in the system were determined according to the SIC. The suggested lag lengths were one to one. No restrictions are imposed in identifying the cointegrating vectors. The coefficients of the error correction terms were denoted by λ . The results can be seen in Table 7, 8, and 9. On the bottom of the tables, the log likelihood values, the AIC and SBIC are reported. Three types of inference, concerning the dynamics of the seven markets, can be drawn from the reported results of the VEC model in Table 7, 8, and 9. The first concerns whether the left hand side variable in each equation in the system is endogenous or weakly exogenous. The second type of inference is about the speed, degree, and direction of adjustment of the variables in the system to restore equilibrium following a shock to the system. The third type of inference is associated with the direction of short-run causal linkages between the markets. Table 7 (pre-crisis period) shows that all error correction term coefficients are significant at 1% level, meaning that financial sector in all of the observed markets experienced strong shock. The strongest pressure came from Singapore market, indicated by its error correction term coefficient of -0.106 and R square of 23.83% (significant at significance level of 1%). The weakest pressure came from the Indonesian market with error correction term coefficient of -0.04 and R-square of 4%. Overall, financial sectors in all observed markets were shock triggers, not shock receivers. When Hongkong was set as the basis, financial stock prices in Malaysia and Singapore markets received short-term pressure, indicated by their coefficients of 0.156 and 0.178 (significant at significance level of 5%), respectively. Overall, more markets received pressure when Malaysia, Singapore and UK markets were set as the basis, as indicated by more significant coefficients in the respective columns on Table 7. On the other hand, if Indonesian market was set as the basis, none of

A. Herway & E. Febrian | GJBR ♦ Vol. 7 ♦ No. 5 ♦ 2013
42
other observed markets received pressure. In Table 8 (During Crisis period) it can be seen that more markets received pressure during the crisis, as indicated by more significant coefficients. Table 7: Estimated Vector Error Correction Model Results (Pre-Crisis)
Variables ∆lHK ∆lINA ∆lJP ∆lMY ∆lSG ∆lUK ∆lUS
ECM (λ)
-0.0867*** -0.0400*** -0.0637*** -0.0662*** -0.1060*** -0.0605*** 0.0806*** ∆lHK (-1) 0.0259 -0.1003 0.1304** 0.0495 0.0022 0.0140 0.0499* ∆lINA (-1) 0.0237 0.1202** 0.0046 0.0193 0.0103 -0.0159 0.0090 ∆lJP (-1) 0.0256 0.1264 0.1580*** 0.0928 0.0584* 0.0173 0.0666** ∆lMY (-1) 0.1556** -0.1009 0.0588 0.2367*** 0.3553*** 0.0840*** 0.0503 ∆lSG (-1) 0.1784** -0.1613 -0.0613 -0.1154** 0.0407 0.1313*** -0.0502 ∆lUK (-1) 0.0190 0.0637 0.0243 0.1375* 0.1754** -0.0903* 0.0874 ∆lUS (-1) 0.0504 -0.0317 -0.0526 0.1066* 0.2744*** -0.0601* 0.1361*** R-Squared 0.0899 0.0413 0.0533 0.1372 0.2383 0.1689 0.1110 F-Statictic 5.0274*** 2.1917** 2.8630*** 8.0904*** 15.915*** 10.3396*** 6.351***
Log likelihood : 43.840,78
SIC : -42,37702
This table shows estimated VEC results beased on stock-price data from 2 January 2007 to 14 September 2008 (Pre Crisis Period). ***, **, and * indicate significance at the 1, 5, and 10 percent levels respectively. When Hongkong was set as the basis, Indonesian, Japan, Malaysia, and Singapore markets received pressure. Singapore market seemed to be the most important shock trigger during the crisis, with R-Square of 28.6, as all markets, except for Indonesian and Malaysian markets, receive pressure if Singapore is set as the basis. It is worth noting that during the crisis, UK market does not provide shock to any other observed markets. From Table 8 we can infer that financial sector stock prices in the Indonesian market caused changes to those in Hongkong during the crisis (significant at significance level of 1%). Financial sector stock prices in Japan, Malaysia, Singapore and UK had a two-way causality relationship with those in Hongkong. Table 8: VEC Estimated Results (During Crisis)
Variables ∆lHK ∆lINA ∆lJP ∆lMY ∆lSG ∆lUK ∆lUS ECM -0.0493*** -0.0479*** -0.0795*** -0.04*** -0.0947*** -0.024 -0.0598*** ∆lHK (-1) 0.0816* -0.0355 0.1021** 0.0884*** 0.1374*** 0.142 0.0854 ∆lINA(-1) 0.0391** 0.0667 -0.0144 0.0115 0.0162 -0.0099 -0.0336 ∆lJP (-1) 0.066* 0.1898** 0.0194 0.0448** 0.1768*** 0.0216 0.1101** ∆lMY (-1) 0.1722* 0.2925 0.2223** 0.0972** 0.0528 0.15** 0.0634 ∆lSG (-1) 0.0918* 0.0666 0.1378*** 0.0361 0.0746** -0.0316 -0.088 ∆lUK (-1) 0.0785 0.0588 0.386*** 0.0464 0.119** 0.0393 0.4356*** ∆lUS (-1) -0.0283 -0.0491 0.0287 -0.0016 0.0546** 0.0192 -0.0474 R-Squared 0.0543 0.0326 0.1583 0.1222 0.286 0.0916 0.0988 F-Statictic 4.0195*** 2.3561** 14.358*** 9.747*** 28.0452*** 7.0606*** 7.6781***
Log likelihood : 43.840,78
SIC : -42,37702 This table shows estimated VEC results beased on stock-price data from 15 September 2008 to 30 December 2010 (During-Crisis Period). ***, **, and * indicate significance at the 1, 5, and 10 percent levels respectively. Table 9 displays the results of VEC Granger Causality test using Chi-Square with significance level of 10%, 5%, and 1%. The most right column indicates the causality between the observed markets. The results are reported for the time periods before the crises and during the crisis. CONCLUSION This study was aimed at investigating the existence of the global linkage of Indonesian Financial Sector stock prices as well as linkage among prominent markets during the US crisis. The study also employed pre-US-crisis data to show degree of the linkage change. The observed markets included US, UK, Japan, Hongkong, Singapore, and Malaysia markets, in addition to Indonesian market. The data was financial
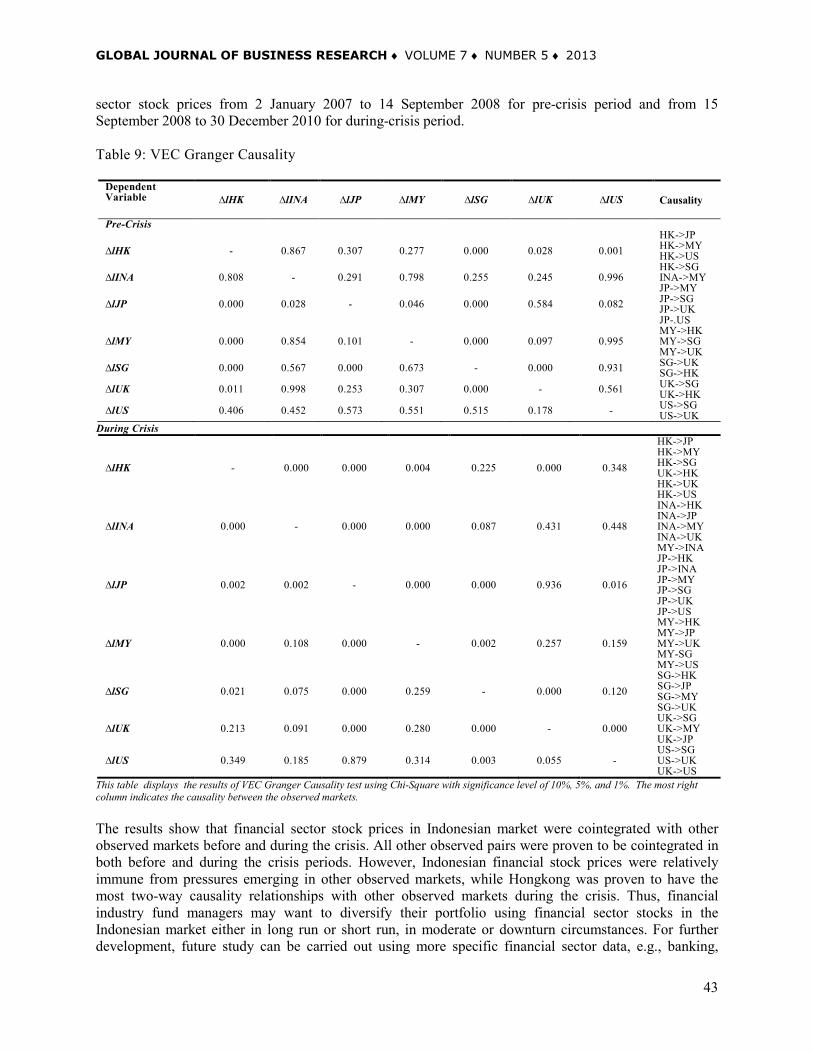
GLOBAL JOURNAL OF BUSINESS RESEARCH ♦ VOLUME 7 ♦ NUMBER 5 ♦ 2013
43
sector stock prices from 2 January 2007 to 14 September 2008 for pre-crisis period and from 15 September 2008 to 30 December 2010 for during-crisis period. Table 9: VEC Granger Causality
Dependent Variable ∆lHK ∆lINA ∆lJP ∆lMY ∆lSG ∆lUK ∆lUS Causality
Pre-Crisis
∆lHK - 0.867 0.307 0.277 0.000 0.028 0.001 HK->JP HK->MY HK->US HK->SG
∆lINA 0.808 - 0.291 0.798 0.255 0.245 0.996 INA->MY
∆lJP 0.000 0.028 - 0.046 0.000 0.584 0.082 JP->MY JP->SG JP->UK JP-.US
∆lMY 0.000 0.854 0.101 - 0.000 0.097 0.995 MY->HK MY->SG MY->UK
∆lSG 0.000 0.567 0.000 0.673 - 0.000 0.931 SG->UK SG->HK
∆lUK 0.011 0.998 0.253 0.307 0.000 - 0.561 UK->SG UK->HK
∆lUS 0.406 0.452 0.573 0.551 0.515 0.178 - US->SG US->UK
During Crisis
∆lHK - 0.000 0.000 0.004 0.225 0.000 0.348
HK->JP HK->MY HK->SG UK->HK HK->UK HK->US
∆lINA 0.000 - 0.000 0.000 0.087 0.431 0.448
INA->HK INA->JP INA->MY INA->UK MY->INA
∆lJP 0.002 0.002 - 0.000 0.000 0.936 0.016
JP->HK JP->INA JP->MY JP->SG JP->UK JP->US
∆lMY 0.000 0.108 0.000 - 0.002 0.257 0.159
MY->HK MY->JP MY->UK MY-SG MY->US
∆lSG 0.021 0.075 0.000 0.259 - 0.000 0.120 SG->HK SG->JP SG->MY SG->UK
∆lUK 0.213 0.091 0.000 0.280 0.000 - 0.000 UK->SG UK->MY UK->JP
∆lUS 0.349 0.185 0.879 0.314 0.003 0.055 - US->SG US->UK UK->US
This table displays the results of VEC Granger Causality test using Chi-Square with significance level of 10%, 5%, and 1%. The most right column indicates the causality between the observed markets. The results show that financial sector stock prices in Indonesian market were cointegrated with other observed markets before and during the crisis. All other observed pairs were proven to be cointegrated in both before and during the crisis periods. However, Indonesian financial stock prices were relatively immune from pressures emerging in other observed markets, while Hongkong was proven to have the most two-way causality relationships with other observed markets during the crisis. Thus, financial industry fund managers may want to diversify their portfolio using financial sector stocks in the Indonesian market either in long run or short run, in moderate or downturn circumstances. For further development, future study can be carried out using more specific financial sector data, e.g., banking,

A. Herway & E. Febrian | GJBR ♦ Vol. 7 ♦ No. 5 ♦ 2013
44
insurance, mutual funds, etc, to reveal more particular characters of market linkage. This is necessary since the development of such sub financial sectors varies accross economies. REFERENCES Alexander, C, (1999) “Optimal Hedging using Cointegration,” Philosophical Transactions of the Royal Society A 357, 2039-2058. Christensen, Ben J., Morten Ø. Nielsen (2003) “Asymptotic Normality of Narrow-Band Least Squares in the Stationary Fractional Cointegration Model and Volatility Forecasting," University of Aarhus Christofi, A., and Pericli, A (1999) “Correlation in price changes and volatility of major Latin American stock markets.” Journal of Multinational Financial Management, 9, 79-93. Dickey, D.A. and Fuller, W.A (1979) “Distribution of the Estimators for Autoregressive Time Series with a Unit Root,” Journal of the American Statistical Association, 74, p. 427–431 Duan, J.C., and Pliska, S (1998) “Option Valuation with Cointegrated Prices, “ Working Paper, Department of Finance, Hong Kong University of Science and Technology. Engle, R., and Granger, C. J. W (1987) “Cointegration and Error-Correction: Representation, Esti-mation, and Testing,” Econometrica, (March), pp. 251-276. Granger, C. W. J (1981) “Some properties of time series data and their use in econometric model specification,” Journal of Econometrics 16, 121—130. Granger, C. W. J. & Hallman, J. J (1991) “Long Memory Series with Attractors,” Oxford Bulletin of Economics and Statistics, 53, 11-26. In, Francis. Kim, S. and Yoon, J. H.and Viney, C (2001) “Dynamic interdependence and volatility transmission of Asian stock markets Evidence from the Asian crisis.” International Review of Financial Analysis, 10, 87-96 In, Francis. Kim, S. and Yoon, J. H (2002) “International stock market linkages: Evidence from the Asian financial crisis,” Journal of Emerging Market Finance, 1, 1 Johansen, S. & Juselius, K (1990) “Maximum Likelihood Estimation and Inference on Cointegration with Application to the Demand for Money,” Oxford Bulletin of Economics Liu, X, Burridge, P. and Sinclair, P (2002) “Relationship between economic growth, foreign direct investment and trade: evidence from China,” Applied Economics, 34, 1433-1440 Liu, X. and Romilly, P (1997) “An empirical investigation of the causal relationship between openness and economic growth in China,” Applied economics, 29, 1679- 86. Lucas, A (1997) “Strategic and Tactical Asset Allocation and the Effect of Long-run Equilibrium Relations, Research Memorandum,” 1997-42, Vrije Universiteit, Amsterdam. MacKinnon, J (1996) Numerical Distribution Functions for Unit Root and Cointegration Tests, Journal of Applied Econometrics, 11, 601-618. Masih Abul M.M. and Masih Rumi. (1999) “Are Asian stock market fluctuations due mainly to intra-regional contagion effects? Evidence based on Asian emerging stock markets,” Pacific-Basin Finance Journal 7, 251-282 Osterwald-Lenum, M (1992) “A Note with Quantiles of Asymptotic Distribution of the Maximum Likelihood Cointegration Rank Test Statistics,“ Oxford Bulletin of Economics and Statistics, 54, 461-72.
GLOBAL JOURNAL OF BUSINESS RESEARCH ♦ VOLUME 7 ♦ NUMBER 5 ♦ 2013
45
Tsai Feng-Jen and Chang-Chuan Chan (2011) “The Impact of the 2008 Financial Crisis on Psychological Work Stress among Financial Workers and Lawyers,” Int. Arch Occup Environ Health, 84, 445-452 THE AUTHORS Aldrin Herwany is the head deputy, Center for Management and Business Studies at the Faculty of Economics & Business, Universitas Padjadjaran, Bandung, Indonesia. Email: [email protected]; and [email protected]; Office fax# +62 22 4239954. Erie Febrian is an assistant Professor at the Faculty of Economics & Business, Universitas Padjadjaran, Bandung, Indonesia. Email: [email protected]; [email protected]; Office fax # +62 22 2509055.


GLOBAL JOURNAL OF BUSINESS RESEARCH ♦ VOLUME 7 ♦ NUMBER 5 ♦ 2013
47
LEADERSHIP STYLES AND ORGANIZATIONAL EFFECTIVENESS IN SMALL CONSTRUCTION
BUSINESSES IN PUEBLA, MEXICO Rafaela Martínez Méndez, Benemérita Universidad Autónoma de Puebla
José Gerardo Serafín Vera Muñoz, Benemérita Universidad Autónoma de Puebla María Antonieta Monserrat Vera Muñoz, Benemérita Universidad Autónoma de Puebla
ABSTRACT
This paper analyzes types of leadership and their relationship with organizational effectiveness in small construction enterprises of Puebla. An analysis of various literature related to the topic was examined, for a theoretical basis. Next, some aspects were measured through a Likert-scale questionnaire, using a sample of 49 small construction businesses. The goal is to describe how leadership styles, in small construction businesses located in Puebla, are perceived, along with how to determine their relationships with the organizational effectiveness. The following research question arose: What type of leadership dominates the small construction businesses of Puebla? What is the relationship among organizational effectiveness and the types of leadership? The results of the investigation show a positive and significant correlation between effectiveness, and democratic leadership, and Laissez-faire (liberal) leadership. The regression model used explains 69.1% of the variations in effectiveness. In addition, there is no statistical evidence of omitted variables (the constant test = 0. 914). JEL: L26, M5, M12 KEY WORDS: Styles of Leadership, Organizational Effectiveness, Small Businesses INTRODUCTION
he economy is characterized by globalization and rapid technological progress which creates challenges and problems for small businesses. Directors face these challenges and their competitors in order to prevail in the market and grow. In this context the results of strategic choices and
performance are partially predetermined by the characteristics of those involved in their administration. Texts on leadership styles include investigations by Ogbonna and Harris (2000). They examined the relationship among organizational culture, leadership styles and the performance of one thousand of UK’s large and medium-sized enterprises. They found that leadership style is only indirectly linked to performance, but that competitive and innovative values and traits are linked directly, and that, contrary to what was expected, the clan and bureaucratic or hierarchical traits were not directly related to performance. Pedraja, R. and Rodriguez P. (2004) studied a sample of 42 executives belonging to 10 public institutions from the Region of Tarapacá, by observing the relation among the participatory, collaborative and instrumental leadership styles, and effectiveness. The results show that, in public organizations, participative and collaborative leadership styles which positively influence effectiveness. Mendoza and Ortiz (2006), showed the dimensions that make up transformational leadership and how its application impacts both organization culture and organization effectiveness, resulting from the dynamic interactions that occur between the leader and the group within a certain determined context or situation. Valentín y Rivas (2006) identified the management style proposed by Bass best characterizes the Board of Directors of a business school and established the relationship with values such as: extra effort, effectiveness, personnel satisfaction, as well as the satisfaction and influence by the Board of Directors. Three directors, sixteen supervisors and 71 staff were surveyed. The results show that transformational
T
R. Martínez Méndez et al | GJBR ♦ Vol. 7 ♦ No. 5 ♦ 2013
48
direction (stimulating interest among colleagues and followers to see their job with new perspectives) is predominant in business school. Transformational leadership (characterized by having a radically new vision, which is attractive and motivating to people) showed a substantial correlation to the value of extra effort. Rodriguez Ponce (2010) provides an explanatory study which uses a sample of 68 senior managers of small and medium-sized Chilean enterprises. The results show there is a relationship among the leadership styles of the transformational, the transactional and the "laissez faire" (liberal). Leadership style explains the 46.2% of innovation culture and there is a relationship between organizational culture and effectiveness. In this context, this research describes how types of leadership in small construction businesses located in Puebla are perceived as well as their relationship to organizational effectiveness. The research question arises: What type of leadership dominates the small construction businesses in Puebla? What is the relationship between the organizational effectiveness and the types of leadership? The research is divided into three main sections. The first discusses the theoretical aspects of leadership, organizational effectiveness, and small business; the second section discusses the methodology used in the empirical study and the third section presents the results and conclusions as well as the bibliography used. LITERATURE REVIEW Characteristics and Leadership Styles The term leadership has different interpretations and connotations that need to be clarified. Leadership is usually confused with that of manager; however the latter obtains results by managing the activities of others, while a leader creates a vision and inspires its followers to make it happen, beyond their normal capabilities and by promoting their development. Also, in everyday language, we talk about a leading product, of the leading company or leading person referring to the best, or the largest. In an organization a leader is the person who has a group of people under its leadership, and the people on whom he/she exerts their influence are known as subordinates. Thus, directors, executives, administrators, managers and bosses can be leaders; the action carried out to influence on others is what we know as leadership. The leadership concept is widely used in more recent literature on leaders and leadership. Some outstanding authors in the area are: Robbins, (1999); Kast and Rosenzweig (2000); Cásares (2000) and Hughes et al. (1999). The leadership that this study covers is by means of which it influences and inspires others to achieve the desired objectives. In the small construction businesses of Puebla this kind of leadership is presumed to be exerted by the owner, pursuant to his/her position inside the power structure. In its broader meaning, organizational leadership is defined as, according to De la Cerda & Núñez (1998): the process of directing, guiding or influencing the work behavior and the job performance through the exercise of authority. The specific characteristics of leadership are associated with culture, the personality of the leader, the type of work, and the characteristics of the followers, the subordinates-collaborators, technology and many other variables. According to Kotter (1999), leadership is the process of moving a group in a certain direction by, usually non-coercive means. Effective leadership is the one that produces movements aimed at the long term interests of the group. According to Etzioni (1965), leadership is a special form of power that involves skill, based on the personal qualities of a leader, to obtain the voluntary subordination by his/her followers in a wide range of issues. He distinguishes leadership from that of the power concept, in which leadership’s influence resides, i.e., a preference shift, while power only implies that the preferences of subordinates are put aside. Leadership involves what a person does above and beyond the basic

GLOBAL JOURNAL OF BUSINESS RESEARCH ♦ VOLUME 7 ♦ NUMBER 5 ♦ 2013
49
requirements of one’s job. It takes persuasion of individuals, innovation of ideas, and decision-making to make leadership different from merely holding power. Leadership Theories Several authors developed theories on leadership, which can be classified into three main groups. Each has different approaches and features as presented below. The theory of personality traits is the oldest on the study of leadership since its origins date back to the 1920s. Considering that a trait is a quality or distinctive feature of personality, this theory takes this concept and proposes that there are features of personality that distinguish it from others. Therefore it seeks characteristics like personality, social, physical and intellectual which differentiate leaders from non-leading people, such as: ambition, energy, the desire to be a leader, honesty and integrity, self-confidence, intelligence, judgment, common sense, a motivating personality and appropriate knowledge for the position, Krieger (2001). We infer that a leader is something superior, gifted with skills out of the ordinary. But this theory does not take into account the enormous influence of subordinates, and that not all managers have these features. Besides, the different internal and external situations that affect organizations are reflected in difficulties that sometimes are impossible to predict. This theory, when considering aspects linked only with personality, is no longer credible, though it is important to note that even when personal characteristics may not be uniform to be a good leader, these are important and must not be discarded at the time of studying them. Behavioral theories on leadership styles focus on the behavior of managers and analyses what they do and how they behave in the performance of their duties. While the theory of traits tries to explain leadership on the basis of what being a leader is, the behavioral one explains it based on what a leader does. This theory attempts to explain leadership by means of the styles to exert authority without taking into account the characteristics of the personality. It references the following three styles of behavior: a) Authoritarian corresponds to the leader who, instinctively, tends to focus the authority; it imposes its ways towards work, it makes unilateral decisions and limits the participation of collaborators; b) Democratic corresponds to the leader who usually involves subordinates in the decision-making, it delegates authority, encourages participation to decide how to work, and uses feedback as an element of personal growth; c) Liberal (Laissez-faire) corresponds to the leader who, in general, gives collaborators full freedom to make decisions and to perform work in the manner which all members deem more convenient, Krieger (2001). Situational Leadership Theories as introduced by Richard Hall, (1996) are also known as contingency theories. This theory attempts to explain the behavior of leaders more broadly. Contingency theory provides the most effective diagnosis of complex situations and increases the likelihood of appropriate actions to be taken. This approach argues that the most appropriate leadership style depends on an analysis of the nature of the situation that a leader faces, and the identification of the key factors of the situation. This theory assumes the point of view that the series of conditions at the time (the situation) defines by whom and in what manner leadership will be exerted. It also points out that, under a certain situation, an individual will emerge as a leader; in another situation, another person will, depending on the domain of the context that the person who becomes responsible has. Likewise, there is evidence indicating that the specific characteristics that characterize leadership behavior vary according to the situation. For Siliceo et al., (2000) leaders in organizations must comply with the following tasks and basic challenges: 1) create a vision, share it with everyone and follow it. Vision is a long-term image of what can and should be achieved. 2) Define the mission and code of values of the organization; systematically communicate and reinforce it with congruent behavior by all the members of the organization. 3) Identify, enrich and channel the emotional and intellectual capital of the company based on high results of quality and competitiveness. 4) Manage change, all managers must become agents of change. 5) Give high priority to education, training and development of all staff. 6) Create and maintain a process of continuous improvement. 7) Create transparency in objectives, responsibility and functions of the staff.

R. Martínez Méndez et al | GJBR ♦ Vol. 7 ♦ No. 5 ♦ 2013
50
Hambirk and Mason (1984), theory of higher echelons postulates that the strategic choices and the performance of the organization are predetermined by the senior management team, as well as, in a context of limited rationality, the cognitive base and the values of the senior management limit the field of vision, influencing selective perception, interpretation, and as a result, the choice of strategy. They claim that the actions and results of a company are the reflection of the values and characteristics of senior management. Under this premise the Upper Echelons Theory is developed, which proposes that managers make strategic decisions on the basis of their cognition and values. Top management decisions depend on managers’ perceptions of their environment, training, experience and personal values. Organizational Effectiveness
Models of organizational effectiveness are defined in a different way. The resource-system model developed by Seashoe and Yuchtman, quoted by Hall (1996), defines effectiveness of an organization as the ability to exploit the environment when acquiring scarce or valuable resources to support its operation. Whereas the goals model proposed by Etzioni defines effectiveness as the degree to which an organization reaches its goals, pointing out that complexity arises when one understands that most organizations have multiple goals (Hall, 1996). As March and Sutton (1997) note: To explain variation in performance or effectiveness is one of the most prevailing issues in the study of organizational performance. Gibson L. James et al. (1999), points out managers, and those who are interested in knowing if the organizations operate efficiently, can focus only on one or on the three perspectives of efficiency: individual effectiveness, group effectiveness and organizational effectiveness. The author emphasizes the performance of the tasks of specific employees or members of the company. The tasks are part of the jobs or positions in the company. Managers constantly evaluate individual effectiveness through evaluation processes of execution of tasks in order to determine who should receive salary increases, promotions and other types of recognition provided by the company. In general, employees work in groups, so it is necessary to have another perspective of effectiveness: the group effectiveness. Sometimes group effectiveness means just the sum of all efforts by all the members. The Small Business The Small Business Administration (SBA), cited by Guillén and Pomar, (2005) defines small business (SB) as one possessed by the owner in full freedom, autonomously operated and which is not dominant in its type of business. There are many ways to classify organizations to determine their sizes. The most common are based on the number of workers and sales. For the National Institute of Statistics and Geography and Informatics in Mexico (INEGI) the stratification used for companies in other sectors, such as Manufacture, Trade and Services, is based on the number of employed persons. It does not fit into the construction sector, mainly due to the high number of outsourced personnel, the significant variations in that number due to the part-time recruitment, and that it greatly depends on the economic cycles of the country, as well as on the varying stages of the jobs, assuming the following stratification of annual revenues reported by them, so that the ranges (thousands of dollars) are as presented in Table1. A qualitative and simple way of classifying the SB is the Bolton Committee of Great Britain’s in Suárez (2003), which is based on the following criteria: a) In economics terms, it has a relatively small portion of its market; b) in terms of property control, it is headed by their owners in a personalized way, leading to non-formal professionals; c) In terms of its independence, assuming it is not part of a consortium, so that the owners are fully responsible for its development.
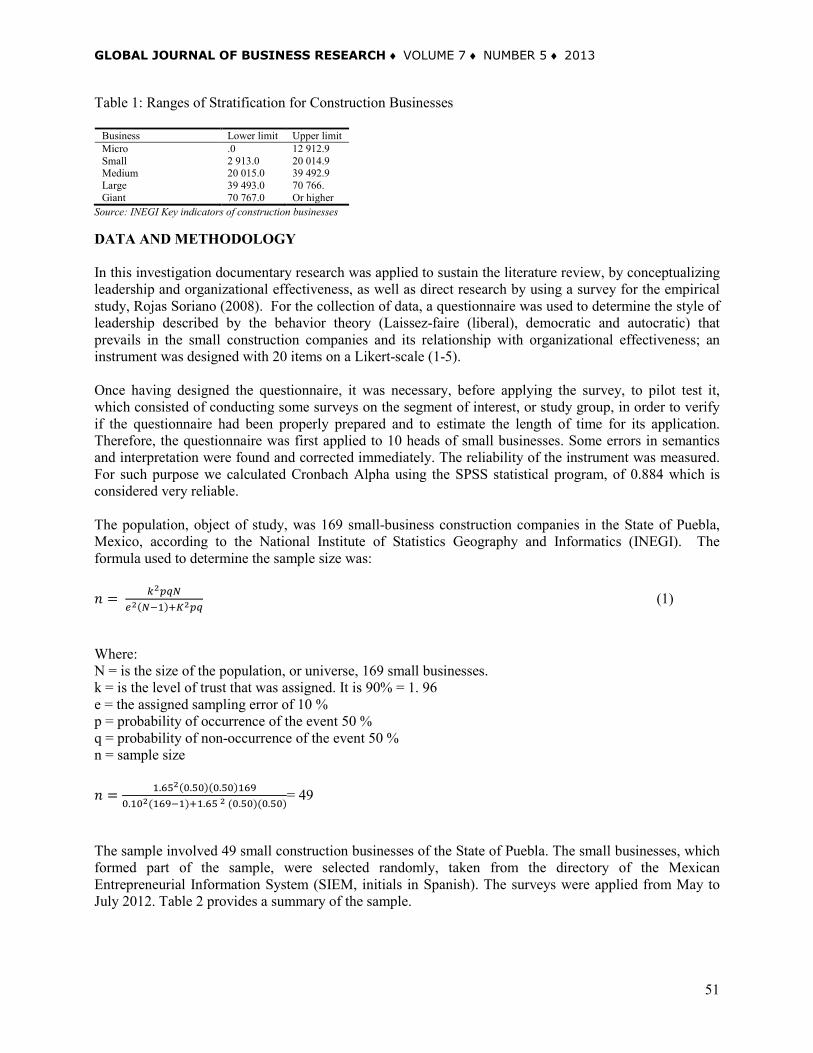
GLOBAL JOURNAL OF BUSINESS RESEARCH ♦ VOLUME 7 ♦ NUMBER 5 ♦ 2013
51
Table 1: Ranges of Stratification for Construction Businesses
Business Lower limit Upper limit Micro .0 12 912.9 Small 2 913.0 20 014.9 Medium 20 015.0 39 492.9 Large 39 493.0 70 766. Giant 70 767.0 Or higher
Source: INEGI Key indicators of construction businesses DATA AND METHODOLOGY In this investigation documentary research was applied to sustain the literature review, by conceptualizing leadership and organizational effectiveness, as well as direct research by using a survey for the empirical study, Rojas Soriano (2008). For the collection of data, a questionnaire was used to determine the style of leadership described by the behavior theory (Laissez-faire (liberal), democratic and autocratic) that prevails in the small construction companies and its relationship with organizational effectiveness; an instrument was designed with 20 items on a Likert-scale (1-5). Once having designed the questionnaire, it was necessary, before applying the survey, to pilot test it, which consisted of conducting some surveys on the segment of interest, or study group, in order to verify if the questionnaire had been properly prepared and to estimate the length of time for its application. Therefore, the questionnaire was first applied to 10 heads of small businesses. Some errors in semantics and interpretation were found and corrected immediately. The reliability of the instrument was measured. For such purpose we calculated Cronbach Alpha using the SPSS statistical program, of 0.884 which is considered very reliable. The population, object of study, was 169 small-business construction companies in the State of Puebla, Mexico, according to the National Institute of Statistics Geography and Informatics (INEGI). The formula used to determine the sample size was: 𝑛 = 𝑘2𝑝𝑞𝑁
𝑒2(𝑁−1)+𝐾2𝑝𝑞 (1)
Where: N = is the size of the population, or universe, 169 small businesses. k = is the level of trust that was assigned. It is 90% = 1. 96 e = the assigned sampling error of 10 % p = probability of occurrence of the event 50 % q = probability of non-occurrence of the event 50 % n = sample size 𝑛 = 1.652(0.50)(0.50)169
0.102(169−1)+1.65 2 (0.50)(0.50)= 49
The sample involved 49 small construction businesses of the State of Puebla. The small businesses, which formed part of the sample, were selected randomly, taken from the directory of the Mexican Entrepreneurial Information System (SIEM, initials in Spanish). The surveys were applied from May to July 2012. Table 2 provides a summary of the sample.
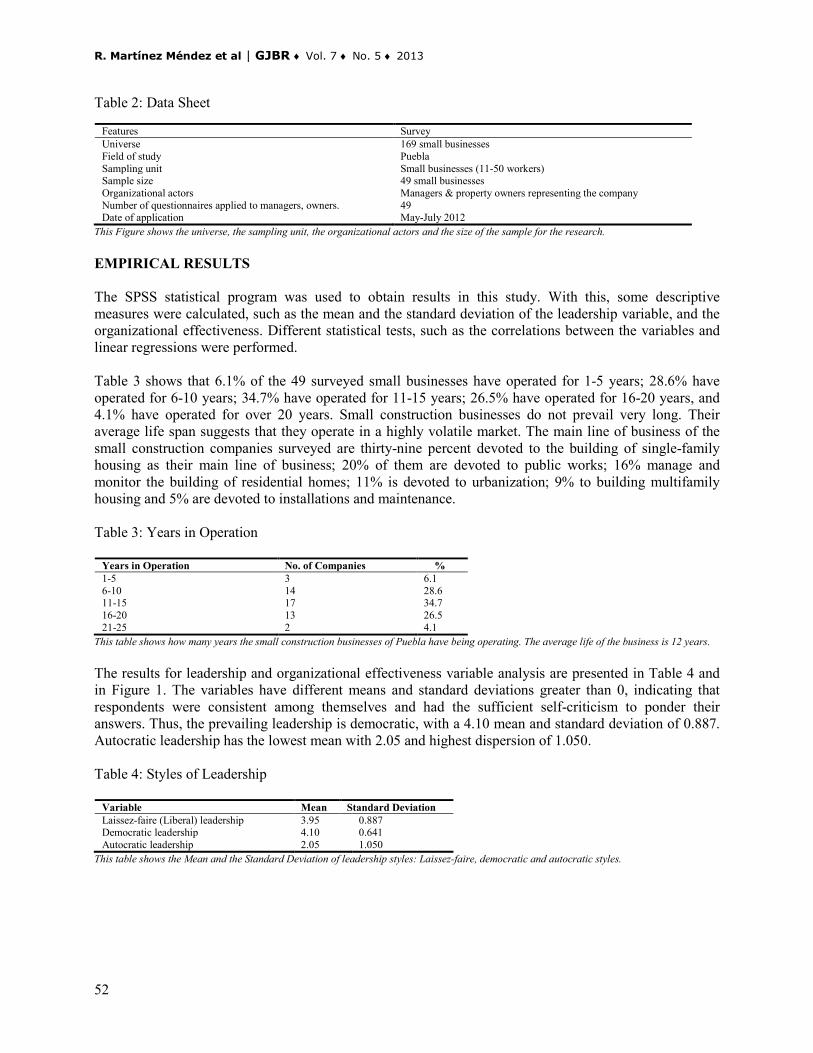
R. Martínez Méndez et al | GJBR ♦ Vol. 7 ♦ No. 5 ♦ 2013
52
Table 2: Data Sheet
Features Survey Universe 169 small businesses Field of study Puebla Sampling unit Small businesses (11-50 workers) Sample size 49 small businesses Organizational actors Managers & property owners representing the company Number of questionnaires applied to managers, owners. 49 Date of application May-July 2012
This Figure shows the universe, the sampling unit, the organizational actors and the size of the sample for the research. EMPIRICAL RESULTS The SPSS statistical program was used to obtain results in this study. With this, some descriptive measures were calculated, such as the mean and the standard deviation of the leadership variable, and the organizational effectiveness. Different statistical tests, such as the correlations between the variables and linear regressions were performed. Table 3 shows that 6.1% of the 49 surveyed small businesses have operated for 1-5 years; 28.6% have operated for 6-10 years; 34.7% have operated for 11-15 years; 26.5% have operated for 16-20 years, and 4.1% have operated for over 20 years. Small construction businesses do not prevail very long. Their average life span suggests that they operate in a highly volatile market. The main line of business of the small construction companies surveyed are thirty-nine percent devoted to the building of single-family housing as their main line of business; 20% of them are devoted to public works; 16% manage and monitor the building of residential homes; 11% is devoted to urbanization; 9% to building multifamily housing and 5% are devoted to installations and maintenance. Table 3: Years in Operation
Years in Operation No. of Companies % 1-5 3 6.1 6-10 14 28.6 11-15 17 34.7 16-20 13 26.5 21-25 2 4.1
This table shows how many years the small construction businesses of Puebla have being operating. The average life of the business is 12 years. The results for leadership and organizational effectiveness variable analysis are presented in Table 4 and in Figure 1. The variables have different means and standard deviations greater than 0, indicating that respondents were consistent among themselves and had the sufficient self-criticism to ponder their answers. Thus, the prevailing leadership is democratic, with a 4.10 mean and standard deviation of 0.887. Autocratic leadership has the lowest mean with 2.05 and highest dispersion of 1.050. Table 4: Styles of Leadership
Variable Mean Standard Deviation Laissez-faire (Liberal) leadership 3.95 0.887 Democratic leadership 4.10 0.641 Autocratic leadership 2.05 1.050
This table shows the Mean and the Standard Deviation of leadership styles: Laissez-faire, democratic and autocratic styles.
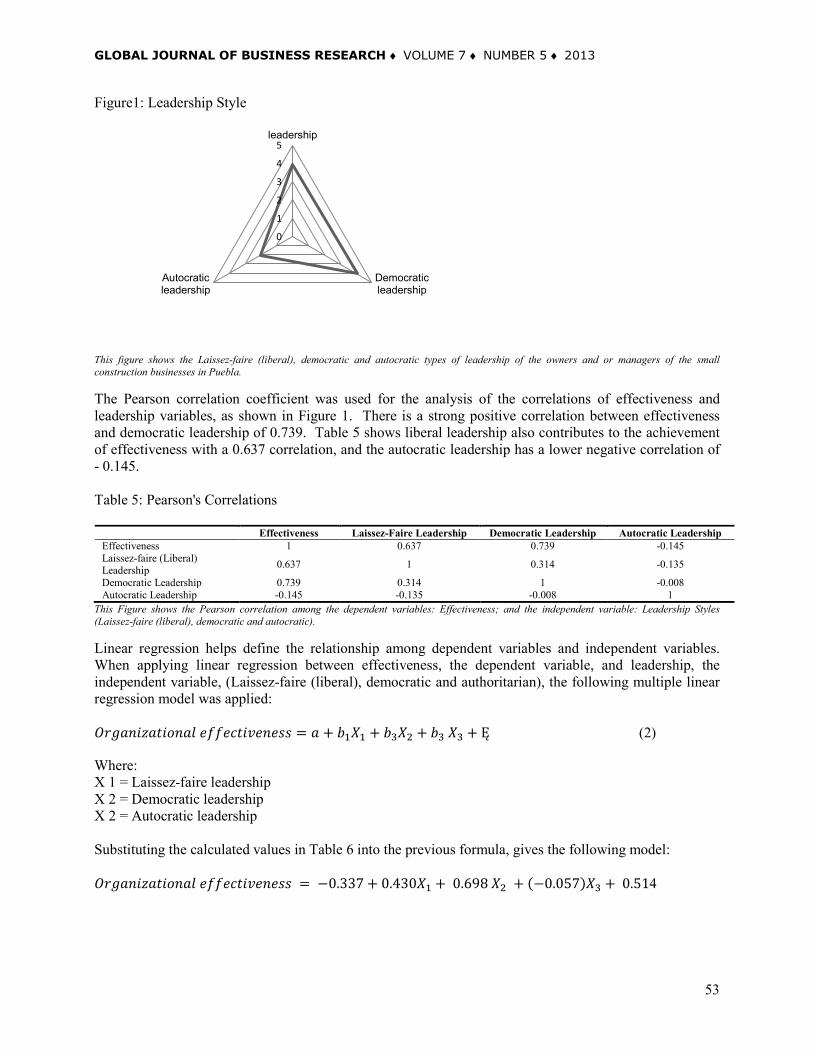
GLOBAL JOURNAL OF BUSINESS RESEARCH ♦ VOLUME 7 ♦ NUMBER 5 ♦ 2013
53
Figure1: Leadership Style
This figure shows the Laissez-faire (liberal), democratic and autocratic types of leadership of the owners and or managers of the small construction businesses in Puebla. The Pearson correlation coefficient was used for the analysis of the correlations of effectiveness and leadership variables, as shown in Figure 1. There is a strong positive correlation between effectiveness and democratic leadership of 0.739. Table 5 shows liberal leadership also contributes to the achievement of effectiveness with a 0.637 correlation, and the autocratic leadership has a lower negative correlation of - 0.145. Table 5: Pearson's Correlations
Effectiveness Laissez-Faire Leadership Democratic Leadership Autocratic Leadership Effectiveness 1 0.637 0.739 -0.145 Laissez-faire (Liberal) Leadership 0.637 1 0.314 -0.135
Democratic Leadership 0.739 0.314 1 -0.008 Autocratic Leadership -0.145 -0.135 -0.008 1
This Figure shows the Pearson correlation among the dependent variables: Effectiveness; and the independent variable: Leadership Styles (Laissez-faire (liberal), democratic and autocratic). Linear regression helps define the relationship among dependent variables and independent variables. When applying linear regression between effectiveness, the dependent variable, and leadership, the independent variable, (Laissez-faire (liberal), democratic and authoritarian), the following multiple linear regression model was applied: 𝑂𝑟𝑔𝑎𝑛𝑖𝑧𝑎𝑡𝑖𝑜𝑛𝑎𝑙 𝑒𝑓𝑓𝑒𝑐𝑡𝑖𝑣𝑒𝑛𝑒𝑠𝑠 = 𝑎 + 𝑏1𝑋1 + 𝑏3𝑋2 + 𝑏3 𝑋3 + Ę (2)
Where: X 1 = Laissez-faire leadership X 2 = Democratic leadership X 2 = Autocratic leadership Substituting the calculated values in Table 6 into the previous formula, gives the following model: 𝑂𝑟𝑔𝑎𝑛𝑖𝑧𝑎𝑡𝑖𝑜𝑛𝑎𝑙 𝑒𝑓𝑓𝑒𝑐𝑡𝑖𝑣𝑒𝑛𝑒𝑠𝑠 = −0.337 + 0.430𝑋1 + 0.698 𝑋2 + (−0.057)𝑋3 + 0.514
0
1
2
3
4
5leadership
Democraticleadership
Autocraticleadership

R. Martínez Méndez et al | GJBR ♦ Vol. 7 ♦ No. 5 ♦ 2013
54
Table 6: Coefficients
Model Non-standardized Coefficients Standardized Coefficients t Sig. Adjusted R Square
Typical Error Estimation B Typical Error Beta
(Constant) -0.337 0.747 0.914 0.658 Laissez-faire leadership 0.430 0.135 0.438 3.195 0.006 Democratic leadership 0.698 0.158 0.601 4.422 0.000 Autocratic leadership -0.057 0.092 -0.081 -0.620 0.544 Adjusted R square 0.691 Typical error estimation 0.514
This table shows the coefficients of the independent variables: Laissez-faire leadership, democratic leadership and autocratic leadership. The results show that: 1. There is a positive and significant correlation between effectiveness, and democratic and Laissez-faire (liberal) leadership. 2. There is a negative correlation between effectiveness and autocratic leadership. 3. The regression model used explains 69.1% of the variations in effectiveness. Furthermore, there is no statistical evidence of omitted variables (constant test = 0.914). 4. Laissez-faire (liberal) leadership is a variable that positively influences the explanation of effectiveness, t = 3.195. 5. The democratic leadership is a variable that positively influences the explanation of effectiveness, t = 4.442 and 6. Autocratic leadership is a variable that negatively influences the explanation of effectiveness, t = 0.620. Therefore, in this research, organizational effectiveness is explained by the direct effects of Laissez-faire leadership style and of democratic leadership style and, indirectly, by an autocratic leadership style, as can be seen in Figure 2. Figure 2: Relationship among Organizational Effectiveness and Leadership Types
This figure shows the relationship among effectiveness and democratic, laissez-faire, and autocratic leadership styles. CONCLUSIONS Finally, in order to conclude this section, we discuss the main theoretical and empirical implications arising from this research. The goal of the research posed at the beginning of the investigation was to describe how leadership styles, in the small construction businesses located in Puebla, are perceived, along with how to determine their relationships with the organizational effectiveness and which was successfully achieved as one can observe in the results of the research above. For this purpose a documentary investigation was carried out, as well as the collection of data of an empirical study with a sampling of 49 small businesses through the application of a questionnaire with the purpose of determining the leadership style that the behaviorist theory points out (liberal, democratic and autocratic) that prevail in the small construction businesses, and their relationship to organizational effectiveness, using an instrument of 20 items on a Likert-scale (1-5).
Laissez-faire Leadership
Autocratic Leadership
Democratic Leadership
Organizational Effectiveness
0.435 0.713
-0.078

GLOBAL JOURNAL OF BUSINESS RESEARCH ♦ VOLUME 7 ♦ NUMBER 5 ♦ 2013
55
From the results we note 1.) There is a positive and significant correlation between effectiveness and democratic leadership and liberal leadership in the small construction businesses in Puebla and 2.) There is a negative correlation between effectiveness and autocratic leadership in the small construction businesses in Puebla. Referring to the democratic and liberal leadership styles, we note these impact the small construction businesses, which is consistent with the state of the art (Pedraja-Rejas and Rodriguez-Ponce 2004; Rodriguez, 2010). In this context, leadership styles, as independent variables, impact the effectiveness (the dependent variable) of the small construction businesses, which coincides with the Upper Echelons Theory, Hambirk and Mason (1984), who postulated that the strategic choices and the performance of the organizations are determined by the senior management team. According to the results we would expect that the rest of the firms execute a democratic leadership style, which implies: a) delegation of authority; b) involvement of subordinates in decision making; (c) support of subordinates. The authors agree with Silíceos et al. (2000), that leaders of small construction businesses must comply with the following tasks: create the vision and define the mission and the company code of values; be clear about their objectives, responsibilities and tasks of the personnel; strengthen teamwork, human processes and the work culture, and systematically improve the organizational climate. From the results we assume that these tasks are achieved by asking questions, asking for suggestions, consulting, requesting, seeking ideas, etc., from the employees or at least from those who are involved in the direction of the businesses. Likewise leadership influences the organizational effectiveness of the small construction businesses. There are other factors such as organizational climate, organizational culture, among others, which would be the subject of another research. Finally, future investigation could resume this research to address some items that are pending to be reviewed, such as the types of prevailing culture in the conglomerate of micro, small and medium-sized enterprises (MSMEs) and in each specific sector of activity. Or rather, the relationship that was studied in this research could be reviewed and discussed, by taking each sector as a unit of analysis, or the size of the companies (micro, small or medium); as well as by adding control variables such as the gender of the leaders. REFERENCES De la Cerda Gastélum José y Núñez de la Peña Francisco (1998). “La administración en desarrollo. Hacia una nueva administrativa en México y Latinoamérica”. México. Editorial Diana. p. 77-97 Gibson et al. 1999. “Las organizaciones (Comportamiento, Estructura y Procesos)”. México. Editorial Mc Graw Hill. p. 15-42. Guillén Mondragón Irene Juana y Pomar Fernández Silvia (2005). “Estilos de Gestión en la pequeña empresa encuentros y desencuentros”. Administración y Organizaciones UAM. p. 9-36 Hall Richard H. (1996). “Organizaciones. Estructura, procesos y resultados”. México. Editorial Prentice Hall. p. 146-192. Hambrick D. and Mason P. (1984). “Upper echelons theory . The organizations as a reflection of its top managers. Acad. Manag. Rev . 9. p.193-204. Henri, J. F. (2006). Organizational culture and performance measurement systems. Canada. Accounting, Organizations and Society, p.31,

R. Martínez Méndez et al | GJBR ♦ Vol. 7 ♦ No. 5 ♦ 2013
56
Kerlinger Fred N y Lee Howard B (1986).”Investigación del Comportamiento. Métodos de investigación en las Ciencias Sociales. México. Editorial MC Graw Hill. p.147-160 Krieger Mario (2001). “Sociología de las organizaciones. Una introducción al comportamiento organizacional”. México. Editorial Prentice Hall. p. 293-384 Kotter, J. (1999). “La verdadera labor de un líder”. Colombia. Editorial Norma. p. 12-32. Mendoza Torres Martha Ruth y Ortiz Riaga Carolina (2006).” El liderazgo transformacional, dimensiones e impacto en la cultura organizacional y eficacia de las empresas”. Colombia. Revista Facultad de ciencias económicas: investigación y reflexión. Universidad Militar Nueva Granada. p.118-134 Ogbonna, E. and Harris, L. (2000). Leadership style, organizational culture and performance: empirical evidence from UK companies. International U.S.A. Journal of Human Resource Management, 11 (4). p.776-788. Pedraja R. Liliana y Rodríguez P. Emilio (2004).”Efectos del estilo de liderazgo sobre la eficacia de las organizaciones públicas”. Chile. Revista Facultad de Ingeniería. U.T:A. p. 63-77. Rodríguez, Emilio (2010). “Estilos de liderazgo, cultura organizacional y eficacia, un estudio empírico en pequeñas y medianas empresas” Venezuela. Revista de Ciencias Sociales. Universidad de Zulia. p 629-641 Rojas Soriano Raúl (2008). “Guía para realizar investigaciones sociales”. México. Editorial Plaza y Valdez. p. 92-100 Silíceo Aguilar Alfonso, Cásares Arrangoiz David y González Martínez José Luis, (2000). “Liderazgo, valores y cultura organizacional. Hacia una organización competitiva”. México. Editorial Mc Graw Hill. p 129-149. Suárez-Núñez Tirso. (2001) La pequeña empresa (PE) en el pensamiento económico. México. Revista Administración y organizaciones 7, año 4. UAM. p. 5-26 Valentín Kajatt Nadina y Rivas Tovar Luis Arturo (2006). Los estilos de liderazgo en las organizaciones de servicios: el caso de una escuela de negocios. México. Revista de investigación y análisis. p. 28-43. BIOGRAPHY Rafaela Martínez Méndez, Ph.D. in Administration Science, is a Full-time Researcher and Professor at the College of Public Accountancy of Meritorious Autonomous University of Puebla, in Mexico. E-mail: [email protected] José Gerardo Serafín Vera Muñoz, Ph.D. in Administration, is a Full-time Researcher and Professor at the College of Public Accountancy of Meritorious Autonomous University of Puebla, in Mexico. E-mail: [email protected]. María Antonieta Monserrat Vera Muñoz, Ph.D. in Management of Organizations, is a Full-time Researcher and Professor at the College of Public Accountancy of Meritorious Autonomous University of Puebla, in Mexico. E-mail: [email protected]

GLOBAL JOURNAL OF BUSINESS RESEARCH ♦ VOLUME 7 ♦ NUMBER 5 ♦ 2013
57
THE IMPACT OF MICROCREDIT ON WOMEN- OWNED SMALL AND MEDIUM ENTERPRISES:
EVIDENCE FROM KENYA Clemencia Osa Ouma, University of Nairobi, Kenya
Charles M. Rambo, University of Nairobi, Kenya
Microcredit is a crucial tool for economic empowerment of women. In Kenya, the microcredit industry has supported more than 3 million small and medium enterprises for close to 30 years. Kenya Women Finance Trust is a leading microcredit institution dealing exclusively with financing needs of women. However, whether the services provided by the institution have spurred growth among women-owned enterprises remains undocumented. The objective of this study was to assess the effect of access to microcredit services on the growth of women-owned enterprises within the Central Business District of Kisumu City. To accomplish this, we sourced primary data from 190 women entrepreneurs. The study found that access to microcredit significantly associated with sales, net profit, number of paid workers and liabilities. Thus, access to microcredit had positive effects on the growth of women-owned enterprises. In addition, Kenya Women Finance Trust’s lending policies were not responsive to financing needs of women and to changes in the business environment. This undermined the potential of funded enterprises to achieve sustainable growth. The study recommends the need to review the financial institution’s lending policies, increase the amount of microcredit funds and encourage other actors to finance women-owned enterprises. JEL: O16 KEYWORDS: Access, Microcredit, Small and Medium Enterprises, Women-Owned, Central Business
District INTRODUCTION
icrocredit provides an opportunity for low income-earners, including women to improve their economic and social status. Besides economic empowerment, microcredit carries with it numerous other benefits for women, including better control of their reproductive health as well
as reduced vulnerability to domestic violence. Better incomes make women less vulnerable to gender-based violence perpetuated by their partners (Goetz & Sen, 1994; Mayoux, 1998a). As noted by Ghadoliya (2000), ‘microcredit plays a crucial role in socio-economic empowerment of women by promoting suitable conditions for them to move from positions of marginalization within households, to one of greater roles in decision-making at the community, national and international levels’ (p34). In most countries, commercial banks have not effectively addressed the financial needs of low income-earners, due to stringent baseline requirements. In addition, commercial banks perceive low income-earners as not being credit-worthy due to lack of assets, which they may use as collateral against credit facilities (World Bank, 2009). In this regard, credit facilities provided by Microcredit Institutions (MFIs) play an important role by filling the gap for financial services among low income-earners, majority of who include women. The services provided by MFIs are flexible and tailored to meet the financing needs of women in rural and urban settings (Chandrasekhar, 2004). The origin of microcredit is traceable to the 14th Century, when the Franciscan monks founded the community-oriented pawnshops (World Bank, 2009). In the 19th Century, establishment of the Credit Union Movement in Western Europe added a significant impetus to the growth of microcredit industry. These early movements played a crucial role in
M
C. Osa Ouma & C. M. Rambo | GJBR ♦ Vol. 7 ♦ No. 5 ♦ 2013
58
the establishment of pro-poor institutions, which brought accessible and affordable financing opportunities to low-income earners (World Bank, 2009). In the mid 20th Century, a similar movement emerged in Bangladesh. As noted by Besley (1995), a renowned economist and a Nobel Peace Prize winner, Muhammad Yunus initiated and propagated the idea. It later led to the establishment of the microcredit institution, the Grameen Bank, which served more than 7 million low-income Bangladeshi women by 2007. The success of the institution inspired its replication in India, Philippines, Indonesia and Pakistan, among other countries in the region. Since then microcredit, programs have spread all over the world. A study conducted by the World Bank (1999) indicated that about 25 million people worldwide were using microcredit to finance their business activities, with women forming up to 90% of beneficiaries. By 2005, up to 113 million borrowers had benefited from microcredit services and by 2010, microcredit industry addressed the financing needs of up to 150 million low income-earners, especially in developing countries (World Bank, 2009). In Kenya, the microcredit industry is a relatively new phenomenon, with a few agencies starting about 25 years ago. Due to rapid development in Kenya’s economic landscape, the agencies eventually graduated into vibrant institutions in the 1990s (Hospes, Musinga & Ong’ayo, 2002). The growth of microcredit industry in Kenya improved through the Government’s resolve to create an enabling environment through appropriate policy and legal frameworks to support entrepreneurial development. Between 1992 and 1994, the Government was intensively involved in implementing the Structural Adjustment Programs (SAPs). In this regard, the aim of economic liberalization was to restore macro-economic stability and spur private sector investments. To counter the potential negative impact of liberalization, microcredit industry emerged as one of the areas requiring donor support. As noted by Atieno (2009), government estimations indicate that the microcredit industry has received more than US$ 200 million from external sources, which supported the financing needs of Small and Medium Enterprises (SMEs). By 2001, about 1.3 million SMEs were operational in the country and provided job opportunities to about 2.4 million people; and accounted for about 70% of economic activities (Hospes et al., 2002). By 2008, SMEs created employment for about 75% of the national workforce and contributed up to about 22% of the national Gross Domestic Product (GDP). In Kisumu town, the role of SMEs as regards employment creation needs no amplification. By 2008, the sector engaged more than 40% of the district’s labour force (Government of Kenya, 2008). Kenya Women Finance Trust (KWFT) is one of the institutions that have shaped the microcredit industry in the country by extending microcredit facilities to women-owned SMEs (Odhiambo, 1985; Hospes et al., 2002; Government of Kenya, 2008). Established in 1982, KWFT has an elaborate national network of nine regional offices, supported a satellite of sub-regional offices. KWFT empowers women by providing accessible and affordable financial services. Microcredit facilities are important for the growth and expansion of SMEs and for their subsequent role in the national economy (Atieno, 2009). The growth and expansion of SMEs requires sustained investment in working capital. However, at low levels of income, the accumulation of such capital may be difficult. Under such circumstances, microcredit facilities may help small-scale entrepreneurs improve their incomes and accumulate own capital (Hossain, 1988; Atieno, 2001). KWFT have exclusively served the financing needs of women-owned SMEs; however, whether the microcredit services provided by the institution has spurred growth in the performance of women-owned SMEs, especially within the Central Business District (CBD) of Kisumu City remains unclear and undocumented. Against this background information, this study determined the impact of microcredit services on women-owned SMEs within Kisumu City. The resultant information is useful for development agencies, as well as scholars in microfinance, entrepreneurship as well as gender and development. The remainder of this paper covers a section on literature review, data and methodology, results and discussions, as well as concluding remarks.
GLOBAL JOURNAL OF BUSINESS RESEARCH ♦ VOLUME 7 ♦ NUMBER 5 ♦ 2013
59
LITERATURE REVIEW Small and Medium Enterprises (SMEs) play an important role in the social and economic development of many countries by creating employment opportunities and improving incomes. In Kenya, the development of SMEs is a priority strategy for the country’s industrialization, employment creation and poverty reduction (Mitulla, 2003; Atieno, 2009). In this regard, SMEs create employment for about 75% of the national workforce and contribute up to 22% of the national Gross Domestic Product (Mbithi & Mainga, 2006; Atieno, 2009). With about 70% of SMEs located in rural areas, the sector is poised to support the development of rural economies (Mitulla, 2003). The Government of Kenya (GoK) recognizes the contribution of SMEs to the national economy; and has since formulated policies to facilitate their establishment and survival. For instance, in 1996, the GoK developed the Sessional Paper Number 2, on Industrial Transformation to the Year 2020, which emphasized the need to improve the availability of credit facilities to SMEs in all parts of the country (Atieno, 2001). The Economic Recovery Strategy Paper for Wealth and Employment Creation (ERSWEC) 2003-2007 identifies SMEs and in particular expansion of the informal sector as one of the activities to facilitate economic recovery and growth. In 2005, the GoK published another policy paper– the Sessional Paper Number 2, on the Development of Micro and Small Enterprises for Employment and Wealth Creation was published (Government of Kenya, 2005; Mbithi & Mainga, 2006; Atieno, 2009). The paper articulates policies for developing SMEs, including the need to increase access to financial services. In 2006, the GoK drafted the Micro and Small Enterprises Bill, as a step towards legalization of SMEs in the country. Article 20, part 1 of the Bill created the Micro and Small Enterprises Development Fund (SMEDF), with the purpose of providing funding to registered SMEs through microcredit (Government of Kenya, 2006). Among other challenges experienced by SMEs, inadequate access to formal credit stands out as a key impediment to their survival and performance. In Kenya, SMEs have limited access to credit services provided by formal financial institutions. As such, most SMEs rely on retained earnings and loans from informal associations, which are often unpredictable, unsecure and have a limited scope for risk sharing. Besides, as SMEs grow, their credit requirements become too complicated for informal credit sources to address (Aryeetey, 1996). The expansion of SMEs requires sustained investments; however, at low levels of income, capital accumulation may be difficult. Formal credit facilities may help small-scale entrepreneurs to improve their incomes and accumulate own capital (Hossain, 1988; Atieno, 2001). Hence, access to well-developed microcredit systems may be a crucial catalyst for economic development (Mitulla, 2003). As noted by Atieno (2009), formal microcredit services are important for the expansion of SMEs and for their subsequent role in the national economy. The impact of microcredit on the growth of women-owned SMEs and women’s economic status has been a subject of empirical investigations worldwide. Recent empirical evidence suggest that a well-developed microcredit system can help women-owned SMEs to access affordable credit services, which in turn, is likely to reduce poverty among women. Microcredit enables women entrepreneurs to improve net returns, insure against risks and broaden investment opportunities (Claessens & Kranz, 2001); similarly, Wright (2000) notes that microcredit provides an important glimmer of hope for women entrepreneurs, with a potential to bridge gender gap between men and women. Barnes (2005) conducted a study in Zimbabwe to determine the impact of microcredit on the performance of SMEs and household economic status among communities most burdened by HIV and AIDS. The

C. Osa Ouma & C. M. Rambo | GJBR ♦ Vol. 7 ♦ No. 5 ♦ 2013
60
study revealed that access to microcredit had a positive effect on borrowers’ average income, food security, nutrition, treatment adherence as well as education of orphaned and vulnerable children. A little earlier in 2004, Robinson assessed the role of microfinance on the economic status of the poor in developing countries, majority of who are women. The study found that women-owned SMEs formed about 83% of microcredit clientele, which increased the role of women entrepreneurs in economic development at the household, community, national and international levels. Based on the findings, Robinson (2004) argued that investing in women-owned SMEs was an effective way of increasing family expenditures on health and education, as well as improving nutrition and food security. Another study conducted by Khandker (2003), focused on the tracking of microcredit and poverty indicators in Bangladesh. The study found that access to microcredit reduced poverty rates by more than 20% among borrowers, with more than half of such improvement resulting from microcredit (Khandker, 2003). Due to the spillover effect on non-participants in microfinance schemes, the study attributed up to 40% of poverty reduction in rural Bangladesh to microcredit. In a review of the same study, two years later, Khandker demonstrated that the substantial impact of microcredit on poverty was entirely the result of borrowing by women rather than men (Khandker, 2005). Furthermore, Morduch (1999) noted that in developing countries, women played a pivotal role as risk managers and drivers of development, particularly in poor communities. Microcredit programs in such countries enabled thousands of women to use small sums of money in creative ways to develop livelihoods, improve family well-being and accumulate savings. However, the study noted that available microcredit resources were too limited to spur long-term economic growth; thus, suggesting the need for more investments in microfinance programs (Morduch, 1999). The overriding message in the reviewed studies is that access to microcredit is a crucial factor for the survival and performance of SMEs. Although a number of studies have their setting in developing countries, in Kenya, the relationship between microcredit and performance of women-owned SMEs has not attracted as much empirical investigation, notwithstanding the fact that microfinance institutions such as KWFT have been operational in the country for close to three decades. DATA AND METHODOLOGY The study applied a cross-sectional survey design with both quantitative and qualitative approaches. The quantitative approach obtained numerical and quantifiable data. The qualitative approach elicited in-depth information based on personal experiences and opinions of women entrepreneurs. The study population consisted of women-owned SMEs operating within the CBD of Kisumu City. We sourced primary data from 190 women SME owners who had received microcredit from KWFT and stayed in business for at least three years. We also sourced secondary data through a review of KWFT registers and reports, as well as relevant empirical and policy literature. We used stratified random and purposive sampling procedures to obtain samples of SMEs and women entrepreneurs, whom were engaged in interviews between May and June 2010. Furthermore, we applied the Statistical Package for Social Sciences (SPSS) package to generate frequency distributions, percentages and cross-tabulations. The analysis of qualitative data involved organization into thematic areas, description and thematic analysis. The following publications support the methodology that we applied in this study: Best & Khan, 2004; Kothari, 2004; Bryman & Cramer, 1997; Mugenda & Mugenda, 1999; Nachmias & Nachmias, 1999. RESULTS The study covered a total of 190 women entrepreneurs, each representing and providing information about their enterprises. All the participants reported having received microcredit from Kenya Women Finance Trust (KWFT) to support their businesses. Of the 190 participants, the majority, [110 (57.9%)]

GLOBAL JOURNAL OF BUSINESS RESEARCH ♦ VOLUME 7 ♦ NUMBER 5 ♦ 2013
61
had received microcredit exclusively from KWFT trust once; 66 (34.7%) participants had been funded twice, 11 (5.8%) had received microcredit thrice, while 3 (1.6%) had been funded more than thrice. In addition, Table 1 indicates that the SMEs represented in this study were involved in various lines of business, including hairdressing, clothing boutique, tailoring, food selling and retailing, among others. Table 1: The Type of Business for SMEs Participating in the Study
CATEGORY OF SMES FREQUENCY PERCENT Hairdressing 13 6.8 Clothing boutiques 49 25.8 Tailoring 51 26.8 Food selling 17 8.9 Hair dressing /clothing boutiques 12 6.3 Tailoring/clothing boutiques 14 7.4 Retailing 26 13.7 Others 8 4.2 Total 190 100.0
Table 1 presents the type of business activities carried out by the small and medium enterprises involved in this study. As reflected in the frequency distributions, most business ventures dealt in tailoring activities, clothing boutiques and retailing business. The category lumped as ‘others’ included hardware shops, bookshops and dry-cleaning outlets. Table 1 also shows that some SMEs were involved in more than one business activity. In this regard, 12 (6.3%) respondents were involved in both hairdressing and clothing boutiques, while 14 (7.4%) respondents operated tailoring and clothing boutiques. The results presented in Table 2 further reveal a preference towards certain business lines such as clothing boutiques and tailoring shops among women. Furthermore, 50 (26.3%) SMEs were aged between 3 and 5 years; 58 (30.5%) were aged between 6 and 8 years, while 69 (36.3%) were aged between 8 and 11 years old. Overall, up to 177 (93.2%) SMEs had been operational for between 3 and 11 years. Age emerged to be an important factor influencing the extent to which microcredit services affected the growth of SMEs. Through in-depth interviews, the study noted that older SMEs were more entrenched in the market than new ones. Thus, they had better marketing structures and were likely to experience faster growth than new firms were. In addition, 166 (87.4%) SMEs were registered as sole proprietorship business entities, 19 (10.0%) were limited liability companies, while 5 (2.6%) were registered as partnerships. Of the 190 SMEs involved in the study, 83 (43.7%) were generating revenues in the range of KES 20,000 to KES 29,999; another 56 (29.5%) were generating between KES 10,000 and KES 19,999; while 17 (8.9%) generated between KES 30,000 and KES 39,000. In addition, 13 (6.8%) SMEs had revenues averaging KES 5,000 to KES 9,999; another 9 (4.7%) SMEs generated between KES 40,000 and KES 49,999; 8 (4.2%) had revenues below KES 5,000; while 4 (2.1%) SMEs reported average revenues of KES 50,000 or more. Notable from these results is the fact that majority of the SMEs [156 (82.1%)], were generating between KES 10,000 and 40,000 as net profits on a monthly basis. The study found that 141 (74.2%) SMEs had between 1 and 9 paid workers, 41 (21.6%) SMEs had between 10 and 19 workers, while 8 (4.2%) SMEs had 20 workers or more. However, the SMEs also relied on unpaid work provided by family members. Besides, the study revealed that support from family members in terms of unpaid labour was necessary for the survival of SMEs in their quest for a market share. However, for SMEs that managed to consolidate a strong financial base, family workers were gradually absorbed into the payroll and served as paid workers. All the 190 SMEs had accessed microcredit from KWFT, with up to 176 (91.6%), receiving microcredit exclusively from the organization; while 16 (8.4%) others received credit from supplementary sources such as community savings and loan schemes, friends and relatives. The huge percentage receiving funding exclusively from KWFT indicated the significant role played by the organization in addressing

C. Osa Ouma & C. M. Rambo | GJBR ♦ Vol. 7 ♦ No. 5 ♦ 2013
62
financing needs of women-owned SMEs within the community. Those who had received alternative funds from relatives, friends and suppliers hinted that such sources were favourable in terms of interest rates and devoid of complicated formalities. However, loans obtained from such sources were insufficient and in most cases, not available consistently. Table 2 shows that out of 190 participants, 31 (16.3%) had obtained between KES 10,000 and KES 19,000; 50 (26.3%) were funded to the tune of KES 20,000 to KES 39,000; while 59 (31.1%) received KES 40,000 to KES 69,000. In addition, 33 (17.4%) SMEs received microcredit between KES 70,000 to KES 99,000; those who received KES 100,000 or more were 17 (8.9%) business enterprises. Table 2: Amount of Credit Received during Last Application
AMOUNT RECEIVED FREQUENCY PERCENT KES 10,000-19,000 31 16.3 KES 20,000-39,000 50 26.3 KES 40,000-69,000 59 31.1 KES 70,000-99,000 33 17.4 KES 100,000 plus 17 8.9 Total 190 100.0
The Table shows the amount of credit received from Kenya Women Finance Trust during the last time respondent made an application. The results show that about one-third of participants received between Kenya Shillings (KES) 40,000 and 69,000, while slightly less than one-third received between KES 20,000 and 39,000. However, the results show that more than 90% of the women entrepreneurs received less than KES 100,000, which may have implications on the financial stability of women-owned enterprises. The study found that microcredit provided to women under the group-based model ranged between KES 10,500 and KES 99,000, which explains why more than 90% of the enterprises were able to secure funds below KES 100,000. We requested participants to state their opinion regarding the adequacy of funds provided as microcredit by the KWFT. The results indicated that 110 (57.9%) entrepreneurs felt that the funds were inadequate vis-à-vis their financing needs, while 66 (34.7%) indicated that the funds were very inadequate. Consequently, up to 8.4% of the entrepreneurs sought supplementary funding from alternative sources. Kenya Women Finance Trust delivered microcredit services to women using two key models, viz. individual-based and group-based models. Under the individual-based model, the institution provided microcredit to individual borrowers having minimum qualifications as well as providing collateral and business plans. In addition, individual borrowers took personal responsibility for credit advanced to them, which in turn, encouraged borrowers to service their accounts consistently. This provides opportunity for women to access high amounts of credit, which could improve the performance of business enterprises. Besides, individual responsibility discourages defaults. However, the model is inaccessible to most women in low-income brackets, especially those lacking collateral. The second model addresses financing needs for registered self-help groups. Under this model, each member is required to save their income with such groups for at least six months before qualifying for loans. Additional requirements for microcredit include prompt repayment and commitment to group activities. Participants noted that the model is particularly effective in reaching out to women from low-income groups, since borrowers require no collateral, as group members take responsibility for loans advanced to individual members. This condition necessitates support for borrowers to ensure proper utilization of microcredit. This commitment equates to social collateral. The model restricts access to large amounts beyond KES 100,000 and non-commitment among some borrowers. Even though the group-based model is more risky than the individual model, it plays a bigger role in facilitating low income-earners to access microcredit. In this study, up to 173 (91.1%), as compared to 17 (8.9%) participants received microcredit through the group-based model. In addition, KWFT created special loan products based on demand, including loans for school fees, clean energy, water tank loan, community phone and access to electricity network.

GLOBAL JOURNAL OF BUSINESS RESEARCH ♦ VOLUME 7 ♦ NUMBER 5 ♦ 2013
63
The study set to determine the impact of microcredit services provided by KWFT on the growth of women-owned enterprises. In this regard, we measured access to microcredit in terms of the number of times one had obtained credit from KWFT, and the growth of SMEs in terms of change in sales volume, net profits, number of paid workers as well as the trend of liabilities before and after obtaining credit. In this regard, we asked participants to indicate the number of times they had obtained credit from the institution. The results show that about one-half, 97 (51.1%) had been funded twice, 61 (32.1%) had received funding once, 23 (12.1%) had obtained microcredit thrice, while 9 (4.7%) had been funded more than three times. This implies that about 70% of the SMEs involved in the study were servicing their credit regularly, which enabled them to access microcredit repeatedly. The analysis yielded a computed chi square value of 19.35 with 3 degrees of freedom. This was statistically significant within 5% error margin, implying up to 95% chance that the growth of SMEs significantly associated with the number of times one accessed microcredit from KWFT. The results further suggested that SMEs accessing microcredit more than once were likely to experience higher growth in terms of sales volume, net profit, number of paid workers and liability status than those receiving microcredit for the first time. Growth is one of the most important goals of a business enterprise. Growth is a crucial precondition for a firm’s longevity. While negative growth is a sign of problems, stagnation is indicative of challenges an SME is likely to face in the future. Sales volume is one of the factors used to gauge whether an SME is growing positively or otherwise. Based on this, we requested participants to indicate their opinion regarding the performance of their SMEs in terms of sales before and after receiving microcredit from KWFT. As indicated in Table 3, 140 (73.7%) respondents felt that their enterprises were very inactive in terms of sales before receiving microcredit; however, after credit, up to 160 (84.2%) participants were convinced that their SMEs became more active - an indication that performance in terms of sales improved for more than 80% of the SMEs that received microcredit from KWFT. Table 3: Business Performance in Terms of Sales Before and after Credit
SALES BEFORE CREDIT AFTER CREDIT SUMMARY STATISTICS Frequency Percent Frequency Percent Computed χ2 Df P-value
Very active 11 5.8 29 15.3
7.341 3 0.043** Active 32 16.8 160 84.2 Inactive 7 3.7 0 0.0 Very inactive 140 73.7 1 0.5 Total 190 100.0 190 100.0
This Table indicates the opinion of women business owners regarding the activeness of their firms in terms of sales before accessing microcredit and after accessing microcredit from Kenya Women Finance Trust. The results suggest that a significant majority of women entrepreneurs (84%) believed that their firms became more active after accessing microcredit than before (n=190; χ2=7.341; 3 degrees of freedom; p-value =0.05). Note that *,** and *** represents significance at 10, 5 and 1 percent, respectively. The results yielded a computed chi square value of 7.341 with 5 degrees of freedom. The results were statistically significant within 5% error margin, leading to the rejection of the null hypothesis stating that there is no statistical association between access to microcredit from KWFT and the growth of SMEs in terms of sales because it contradicted empirical evidence. This implies that there was some significant association between access to microcredit and the growth of women-owned SMEs. Hence, about 85% of the SMEs were likely to experience higher growth after accessing microcredit than before. Through improved sales, SMEs were in a better position to improve revenues and accumulate capital resources for reinvestments. In conclusion, access to microcredit facilities is likely to have a positive effect on the growth of SMEs in terms of sales.

C. Osa Ouma & C. M. Rambo | GJBR ♦ Vol. 7 ♦ No. 5 ♦ 2013
64
The growth and expansion of SMEs requires sustained investment in working capital. However, at low levels of net profits, the accumulation of such capital may be difficult. Net profits provide a natural way through which SMEs build their financial base and replenish working capital. As net profits increase, so is the likelihood that an SME is experiencing growth. Based on these premises, we requested participants to indicate if there was any change in net profits, looking at the period before and after receiving microcredit from KWFT. The results presented in Table 4 below shows that the majority, [152 (80.0%)] participants were of the view that their SMEs registered dismal performance in terms of net profits before accessing microcredit from KWFT. After funding, up to 166 (87.4%) participants indicated that there was a positive change in net profits. Table 4: Performance Before and After Access to Credit in Terms of Profits
CHANGE IN PROFIT BEFORE CREDIT AFTER CREDIT SUMMARY STATISTICS Frequency Percent Frequency Percent Computed χ2 Df P-value
Profit increased 18 9.5 166 87.4
13.144 2 0.031** No change in profit 20 10.5 17 8.9 Profit decreased 152 80.0 7 3.7 Total 190 100.0 190 100.0
This Table presents women business owners’ opinion regarding change in net profits before accessing microcredit and after accessing microcredit from Kenya Women Finance Trust. The results suggest that a significant majority of women entrepreneurs (87%) believed that net profits changed positively after accessing microcredit than before (n=190; χ 2= 13.144; 2 df; p=0.031). Note that *,** and *** represents significance at 10, 5 and 1 percent, respectively. The results obtained a computed chi square value of 13.0, with 2 degrees of freedom, which was statistically significant within 5% error margin. This led to the rejection of the null hypothesis stating that there is no statistical association between access to microcredit and the growth of SMEs in terms of net profits because it was inconsistent with actual data. The results suggested up to 95% chance that access to microcredit provided by KWFT was statistically associated with the growth of women-owned SMEs. The number of paid workers is one of the key indicators commonly used to measure the magnitude of growth among SMEs. The bigger the change in the number paid workforce over time the higher the likelihood that growth is taking place. We requested participants to state the number of paid workers they had before and after receiving microcredit from KWFT. The results showed that up to 141 (74.2%) SMEs had between 1 and 9 paid workers, 41 (21.6%) had between 10 and 19 workers, while 8 (4.2%) had 20 workers or more. More still, Table 5 presents the results obtained from the bivariate analysis regarding change in the number of paid workers between the pre-credit and post-credit periods. The results suggest that there was a general increment in the number of paid workers. Table 5: Variation in the Number of Paid Workers
NUMBER OF PAID WORKERS BEFORE CREDIT AFTER CREDIT SUMMARY STATISTICS
Frequency Percent Frequency Percent Computed χ2 Df P-value 1 to 9 workers 128 67.4 135 71.1
16.220 2 0.027** 10-19 workers 54 28.4 40 21.1 20 workers+ 8 4.2 15 7.9 Total 190 100.0 190 100.0
The Table shows women business owners’ opinion regarding change in the number of paid workers before accessing microcredit and after accessing microcredit from Kenya Women Finance Trust. The results suggest increment in the number of paid workers (n=190; computed χ 2= 16.220; degrees of freedom =2; p-value=0.027). Note that *,** and *** represents significance at 10, 5 and 1 percent, respectively. The analysis obtained a computed chi square value of 16.220, with 2 degrees of freedom. This was statistically significant within 5% error margin, leading to rejection of the third null hypothesis, which stated that there is no significant association between access to microcredit and the growth of SMEs in terms of number of paid workers. The results implied up to 95% chance that access to microcredit

GLOBAL JOURNAL OF BUSINESS RESEARCH ♦ VOLUME 7 ♦ NUMBER 5 ♦ 2013
65
provided by KWFT was associated with growth of women-owned SMEs in terms of number of paid workers. This suggests that most SMEs experienced increased performance after receiving microcredit, which necessitated the number of paid workers to go up. In conclusion, access to microcredit is likely to spur SME growth, which in turn is likely to create more employment opportunities. The level of indebtedness is yet another indicator of whether an SME is growing or not. We further asked participants to state if there was any change in the trend of liabilities, during the period before and after obtaining funding from KWFT. As indicated in Table 6, liabilities were increasing for majority of participants [164 (86.3%)] before accessing microcredit. However, this trend changed for the majority, [163 (85.8%)] who indicated that their liabilities were decreasing after accessing microcredit from KWFT. Table 6: Liability Status Before and After Credit in Terms of Liabilities
CHANGE IN LIABILITIES BEFORE CREDIT AFTER CREDIT SUMMARY STATISTICS Frequency Percent Frequency Percent Computed χ2 Df P-value
Liabilities increasing 164 86.3 19 10.0
9.024 2 0.046** No change in liabilities 12 6.3 8 4.2 Liabilities decreasing 14 7.4 163 85.8 Total 190 100.0 190 100.0
This Table presents the perceptions of women business owners’ opinion regarding change in liability status before accessing microcredit and after accessing microcredit from Kenya Women Finance Trust. The results show that for most participants (86%), liability was decreasing after accessing microcredit from the financial institution (n=190; χ 2=9.024; 2 df; p= 0.046). Note that *,** and *** represents significance at 10, 5 and 1 percent, respectively. In addition, he results obtained a computed chi square value of 9.024 with 2 degrees of freedom, which prompted rejection of the null hypothesis stating that there is no statistical association between access to microcredit and the growth of women-owned SMEs in terms of the level of liabilities. This suggests up to 95% chance that access to microcredit provided by KWFT significantly associated with the growth of women-owned SMEs in terms of liability status. In conclusion, the results suggested that a significant relationship exists between access to microcredit facilities and the reduction of liabilities for a business entity. Better still, access to microcredit enabled SMEs to manage their liabilities. CONCLUSIONS The main objective of this study was to assess the effects of microcredit on the growth of women-owned SMEs within the Central Business District (CBD) of Kisumu City. To achieve this objective, we sourced primary data from women entrepreneurs who had accessed microcredit from Kenya Women Finance Trust (KWFT). The study revealed that more than 90% of participants had received microcredit exclusively from KWFT, while less than 10% sought supplementary funding from other sources such as community savings and loan schemes, friends and relatives. Even though KWFT played an important role in financing women-owned Small and medium enterprise (SMEs), alternative sources of financing were equally important in filling up the financing gap, which arose due to inadequacy of microcredit funds provided by KWFT. It also emerged that women entrepreneurs could only borrow up to a maximum of KES 100,000 under the group-based lending model. Much as the microcredit ceiling was a precautionary measure against default, it constrained the potential of women with greater entrepreneurial ambitions. This necessitates the revision of lending policies under the group-based model to address the actual financing needs of women-owned SMEs. Microcredit was availed to women under two models - the individual model and the group-based model. Although the individual model provided opportunity for women to access higher amounts of credit funds,

C. Osa Ouma & C. M. Rambo | GJBR ♦ Vol. 7 ♦ No. 5 ♦ 2013
66
it did not benefit most people due to stringent minimum qualification, including requirement for collateral. Out of 190 participants, only 17 (8.9%) had accessed microcredit from KWFT as individual applicants. Most women lacked suitable collateral to secure microcredit through the individual-based lending model. This worsened because in most traditional African setting, women lack opportunity to possess immovable properties such as land. The assumption that women entrepreneurs can accumulate wealth and afford collateral may be unrealistic, especially in a highly competitive business environment, where most young business entities die within a year of operation. Thus, sensitizing men to provide necessary back up to women in terms of collateral may be a feasible alternative for enhancing access to microcredit for women-owned SMEs. The group-based model provided a greater access to microcredit for women entrepreneurs. Although the model anchors on friendlier terms, it has a limited funding scope. Based on this premise, entrepreneurs in need of capitation funding beyond KES 100,000 found the model inappropriate in supporting their entrepreneurship ambitions. Thus, the model anchors on policies that created a glass ceiling to the entrepreneurial potential of women and women-owned SMEs. Increasing the amount of microcredit accessible under this model would go a long way in making the KWFT financing program supportive and responsive to the financing needs of women entrepreneurs. Women groups provide a platform for women entrepreneurs to access affordable microcredit on friendly terms. This necessitates sensitization about the importance of such groups their economic empowerment. Under the group-based lending model, the amount of microcredit accessible was standard for all eligible borrowers, irrespective of whether the location of their SMEs is rural or urban. This concern may be justified by the increasing cost of doing business, especially in urban areas. In this regard, Helms (1997) reported that SMEs in urban settings, particularly in developing countries, are twice as likely to collapse as enterprises operating in rural settings. The growth of urban-based SMEs is a subject of various factors, including stiff competition, insecurity and unfavourable business policies, leading to heavy taxation and harassment by licensing authorities. Based on this, formulating lending policies that are sensitive to the financing needs of urban and rural-based SMEs is likely to improve KWFT’s microcredit program. The study also found that KWFT’s microcredit program targets women entrepreneurs in rural areas. However, recent studies and policy pronouncements have indicated that poverty in urban areas is escalating at an alarming rate, the main contributing factors being a high rate of rural-urban migration and a stagnant industrial sector (Atieno, 2009). This makes it important to formulate financing policies that are more sensitive to the financing needs of SMEs in various settings. Access to microcredit remains instrumental for the growth of women-owned SMEs. The key indicators of growth considered in this study included sales volume, net profits, the number of paid workers, and the trend of liabilities before and after receiving microcredit. The study found that access to microcredit significantly associated with all these indicators of growth. The results suggested up to 95% chance that SMEs experienced higher sales and better profits after accessing credit from KWFT. This enabled SMEs to hire more paid workers to support increasing production and to reverse liability trends. In conclusion, adjusting lending policies to be consistent with the actual financing needs of women, and business environment is likely to strengthen the role of KWFT, as a leading pro-women microcredit institution in the country. We included of women entrepreneurs in this study based on whether they had benefitted from microcredit from KWFT, duration in business of at least three years and availability of complete financial records. Although 230 entrepreneurs were contacted, only 190 (82.6%) successfully met the inclusion criteria. The main challenge was lack of complete financial records detailing profits and liabilities before and after receiving microcredit. Besides, some entrepreneurs deliberately avoided sharing up-to-date financial records due to suspicion that such information may end-up in the hands of taxation authority. We
GLOBAL JOURNAL OF BUSINESS RESEARCH ♦ VOLUME 7 ♦ NUMBER 5 ♦ 2013
67
excluded such entrepreneurs from the study, though at the expense of the sample size and validity of the resultant information. This study reveals that access to microcredit is a key determinant of growth among women-owned SMEs. However, the environment in which such SMEs operate may also have significant influence on their financial health and the economic status of women entrepreneurs. More specifically, environmental factors such as taxation policies, competition, purchasing power of target consumers, demand patterns and utility costs, among others may have significant influence on SME performance regardless of the amount of credit funds invested in a business. Future studies should explore environmental factors influencing the performance of women-owned SMEs and make appropriate policy and programmatic recommendations. REFERENCES Atieno, R. (2001) Formal and Informal Institutions’ Lending Policies and Access to Credit by Small-Scale Enterprises in Kenya: An Empirical Assessment. AERC Research Paper 111. Nairobi: African Economic Research Consortium. Atieno, R. (2009) Linkages, Access to Finance and the Performance of Small-Scale Enterprises in Kenya. Research Paper No. 2009/06. New York: World Institute for Development Economics Research. Barnes, C. (2005) “Micro-credit and Households Coping with HIV/AIDS: A Case Study from Zimbabwe”. Microfinance, Vol. 55 (4), p. 431-452. Besley, T. (1995) “How does market failure justify interventions in rural credit markets?” World Bank Economic Review, Vol. 2 (1), p. 12-23. Best, J.W. and Khan, J.V. (2004) Research in Education, 7th Edition. New Delhi: Prentice Hall of India. Bryman, A. and Cramer, D. (1997) Quantitative Data Analysis with SPSS for Windows: a guide for social scientists. London: Routledge. Chandrasekhar, C. P. (2004) “Financial Liberalization and the Macroeconomics of Poverty Reduction,” Thematic Summary on Financial Liberalization for the Asia-Pacific Program on the Macroeconomics of Poverty Reduction. New York: UNDP. Claessens, S. and Kranz, N. (2001) Finance Matters for Poverty Reduction and Attaining MDGs-Recent Empirical Evidence. New York: World Bank. Ghadoliya, M.K. (2000) Empowering Women through Self-Help Groups. New York: World Bank. Goetz, A. and Sen. R. Gupta (1994) “Who takes the credit? Gender, power and control over loan use in rural credit programs in Bangladesh” Working paper. Brighton, England: Institute of development studies, University of Sussex. Government of Kenya, (2005) Achieving Millennium Development Goals in Kenya: A Needs Assessment and Costing Report. Nairobi: Government of Kenya. Government of Kenya, (2006) Micro and Small Enterprises Bill. Nairobi: Government Printer. Government of Kenya, (2008) Mid-term review of the Vision 2030. Nairobi, Government Printer.

C. Osa Ouma & C. M. Rambo | GJBR ♦ Vol. 7 ♦ No. 5 ♦ 2013
68
Helms, M. (1997) “Women and Entrepreneurship: The Appealing Alternative”. Business Perspectives. Vol. 10, No.1, pp. 16-19. Gale Group – Information Integrity. Hospes, K., Musinga, W.M. and Ong’ayo, W. (2002) An Evaluation of Micro-Finance Programs in Kenya. Amsterdam: SNV. Hossain, M. (1988) Credit for the Alleviation of Rural Poverty: The Grammen Bank in Bangladesh. IFPRI Research Report no. 65. Washington, DC: IFPRI. Khandker, S. (2003) “Microfinance and Poverty: Evidence Using Panel Data from Bangladesh”. World Bank Economic Review, Vol. 19 (2), p. 263-285. Kothari, R. C. (2004) Research Methodology: Methods and Technology, New Delhi. New Age International Limited Publishers. Mayoux, L. (1998a) Women’s Empowerment and Microcredit programs: Approaches, Evidence and Ways Forward. The Open University Working paper No. 41. Mbithi, M. and Mainga, J. (2006) Doing Business in Kenya Procedures and Regulations, Opportunities, Sources of Finance and Incentives: A Handbook for Local Investors. Nairobi: UNDP. Mitulla, W. (2003) Street Trade in Kenya the Contribution of Research in Policy Dialogue and Response. Nairobi: Institute of Development Studies, University of Nairobi. Morduch, J. (1999) “The Microfinance Promise.” Journal of Economic Literature, Vol. 37 (4), p.1569-1614. Mugenda, O.M. and Mugenda, A.G. (1999) Research Methods: Quantitative and Qualitative Approaches. Nairobi: Acts Press. Nachmias, C.F. and Nachmias, D. (1996) Research Methods in the Social Sciences, 5thEdition. London: Arnold NCAPD (2008) Kisumu District Strategic Plan 2008-2013 for Implementation of the National Population Policy for Sustainable Development. Nairobi: NCAPD. Odhiambo, M. (1985) “Women Finance Trust Working towards Economic Independence.” Viva Newspaper. Nairobi: Trend Publishers Ltd. pg. 26. Robinson, M. (2004) The Microfinance Revolution: Sustainable Finance for the Poor. Washington D.C.: World Bank. World Bank (1999) Mid -term review of the Poverty Alleviation and Microfinance project. Dhaka: World Bank. World Bank (2009) Doing Business in 2009: Removing Obstacles to Growth. Washington DC: World Bank, and Oxford University Press. Wright, G. (2000) Microfinance Systems. Dhaka: Dhaka University Press.
GLOBAL JOURNAL OF BUSINESS RESEARCH ♦ VOLUME 7 ♦ NUMBER 5 ♦ 2013
69
ACKNOWLEDGEMENT We acknowledge the support of our research assistants, including Tom Odhiambo and Isaiah Mwangi, who supported data collection and processing. We remain indebted to all women entrepreneurs for committing their time to provide the information. To all those supported in other ways, we thank you. BIOGRAPHY Clemencia Osa Ouma is a PhD student in Project Planning and Management at the University of Nairobi. She is reachable through Telephone Number, +254 020 318 262. Charles M. Rambo is a senior lecturer and coordinator of Postgraduate programs at the Department of Extra Mural Studies, University of Nairobi, Kenya. His academic interests include financial management, Small and Medium Enterprises, small-scale farming and education financing. His previous work appears in journals such as Journal of Continuing, Open and Distance Education, International Journal of Disaster Management and Risk Reduction and the Fountain: Journal of Education Research, African Journal of Business and Management, African Journal of Business and Economics. He is reachable at the University of Nairobi through Telephone Number, +254 020 318 262; Mobile numbers +254 0721 276 663 or + 254 0733 711 255; email addresses: [email protected] or [email protected]. Channel all correspondence regarding this article to Dr. Rambo.


GLOBAL JOURNAL OF BUSINESS RESEARCH ♦ VOLUME 7 ♦ NUMBER 5 ♦ 2013
71
THE IMPACT OF CREDIT UNION FINANCIAL INTERMEDIATION ON ECONOMIC GROWTH: A
MULTI-COUNTRY ANALYSIS Michael Adusei, Kwame Nkrumah University of Science and Technology
Samuel Kofi Afrane, Kwame Nkrumah University of Science and Technology Kumasi
ABSTRACT The paper investigates the relationship between credit union (CU) financial intermediation and economic growth using seventeen-year data (1995-2011) from 12 CU countries. Using the panel Generalized Method of Moments (GMM) estimation technique, the study finds that there is a statistically significant positive relationship between CU financial intermediation and economic growth. On the strength of this evidence, the paper concludes that CU financial intermediation has a positive impact on economic growth and thus recommends a vigorous promotion of CU financial intermediation in the study countries. JEL: G2, O1 KEYWORDS: Financial Intermediation, Credit Union, Economic Growth INTRODUCTION
he preponderance of empirical evidence on the finance-growth nexus triangulates around the contention that financial sector provides a fertile ground for the allocation of resources, better monitoring, fewer information asymmetries, and economic growth (Shen and Lee, 2006). Put more
succinctly, finance stimulates economic growth. The writings of Schumpeter (1911), Goldsmith (1969), Mckinnon (1973), and Shaw (1973) have contributed significantly to this view. Schumpeter (1911), for example, posits that a well-developed financial system has the potential of catalyzing technological innovation and economic growth through the provision of financial services and resources to those entrepreneurs who have the highest probability of successfully implementing innovative products and processes. Despite the fact that microfinance is an integral part of the financial systems of most economies, to date, studies on the finance-growth nexus have focused only on stock markets and the banking sector. ADB (2000) defines microfinance as the extension of a broad range of financial services such as loans, deposits, payment services, money transfers, and insurance to poor and low-income households and their microenterprises. It has been hailed as a ‘‘silver bullet’’ approach to development because of its supposed ability to transform the poor and marginalized (Aach, 2008). As part of microfinance institutions, credit unions (CUs) play the role of depository financial institutions, mobilizing savings and making credit available to mostly poor and financially excluded in society. Whether or not this intermediation role of CUs promotes economic growth, to the best knowledge of the authors, is yet to be explored. Consequently, the current study seeks to fill this gap in the literature by empirically addressing one question: Does CU financial intermediation promote economic growth? The remainder of the paper is sectionalized as follows. Section 2 reviews the relevant literature. Section 3 presents the research methodology employed followed by section 4 which presents the results of the study. Section 5 concludes the paper.
T
M. Adusei & S. Kofi Afrene | GJBR ♦ Vol. 7 ♦ No. 5 ♦ 2013
72
REVIEW OF LITERATURE It is now established that four causal relationships between financial development and economic growth are conceivable (Apergis et al., 2007). The first hypothesis, called supply-leading response hypothesis, argues that financial development causes economic growth (Schumpeter (1911), the McKinnon (1973) and Shaw (1973). The second hypothesis called demand-following response hypothesis posits that economic growth causes financial development. It argues that the development of the real sector stimulates demand for financial services that are passively met by the introduction of new financial institutions (Odhiambo, 2010). The third hypothesis is mutual impact which argues that there is a bi-directional causal relationship between finance and growth (Demetriades and Hussein, 1996; and Greenwood and Smith, 1997). The fourth hypothesis is no-causal relationship hypothesis which argues that there is no causal relationship between financial development and economic growth (Graff, 1999). Indubitably, there are some dimensions of the finance-growth nexus that have remained unresolved. One of such dimensions relates to the part of the financial sector that positively impacts growth. Shen and Lee (2006) provide evidence that only stock market development has positive effects on growth and that banking development has an unfavorable, if not negative, effect on growth. In tandem with this finding, Saci et al. (2009) provide evidence, based on a panel of annual data for 30 developing countries, that while the stock market variables in their model are positively and significantly related to growth, their presence in the model results in the standard banking sector variables (credit to the private sector and liquid liabilities) having negative effects on growth. However, Arestis et al. (2001) report that although both banks and stock markets may be able to promote economic growth, yet the effects of the former are more powerful. Demirhan et al. (2011) suggest that the development of stock market and banking sector causes economic growth, the contribution of the banking sector to economic growth has been larger than that of the stock market. It is obvious from the foregoing that so far the debate as to which part of the financial system impacts growth has centered on banking and stock markets. However, financial systems do not consist of only banking and stock markets. Microfinance institutions have become an integral part of financial systems. Worldwide, microfinance is regarded as a vehicle for extending financial services to the poor and financially excluded in society (Adusei and Appiah, 2011). It has evolved as a development tool intended to provide credit and financial services to the productive poor who do not have access to formal financial intermediation and are engaged in small and micro enterprises (Kyereboah-Coleman, 2007). Microfinance is capable of improving the well-being of poor women in developing countries (Vonderlack and Schreiner, 2001). There is no doubt that microfinance is an effective tool for development, and one that has been remarkably successful (Bowman, 2006). Three main modalities have been identified for microfinance delivery. These are the CU Approach, the Non-governmental Organization Approach and the Banking Approach (Montgomery and Weis, 2006). CUs are cooperative, not-for-profit depository institutions that serve a defined field of membership (Frame, et al., 2002). They are mutual organizations owned by their members, who are also their (principal) customers (Davis, 2007). Seibel (1989) identifies four (4) types of credit societies or unions in Africa. Rotating Savings Associations is one type of CU where each member pays a fixed amount of money at regular intervals. Then in rotating order, each member receives the total amount collected at a time. When each member has received the total amount at least once, the cycle terminates and a new cycle begins. Another type of CU involves each member paying a fixed amount at regular intervals. Part of the contribution is allocated to one member at a time in a rotating order whilst part is retained in a general fund which is used for loans, insurance, etc. Another type of CU which is called non-rotating association involves each member paying a fixed or variable amount at regular intervals. The contributions are deposited and paid back to the individual member at the end of a stipulated period. The
GLOBAL JOURNAL OF BUSINESS RESEARCH ♦ VOLUME 7 ♦ NUMBER 5 ♦ 2013
73
non-rotating savings and CUs is another type which involves each member paying a fixed or variable amount at regular intervals. The income of the association from sources such as contributions, fees, penalties is put into a fund, which may be utilized for loans, insurance and social services. Fairbairn et al. (1997) posit that the self-help ethos, which underpins CUs, make them an ideal vehicle in the fight against financial exclusion. According to Alexander (2000) by providing savings facilities and low-cost loans to people who otherwise might never get them, CUs offer stability. As a result, CUs have received significant support both at central and local government levels in the western world. For example, in Great Britain, at local government level, direct grant assistance is provided to support community-based CUs located in deprived wards, as they have been considered to be best placed to tackle financial exclusion (Ward and Mckillop, 2005). However, the question is, do CUs contribute to economic growth? RESEARCH METHODOLOGY Model and Data CU loans to savings ratio is used as proxy for CU financial intermediation (CFIN). As shown in Table 1, inflation (INFL); capital formation (gross domestic investment) as a share of GDP (CFORM) and credit to private sector as a share of GDP (CPS) are used as control variables. The use of the three control variables is empirically grounded. Inflation in our model measures the macroeconomic stability of the study countries (Shahbaz, 2009; Apergis et al., 2007). Capital formation affects economic growth (Ghosh and Phillips, 1998). Studies such as King and Levine (1993a), King and Levine (1993b) and Levine, et al (2000) have found a positive effect of private domestic credit on per capita GDP growth. Following Levine et al. (2000), Beck and Levine (2002); Rousseau and Wachtel (2000); Yao (2006); and Saci et al. (2009), the study utilizes panel Generalized Method of Moments (GMM) technique. GMM techniques control for unobserved country-specific effects, first-difference non-stationary variables, overcome the endogeneity of the explanatory variables by using instruments and test for the presence of autocorrelation (Saci et al.2009). Thus, they provide better results. We use the following cross-country growth regression: Yit = α + βXit + ηi+εit (1) Where y is the logarithm of real per capita GDP, X represents the set of explanatory variables, η is an unobserved country-specific effect, ε is the error term and the subscripts i and t represent country and time period, respectively. The dependent variable in Equation 1 is the real per capita GDP. We use lags of all the variables as instrumental variables. We use the natural logarithm of all variables because according to Sarel (1996), the log transformation eliminates, at least partially, any asymmetry in the data. Annual panel data from 12 CU countries covering the period of 1995-2011 have been purposively gathered from the World Development Indicators (WDI) (www.worldbank.org) and World Council of Credit Unions (www.woccu.org). The list of the study countries has been attached to the paper as Appendix A. The choice of a country has been based on the availability of data on all the variables defined in Table 1. ESTIMATION RESULTS Table 2 is the correlation matrix. It can be observed that the correlations are within acceptable limits (Bryman and Cramer, 1997). The adjusted R2 value of 0.75% reported in Table 3 indicates a strong fit.

M. Adusei & S. Kofi Afrene | GJBR ♦ Vol. 7 ♦ No. 5 ♦ 2013
74
Table 1: Definitions of Variables
Variable Definition Measure of Economic Growth GDP per capita (GDPPC) GDP per capita is gross domestic product divided by midyear
population. CU Financial Intermediation (CFIN) Loans to savings ratio Control Variables Inflation(INFL) The annual percentage change in the cost to the average consumer of
acquiring a basket of goods and services that may be fixed or changed at specified intervals.
Capital Formation (CFORM) Gross capital formation as a share of GDP Credit to private sector (CPS) Credit to private sector as a share of GDP
This table defines the variables that have been used Access to finance has been one of the priorities on the agenda of policy makers worldwide (Adusei and Appiah, 2012). Research indicates that access to finance promotes more start-ups (Klapper et al. 2006) and enables existing firms to attain a larger equilibrium size by enabling them to take advantage of growth and investment opportunities (Beck et al. 2006). In effect, access to finance and its productive utilization should promote economic growth. CU financial intermediation has been found to have a positive, statistically significant relationship with economic growth, suggesting that countries that promote the operations of CUs are likely to experience economic growth. This is understandable in the sense that the poor and financially excluded who are usually the patrons of CUs have productive ideas but lack funds to prosecute them. Thus, when CU operations become more pervasive and accessible, these productive ideas see materialization which promotes growth. Besides, the lending standards of CUs are usually pro-poor in character which enables the poor and financially excluded in society to access funds at affordable rates for economic activities. Indeed, studies have shown that people patronize microfinance institutions and for that matter CUs for a number of reasons: flexibility and adaptability of their services to the needs and work patterns of the rural and urban poor; lack of access to institutionalized banking because of small deposits and lack of collateral; the desire for confidentiality in financial transactions; and opportunities for individuals to save small amounts which can be accumulated as start up capital (Ofei, 2002; Turner, 1996). Table 2: Correlation Matrix
LGDPPC LCFIN LCFORM LINFL LCPS LGDPPC 1.000000 0.106946 0.064882 -0.092464 0.451797 LCFIN 0.106946 1.000000 -0.026511 0.089673 0.110508 LCFORM 0.064882 -0.026511 1.000000 0.097574 0.244862 LINFL -0.092464 0.089673 0.097574 1.000000 -0.203184 LCPS 0.451797 0.110508 0.244862 -0.203184 1.000000 Observations 204 204 204 204 204
This table presents correlations between variables. Capital formation has also been found to have positive, statistically significant relationship with growth. This is in line with the extant literature that as investment in capital goods increases growth is promoted. On the other hand, inflation has been found to have negative, statistically relationship with growth, suggesting that inflation has a distorting effect on growth in the study countries. This finding supports the position of the distortionist school of thought on the relationship between inflation and growth. The distortionist school of thought asserts that higher inflation undermines growth by distorting investment patterns and hampering propensities to save and invest (McKinnon; 1973; Johnson, 1967). McKinnon (1973), in particular, has long opined that money balances and capital goods are complementary (rather than substitutable) in developing countries. Thus, with the anticipation of higher inflation, money balances become less attractive to hold which discourages capital formation.
GLOBAL JOURNAL OF BUSINESS RESEARCH ♦ VOLUME 7 ♦ NUMBER 5 ♦ 2013
75
Contrary to studies such as King and Levine (1993a), King and Levine (1993b) and Levine et al. (2000) that have reported a positive effect of private domestic credit on growth, credit to private sector has been found to have a negative, but statistically insignificant relationship with economic growth. Table 3: Panel GMM Results
Dependent Variable: LGDPPC Variable
Coefficient Std. Error t-Statistic Prob.
C 4.584820 1.075287 4.263810 0.0000*** LCFIN 0.744208 0.456437 1.630471 0.1050* LCFORM 1.192784 0.382901 3.115123 0.0022** LINFL -0.444082 0.112233 -3.956783 0.0001*** L CPS -0.049712 0.108599 -0.457754 0.6478 R2 =0.79, Adjusted R2 =0.75, Durbin-Watson stat= 1.87
Instrument List: LGDPPC (-1), LCFIN (-1) LCFORM (-1) LINFL (-1) LCPS (-1) * Figures in parentheses are probability values. Note: ***, ** and * represent 1%, 5% and 10% levels of significance CONCLUSION The paper investigates the impact of CU financial intermediation on economic growth using seventeen-year panel data from 12 CU countries. The objective has been to ascertain whether countries that promote CU financial intermediation are likely to experience some economic growth. Using the panel GMM estimation technique which overcomes the shortfalls of the Ordinary Least Squares regression (OLS), the study finds that there is a statistically significant positive relationship between CU financial intermediation and economic growth. In line with the extant literature, the study also finds that more capital formation promotes economic growth in the study countries. Furthermore, our analysis lends credence to the contention that inflation distorts economic growth in the study countries. The study also finds that credit to the private sector distorts growth. However, this is statistically insignificant. On the strength of this evidence adduced above, the paper concludes that CU financial intermediation promotes economic growth and, therefore, recommends intensification of CU financial intermediation in the study countries. The main weakness of this paper is that it has relied on secondary data. Thus, the validity of its findings and conclusion is limited to the extent to which these data are valid. Another weakness of the paper, which could be an agenda for future research, is its inability to establish the direction of causality between CU financial intermediation and economic growth. Notwithstanding these weaknesses, the paper, without a shred of doubt, contributes to the growth literature by accentuating the significance of CUs to growth. Appendix A: List of Study Countries
Country Region 1. Kenya Africa 2. Uganda Africa 3. Bangladesh Asia 4. Indonesia Asia 5. Philippines Asia 6. Thailand Asia 7. Bolivia Latin America 8. Brazil Latin America 9. Peru Latin America 10. Honduras Latin America 11. Guatemala Latin America 12. Ukraine Europe

M. Adusei & S. Kofi Afrene | GJBR ♦ Vol. 7 ♦ No. 5 ♦ 2013
76
REFERENCES Aach, M (2008) “Microfinance as a Tool for Alleviating Poverty: Practice and Implications,”. Stanford Journal of Microfinance, 1(1). Retrieved from http://www.stanford.edu/ group/publicknowledge/cgibin/ojs/sjmjournal/index.php? ADB (2000) Finance for the poor: Microfinance Development Strategy. Manila: Asian Development Bank. Adusei, M. & Appiah, S (2011) Determinants of Group Lending in the Credit Union Industry in Ghana, Journal of African Business, 12, pp.238–251 Adusei, M. & Appiah, S (2012) Evidence on the Impact of the “Susu” Scheme in Ghana, Global Journal of Business Research, 6(2) pp. 1-10 Alexander, W (2000) “Scotland and Ireland in Child Poverty Link-up,” The Irish News, 21 January. Apergis, N., Filippidis, L. & Economidou, C (2007) “Financial Deepening and Economic Growth Linkages: A Panel Data Analysis,” Review of World Economics, 143 (1) pp.179-198 DOI: 10.1007/S10290-007-0102- Arestis, P.; Demetriades, P. O. & Luintel, K B (2001) “Financial Development and Economic Growth: The Role of Stock Markets,” Journal of Money, Credit and Banking, 33(1), pp. 16-41. Beck, T. & Levine, R (2002) “Stock Markets, Banks and Growth: Panel Evidence,” World Bank Working Paper Beck, T. Demirgu¨c¸-Kunt, A., Laeven, L., & Maksimovic, V (2006) “The Determinants of Financing Obstacles,” Journal of International Money and Finance, 25,pp.932-52 Bowman, C (2006) “The Economics of Microfinance, by Beatriz Armendáriz de Aghion and Jonathan Morduch,” Economic Record, 82, pp. 491–492. Bryman, A. & Cramer, D (1997) Quantitative Data Analysis with SPSS for Windows: A Guide for Social Scientists, London, Routledge. Davis, K (2007) “Australian Credit Unions and the Demutualization Agenda,” Annals of Public and Cooperative Economics, 78(2), pp. 277–300. Demetriades P.O. & Hussein K A (1996) Does Financial Development Cause Economic Growth? Time Series Evidence from 16 Countries, Journal of Development Economics, 51(2), pp. 87-411. Demirhan, E., Aydemir, O., & Inkaya, A (2011) “The Direction of Causality Between Financial Development and Economic Growth: Evidence from Turkey,” International Journal of Management, 28(1), pp.3-19. Fairbairn B., Ketilson L., & Krebs P (1997) Credit Unions and Community Economic Development,” Centre for the Study of Co-operatives, University of Saskatchewan, Canada. Frame, W.S.; Karels, G. V. & McClatchey, C (2002) The Effect of the Common Bond and Membership Expansion on Credit Union Risk, The Financial Review; 37, pp. 613-636

GLOBAL JOURNAL OF BUSINESS RESEARCH ♦ VOLUME 7 ♦ NUMBER 5 ♦ 2013
77
Ghosh, A. & Phillips, S (1998) “Warning: Inflation may be Harmful to Your Growth, IMF Staff Papers, 45(4), pp.672-710. Goldsmith, R W (1969) Financial Structure and Development, New Haven, CT: Yale University Press Graff, M (1999) Financial Development and Economic Growth: A New Empirical Analysis. Dresden discussion paper series in Economics, Nr. 5/99, Technische Universitat Dresden. Greenwood, J. & Smith, B (1997) “Financial Markets in Development and the Development of Financial Market,” Journal of Economic Dynamic and Control, 21(1), pp. 145-181. Johnson, H G (1967) "Is Inflation a Retarding Factor in Economic Growth?," in D. Krivine (ed.), Piscai and Monetary Problems In Developing States, Proceedings of the 3rd Rehovoth Conference, New York: Praeger Publishing Company. King, R. & Levine, R (1993a) “Finance and Growth: Schumpeter Might Be Right,” Quarterly Journal of Economics, 108(3), pp.717-737 King, R. & Levine, R (1993b) “Finance, Entrepreneurship, and Growth: Theory and Evidence.” Journal of Monetary Economics, 32, pp.513–542. Klapper, L., Laeven, L. & Rajan, R (2006) “Entry Regulation as Barrier to Entrepreneurship,” Journal of Financial Economics, 82, pp.591-629. Kyereboah-Coleman, A (2007) “The Impact of Capital Structure on the Performance of Microfinance Institutions,” Journal of Risk Finance, 8(1), pp.56-71. Levine, R., Loayza, N. & Beck, T (2000)“Financial Intermediation and Growth: Causality and Causes,” Journal of Monetary Economics, 46, pp.31–77. McKinnon R. I. (1973) Money and Capital in Economic Development, Washington DC: Brookings Institution. Montgomery, H. & Weiss, J (2006) “Modalities of Microfinance Delivery in Asia and Latin America: Lessons for China,” China & World Economy, 14(1), pp.30 – 43. Odhiambo, N M (2010) “Finance-Investment-Growth Nexus in South Africa: An ARDL-Bounds Testing Procedure,” Econ Change Restruct, 43, pp.205–219. Ofei, K A (2002) “Retooling Credit Unions: The Case of Credit Union Association of Ghana”. International Labour Organization, ISBN 92-2-112804-0 ISSN 1609-8382. Rousseau, P. L. & Wachtel, P (2000) “Equity Markets and Growth: Cross-country Evidence on Timing and Outcomes, 1980–1995,” Journal of Business and Finance, 24, pp.1933–57. Saci, K., Giorgioni, G. & Holden, K (2009) “Does Financial Development Affect Growth?” Applied Economics, 41, pp.1701–1707. Sarel, M (1996) Nonlinear Effects of Inflation on Economic Growth, IMF Staff Papers, International Monetary Fund 43, pp.199-215
M. Adusei & S. Kofi Afrene | GJBR ♦ Vol. 7 ♦ No. 5 ♦ 2013
78
Schumpeter J A (1911), The Theory of Economic Development, Cambridge, MA: Harvard University Press Seibel, H D (1989) Linking Formal and Informal Institutions in Africa and Asia, Proceedings of the International Conference on Micro enterprises in Developing Countries. London: IT Publications. Shahbaz, M A (2009) “Reassessment of Finance-Growth Nexus for Pakistan: Under the Investigation of FMOLS and DOLS Techniques,” The Icfai Journal of Applied Economics, 8(1), pp. 65-81. Shaw, E S (1973) Financial Deepening in Economic Development, New York: Oxford University Press. Shen, C. & Lee, C (2006) “Same Financial Development Yet Different Economic Growth—Why?” Journal of Money, Credit and Banking, 38(7), pp.1907-1944. Turner, W J (1996) “Credit Unions and Banks: Turning Problems into Opportunities in Personal Banking,” International Journal for Bank Marketing, 14/1, pp. 30-40 Vonderlack, R.M. & Schreiner, M (2001) Women, Microfinance, and Savings: Lessons and Proposals, Center for Social Development, United States of America Ward, A. & Mckillop, D G (2005) “An Investigation into the Link Between UK Credit Union Characteristics, Location and their Success,” Annals of Public and Cooperative Economics; 76(3), pp.461- 489\ Yao, S (2006) On Economic Growth, FDI and Exports in China,” Applied Economics, 38, pp.339–51. www.woccu.org www.worldbank.org BIOGRAPHY Michael Adusei is a lecturer in the Department of Accounting and Finance, School of Business, Kwame Nkrumah University of Science and Technology (KNUST), Ghana. He has publications in renowned journals including Journal of International Development, British Journal of Economics, Management and Trade, Journal of Money, Investment and Banking, Global Journal of Business Research and Journal of African Business. He reviews papers for a number of refereed journals including Applied Economics, Journal of African Business and The International Journal of Business and Finance Research. Email: [email protected]
Dr. Samuel Afrane is an Associate Professor of Development Planning. He is currently the Acting Provost of the College of Art and Social Sciences of KNUST. He was the former Dean of the Faculty of Planning and Land Economy of the College of Architecture and Planning. Prof. Afrane has considerable teaching, research, and consultancy experiences in Strategic Planning, Institutional Management, Urban and Housing Development, Microfinance, Project Monitoring and Evaluation. He reviews articles and papers for a number of refereed journals including, Journal of Applied Science and Technology, SPRING Journal, Journal of Science and Technology, etc. Email: [email protected]
GLOBAL JOURNAL OF BUSINESS RESEARCH ♦ VOLUME 7 ♦ NUMBER 5 ♦ 2013
79
E-GOVERNANCE IN ARAB COUNTRIES: STATUS AND CHALLENGES
Alaa-Aldin Abdul Rahim A. Al Athmay, University of Sharjah, Sharjah, United Arab Emirates
ABSTRACT The objective of E-governance is to support and simplify governance for government, citizens and businesses. The achievement of this goal depends on the cooperation of government as well as citizens and other stakeholders. This paper reviews data published by Division of Public Economics & Public Administration of the United Nations to assess Arab countries global ranking on two dimensions: Online Service Index (OSI) and E-participation Index (EPI) of e-governance. We analyze data obtained from semi-structured, face-to-face interviews with 60 participants on challenges faced by Arab countries. The data reveals discrepancies in performance among Arab countries on the two indices used in this study. On both indices, with exception of countries from GCC, including Bahrain, UAE, Saudi Arabia and Qatar, the performance of Arab countries is below the satisfactory level. The average OSI score is less than 0.3500 out of perfect score of 1.0000. On the e-participation index, with exception of a few countries such as Bahrain, Egypt and UAE, the average score is only 0.10 out of the maximum score of 1.0000. The low score in e-participation reflects a gap in the mindset of policy makers and stakeholders as well as the absence of effective application of the principles of good governance. The study further finds that different human, organizational and technical challenges faced by these countries require focused attention from policy makers to address. The interviewees identified the most critical factors affecting the likely adoption of good e-governance practices. JEL: H1, H4, H7 KEYWORDS: E-governance, Arab Countries INTRODUCTION
-government is an institutional approach which focuses on carrying out decisions related to the use of information and communication technology (ICT) and to transform relations with citizens, businesses and other parts of government. It represents a paradigm shift where governments and
policy makers realize the importance of e-government as a mechanism to serve both the governors and the governed. It uses internet technology to transform the traditional public sector by making it more accessible, transparent, effective and accountable. The end result of the adoption of e-government is to create a more satisfied picture of government business processes. E-government is not only putting a computer on the desk of bureaucrats, but also changes the mentality of bureaucrats and treats stakeholders whether they are recipients or providers of government services as a valued customers or an important participants in decision-making (Shakya & Sigdel, 2007). E-governance is a wider concept which reflects the relationships between government employees, elected or appointed, and the wider society. As interpreted by Heeks (2003), e-governance goes beyond the provision of simple service and builds an external interaction with diverse stakeholders of government. It creates a positive relationship between the governing and the governed to achieve governance objectives. Successful implementation of e-governance requires the movement from a passive information society to an active engagement of citizens. The strategic objective of e-governance is to create better information regimes, inform citizens, and engage citizens through emails lists, discussion forums, government consultation portals, and online
E

A. A. A. R. A. Al Athmay | GJBR ♦ Vol. 7 ♦ No. 5 ♦ 2013
80
mediation. Thus, the role of e-governance is to bridge the gap between the governed and the governors by enabling better informed and creating an empowered community. According to the UN (e-government survey, 2010), the most important elements of e-governance in developing countries include features such as accountability, transparency, participation, equity, promotion of the rule of law and decentralization. E-governance is intended to make public administration more transparent, speedy and accountable through addressing the society’s needs for information and services and enabling effective interaction between the people, businesses and government (Farooquie, 2011). To this end, governance in the majority of developing countries is a challenge, because the majority of governed are not clear and informed on various rules and procedures and because governors are not aware of the implications of the advancement in ICTs (Singh, 2010). While the definitions of e-government and e-governance overlap (UN Global E-Readiness Reports, 2005; Gartner Group, 2003; Adeyemo, 2011; Fraga, 2002), there is a significant differences between the two terms. E-government involves the adoption of ICT to enable the deployment of new channels of service delivery, and make interactions between public servants and citizens and civil society more convenient. E-governance is a wider concept which goes beyond the simple provision of services. It refers to the use of ICT by government institutions to transform relations with citizens, businesses, and various arms of government resulting in better delivery of services to citizens, improved interface with business and industry, citizens’ empowerment, and enabling greater transparency and accountability. The end product is creating more effective government (Singh, 2010). E-governance has similar objectives. Good governance strives to build a positive link with the wider environment (political, economic, and social systems) to better manage affairs of a country at all levels. E-governance involves the usage of ICTs at various levels of government and public sector organizations for the purpose of enhancing governance (Heeks, 2003; Bin Salamat, Bin Hassan & Bin Muhammad, 2011). E-governance comprises three basic elements: e-government, e-regulation and e-democracy (Adeyemo, 2011). The e-government as stated above refers to the use of information technologies for the purpose of providing better services, often in partnership with citizens, businesses and other public sector organizations. E-regulation refers to the establishment of participative electronic mechanisms for purposes of organizational development. E-democracy involves the use of electronic means to encourage public participation in decision making. This study examines the state of readiness among the Arab countries with particular reference to two basic elements of e-governance namely the Online Service index (OSI) and E-participation Index (EPI). The paper focuses on the term e-Governance development – i.e. how far governments of Arab countries have actually advanced in this field instead of how ready or able they might be to do so. The paper provides insight into the challenges of e-governance implementation in those countries. The paper is organized as follows: Section 2 provides the background and the context of e-government in Arab countries and its implementation. Section 3 introduces methods and data collection used to explore the status and the challenges that restrain the adoption of e-governance in Arab countries. Section 4 discusses the connection between e-governance and good governance. The results obtained are reported and discussed in section 5, and finally section 6 covers the conclusion and future research implications. LITERATURE REVIEW There is a paucity of research exploring E-Governance in Arab countries. Many authors point out a digital divide (Chatfield & Alhujran, 2009), and also underline various others impediments such as highly bureaucratic nature of government agencies and a rarely trained human resource (Al-Nuaim, 2008). Al-Nuaim (2009) also found that Arab municipal Web sites were not citizen centered, suffered from fundamental problems and had limited interactive services. Ciborra and Navarra (2005) examined the early design of e-government solutions in Jordan and found that implementing a general standardized ICT portfolio to support good governance proved to be a difficult task. Awan (2007) studied the government-

GLOBAL JOURNAL OF BUSINESS RESEARCH ♦ VOLUME 7 ♦ NUMBER 5 ♦ 2013
81
to-business (G2B) aspect of Dubai e-government and found that businesses often didn’t use e-government services for business transactions. One reason included slow online responses to business queries. Chatfield and Alhujran (2009) conducted a cross-country comparison of e-government websites and portals in 16 Arab countries. It was revealed that Arab countries lag behind more developed nations in terms of e-government service delivery capability. A wide digital divide was found among Arab countries in terms of advanced e-government services. Zaied, Khairalla, and Al-Rashed (2007) investigated the perceptions of towards the IT environment in public organizations in Kuwait and found that less than half of participants agreed that their organizations had adequate appropriate connectivity, infrastructure, and IT human skills to implement the e-government system. Belwal and Al-Zoubi (2008) assessed the public centric e-governance in Jordan and highlighted many impeding forces such as digital divide, corruption, social bottlenecks, lack of marketing to stakeholders and citizen’s lack of adoption of technology. E-governance is a way to describe links between government and its wider environment: political, social, and administrative. The most important utilities of e-governance in developing countries include features such as accountability, transparency, participation, equity, promotion of the rule of law and decentralization. To this end, e-governance in the majority of developing countries is a challenge, because a majority of those governed are not clear and informed on various rules and procedures and because governors are not aware of the implication of the advancement in ICTs (Singh, 2010). A case study on India, entitled “promoting e-governance through right to information”, Singh (2010, p 8) concluded that “E-government hype is not e-government reality…… the central lesson which emerges out of e-government practice for the last more than a decade is that public service delivery continues to be unsatisfactory…..and unrealized”. E-government is not merely the computerization of a government, but using technology to transfer the business of government to effect relations with businesses, citizens and other users of technology. The transformation of the nature of politics and the relationship require coordination and collaboration of all users of e-government project. Cecchini and Raina (2004) stated to establish service and information needs of the community, e-government should be developed in collaboration with local staff, including administrators and political actors. Ndou (2004) studied 15 case studies in e-government initiatives in developing countries and concluded that “ the ability of developing countries to reap the full benefits of e-government is limited and is largely hampered by the existence of many political, social and economic hindrances” (p.16). Gianluca, Alfano and Viscusi (2011) proposed and discussed an interpretative framework for assessing ICT-enabled governance with a specific focus on analyzing government openness. The authors attempted to find a link between ICT and governance and outline the various challenges that this poses. Despite the many e-government initiatives and projects that have been carried out for the past decade, the complexity and volume of resulting project outcomes represent a challenge for effective exploitation of the results in other initiatives and intervention contexts (p. 152). The study adds that cultural administrative tradition differences and cross-border and city level objectives influence the critical governance value drivers and characteristics of interoperability systems deployed. The e-government readiness index for two United Nations Surveys (2010, 2012) released by the Division of Public Economics & Public Administration of the United Nation, which included 191 countries, shows that most Arab countries have not fared well in e-government readiness. Only a few Arab countries from Gulf Cooperation Council are among the top 50 for the same period. This index is on a 0 to 1 scale, with higher values representing higher readiness. This index is an indicator of progress the UN member countries have made in implementing e-government services. This index is measured by several parameters including online service, telecommunication infrastructure & human capital components (UN E-government Survey 2012). This index can be viewed as a backbone for others indices associated with e-governance such as the Web Measure Index, Online Transactions Index, and E-participation Index. Table 1 show that the only Arab countries in the 2010 top 50 counties on the e-government index are

A. A. A. R. A. Al Athmay | GJBR ♦ Vol. 7 ♦ No. 5 ♦ 2013
82
Bahrain, United Arab Emirates and Kuwait. For the 2012 United Nations survey, two Arab countries moved achieved standing in the e-government index, namely Saudi Arabia and Qatar while Kuwait declined 13 positions to 65th. Table 1: E-government Readiness Index (2010, 2012): Top 50 Countries
Country Index 2010
Index 2012
Global Ranking Country
Index 2010
Index 2012
Global Ranking
2010 2012 2010 2012
Republic of Korea 0.8785 0.9283 1 1 Israel 0.6552 0.8100 26 16 USA 0.8510 0.8687 2 5 Hungary 0.6315 0.7201 27 31
Canada 0.8448 0.8430 3 11 Lithuania 0.6295 0.7333 28 29 UK 0.8147 0.8960 4 3 Slovenia 0.6242 0.7492 29 25
Netherlands 0.8097 0.9125 5 2 Malta 0.6129 0.7131 30 35 Norway 0.8020 0.8593 6 8 Columbia 0.6125 0.6572 31 43
Denmark 0.8772 0.8889 7 4 Malaysia 0.6101 0.6703 32 40 Australia 0.7863 0.8390 8 12 Czech Republic 0.6060 0.6491 33 46
Spain 0.7516 0.7770 9 23 Chile 0.6014 0.6769 34 39 France 0.7510 0.8635 10 6 Croatia 0.5858 0.7328 35 30
Singapore 0.7476 0.8474 11 10 Uruguay 0.5848 0.6315 36 50 Sweden 0.7474 0.8599 12 7 Latvia 0.5826 0.6604 37 42 Bahrain 0.7363 0.6946 13 36 Italy 0.5800 0.7190 38 32
New Zealand 0.7311 0.8381 14 13 Portugal 0..5787 0.7165 39 33 Germany 0.7309 0.8079 15 17 Barbados 0.5714 0.6566 40 44 Belgium 0.7225 0.7718 16 24 Greece 0.5708 0.6872 41 37
Japan 0.7152 0.8019 17 18 Cyprus 0.5705 0.6508 42 45 Switzerland 0.7136 0.8134 18 15 Slovakia 0.5639 0.6292 43 53
Finland 0.6967 0.8505 19 9 Bulgaria 0.5590 0.6132 44 60 Estonia 0.6965 0.7987 20 20 Poland 0.5582 0.6441 45 47 Ireland 0.6866 0.7149 21 34 Kazakhstan 0.5778 0.6844 46 38 Iceland 0.6697 0.7835 22 22 Romania 0.5479 0.6060 47 62
Liechtenstein 0.6694 0.8264 23 14 Argentina 0.5467 0.6228 48 56 Austria 0.6679 0.7840 24 21 UAE 0.5349 0.7344 49 28
Luxembourg 0.6672 0.8014 25 19 Kuwait 0.5290 0.5960 50 63 This table shows the E-government readiness Index for 2010 and 2012 for the top 50 ranked countries.
OBJECTIVES AND METHODOLOGY The present study reviews the status of Arab countries e-governance practices and highlights the challenges facing them toward full realization of e-governance. The study comprises two objectives: The first objective is to explore the status of E-government in Arab countries by using two indices of the United Nations e-government global surveys namely the OSI and e-participation index (EPI) to shed light on the state of readiness among the Arab countries to disseminate information and service delivery and encouraging citizen participation in the public policy process. These indices were assumed to capture the backbone of the e-governance practices. The study is based on secondary data released by United Nations global surveys for the years (2010 and 2012). Data on these two indices published by United Nations Department of Economic and Social Affairs/Division for Public Administration and Development Management, UNPAN/2005/14, New York are freely available at http://www.un.unpan.org/dpag/ The second objective is to explore areas of challenges which contributed to lack of e-governance practices in Arab countries. This study adopted a semi-structured face-to-face interview as the key tool for collecting primary data. Interviews were administered with two types of participants, 40 professional

GLOBAL JOURNAL OF BUSINESS RESEARCH ♦ VOLUME 7 ♦ NUMBER 5 ♦ 2013
83
expatriates, working in local universities and 20 adults from the fourth year classes of a local university. The participants are users of e-government services and the internet has constitutes the main part in their daily routine. Each interview lasted on an average of one and half hour. The data were collected over the period of six months during April through September, 2012. During the interview, detailed notes were taken. An interview protocol was developed by exploring challenges that affect the realization of good benefits of e-governance services in Arab countries, for example, the right of citizens to acquire information from government institutions and use them to make their government more effective, the level of awareness among them and the role of public sector marketing to enhance the level of understanding about e-governance benefits, and the perceived advantages of having such services. Based on extensive readings of the relevant literature including: Ndou, 2004; Bhatnagar, S., 2002; Heeks, 2003; Dada, 2006; Bwalya, 2009; Salem & Jarrar, 2011, the author synthesized some common challenges. INDEX RESULTS Online Service Index (OSI) The strategic objective of OSI is to measure the online presence of government national websites. It is intended to provide a government with a comparative ranking on its abilities to deliver e-services to the public and other sources of information such as policies, regulations, laws, reports and any downloadable databases deemed essential for good governance. Several models have been proposed to capture the evolution of e-government services (Benchmarking e-government, 2002; Matthias and Gaelle, 2003; Kaaya, 2004; Okot-Uma and Rogers 2004). In order to demonstrate the ability by which national Arab States provide online services and other information to their citizens, this study has adopted the four stages of e-government model of the United Nations e-government survey 2010. The four stages are: emerging presence; enhanced presence; transactional presence; and connected presence. The first stage is concerned with the provision of limited and basic information. The second stage provides greater public policy and governance sources of information. The third stage is allowing two-way interaction between government and the public. The fourth stage relate to forward and reverse integration with citizens, businesses and government to government. This surveys provides a comparative assessment of the performance and ranking of 192 United Nations Member States on how the public sector has responded to the demands of citizens and businesses for excellent services and products through the adoption of innovative tool such as ICTs (Kerby, 2008). To assess the online presence of national websites and to meet the growing needs of citizens and other stakeholders for different types of information and services, the author examined data on OSI. The United Nation e-government surveys 2010 and 2012 are used to show the progress made by Arab countries on this index. The highest score in this index is 1.0000. Countries which have achieved a perfect score of 1.0000 in 2010 and 2012 are USA, Republic of Korea and Singapore. Bahrain is the only Arab country in the top 20 in 2010 with score of 0.7302 and in 2012. Beside Bahrain two other Arab countries are added to the list of top 20, namely United Arab Emirates and Saudi Arabia whose scores respectively are 0.8627 and 0.7974. Others Arab countries which maintained a good standing on UN e-government survey 2012 compared to 2010 survey are Morocco, Qatar and Oman. The last two countries among top 50 in global rankings and scored respectively 0.7386 and 0.6667. Morocco improved its global ranking on OSI by 48 positions to achieve score of 0.5425 in 2012 compared to 0.2381 in 2010. Jordan was the largest loser in 2012 compared to 2010. Jordan scored 0.5333 in 2010 and was ranked 22nd in OSI globally and it slipped down to rank 100 in 2012 losing 78 positions. Table 2 reveals that the majority of Arab countries still lag globally in OSI and great efforts need to done for enhancing their national portals websites. For example, the performance of countries such as Lebanon, Jordan, and Tunisia on OSI is less than satisfactory and achieved scores 0.4771; 0.3922; and 0.4771 respectively. The OSI scores (see Table 2) of other Arab countries such as Mauritania, Somalia, Sudan,
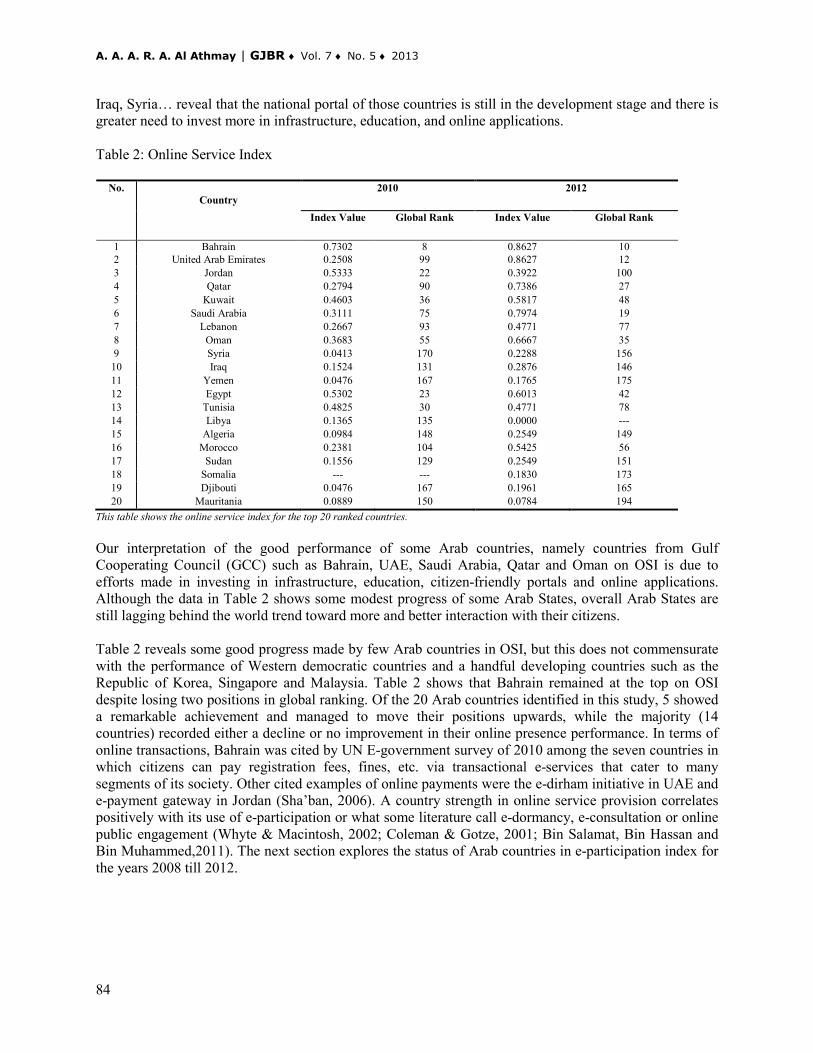
A. A. A. R. A. Al Athmay | GJBR ♦ Vol. 7 ♦ No. 5 ♦ 2013
84
Iraq, Syria… reveal that the national portal of those countries is still in the development stage and there is greater need to invest more in infrastructure, education, and online applications. Table 2: Online Service Index
No. Country
2010 2012
Index Value Global Rank Index Value Global Rank
1
Bahrain 0.7302 8 0.8627 10 2 United Arab Emirates 0.2508 99 0.8627 12 3 Jordan
0.5333 22 0.3922 100
4 Qatar 0.2794 90 0.7386 27 5 Kuwait 0.4603 36 0.5817 48 6 Saudi Arabia 0.3111 75 0.7974 19 7 Lebanon 0.2667 93 0.4771 77 8 Oman 0.3683 55 0.6667 35 9 Syria 0.0413 170 0.2288 156
10 Iraq 0.1524 131 0.2876 146 11 Yemen 0.0476 167 0.1765 175 12 Egypt 0.5302 23 0.6013 42 13 Tunisia 0.4825 30 0.4771 78 14 Libya 0.1365 135 0.0000 --- 15 Algeria 0.0984 148 0.2549 149 16 Morocco 0.2381 104 0.5425 56 17 Sudan 0.1556 129 0.2549 151 18 Somalia --- --- 0.1830 173 19 Djibouti 0.0476 167 0.1961 165 20 Mauritania 0.0889 150 0.0784 194
This table shows the online service index for the top 20 ranked countries. Our interpretation of the good performance of some Arab countries, namely countries from Gulf Cooperating Council (GCC) such as Bahrain, UAE, Saudi Arabia, Qatar and Oman on OSI is due to efforts made in investing in infrastructure, education, citizen-friendly portals and online applications. Although the data in Table 2 shows some modest progress of some Arab States, overall Arab States are still lagging behind the world trend toward more and better interaction with their citizens. Table 2 reveals some good progress made by few Arab countries in OSI, but this does not commensurate with the performance of Western democratic countries and a handful developing countries such as the Republic of Korea, Singapore and Malaysia. Table 2 shows that Bahrain remained at the top on OSI despite losing two positions in global ranking. Of the 20 Arab countries identified in this study, 5 showed a remarkable achievement and managed to move their positions upwards, while the majority (14 countries) recorded either a decline or no improvement in their online presence performance. In terms of online transactions, Bahrain was cited by UN E-government survey of 2010 among the seven countries in which citizens can pay registration fees, fines, etc. via transactional e-services that cater to many segments of its society. Other cited examples of online payments were the e-dirham initiative in UAE and e-payment gateway in Jordan (Sha’ban, 2006). A country strength in online service provision correlates positively with its use of e-participation or what some literature call e-dormancy, e-consultation or online public engagement (Whyte & Macintosh, 2002; Coleman & Gotze, 2001; Bin Salamat, Bin Hassan and Bin Muhammed,2011). The next section explores the status of Arab countries in e-participation index for the years 2008 till 2012.

GLOBAL JOURNAL OF BUSINESS RESEARCH ♦ VOLUME 7 ♦ NUMBER 5 ♦ 2013
85
E – Participation Index (EPI) E-participation opens the gate toward knowledge sharing attitude on the part of government employees and greater involvement of the citizens, businesses and other civil society organization in government affairs. E-participation opens the opportunity for all stakeholders to assess the quality of the connected presence stage of e-government. E-participation is meant to assess the quality, usefulness and relevancy of the information and the willingness of governments to involve citizens in public policy making process. It is not only to locate service centers and to carry out decisions related to service provisions but to simplify governance for government, citizens and businesses. While the online service index assesses the availability of information and services to the public, e-participation measures the usefulness of these services to fulfill the public’s needs and expectations and to facilitate a speedy, transparent and accountable government administration. E-participation index contains three benchmarks, namely E-information, E-consultation, and E-decision making. Taken together, these benchmarks measure the degree of the country strength in e-participation. E-information measures the extent to which national governments provide information on the internet to be used as the basis of citizens’ participation. E-consultation is the back and forth interaction between the government and its citizens. The focus is on the stakeholder interaction. E-decision making provides evidence of real changes in public policies as resulted from citizens’ inputs and feedback (Kerby, 2008; Adeyemo, 2011). This section uses the UN e-participation index for the three years: 2008, 2010 and 2012 as an important and valuable means to provide an overview of the current performance of Arab countries in e-participation. Breakdown of data on each component of e-participation are only available for selected, primarily western, countries. Therefore, data on e-participation is shown only as a single score in the e-participation index. The author uses UN, EPI (E-Participation Index) for the above period to gauge the best performing Arab countries on this index with the reference to the best practices found in other countries. Table 3 shows the performance of Arab countries on EPI for the years 2012, 2010 and 2008. The highest value of EPI is 1.0000, earned by Netherlands in 2012 and the top 20 are from Western countries and two Arab countries: UAE and Egypt. By looking across the data in Table 3, we note there is steady progress of some Arab countries on e-participation in 2012 compared to 2008 and 2010. Countries such as UAE, Bahrain, Saudi Arabia, Qatar, Oman, Egypt, Tunisia, and Morocco have maintained good standing on global basis. For example, the index value of Arab States within the GCC sub region on e-participation range between 0.4474 (Oman) to 0.7368 (UAE) indicating that the quality of information deployed by those countries are useful compared to other Arab States. In 2012, Saudi Arabia, Qatar, UAE, and Oman appeared to be winners in EPI among the rest of Arab countries surveyed in global rankings. They improve their global ranking by 79, 64, 62, and 39 positions respectively compared to 2010. Countries Such as Jordan and Kuwait suffered declines on EPI losing 71 and 37 positions respectively. As can be seen in Table 3, about 65% of the Arab countries surveyed in this study had scores in the range between 0.00 and 0.20 in 2010 and 2012. In 2008, the highest score in EPI was recorded by countries such as Jordan, Lebanon, and Egypt. In 2008 and 2010 almost all Arab States were showing a poor EPI scores. This poor showing could be attributed to lack of incorporating online services tools to promote an acceptable level of participation and engagement of their citizens in the public policy process (See Table 3). The number of the Arab countries in the range 0.20 – 0.29 has dropped by 7 countries in 2010 compared to 2008. In 2012 more than 50% of Arab countries achieved scores ranging from 0.0000 to less than 0.2000. The data in Table 3 reveals that performance of some countries on EPI such as UAE, Saudi Arabia, Qatar, Egypt and Morocco have improved. The performance scores of other countries such as Jordan, Lebanon and Kuwait have fluctuated. The remaining Arab States have shown no improvement on the index value of e-participation.

A. A. A. R. A. Al Athmay | GJBR ♦ Vol. 7 ♦ No. 5 ♦ 2013
86
Eight Arab countries show strong performance for the year 2012 compared to 2010 are 8. For example countries such as Saudi Arabia, UAE, Morocco and Qatar have shown an outstanding jump and have climbed 79 positions in the case of Saudi and 37 positions in the case of Egypt. Those four countries beside Bahrain and Oman are in the top six performers for the same period. Among the aforementioned countries, the most attractive-attention performance came from Saudi Arabia by rising 79 positions from 102nd place in 2010 to 23rd place in 2012, followed by UAE which climbed 64 positions from 86th place in 2010 to 14th in 2012. The fluctuation in performance on EPI for some countries such as Jordan, Lebanon, Kuwait, and Tunisia and continuing decline for others such Yemen, Algeria, Iraq, Syria, Sudan…etc can be attributed to so many factors such as funds issue, lack of openness, the bureaucratic nature of government institutions, lack of awareness, lack of trust in the national Website Portal, administrative cultures, absence of check and balance among the three branches of the political system, and rules and procedures defined in the constitution becoming an obstacle in the path of full interaction between the governed (citizens, businesses) and the government. Table 3: E-participation Index in Arab Countries
No. Country
2008 2010 2012
Index Value
Global Rank
Index Value
Global Rank
Index Value
Global Rank
1 UAE 0.2955 41 0.1286 86 0.7368 14 2 Bahrain 0.3409 36 0.6714 11 0.6579 21 3 Jordan 0.5455 15 0.2857 42 0.1053 103 4 Qatar 0.1818 71 0.1286 86 0.6316 22 5 Kuwait 0.0682 116 0.2286 53 0.1842 90 6 Saudi Arabia 0.3182 38 0.1000 102 0.6316 23 7 Lebanon 0.4091 28 0.2714 45 0.3158 49 8 Oman 0.2045 60 0.1571 76 0.4474 37 9 Syria 0.0455 135 0.0143 157 0.0263 153
10 Iraq 0.2045 60 0.0429 135 0.1053 106 11 Yemen 0.0000 170 0.0429 135 0.0000 193 12 Egypt 0.2500 49 0.2857 42 0.6842 15 13 Tunisia 0.0227 152 0.3000 39 0.3684 44 14 Libya 0.2045 60 0.1714 68 0.0000 176 15 Algeria 0.0227 152 0.0143 157 0.0526 122 16 Morocco 0.0000 170 0.1286 86 0.3947 39 17 Sudan 0.2045 60 0.1000 102 0.0789 121 18 Somalia 0.0000 170 --- --- 0.0789 120 19 Djibouti 0.0227 152 0.0286 141 0.0000 168 20 Mauritania 0.1136 87 0.1143 97 0.0000 180
This table shows the e-participation index for Arab countries. With the exception of a few countries noticed above, the global United Nation reports of 2008, 2010, and 2012 indicate the majority of Arab countries show a static to low achievement in EPI. In 2008, the top 5 Arab countries (Bahrain, UAE, Jordan, Lebanon and Saudi Arabia) achieved on average 0.3818 on EPI while the remaining 15 countries achieved an average score of 0.0757. The highest score in EPI was 0.12. The average score in 2010 of more than 65% of Arab Countries was only 0.10. In 2012, the top 5 countries for EPI are UAE, Bahrain, Qatar, Saudi Arabia and Egypt. They show good improvements on EPI and achieved an average of 0.6684. The next top 5 countries (Oman, Lebanon, Morocco, Tunisia, and Kuwait) achieved an average score of 0.2526. The remaining 10 Arab states achieved an average of 0.0341 on EPI. These data on EPI could be interpreted to indicate a lack of online consultation and citizens’ feedback on decision-making in most of Arab countries has contributed to their low scores in e-
GLOBAL JOURNAL OF BUSINESS RESEARCH ♦ VOLUME 7 ♦ NUMBER 5 ♦ 2013
87
participation. In addition, a low level of trust between employees of government and citizens create a negative perception of sharing knowledge and information and confidence in e-governance initiative. INTERVIEW RESULTS E-Governance Challenges
This section examines the challenges that are likely to influence the adoption of e-governance in Arab countries. The specific aim of this section is to gain insight into the factors that affect the adoption of e-governance services in these states. It is expected that the findings will help policy makers gain a better understanding of the citizens and businesses involvement in supporting and simplifying good governance through using the ICT as a medium of connection and thus enabling them legislate laws and regulations to promote an active participation of citizens and businesses in the political process. The following challenges are the result of the extensive face-to-face interview with participants of this study: First is the Lack of Access to Government Information: Public access to information is now a universally recognized right. In developed nations, this right to information is the basic element to realize the goal of transparent government. Transparent governance is build around the notion for free debate and accountability that encourage citizens to engage with public officials and to make the state a more effective (Murad, 2010). It is the right established by legislation to grant everyone a freedom of opinion and expression by using internet technology as a tool of governance. When asked about their knowledge of law or mandate which requires public agencies to provide whatever information demanded by the public, “the majority of interviewees, about 73% show no awareness of such law”. The researcher has shared and discussed with the interviewees the secondary data shown above in the tables and whether these data has any meaning to them. “Most agreed that most Arab countries have taken steps to put information on the types of services provided to the public but some other information which is vital to the citizens and other stakeholders do not exist in the national websites”. Only information which does not create any harm to the concerned authority is found. They contend that the discretion to release or withhold information usually is not based on reasonable grounds. Arab governments, “according to most interviewers operate as a closed bureaucracy”. Information is created by an agency, put in place by the generating ministry/department, classified as secret and held by the ministry/department which created it. The public’s access to this information is determined by the creating agency. The high centralization of the governments’ bureaucracy and the pressure to avoid making any errors by following rules and procedures are major factors which contribute to the secrecy and confidentiality of information.
The second issue is awareness and public sector marketing. Connected with right of the public to access to information is the lack of awareness and role of public sector marketing. Few interviewees show disagreement toward this challenge, while the majority agreed there is acute lack of awareness among the public about their role as an opinion providers and valuable participant in decision making process. The few Arab countries which offer citizens various channels to engage in policy masking are Bahrain, UAE, and Tunisia, and Saudi Arabia (Moore, 2011). UAE and Bahrain have developed and launched recently, Government 2.0 which encourages the utilization of participatory technologies or social marketing in governance (Moore, 2011). Our interpretation to this lack of awareness and disappointing involvement of the citizens in decision making are attributed to the imbalance in power between the executive and legislative body and between the government and their citizens. Despite the growing internet penetration rates among the young in Arab countries (Moore, 2011), but our interpretation to lack of citizens’ awareness of their roles in better governance might be attributed to apathy factor or some other political and social factors. For example, “Some Arab countries have undertaken steps to put information and data concerning the organization of exhibitions, conferences, seminars, and press interview. However, the majority of interviewees about 83% complained about a lack

A. A. A. R. A. Al Athmay | GJBR ♦ Vol. 7 ♦ No. 5 ♦ 2013
88
of awareness of the meaning of e-governance”. They further blamed their governments for not appropriating enough advertisement budget for this purpose and the absence role of the public sector marketing. According to one interviewee, “There is no awareness of such terms such as transparency, empowerment, and right to acquire electronic information from government. If you ask individuals on the street about these terms, they likely have not heard of them or even understand their meaning”. Abdulrahman Saif Al Khaddar, Head of online Services Section attributed this low level to lack of awareness among the users of online services, the low level of trust in government information and low advertisement budget for promoting the online services (Salem & Jarrar, 2010;UAEINteract, 29 May 2008).
The third issue is lack of coordination and collaboration within and between governments of Arab countries. The customer focus is an essential element of any e-government project. When developing and designing, and implementing an e-government, governments should consider citizens and businesses needs of information and why they need this information. Information should be classified based on themes not institutional fashion. When interviewees were asked about this issue, “they all agree that customer needs for information are incorporated in e-government strategy but are not found in reality”. The main reason for such negligence of customers needs is “the absence of coordination and collaboration within the government and between governments”. When interviewees are asked about whether there is a necessity to establish a central coordinated office to facilitate such needs, “the majority agreed that the creation of such a unit can facilitate promoting sharing of information and good practices. The majority further contended there is absence of clear plan for the coordinated implementation of e-governance services within each country and between countries. This creates difficulty in interoperability, vast duplication of efforts, and concern about security and privacy issues of information. Interviewees contended that uniform standards and architecture for e-government applications is almost absent and even if present, is not practiced. Thus, to build electronic services and cater to customers’ needs, cross agencies and governments coordination and collaboration is needed for better service to the customers and to achieve efficiency and interoperability in government.
The fourth challenge mentioned by interviewers is the nonexistence of critical evaluation of an e-government plan in the majority of Arab countries. As we know, the purpose of e-government is sharing knowledge, information and building confidence in e-government projects. Evaluation of e-government plans means taking measures to respond to customers’ demand for e-government services and therefore, governments should work closely with citizens and businesses to provide them with useful services and information. The majority of interviewers (90%) noted the absence of critical examination of the present state of any e-government strategy. The majority of interviewees noted that critical assessment of any public sector program, including e-government is seldom done and usually is found in government documents but not practiced. Factors such as the lack of competent personnel, the unavailability of current data, the absence of customers’ feedback and inputs, and less value given to evaluation outcomes are some reasons cited by interviewees for the absence of critical evaluation. Interviewees added additional reasons for improper assessment of e-government projects. Governments in Arab countries, with exception of some countries within the GCC region, there is absence of external assessment of the project, no considerations were given to stakeholders needs and feedback, assessment is done as part of some mandatory requirement and once it is completed is shelved and forgotten, and agencies usually perform assessment just to show an interest in keeping the project by showing a positive outcome. Thus, proper assessment of e-government can boost the learning process by showing the kind of changes needed to be successful (Cupta, 2007). They indicate that in most of Arab countries e-governance means computerizing existing government functions and there is a total absence for the appreciation of the information systems in streamlining the government process and molding the mindset of key politicians, ICT professional and mainstream staff

GLOBAL JOURNAL OF BUSINESS RESEARCH ♦ VOLUME 7 ♦ NUMBER 5 ♦ 2013
89
Fifth, the adoption of e-government in both developed and developing countries is often heralded as new way of bringing a structural change in the system of public sector. The success of e-government initiatives depends to a large extent on the match between internal organizational factors and external factors. If there is a match between the two environments, this form of initiative could lead to successful attainment of e-government goals in terms of better transformation of the internal operations of government as well as of fruitful interaction with civil society (Dada, 2006; Noor, AbdelRahman, Fadlalla, 2007). Literature on e-government adoption in developing countries in general and specifically in Arab countries cite frustrating stories of systems failure. The incompatibility between social, political, and economic values and e-government goals, the continuing traditional bureaucratic nature of public sector, the existing of detailed rules and procedures, lack of clarification on what is required from government agencies responsible for implementing e-government, not treating citizens as a single customer, the traditional way of responding to citizens complaints, are some factors which contribute to the failure of e-government initiatives in Arab countries. The United Nations Department and social affairs (UNDESA) estimated that more than 70% of e-government projects in developing countries fail for the same reasons noted above (Salem, 2006). The majority of interviewees were optimistic about the promised change in term of reducing bureaucracy. A typical response was this new line of channels will be open between bureaucrats of government and the public and the traditional rules, procedures and processes which unnecessarily complicated government services will replaced with an open-oriented and result-based bureaucracy.”
About 88% of the interviewees expressed negative perception towards government bureaucracy in Arab countries. They indicate most e-government users still involve unnecessarily detailed and complicated procedures when completing government transactions. Interviewees raised concerns that employees in government bureaucracy still follow routine processes and use plenty of paperwork in delivering services to the public. Barriers to e-government are not only structural and procedural but also include value barriers of public administrators. The majority of interviewees are skeptical that e-government adoption in Arab countries would bring radical change such as speedy services and efficient processes. While leaders of Arab countries might be aware of the importance of restructuring organizations and processes in order to maximize value to users, they must overcome internal resistance when implementing change. Using proper incentive systems and other organizational carrots such recognition, active participation and more progressive appraisal systems might ensure good co-ordination and promote a sense of ownership and accountability for decentralized initiatives.
Because there is a high level of bureaucratization in most Arab countries, one would expect a limited role of e-government in providing information to stakeholders (Noor,AbdelRahman, Fadlalla, 2008; Al-Nuaim, 2008). Interviewees described government bureaucracy in Arab countries as rule-driven, centralized, top-driven hierarchy and oriented only to a cost-efficient objective. Being aware of these traditional cultural values is a big step towards successful organizational change (Ndou, 2004). The interviewee perceptions are consistent with findings of some literature which suggest that ICT has been used most often to reinforce existing organizational arrangements and power distributions rather than to change them (Holden, 2003; Fountain, 2002; Kraemer & King, 2005). Under this kind of environment, bureaucracy will be replicated in the government national portal and the bureaucracy will grasp a new hat with a different name.
The sixth issue is infrastructure and Technical Issues: Facilitating conditions such as ICT infrastructure such as e-readiness, computer literacy, and telecommunication equipment can be an important determinant of e-government use and adoption (Barua, 2012). The technical issue refers to the functioning of the organizational networks to allow citizens and businesses the possibility to search and use of information to consult, participate in forums and decision-making process (Ndou,2004). Shared, proper ICT infrastructure and a good interoperability governance system cannot materialize without

A. A. A. R. A. Al Athmay | GJBR ♦ Vol. 7 ♦ No. 5 ♦ 2013
90
collaboration between the various stakeholders (Government agencies, citizens, businesses, employees and governments). The lack of adequate ICT infrastructure, the poor integration of the back-office information system with the online access to customers, and the continuation of a legacy systems are some among other barriers shared by the majority of interviewees. The lack of knowledge and skills required for successful e-government implementation, the malfunctioning of network, and server and the lack of collaboration are some key barriers which contribute to the stagnations of most Arab countries (with exception of some countries within the GCC such as UAE, Bahrain and Qatar) in the emerging and enhance stages of online presence. ICT infrastructure and internet penetration vary across the Arab world, with GCC generally being more advanced compared to the rest of Arab world (Moore, 2011). The majority of interviewees (85%) casted doubt on the abilities of government institutions to successfully design, develop and implement their own e-government initiatives. To realize the potential benefits from technology, Arab countries should first demonstrate good practices of good governance before start any move toward a higher level of Web-enabled citizen participation in public policy discourse. According to one interviewee, governments in Arab countries are far behind a normative framework of good governance. Lack of stable politics, unclear macro-economic policy, dominance of personalized leadership and the marginalization of legislative and judicial branches are among obstacles cited for full realization of e-governance goals such as better service delivery, ushering in transparency & accountability, empowering people through information, improved efficiency within governments and enhancing interaction with business and non-profit organizations (Singh, 2010). Recent events demonstrate the challenge facing some Arab countries in governance and e-governance. Recent riots in some Arab countries demonstrate that the public is far from active engaged in policy formulation and decision making processes. There is a need for most Arab countries to adopt government 2.0 which can help those countries supplant the traditional role of governments to one which fosters better collaboration between governments and citizens, enhancing citizens’ engagement in public policy making and lifting the status of governance into a new platform of e-participation (Moore, 2011). Few Arab countries utilize e-participation as integral part of e-government encouraging a transparent and an open public administration systems. According to A. Fadi Salem, the Director of the Governance and Innovation Program at Dubai School of Government, only two countries namely, Bahrain and UAE are utilizing participatory technologies or social networking in governance.
Seventh is the lack of back-office capability in most Arab public sector organizations. Most interviewees agreed that a lack of back-office competency remains a big hurdle toward modernizing public administration and adopting an effective e-governance system. Most senior officers whether elected or appointed members of parliaments do not possess the required merit to make them appreciate the essential benefits of e-government adoption. Most are hired based on favoritisms, social and personal networks. This problem created a gap of knowledge between senior officers, IT professionals and mainstream users of technology. This renders the whole of governance practices weak and ineffective (based on interview). The support of back-office and creation of agile and adaptable workforces were recognized as a precondition for developing online services and e-participation (Sardi & Mlikota, 2002; Janowski, 2005). Examining the design of e-government solutions in Kuwait, Zaied, Khairlla & Al-Rashed cited lack of the necessary IT skills among other obstacles in implementing effective e-government system. Finding a common understanding of e-governance requirements between the front-Office and back-office would help the latter respond efficiently to the needs of the public and other stakeholders and to make the job easy for the former to addressing key changes required for effective implementation of e-government. For example some such changes are: integrated human resources and payroll system, integrated financial management systems, web-based data resources to improve decision making and intranet system to improve information flows within governmental institutions. Al-Hiram reported the slow pace of e-government transformation (UAEInteract, 2009) “…. With the exception of high performing nations, on average less than 50 per cent of all internet users access eGovernment data and less than 20 per cent

GLOBAL JOURNAL OF BUSINESS RESEARCH ♦ VOLUME 7 ♦ NUMBER 5 ♦ 2013
91
undertake online transactions…..” Such slow pace can also be inferred in Humaidan’s statement that “…. We aim to include more government departments and agencies in Dubai and achieve integration in the delivery of services through a unified platform, which we believe will contribute significantly to realizing the Dubai Strategic Plan 2015.” This is a problem that can and must be addressed, in our view, by extensive skilling of public sector marketing in the UAE in particular and the region at large. The eighth issue is stakeholders involvement. E-government projects should be established to reflect the needs of stakeholders (Staff, public managers, business community, citizens) that it serving and technology should be developed through active involvement of those affected by these projects. In Arab countries, according to most interviewees(77%), such culture does not exist. If it exists, it does not give the required weight due to political and economic factors. In most Arab countries, decisions to adopt e-government initiative are taken without consideration to the adaptation to local realities (based on Interview). The absence of collaboration with local community and others who are closely related to the e-government project increase the hard-soft gap and reduce sense of ownership and awareness of the implemented project. Information, according to interviewees, is stored in the websites by the government institutions and the bulk of the decisions affecting citizens’ life are made by such institutions far beyond citizens’ influence and involvement (based on Interview). Information systems should be designed within the context of the law to make top-level decision-making processes rely on the online environment and to leave space to change these systems in years later. Thus, it is important to involve the people most closely related to e-government projects by improving local awareness and taking an active role of educating the public about the value of e-government project (Ciboora, 2005; Jaeger and Thompson, 2003)
The ninth issue is whether in a developed or developing country, e-government should viewed as a supplementary tool to governance. E-government projects involve long-term commitment and require collaboration across agencies. The instability of political systems and change in economic circumstances in some Arab countries (Salem, 2006) and the high competitive environment in other countries, might contribute to the lack meritocracy and the level of trust for sharing information and knowledge (Salem & Jarrar (2010). More than 80% of interviewees agreed that most government employees perceive information and skills in ICT as a source of power. The others agreed and shared challenge among the interviewees to e-governance practices is the lack of trust in a national online portal of government. In most Arab countries, e-government focused only on providing limited online interaction and citizens and businesses have little trust of online services (based on Interview). Interviewees casted trust in the internet of some Arab countries such as those located within GCC region due to advanced and capable security solutions. For the rest of Arab countries, interviewees have thought that e-government services is not trusted for reasons such as instability of political and economic systems and the absence of legislations protecting the personal data provided by the citizens and businesses. The study conducted by Al-Nuaim (2009) found that Arab municipal Web sites were not citizen centered, suffered from fundamental problems and had limited interactive services Other factors that have been attributed to low trust in utilization of e-government services for business transactions might be attributed to the ignorance of governments’ leaders to their responsibility about what e-government is and what its benefits to community. Concerns such as data quality, security, slow operational processes, and complicated procedures are other factors which highlighted among the interviewees for low trust between government and the public. These findings are consistent with Ranaivomanana (2006) and Al Awadhi & morris (2009). Engaging the public and others beneficiaries of e-government project in public policy issues requires educating both government employees and the stakeholders’ users of e-government systems (Lin et al., 2001). The tenth issues is agreed upon challenges facing e-government in Arab countries. Interviewees agreed on the issue of the failure to create the right culture within the organization. Intranet, internet and sharing information represents a direct challenge in most of Arab countries where prevailing bureaucratic culture

A. A. A. R. A. Al Athmay | GJBR ♦ Vol. 7 ♦ No. 5 ♦ 2013
92
remains an obstacle toward sharing information. According to most interviewees, “the right attitudes to service orientation and adaptability to change do not exist in most of Arab countries”. More than 75% of interviewees said that the culture of information and knowledge sharing does not exist. When asked about factors that contributed to this problem, they said in Arab countries such Iraq, Sudan, Yemen, Syria, Algeria…etc, inadequate human resource capacity is a major problem to the lack of customer-orientation. For countries located within the GCC, the main problem is that the prevailing competitive environment might negatively impact the flow and sharing of information and knowledge. ICT as distinguished by its network could provide vast opportunities internally among different units with organizations and between organizations and externally of enhancing the transparency and accountability for governments in Arab countries. These findings are similar to those of Ranaivomanana (2006) and Salem and Jarrar (2010). The other challenge which associated with management change is the employee resistance to change. Although this phenomenon is felt by many countries it needs careful attention in Arab countries. In most Arab countries, the public sector remains the largest employer and change might bring fearless for job losses and power reduction for employees. Active participation of staff at the developmental stages of IT deployment, active demonstration of the potential benefits of ICT system and creating incentives for employees to learn and accept change are among other strategies for dealing successfully with resistance. The adoption of e-government raises the expected roles and responsibilities of the officials in responding to enquiries from the citizens. Based on interviews, employees are still not ready to assume the new tasks and are not computer literate. The existence of traditional technological illiteracy in most developing countries makes it hard for people to interact with changes needed in an information society (Nagi 2009). Resistance to change or the full implementation of e-government is attributed to cultural and religious aspects, according to some interviewees. Computer illiterate see the technology as black art while those who are computer literate are guarded and speak another language. Therefore, understanding organizational culture is crucial to having a practical change management plan. These findings are in consistent Salem & Jarrar, 2010; Dada, 2006 ; Ciborra, 2005; Al Awadhi & Morris, 2009). Lack of e-participation represents another issue. E-participation is build around the concept of transparency and both concepts contribute to the objective of good governance. The strategic objective is to support and simplify governance for stakeholders (government, government employees, citizens and businesses). To conduct their business with government, all stakeholders use online services as an alternative way to traditional approaches such as calling the officials or meeting them on face-to-face basis. The culture in Arab countries is characterized is collective and people highly value face-to-face relationships and most of their daily matters are solve through this traditional conduct. When asked whether they prefer using emails or traditional communication such as telephone or face-to-face interaction, the majority, about 92%, said we use the traditional way. Interviewees said the majority of government employees use email and internet in their official duties but the tradition here is that people who use emails and internet do not use them to have an impact on public policy but rather to gather information to serve their own interest and satisfy their needs of information. Comments and proposals made as part of e-participation do not exist in Arab countries, as commented by some interviewees. Responding to citizens comments and complaints through emails is uncommon in Arab countries (based on Interview). Respondents said in Arab countries, relationships should be live and informal face-to-face judgment was important to understand the various views. In Arab countries, capacity to direct information flows into decision making is nonexistent (based on Interview). This lack of participation contributes to the narrow involvement of people in public policy and to less responsive government. The low level performance of most Arab countries on EPI and OSL confirms these findings. Other scholarly writings such as Ranaivomanana (2006); Al Awadhi & Morris, 2009 are consistent with our findings.
Table 4 summarizes these challenges and indicates the number and percentage of interviewees who have agreed on each of these challenges. Table 4 reveals a lack of e-participation, lack of critical assessment of e-government initiatives and reforming bureaucracy receive a higher ranking and policy makers need to
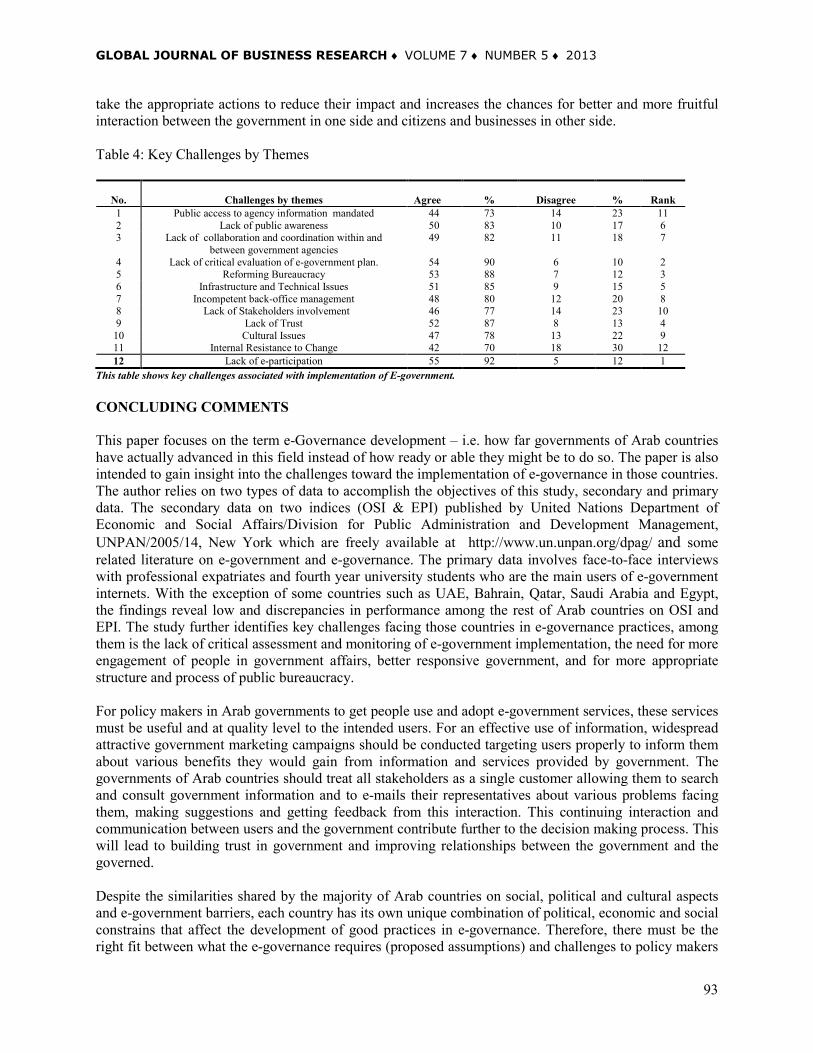
GLOBAL JOURNAL OF BUSINESS RESEARCH ♦ VOLUME 7 ♦ NUMBER 5 ♦ 2013
93
take the appropriate actions to reduce their impact and increases the chances for better and more fruitful interaction between the government in one side and citizens and businesses in other side. Table 4: Key Challenges by Themes
No.
Challenges by themes Agree
%
Disagree
%
Rank
1 Public access to agency information mandated 44 73 14 23 11 2 Lack of public awareness 50 83 10 17 6 3 Lack of collaboration and coordination within and
between government agencies 49 82 11 18 7
4 Lack of critical evaluation of e-government plan. 54 90 6 10 2 5 Reforming Bureaucracy 53 88 7 12 3 6 Infrastructure and Technical Issues 51 85 9 15 5 7 Incompetent back-office management 48 80 12 20 8 8 Lack of Stakeholders involvement 46 77 14 23 10 9 Lack of Trust 52 87 8 13 4
10 Cultural Issues 47 78 13 22 9 11 Internal Resistance to Change 42 70 18 30 12 12 Lack of e-participation 55 92 5 12 1
This table shows key challenges associated with implementation of E-government. CONCLUDING COMMENTS This paper focuses on the term e-Governance development – i.e. how far governments of Arab countries have actually advanced in this field instead of how ready or able they might be to do so. The paper is also intended to gain insight into the challenges toward the implementation of e-governance in those countries. The author relies on two types of data to accomplish the objectives of this study, secondary and primary data. The secondary data on two indices (OSI & EPI) published by United Nations Department of Economic and Social Affairs/Division for Public Administration and Development Management, UNPAN/2005/14, New York which are freely available at http://www.un.unpan.org/dpag/ and some related literature on e-government and e-governance. The primary data involves face-to-face interviews with professional expatriates and fourth year university students who are the main users of e-government internets. With the exception of some countries such as UAE, Bahrain, Qatar, Saudi Arabia and Egypt, the findings reveal low and discrepancies in performance among the rest of Arab countries on OSI and EPI. The study further identifies key challenges facing those countries in e-governance practices, among them is the lack of critical assessment and monitoring of e-government implementation, the need for more engagement of people in government affairs, better responsive government, and for more appropriate structure and process of public bureaucracy. For policy makers in Arab governments to get people use and adopt e-government services, these services must be useful and at quality level to the intended users. For an effective use of information, widespread attractive government marketing campaigns should be conducted targeting users properly to inform them about various benefits they would gain from information and services provided by government. The governments of Arab countries should treat all stakeholders as a single customer allowing them to search and consult government information and to e-mails their representatives about various problems facing them, making suggestions and getting feedback from this interaction. This continuing interaction and communication between users and the government contribute further to the decision making process. This will lead to building trust in government and improving relationships between the government and the governed. Despite the similarities shared by the majority of Arab countries on social, political and cultural aspects and e-government barriers, each country has its own unique combination of political, economic and social constrains that affect the development of good practices in e-governance. Therefore, there must be the right fit between what the e-governance requires (proposed assumptions) and challenges to policy makers

A. A. A. R. A. Al Athmay | GJBR ♦ Vol. 7 ♦ No. 5 ♦ 2013
94
to change. Accepting this reality, there is no single correct approach to e-government and analysis of the contextual feature of each country might produce somewhat acceptable prescription to deal with these challenges. The results of this paper inform us that Arab countries, as the case of most developing countries, need to counter the main challenges of e-government. The absence of a coordinated plan, lack of trust in sharing information and knowledge, the incapability of back-office, the absence of good governance, and the inexistence of critical evaluation of the present state of e-government systems have all contributed to poor realization of e-governance objectives. A coordinated implementation plan of e-governance within each country and between Arab countries is needed and should be supervised and enforced by e-government leaders. A critical examination of the present state and identifying those areas which need improvement will benefit the country. For most Arab countries, e-governance means computerizing existing government functions. There is lesser appreciation for the role of information systems in modernizing the government process, systems, structure and molding the mindset of politicians, ICT professionals and mainstream’ staff. More efforts should be incorporated into a national e-government plan to introduce real changes in the way services & information are produced and delivered, enhancing online transactions and the inclusion of e-consultation and e-decision making which allow vital two way interaction between the government and people in secure manner. REFERENCES Adeyemo, A.B., (2011), “E-government implementation in Nigeria: An assessment of Nigeria’s global e-gov ranking”., Journal of Internet and Information System, Vol. 2 (1), pp.11-19. Al Awadhi, Suha. And Morris, Anne. (2009), Factors Influencing the Adoption of E-government Services, Journal of Software, Vol.4, No.6, pp 584-90 Al-Nagi, E. and Hamdan, M. (2009). Computerization and E-government Implementation in Jordan, Challenges, Obstacles and Successes, Government Information Quarterly, 26, PP. 577-83 Al-Nuaim, Hana Abdullah. (2009), How “E” are Arab Municipalities? An Evaluation Of Arab Caital Municipal Web Sites, Electronic Government Research, Vol.5, Issues 1 Awan, M. (2007), Dubai e-government: an evaluation of G2B websites, Journal of Internet Commerce, 6(3), 115-129. Bannister, F. and Walsh, N. (2002). “The virtual public servant: Ireland’s public services broker. Information Polity”: The international Journal of Government and Democracy in the Information Age, 7 (2/3) pp.115. Barua, Mithun. (2012), E-Governmence Adoption In Government Organization of India, International Journal of Managing Public Sector Information and Communication Technologies, Vol.3, No.1, PP 1-20 Belwal, R. and Al-Zoubi, K. (2008), Public centric e-governance in Jordan: a field study of people’s perceptions of e-governance awareness, corruption, and trust, Journal of Information, Communication, and Ethics in Society, 6(4), 317-333. Bhatnagar, S. (2002), “Egovernment and Developing Countries: An Overview”, International Review of Law Computer & Technology, Vol. 18, No.1, pp 109-132

GLOBAL JOURNAL OF BUSINESS RESEARCH ♦ VOLUME 7 ♦ NUMBER 5 ♦ 2013
95
Bin Salamat, M. Aizi., Bin Hassan, Shahizan., & Bin Muhammad, M Syakiran. (2011), “Electronic Participation in Malaysia”, Journal of e-Government Studies and Best Practices, Vol. 2011, Article Id 270543, pp. 1-11. Bwalya, Kelvin J. (2009), “Factors Affecting Adoption of E-Government in Zambia”, The Electronic Journal on Information Systems in Developing Countries, Volume 38, No. 4, pp 1-13. Cecchini, S. & Raina, M. (2004), “Electronic Government and the rural Poor: The Case of Gyandoor”, Information Technologies & People Vol. 18, No. 3, pp. 65-75 Chatfield, A. and Alhujran, O. (2009), A cross-country comparative analysis of e-government service delivery among Arab countries, Information Technology for Development,15(3), 151-170. Ciborra, C. (2005), “Interpreting e-government and Development Efficiency, Transparency or governance at a distance?”, Information Technology & People, Vol. 18, No.3, pp. 260-279. Ciborra, C. and Navarra, D. (2005), Good governance, development theory, and aid policy: risks and challenges of e-government in Jordan, Information Technology for Development, 11(2), 141-159. Coleman, S & Gotze, J. (2001). “Bowling Together: Online Public Engagement in Policy Deliberation,” United Nations Educational, Scientific and Cultural Organization. [online]. [Retrieved October 11, 2008], Http://portal. Unesco.org/ci/en/ev.php-URL_ID=5468&URL_Do-Do_Topic&URL_SECTION=201.html Dad, Danish. ( 2006), “The Failure of E-Government in Developing Countries: A Literature Review”, The Electronic Journal on Information Systems in Developing Countries, Volume 18, No. 26,, pp1-16. Farooquie, Jamal A., (2011) “A Review of E-Government Readiness in India and the UAE”, International Journal of Humanities and Social Science, Vol. 1 No. 2, pp. 1-8. Fountain, J.E. (2002). Information, Institutions and Governance. Cambridge, John F. Kennedy School of Government: Harvard University. Fraga, E. (2002). Trends in e-Government in Digital Era: How to Plan, Design, Secure, and Measure e-Government, Government Management Information Science (GMIS) Conference, Santa Fe, New Mexico Gianluca, Misuraca., Alfano, Giuseppe., & Viscusi, Gianluigi. (2011). A Multi-Level Framework for ICT-Enabled Governance: Assessing the non-Technical Dimensions of ‘Government Openness’, Electronic Journal of e-Government, Vol. 9, Issue 2, pp.152-165 Gupta, Plyush. (2007), Challenges and Issues in e-Government Project Assessment, Paper presented and published as part of the ICEGOV 2007, December 10-13 Heeks, Richard: (2001) “Building e-Governance for Development: A Framework for National and Donor Action”. Working Paper No. 12. Institute for Development Policy and Management – University of Manchester, Manchester, UK Heeks, R. (2003), “Most eGovernment-for-Development Projects Fail: How Can Risks be Reduced?” iGovernment Working Paper Series, Paper no.14
A. A. A. R. A. Al Athmay | GJBR ♦ Vol. 7 ♦ No. 5 ♦ 2013
96
Holden, S.H. (2003), The Evolution of Information Technology Management at the Federal Level: Implications for Public Administration. In D.G. Garson (Ed.), Public Information Technology: Policy and Management Issues, (pp. 53-73). Hershey, PA: Idea Group Publishing. Howard, M. (2001) E-Government across the globe: How will “e” change government? Government Finance Review, Vol. 17, Issue 4, pp. 6-9. http://portal.unesco.org/ci/en/ev.phpURL_ID=3038&URL_DO=DO_PRINTPAGE&URL_SECTION=201.html Janowski, Tomasz. (2005). “Introduction to Electronic Government”, Center for Electronic Governance. United Nations University. Kaufmann Daniel, Aart Kraay, and Pablo Zoido-Lobaton, “Governance Matters II”, The World Bank, January 2002. Keohane, R. O. and Nye, J. S., In Nye, J.S. and Donahue, J.D. (editors), Governance in a Globalization World. Washington, D.C. : Brookings Institution Press. 2000. Kerby, Richard. (2008). Electronic/Mobile Government in Arab States: Building Capacity in Knowledge Management through Partnership. Presentation by Richard Kerby, UNDESA. Beirut, Lebanon. Kim, Pan Suk. Halligan, John. Cho, Namshin., Oh, Cheol H., Eikenberry, Angela M. (2005), Toward Participatory and Transparent Governance: Report on the Sixth Global Forum on Reinventing Government, Public Administration Review, Vol.65, N0.6, pp.646-54 Kraemer, Kenneth. L & King, John. Leslie. (2005), Information Technology & Administrative Reform: Will E-Government be Different?, International Journal of Electronic Government Research, Final.doc Lenihan, D. (2002), “realigning governance: from e-government to e-democracy”, OECD Centre for Collaborative Government, Available at: www.collaborativegovernment.com (accessed 3 December 2007). Moore, John. (2011). “Government 2.0 and the role of social media in the Middle East. Http:// www.customerthink.com/blog/government_2_0_and_the_role_of_social_media_in_t. Murad, Mohammad. Hasan. (2010), Improving Transparency Through Right to Information and e-Governance: A Bangladesh Perspective”, Volume 6, Issue 1, pp. 1-18. Ndou, Valentina. (2004), “E-Government for Developing Countries: Opportunities and Challenges”, The Electronic Journal on Information Systems in Developing Countries, Vol. 26, No. 1, pp1-24. Nour, Mohamed A, AbdelRahman, A, AbdelRahman, and Fadlalla, Adam. (2008), A context-based integrative framework for e-government initiatives, Government Information Quarterly, 25, pp. 448-461 Ranaivomanana, Guy. (2006), “E-Government from the Public Administration and Policy Perspective”, SDI/NICI Joint Working Session, Addis Ababa, Ethiopia. Riley, T.R. (2003), E-Government vs. E-Governance: Examining the Difference in a changing Public Sector Climate, The Commonwealth Secretariat and Government Telecommunication Center for Information Services, Public Works and Government Services, Ottawa.

GLOBAL JOURNAL OF BUSINESS RESEARCH ♦ VOLUME 7 ♦ NUMBER 5 ♦ 2013
97
Salem, Fadi. (2006), Exploring e-Government Barriers in the Arab States, Policy Brief, Dubai Scholl of Government. Dubai. Salem, Fadi. And Jarrar, Yasar. (2011), Government 2.0? Technology, Trust and Collaboration in the UAE Public Sector, Dubai School of Government Sardi, Ximena Castro & Mlikota, Kristina. (2002). “Overview on E-governance: ICTs as Tools for Improving Local Governance” Working paper, Prepared in the Framework of the ICT Cross-Cutting Project, United Nations Educational, Scientific and Cultural Organization. Sha’ban, Charles. (2006). “E-Government Readiness in the Arab Countries”, UN Workshop on E-Participation and E-Government, 27-28, Budapest, Hungary Shahwan, Usamah., “E-Government in Developing Countries”, available at: http://css.escwa.org. ib/ictd/01018/presentation/day 2/8 pdf. Shakya, Rajesh and Sigdel, Shailendra. (April 14, 2007) “E-Governance for Good Governance in Nepal”, Spotlight – English Weekly Magazine. Singh, Shalini. (2010), “Promoting e-Governance through Right to Information: A case-Study of India”, International Journal of Scientific & Engineering Research, Volume 1, Issue 2, pp. 1-9. UAEInteract (25 May 2009) Abu Dhabi to double online revenues by end of the year. Online at: http://www.uaeinteract.com/docs/abu_Dhabi_to_double_online_revenues_by_end_of_the_year_/35958.htm UN Global E-government Readiness Report. From E-Government to E – inclusion, UNPAN/2005/14, United Nations publication, United Nations, 2005. UN Global E-Government Readiness Report (2005). From E-Government to E-inclusion, United Nations Department of Economic and Social Affairs/Division for Public Administration and Development Management, UNPAN/2005/14, New York. UN Global E-Government Survey (2008). From E-Government to Connected Governance, United Nations Department of Economic and Social Affairs/Division for Public Administration and Development Management, ST/ESA/PAD/SER.E/112, New York. UN Global E-Government Survey (2010). Leveraging e-government at a time of financial and economic crisis, United Nations Department of Economic and Social Affairs/Division for Public Administration and Development Management at: http://www.un.unpan.org/dpag/ UN Global E-Government Survey (2012). Leveraging e-government at a time of financial and economic crisis, United Nations Department of Economic and Social Affairs/Division for Public Administration and Development Management at: http://www.un.unpan.org/dpag/ Whyte, A. & Macintosh, A. (2002). “Analysis and Evaluation of E-Consultation,” e-Service Journal, 2(1). pp. 9-34. Zaied, A., Khairalla, F. and Al-Rashed, W. (2007), Assessing e-readiness in the Arab countries: perceptions, towards ICT environment in public organizations in the state of Kuwait, The Electronic Journal of e-Government, 5(1), 77-86.

A. A. A. R. A. Al Athmay | GJBR ♦ Vol. 7 ♦ No. 5 ♦ 2013
98
BIOGRAPHY Alaa-Aldin Abdul Rahim A. Al Athmay works at Department of Management, Marketing and Public Administration University of Sharjah, Sharjah, United Arab Emirates. He can be reached at [email protected]
GLOBAL JOURNAL OF BUSINESS RESEARCH ♦ VOLUME 7 ♦ NUMBER 5 ♦ 2013
99
THE COMPLEMENTARITY OF CORPORATE SOCIAL RESPONSIBILITY AND INNOVATION: EVIDENCE
FROM BELGIAN FIRMS Ferauge Perrine, University of Mons
ABSTRACT
In recent years, more and more companies, both small and large, have become aware of issues related to sustainable development. In spite of the significant presence of small and medium enterprises (SMEs) in Europe, few studies have examined the social responsibilities of SMEs. Corporate social responsibility (CSR) requires numerous changes for companies, and innovation can thus constitute a tool supporting the implementation of CSR. In addition, sustainable development can generate new opportunities for SMEs to innovate. Thus, the goal of this exploratory study is to better understand the connections linking CSR and innovation in the context of SMEs. Semi-structured interviews with leaders of seven SMEs in Wallonia (Belgium) have allowed us to provide insight regarding the role of innovation in the process of defining social responsibility in the SME context. JEL: M10, M14, O32 KEYWORDS: Sustainability, CSR, Innovation, Small business INTRODUCTION
t the present time, sustainable development (SD) constitutes more than a simple fad and has instead progressively become “an unavoidable reality” (Renault & Ashta, 2007, p. 5). In particular, financial crises, pollution, resource depletion, labour rights, and various other factors
have stimulated certain organisations to focus on SD (Asselineau & Lechalard, 2008). In recent years, an increasing number of companies have become aware that it is possible to manage a company in a sustainable way by considering and prioritising long-term interests, and these companies have therefore undergone profound managerial changes as a result (CIDD, 2006). However, one certainly does not find the same level of commitment to SD in all companies. Firm size is certainly one of the factors that is linked to the observed differences in firms’ commitment to social responsibility; in particular, large companies and small firms generally do not commit to corporate social responsibility (CSR) in the same manner (Lepoutre & Heene, 2006). In Europe, small and medium enterprises (SMEs) represent a significant economic sector. In Belgium, as in most countries, the majority of companies are SMEs (Gendre-Aegerter, 2008; Spence et al., 2007). However, numerous authors have regretfully observed that despite the important presence of SMEs in the European economic landscape, there exist only a small number of studies addressing CSR in SMEs (Lapointe, 2006). In addition, several authors have examined the potential relationship linking CSR and innovation (Labelle, 2008). However, this relationship has rarely been studied in the context of SMEs (Bocquet & Mothe, 2010; Temri, 2008). CSR initiatives may prove important for SMEs, as according to Little (2006), these initiatives can lead to the implementation of processes of innovation that respond to social, environmental, and economic needs by creating new work methods, products, services, processes, and markets in a context that could lead numerous firms to redefine their strategy. The goal of this study is thus to analyze the conditions under which innovation can either favor or result from social responsibility considerations of SMEs. The use of innovation in the service of CSR is a
A

F. Perrine | GJBR ♦ Vol. 7 ♦ No. 5 ♦ 2013
100
complex challenge that connects the concepts of innovation and SD, both of which display multidimensional characteristics. To begin, we shall define the field of the CSR and the innovation. We shall then attempt to develop the concept of innovation and the conditions in which it can facilitate and promote CSR. After we had specified our methodology, we shall present the main results of our study as well as their interpretation. LITTERATURE REVIEW From Sustainable Development to Corporate Social Responsibility In the literature, we find numerous definitions of SD and CSR. To better understand these two concepts, it is important to be precise about the definitions that are used. Although SD is a fuzzy concept, a report by Brundtland (1987) defines SD as development that allows for “responding to the needs of the present without compromising the abilities of future generations to respond to theirs”. We find the concept of responsible entrepreneurship to be an extension of SD; in particular, this concept, as stated by the European Commission (EC) (2004, p. 7), designates “strategies voluntarily adopted by companies to contribute to SD”. This definition fits with the concept of CSR, which represents, according to the CIDD (2006, p. 7), “a process of improvement in which companies integrate to their management considerations of social, environmental and economic order in a voluntary, systematic and coherent way, in consultation with their stakeholders.” This definition of CSR alludes to firms’ centers of activities, which have been labeled theoretically by Elkington (1998) as the triple bottom line, a concept that leads CSR-oriented firms to define their results in terms of the following three pillars of SD: Planet (respect for the environment), People (respect for employees, customers, suppliers, stakeholders, and society), and Profit (profitability of the company, its growth, and the growth of the economy as a whole) (David et al., 2005; Labelle, 2008; Spence, 2007). Numerous empirical studies indicate that the commitment of companies to CSR tends to increase with company size. Despite this finding, however, it has been claimed that half of European SMEs are already invested in one or more socially responsible activities (Lapointe & Gendron, 2004; EC, 2002).Various actors have attempted to promote CSR in the context of SMEs, and specifically adapted tools have been developed to encourage CSR. An awareness campaign, for example, has been launched by the EC (consisting of a guide, a list of best practices, and seminars). The numerous scientific studies and science communications addressing CSR demonstrate growing interest in SD and emphasize the benefits of adopting socially responsible strategies (Quairel & Auberger, 2005). We have observed that SMEs are increasingly aware of the impact that their activities can have on SD (CIDD, 2006; Spence, 2007). Social Responsibility and Innovation If one consults the extensive literature on the subject, various ambiguities can be found regarding the notion of innovation. Thus, to better comprehend the concept of innovation, it is important to distinguish between innovation and creativity. Carrier and Garand (1996) emphasize the confusion that may exist between the two concepts and note that creativity corresponds to the initial discovery of ideas and can therefore be a source for a subsequent process of innovation. It is thus necessary to distinguish creativity and innovation by considering these notions as two distinct phases of a process chain; for this chain, creativity represents the point of departure from established practices, whereas innovation finalizes and implements novel and creative concepts. Furthermore, it is not always easy to distinguish change from innovation. The implementation of an innovation systematically leads to change for the company, whereas the company can make an organizational change without innovation. We therefore wish to emphasize the fact that, in the literature,

GLOBAL JOURNAL OF BUSINESS RESEARCH ♦ VOLUME 7 ♦ NUMBER 5 ♦ 2013
101
we find the following different ways of evaluating innovation: the relative perception of the adopter, the objective novelty, the degree of originality of the innovation, and the nature and breadth of the change induced (Carrier & Garand, 1996). In this study, we will distinguish innovation from change in a company by assessing the relative perception of the change within that company. Thus, change within an organization will be considered to be an innovation if that change is perceived to be a novel one by the organization’s actors. We thus choose to retain the definition of innovation provided by the Organization for Economic Co-operation and Development (OECD); in this definition, innovation corresponds to the “implementation of a product (good or service) or of a new or notably improved procedure, of a new method of commercialization, or of a new organizational method in a company’s practices, in the organization of the workplace, or in external relations” (OECD, 2005, p. 54). Recently, increasingly better methods have been used to incorporate the concept of innovation into the context of addressing SD. The adoption of CSR concepts will produce changes in the way in which SD is managed, as CSR involves important modifications in company management and produces various organizational innovations (Mathieu, 2005). To understand the concept of SD in a global way, it is important to examine the notion of innovation (Mathieu, 2005). According to Asselineau and Lechalard (2008), a company that seeks to integrate a vision of SD should review its ways of thinking and develop new working methods. Innovation is one of the drivers of company competitiveness, but it is not always easy to implement. According to Labelle (2008, p. 1), “innovation and SD are two contemporary issues which are faced by entrepreneurs. Certain entrepreneurs have chosen to face them head on. In doing so, they have caused an interesting result, that is, that management focused on sustainability favors innovation”. CSR initiatives can thus lead to the implementation of processes of innovation that respond to social, environmental, and economic needs by creating new work methods, products, services, processes, and markets in a context that could lead numerous firms to redefine their strategy (Little 2006). In addition, the entrepreneur, as Schumpeter (1934) suggests, is a natural innovator. SD will provide the responsible entrepreneur with opportunities to innovate that respond to the considerations of the various parties concerned with improving current modes of consumption, production, and organization (Spence, 2007). The real challenge for companies pursuing innovation is not simply the generation of good ideas; instead, the more important aspect of the challenge is converting these ideas into products and services that will be successful in the market. It could thus be the case that social responsibility generates new ideas and stimulates various ethical considerations (EC, 2007). In addition, as noted by MacGregor et al. (2007), responsible innovation demands a proactive attitude on the part of the company. A proactive approach is customarily one of the characteristics of innovative companies. These companies do not wait for competition or external pressure to take action and innovate. Both innovation and a proactive perspective are required in the implementation of a CSR strategy. The Bidirectional Relationship between CSR and Innovation One can increasingly find studies that examine the connections between innovation and CSR (Labelle, 2008; MacGregor et al., 2007). In addition, several authors have investigated the direction of the relationship between innovation and CSR (EC, 2007; MacGregor et al., 2007). Within the framework of the Response Project of the EC (EC, 2007), which has the goal of convincing SMEs to implement CSR through the use of innovative activities, MacGregor et al. (2007) demonstrate the bidirectionality of the interactions between innovation and CSR. In particular, two separate pathways have been emphasized thus far in the study of this relationship. In certain companies, CSR leads to innovation, a phenomenon that can be explained by the fact the companies in question are guided primarily by their values. These firms seriously consider the impact of their activities on the environment and the community, although it should be noted that these considerations do not imply that the companies in question lose sight of the importance of profit. By contrast, innovation leads to CSR in companies that are principally focused on the creation of value. These companies value their workforce, their production chain, and their customers

F. Perrine | GJBR ♦ Vol. 7 ♦ No. 5 ♦ 2013
102
and invest continually with the goal of creating added value (EC, 2007). Nevertheless, a review of the literature suggests that there is still a lack of understanding regarding the ways in which CSR initiatives can both rely on processes of innovation and improve performance for SMEs. We therefore seek to better understand the connection that can exist between innovation and CSR practices in the specific context of SMEs, thus allowing us to appreciate the role of innovation in the process of improving the CSR of concerned SMEs. METHODOLOGICAL CHOICE AND SAMPLE CHARACTERISTICS The CSR of SMEs and the relationship between this CSR and the process of innovation has rarely been studied, particularly in Belgium (Peeters, 2005). As the research field of this study is novel and the object of study is relatively original, we chose to pursue a qualitative investigation that is exploratory in nature. This type of approach seeks to provide a finer and deeper comprehension of the object of research (Miles & Huberman, 2003). In particular, in this instance, the study results will allow us to better understand the move towards CSR by SMEs; this move is already beginning to take place in Wallonia (a region of Belgium). The Definitions of SMEs Used for Our Study In the framework of our study, we chose to retain two complementary definitions of SMEs that are both frequently referenced within the scientific community. From this perspective, we thus chose to value both quantitative and qualitative approaches by considering both the definition of the European Commission (2006) and the definition of Julien (1997). The European definition is based on quantitative criteria (EC, 2006). This new definition distinguishes between three different categories of companies and takes the following three criteria into account: staffing, annual turnover, and annual balance sheet. Julien’s definition (1997) is interesting because it accounts for supplementary criteria that are qualitative in nature, thereby emphasizing the human factor. In particular, in Julien’s definition (1997), a company is an SME if it meets the following criteria: small company size, management centralized around the manager who directly contacts other organization members, weak specialization (of management and staff) in the division of responsibilities, simple or less organized systems of processing internal and external information (through dialogue rather than formal or written procedures) and an intuitive or relatively informal strategy. The Makeup of the Sample and the Collection of Data In Wallonia, it is still difficult to identify SMEs that are adopting CSR. Although we met various economic actors directly connected to SMEs in Wallonia, we did not have a database available that would be useful in helping us to prepare a sample of SMEs that were engaged in at least one CSR-related action. We nevertheless were able to discover a channel for identifying responsible SMEs, due to the fact that various economic actors organize the distribution of rewards (prizes) in the field of CSR to honor companies in Wallonia for their environmental, social, and/or economic commitments. Thus, our sample is composed of SMEs from Wallonia that were distinguished by receiving an external reward for their involvement in social, environmental, and/or overall SD. The homogeneity of the cases in our sample is thus based on the commitment to responsibility of these SMEs, as recognized by an external organization. In practice, each manager of the SMEs participating in the study was the object of a semi-structured interview that was recorded within the company at the manager’s convenience during the year 2010. To address the question of the number of interviews needed for our study, we used the concept of theoretical saturation; the conditions for theoretical saturation were satisfied after seven interviews.

GLOBAL JOURNAL OF BUSINESS RESEARCH ♦ VOLUME 7 ♦ NUMBER 5 ♦ 2013
103
The Profile of Sample Companies A brief description of the companies included in the sample is presented below: Company A :This family company, created in 1934 and specializing in the manufacture of cooking margarines, employs 85 people. It received the Energy and Environment prize for SD in 2006 for the installation of a cogeneration unit for utilizing renewable energy. It was certified organic in 2009 and launched its first product based on 100% segregated palm oil in 2011. Company B : This computer services company, created in 1998, employs eight people. Its manager, concerned with the workers’ well-being, created the company with the goal of developing a work environment that differed from the environment of large companies. The company has always followed cutting-edge technologies very closely to and has the ability to suggest and implement technological solutions for its customers. It received the Mercury prize for SD in 2008. Company C : This computer services company employs 14 people. Created by the manager in 2000, this company is experiencing significant growth. It received the ALFER prize for social economics in 2007. Company D : This company, which employs disabled workers, was created in 1970 and now employs 160 people. The chief activities of the company are related to timber and logistics (packing and packaging). The present manager took charge of the company in 2007. After losing an important customer, the company successfully managed to diversify its activities. It received the Godefroid prize for SD in 2009. Company E: This enterprise, created in 1978, employs 90 persons (nearly 80 persons from the Walloon Agency for Inclusion of the Disabled, and roughly 15 non-handicapped employees). This firm is a nursery that offers activities such as park fencing, eco-construction, gardening and masonry. Since assuming the management of the company in 1989, the present manager has striven to achieve financial equilibrium. In addition, the company has been nominated for the Godefroid prize in SD in 2010. Company F : This enterprise in the area of bulky waste collection, created in 2005, employs 20 people and works in collaboration with a non-profit organization that provides the firm with disabled staff members. The company envisages extension of these activities to other locations. It has co-managers instead of a single overall manager. The company received the Walloon Entrepreneurship Grand Prize in 2008. Company G :This family company, created in 1998, employs 14 people and is active in the area of alternative heating. It received the Energy Award prize in 2007. Since the economic crisis, the manager, who is the creator of the company, has foreseen a negative future for his company. Nevertheless, he is investing in a project related to mobile boiler rooms. RESULTS AND DISCUSSION To explore the relationship between CSR and innovation, we analyzed our discourses with the managers of the seven companies in the sample. Complementarity between CSR and innovation could be identified in the seven SMEs. Furthermore, this complementarity highlighted several distinct corporate trajectories related to the two concepts in question, which are discussed below. Ecology Creates New Opportunities for Innovation This trajectory was uniquely identified for company A. The commitment to responsibility of this company is chiefly focused on the implementation of environmental actions. This firm did not seek to distinguish

F. Perrine | GJBR ♦ Vol. 7 ♦ No. 5 ♦ 2013
104
itself in the social aspect of CSR. The company has been invested in a continual process of innovation for several years, and it seeks to be ahead of its competitors and describes itself as “avant-garde”. This firm would like to optimize its productivity and develop as complete of a range of products as possible. It has devoted its innovative processes to the service of its ecological objectives.These innovative projects (Table 1) demonstrate to us that company A seeks to innovate to stay ahead of its competitors. It thus tries to launch new products regularly. The company has also committed its innovation processes towards its core ecological commitments, as it seeks to ensure that it is at the forefront of addressing new environmental issues as they arise. Table 1: Innovation and Outcomes (Company A)
Innovations Outcomes Expected for the Company Outcomes Expected for CSR
Product innovations
The regular launching of new products
The company provides a range of quality products that is as complete as possible
Products that are certified as organic
New potential market Weak current sales
Product based on 100% segregated palm oil
Products guarantee respect for primary forests and their fauna as well as decent working conditions in producing countries
Commercial innovations
The creation of the “Green Energy” logo (indicating energy cogeneration) that is visible on most products
Positive image with customers The identification by customers of products produced with green energy.
Procedural innovations
Continuous innovation in the process of production
Greater productivity
The creation of a plant that is a cogenerator of renewable energy
The use of green electricity by the company
This table shows the innovation activities of the company A as well as their outcomes expected for the company and for CSR. The company thus continually finds new opportunities to innovate with regard to these environmental issues (Figure 1). Figure 1: The Innovating Strategy for Company A
This figure shows that besides the innovation for economic ends, the ecology creates too, for the company A, new opportunities for innovation. The Pursuit of Sustainable Goals through Innovation We identified four companies that pursue their commitment to responsibility (both social and environmental) through the implementation of innovative activities. Company D (Table 2) allows disabled individuals to be involved in the business activities of the
The innovation of the company for economic ends
Company
Ecology creates new opportunities for
innovation
Innovating strategy

GLOBAL JOURNAL OF BUSINESS RESEARCH ♦ VOLUME 7 ♦ NUMBER 5 ♦ 2013
105
company. As its activities have diversified, the company has supplied its staff with additional training to ensure their well-being. This diversification has also allowed the company to assure its own longevity. The company was not invested in a continuous process of innovation before the arrival of its current manager. When he arrived at the firm, the present manager had the idea of diversifying the activities of the company. He had to implement considerable changes in the management of the company and brought his SD approach to all company activities. In particular, the firm has implemented SD by constructing passive buildings, re-using the by-products of it’s sawmill and pallet shop, and recycling waste, among other measures. Table 2 : Innovation and Outcomes (Company D)
Innovations Outcomes expected for the company
Outcomes expected for CSR
Product and service innovation
Opening a restaurant and a store The diversification of company activities The opening of enterprise for the local community
Organizational innovation
The restructuring of company management and management tools
The writing of management procedures to engage in a process of certification in the future
Procedural innovations
The acquisition of new tools Greater potential diversification of company activities
The creation of a trigeneration plant The use of green electricity by the company
This table shows the innovation activities of the company D as well as their outcomes expected for the company and for CSR. Company E (Table 3) has undertaken numerous activities that favor SD, particularly due to the system of environmental management that the firm has implemented. At the social level, the company has invested a considerable amount in the training of its staff. It also organizes “SD weekends” and discovery activities for the schools of the region to raise the awareness of children and the general public with regard to SD issues. Finally, the company does not hesitate to inform the public about SD and makes a weekly newsletter known as “SD Advice” available to all. Thus, since its creation, this company has always been strongly invested in a process of innovation that allows it to implement numerous new, socially responsible projects. Table 3 : Innovation and Outcomes (Company E)
Innovations Outcomes expected for the company
Outcomes expected for CSR
Product and service
innovations
Eco-construction The creation of green roofs Biological cultures
The promotion of sustainable products to customers
Commercial innovation The creation of an eco-construction building within the company
The promotion of sustainable construction and company services
Organizational innovation
The creation of a newsletter The promotion of sustainable development
Procedural innovations
The creation of a container yard Better waste management The creation of a watering nursery with a drip system The recovery of water from roofs in a pond Lagoon systems
Better management of water consumption
This table shows the innovation activities of the company E as well as the outcomes expected for the company and for CSR. Company F (Table 4) can be considered to be wholly responsible in the sense that it is invested in all three CSR areas (environmental, social, and economic). Its responsibility was established through the company’s strategy. Thus, this company aims to have its activities evolve in a way that better integrates CSR considerations in the future. One of the responsible actions implemented by this firm is the free collection service for bulky waste that this SME offers to the populace. Direct contacts between the

F. Perrine | GJBR ♦ Vol. 7 ♦ No. 5 ♦ 2013
106
collecting staff and the local populace promote the exchange of information about how to better sort waste. The home collection service also has the advantage of being accessible to persons with reduced mobility. With regard to CSR, numerous innovations have thus allowed the company to become more involved in the social and environmental spheres of SD. Table 4 : Innovation and Outcomes (Company F)
Innovations Outcomes Expected for the Company
Outcomes Expected for CSR
Procedural innovations
The creation of new containers Containers that are better adapted for the sorting work of company staff
The purchase of a shampooer for seats
Favors recycling and recovery of seats as well as their sale in a second-hand shop
Organizational innovations
The creation of a framework for the professional inclusion of individuals with weak skills
The employment of a social worker who will promote an agreeable working environment
Commercial innovations
The creation of a second-hand shop
Emphasizes the importance of shop presentation Encourages customers to engage in a responsible acts The installation of a kiosk to improve customer awareness of environmental imperatives.
The online sale of products via a virtual shop
Generate a flow of rare objects or discontinued items sought by specific customers The expansion of the firm’s catchment area
The labeling of appliances Traceability and after-sale service can be proposed for appliances
This table shows the innovation activities of the company F as well as the outcomes expected for the company and for CSR. Company G (Table 5) stood out due to its manager’s testimony regarding the firm’s experience with various external actors; in particular, this experience included both the organization of open houses directed at schools and initiatives that informed the public about alternative heating options. The company has invested in innovation at various levels. It participates in a continuous process of innovation that allows it to pursue its ecological objectives. Table 5 : Innovation and Outcomes (Company G)
Innovations Outcomes Expected for the Company
Outcomes Expected for CSR
Product innovation
Project for mobile boilers in collaboration with the region of Wallonia
Provide a sustainable long-term solution Generate a potential market that could create jobs.
Procedural innovation
A test laboratory for boilers using alternative energy
The direct presentation of boilers to customers
The training of technicians on boilers at the company
Organizational innovation
The creation of a second company
Submit a quality pellet to customers of company G and its competing companies
Encourage differentiation from fellow installers This table shows the innovation activities of the company G as well as the outcomes expected for the company and for CSR. Figure 2 indicates the desire by responsible companies (companies D, E, F, and G) to pursue their sustainable commitments by implementing innovative activities, in the hope that positive effects will be generated at the social and environmental level. Firstly, the innovative projects of company D demonstrate to us that it seeks to innovate to favor the diversification of its activities and to continue to operate (that is, innovation for its own economic ends). When he took on the management of the
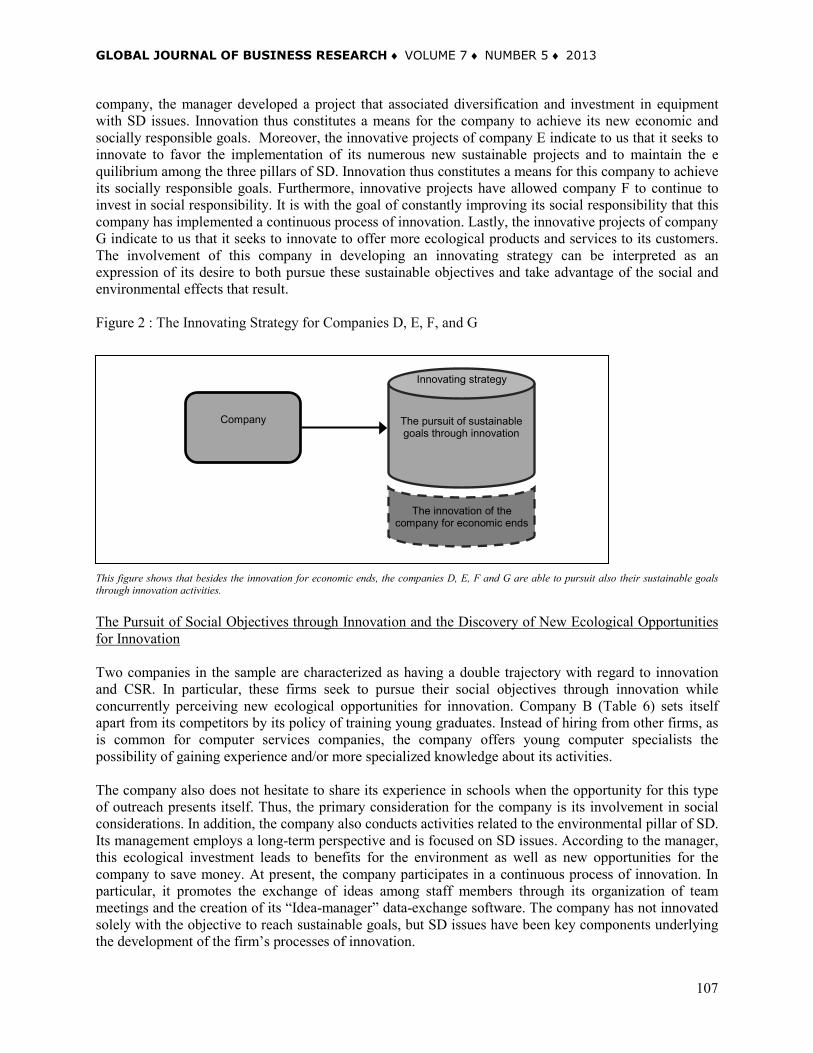
GLOBAL JOURNAL OF BUSINESS RESEARCH ♦ VOLUME 7 ♦ NUMBER 5 ♦ 2013
107
company, the manager developed a project that associated diversification and investment in equipment with SD issues. Innovation thus constitutes a means for the company to achieve its new economic and socially responsible goals. Moreover, the innovative projects of company E indicate to us that it seeks to innovate to favor the implementation of its numerous new sustainable projects and to maintain the e quilibrium among the three pillars of SD. Innovation thus constitutes a means for this company to achieve its socially responsible goals. Furthermore, innovative projects have allowed company F to continue to invest in social responsibility. It is with the goal of constantly improving its social responsibility that this company has implemented a continuous process of innovation. Lastly, the innovative projects of company G indicate to us that it seeks to innovate to offer more ecological products and services to its customers. The involvement of this company in developing an innovating strategy can be interpreted as an expression of its desire to both pursue these sustainable objectives and take advantage of the social and environmental effects that result. Figure 2 : The Innovating Strategy for Companies D, E, F, and G
This figure shows that besides the innovation for economic ends, the companies D, E, F and G are able to pursuit also their sustainable goals through innovation activities. The Pursuit of Social Objectives through Innovation and the Discovery of New Ecological Opportunities for Innovation Two companies in the sample are characterized as having a double trajectory with regard to innovation and CSR. In particular, these firms seek to pursue their social objectives through innovation while concurrently perceiving new ecological opportunities for innovation. Company B (Table 6) sets itself apart from its competitors by its policy of training young graduates. Instead of hiring from other firms, as is common for computer services companies, the company offers young computer specialists the possibility of gaining experience and/or more specialized knowledge about its activities. The company also does not hesitate to share its experience in schools when the opportunity for this type of outreach presents itself. Thus, the primary consideration for the company is its involvement in social considerations. In addition, the company also conducts activities related to the environmental pillar of SD. Its management employs a long-term perspective and is focused on SD issues. According to the manager, this ecological investment leads to benefits for the environment as well as new opportunities for the company to save money. At present, the company participates in a continuous process of innovation. In particular, it promotes the exchange of ideas among staff members through its organization of team meetings and the creation of its “Idea-manager” data-exchange software. The company has not innovated solely with the objective to reach sustainable goals, but SD issues have been key components underlying the development of the firm’s processes of innovation.
Company
The pursuit of sustainable goals through innovation
Innovating strategy
The innovation of the company for economic ends

F. Perrine | GJBR ♦ Vol. 7 ♦ No. 5 ♦ 2013
108
Table 6 : Innovation and Outcomes (Company B)
Innovations Outcomes expected for the company Outcomes expected for CSR Procedural innovation
Virtualisation The creation of virtual servers on a single computer Flexibility
Reduced energy consumption
Organizational innovation
Telecommuting Staff accountability Reduced costs for the employer Flexibility
Greater autonomy and well-being of company staff Reduced CO2 emissions
This table shows the innovation activities of the company B as well as the outcomes expected for the company and for CSR. Company C’s status as a co-operative company (Table 7) requires it to have a very specific internal management; in particular, its management must be directed toward the social well-being of its workers. Its status as a co-operative firm thus allows the company to make its workers socially aware of the various issues of the firm. The firm’s workers become associates after one year and thus rapidly assume roles as central actors in the decision-making processes of the company. The company is invested in innovation at various levels. It participates in a continuous process of innovation that allows it to pursue its ambitions as a co-operative company that provides computer services. Table 7 : Innovation and Outcomes (Company C)
Innovation Outcomes expected for the company Outcomes expected for CSR Product innovation A capped system of governance Greater customer accountability
Reward customers who manage their IT infrastructure well
Commercial innovations
The purchase of a drone piloted by an iPad for a trade show
Attract customers to trade show booth
The purchase of an iPad abroad before its release in Belgium as part of organizing a competition
Generate buzz for the company
Procedural innovations
The purchase of new cars with low CO2 emissions
Reduced transportation costs Reduced CO2 emissions
The construction of new passive buildings
Reduced costs of energy consumption Generate indirect publicity
Reduced energy consumption
Organizational innovation
A co-operative company structure Increased support by workers for new projects
Increased well-being and development of workers within the company
Increased worker responsibility and participation in decision-making processes
This table shows the innovation activities of the company C as well as the outcomes expected for the company and for CSR. Figure 3 illustrates the complementarity of this double trajectory for companies B and C. The involvement of company B in innovation can be seen through its desire to pursue its economic objectives in a structure that respects social imperatives (the pursuit of social objectives through innovation). The company also finds that environmental issues provide it with new opportunities to innovate that also ensure economic advantages. Moreover, the innovative projects of company C indicate to us that this firm seeks to innovate to secure its future. The involvement of this company in a continuous strategy of innovation (for economic ends) can be viewed through the perspective of its desire to pursue its economic objectives within a structure that respects social imperatives (the pursuit of social objectives through innovation). The company also finds that environmental issues provide it with new opportunities to innovate that also ensure economic advantages. Interpretation of the Results All of the SMEs from the sample are companies that are voluntarily committed to responsibility. This

GLOBAL JOURNAL OF BUSINESS RESEARCH ♦ VOLUME 7 ♦ NUMBER 5 ♦ 2013
109
commitment is revealed through the firms’ responsible actions at the environmental, social, and economic levels. We are able to observe that to pursue their sustainable objectives, the SMEs in the sample implemented innovative activities that allowed them to become socially responsible. As a consequence, the commitment to responsibility of the seven companies was always accompanied by a process of innovation (although this process varied in intensity from one company to another). Figure 3 : The Innovating Strategy for Companies B and C
This figure shows that besides the innovation for economic ends, the companies B and C are able to pursuit also their social objectives through innovation activities. Moreover, the ecology creates, for this company, new opportunities for innovation. Thus, the complementary of CSR and innovation could be established for all of the SMEs in the sample. Among the companies that were studied, three were set apart by their involvement in a continuous process of innovation that was not exclusively intended to express their commitment to sustainability. Thus, the following companies implemented innovations for ends that were more economic in nature:
- Company A invested in a process of regular creation of new products and also seeks to innovate to increase its productivity.
- Company C innovated for commercial ends and with a desire to reduce its costs.
- Company D implemented various innovations that allow it to diversify its activities. In addition, more fundamentally, an analysis of the innovating strategies of companies in the sample allowed us to identify two trajectories related to the way that the studied companies envisage innovation as it relates to adopting CSR principles. The first trajectory characterizes companies that wish to invest in CSR and manage to pursue their sustainable objectives (social and/or environmental) by implementing activities of innovation. For these companies, the process of innovation is viewed as a necessary tool for integrating CSR. The second trajectory envisages a constantly innovating SME, that is, a company that is invested in a continuous process of improvement and innovation. As the company in question is also concerned about its commitment to CSR, it finds new opportunities in this commitment to innovate that can not only provide it with cost reductions but also add social value to its environment. Figure 4 illustrates not only the two trajectories that can be implemented (not necessarily mutually exclusively) as innovating strategies for responsible companies (socially and/or environmentally) but also the possible presence of an innovation process that is primarily economically driven instead of CSR--focused.
Company
Innovating strategy
The innovation of the company for economic ends
The pursuit of social
objectives through
innovation
Ecology creates opportunities for
innovation
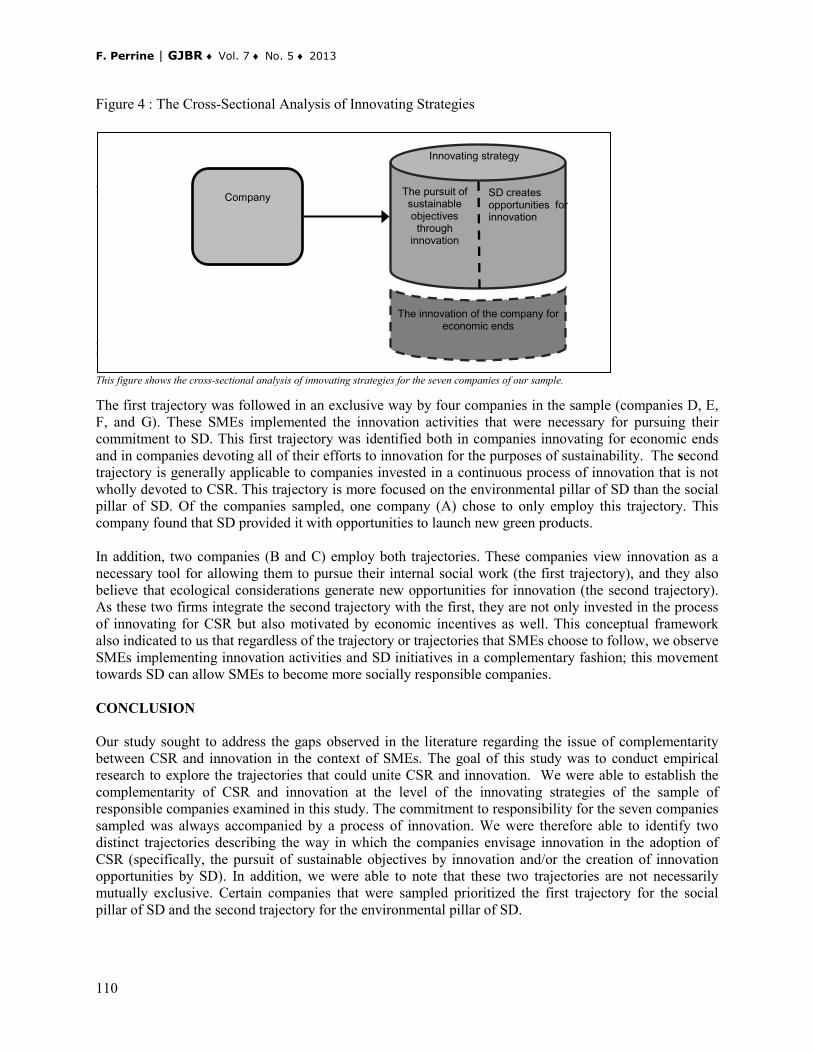
F. Perrine | GJBR ♦ Vol. 7 ♦ No. 5 ♦ 2013
110
Figure 4 : The Cross-Sectional Analysis of Innovating Strategies focused.
This figure shows the cross-sectional analysis of innovating strategies for the seven companies of our sample. The first trajectory was followed in an exclusive way by four companies in the sample (companies D, E, F, and G). These SMEs implemented the innovation activities that were necessary for pursuing their commitment to SD. This first trajectory was identified both in companies innovating for economic ends and in companies devoting all of their efforts to innovation for the purposes of sustainability. The second trajectory is generally applicable to companies invested in a continuous process of innovation that is not wholly devoted to CSR. This trajectory is more focused on the environmental pillar of SD than the social pillar of SD. Of the companies sampled, one company (A) chose to only employ this trajectory. This company found that SD provided it with opportunities to launch new green products. In addition, two companies (B and C) employ both trajectories. These companies view innovation as a necessary tool for allowing them to pursue their internal social work (the first trajectory), and they also believe that ecological considerations generate new opportunities for innovation (the second trajectory). As these two firms integrate the second trajectory with the first, they are not only invested in the process of innovating for CSR but also motivated by economic incentives as well. This conceptual framework also indicated to us that regardless of the trajectory or trajectories that SMEs choose to follow, we observe SMEs implementing innovation activities and SD initiatives in a complementary fashion; this movement towards SD can allow SMEs to become more socially responsible companies. CONCLUSION Our study sought to address the gaps observed in the literature regarding the issue of complementarity between CSR and innovation in the context of SMEs. The goal of this study was to conduct empirical research to explore the trajectories that could unite CSR and innovation. We were able to establish the complementarity of CSR and innovation at the level of the innovating strategies of the sample of responsible companies examined in this study. The commitment to responsibility for the seven companies sampled was always accompanied by a process of innovation. We were therefore able to identify two distinct trajectories describing the way in which the companies envisage innovation in the adoption of CSR (specifically, the pursuit of sustainable objectives by innovation and/or the creation of innovation opportunities by SD). In addition, we were able to note that these two trajectories are not necessarily mutually exclusive. Certain companies that were sampled prioritized the first trajectory for the social pillar of SD and the second trajectory for the environmental pillar of SD.
Figure 4 : The cross-sectional analysis of innovating strategies
Company
Innovating strategy
The innovation of the company for economic ends
The pursuit of sustainable objectives through
innovation
SD creates opportunities for innovation

GLOBAL JOURNAL OF BUSINESS RESEARCH ♦ VOLUME 7 ♦ NUMBER 5 ♦ 2013
111
In practice, the results and reflections inspired by this exploratory study may be useful for all of the actors who are connected with SMEs and seek to understand and support the implementation of CSR by SMEs. Due to the exploratory character of this study, certain limitations were inevitably present in our investigation. Nevertheless, we believe that a study of this type generally allows for the better understanding of a poorly studied issue and opens new paths for future research. On the methodological level, the major limitations of this study stem from the exploratory nature of the data analysis and the small size of our sample. It might be interesting to choose a more diverse sample of companies, or a sample that extended into either other regions of Belgium (such as Brussels and Flanders) or other countries. Cultural differences might be likely to appear in a more extensive study, and these cultural distinctions could influence the ways in which companies engage in CSR. After this exploration, we believe that we can offer a certain number of insights. The fact that the research addressing this intriguing topic continues to be incomplete leads us to surmise that sufficient investigative potential for the study of CSR in SMEs exists to justify more targeted studies; these targeted studies could then provide a progressively better understanding of this issue, which is continuing to grow in importance in the field of management science. REFERENCES Aegerter, D. and Davoine, E. (2006) « La place des parties prenantes dans la représentation de la responsabilité sociale des dirigeants de PME », Bulletin Oeconomia Humana, décembre. Asselineau, A. and Lechalard P. (2008) « Développement durable et entreprise responsable : une voie pour l’innovation de rupture ? », Cahier de recherche 8/2008, Groupe ESC Clermont. Bocquet, R. and Mothe C. (2010), ‘Exploring the relationship between CSR and innovation: A comparison between large and small-sized French firms”, Conférence de l’Association Internationale Management Stratégique, Luxembourg, juin. Brundtland, G. H. (1987), « Our Common Future », Oxford, Oxford University Press. Carrier, C. and Garand, D. (1996), « Le concept d’innovation : débats et ambigüités », 5ème Conférence Internationale de Management Stratégique, 13-15 mai, Lille. Ernult, J. and Ashta, A. (2007) « Développement durable, responsabilité sociétale de l’entreprise, théorie des parties prenantes : Evolution et perspectives », ESC Dijon Bourgogne. Cahiers du Ceren, 21. European Commission (EC) (2002) « Les PME européennes et les responsabilités sociales et environnementales », Observatoire des PME européennes. European Commission (EC) (2004) « Entrepreneuriat responsable. Exemples de bonnes pratiques mises en œuvre par des petites et moyennes entreprises européennes ». Office des publications officielles des Communautés européennes, Belgique. European Commission (EC). (2006) « La nouvelle définition des PME ». Entreprises et Industrie – Publications. European Commission (EC) (2007) « SME Training Workbook », Response Project.
F. Perrine | GJBR ♦ Vol. 7 ♦ No. 5 ♦ 2013
112
Commission Interdépartementale du Développement Durable (CIDD - Interdepartmental Commission for Sustainable Development) (2006) « Cadre de référence. La responsabilité sociétale des entreprises en Belgique », working paper. David, P., Dupuis, J-C. and Le Bas C. (2005) « Le management responsable : Introduction à quelques travaux récents sur la responsabilité sociale des entreprises » La Revue des Sciences de Gestion, Direction et Gestion, 211-212, p. 23-28. Elkington, J. (1998) “Cannibals with Forks: the Triple Bottom Line of 21st Century Business”, New Society Publishers, Gabriola Island. Gendre-Aegerter, D. (2008) « La perception du dirigeant de PME de sa responsabilité sociale : une approche par la cartographie cognitive », Thèse présentée à la Faculté des Sciences économiques et sociales de l’Université de Fribourg (Suisse). Julien, P-A. (1997) « Les PME : bilan et perspectives », GREPME (Groupe de Recherche en économie et gestion des PME), Economica, Québec. Labelle, F. (2008), « La PME et la durabilité : une gestion qui améliore les capacités d’innovation des entrepreneurs », 9ème Congrès International Francophone en Entrepreneuriat et PME, du 28 au 31 octobre, Louvain-la-Neuve, Belgique. Lapointe, A. and Gendron, C. (2004) « La responsabilité sociale d’entreprise dans la PME ; option marginale ou enjeu vital ? », 7ème Congrès International Francophone en Entrepreneuriat et PME, du 27 au 29 octobre, Montpellier, France. Lapointe, A. (2006) « Vers un engagement de la PME dans la RSE ? », Bulletin Oeconomia Humana, Décembre. Lepoutre, J. and Heene, A. (2006), “Investigating the impact of firm size on small business social responsibility: a critical review”, Journal of Business Ethics, 67:3, 257-273. Little, A. D. (2006), “The Innovation Highground – Winning tomorrow’s customers using sustainability – driven innovation”, Strategic Direction, 22:1, 35-37. MacGregor, S. P., Bianchi, M., Hernandez, J. L. and Mendibil, K. (2007), “Towards the tipping point for social innovation”, Response Project, working paper. Mathieu, A. (2005) « Développement durable et entreprises: du concept à la typologie », Journée Developpement Durable (AIMS), le 11 mai, Aix en Provence. Miles, M. B. and Huberman, A. M. (2003), “Analyse des données qualitatives ». De Boeck, 2ème édition, Bruxelles, Belgique. Organisation for Economic Co-operation and Development (OECD). (2005) « Manuel d’Oslo. Principes directeurs pour le recueil et l’interprétation des données sur l’innovation », 3ème Edition, Editions OCDE. Peeters, A., avec la collaboration de Vermeulen F. et de HEC Consulting. (2005) « Responsabilité sociale des Entreprises en Région wallonne », Etude de faisabilité réalisée à la demande de Ministre Marcourt, Bruxelles.
GLOBAL JOURNAL OF BUSINESS RESEARCH ♦ VOLUME 7 ♦ NUMBER 5 ♦ 2013
113
Quairel, F. and Auberger, M-N. (2005) « Management responsable et PME : Une relecture du concept de responsabilité sociétale de l’entreprise », Revue des sciences de gestion, p. 211-212. Schumpeter, J. A. (1934) “The Theory of Economic Development”, Cambridge, Harvard University Press. Spence, M., Ben Boubaker Gherib, J. and Ondoua Biwolé, V. (2007) « Développement durable et PME. Une étude exploratoire des déterminants de leur engagement », Revue internationale PME, 20 : 3-4, p. 17-42. Spence, M. (2007) « PME et Développement Durable », in Management des PME. De la création à la croissance, sous la direction J. Filion, Pearsons Education, p. 415-427. Temri, L. (2008) « L’entrepreneur et la PME, vecteurs de changement et d’innovation », 9ème Congrès International Francophone en Entrepreneuriat et PME, du 28 au 30 octobre, Louvain-la-Neuve, Belgique. BIOGRAPHY Perrine Ferauge is a Teaching Assistant at Warocqué School of Business and Economics (University of Mons). She works in the Micro Economics Department. Her researches fields are sustainable development, innovation, corporate social communication, and Small-Medium size enterprise. She can be contacted at University of Mons, 20 place Warocqué, 7000 Mons, Belgium. Email: [email protected]


GLOBAL JOURNAL OF BUSINESS RESEARCH ♦ VOLUME 7 ♦ NUMBER 5 ♦ 2013
115
EXTREME PROGRAMMING PROJECT PERFORMANCE MANAGEMENT BY STATISTICAL
EARNED VALUE ANALYSIS Wei Lu, Duke University
Li Lu, University of Electronic Science and Technology of China
ABSTRACT As an important project type of Agile Software Development, the performance evaluation and prediction for eXtreme Programming project has significant meanings. Targeting on the short release life cycle and concurrent multitask features, a statistical earned value analysis model is proposed. Based on the traditional concept of earned value analysis, the statistical earned value analysis model introduced Elastic Net regression function and Laplacian hierarchical model to construct a Bayesian Elastic Net model fitted for project performance evaluation and prediction. The model is demonstrated with the JAX Laboratory software development project data. With simulated coefficients estimation, we realized an empirical data support for project performance assessment. JEL: C35, C63, M15 KEYWORDS: Project Management, Performance, Prediction, Earned Value INTRODUCTION
here has been growing tendency for the usage of the Agile Software Development paradigm these years, due to its claimed lower costs, better performance, productivity, business satisfaction features by Mishra (2011). This paradigm can be applied to supply chain management (SCM), a
complex software development project. Considering its wide scope and complex requirements, predictable models for software development process are not fitted. Targeting such problems involving variability and uncertainty, agile methodologies are adaptive rather than predictive. Thus, for project management, how to evaluate and manage the process performance aiming this development mode is an important issue. Project Management Body of Knowledge (PMBOK), presented by U.S.A Project Management Institution (PMI), regards earned value management as a key method for project performance management. For eXtreme Programming (XP) software project, the difficulty for spreading the application lies in the earned value determination during the process. Especially due to the variability of targets on a later stage of the project, the determination of earned value seems more difficult. Kim and Reinschmidt (2011) proposed a probabilistic cost forecasting method based on self-adaptive inside view (the bottom-up estimate), combining with outside (top-down) view of project cost estimates using Bayesian inferences and model averaging technique. Its precision is high under the condition of linear cumulative cost curve, but models with highly nonlinear features will affect its suitability. In this paper, we introduced a concept of statistical earned value analysis (SEVA). Targeted on the concurrent features of short release cycle, programming, test, and maintaining units for software extreme programming, an analytical model is proposed. This model is able to combine the data of project implementation process with Bayesian theory, and conduct posterior analysis according to the nonlinear characteristics, thus provide timely performance evaluation data analysis to project manager.
T
W. Lu & L. Lu | GJBR ♦ Vol. 7 ♦ No. 5 ♦ 2013
116
The remainder of the paper is organized as follows. In the next section, we review relative literatures; the data and methodology section, a short introduction to EVA is presented, and then an explanation of the Bayesian Elastic Net model followed by a description of the statistical inference methods employed. In the results and discussion part, the project case used is illustrated; subsequently, the analytical results are presented. LITERATURE REVIEW With increasing levels of complexity and uncertainty, project management is a vital task. Due to its contemporary and unique features, it is imperative to gauge the performance. Much work has been made in this area. For example, Hillman (1994) uses the EFQM Model to suggest a practical framework for progress self-assessment. Based on it, Bryde (2003) proposed a project management performance assessment (PMPA) model, using six criteria for assessing PM performance: “project management leadership; project management staff; project management policy and strategy; project management partnerships and resources; project life cycle management processes; and project management key performance indicators”. Qureshi, Warraich and Hijazi (2009) further examined the impact level of these criteria and their association scope. As is put forward by Wysocki (2009), two variables can be used to define the project landscape: “goal” and “solution”. With constant variability of goals and corresponding solutions, Extreme Project Management is an important category of PM. There is a wide range of work addressing the issues related to Extreme Programming (XP) and its process management, e.g., the work of Beck (1999) and Darwish (2011). According to PMBOK, earned value management is an efficient approach for project performance management. By conducting progress and cost analysis through Schedule Performance Index (SPI) and Cost Performance Index (CPI), this method is effective conditioned on two premises: first, earned value is convenient for acquiring and estimating, such as engineering project instance, completed progress’s proportion of the total work amount would be easier to estimate; second, the ultimate goal of the project is relatively fixed, which would make the earned value estimation benchmark more constant. However, as is discussed by Yap (2006) and Zhai etc. (2011), the difficulty of earned value determination during the process for XP software projects lays in its requirement frequent variability, deficiency and flood characteristics. The probabilistic cost forecasting method proposed by Kim and Reinschmidt (2011) is based on self-adaptive inside view combining with outside view of project cost estimates using Bayesian inferences and model averaging technique. During the execution phase, through incorporating actual predictive performance and pre-project cost estimation modification, this method can sufficiently use available prior information. It is precise for linear cumulative cost curve, but not for models with highly nonlinear features. Targeting those unique features of XP performance management, an adaptive model should be implemented. To analyze earned value data and give predictions for future performance, we consider a form of regression. The problem of interest is the estimation of the regression coefficient parameters as well as the prediction accuracy. Tibshirani (1996) proposed the Lasso method to address the feature selection problem and is widely applied in a variety of statistical analysis. However, many project process features has high correlation, while Lasso tends to arbitrarily select just a few of those relevant features and ignore the rest. This property of Lasso will undermine model’s interpretability and robustness. Thus, a naïve Elastic Net estimator is proposed by Zou and Hastie (2005), which yield sparse and grouped variable selection. Sequencing work by Park (2008) and Chen etc. (2011) provided the Bayesian and hierarchical from of Elastic Net method to further enhance the flexibility and accuracy of the model.

GLOBAL JOURNAL OF BUSINESS RESEARCH ♦ VOLUME 7 ♦ NUMBER 5 ♦ 2013
117
DATA AND METHODOLOGY The nature of the XP problem is shown in Figure 1; from which we can see that the prophase and interim performance prediction analysis, with the prophase performance benchmark obtained at early stage, will gradually be adjusted during the development process when performance information and clearer project requirements are gathered from clients and developers. The data is collected during a three-month software-developing project at JAX Laboratory in 2012. Through work breakdown structures (WBS), the total project quantities are determined. The weekly meetings provide assessments of performance for finished tasks and newly added workload. So as to realize plan updating, actual completion degree estimation and sample data collection. Figure 1: Performance Evaluation and Prediction before and after Requirements Change
This figure shows the idea behind XP project where darker bars indicate expected performance while lighter color bars are performance evaluations after requirements change Considering the differences between base and empirical performance for XP projects, the life cycle data is regarded as having truncated features. That is to suppose that only partial life cycle of subroutine individual (explicit requirement) is less than certain value, while the residual potential demand development time exceeds certain value. Since distinct truncation will lead to differences, the SEVA methods are based on Bayesian survival analytical theories. Using Elastic Net method and MCMC steady-state simulation method or variational Bayesian (VB) inference algorithms as derived by Park and Casella (2008), we constructed project Bayesian survival analysis model, in order to solve the difficulties of high dimensional numerical integration. By constructing XP project life period regression model, the influence of environmental and target conditions variability on the project performance is effectively reflected. The key steps for this analytical model, which are derived in detail by Chen, Carlson and Zaas (2011), are as follows: Step 1: Construct Elastic Net regression target function to solve multi-linear problem as a substitution of Principal factor analysis; �̂�(𝑁𝑎𝑖𝑣𝑒 𝐸𝑁𝑒𝑡) = 𝑎𝑟𝑔𝑚𝑖𝑛 ‖𝑦 − 𝑋𝛽‖22 + 𝜆1‖𝛽‖1 + 𝜆2‖𝛽‖22 (1) This is the naïve elastic net criterion, which can be viewed as a penalized least squares method and a convex combination of the lasso and ridge penalty. Step 2: Construct Laplacian Hierarchical Model with the following Laplace prior form;
𝑝(𝛽|𝜏, 𝛾) = ∏ �𝛾𝑗𝜏2𝑒𝑥𝑝�−�𝛾𝑗𝜏|𝛽𝑗|�𝑝
𝑗=1
= ∏ ∫𝑁�𝛽𝑗; 0, 𝜏−1𝛼𝑗−1�𝑝𝑗=1 𝐼𝑛𝑣𝐺𝑎 �𝛼𝑗; 1, 𝛾𝑗
2� 𝑑𝛼𝑗 (2)
Step 3: Construct the complete Bayesian Elastic Net Model. A Gamma prior is imposed on each individual 𝛾𝑗 to avoid tuning;
02468
10
0 1 2 3 4 5 6 7 8 9 10 11 12

W. Lu & L. Lu | GJBR ♦ Vol. 7 ♦ No. 5 ♦ 2013
118
𝒚~𝑁(𝑦;𝑿𝛽, 𝜏−1𝑰) 𝛽𝑗~𝑁�𝛽𝑗; 0, 𝜏−1(𝛼𝑗 + 𝜆2)−1� 𝜏~𝐺𝑎(𝜏; 𝑐0,𝑑0) 𝛼𝑗~𝜂(𝛼𝑗 (𝛼𝑗 + 𝜆2))⁄
12 𝐼𝑛𝑣𝐺𝑎 �𝛼𝑗; 1, 𝛾
2�𝐺𝑎(𝛾𝑗; 𝑎0,𝑏0) (3)
Where 𝜂 is a normalizing constant, and 𝜆2 is a parameter tuned by cross validation. Step 4: Put forward the specific hyper-parameters of fully extended model.
𝑝(𝒚,𝛽, 𝜏,𝛼, 𝛾) ∝ 𝑁(𝑦;𝑿𝛽, 𝜏−1𝐼)𝐺𝑎(𝜏; 𝑐0,𝑑0)
× �𝑁�𝛽𝑗; 0, 𝜏−1�𝛼𝑗 + 𝜆2�−1� (𝛼𝑗 (𝛼𝑗 + 𝜆2))⁄
12
𝑝
𝑗=1
× 𝐼𝑛𝑣𝐺𝑎 �𝛼𝑗; 1, 𝛾𝑗2� 𝐺𝑎�𝛾𝑗; 𝑎0,𝑏0� (4)
RESULTS AND DISCUSSION The results for the JAX Laboratory case study are presented in this section. This is a comprehensive system development project which requires data preprocessing, singular value decomposition (SVD), single-locus regression, Extreme Value Decomposition (EVD) test, pair-wise linear regression analysis, error propagation calculation, permutation test and networking construction in a 3-month period. Using XP mode, this project gradually perfects the identification and range definition of final target. Thus, an EVA method combining with dynamic prediction is required. Due to the uncertainty in initial phases of development, there are several modifications of bench plan during the process requiring prediction analysis to determine the best action strategy. Here, we use character A-J to represent each step of JAX project. Each of them contains about 50 activities. Performance analysis is conducted on a daily basis. By adopting statistical earned value analysis (SEVA) methods, we applied Bayesian posterior model to performance prediction. Based on Bayesian Enet model presented in the previous section, SEVA results during the project implementation process are shown in Table 1. After simulating with Schedule Performance Index (SPI) and Cost Performance Index (CPI) analysis, we can obtain the project performance evaluation for each stage (Table 2). We applied the Bayesian Elastic Net model introduced in the previous section to 12 groups of simulated data, where each group includes 10 earned values of sequential steps A-J. The simulation results are shown in Figure 2. The circles represent our prior expectations of the project performance, while the crosses represent posterior performance estimations. After using five samples for regression coefficient training, we modified our performance beliefs for the left seven samples. From the figure, we can see that the residuals are within an acceptable range, which proves the effectiveness of SEVA method. Table 1: Statistical Earned Value Analysis during the Project Implementation Phases
A B C D E F G H I J 0.077 0.096 0.161 0.064 0.161 0.096 0.080 0.064 0.125 0.074 0.073 0.091 0.152 0.061 0.152 0.091 0.076 0.061 0.119 0.070 0.073 0.118 0.210 0.085 0.152 0.091 0.076 0.061 0.119 0.070 0.069 0.112 0.199 0.080 0.144 0.087 0.072 0.058 0.113 0.066
This table shows the earned value of each project stage, where A-J represents the steps in sequence.
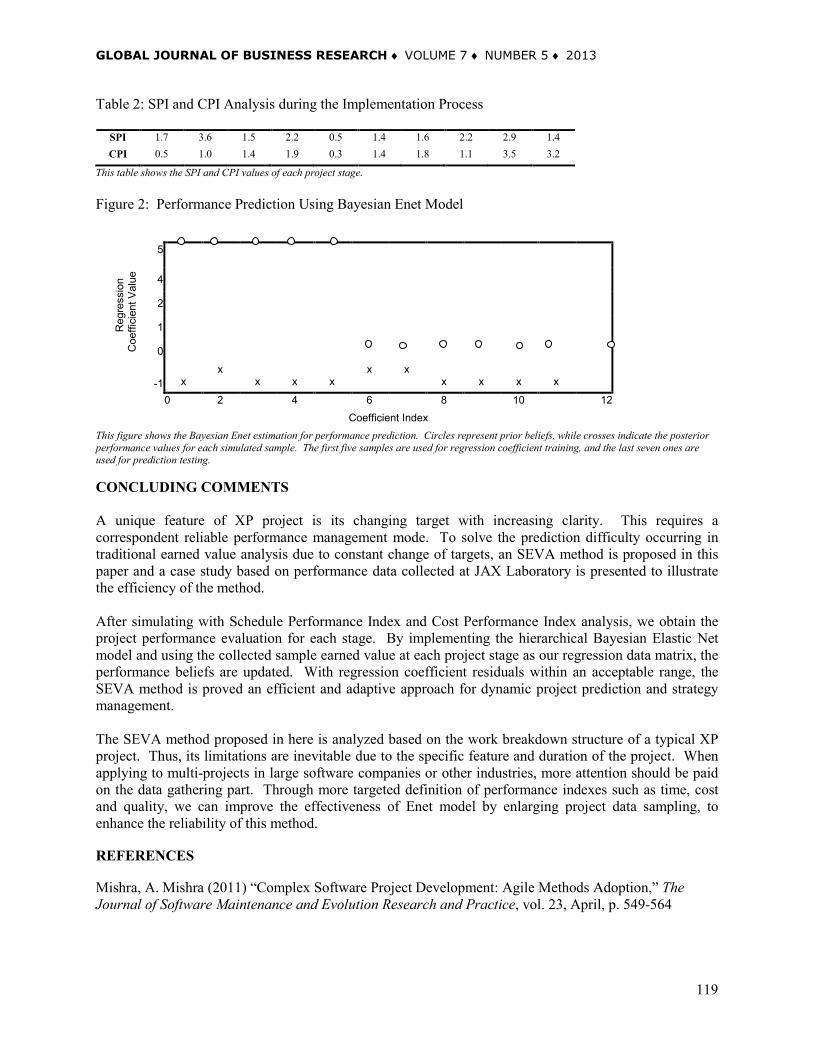
GLOBAL JOURNAL OF BUSINESS RESEARCH ♦ VOLUME 7 ♦ NUMBER 5 ♦ 2013
119
Table 2: SPI and CPI Analysis during the Implementation Process
SPI 1.7 3.6 1.5 2.2 0.5 1.4 1.6 2.2 2.9 1.4 CPI 0.5 1.0 1.4 1.9 0.3 1.4 1.8 1.1 3.5 3.2
This table shows the SPI and CPI values of each project stage. Figure 2: Performance Prediction Using Bayesian Enet Model
5
4
2
1
0
-1
x
x x
x
x
x x x
x
x
x
0 2 4 6 8 10 12 Coefficient Index
This figure shows the Bayesian Enet estimation for performance prediction. Circles represent prior beliefs, while crosses indicate the posterior performance values for each simulated sample. The first five samples are used for regression coefficient training, and the last seven ones are used for prediction testing.
CONCLUDING COMMENTS A unique feature of XP project is its changing target with increasing clarity. This requires a correspondent reliable performance management mode. To solve the prediction difficulty occurring in traditional earned value analysis due to constant change of targets, an SEVA method is proposed in this paper and a case study based on performance data collected at JAX Laboratory is presented to illustrate the efficiency of the method. After simulating with Schedule Performance Index and Cost Performance Index analysis, we obtain the project performance evaluation for each stage. By implementing the hierarchical Bayesian Elastic Net model and using the collected sample earned value at each project stage as our regression data matrix, the performance beliefs are updated. With regression coefficient residuals within an acceptable range, the SEVA method is proved an efficient and adaptive approach for dynamic project prediction and strategy management. The SEVA method proposed in here is analyzed based on the work breakdown structure of a typical XP project. Thus, its limitations are inevitable due to the specific feature and duration of the project. When applying to multi-projects in large software companies or other industries, more attention should be paid on the data gathering part. Through more targeted definition of performance indexes such as time, cost and quality, we can improve the effectiveness of Enet model by enlarging project data sampling, to enhance the reliability of this method. REFERENCES Mishra, A. Mishra (2011) “Complex Software Project Development: Agile Methods Adoption,” The Journal of Software Maintenance and Evolution Research and Practice, vol. 23, April, p. 549-564
Reg
ress
ion
Coe
ffici
ent V
alue
W. Lu & L. Lu | GJBR ♦ Vol. 7 ♦ No. 5 ♦ 2013
120
Project Management Institute (PMI) (2008) “A Guide to the Project Management Body of Knowledge,” 4th ed., Newtown Square, PA Kim & Reinschmidt (2011) “Combination of Project Cost Forecasts in Earned Value Management,” The Journal of Constr. Eng. Management, vol. 137, June, p. 958-966 Hillman, G.P. (1994) “Making Self-assessment Successful,” The TQM Magazine, vol. 6 No. 3, pp. 29-31 Bryde JD (2003) “Modeling Project Management Performance,” The International Journal of Quality Reliability Manage, vol. 20(2), p. 225–229 Qureshi, Tahir Masood; Warraich, Aamir Shahzad; Hijazi, Syed Tahir (2009) “Significance of Project Management Performance Assessment (PMPA) Model,” The International Journal of Project Management, vol. 27, p. 378–388 Wysocki, Robert K. (2009) “Effective Project Management : Traditional, Agile, Extreme,” 5th ed., Wiley Pub. Beck, Kent (1999) “Extreme Programming Explained: Embrace Change,” Addison Wesley Darwish, Nagy Ramadan (2011) “Improving the Quality of Applying eXtreme Programming (XP) Approach,” The International Journal of Computer Science and Information Security, vol. 9 (11), p. 16. Yap, Monica (2006) “Value Based Extreme Programming,” Agile Conference, July, p. 184-191 Zhai, Li-li; Hong, Lian-feng & Sun, Qin-ying (2011) “Research on Requirement for High-quality Model of Extreme Programming,” International Conference on Information Management, Innovation Management and Industrial Engineering, vol.1, p. 518 – 522 Tibshirani, R. (1996) “Regression Shrinkage and Selection via the Lasso,” The Journal of Royal Statistical Society Series B, vol. 58, p. 267–288 Zou, H.; Hastie T. (2005) “Regularization and Variable Selection via the Elastic Net,” The Journal of Royal Statistical Society Series B, vol. 67, p. 301–320 Chen, Minhua; Carlson, David & Zaas (2011) “Detection of Viruses via Statistical Gene-Expression Analysis,” IEEE Transaction of Biomedical Engineering, vol. 58(3), March, p. 468-479 Park, Casella (2008) “The Bayesian Lasso,” The Journal of the American Statistical Association, Vol. 103, p. 681–686 BIOGRAPHY Wei Lu is Electrical and Computer Engineering graduate focus on statistical data mining at Duke University, who can be reached at [email protected]. Li Lu is Associate Professor of Management and Economics School at University of Electronic Science and Technology of China, who can be reached at [email protected].

GLOBAL JOURNAL OF BUSINESS RESEARCH ♦ VOLUME 7 ♦ NUMBER 5 ♦ 2013
121
WHAT DO EXPERTS EXPECT FROM HUMAN RESOURCE PRACTICES
Jocelyne Abraham, IAE de Tours - CERMAT Lucie Morin, Université du Québec à Montréal
Stephane Renaud, Université de Montréal Jean-Yves Saulquin, Loire Valley University / France Business School Richard Soparnot, Loire Valley University / France Business School
ABSTRACT
Knowing how to attract highly qualified employees known as experts is of critical importance to many organizations in the new knowledge economy. The aim of this exploratory empirical study is to examine experts’ expectations in regard to organizational and job related factors. After defining what is an expert, we review academic research on what attracts employees and how this applies to experts. Our data come from a large organization in the high technology sector. Results show that, in many ways, the expectations of experts differ from those of less qualified employees. For instance, when they consider a potential employer, financial rewards linked to performance are more significant to experts than to other employees whereas unusual perks (e.g., lounge) and work-life balance are less significant. JEL: M12 KEYWORDS: Expert, HR Practices, Attraction INTRODUCTION
n many parts of the industrialized world, the knowledge-based economy is on the increase. This particular form of economy is mainly based on the intellectual capital of an organization. This is not a new idea. In 1776, the economist Adam Smith, in The Wealth of Nations, did not only include
material wealth in his definition of fixed capital but equally included the value of experience useful to all members of an organization. Further, he considered education and training to be key examples of human investment. Nowadays, businesses are increasingly relying on intellectual capital rather than physical capital as a source of value creation. In numerous sectors of activities, we are witnessing a truly « intellectual revolution » which confers a strategic dimension upon immaterial assets. These assets, which are of an intellectual nature, constitute rare, key resources capable of differentiation which can create a lasting competitive advantage if the conditions are right. Intellectual capital has been studied by many academic research scientists (Bontis, 1998, 1999, 2003; Edvinsson & Malone, 1997; Lev, 2001; Roos, Roos, Dragonetti & Edvinsson, 1997). It can be defined as a group of resources, some of them having an external component (e.g., brands, patents, reputation and consumer satisfaction levels) whereas others being more internal to an organization (e.g., strategic competence of a company’s employees). Highly qualified employees known as experts are at the tipping point between external and internal resources. Knowing how to attract such personnel is thus of critical importance to a business (Deloitte, 2008; Peretti, 2008). Attracting experts is even more important in the high technology industry sector which is essentially an innovative sector. The productivity and competitivity in this sector rest mostly on the creativity of its personnel (Iles, Chuai & Preece, 2010). Competition appears to boil down to the differential in knowledge between business competitors in the sector (Prahalad & Hamel, 1990). Thus, experts constitute a key resource for businesses that want to survive and grow. It is strategically important for top-managers as
I
J. Abraham et al | GJBR ♦ Vol. 7 ♦ No. 5 ♦ 2013
122
well as operational managers, to concentrate on this target group of employees and understand what expectations they might have in regard to the organization and the job itself. The main objective of this article is to examine the expectations of experts in regard to organizational and job related factors and to offer suggestions to HR managers as to how best to deal with this strategic resource. Specifically, we want to answer the following research question: what do experts want in terms of human resources practices and to what extend do these expectations differ from those of less qualified employees? Our paper is structured as follow: First, we define the concept of expert. Eventhough the term “expert” is very often used in professional settings, the scientific literature does not offer a clear definition of that concept. Second, we review the relevant academic literature on attraction. Specifically, we present a summary of case literature focusing on the notion of expectations as well as the perception of employees themselves on the subject of what makes a good employer. Third, we present the data and methodology used in this exploratory empirical study, this section being followed by our results. Last, we draw conclusions that are of both scientific and managerial importance.
LITTERATURE REVIEW What is an Expert? Experts are a strategic resource. As an integral part of the human capital of any organization, experts have a very direct impact on performance, first because of their skills (Becker, Huselid, Pickus & Spratt, 1997) and second because they constitute a particularly volatile resource, courted for a price and actively pursued by « head-hunters ». An expert whose talent is either not formally recognized by the company or whose talent is under appreciated, can attract interest from and be lured away by a market competitor. This can result in the loss of a key resource and cause recruitment difficulties in finding a replacement for the particular resource skill-set of the departing employee. Poor management of experts in a company actually has two negative consequences – firstly, the impact it has upon competitive edge and market position; and secondly the impact it has upon reputation in the employment market. Being able to identify talent, attracting and retaining the expertise of key personnel is a crucial human capital management issue in terms of HR function. Identifying experts in a business is not an easy task. A recent study (Abraham, Saulquin & Soparnot, 2011) identified the key characteristics of an expert. As detailed in Table 1, an expert can be defined along three main characteristics: knowledge, significant role in decision making and experience. Table 1: Expert Definitions from the Academic Literature
Bouchez (2006) Roquepio (1997) Trépos (1996) Knowledge Role in decision-making Experience
Defined an expert in terms of actions based upon knowledge
Defined an expert in terms of role played in decision- making process
Defined an expert in terms of experience and background
Transforms and creates knowledge, manipulates concepts and ideas.
Contributes towards ‘informed view and balanced judgement’, provides knowledge in order to facilitate decision-making process
Has experienced danger (experiti), has been confronted and had his knowledge tested (expertis)
Difference between expert who resolves complex problems and the creative expert who puts forward inventive and commercially viable propositions
Difference between scientific statement and and scientific expertise (existence of a decision-making process)
Expert distinguished by ability to deal with situations as a result of experience acquired in dealing with similarly difficult situations in the past
An Expert can be defined along three main characteristics: knowledge, significant role in decision making and experience. An expert possesses knowledge above and beyond the norm. According to Bouchez (2006), an expert doesn’t just apply knowledge. He or she is first and foremost a creator of knowledge. The expert employee doesn’t just deal with information but has a genuine ability to manipulate ideas and concepts. In

GLOBAL JOURNAL OF BUSINESS RESEARCH ♦ VOLUME 7 ♦ NUMBER 5 ♦ 2013
123
this respect, an expert possesses a level of competence over and above the norm. In the majority of large companies, competence (knowledge, know-how and life skills) is measured by specially adapted criteria (employment and competency reference systems) on scales of several levels (for exemple five levels). An expert is at the very top of this scale of measurement. Further, in terms of being a creator of knowledge, the expert carries with him a certain reputation which situates him or her on a second scale, namely prestige. This recognizes that an employee can be specifically sought out on the basis of his ability, have his ability recognized by others, enjoy a reputation because of his ability and be revered as a result. An expert also occupies a special role in the decision-making process of an organization (Roquepio, 1997). In order to appreciate this particular characteristic, the scientific expert is the one which perhaps most readily comes to mind. The scientific expert is consulted during the decision-making process in order to bring the full weight of his knowledge (recognized and accepted as being scientifically sound) to assist the decision-making process. His role in this instance is to provide knowledge not make decisions. He helps create an ‘informed view and balanced judgment’ on various aspects of a given problem. In a business, an expert might have a different role, in as much as the expertise sought may be more technical than scientific and in as much as the salaried expert is contractually bound to a company. Personnel considered to be experts are paid to provide advice, wherever possible based on knowledge established scientifically; or alternately to provide an opinion based on personal conviction, the conviction itself being the product of the expert’s own experience and competence. Last, the career projectory of an expert, and thus his or her experience, is in general particular. As Trépos (1996) indicates, the Latin origin of the term expert suggests “experience”, or in other words, a certain testing or endurance. An expert is therefore someone who has experienced situations, who has confronted the dual dangers of ignorance and error. As a result, he is deemed capable of objectivity, not like someone swayed by passion or ideology. In trying to describe the factors shaping the career path of an expert, the following are good markers: 1) a career path distinguished by problems which have been successfully overcome and which have resulted in the acquisition of experience as a result; 2) a current work reputation which is further proof of his ability to deploy his know-how and considerable problem-solving skills; and 3) a positive future since reputation is acquired and there is an expectation of further success in the future. In summary, an expert is a person who is imbued with competence at the highest level of the scale of intellectual knowledge within a business, which reflects a capacity to adapt knowledge to any given situation which is new, complex and unexpected. Secondly, an expert is someone who has particular legitimacy and carries particular weight, both within the organization and outside it in terms of either peer or trademark recognition and who often has a large social network and a well-earned reputation as a result. The position of the expert is all the more strategic within an organization because he or she occupies a central role either as an advisor or as a decision-maker. Success in the past and particularly the prospect of future success is an indicator of the value an expert represents. It is therefore crucial for a business to know how to manage this particular category of personnel as much to prevent them from being poached by the opposition as to retain them for the business. Human resource practices have evolved significantly over the past few decades. In today’s world, it’s less about means and more about the ability to understand the expectations of employees within a particular field. Since the contribution an expert can make is contingent to and depends on a particular business, its working environment and style of management, it is essential to develop an understanding of the expectations an expert might have both in relation to the wider organization generally and to his or her immediate work environment and job in particular. However, to our knowledge, there is no literature on this precise subject. Thus, we reviewed literature on expectations at large. The following section presents a summary of that literature.
J. Abraham et al | GJBR ♦ Vol. 7 ♦ No. 5 ♦ 2013
124
Which Factors Attract Employees? More than three decades ago, a seminal study conducted by Jurgensen (1978) examined employment characteristic preferences such as the type of business, employment security, work colleagues, career development, management, pay, working conditions and working hours etc. Further, these characteristics were studied by demographic variables such as gender, age, level of qualification and marital status. In brief, results show that gender matters in regard to preferences. Research has also explored relationships between employment characteristics and recruitment (Cable & Judge, 1996, 1997; Ehrhart & Ziegert, 2005; Rynes & Barber, 1990; Turban, 2001). However, none of these studies made any distinction between different categories of employee. The « fit » between the workplace culture and a candidate’s individual personality can also have an impact and influence upon the attraction of personnel (Judge & Cable, 1997; Sheridan, 1992; Van Vianen, 2000). In regard to practices related to HR, our review of previous research indicates that two key groups of factors emerge in relation to discussion about what attract employees: organizational practices (ex: work-life balance policies) and job related practices (ex: pay). Review of previous academic literature suggests that explicative variables related to job characteristics are more important in terms of attraction, recruitment and retention. The literature reveals that six factors have a significant impact on attraction (Carless & Imber, 2007). These factors not only relate to the content of the job itself but also deal with issues peripheral to the employment. They relate specifically to HR practices, tools or groups of tools or practices. The first factor is the nature of the work itself (the job one is doing). The quality of the job for which they are recruited (or are currently doing) is of paramount importance to them. The job itself needs to be professionally stimulating and interesting. Individuals in this sector seek work that is interesting, provides the opportunity to use previous experience accrued and also the opportunity to stretch themselves and so acquire more experience. They particularly appreciate varied and challenging work. A second important factor has to do with the immediate work environment.Working as part of a team either physically or virtually, or project-based work requires the employee to belong to at least one if not several social networks, including links with close or more distant colleagues or teams. A pleasant work place and working environment stimulates the work ethic. In relation to this specific category of employee – the expert, in addition to workplace environment, the intellectual quality of the team in which he or she works is also important. This factor and the previous concern the job itself and what it can bring to an employee. The third factor is global compensation (direct and indirect as well as extrinsic and intrinsic compensation). As the other following factors, it relates more generally to the organization as a whole and what it can offer an employee. Global compensation includes compensation in all possible contexts such as benefits, immediate or deferred salary enhancement, career advancement or status and reputation involved in current or future posts (pay and career). Reward linked to performance is a practice which needs to be prioritised in the fight for talent (Sturman, Trevor, Boudreau & Gerhart, 2003). The fourth factor is corporate image or reputation. Studies show that employees are attracted to well-known businesses, with a good reputation and an unblemished ethical background where values similar to their own prevail (Judge & Cable, 1997). A fifth organizational factor is location. A pleasant town or work complex, the quality of the surroundings for both the employee and his family, availability of public transport and access to motorway routes, proximity to family are equally factors which help attract and retain an employee.

GLOBAL JOURNAL OF BUSINESS RESEARCH ♦ VOLUME 7 ♦ NUMBER 5 ♦ 2013
125
Finally, the sixth factor relates to health and welfare or, in other words, an individual’s search for wellbeing, physical and mental health and a work life balance. Some companies are keen to invest in the health and wellbeing of their employees by offering sports facilities and activities, and other personal services, corporate concierges, massage or personal training. Included in this sixth factor is the need a business may feel to monitor workloads for their staff to achieve a good home life -work balance. More recently, characteristics such as corporate image and company ethics, workplace culture, and social responsibility have emerge as important considerations. In support, results from Tsai and Yang (2010) indicate that corporate image - covering product, service and company ethics- has an impact upon attraction and recruitment of potential candidates. A good fit between a company’s ethics and an individual’s values also has a positive effect upon recruitment (Coldwell, Billsberry, Van Meurs & Marsh, 2007). Prospective employees have increasingly been attracted by the social dimension and social responsibility policies of a company (Corrigall, 2008; Thibodeaux & Jose, 1999) particularly those who demonstrate respect for work-family balance (Bourhis & Mekkaoui, 2010). Base on both the social identity theory and the signal theory, Greening and Turban (2000) suggested that personnel, especially the most talented, are particularly proud to be associated with companies which demonstrate a proven track record of social responsibility. The theory of social identity is bound up with the image an employee might have of himself or herself and how this is influenced by the image and reputation of the employer (Dutton, Dukerich & Harquail, 1994). On the topic of talent management, Mirallès (2007) emphasizes the need for HR practices to have strong connections between four different functions – scouting (the whole range of practices involved in recruitment of the very best candidates), casting (ability to create a good team and thus demonstrate the enjoyment to be found in working as a group), coaching (which encompasses all personal development techniques such as individual career development, and methodologies which promote team bonding, participation and motivation) and cocooning (which relates to resource retention and protection). Our study focuses on the first function or scouting. To our knowledge, there is no empirical study on what experts want, on from the opposite perspective, what can an organization offer to an expert to attract him or her. DATA AND METHODOLOGY Data Our data come from a survey conducted amongst employees of a worldwide business in the high technology sector. To be more specific, our sample was made up of all new employees hired between April 2009 and September 2010 in one North American office of the company. Data collection was carried out electronically using the SurveyMonkey website, a secure site frequently used by North American university researchers. Within the first six months of starting their new job, each new employee was invited via an email to complete a questionnaire. Participation in the survey was entirely voluntary and provision was made for the employees to complete the survey during work hours. The questionnaire included a section on individual characteristics and another on employee expectations in terms of organizational and job characteristics sought in a prospective employer. Employees were divided into three groups to facilitate the administration of the survey. Group 1 included employees hired between April and September 2009 and surveyed in October 2009; Group 2 included employees hired between October 2009 and March 2010 and surveyed in April 2010; and Group 3 included employees hired between April and September 2010 and surveyed in October 2010. In order to maximize our response rate, a reminder email was sent two weeks after the first introductory email. In addition, a research assistant was on site for few days at the start of the survey to encourage participation and to answer questions.

J. Abraham et al | GJBR ♦ Vol. 7 ♦ No. 5 ♦ 2013
126
In total, 353 employees participated in our study. Group 1 included 181 participants out of a total of 246 new employees (73.57 % response rate). Group 2 comprised 90 participants out of a total of 114 new employees (78.95 % response rate). Finally, group 3 comprised 82 participants out of a total of 96 new employees (85.42 % response rate). Our overall response rate is thus of 77.41 % (353 / 456). This is a particularly high response rate for this type of survey. Measures Our independant variable has to do with being an expert or not. The company where we conducted our survey divides its employees into five different levels of ability and contribution: 1) Works under supervision; 2) Is Autonomous; 3) Has problem solving ability; 4) Can innovate; and 5) Has demonstrated leadership. An employee at the «works under supervision » level will have a good knowledge of his professional subject. His work needs to be supervised by someone more experienced, because he is basically working at apprentice level. In terms of competence he or she will be able to use functional tools of a basic nature or understand simple processes depending on the task involved. Such an employee has to respect the existence of constraints. An employee, who demonstrates «autonomy» has a good understanding of his role, behaves in a professionally responsible way and is fully functional in this work. There is regular supervision of his work. In terms of competence he has an efficient working knowledge of the majority of the tools used or is able to understand concepts and processes involved in the work of his team as well as their impact upon other teams, depending on the task involved. He is able to respond to a well defined request. An employee with « problem solving ability » is an individual who is able to solve complex problems or issues, take important decisions and share his knowledge. He has to report to a senior colleague on strategic matters. At this level of competence, he is able to make maximum use of tools and processes, depending on the task involved and is able to suggest improvements. He is able to anticipate problems and offer solutions. An employee who is considered to be at the « innovation » level has a track record of innovation, of creative thinking and is able to introduce concrete steps to encourage the successful development of his team. He shares his own expertise and sets his own targets. In terms of his ability he develops strategies as well as tools or processes depending on the particular case. He is involved in the creative process and puts forward ideas. The last employee category is defined as « leadership » level. An employee finding himself in this category has a significant influence in his field and is considered to be a role model. He represents his division and carries out his leadership role efficiently. In terms of his ability, he has a track record of leadership and ability to inspire a team. He is able to inspire and engage his particular division. The HR department placed each surveyed employee in one of the above five categories. We have used this categorization to create our variable model in relation to experts. We believe that the categories of « innovation » and « leadership » best describe the concept of an expert. In total, 37 participants had been placed in these two categories. In addition, as discussed above, experts also have in general a very high level of education. We thus added this variable to our categorization. In summary, a participant who was classified by the company in the innovation or leadership category and who had a university qualification (minimum three years of study at university) was classified as an expert (Coding = 1) whereas all other employees were classified as non experts (Coding = 0). Out of a total of 353 participating employees, 22 (6.23 %) were coded as experts. The fact that there are so few in this category is coherent with the existing academic research suggesting that there is a very small proportion of employees in any given business who fall into the expert category. Our dependant variables are the expectations in regard to organizational and job related factors. Our questionnaire included 68 items. Table 2 details each item. As one can notice, there is no item relating to location, a key factor pointed out in the literature. This factor was not important for the organization we worked with. Specifically, participants were asked to answer the following question: « To what degree are the following factors important to you when applying for a job with a prospective employer? ».
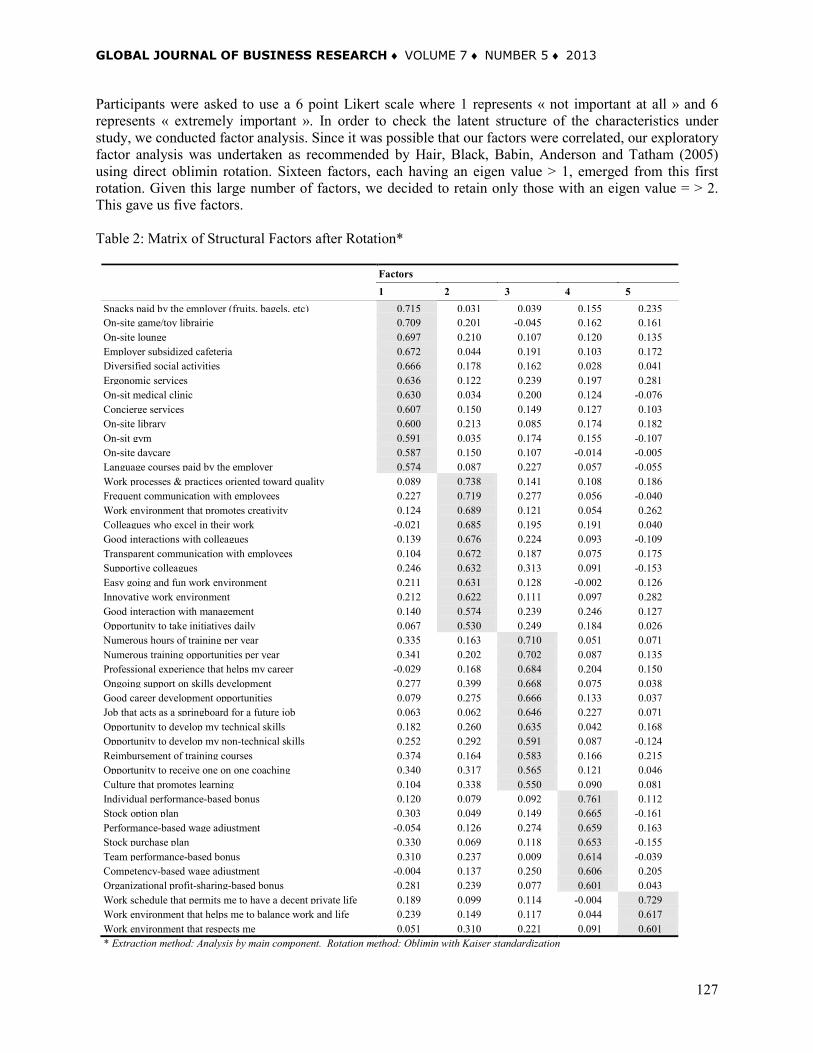
GLOBAL JOURNAL OF BUSINESS RESEARCH ♦ VOLUME 7 ♦ NUMBER 5 ♦ 2013
127
Participants were asked to use a 6 point Likert scale where 1 represents « not important at all » and 6 represents « extremely important ». In order to check the latent structure of the characteristics under study, we conducted factor analysis. Since it was possible that our factors were correlated, our exploratory factor analysis was undertaken as recommended by Hair, Black, Babin, Anderson and Tatham (2005) using direct oblimin rotation. Sixteen factors, each having an eigen value > 1, emerged from this first rotation. Given this large number of factors, we decided to retain only those with an eigen value = > 2. This gave us five factors. Table 2: Matrix of Structural Factors after Rotation*
Factors
1 2 3 4 5 Snacks paid by the employer (fruits, bagels, etc) 0.715 0.031 0.039 0.155 0.235 On-site game/toy librairie 0.709 0.201 -0.045 0.162 0.161 On-site lounge 0.697 0.210 0.107 0.120 0.135 Employer subsidized cafeteria 0.672 0.044 0.191 0.103 0.172 Diversified social activities 0.666 0.178 0.162 0.028 0.041 Ergonomic services 0.636 0.122 0.239 0.197 0.281 On-sit medical clinic 0.630 0.034 0.200 0.124 -0.076 Concierge services 0.607 0.150 0.149 0.127 0.103 On-site library 0.600 0.213 0.085 0.174 0.182 On-sit gym 0.591 0.035 0.174 0.155 -0.107 On-site daycare 0.587 0.150 0.107 -0.014 -0.005 Language courses paid by the employer 0.574 0.087 0.227 0.057 -0.055 Work processes & practices oriented toward quality 0.089 0.738 0.141 0.108 0.186 Frequent communication with employees 0.227 0.719 0.277 0.056 -0.040 Work environment that promotes creativity 0.124 0.689 0.121 0.054 0.262 Colleagues who excel in their work -0.021 0.685 0.195 0.191 0.040 Good interactions with colleagues 0.139 0.676 0.224 0.093 -0.109 Transparent communication with employees 0.104 0.672 0.187 0.075 0.175 Supportive colleagues 0.246 0.632 0.313 0.091 -0.153 Easy going and fun work environment 0.211 0.631 0.128 -0.002 0.126 Innovative work environment 0.212 0.622 0.111 0.097 0.282 Good interaction with management 0.140 0.574 0.239 0.246 0.127 Opportunity to take initiatives daily 0.067 0.530 0.249 0.184 0.026 Numerous hours of training per year 0.335 0.163 0.710 0.051 0.071 Numerous training opportunities per year 0.341 0.202 0.702 0.087 0.135 Professional experience that helps my career -0.029 0.168 0.684 0.204 0.150 Ongoing support on skills development 0.277 0.399 0.668 0.075 0.038 Good career development opportunities 0.079 0.275 0.666 0.133 0.037 Job that acts as a springboard for a future job 0.063 0.062 0.646 0.227 0.071 Opportunity to develop my technical skills 0.182 0.260 0.635 0.042 0.168 Opportunity to develop my non-technical skills 0.252 0.292 0.591 0.087 -0.124 Reimbursement of training courses 0.374 0.164 0.583 0.166 0.215 Opportunity to receive one on one coaching 0.340 0.317 0.565 0.121 0.046 Culture that promotes learning 0.104 0.338 0.550 0.090 0.081 Individual performance-based bonus 0.120 0.079 0.092 0.761 0.112 Stock option plan 0.303 0.049 0.149 0.665 -0.161 Performance-based wage adjustment -0.054 0.126 0.274 0.659 0.163 Stock purchase plan 0.330 0.069 0.118 0.653 -0.155 Team performance-based bonus 0.310 0.237 0.009 0.614 -0.039 Competency-based wage adjustment -0.004 0.137 0.250 0.606 0.205 Organizational profit-sharing-based bonus 0.281 0.239 0.077 0.601 0.043 Work schedule that permits me to have a decent private life 0.189 0.099 0.114 -0.004 0.729 Work environment that helps me to balance work and life 0.239 0.149 0.117 0.044 0.617 Work environment that respects me 0.051 0.310 0.221 0.091 0.601
* Extraction method: Analysis by main component. Rotation method: Oblimin with Kaiser standardization

J. Abraham et al | GJBR ♦ Vol. 7 ♦ No. 5 ♦ 2013
128
Then, we carried out a second factor analysis specifically extracting five factors from the original total of 68 items. This was conducted using a varimax rotation since this method produces very similar results to direct oblimin rotation but is able to extract uncorrelated factors. Items with a score below 0.50 were withdrawn from the sample – 19 items in total. We then carried out a third factor analysis using varimax rotation on the 52 remaining items – with extraction of the 5 factors. Results revealed that five items scored > 0.40 on more than one factor. These items were removed. A fourth factor analysis using varimax rotation was carried out on the 47 remaining items and the results enabled us to remove three items with scores less than 0.50. The results of the final factor analysis carried out on the remaining 44 items are presented in Table 2. We carried out factor analysis of the main components using varimax rotation. The Bartlett test for sphericity (score of 0.00), and the Kaiser-Meyer-Olkin (KMO) validity measuring tool score of 0.906 indicate a very satisfactory result overall. Results from Table 2 suggest the five following categories of expectations : 1- Unusual perks (12 items), 2- Dynamic work environment (11 items), 3- Development and career (11 items), 4- Incentive compensation (7 items), and 5- Work-life balance (3 items). We calculated the alpha coefficients for each of these five factors. Results were as follows: Unusual perks – benefits and workplace environment factors α = 0.901; Dynamic work environment α = 0.904; Development and career α = 0.910; Incentive compensation α = 0.835; Work-life balance α = 0.784. The high rate of alphas scored indicates that all these factors demonstrate an excellent level of internal consistency. In order to carry out our statistical analysis we applied the factorial score to each participant for each category of expectation. The factorial scores were standardized and indicated an average of 0 and a standard deviation of 1. For instance, individuals with a negative factorial score in the area of unusual perks showed a lower than average level of expectation in comparison to other participants. Similarly, participants with a positive score had a higher than average level of expectation in comparison to the rest of the group. The five factors which came out of our factor analysis are coherent with this existing body of research reviewed earlier which proposes a six factor model (our five factors plus location). RESULTS AND DISCUSSION What matters most for experts? Do these expectations differ between experts and non experts? These are the two questions we tried to address in this study. Table 3 presents the means by factor for each category of employees as well as the results from T-Test in regard to the five factors under study. As mentioned above, we used factorial standardized scores. Thus, all scores have a mean of 0 and a standard deviation of 1. To decode our results, one can use the following two cases: individuals with a positive factorial score for the factor “Dynamic work environment” show a higher than average level of expectation in comparison to other participants whereas individuals with a negative score have a lower than average level of expectation in comparison to the rest of the group. Considering this, our results indicate, from most important to least, experts’ expectations are : incentive compensation, dynamic work environment, development and career, work-life balance and unusual perks. Respectively, non experts show the following ranking but with less variance among factors: unusual perks, work-life balance, development and career, dynamic work environment and incentive compensation. This ranking appears to be the contrary of the one for experts. A series of T-Test was conducted to verify if experts’ expectations are statistically different than those of non experts. Results from Table 3 indicate that the expectations of experts in relation to unusual perks (M= -0.441) are lower than expectations of non experts (0.017). There is a statistically significant difference between the two means (p<0.05). Similarly, the expectations that experts have in regard to

GLOBAL JOURNAL OF BUSINESS RESEARCH ♦ VOLUME 7 ♦ NUMBER 5 ♦ 2013
129
work-life balance (-0.333) are also lower than those of non experts (0.016). The T-test is statistically significant (p<0.1). On the contrary, results show that experts have higher expectations in regard to incentive compensation (0.428) linked to performance than non experts (-0.024). This mean difference is statistically significant (p<0.05). Finally, results from Table 3 show no significant difference between the expectations of experts and those of non experts in relation to the desire for a dynamic work environment (p>0.1) as well development and career (P>0.1).The means on these two last factors are not statistically different. Table 3: Means and T-test Results for the Expectations of Experts and Non Experts
Experts Other employees Unusual perks – benefits, facilities and workplace environment -0.441 0.017 T-Test -2.100 ** Dynamic work environment 0.153 -0.007 T-Test 0.727 Development and career -0.258 0.012 T-Test -1.225 Incentive compensation linked to performance 0.428 -0.024 T-Test 2.070 ** Work-life balance -0.333 0.016 T-Test -1.590 *
n = 22 experts, 328 other employees and 3 values removed. * = < 0.10 and ** = 0.05 (one-tailed t-tests)
These results are innovative and interesting in several ways. They show that experts are attracted by organisations that offer compensation packages that reflect performance and contributions to the organisation. This result is in line with the view that experts have a greater appreciation of their market value and feel that this above-average value should be rewarded. Furthermore, this result is also in line with Vroom’s Expectancy theory. Experts know that their efforts lead to performance. Hence, they expect to be rewarded for their performance. Consequently, organisations wishing to attract experts more readily will need to offer them global compensation that encompasses not only a competitive based pay but also a mix of incentive-pay practices such as individual performance based-bonus, different type of stock plans, competency based pay, etc. CONCLUDING COMMENTS The aim of this study was to examine experts’ expectations in regard to organizational and job related factors. Using data from a sample of employees of a large worldwide business in the high technology sector, results show that experts focus more on incentive compensation and focus less on unusual perks and work-life balance when applying for a job with a prospective employer. Furthermore, their expectations differ from those of non experts. The latter category of employees focus more on unusual perk, work-life balance and development and career when considering a prospective employer. This study encompasses some limitations. The fact that there are few experts in any given organization is a problem. In order to conduct research related specifically to experts, it is difficult to obtain a large sample of experts. As a result, the statistical power is limited given the limited degrees of freedom. Another limitation concerns the use of cross-sectional data. They are restricted to a specific point in time and do not permit to study the relationships among variables over time. We suggest that future work be carried out on larger samples of experts. In addition such research could also attempt to actually measure the value of an expert. This would be a most worthwhile exercise particularly since our results

J. Abraham et al | GJBR ♦ Vol. 7 ♦ No. 5 ♦ 2013
130
demonstrate that what an expert prizes above all other factors, and also what is more important to him than to other category of employee, is financial recognition of their talent, so it would be interesting indeed to find out the approximate value they represent for organizations. Researchers would need to put forward a business operations model to help companies make decisions on compensation packages for experts. This is something the corporate management sector should seriously consider. REFERENCES Abraham, J., Soparnot, R. & Saulquin, J. Y. (2011). Evaluation of the value of experts to a business: proposal of a theoretical model. Problems and Perspectives in Management, vol. 3, p. 122-130. Becker, B. E., Huselid, M. A., Pickus, P. S. & Spratt, MF. (1997). HR as a source of shareholder value: research and recommendations. Human Resource Management, vol. 36(1), p. 39-47. Bontis, N. (1998). Intellectual capital: an exploratory study that develops measures and models. Management Decision, vol. 36(2), p. 63-76. Bontis, N. (1999). Managing organizational knowledge by diagnosing intellectual capital: framing and advancing the state of the field. International Journal of Technology Management, vol. 18 (5-8), p. 433-462. Bontis, N. (2003). Intellectual capital disclosure in Canadian corporations. Journal of Human Resource Costing and Accounting, vol. 7 (1-2), p. 9-20. Bouchez, J. P. (2006). Manager des travailleurs professionnels du savoir: Enjeux et perspectives. Revue Française de Gestion, vol. 32(168-169), p. 35-56. Bourhis, A. & Mekkaoui, R. (2010). Beyond Work-Family Balance: Are Family-Friendly Organizations More Attractive ? Relations industrielles, vol. 65(1), p. 98-117. Cable, D. M. & Judge, T. A. (1996). Person-organization fit job choice decisions and organizational entry. Organizational Behavior and Human Decision Processes, vol. 67(3), p. 294-311. Cable, D. M., & Judge, TA. (1997). Interviewers perceptions of person-organisation fit and organizational selection decisions. Journal of Applied Psychology, vol. 82(4), p. 546-561. Carless, S. A. & Imbert, A. (2007). Job and organizational characteristics: a construct evaluation of applicant perceptions. Educational and psychological measurement, vol. 67, p. 328-337. Coldwell, D. A., Billsberry, J. Van Meurs N. & Marsh P. J. (2007). The Effects of Person-Organization Ethical Fit on Employee Attraction and Retention: Towards a Testable Explanatory Model. Journal of Business Ethics, vol. 78, p. 611-622. Corrigall, E. A. (2008). Welfare states families job attribute preferences and work. Cross Cultural Management, vol. 15(2), p. 144-161. Deloitte (2008). Do You Know Where Your Talent Is? Why Acquisition and Retention Strategies Don’t Work. Research Study Group. Dutton, J. E., Dukerich, J. M. & Harquail, C. V. (1994). Organizational images and member identification. Administration Science Quarterly, vol. 39, p. 239-263.

GLOBAL JOURNAL OF BUSINESS RESEARCH ♦ VOLUME 7 ♦ NUMBER 5 ♦ 2013
131
Edvinsson, L. & Malone, M. (1997). Intellectual Capital. HarperCollins. New York. Ehrhart, K. H. & Ziegert, J. C. (2005). Why are individuals attracted to organizations? Journal of Management, vol. 31(6), p. 901-919. Greening, D. W. & Turban, D. B. (2000). Corporate Social Performance as a Competitive Advantage in Attracting a Quality Workforce. Business & Society, vol. 39, p. 254-280. Hair, F. J. Jr., Black, W. C., Babin, B. J., Anderson, R. E. & Tatham, R. L. (2006). Multivariate Data Analysis (6th ed.). New Jersey: Pearson Prentice Hall. Iles, P., Chuai, X. & Preece, D. (2010). Talent Management and HRM in Multinational companies in Beijing: Definitions, Differences and drivers. Journal of World Business, vol. 45(2), p. 179. Judge, T. A. & Cable, D. M., (1997). Applicant Personality. Organizational Culture and Organization Attraction. Personnel Psychology, vol. 50, p. 359-394. Jurgensen, C. E. (1978). Job preferences (What makes a job good or bad?). Journal of Applied Psychology, vol. 63(3), p. 267-276. Lev, B. (2001). Intangibles: Management measurement and reporting. Washington DC : Brookings Institute. Mirallès, P. (2007). La gestion des talents : émergence d’un nouveau modèle de management ? Management et Avenir, vol. 11, p. 29-42. Peretti, J. M. (2008). Tous talentueux : Développer les talents & les potentiels dans l'entreprise - Les meilleures pratiques vues par 100 experts. Paris, France: Éditions d’Organisation. Prahalad, C. K. & Hamel, G. (1990). The core competence of the corporation. Harvard Business Review, May-June, p. 79-91. Roquepio, P. (1997). Entre savoir et décision, l’expertise scientifique, Sciences en Question, vol. 11. Roos, J., Roos, G., Dragonetti, N. & Edvinsson, L. (1997). Intellectual Capital. London, England: Macmillan Press. Rynes, S. L. & Barber, A. E. (1990). Applicant Attraction Strategies: An Organizational Perspective. The Academy of Management Review, vol. 15(2), p. 286-310. Sheridan J.E. (1992). Organizational culture and employee retention. Academy of management Journal, vol. 35, p. 1036-1056. Sturman, M. C., Trevor, C. O., Boudreau, J. W. * Gerhart, B. (2003). Is it Worth it too Win the Talent War? Evaluating the Utility of Performance-Based Pay. Personnel Psychology, vol. 56(4), p. 997-1035. Thibodeaux, M.S. & Jose, A. (1999). Institutionalization of ethics: the perspective of managers. Journal of Business Ethics, vol. 22, p. 133-143. Trépos, J. Y. (1996). La sociologie de l'expertise. Paris, France: Presses Universitaires de France.
J. Abraham et al | GJBR ♦ Vol. 7 ♦ No. 5 ♦ 2013
132
Tsai, W. C. & Yang, I. WF. (2010). Does Image Matter to Different Job Applicants? The Influence of Individual Differences on Organizational Attractiveness. International Journal of Selection and Assessment, vol. 18(1), p. 48-63. Turban, D. B. (2001). Organizational attractiveness as an employer on college campuses: an examination of the applicant population. Journal of Vocational Behaviour, vol. 58, p. 293-312. Van Vianen, A. E. (2000). Person-organization fit: the match between newcomers and recruiters preferences of organizational cultures. Personnel Psychology, vol. 53, p. 1-32. BIOGRAPHY Jocelyne Abraham is Professor at the IAE of Tours - CERMAT (EA2109). She is also a Senior Lecturer Research Supervisor. She can be reached at IAE of Tours 50 av Portalis BP 0607, 37200 Tours Cedex 03, France, [email protected] Lucie Morin, Ph.D., is a Full Professor at the École des Sciences de la Gestion at Université du Québec à Montréal. She teaches and conducts applied research mostly on training & development. She can be reached at the UQAM, C.P. 8888, Succursale Centre-ville, Montréal (Québec) H3C 3P8, Canada, [email protected] Stephane Renaud, Ph.D., is a Full Professor at the Ecole de relations industrielles, Université de Montréal. He teaches and conducts applied research mostly on compensation. He can be reached at the Université de Montréal, C.P. 6128, Succursale Centre-ville, Montréal (Québec) H3C 3J7, Canada, [email protected] Jean-Yves Saulquin is Professor of Finance at France Business School. He can be reached at France Business School, 1 Rue Léo Delibes BP 0535, 37205 Tours Cedex 3, France, [email protected] Richard Soparnot is the Dean of Research and Professor of Strategy at France Business School. He can be reached at France Business School, 1 Rue Léo Delibes BP 0535, 37205 Tours Cedex 3, France, [email protected]
REVIEWERS The IBFR would like to thank the following members of the academic community and industry for their much appreciated contribution as reviewers.
Hisham Abdelbaki, University of Mansoura - Egypt
Isaac Oluwajoba Abereijo, Obafemi Awolowo University
Naser Abughazaleh, Gulf University For Science And Technology
Nsiah Acheampong, University of Phoenix
Vera Adamchik, University of Houston-Victoria
Iyabo Adeoye, National Horticultural Research Instittute, Ibadan, Nigeria.
Michael Adusei, Kwame Nkrumah University of Science And Technology
Mohd Ajlouni, Yarmouk University
Sylvester Akinbuli, University of Lagos
Anthony Akinlo, Obafemi Awolowo University
Yousuf Al-Busaidi, Sultan Qaboos University
Khaled Aljaaidi, Universiti Utara Malaysia
Hussein Al-tamimi, University of Sharjah
Paulo Alves, CMVM, ISCAL and Lusofona University
Ghazi Al-weshah, Albalqa Applied University
Glyn Atwal, Groupe Ecole Supérieure de Commerce de Rennes
Samar Baqer, Kuwait University College of Business Administration
Susan C. Baxter, Bethune-Cookman College
Nagib Bayoud, Tripoli University
Ahmet Bayraktar, Rutgers University
Kyle Brink, Western Michigan University
Giovanni Bronzetti, University of Calabria
Karel Bruna, University of Economics-Prague
Priyashni Chand, University of the South Pacific
Wan-Ju Chen, Diwan College of Management
Yahn-shir Chen, National Yunlin University of Science and Techology, Taiwan
Bea Chiang, The College of New Jersey
Te-kuang Chou, Southern Taiwan University
Shih Yung Chou, University of the Incarnate Word
Caryn Coatney, University of Southern Queensland
Iyanna College of Business Administration,
Michael Conyette, Okanagan College
Huang Department of Accounting, Economics & Finance,
Rajni Devi, The University of the South Pacific
Leonel Di Camillo, Universidad Austral
Steven Dunn, University of Wisconsin Oshkosh
Mahmoud Elgamal, College of Business Administration - Kuwait University
Ernesto Escobedo, Business Offices of Dr. Escobedo
Zaifeng Fan, University of Wisconsin whitewater Perrine Ferauge University of Mons
Olga Ferraro, University of Calabria
William Francisco, Austin Peay State University
Peter Geczy, AIST
Lucia Gibilaro, University of Bergamo
Hongtao Guo, Salem State University
Danyelle Guyatt, University of Bath
Zulkifli Hasan, Islamic University College of Malaysia
Shahriar Hasan, Thompson Rivers University
Peng He, Investment Technology Group
Niall Hegarty, St. Johns University
Paulin Houanye, University of International Business and Education, School of Law
Daniel Hsiao, University of Minnesota Duluth
Xiaochu Hu, School of Public Policy, George Mason University
Jui-ying Hung, Chatoyang University of Technology
Fazeena Hussain, University of the South Pacific
Shilpa Iyanna, Abu Dhabi University
Sakshi Jain, University of Delhi
Raja Saquib Yusaf Janjua, CIIT
Yu Junye, Louisiana State University
Tejendra N. Kalia, Worcester State College
Gary Keller, Eastern Oregon University
Ann Galligan Kelley, Providence College
Ann Kelley, Providence college
Ifraz Khan, University of the South Pacific
Halil Kiymaz, Rollins College
Susan Kowalewski, DYouville College
Bamini Kpd Balakrishnan, Universiti Malaysia Sabah
Bohumil Král, University of Economics-Prague
Jan Kruger, Unisa School for Business Leadership
Christopher B. Kummer, Webster University-Vienna
Mei-mei Kuo, JinWen University of Science & Technology
Mary Layfield Ledbetter, Nova Southeastern University
John Ledgerwood, Embry-Riddle Aeronautical University
Yen-hsien Lee, Department of Finance, Chung Yuan Christian University
Shulin Lin, Hsiuping University of Science and Technology
Yingchou Lin, Missouri University of Science and Technology
Melissa Lotter, Tshwane University of Technology
Xin (Robert) Luo, Virginia State University
Andy Lynch, Southern New Hampshire University
Abeer Mahrous, Cairo university
Gladys Marquez-Navarro, Saint Louis University
Cheryl G. Max, IBM
Romilda Mazzotta, University of Calabria
Mary Beth Mccabe, National University

Avi Messica, Holon Institute of Technology
Scott Miller, Pepperdine University
Cameron Montgomery, Delta State University
Sandip Mukherji, Howard University
Tony Mutsue, Iowa Wesleyan College
Cheedradevi Narayanasamy, Graduate School of Business, National University of Malaysia
Dennis Olson, Thompson Rivers University
Godwin Onyeaso, Shorter University
Bilge Kagan Ozdemir, Anadolu University
Dawn H. Pearcy, Eastern Michigan University
Pina Puntillo, University of Calabria (Italy)
Rahim Quazi, Prairie View A&M University
Anitha Ramachander, New Horizon College of Engineering
Charles Rambo, University Of Nairobi, Kenya
Prena Rani, University of the South Pacific
Kathleen Reddick, College of St. Elizabeth
Maurizio Rija, University of Calabria.
Matthew T. Royle, Valdosta State University
Tatsiana N. Rybak, Belarusian State Economic University
Rafiu Oyesola Salawu, Obafemi Awolowo University
Paul Allen Salisbury, York College, City University of New York
Leire San Jose, University of Basque Country
I Putu Sugiartha Sanjaya, Atma Jaya Yogyakarta University, Indonesia
Sunando Sengupta, Bowie State University
Brian W. Sloboda, University of Phoenix
Smita Mayuresh Sovani, Pune University
Alexandru Stancu, University of Geneva and IATA (International Air Transport Association)
Jiří Strouhal, University of Economics-Prague
Vichet Sum, University of Maryland -- Eastern Shore
Qian Sun, Kutztown University
Diah Suryaningrum, Universitas Pembangunan Nasional Veteran Jatim
Andree Swanson, Ashford University
James Tanoos, Saint Mary-of-the-Woods College
Jeannemarie Thorpe, Southern NH University
Ramona Toma, Lucian Blaga University of Sibiu-Romania Alejandro Torres Mussatto Senado de la Republica & Universidad de Valparaíso
Jorge Torres-Zorrilla, Pontificia Universidad Católica del Perú
William Trainor, East Tennessee State University
Md Hamid Uddin, University Of Sharjah
Ozge Uygur, Rowan University
K.W. VanVuren, The University of Tennessee – Martin
Vijay Vishwakarma, St. Francis Xavier University
Ya-fang Wang, Providence University
Richard Zhe Wang, Eastern Illinois University
Jon Webber, University of Phoenix
Jason West, Griffith University
Wannapa Wichitchanya, Burapha University
Veronda Willis, The University of Texas at San Antonio
Bingqing Yin, University of Kansas
Fabiola Baltar, Universidad Nacional de Mar del Plata
Myrna Berrios, Modern Hairstyling Institute
Monica Clavel San Emeterio, University of La Rioja
Esther Enriquez, Instituto Tecnologico de Ciudad Juarez
Carmen Galve-górriz, Universidad de Zaragoza
Blanca Rosa Garcia Rivera, Universidad Autónoma De Baja California
Carlos Alberto González Camargo, Universidad Jorge Tadeo Lozano
Hector Alfonso Gonzalez Guerra, Universidad Autonoma De Coahuila
Claudia Soledad Herrera Oliva, Universidad Autónoma De Baja California
Eduardo Macias-Negrete, Instituto Tecnologico De Ciudad Juarez
Jesús Apolinar Martínez Puebla, Universidad Autónoma De Tamaulipas
Francisco Jose May Hernandez, Universidad Del Caribe
Aurora Irma Maynez Guaderrama, Universidad Autonoma De Ciudad Juarez
Linda Margarita Medina Herrera, Tecnológico De Monterrey. Campus Ciudad De México
Erwin Eduardo Navarrete Andrade, Universidad Central De Chile
Gloria Alicia Nieves Bernal, Universidad Autónoma Del Estado De Baja California
Julian Pando, University Of The Basque Country
Eloisa Perez, Macewan University
Iñaki Periáñez, Universidad Del Pais Vasco (Spain)
Alma Ruth Rebolledo Mendoza, Universidad De Colima
Carmen Rios, Universidad del Este
Celsa G. Sánchez, CETYS Universidad
Adriana Patricia Soto Aguilar, Benemerita Universidad Autonoma De Puebla Amy Yeo, Tunku Abdul Rahman College
REVIEWERS The IBFR would like to thank the following members of the academic community and industry for their much appreciated contribution as reviewers.
Haydeé Aguilar, Universidad Autónoma de Aguascalientes
María Antonieta Andrade Vallejo, Instituto Politécnico Nacional
Olga Lucía Anzola Morales, Universidad Externado de Colombia
Hector Luis Avila Baray, Instituto Tecnologico De Cd. Cuauhtemoc
Graciela Ayala Jiménez, Universidad Autónoma de Querétaro
Ana Cecilia Bustamante Valenzuela, Universidad Autonoma De Baja California
Carlos Alberto Cano Plata, Universidad De Bogotá Jorge Tadeo Lozano
Alberto Cardenas, Instituto Tecnologico De Cd. Juarez
Edyamira Cardozo, Universidad Nacional Experimental De Guayana
Sheila Nora Katia Carrillo Incháustegui, Universidad Peruana Cayetano Heredia
emma casas medina, Centro de Estudios Superiores del Estado de Sonora
Benjamín Castillo Osorio, Universidad Cooperativa De Colombia y Universidad De Córdoba
Benjamin Castillo Osorio, Universidad del Sinú-Sede Monteria
María Antonia Cervilla de Olivieri, Universidad Simón Bolívar
Cipriano Domigo Coronado García, Universidad Autónoma de Baja California
Semei Leopoldo Coronado Ramírez, Universidad de Guadalajara
Esther Eduviges Corral Quintero, Universidad Autónoma de Baja California
Dorie Cruz Ramirez, Universidad Autonoma Del Estado De Hidalgo /Esc. Superior De Cd. Sahagún
Edna Isabel De La Garza Martinez, Universidad Autónoma De Coahuila
Javier de León Ledesma, Universidad de Las Palmas de Gran Canaria - Campus Universitario de Tafira
Hilario Díaz Guzmán, Universidad Popular Autónoma del Estado de Puebla
Cesar Amador Díaz Pelayo, Universidad de Guadalajara, Centro Universitario Costa Sur
Avilés Elizabeth, CICESE
Avilés Elizabeth, CICESE
Ernesto Geovani Figueroa González, Universidad Juárez del Estado de Durango
Ana Karen Fraire, Universidad De Gualdalajara
Carmen Galve-Górriz, Universidad de Zaragoza
Teresa García López, Universidad Veracruzana
Helbert Eli Gazca Santos, Instituto Tecnológico De Mérida
Denisse Gómez Bañuelos, CESUES
Ana Ma. Guillén Jiménez, Universidad Autónoma de Baja California
Ana Ma. Guillén Jiménez, Universidad Autónoma de Baja California
Araceli Gutierrez, Universidad Autonoma De Aguascalientes
Andreina Hernandez, Universidad Central de Venezuela
Arturo Hernández, Universidad Tecnológica Centroamericana
Alejandro Hernández Trasobares, Universidad de Zaragoza
Alma Delia Inda, Universidad Autonoma Del Estado De Baja California
Terrance Jalbert, The IBFR
Gaspar Alonso Jiménez Rentería, Instituto Tecnológico de Chihuahua
Lourdes Jordán Sales, Universidad de Las Palmas de Gran Canaria
Santiago León Ch., Universidad Marítima del Caribe
Graciela López Méndez, Universidad de Guadalajara-Jalisco
Virginia Guadalupe López Torres, Universidad Autónoma de Baja California
Angel Machorro Rodríguez, Instituto Tecnológico de Orizaba
Cruz Elda Macias Teran, Universidad Autonoma de Baja California
Aracely Madrid, ITESM, Campus Chihuahua
Deneb Magaña Medina, Universidad Juárez Autónoma de Tabasco
Carlos Manosalvas, Universidad Estatal Amazónica
Gladys Yaneth Mariño Becerra, Universidad Pedagogica y Tecnológica de Colombia
Omaira Cecilia Martínez Moreno, Universidad Autónoma de Baja California-México
Jesus Carlos Martinez Ruiz, Universidad Autonoma De Chihuahua
Alaitz Mendizabal, Universidad Del País Vasco
Alaitz Mendizabal Zubeldia, Universidad del País Vasco/ Euskal Herriko Unibertsitatea

Fidel Antonio Mendoza Shaw, Universidad Estatal De Sonora
Juan Nicolás Montoya Monsalve, Universidad Nacional de Colombia-Manizales
Jennifer Mul Encalada, Universidad Autónoma De Yucatán
Alberto Elías Muñoz Santiago, Fundación Universidad del Norte
Bertha Guadalupe Ojeda García, Universidad Estatal de Sonora
Erika Olivas, Universidad Estatal de Sonora
Erick Orozco, Universidad Simon Bolivar
José Manuel Osorio Atondo, Centro de Estudios Superiores del Estado de Sonora
Luz Stella Pemberthy Gallo, Universidad del Cauca
Andres Pereyra Chan, Instituto Tecnologico De Merida
Iñaki Periáñez, Universidad del Pais Vasco (spain)
Adolfo León Plazas Tenorio, Universidad del Cauca
Hector Priego Huertas, Universidad De Colima
Juan Carlos Robledo Fernández, Universidad EAFIT-Medellin/Universidad Tecnologica de Bolivar-Cartagena
Humberto Rosso, Universidad Mayor de San Andres
José Gabriel Ruiz Andrade, Universidad Autónoma de Baja California-México
Antonio Salas, Universidad Autonoma De Chihuahua
Claudia Nora Salcido, Facultad de Economía Contaduría y Administración Universidad Juarez del Estado de Durango
Juan Manuel San Martín Reyna, Universidad Autónoma de Tamaulipas-México
Francisco Sanches Tomé, Instituto Politécnico da Guarda
Edelmira Sánchez, Universidad Autónoma de Ciudad Juárez
Deycy Janeth Sánchez Preciado, Universidad del Cauca
María Cristina Sánchez Romero, Instituto Tecnológico de Orizaba
María Dolores Sánchez-Fernández, Universidade da Coruña
Luis Eduardo Sandoval Garrido, Universidad Militar de Nueva Granada
Pol Santandreu i Gràcia, Universitat de Barcelona, Santandreu Consultors
Victor Gustavo Sarasqueta, Universidad Argentina de la Empresa UADE
Jaime Andrés Sarmiento Espinel, Universidad Militar de Nueva Granada
Jesus Otoniel Sosa Rodriguez, Universidad De Colima
Edith Georgina Surdez Pérez, Universidad Juárez Autónoma de Tabasco
Jesús María Martín Terán Gastélum, Centro de Estudios Superiores del Estado de Sonora
Jesús María Martín Terán Gastélum, Centro de Estudios Superiores del Estado de Sonora
Jesus María Martín Terán Terán Gastélum, Centro de Estudios Superiores del Estado de Sonora
Maria De La Paz Toldos Romero, Tecnologico De Monterrey, Campus Guadalajara
Abraham Vásquez Cruz, Universidad Veracruzana
Angel Wilhelm Vazquez, Universidad Autonoma Del Estado De Morelos
Lorena Vélez García, Universidad Autónoma de Baja California
Alejandro Villafañez Zamudio, Instituto Tecnologico de Matamoros
Hector Rosendo Villanueva Zamora, Universidad Mesoamericana
Oskar Villarreal Larrinaga, Universidad del País Vasco/Euskal Herriko Universitatea
Delimiro Alberto Visbal Cadavid, Universidad del Magdalena

HOW TO PUBLISH
Submission Instructions
The Journal welcomes submissions for publication consideration. Complete directions for manuscript submission are available at the Journal website www.theIBFR.com/journal.htm. Papers may be submitted for initial review in any format. However, authors should take special care to address spelling and grammar issues prior to submission. Authors of accepted papers are required to precisely format their document according to the journal guidelines.
There is no charge for standard paper reviews. The normal review time for submissions is 90-120 days. However, authors desiring a quicker review may elect to pay an expedited review fee, which guarantees an inditial review within two weeks. Authors of accepted papers are required to pay a publication fee based on the manuscript length and number of authors. Please see our website for current publication and expedited review rates.
Authors submitting a manuscript for publication consideration must guarantee that the document contains the original work of the authors, has not been published elsewhere, and is not under publication consideration elsewhere. In addition, submission of a manuscript implies that the author is prepared to pay the publication fee should the manuscript be accepted.
Subscriptions
Individual and library subscriptions to the Journal are available. Please contact us by mail or by email to: [email protected] for updated information.
Contact Information
Mercedes Jalbert, Executive Editor The IBFRP.O. Box 4908Hilo, HI [email protected]
Website
www.theIBFR.org or www.theIBFR.com

Review of Business & Finance Studies Review of Business & Finance Studies (ISSN: 2150-3338 print and 2156-8081 online) publishes high-quality studies in all areas of business, finance and related fields. Empirical, and theoretical papers as well as case studies are welcome. Cases can be based on real-world or hypothetical situations.
All papers submitted to the Journal are double-blind reviewed. The Journal is listed in Cabell’s, Ulrich’s Periodicals Directory The Journal is distributed in print, through EBSCOHost, ProQuest ABI/Inform and SSRN.
The journal accept rate is between 15 and 25 percent
Business Education & AccreditationBE A
AT Accounting
Taxation&
Accounting and Taxation (AT)
Accounting and Taxation (AT) publishes high-quality articles in all areas of accounting, auditing, taxation and related areas. Theoretical, empirical and applied manuscripts are welcome for publication consideration.
All papers submitted to the Journal are double-blind reviewed. AT is listed in Cabell’s and Ulrich’s Periodicals Directory. The Journal is distributed in print, through EBSCOHost, ProQuest ABI/Inform and SSRN.
The journal acceptance rate is between 5 and 15 percent.
Business Education and Acreditation (BEA)Business Education & Accreditation publishes high-quality articles in all areas of business education, curriculum, educational methods, educational administration, advances in educational technology and accreditation. Theoretical, empirical and applied manuscripts are welcome for publication consideration.
All papers submitted to the Journal are double-blind reviewed. BEA is is listed in Cabell’s and Ulrich’s Periodicals Directory. The Journal is distributed in print, through EBSCOHost, ProQuest ABI/Inform and SSRN.
The journal acceptance rate is between 15 and 25 percent.
PUBLICATION OPPORTUNITIES