A Time Based Correlated Logical Methodology for Choosing ... abstract.pdf · Asian Journal of...
13
Asian Journal of Research in Social Sciences and Humanities Asian Journal of Research in Social Sciences and Humanities Vol. 6, No. 5, May 2016, pp.926-952. ISSN 2249-7315 A Journal Indexed in Indian Citation Index DOI NUMBER: 10.5958/2249-7315.2016.00162.3 Category;Science and Technology 926 Asian Research Consortium www.aijsh.com A Time Based Correlated Logical Methodology for Choosing Optimum Lean Tools and Techniques in Garment Manufacturing Scenario G. Vijaya Kumar*; Y. Robinson** *Department of Mechanical Engineering, RVS Technical Campus, Coimbatore, Tamilnadu, India. **RVS Faculty, RVS Technical Campus, Coimbatore, Tamilnadu, India. Abstract Lean tools and techniques have been emerged to eliminate manufacturing waste and thus increase operational efficiency in garment manufacturing process. Implementing lean tools and techniques requires a huge amount of resources and in practice; manufacturers meet difficulties to choose optimum lean tools and techniques within their resource constraints and to find the perceived value of manufacturing waste elimination in garment manufacturing process. There is currently no logical methodology is available for selecting suitable lean tools and techniques within a manufacturer’s resource constraints. This research goal is to develop time based mathematical models and a logical methodology for choosing optimum lean tools and techniques. Mathematical models were formulated and a logical methodology was developed for calculating the perceived value of lean tools and techniques to manufacturing waste elimination and a stage-by-stage methodology is provided for choosing optimum lean tools and techniques to maximize the manufacturing performance within their limited amount of available resources constraints to eliminate their determined wastes. A computer programme has been developed in MATLAB to solve the developed equations to attain optimum result. Developed MATLAB programme is achieved to find optimum lean tools and techniques for identified wastes within the manufacturer resources constraints using the methodology and mathematical model. A waste relations matrix (WCM) has been proposed to establish the relations between the manufacturing wastes and lean tools and techniques. Using waste relations matrix, utilizing the proposed methodology and developed
Transcript of A Time Based Correlated Logical Methodology for Choosing ... abstract.pdf · Asian Journal of...

Asian Journal
of Research in
Social Sciences
and
Humanities Asian Journal of Research in Social Sciences and Humanities Vol. 6, No. 5, May 2016, pp.926-952.
ISSN 2249-7315 A Journal Indexed in Indian Citation Index
DOI NUMBER: 10.5958/2249-7315.2016.00162.3Category;Science and Technology
926
Asian Research Consortium
www.aijsh.com
A Time Based Correlated Logical Methodology for Choosing Optimum Lean Tools and Techniques in
Garment Manufacturing Scenario
G. Vijaya Kumar*; Y. Robinson**
*Department of Mechanical Engineering,
RVS Technical Campus,
Coimbatore, Tamilnadu, India.
**RVS Faculty,
RVS Technical Campus,
Coimbatore, Tamilnadu, India.
Abstract
Lean tools and techniques have been emerged to eliminate manufacturing waste and thus increase operational efficiency in garment manufacturing process. Implementing lean tools and techniques requires a huge amount of resources and in practice; manufacturers meet difficulties to choose optimum lean tools and techniques within their resource constraints and to find the perceived value of manufacturing waste elimination in garment manufacturing process. There is currently no logical methodology is available for selecting suitable lean tools and techniques within a manufacturer’s resource constraints. This research goal is to develop time based mathematical models and a logical methodology for choosing optimum lean tools and techniques. Mathematical models were formulated and a logical methodology was developed for calculating the perceived value of lean tools and techniques to manufacturing waste elimination and a stage-by-stage methodology is provided for choosing optimum lean tools and techniques to maximize the manufacturing performance within their limited amount of available resources constraints to eliminate their determined wastes. A computer programme has been developed in MATLAB to solve the developed equations to attain optimum result. Developed MATLAB programme is achieved to find optimum lean tools and techniques for identified wastes within the manufacturer resources constraints using the methodology and mathematical model. A waste relations matrix (WCM) has been proposed to establish the relations between the manufacturing wastes and lean tools and techniques. Using waste relations matrix, utilizing the proposed methodology and developed

Kumar & Robinson (2016). Asian Journal of Research in Social Sciences and Humanities,
Vol. 6, No.5, pp.926-952.
927
mathematical model for maximize perceived value of elimination of a manufacturer’s wastes by implementing suitable lean tools and techniques within their resources constraints. Results also establish that the perceived value of elimination of manufacturing wastes can meaningfully be altered based on manufacturer polices. The planned methodology can also be used dynamically by altering the input in the programme developed in MATLAB. Thus by finding suitable lean tools and techniques for particular garment manufacturing wastes, a manufacturer can better prioritize implementation efforts and resources to maximize the success of implementing lean tools and techniques in their garment industries.
Keywords: Lean Tools and techniques, Waste correlation Matrix, Lean implementation Time, MATLAB, Garment manufacturing Industries. ________________________________________________________________________________
.
References
Nahm, A. Y., Vonderembse, M. A., Subba Rao, S., & Ragu-Nathan, T. S. 2006. Time-based manufacturing improves business performance—results from a survey.
International Journal of Production Economics, 101(2), 213-229.
Karim, M. A., Smith, A. J. R., Halgamuge, S. K., & Islam, M. M. 2008. A comparative study of manufacturing practices and performance variables. International Journal of Production Economics, 112(2), 841-859.
Papadopoulou, T. C., & Ozbayrak, M. 2005a. Leanness: experiences from the journey to date. Journal of Manufacturing Technology Management, 16(7), 784-807.
Papadopoulou, T. C., & Ozbayrak, M. 2005b. Leanness: experiences from the journey to date. Management, 16(7), 784-807.
Womack, J. P., Jones, D. T., & Roos, D. 1990.The machine that changed the World Rawson associates New York time magazine.
B.Carreira, Lean manufacturing that works: powerful tools for dramatically reducing waste and maximizing profits. Amacom Books, 2005.
Eswaramoorthi, M., Prasad, P., & Mohanram, P. 2010. Developing an Effective Tools and techniques to Configure Assembly Systems Using Lean Concepts. International Journal of Lean Thinking, 1(2), 14-35.
Bachamada, C. 1999. Development of an empirical model for the planning and implementation of lean manufacturing. M. S. The University of Texas at El Paso, United States—Texas.
Pavnaskar, S.J. 2004. A systematic method for leaning engineering processes. Ph.D. Michigan Technological University, United States.
Kumar & Robinson (2016). Asian Journal of Research in Social Sciences and Humanities,
Vol. 6, No.5, pp.926-952.
928
Abdulmalek, F.A., & Rajgopal, J. 2007. Analyzing the benefits of lean manufacturing and value stream mapping via simulation: a process sector case study. International Journal of production Economics, 107(1), 223-236.
Leung, S., & Lee, W. 2004. Strategic manufacturing capability pursuance: A conceptual framework. Benchmarking: An International Journal, 11(2), 156-174.
Mejabi, O. O. (2003).Framework for a lean manufacturing planning system. International Journal of Manufacturing Technology and Management, 5(5), 563-578.
Allen, J., Robinson, C., & Stewart, D. (2001a). Lean Manufacturing: A plant Floorguide: Society of Manufacturing Engineers.
Allen, J., Robinson, C., & Stewart, D. (2001b). Lean Manufacturing: A Plant Floor Guide. Total Systems Development.
Bheda, R., Narag, A.S. and Singla, M.L. Apparel Manufacturing a Tools and techniques for Productivity Improvement, Journal of Fashion Marketing and Management, Volume No1, pp.12-22, MCB up limited, 2003.
Schon berger, R. J. (2012). Measurement of Lean Value Chains: Efficiency and Effectiveness. Modelling Value, 65-75.
Hines, P., & Rich, N. (1997a). The seven value stream mapping tools. International Journal of Operations & Production Management, 17(1), 46-64.
Hines, P., & Rich, N. Doolen, T.L., &Hacker, M.E. (2005). A review of lean assessment in organizations: an exploratory study of lean practices by electronics manufacturers. Journal of Manufacturing Systems, 24(1), 55-67.
Abdul malek, F. A., & Rajgopal, J. (2007). Analyzing the benefits of lean manufacturing and value stream mapping via simulation: a process sector case study.
Md Al Amin and M.A. Karim 2013. A time based quantitative tools and techniques for selecting lean strategies for manufacturing organizations, 51(4), pp. 1146-1167.
Leung, S., & Lee, W. (2004). Strategic manufacturing capability pursuance: a conceptual framework. Benchmarking: An International Journal, 11(2), 156-174.
Wacker, J. G. (1996). A theoretical model of manufacturing lead times and the irrelationship to a manufacturing goal hierarchy decision sciences, 27(3), 483-517.
Wan, H., & Chen, F. F. (2008).Achanga, P., Shehab, E., Roy, R., & Nelder, G.(2006). Critical success factors forlean implementation within SMEs. Journal of Manufacturing Technology Management, 17(4), 460-471.
Pavnaskar, S.J. (2004). A systematic method for leaning Engineering processes. Ph.D., Michigan Technological University, United States--Michigan.

Kumar & Robinson (2016). Asian Journal of Research in Social Sciences and Humanities,
Vol. 6, No.5, pp.926-952.
929
Pavnaskar, S.J., Gershenson, J.K., & Jambekar, A. B. (2003). Classification scheme for lean manufacturing tools. International Journal of Production Research,41(13), 3075-3090.
Anvari, A., Norzima, Z., Rosnah, M., Hojjati, S. M. H., & Ismail, Y. (2010). A Comparative Study on Journey of Lean Manufacturing Implementation.
Aijstpme. Anvari, A., Zulkifli, N., Yusuff, R. M., Hojjati, S.M.H., & Ismail, Y. (2011). proposed dynamic model for a lean road map. African Journal of Business Management, 5(16), 6727-6737.
Wan H., & Chen, F.F. (2009). Decision support for lean practitioners: A web-based adaptive assessment tools and techniques. Computers in Industry, 60(4), 277-283.
Herron, C., & Braiden, P.M. (2006). A methodology for developing sustainable quantifiable productivity improvement in manufacturing companies. International ournal of Production Economics, 104(1), 143-153.
Raja, M. I. (2011).Lean manufacturing-an Integrated Socio-Technical Systems tools and techniques to Work Design. Clemson University.
Reid, R. A. (2006). Productivity and quality improvement: an implementation framework. International Journal of Productivity and Quality Management,1(1),26-36.
S. R. Devadasan, Lean manufacturing Agile manufacturing. PHI learning pvt ltd. 2012. http://www.leanproduction.com/top-25-lean-tools.html
Garrison, R H & Noreen, E W 2003, Managerial Accounting, McGrew-Hill.
Adediranoluwatoyin (2008): MBA thesis, A test of the effect of TQM on performance and stake holder satisfaction;
Toyota production system hand book (www.artoflean.com)
Achanga, P., Shehab, E., Roy, R., & Nelder, G. (2006). Critical success factors for lean implementation within SMEs. Journal of Manufacturing Technology Management, 17(4), 460-471
Marvel, J. H., & Standridge, C. R. (2009). Simulation-enhanced lean design process. Journal of Industrial Engineering and Management, 2(1), 90-113.
Gautam, N., & Singh, N. (2008). Lean product development: Maximizing the customer perceived value through design change (redesign). International Journal of Production Economics, 114(1), 313-332.
Fig.1. Proposed methodology FOR choosing Optimum Lean Tools and
Techniques for determined wastes within Time Constraints
Kumar & Robinson (2016). Asian Journal of Research in Social Sciences and Humanities,
Vol. 6, No.5, pp.926-952.
930
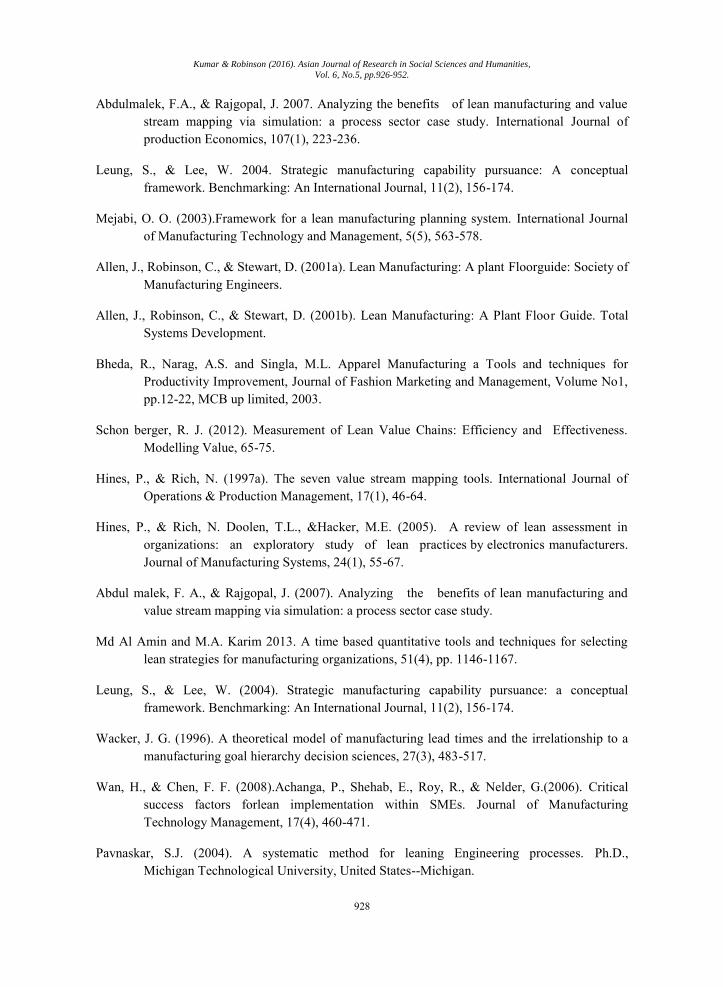
Fig.2.Executive Implication Flow Chart

Kumar & Robinson (2016). Asian Journal of Research in Social Sciences and Humanities,
Vol. 6, No.5, pp.926-952.
931
Table 1. Garment Industry Wastes with Relative Importance Values
Identified Problems Manufacturing Wastes Relative
Importance
Walk for getting parts Unnecessary Motion 9 Poor quality parts Defects 8 Inefficient workstation layout Transport 7 Lack of standard process Inappropriate Processing 7 Overproduction WIP 4 Parts shortages Raw material inventory 5 Employee in idle position Underutilization of people 6 More relaxing time in cutting and waiting Waiting 4

Kumar & Robinson (2016). Asian Journal of Research in Social Sciences and Humanities,
Vol. 6, No.5, pp.926-952.
932
Table 2. Correlation between Lean Tools and techniques and Manufacturing
Wastes
Table.3.Reduction of Garment Wastes through the use of Visual Management
Tools
Identified
Garment
Manufacturing
Waste
Visual management tools
Transportation Sign boards, labelling and colour lines Excess inventory One piece flows, kanban cards and graphs Excess motion Sequencing boards, labelling, pictures and kanban cards Waiting Sign boards and labelling Over production Kanban cards Over processing Sequencing boards and control boards Defects Gauges colour coding and pictures Underutilization of people Sequential boards, charts and checklist
Utilizing lean tools and techniques
Tra
nsp
ort
ati
on
Ex
cess
in
ven
tory
Ex
cess
mo
tio
n
Wa
itin
g
Ov
er p
rod
uct
ion
Ov
er p
roce
ssin
g
Def
ects
Un
der
uti
liza
tio
n o
f
peo
ple
Relative importance by experts and manufactures 7 5 9 4 4 7 8 6
Implement lean creativities if ws is selected WS1 WS2 WS3 WS4 WS5 WS6 WS7 WS8 Waste chosen for improvement if 1,0 if not chosen 1 1 1 1 1 1 1 1
5s 0 0 HC=1 HC=1 MC=0 0 MC=0 0 Pull system through kanban card 0 HC=1 0 0 HC=1 0 0 0 SMED 0 0 HC=1 HC=1 0 0 0 0 Poka-yoke 0 0 0 0 0 0 HC=1 0 Work load balancing 0 0 0 0 0 0 0 HC=1 Total quality management 0 0 0 0 0 MC=0 HC=1 0 Standard Work Process LC=0 0 MC=0 0 0 HC=1 LC=0 0 Just in time 0 HC 0 0 0 0 LC=0 0 Visual management tools HC=1 HC=1 HC=1 HC=1 HC=1 HC=1 HC=1 HC=1 Cellular manufacturing HC=1 0 HC=1 0 0 0 0 0

Kumar & Robinson (2016). Asian Journal of Research in Social Sciences and Humanities,
Vol. 6, No.5, pp.926-952.
933
Table.4. Lean Tools and Techniques Correlated Influence on Garment
Manufacturing Wastes
Contributing lean tools and
techniques
Decision task
Tra
nsp
ort
ati
on
Ex
cess
in
ven
tory
Ex
cess
mo
tio
n
Wa
itin
g
Ov
er p
rod
uct
ion
Ov
er p
roce
ssin
g
Def
ects
Un
der
uti
liza
tio
n o
f
peo
ple
Relative importance by experts and manufactures 7 5 9 4 4 7 8 6
Implement lean creativities if ws is selected WS1 WS2 WS3 WS4 WS5 WS6 WS7 WS8
Waste chosen for improvement if 1,0 if not chosen 1 1 1 1 1 1 1 1
5s 0 0 HC=1 HC=1 MC=0 0 MC=0 0 Pull system through kanban card 0 HC=1 0 0 HC=1 0 0 0 SMED 0 0 HC=1 HC=1 0 0 0 0 Poka-yoke 0 0 0 0 0 0 HC=1 0 Work load balancing 0 0 0 0 0 0 0 HC=1 Total quality management 0 0 0 0 0 MC=0 HC=1 0 Standard Work Process LC=0 0 MC=0 0 0 HC=1 LC=0 0 Just in time 0 HC 0 0 0 0 LC=0 0 Visual management tools HC=1 HC=1 HC=1 HC=1 HC=1 HC=1 HC=1 HC=1
Cellular manufacturing HC=1 0 HC=1 0 0 0 0 0
Kumar & Robinson (2016). Asian Journal of Research in Social Sciences and Humanities,
Vol. 6, No.5, pp.926-952.
934
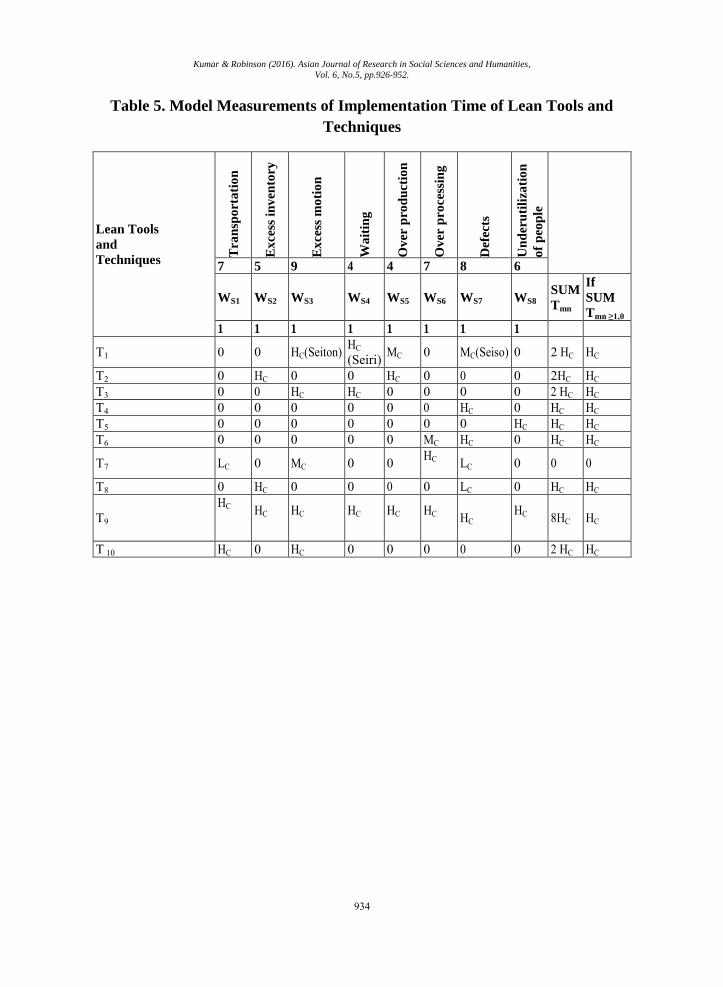
Table 5. Model Measurements of Implementation Time of Lean Tools and
Techniques
Lean Tools
and
Techniques
Tra
nsp
ort
ati
on
Ex
cess
in
ven
tory
Ex
cess
mo
tio
n
Wa
itin
g
Ov
er p
rod
uct
ion
Ov
er p
roce
ssin
g
Def
ects
Un
der
uti
liza
tio
n
of
peo
ple
7 5 9 4 4 7 8 6
WS1 WS2 WS3 WS4 WS5 WS6 WS7 WS8 SUM
Tmn
If
SUM
Tmn ≥1,0
1 1 1 1 1 1 1 1
T1 0 0 HC(Seiton) HC (Seiri) MC 0 MC(Seiso) 0 2 HC HC
T2 0 HC 0 0 HC 0 0 0 2HC HC T3 0 0 HC HC 0 0 0 0 2 HC HC T4 0 0 0 0 0 0 HC 0 HC HC T5 0 0 0 0 0 0 0 HC HC HC T6 0 0 0 0 0 MC HC 0 HC HC
T7 LC 0 MC 0 0 HC LC 0 0 0
T8 0 HC 0 0 0 0 LC 0 HC HC
T9 HC
HC
HC
HC
HC
HC
HC HC
8HC HC
T 10 HC 0 HC 0 0 0 0 0 2 HC HC

Kumar & Robinson (2016). Asian Journal of Research in Social Sciences and Humanities,
Vol. 6, No.5, pp.926-952.
935
Table.6. Decisional Waste Relation Matrix
Utilizing lean tools and
techniques
Decision Task
Tra
nsp
ort
ati
on
Ex
cess
in
ven
tory
Ex
cess
mo
tio
n
Wa
itin
g
Ov
er p
rod
uct
ion
Ov
er p
roce
ssin
g
Def
ects
Un
der
uti
liza
tio
n o
f
peo
ple
Relative importance by experts and manufactures 7 5 9 4 4 7 8 6
Implement lean creativities if Ws is selected WS1 WS2 WS3 WS4 WS5 WS6 WS7 WS8
5s 0 0 HC (Seiton)
HC (Seiri) 0 0 MC
(Seiso) 0
Pull system through kanban card 0 HC 0 0 HC 0 0 0
SMED 0 0 HC HC 0 0 0 0
Poka-yoke 0 0 0 0 0 0 HC 0
Work load balancing 0 0 0 0 0 0 0 HC
Total quality management 0 0 0 0 0 MC HC 0
Standard Work Process LC 0 MC 0 0 HC
LC 0
Just in time 0 HC 0 0 0 0 LC 0
Visual management tools HC
(SIGN
BOARDS)
HC
(ONE
PIECE
FLOW)
HC
(SEQUENCING
BOARDS)
HC
(SIGN
BOARDS)
HC
(KANBANCARDS)
HC
(CONTROL
BOARDS )
HC
(COLOUR
CODINGS)
HC
(SEQUENCING
BOARDS)
Cellular manufacturing HC 0 HC 0 0 0 0 0

Kumar & Robinson (2016). Asian Journal of Research in Social Sciences and Humanities,
Vol. 6, No.5, pp.926-952.
936
Table.7. Results with specified Group of Constraints
Change in
manufacturer
perceived value
=40
Decision Task
Tra
nsp
ort
ati
on
Ex
cess
in
ven
tory
Ex
cess
mo
tio
n
Wa
itin
g
Ov
er p
rod
uct
ion
Ov
er p
roce
ssin
g
Def
ects
Un
der
uti
lisa
tio
n o
f
peo
ple
Op
era
tiv
e ch
an
ge
per
cei
ved
va
lue=
40
Relative importance by experts and manufactures
7 5 9 6 4 7 8 6
Implement lean creativities if ws is selected
WS1 WS2 WS3 WS4 WS5 WS6 WS7 WS8
Waste chosen for improvement if R ,N if not chosen
1 1 1 1 1 1 1 1
5s 0 0 HC HC MC 0 MC 0 2HC
Pull system through kanban card 0 HC 0 0 HC 0 0 0 2HC
SMED 0 0 HC HC 0 0 0 0 2HC
Poka-yoke 0 0 0 0 0 0 HC 0 HC Work load balancing 0 0 0 0 0 0 0 HC HC
Total quality management 0 0 0 0 0 0 HC 0 HC
Standard Work Process
LC 0 MC 0 0 HC LC 0 HC
Just in time 0 HC 0 0 0 0 LC 0 HC
Visual management tools
HC
(SIGN
BOARDS)
HC
(ONE
PIECE
FLOW)
HC
(SEQUENCING
BOARDS)
HC
(SIGN
BOARDS)
HC
(KANBANCARDS)
HC
(CONTROL
BOARDS )
HC
(COLOUR
CODINGS)
HC
(SEQUENCING
BOARDS)
8HC
Cellular manufacturing
HC 0 HC 0 0 0 0 0 2HC
Utilizing lean tools 2HC 3HC 4HC 3HC 2HC 2HC 3HC 2HC 21HC

Kumar & Robinson (2016). Asian Journal of Research in Social Sciences and Humanities,
Vol. 6, No.5, pp.926-952.
937
Table.8. Dynamic Result With Given Group of Constraints
Table.9. Lean tools and techniques Implementation Time
Change in
manufacturer
perceived value = 40
Decision task
Tra
nsp
ort
ati
on
Ex
cess
in
ven
tory
Ex
cess
mo
tio
n
Wa
itin
g
Ov
er p
rod
uct
ion
Ov
er p
roce
ssin
g
Def
ects
Un
der
uti
liza
tio
n o
f
peo
ple
Op
era
tiv
e ch
an
ge
per
cei
ved
va
lue=
41
Relative importance value by experts and manufactures 7 9 5 6 4 7 8
6
Implement lean tools and Techniques if Ws is selected WS1 WS2 WS3 WS4 WS5 WS6 WS7
WS8
Waste chosen for improvement if 1,0 if not chosen 1 1 1 0 1 1 1
5s 0 0 HC HC 0 0 MC 0 HC Pull system through kanban card 0 HC 0 0 HC 0 0 0 HC SMED 0 0 0 HC 0 0 0 0 HC Poka-yoke 0 0 0 0 0 0 HC 0 HC Work load balancing 0 0 0 0 0 0 0 HC HC Total quality management 0 0 0 0 0 0 HC 0 HC Standard Work Process LC 0 MC 0 0 HC
LC 0 HC
Just in time 0 HC 0 0 0 0 LC 0 HC Visual management tools HC HC HC HC HC HC HC HC HC Cellular manufacturing HC 0 HC 0 0 0 LC 0 HC
Lea
n
too
ls a
nd
tech
niq
ues
Lean Implementation Time
Dev
elo
pm
ent
Tim
e (u
nit
)
Tra
inin
g
Tim
e
(un
it)
Ad
just
men
t
Tim
e (u
nit
)
Va
lid
ati
on
Tim
e (u
nit
)
T1 4 2 2 2 T2 6 8 4 4 T3 4 3 4 2 T4 3 1 1 1 T5 8 6 2 3 T6 4 4 6 4 T7 3 4 4 3 T9 6 4 8 4 T9 6 6 4 3 T10 6 6 4 4

Kumar & Robinson (2016). Asian Journal of Research in Social Sciences and Humanities,
Vol. 6, No.5, pp.926-952.
938
Table.10.Modified Time Constraints T
yp
es o
f
Acc
um
ula
tio
n
tim
e
Pre
lim
ina
ry
con
stra
int
Pre
lim
ina
ry
solu
tio
n
Re
alt
ered
Tim
e
Co
nst
rain
ts
Inn
ov
ati
ve
solu
tio
n
Planning time 40 37 43 36 Modification time 52 42 38 30 Training time 35 33 38 31 Validation time 37 32 24 20
![Asian Journal of Business and … Asian Journal of Business and Management Sciences ISSN: 2047-2528 Vol. 2 No. 2 [51-63]](https://static.fdocuments.us/doc/165x107/5b023d997f8b9ab9598d8066/asian-journal-of-business-and-asian-journal-of-business-and-management-sciences.jpg)