Geological modeling using Petrel Software for Mishrif ...
14
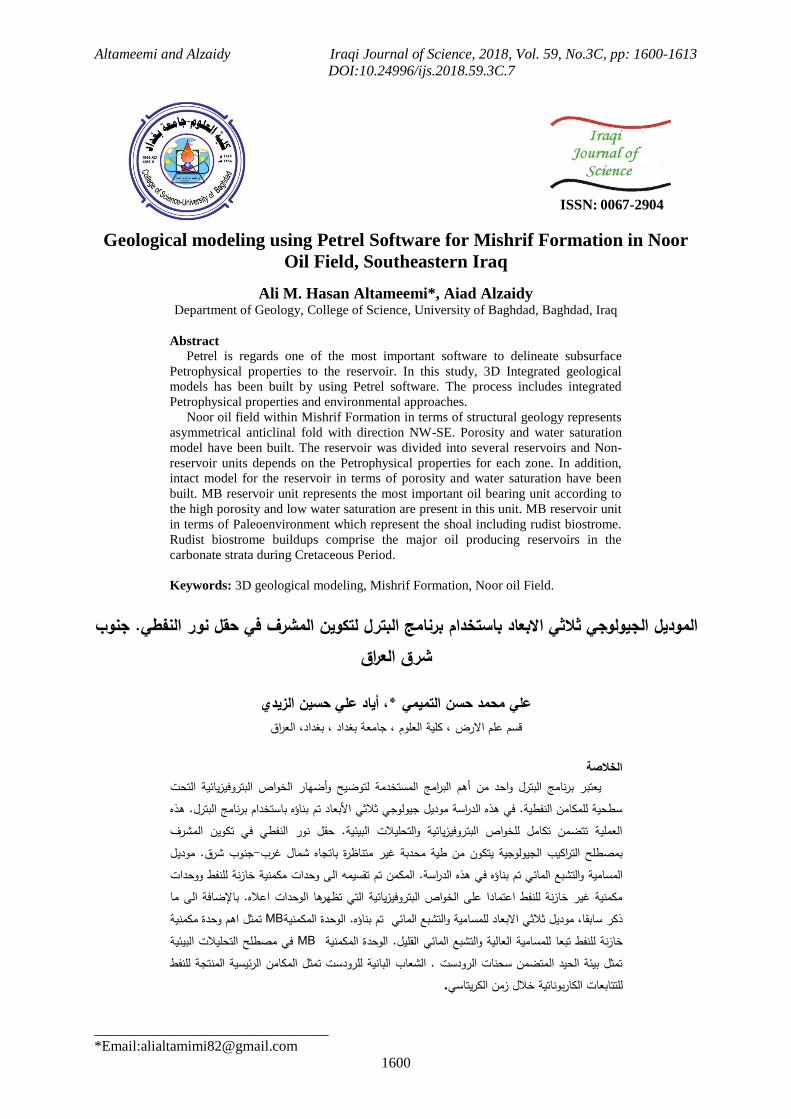
Altameemi and Alzaidy Iraqi Journal of Science, 2018, Vol. 59, No.3C, pp: 1600-1613 DOI:10.24996/ijs.2018.59.3C.7 ________________________________ *Email:[email protected] 1600 Geological modeling using Petrel Software for Mishrif Formation in Noor Oil Field, Southeastern Iraq Ali M. Hasan Altameemi*, Aiad Alzaidy Department of Geology, College of Science, University of Baghdad, Baghdad, Iraq Abstract Petrel is regards one of the most important software to delineate subsurface Petrophysical properties to the reservoir. In this study, 3D Integrated geological models has been built by using Petrel software. The process includes integrated Petrophysical properties and environmental approaches. Noor oil field within Mishrif Formation in terms of structural geology represents asymmetrical anticlinal fold with direction NW-SE. Porosity and water saturation model have been built. The reservoir was divided into several reservoirs and Non- reservoir units depends on the Petrophysical properties for each zone. In addition, intact model for the reservoir in terms of porosity and water saturation have been built. MB reservoir unit represents the most important oil bearing unit according to the high porosity and low water saturation are present in this unit. MB reservoir unit in terms of Paleoenvironment which represent the shoal including rudist biostrome. Rudist biostrome buildups comprise the major oil producing reservoirs in the carbonate strata during Cretaceous Period. Keywords: 3D geological modeling, Mishrif Formation, Noor oil Field. بعاد ثي اولوجي ث الجيموديل الستخدام با في حقل نور لتكوين المشرفبترلمج ال برنا النفطي. جنوب اق شرق العردي حسين الزياد عمي *، أيمي محمد حسن التمي عميرضم ا عم قسم اقمعة بغداد ، بغداد، العروم ، جا ، كمية العمصة الخحتئية التلبتروفيزيار الخواص اح وأضيا امج المستخدمة لتوضين أىم البربترل واحد ممج ال يعتبر برنابترل.مج الم برناستخدابعاد تم بناؤه باثي اولوجي ث اسة موديل جية. في ىذه الدر النفطيمكامن سطحية لم ىذه تكوين المشرفطي في نور النفبيئية. حقلت الئية والتحميلبتروفيزيا لمخواص اية تتضمن تكاملم العم غير متناظرة الجيولوجية يتكون من طية محدبة اكيبصطمح التر بم باتجاه شمال غرب- جنوب شرق. موديلائي تم بنامية والتشبع الملمسا ا تقسيمو الن تم اسة. المكم ؤه في ىذه الدرزنة لمنفط ووحداتت مكمنية خا ى وحدالى مافة اضاه. با الوحدات اع تظيرىاة التيلبتروفيزيائيدا عمى الخواص اعتمازنة لمنفط ا مكمنية غير خا المكمنيةؤه. الوحدة تم بنالمائيمية والتشبع امسابعاد لمثي ا ذكر سابقا، موديل ثMB مكمنيةثل اىم وحدة تم خازنة لمنفط تبعا المكمنية. الوحدةقميلئي اللمالية والتشبع العامية امسا لمMB ت البيئية التحميصطمح في منتجة لمنفطمن الرئيسية الملمكا تمثل البانية لمرودستب الشعات الرودست . ا سحنا بيئة الحيد المتضمن تمثلتاسي زمن الكريللكاربوناتية خت ا لمتتابعا. ISSN: 0067-2904
Transcript of Geological modeling using Petrel Software for Mishrif ...
Altameemi and Alzaidy Iraqi Journal of Science, 2018, Vol. 59, No.3C, pp: 1600-1613
DOI:10.24996/ijs.2018.59.3C.7
________________________________
*Email:[email protected]
1600
Geological modeling using Petrel Software for Mishrif Formation in Noor
Oil Field, Southeastern Iraq
Ali M. Hasan Altameemi*, Aiad Alzaidy Department of Geology, College of Science, University of Baghdad, Baghdad, Iraq
Abstract
Petrel is regards one of the most important software to delineate subsurface
Petrophysical properties to the reservoir. In this study, 3D Integrated geological
models has been built by using Petrel software. The process includes integrated
Petrophysical properties and environmental approaches.
Noor oil field within Mishrif Formation in terms of structural geology represents
asymmetrical anticlinal fold with direction NW-SE. Porosity and water saturation
model have been built. The reservoir was divided into several reservoirs and Non-
reservoir units depends on the Petrophysical properties for each zone. In addition,
intact model for the reservoir in terms of porosity and water saturation have been
built. MB reservoir unit represents the most important oil bearing unit according to
the high porosity and low water saturation are present in this unit. MB reservoir unit
in terms of Paleoenvironment which represent the shoal including rudist biostrome.
Rudist biostrome buildups comprise the major oil producing reservoirs in the
carbonate strata during Cretaceous Period.
Keywords: 3D geological modeling, Mishrif Formation, Noor oil Field.
جنوب .النفطي برنامج البترل لتكوين المشرف في حقل نور باستخدامالموديل الجيولوجي ثلاثي الابعاد شرق العراق
عمي محمد حسن التميمي *، أياد عمي حسين الزيدي، كمية العموم ، جامعة بغداد ، بغداد، العراققسم عمم الارض
الخلاصة
يعتبر برنامج البترل واحد من أىم البرامج المستخدمة لتوضيح وأضيار الخواص البتروفيزيائية التحت ىذه سطحية لممكامن النفطية. في ىذه الدراسة موديل جيولوجي ثلاثي الأبعاد تم بناؤه باستخدام برنامج البترل.
العممية تتضمن تكامل لمخواص البتروفيزيائية والتحميلات البيئية. حقل نور النفطي في تكوين المشرف جنوب شرق. موديل -شمال غرب باتجاهبمصطمح التراكيب الجيولوجية يتكون من طية محدبة غير متناظرة
ى وحدات مكمنية خازنة لمنفط ووحدات ؤه في ىذه الدراسة. المكمن تم تقسيمو الالمسامية والتشبع المائي تم بنامكمنية غير خازنة لمنفط اعتمادا عمى الخواص البتروفيزيائية التي تظيرىا الوحدات اعلاه. بالإضافة الى ما
تمثل اىم وحدة مكمنية MBذكر سابقا، موديل ثلاثي الابعاد لممسامية والتشبع المائي تم بناؤه. الوحدة المكمنيةفي مصطمح التحميلات البيئية MBلممسامية العالية والتشبع المائي القميل. الوحدة المكمنية خازنة لمنفط تبعا
تمثل بيئة الحيد المتضمن سحنات الرودست . الشعاب البانية لمرودست تمثل المكامن الرئيسية المنتجة لمنفط .لمتتابعات الكاربوناتية خلال زمن الكريتاسي
ISSN: 0067-2904
Altameemi and Alzaidy Iraqi Journal of Science, 2018, Vol. 59, No.3C, pp: 1600-1613
1601
Introduction
3D geological modeling has been built for Mishrif Formation using Petrel software. Petrel
represents one of the most familiar and popular software in oil industry[1].The 3D model is the grid
which represents integrated of the stratigraphy, reservoir properties, and the structure in three
direction(X,Y,and Z) [2].Realistic geologic models are required in the oil and gas industry as input to
reservoir simulator programs, which can be predict the rocks behaviors under different hydrocarbon
recovery scenarios.
The aim of this paper is to reconstruct 3D geological modeling using Petrel software for eight wells
in Mishrif Formation in Noor Oil Field. This model includes structural models and Petrophysical
properties for each reservoirs and final model for the reservoir.
Study Area
Noor oil field is located 15 km northeastern of Amara City, Misan Governorate. The field is NW-
SE trending anticline, and is about 20 km long and 6.5 km wide Figure-1.
Figure 1- Location Map of the study area.
Methodology
Petrel software has been chosen for built 3D geological modeling for Mishrif Formation. There are
several steps starting as data requirements for building this type of model. These data are:
1-Well head: include the position for each well of Noor oil field. These data include northern, eastern,
and rotary table Kelly bushing (RTKB).

Altameemi and Alzaidy Iraqi Journal of Science, 2018, Vol. 59, No.3C, pp: 1600-1613
1602
2-Well tops: include well tops for all reservoir units in Mishrif Formation within Noor oil field. In
addition, the total depth for each well have been imported to petrel Software.
3-Well logs: data for eight borehole(include porosity ,water saturation, and CPI values that exported
form IP(Interactive petrophysics software) have been imported to the petrel software.
Workflow steps for design 3D model
In order to build 3D model, there are several steps must be completed in terms of static Petrel
model in petroleum reservoir. These are:
1-3D Grid Construction
This step represents the main steps for build 3D model. This step involves the model were divided
into boxes and each box called a grid cell and will have a single rock type, one value of porosity, one
value of water saturation. These are referred to as the cell's properties. This is a simplification of the
true case, but allows us to generate a representation of reality that can be used in calculation [3].
(Figure-2)
Figure 2- 3D Grid of Mishrif Formation in Noor Oil Field.
1- Structural Contour Map
A structure contour map represents one of the most important step to create three-dimensional
structural interpretation. Contour maps can be drawn by computer from the surface and correlated
boreholes[4].(Figure-3).

Altameemi and Alzaidy Iraqi Journal of Science, 2018, Vol. 59, No.3C, pp: 1600-1613
1603
Figure 3- 3D Structural modeling of Mishrif Formation in Noor Oil Field.
3- Layering of Geological Model
A geologic model requires accurate representation of layered volumes. Three-dimensional (3-D)
geologic models are increasingly the best method to constrain geology at depth [5].
Each reservoir unit has been divided into many layers depending on facies and Petrophysical
properties. MA is divided into 10 layers, MB11 unit has been divided into 10 layers, while MB12 unit
of 5 layers. MB21 unit is divided into 10 and the MB22 unit is divided into 5 layers, MC is divided
into 20 layers, (Figure-4).

Altameemi and Alzaidy Iraqi Journal of Science, 2018, Vol. 59, No.3C, pp: 1600-1613
1604
Figure 4- Layers setting for Noor Model showing the number of layers in Mishrif Formation.
4-Scale up Well Logs
This process includes an averages the values to the cell in the 3D grid that are penetrated by the
well. Each grid cell has a single value for each property. As the grid cells are often much larger than
the sample density for well logs, well log data must be scaled up before entering them into the grid.
This process is also called blocking of well logs [5].There are many statistical methods used to scale
up such as (arithmetic average, harmonic, and geometric method). The distribution of porosity and
water saturation values in the current model used the (arithmetic average) while in the facies model
(most of method) was used . Figures-(5, 6, 7) shows the scale up well logs setting that using in the
Noor model.
Figure 5-Scale up to water saturation.

Altameemi and Alzaidy Iraqi Journal of Science, 2018, Vol. 59, No.3C, pp: 1600-1613
1605
Figure 6- Scale up to the porosity.
Figure7- Scale up to the facies.
5. Property Modeling
Property modeling is a process of filling the cells of the grid with discrete (facies) or continuous
(Petrophysical) properties. Petrel assumes that the layer geometry given to the grid follows the
geological layering in the model area. These processes are therefore dependent upon the geometry of
the existing grid. When interpolating between data points, petrel will propagate property values along
grid layers [6].
The aim of a geological reservoir model is to provide a complete set of continuous reservoir
parameters (i.e. porosity ,permeability, and water saturation) for each cell of the grid .Many different
techniques can be used to generate these parameters [7].
Altameemi and Alzaidy Iraqi Journal of Science, 2018, Vol. 59, No.3C, pp: 1600-1613
1606
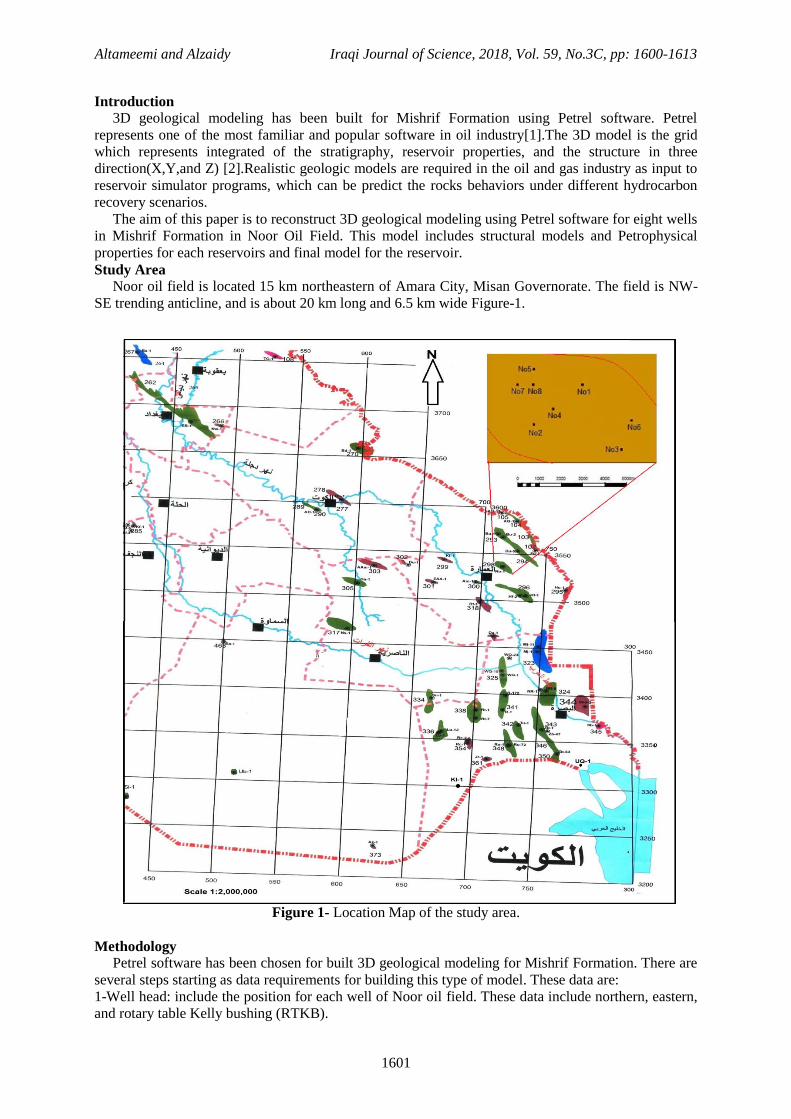
5.1 Facies and Environmental modeling
Facies modeling is discrete facies throughout the model grid. Facies model of Mishrif Formation in
the Noor Oil field was constructed based on the results of the microfacies interpretation of
sedimentary environments as obtained from logs and other geological data, (Figure-8).
Figure 8- 3D facies model of Mishrif Formation in Noor field.
According to the microfacies model, environment of Mishrif Formation was built. The environment
divides into shallow restricted, back-shoal, shoal, shallow open and deep marine environment. The
Results from environmental modeling show that the Mishrif Formation in Noor Oil field has many
stratigraphic traps. Fine textures (mudstone-wackstone) mainly dominate in the lower and uppermost
Mishrif Formation. In contrast, the coarse texture dominant Mainly in the middle of Formation (back
shoal, shoal including rudist biostrome, with some areas in shallow open marine environment,
(Figure.9)
.
Figure 9- 3D environment model of Mishrif Formation in Noor field.

Altameemi and Alzaidy Iraqi Journal of Science, 2018, Vol. 59, No.3C, pp: 1600-1613
1607
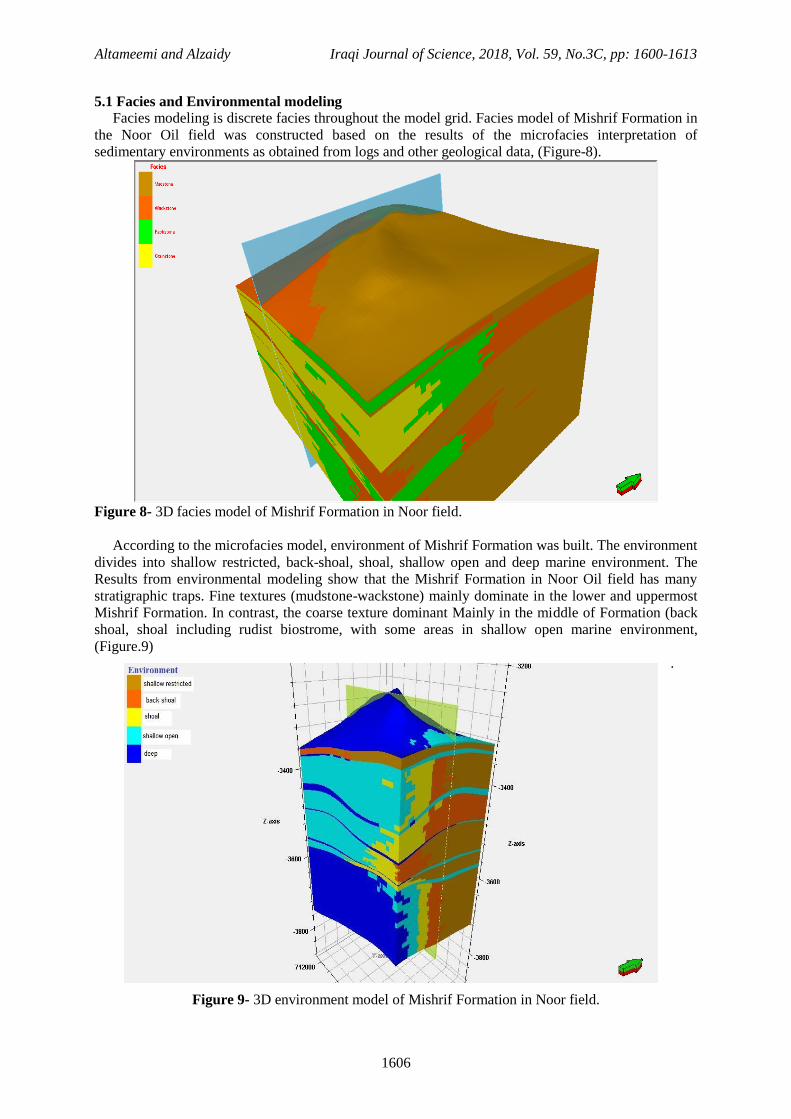
5. 2 Porosity Model
Porosity model was built depending on the results have been determined from porosity logs. In this
model, porosity model was built for each unit to the Mishrif Formation in the Noor oil field. Each unit
characterized by specific range of porosity values Figures-(10, 11, 12, 13, 14, 15).
Figure10- Porosity Model of the MA unit
Figure 11- Porosity Model of the MB11 unit.

Altameemi and Alzaidy Iraqi Journal of Science, 2018, Vol. 59, No.3C, pp: 1600-1613
1608
Figure 12- Porosity Model of the MB12 unit.
Figure 13- Porosity Model of the MB21 unit.
Altameemi and Alzaidy Iraqi Journal of Science, 2018, Vol. 59, No.3C, pp: 1600-1613
1609
Figure 14- Porosity Model of the MB22 unit.
Figure 15- Porosity Model of the MC unit.
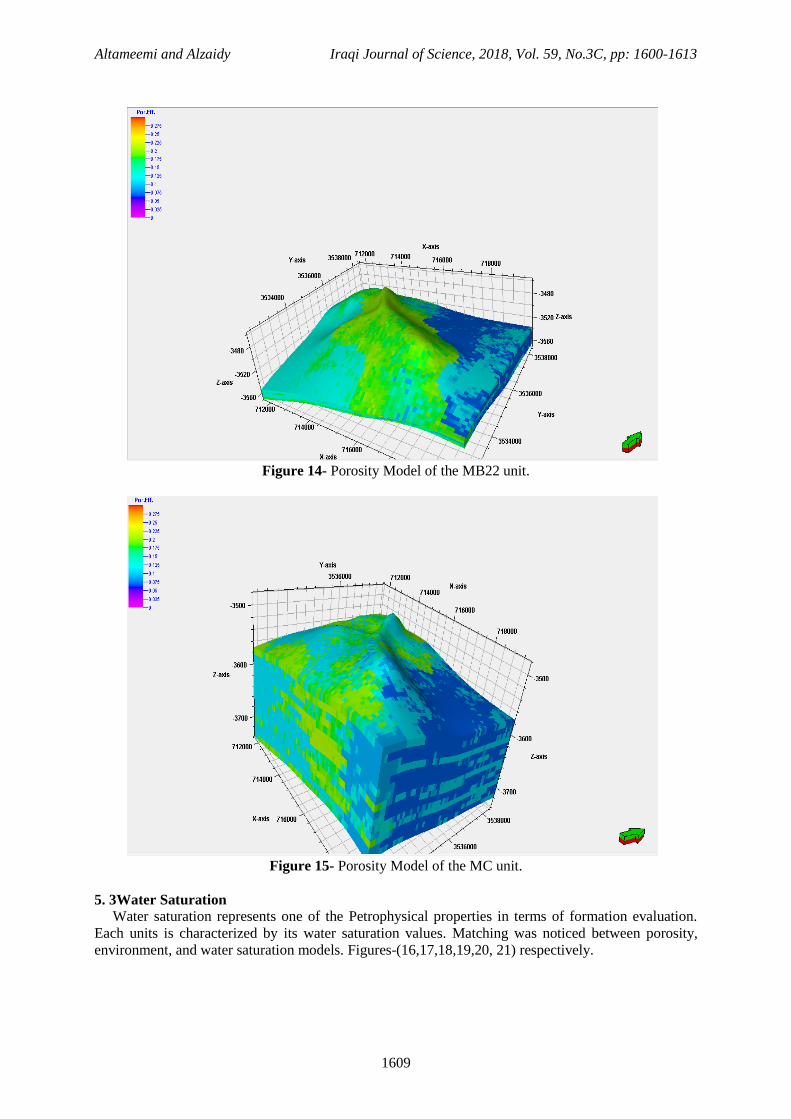
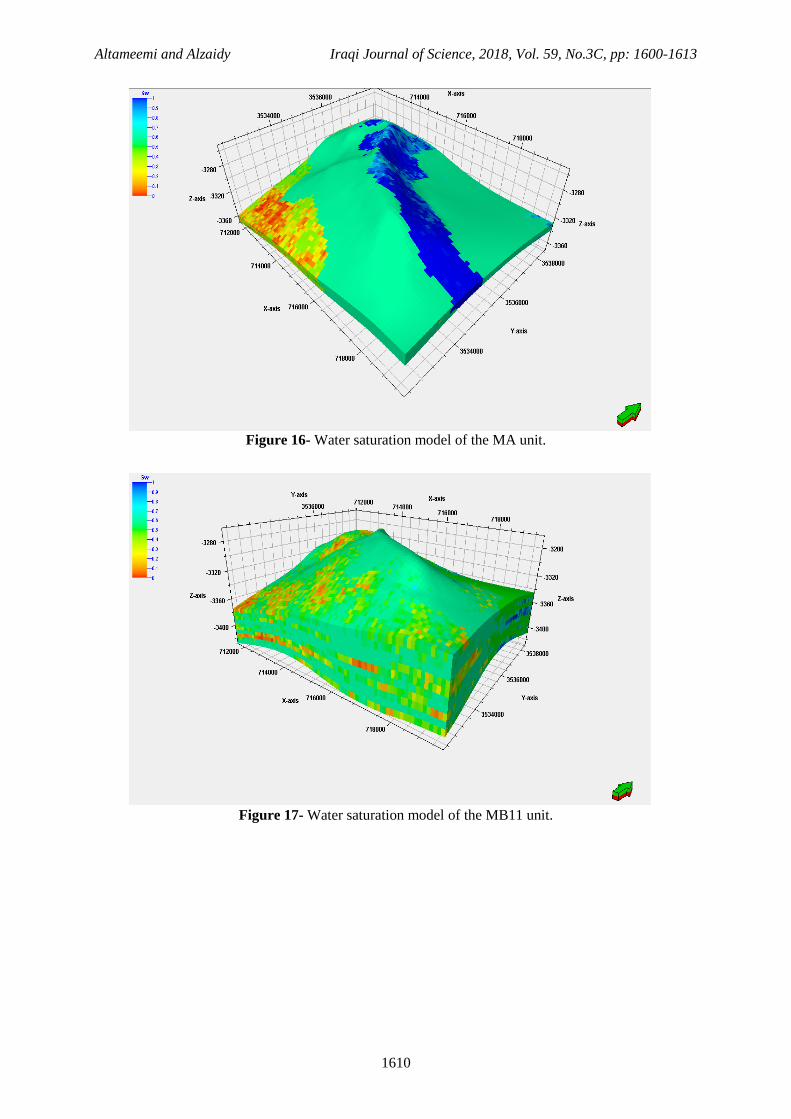
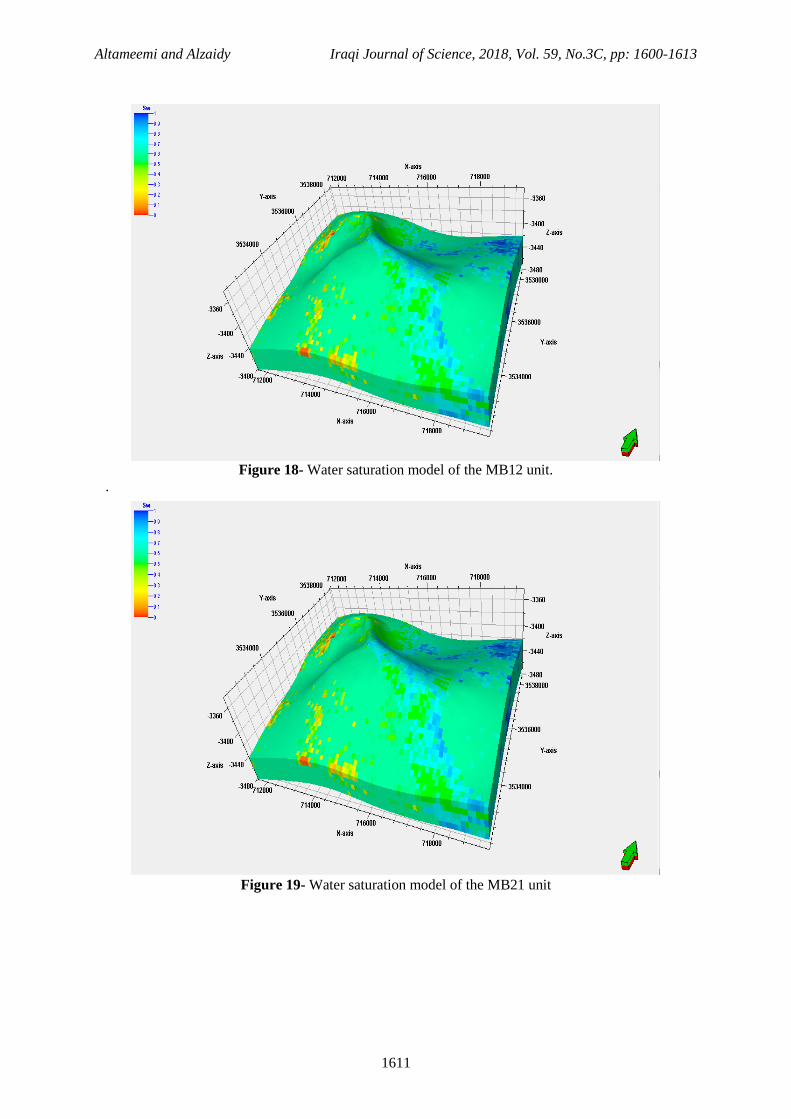
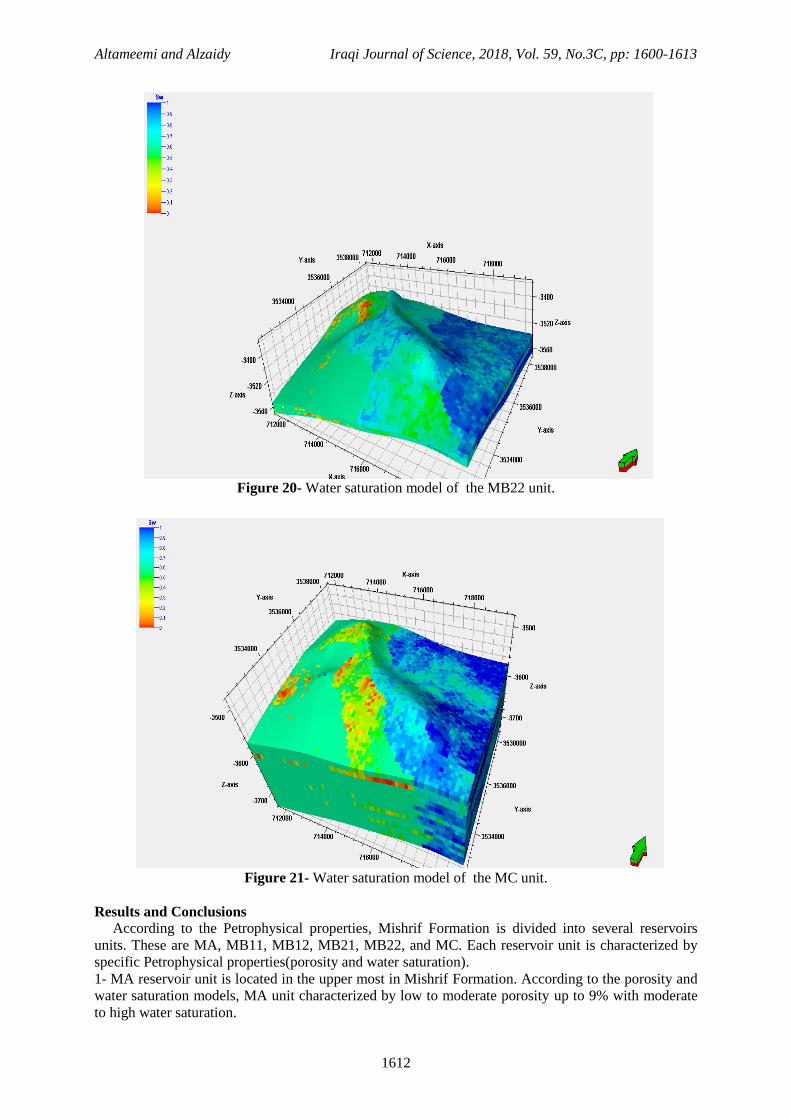
5. 3Water Saturation
Water saturation represents one of the Petrophysical properties in terms of formation evaluation.
Each units is characterized by its water saturation values. Matching was noticed between porosity,
environment, and water saturation models. Figures-(16,17,18,19,20, 21) respectively.
Altameemi and Alzaidy Iraqi Journal of Science, 2018, Vol. 59, No.3C, pp: 1600-1613
1610
Figure 16- Water saturation model of the MA unit.
Figure 17- Water saturation model of the MB11 unit.
Altameemi and Alzaidy Iraqi Journal of Science, 2018, Vol. 59, No.3C, pp: 1600-1613
1611
Figure 18- Water saturation model of the MB12 unit.
.
Figure 19- Water saturation model of the MB21 unit
Altameemi and Alzaidy Iraqi Journal of Science, 2018, Vol. 59, No.3C, pp: 1600-1613
1612
Figure 20- Water saturation model of the MB22 unit.
Figure 21- Water saturation model of the MC unit.
Results and Conclusions
According to the Petrophysical properties, Mishrif Formation is divided into several reservoirs
units. These are MA, MB11, MB12, MB21, MB22, and MC. Each reservoir unit is characterized by
specific Petrophysical properties(porosity and water saturation).
1- MA reservoir unit is located in the upper most in Mishrif Formation. According to the porosity and
water saturation models, MA unit characterized by low to moderate porosity up to 9% with moderate
to high water saturation.
Altameemi and Alzaidy Iraqi Journal of Science, 2018, Vol. 59, No.3C, pp: 1600-1613
1613
2-MB major unit in this study is divided into minor units according to improvement of Petrophysical
properties in (MB11,MB12, and MB21). In general this reservoir unit shows moderate to high porosity
reaches in MB 12 to 25% with low values of water saturation. This results shows that the MB12 is the
main reservoir of Mishrif Formation in Noor oil field.
3-MC unit is characterized by low porosity with high water saturation.
4- High value of porosity in MB12 is due to presence this unit within shoal(including rudists
biostrome) environment. Rudists biostrome represents the main components and then major oil
producing reservoirs in the Cretaceous carbonate strata in the Middle East.
5-Structural contour map shows that the Mishrif Formation in Noor oil field represents asymmetrical
anticlinal fold with trending in NW-SE direction.
5-One of the most important goals from using Petrel software is to determine which directions the
Petrophysical properties enhance or decrease.
6-3D environmental model have been made depending on the facies analysis. The shoal, including
rudist biostrome environment represents the main environment for oil bearing facies. The
improvement in porosity affected by lateral and vertical facies variation. This facies variations
affected by sea level changes and their relationships with the tectonic factor. Therefore, each unit in
terms of reservoir and stratigraphy has facies distribution differs from the others and then differences
in porosity. In Noor Oil Field, bath improvement take a direction NW-SE passes through the dome of
the structure. MA and MB11 reservoir units the improvement in porosity taking a bath in S and SE
direction from the field. Figure(10 and 11).While in MB12 the improvement is located in the eastern
direction and southern part of the field.(Figure 12). Finally, MB22 reservoir unit, the improvement in
porosity taking a zone extended from SE-NW. (Figure-14)
7-From the porosity model, the porosity increases in the shoal including rudist biostrome environment.
Conclusions
1. According to the structural map, the Mishrif Formation in Noor oil Field shows asymmetrical
anticlinal fold which contains one dome.
2. According to the described horizons of Mishrif Formation, this formation was divided into several
reservoirs units MA,MB11,MB12,MB21,MB22,and MC. Each reservoir unit is characterized by
specific range of porosity and water saturation.
3. MB11 and MB12 which are the highest in terms of Petrophysical properties(porosity values).
4. 3D Environmental models were built by using Petrel software. The results show the shoal
including rudist biostrome environment represent the main oil bearing facies.
5. High porosity values are present in the shoal including rudist biostrome environment because the
rudist represent the main rock forming organisms within Cretaceous period.
References
1. Caumon, G., Carlier de Veslud, C., Viseur, S. and Sausse, J. 2009. Surface-Based 3D Modeling of
Geological Structures. International Association for Mathematical Geoscience, Math Geosci, 41:
927-945.
2. Turner, A.K. and Gable, C. W. 2008. A review of Geological Modeling. Colorado School of
Mines, USA.
3. Schlumberger, 2007. Petrel Structural modeling course.105-123.
4. Pack, S. 2000. Creating 3D Models of Lithologies using 3D grid. Dynamic Graphics, Inc.
Alameda.
5. Schlumberger, 2008. Petrel introduction course, Schlumberger, 50-334p.
6. Schlumberger, 2009. Petrel online help, Petrel Introduction Course Schlumberger, 560pp.
7. Bellorini, J. P., Casas, J., Gilly P., Jannes, P. and Matthews P. 2003. Definition of a 3D Integrated
Geological Model in a Complex and Extensive Heavy Oil Field, Oficina Formation, Faja de
Orinoco, Venezuela, Sincor OPCO,Caracas,Venezuela.