Genuine Savings Rates in Developing...
24
THE WORLD BANK ECONOMIC REVIEW, VOL. 13, NO. 2: 333-S6 Genuine Savings Rates in Developing Countries Kirk Hamilton and Michael Clemens Augmented measures of savings and wealth in the national accounts are critical to conceptualizing and achieving sustainable development. After developing the theory of genuine savings—traditional net savings less the value of resource depletion and envi- ronmental degradation plus the value of investment in human capital—this article pre- sents empirical estimates for developing countries. These calculations account for re- source depletion and carbon dioxide emissions, using consistent time series data for 1970-93. The empirical evidence shows that levels of genuine savings are negative in a wide range of countries, particularly in Sub-Saharan Africa, and that these countries are being progressively impoverished. Increasing the coverage of natural resources and pol- lutants in our calculations would reduce the estimated levels of genuine savings overall. The use of genuine savings measures suggests a series of policy questions that are key to sustaining development. These are also explored, specifically the extent to which mon- etary and fiscal policies, exports of exhaustible resources, stronger resource policies, and pollution abatement measures boost genuine savings rates. For policymakers, link- ing sustainable development to genuine savings rates means that there are many pos- sible interventions to increase sustainability, from the macroeconomic to the purely environmental. However defined, achieving sustainable development necessarily entails creating and maintaining wealth. Given the centrality of savings and investment in eco- nomic theory, it is surprising that the effects of depleting natural resources and degrading the environment have not, until recently, been considered in measure- ments of national savings. Augmented measures of savings and wealth in the national accounts are critical to conceptualizing and achieving sustainable devel- opment, which was a prime motivation for publishing Expanding the Measure of Wealth (World Bank 1997). Valuing depletion and degradation within a national accounting framework is an increasingly viable proposition, both as a result of the significant progress made in techniques of valuing environmental resources (for a recent example, see Free- man 1994) and as a result of the expanding foundation that theoretical develop- ments are placing under the mediods of "green" national accounting (Weinman 1976, Hartwick 1990, Maler 1991, and Hamilton 1994, 1996). The first cross- country application of these greener accounting methods to the measurement of Kirk Hamilton is with the Environment Department at the World Bank, and Michael Clemens is with the Department of Economics at Harvard University. The authors gratefully acknowledge the comments of Danny McCoy, David Pearce, and three reviewers. © 1999 The International Bank for Reconstruction and Development / T H E WORLD BANK 333 Public Disclosure Authorized Public Disclosure Authorized Public Disclosure Authorized Public Disclosure Authorized Public Disclosure Authorized Public Disclosure Authorized Public Disclosure Authorized Public Disclosure Authorized
Transcript of Genuine Savings Rates in Developing...
THE WORLD BANK ECONOMIC REVIEW, VOL. 13, NO. 2: 333-S6
Genuine Savings Rates in Developing Countries
Kirk Hamilton and Michael Clemens
Augmented measures of savings and wealth in the national accounts are critical toconceptualizing and achieving sustainable development. After developing the theory ofgenuine savings—traditional net savings less the value of resource depletion and envi-ronmental degradation plus the value of investment in human capital—this article pre-sents empirical estimates for developing countries. These calculations account for re-source depletion and carbon dioxide emissions, using consistent time series data for1970-93. The empirical evidence shows that levels of genuine savings are negative in awide range of countries, particularly in Sub-Saharan Africa, and that these countries arebeing progressively impoverished. Increasing the coverage of natural resources and pol-lutants in our calculations would reduce the estimated levels of genuine savings overall.The use of genuine savings measures suggests a series of policy questions that are key tosustaining development. These are also explored, specifically the extent to which mon-etary and fiscal policies, exports of exhaustible resources, stronger resource policies,and pollution abatement measures boost genuine savings rates. For policymakers, link-ing sustainable development to genuine savings rates means that there are many pos-sible interventions to increase sustainability, from the macroeconomic to the purelyenvironmental.
However defined, achieving sustainable development necessarily entails creatingand maintaining wealth. Given the centrality of savings and investment in eco-nomic theory, it is surprising that the effects of depleting natural resources anddegrading the environment have not, until recently, been considered in measure-ments of national savings. Augmented measures of savings and wealth in thenational accounts are critical to conceptualizing and achieving sustainable devel-opment, which was a prime motivation for publishing Expanding the Measureof Wealth (World Bank 1997).
Valuing depletion and degradation within a national accounting framework isan increasingly viable proposition, both as a result of the significant progress madein techniques of valuing environmental resources (for a recent example, see Free-man 1994) and as a result of the expanding foundation that theoretical develop-ments are placing under the mediods of "green" national accounting (Weinman1976, Hartwick 1990, Maler 1991, and Hamilton 1994, 1996). The first cross-country application of these greener accounting methods to the measurement of
Kirk Hamilton is with the Environment Department at the World Bank, and Michael Clemens is withthe Department of Economics at Harvard University. The authors gratefully acknowledge the commentsof Danny McCoy, David Pearce, and three reviewers.
© 1999 The International Bank for Reconstruction and Development /THE WORLD BANK
333
Pub
lic D
iscl
osur
e A
utho
rized
Pub
lic D
iscl
osur
e A
utho
rized
Pub
lic D
iscl
osur
e A
utho
rized
Pub
lic D
iscl
osur
e A
utho
rized
Pub
lic D
iscl
osur
e A
utho
rized
Pub
lic D
iscl
osur
e A
utho
rized
Pub
lic D
iscl
osur
e A
utho
rized
Pub
lic D
iscl
osur
e A
utho
rized
wb451538
Typewritten Text
77293

334 THE WORLD BANK ECONOMIC REVIEW, VOL. 13, NO. 2
net savings appears in Pearce and Atkinson (1993), who combine published esti-mates of depletion and degradation with standard national accounting data tocalculate true savings for 20 countries. According to this measure many countriesappear to be on unsustainable paths because their gross savings are less than thesum of conventional capital depreciation and natural resource depletion.
Enlarging the concept of net savings to include the depletion of natural resourcesis a reasonable way to extend traditional savings concepts. The depletion of anatural resource is, in effect, the liquidation of an asset and therefore should notappear as a positive contribution to net income or net savings. Although minortechnical issues remain, the methods of valuing the discovery, depletion, and growthof commercial natural resources in the context of the System of National Accounts(SNA) are now well developed (Hamilton 1994 and Hill and Harrison 1994).
More problematic is the valuation of environmental degradation. While UnitedNations guidelines for environmental accounting favor valuation according tothe cost of restoring the environment to its state at the beginning of the account-ing period—the maintenance-cost method—theoretical approaches suggest thatthe marginal social costs of pollution are a more correct basis for valuing emis-sions into the environment (United Nations 1993 and Hamilton 1996).
After developing the theory of genuine savings, this article presents empiricalestimates for developing countries. These calculations account for resource deple-tion and carbon dioxide emissions using consistent time series data for 1970-93.The article concludes with a discussion of the policy issues raised by greenernational accounting.
I. GENUINE SAVINGS: A FORMAL MODEL
The notion of genuine savings is presented briefly and informally in Hamilton(1994) and Pearce, Hamilton, and Atkinson (1996). This section provides a morerigorous development using a model that, although extremely simple, identifiesthe adjustments to savings measures that must be made to account for naturalresources, pollutants, and human capital. Sustainable development is defined tobe, as in Pezzey (1989), nondeclining utility.
We assume a simple closed economy with a single resource used as an input tothe production of a composite good that may be consumed, invested in producedassets or human capital, or used to abate pollution, so that F (K,R,N) = C + K.+a + m, where K is physical capital, R is resource use, N is human capital, C isconsumption, Xis investment in physical capital, a is pollution abatement expen-ditures, and m is investment in human capital (current education expenditures).The function q(m) transforms education expenditures into human capital thatdoes not depreciate (and can be considered as a form of disembodied knowl-edge), so that N= q(m).x Labor is fixed and therefore factored out of the produc-tion function.
1. Investing in human capital is a type of endogenous technical progress. See Weitzman and Lofgren(1997), who deal with exogenous technical change.

Hamilton and Clemens 335
Pollution emissions are a function of production and abatement, e - e(F, a),and pollutants accumulate in a stock X such that X = e - d(X), where d is thequantity of natural dissipation of the pollution stock. The flow of environmentalservices B is negatively related to the size of the pollution stock, so that B = a(X),a x < 0. Resource stocks S grow by an amount g, are depleted by extraction R sothat S = g(S) - R, and are assumed to be costless to produce. The utility of con-sumers is assumed to be a function of consumption and environmental services,U = U(C,B). There is a fixed pure rate of time preference r.
Following Hartwick (1990), new green national accounting aggregates aredefined on the basis of an intertemporal optimization problem. Wealth, W, isdefined to be the present value of utility on the optimal path. It is assumed that asocial planner wishes to maximize wealth as follows:
max W = J~ U(C,B)e-"ds subject to:K=F-C-a-mX =e-dS= -R+gN = q{m).
The current-value Hamiltonian function, which is maximized at each point intime, is given by,
(1) H=U + yKK+yxX+ysS + yNN
where yK, yx, y$, and yN are, respectively, the shadow prices (in utils) of capital,pollution, resources, and human capital. Deriving the first-order conditions for amaximum, the Hamiltonian function may be written as
H = U(C,B) + UC[K~ (1 - beF)FR(R -g)- b(e -d) + q/ql
where b is the marginal cost of pollution abatement. These Hamiltonian equali-ties hold because we assume the economy is on an optimal trajectory. Hamilton(1996) shows that b is precisely equal to the marginal social cost of pollutionemissions and is therefore also equal to the level of the Pigovian tax on emissionsrequired to maximize welfare. The term beF can thus be interpreted as the effec-tive tax rate on production as a result of the emissions tax. So, although westarted with an optimal growth problem, the prices that result are those thatwould prevail in a competitive economy with a Pigovian tax on pollution. Noteas well that 1/q' is the marginal cost of creating a unit of human capital.
Since S-g-R, X=e-d, and N= q, the bracketed expression in the secondterm of the right side of the Hamiltonian is equal to the change in the real valueof all assets in this simple economy, where human capital is valued at its mar-ginal creation cost, pollution stocks are valued at marginal abatement costs, andnatural resources are valued at the resource rental rate, FR, net of the effective tax

336 THE WORLD BANK ECONOMIC REVIEW, VOL. 13, NO. 2
rate on production associated with pollution emissions. Therefore the bracketedexpression also serves to define genuine savings, G,
(2) G = K - ( 1 - beF)FR(R -g)- b(e - d) + qlq'.
For nonliving resources g is equal to zero, and for "pure" cumulative pollutantsd is also zero.
Genuine savings consists therefore of investment in produced assets and hu-man capital, less the value of depletion of natural resources and the value ofaccumulated pollutants. As shown in Hamilton (1997),
(3) UcG=W=rW-U.
Expression 3 implies the following: negative genuine savings at a point in timemeans that future utility must be less than current utility over some period on theoptimal path. In other words, negative genuine savings serves as an indicator ofnonsustainability. This expression also implies that Hicksian income, the maxi-mum amount of produced output that could be consumed while leaving totalwealth instantaneously constant, is given by
(4) NNP = C + K- (1 - beF)FR(R -g)- b(e -d) + qlq'.
Asheim (1994) points out that prices observed in the marketplace will gener-ally differ from those required to support a sustainable (constant-utility) path.However, Asheim is working with a model in which the optimal path is notsustainable. He uses the model of Dasgupta and Heal (1979), in which fixedtechnology, exhaustible resources, and a fixed pure rate of time preference leadto an economy where welfare declines asymptotically to zero along the optimalpath. For this economy the maximal sustainable path is supported by the Hartwickrule (Hartwick 1977): genuine savings are set to be identically zero at each pointin time, and as a result utility is constant. Within the confines of the fixed-technology model, Asheim's point stands.
For a suitable specification of the human capital accumulation function, themodel used in this article is one in which the optimal path is sustainable. Even ifresources are exhaustible and pollution stocks do not dissipate, the endogenoustechnical progress inherent in human capital formation will yield an optimal pathalong which utility rises asymptotically to a positive maximum value. The inter-esting question for this model concerns divergences between observed "real world"prices and theoretical shadow prices on the optimal path. Hamilton, Atkinson,and Pearce (1998) argue that policy distortions in a typical economy lead tooverextraction of natural resources and excess pollution emissions. Under theseconditions it can be shown that real world resource rents exceed their optimallevels, as do marginal pollution damages. More efficient resource and environ-mental policies will reduce this bias and also increase genuine savings.

Hamilton and Clemens 337
The current model can easily be extended to include foreign trade and depre-ciation of produced assets. If produced capital depreciates at a percentage rateequal to 8, then the accounting identity for these assets becomes
K=F-C-a-m-hK
where K now measures net investment.Turning to foreign trade, net foreign assets, A, accumulate as a result of ex-
ports, E, and decumulate with imports, M. For a fixed international rate of re-turn, i, therefore, the asset accounting identity is
A = iA + E - M.
Under these assumptions the measure of Hicksian income, NNP, for an openeconomy is given by
NNP = C + K+E-M + iA-(l-beF)FR(R-g) - b(e-d) + qlq'.
The first six terms in this expression are precisely the standard measure ofNNP. An expanded conception of the asset base implies that the standard NNPshould be adjusted by deducting net depletion of natural resources and the mar-ginal damages from net accumulation of pollution and by adding investments inhuman capital.
Vincent, Panayotou, and Hartwick (1997) show that for a small resource-exporting economy, taking international prices as given, NNP should include thepresent value of future capital gains on resource exports. Hamilton (1997) ar-gues that given the long-term flat-to-declining trend in real resource prices (atleast for subsoil resources), this potential annuity can be considered to be zero. Itwas precisely the unwarranted presumption that prices of resource exports wouldcontinue to rise that led many natural resource exporters into difficulty in the1980s.
The treatment of education and pollution abatement expenditures requiresmore elaboration. Hamilton (1994) essentially argues that current education ex-penditures are not consumption and therefore should be included in savings.Defining net marginal resource rents as n s (1 - beF)FR, NNP can be defined as
(5) NNP = GNP-8K-a-n{R-g)-b(e-d)
where GNP is gross national product.
\mq'
Since \lq' is the marginal cost of creating a unit of human capital, andmlq is the average cost, expression 5 suggests that the value of investments inhuman capital should be greater than current education expenditures (under theusual assumptions about convexity) and that these current expenditures can there-fore serve as a lower-bound estimate of the investment in human capital.

3 3 8 THE WORLD BANK ECONOMIC REVIEW, VOL. 13, NO. 2
Expression 5 says that pollution abatement expenditures, a, are essentiallyintermediate in character and should be deducted in measuring genuine savings.In practice, most current abatement expenditures are already treated as interme-diate inputs in standard national accounting.
Finally, it is important to present the formula for calculating genuine savingsfrom real data. For produced asset depreciation 8K, net marginal resource rentalrate «, and marginal social cost of pollution a, this is given by,
(6) G = GNP-C-SK-n(R-g)-o(e-d) + m.
Here, GNP - C is traditional gross savings, which includes foreign savings,while GNP - C - 8K is traditional net savings. Since carbon dioxide is the onlypollutant considered in what follows, bef can be assumed to be close to zero, sothe adjustment to net resource rents (1 - beF) can safely be assumed to be near 1,while dissipation, d, is assumed to be small relative to emissions, e?
Net natural growth of living resources (R -g) is not added to genuine savingswhen it is positive, but net depletion (that is, when R > g) is deducted. Althoughthis will bias the results against sustainability, Vitousek and others (1986) esti-mate that less than 33 percent of standing forests are merchantable. Empiricalexamination of regions where growth exceeds harvest reveals a number of heavilyforested countries (including Bolivia, Central African Republic, Republic of Congo,and Guyana), where valuing net growth at current unit rents would equal 20-50percent of GNP. A clear dichotomy is at work: all of the timber in net depletioncountries is merchantable, by definition, while probably less than one-third ismerchantable in net growth countries. It is likely that mechanically adding netforest growth to GNP and savings would implicitly include the growth of manyuneconomic trees (those with zero rental value).
II. MEASURING RESOURCE DEPLETION AND ENVIRONMENTAL DEGRADATION
Building on the theory of green national accounting, this article provides afirst set of calculations of genuine savings from a consistently derived and rea-sonably comprehensive time series data set on resource depletion and carbondioxide emissions. Previous studies, such as Repetto and others (1989), Sadoff(1992), and Kellenberg (1995), deal with particular countries in depth. The cal-culations presented here necessarily trade off some amount of accuracy againstwider coverage.
Data availability limits the adjustments to savings measures to the following:valuing resource rents for nonrenewable resources, valuing depletion of forestsbeyond replacement levels, and valuing the marginal social costs of carbon diox-ide (CO2) emissions.
2. Carbon dioxide has an atmospheric residency time of 200 years, or a dissipation rate of roughly 0.5percent a year. For an average growth rate in emissions of 5 percent a year, therefore, the equilibrium ratioof dtoe is 1/11.

Hamilton and Clemens 339
The basic approach to calculating resource rents for nonrenewable resources isto subtract country- or region-specific average costs of extraction from the worldprice for the resource in question, all expressed in current U.S. dollars. Many worldprices were derived from World Bank (1993): where multiple markets—for ex-ample, London and New York—are reported, a simple average of these marketprices serves as the world price. So, for minerals the total resource rents are calcu-lated as the world price minus mining costs minus nulling and beneficiarion costsminus smelting costs minus transport to port minus "normal" return to capital.Cost data are derived from U.S. Bureau of Mines (1987).
For crude oil, unit rents are calculated as the world price minus lifting costs.These lifting costs were estimated based on data from the Inter-American Devel-opment Bank (IDB 1981), International Energy Agency (IEA 1994b, 1995c, 1995d,1996), Jenkins (1989), Sagers, Kryukov, and Shmat (1995), and Smith (1992).
Natural gas, although its international trade has soared in recent years, cannotyet be said to possess a single world price. A world price was estimated by aver-aging free-on-board prices from several points of export worldwide, after whichthe unit rents were calculated like those for oil. Production costs were taken fromAdelman (1991), Cornot-Gandolphe (1994), IEA (1995d), Julius and Mashayekhi(1990), Khan (1986), Liefert (1988), Mashayekhi (1983), and Meyer (1994).
For hard coal a world price was calculated by combining data on steam andcoking coals after adjusting for differences in heat content and quality. A worldprice for lignite was obtained by analyzing national-level differences in pricesbetween hard coal and lignite in various countries and estimating a similar pro-portion of values to hold true with respect to the world price for hard coal. Unitrents for both hard coal and lignite were then calculated as for oil. Coal produc-tion costs were taken from Bhattacharya (1995), Doyle (1987), IEA (1994a, 1995b,1995d, 1995e,), Tretyakova and Heinemeier (1986), and World Bank data.
For forest resources only rent on the portion of wood production that exceedsthe country's mean annual increment in commercial wood mass was subtractedfrom savings. A price for the wood of each country was calculated based on theproportions of fuelwood, coniferous softwood, nonconiferous softwood, and tropi-cal hardwood found in total annual production. Representative world prices wereused for each type of wood, and a price for fuelwood was estimated using WorldBank data. Unit rents were calculated by subtracting average unit harvest costsfrom the world price.
There are several further points to note about this methodology:
• From a theoretical viewpoint depletion estimates depend on scarcity rents,which should be measured as price minus marginal cost of extraction(including a normal return to capital). In practice, data on marginalproduction costs are almost never available, and practitioners (as evidencedby the green national accounting literature) fall back on using average ex-traction costs. This tends to overstate calculated resource rents and henceto understate genuine savings.

340 THE WORLD BANK ECONOMIC REVIEW, VOL. 13, NO. 2
* Countries may or may not be selling their natural resources for internalconsumption at world market prices, although they have good incentives todo so. Moreover, the use of uniform world prices tends to overstate rentsfor countries with lower-grade resources.
* Extraction costs are measured at a fixed point in time, which differs fromcountry to country and resource to resource according to the availability ofdata. Extraction costs are held constant (in real terms) during 1970-94.World prices vary over time, leading to corresponding variations in calculatedrental rates.
• If the extraction cost data are region- rather than country-specific, theregional cost structure is applied to all of the producing countries in theregion.
• Rents on minerals are generally viewed as accruing to the resource ownerfor the production of the crude form of the material in question, typicallyan ore. In practice, most mineral operations are vertically integrated to aconsiderable extent, and the only price and cost data are for refined formsof the materials. Measuring resource rents as described above for thesevertically integrated mineral operations therefore implicitly ascribes to theresource rent any excess returns to capital for the milling and refining stages.
Table 1 presents the calculated average rental rates for several resources. Thetable also shows which cost components, subject to data availability, went intothe calculation of rental rates. In most (but not all) cases an explicit rate of returnon capital appears as a cost component. Missing cost components lead, of course,to overestimates of resource rents. In line with the formal green national ac-counting methods of the preceding section, the country-specific unit resourcerents in each year are multiplied by the quantities of resource extraction for eachof the resources in table 1 to arrive at the total value of resource depletion.
For tropical forest resources, valuing depletion is much more complicated.Where deforestation is occurring, the issue is essentially one of land use, withstanding forests being one use among many for a particular land area. This sug-gests that the correct way to value deforestation is to measure the change in landvalue (which should represent the present value of the net returns under the cho-sen use for land); this is essentially the result in Harrwick (1992). The formalmodel suggests that, where deforestation is not occurring but harvest exceedsgrowth, it is the net depletion of the resource that should be valued.
Because data on the value of forested land before and after clearance are notwidely available, deforestation is not treated explicitly, and forest depletion issimply valued as the stumpage value (price minus average logging cost) of thevolume of commercial timber and fuelwood harvested in excess of natural growthin commercially valuable wood mass for that year. Harvest rates by country areas given in FAO (1994). The annual increment is estimated using World Bankdata and Duvigneaud (1971), Lamprecht (1989), FAO/UNECE (1992), and Kanowskiand others (1992). Stumpage rates come from World Bank data, Openshaw and

Hamilton and Clemens 341
Table 1. Rental Rates for Natural Resources(share of world price)
Naturalresource
BauxiteCopperCrude oilForestryGoldHard coalIron oreLeadLigniteNatural gasNickelPhosphate
rockSilverTinZinc
Mean
0.610.490.650.450.290.280.580.230.380.590.35
0.260.310.350.21
Standarddeviation
0.130.200.260.130.150.170.240.120.170.240.21
0.140.220.160.13
Cost components
Mining, millingMining, milling, smelting, 15 percent return on capitalProduction costsLogging and transportMining, milling, transport, 15 percent return on capitalMining and transportMining, beneficiation, transportMining, milling, smelting, transport, 15 percent return on capitalMining and transportProduction costsMining, milling, smelting
Mining, milling, transport, 15 percent return on capitalMining, milling, transport, 15 percent return on capitalMining, milling, 15 percent return on capitalMining, milling, smelting, transport, 15 percent return on capital
Note: Values are for unweighted pooled data from 1985-94 (except silver and tin, 1975-94), excludingnegative values.
Source: Authors' estimates.
Feinstein (1989), Kellenberg (1995), and others; market prices are from FAO (1983,1995), Openshaw and Feinstein (1989), van Buren (1990), Barnes (1992), andWorld Bank (1993).
The foregoing description of the valuation of forest depletion suggests that thecalculations are quite rough. It should also be obvious that the values calculatedpertain only to commercial exploitation, so that the values of biodiversity, car-bon sequestration, and other uses are not captured.
Pollution damages can enter green national accounts in different ways. Al-though damage to produced assets (the damage to building materials caused byacid rain, for example) is in principle included in depreciation figures, in practicemost statistical systems are not detailed enough to pick this up. The effects ofpollution on output (damaged crops, lost production owing to morbidity) areusually not broken out explicitly, but because they are reflected implicitly in thestandard national accounts, there is no need to adjust savings measures in thisregard.3 Traditionally, the key pollution adjustment is for welfare effects, valuingthe willingness-to-pay to avoid excess mortality and the pain and suffering frompollution-linked morbidity. Because these marginal damage figures are locale-specific, no general treatment of pollution emissions is attempted in the follow-ing discussion.
3. However, if the productive capacity of an asset, such as soil fertility, is damaged by pollution, thenthe loss in asset value should be deducted from savings.

342 THE WORLD BANK ECONOMIC REVIEW, VOL. 13, NO. 2
The only social costs considered here, therefore, are for carbon dioxide. Dataare readily available for this pollutant, and damages are global rather than strictlylocal. The basic emissions data employed are from the Carbon Dioxide Informa-tion and Analysis Center (CDIAC 1994), covering fossil fuel combustion and ce-ment manufacture. The global marginal social cost of a metric ton of carbonemitted is assumed to be $20 in 1990, taken from Fankhauser (1994). Globaldamages are charged to emitting countries on the assumption that the propertyright to a clean environment lies with the pollutee—for example, we are assum-ing that the Comoros Islands have the right not be inundated as a result of CO2
emissions elsewhere.A key element missing in the calculations is any valuation of soil erosion,
owing to the lack of comprehensive data sets on either physical erosion or itsvalue. This is an important gap considering the significance of agriculture inmost developing countries—erosion is considered to be a major problem in Sub-Saharan African countries in particular. A second missing element is fish stocks,where data problems, questions of ownership, and near-zero rental values result-ing from overfishing all militate against including values of depletion.
III. EMPIRICAL ESTIMATES OF GENUINE SAVINGS
The traditional measure of a nation's rate of accumulation of wealth, as re-ported in the World Bank's World Development Indicators, for instance, is grosssavings (World Bank, various years). This is calculated as a residual: GNP minuspublic and private consumption. Net savings, gross savings less the value of de-preciation of produced assets, is a first step toward a sustainability indicator.Measures of genuine savings address a much broader conception of sustainabilitythan net savings by valuing changes in the natural resource base and environ-mental quality in addition to produced assets. Figure 1 presents the componentsof genuine savings as the share of GNP for Tunisia. Note that this calculationomits, for the moment, the effects of human capital investment.
The starting point in the calculation of genuine savings is just standard na-tional accounting. The top curve in figure 1 is gross domestic investment: totalinvestment in structures, machinery and equipment, and inventory accumula-tion. Net foreign borrowing, including net official transfers, is then subtractedfrom this top curve to give gross savings: the difference between production andconsumption over the year. Next, the depreciation of produced assets is deducted,yielding the curve for net savings. Finally, the bottom line is genuine savings,which is obtained by subtracting the value of resource depletion and pollutiondamages from net savings.
The basic national accounts data used to derive genuine savings rates are takenfrom the World Bank's World Tables (World Bank 1995). However, these datado not include the value of depreciation of produced assets. Unofficial estimatesof depreciation, as calculated from perpetual inventory models, are taken fromNehru and Dhareshwar (1993). All of the data sets employed in this article—the

Hamilton and Clemens 343
Figure 1. Genuine Savings in Tunisia, 1970-94Percentage of GNP
•-Gross domestic investment
Net foreignborrowing
"«- Gross savings
«- Net savings
* '<- Genuine savings
Source: Authors' estimates.
World Tables data, the depreciation estimates, and the resource depletion anddegradation calculations—have gaps in their coverage.4
The critical elements added by the green national accounting literature arerecognition of natural resources as factors of production and of environmentalamenities as sources of welfare. A first question to be answered, therefore, iswhether the calculation of depletion and degradation adds substantially to thepicture of whether countries are on a sustainable path. This reduces the questionto whether there are countries whose net savings rates are positive but whosegenuine savings rates are negative.
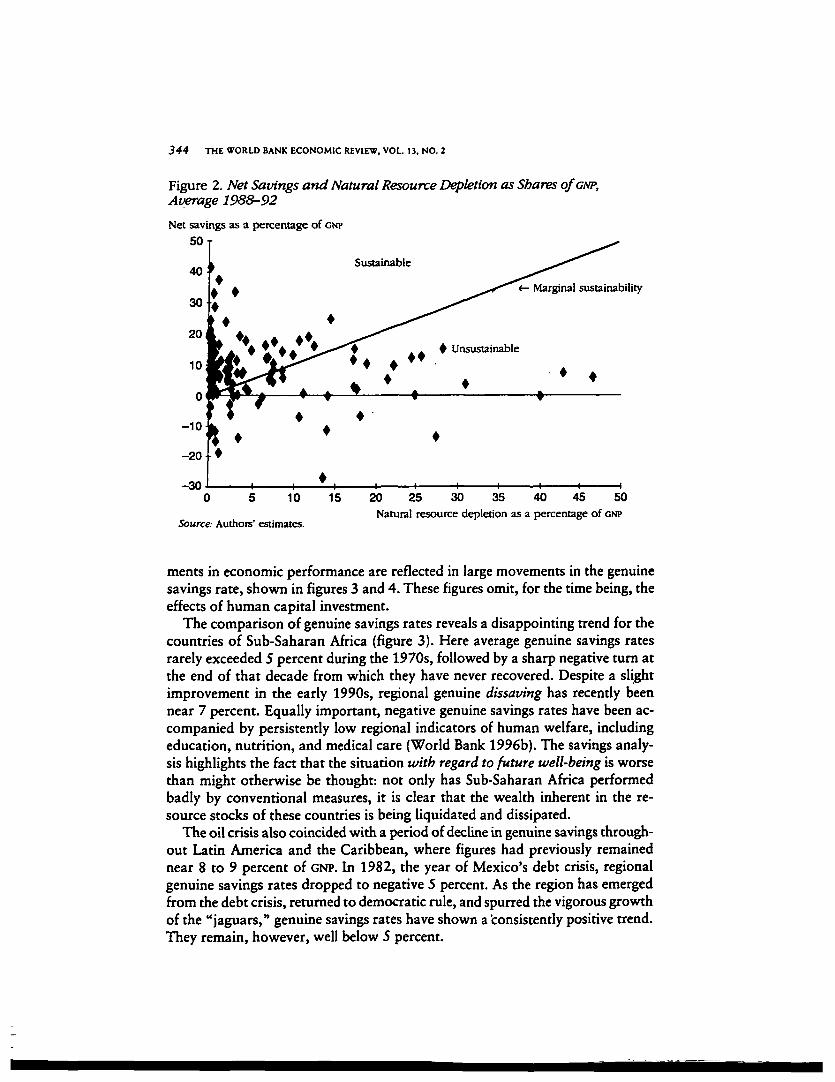
In figure 2 the net savings rate for the industrial and developing countries inour sample is scatter-plotted against the value of depletion and CO2 emissions,using average figures for 1988-92. The line labeled "marginal sustainability" isthe 45° line—countries falling above this line have genuine savings rates that arepositive, while those falling below have negative genuine savings rates. Althoughseveral countries have negative net savings rates, and so are unsustainable evenby conventional national accounting measures, clearly a number have positivenet savings but negative genuine savings. Measuring genuine savings, thereforeprovides useful new information.
A calculation of genuine savings as a percentage of GNP reveals striking differ-ences across the regions of the world. In many developing areas decisive mo-
4. Resource extraction data in physical quantity are taken from the World Bank's Economic and SocialDatabase.
344 THE WORLD BANK ECONOMIC REVIEW, VOL. 13, NO. 2
Figure 2. Net Savings and Natural Resource Depletion as Shares O/GNP,Average 1988-92
Net savings as a percentage of CNP
50
Marginal sustainability
-300 5 10
Source: Authors' estimates.
15 20 25 30 35 40 45 50Natural resource depletion as a percentage of GNP
ments in economic performance are reflected in large movements in the genuinesavings rate, shown in figures 3 and 4. These figures omit, for the time being, theeffects of human capital investment.
The comparison of genuine savings rates reveals a disappointing trend for thecountries of Sub-Saharan Africa (figure 3). Here average genuine savings ratesrarely exceeded 5 percent during the 1970s, followed by a sharp negative turn atthe end of that decade from which they have never recovered. Despite a slightimprovement in the early 1990s, regional genuine dissaving has recently beennear 7 percent. Equally important, negative genuine savings rates have been ac-companied by persistently low regional indicators of human welfare, includingeducation, nutrition, and medical care (World Bank 1996b). The savings analy-sis highlights the fact that the situation with regard to future well-being is worsethan might otherwise be thought: not only has Sub-Saharan Africa performedbadly by conventional measures, it is clear that the wealth inherent in the re-source stocks of these countries is being liquidated and dissipated.
The oil crisis also coincided with a period of decline in genuine savings through-out Latin America and the Caribbean, where figures had previously remainednear 8 to 9 percent of GNP. In 1982, the year of Mexico's debt crisis, regionalgenuine savings rates dropped to negative 5 percent. As the region has emergedfrom the debt crisis, returned to democratic rule, and spurred the vigorous growthof the "jaguars," genuine savings rates have shown a consistently positive trend.They remain, however, well below 5 percent.

Hamilton and Clemens 345
Figure 3. Genuine Savings as a Percentage of GNPfor Selected Regions, 1970-93
Percentage of GNP
20 T
«— Latin America and the Caribbean
»— (N iO •«• »A ~ n rn— <N MI ><r ITN s o
Source: Authors' estimates.
Figure 4. Genuine Satnngs as a Percentage of GNP for Selected Regions, 1970-93
Percentage of GNP
15I ^ \
• High-income OKCD
Source: Authors' estimates.
In stark contrast to the situation in Latin America and the Caribbean, the EastAsia and the Pacific region has genuine savings rates sometimes topping 15 per-cent. However, the effects of important local pollutants, such as particulate mat-ter in air, are not included in this calculation. Moreover, the 1997 financial crisisin this region shows that a robust savings effort is a necessary but not a sufficientcondition for strong and smooth economic growth.

346 THE WORLD BANK ECONOMIC REVIEW, VOL. 13, NO. 2
Consistently negative genuine savings in the Middle East and North Africaregion stands out in figure 4. Regional total consumption as a share of GNP rosefrom around 50 percent in the 1970s to more than 70 percent by the end of the1980s, and imports of food and manufactured goods flowed into the region asmany current account surpluses of the 1970s turned into deficits in the 1980s(World Bank 1996a). However, the caveats about upward biases in the depletionestimates need to be considered when judging these figures: as the most resource-dependent economies, these countries exhibit the highest downward bias in esti-mated genuine savings rates.
South Asia exhibits moderately positive rates of genuine savings over the pe-riod. This is consistent with the moderate rates of economic growth that havecharacterized the countries in the region.
Finally, genuine savings rates in the high-income industrial countries (mem-bers of the Organisation for Economic Co-operation and Development—OECD),pushed upward by high investment, lack of dependence on natural resource deple-tion, and strong exports of high value-added goods and services, are near 10percent for much of the period depicted. The recessions in 1982-83 and 1990coincided with downward turns in genuine savings rates, but the volatility andhigh rates of genuine dissaving seen in other areas are consistently absent.
This picture of genuine savings rates is not complete, however. Just as stan-dard measures of savings ignore asset consumption in natural resource capitalsuch as forests, so can it be argued that they ignore investment in one of a nation'smost valuable assets: its people.
IV. INVESTING IN HUMAN CAPITAL
The process of calculating genuine savings is, in essence, one of broadeningthe traditional definition of what constitutes an asset. Perhaps the most impor-tant of the additions to the asset base is the knowledge, experience, and skillsembodied in a nation's populace, its human capital.
The world's nations augment the stock of human capital in large part throughtheir educational systems, into which they collectively pour trillions of dollarseach year. Standard national accounts label as an investment less than 10 percentof this amount, the portion that is spent on fixed capital, such as school build-ings. Current (as opposed to capital) expenditures on education include teachers'salaries and the purchase of books, and are treated strictly as consumption. Asthe formal accounting model suggests, however, this is clearly incorrect. If acountry's human capital is to be regarded as a valuable asset, expenditures on itsformation must be seen as an investment.
The effects of including human capital investment in the genuine savings cal-culation can be significant. In Chile, for example, current educational expendi-tures represented approximately 3.1 percent of GNP in the early 1990s (figure 5).This level of investment helped to make genuine savings rates positive after the

Hamilton and Clemens 347
Figure 5. Human Capital and Genuine Savings in Chile, 1970-93
Current spending on education
Percentage of GNP40
Extended domestic investment -»
Borrowing and depreciationDepletion
Source: Authors''estimates.
late 1980s. In 1993 and 1994 nearly one-half of the rents from natural resourcedepletion were, notionally at least, being reinvested in human capital.
Adjusting rates of genuine savings to embrace changes in human capital assetsshifts regional genuine savings rates markedly upward (table 2). In Sub-SaharanAfrica accounting for education investment brings recent genuine savings ratesclose to zero. In the Middle East and North Africa genuine savings rates areconsistently negative even after adjusting for education. Finally, high rates ofeducation investment in high-income OECD countries and in East Asia and the
Table 2. Genuine Savings by Region and Income, 1970-93(percentage of GNP)
Classification
RegionEast Asia and the PacificHigh-income industrial countriesLatin America and the CaribbeanMiddle East and North AfricaSouth AsiaSub-Saharan Africa
Income categoryLowMiddleHigh
Average1970-79
15.115.710.4-8.9
7.27.3
9.87.2
15.2
1980-89
12.612.4
1.9-7.76.5
-3.2
3.32.9
12.3
1990
18.615.75.5
-8.87.6
-3.8
5.710.015.9
1991
18.714.54.1
-10.86.3
-1.2
7.59.7
14.6
1992
18.714.04.7
-6.67.1
-0.6
9.07.8
14.1
1993
21.313.96.1
-1.86.4
-1.1
10.58.1
14.1
Note: Values include an adjustment for spending on education.Source: Authors' estimates.

3 4 8 THE WORLD BANK ECONOMIC REVIEW, VOL. 13, NO. 2
Pacific sharpen the contrast between the genuine savings effort in these areas andacross the rest of the globe.
Table 3 presents country-level data for genuine savings rates for the 1970s,1980s, and early 1990s that include current educational expenditures for all coun-tries for which data are available. The pattern of savings shown appears to reflect"the curse of the mineral-rich"—the greater the mineral endowment, the morelikely a country is to have a low or negative savings rate (Gelb 1988 and Sachsand Warner 1995).
V. POLICY ISSUES
Many people would argue that obtaining measures of a green NNP is intrinsi-cally important. However, by measuring income rather than changes in wealth,green NNP will have few direct uses with regard to policies for sustainable devel-opment. In contrast, genuine savings measures suggest a series of policy ques-tions that are key to sustaining development.
It is abundantly clear that monetary and fiscal policies are the biggest leversfor boosting savings rates—for example, in figure 5 shifts in gross savings inChile (gross domestic investment less net foreign borrowing) would move all ofthe curves up or down. The first policy issue is therefore the extent to whichmonetary and fiscal policies encourage strong domestic savings.
While natural resource exports boost foreign savings and therefore the overallsavings effort, the analysis of genuine savings suggests a further question: to what
Table 3. Genuine Savings by Region, 1970-93(percentage of GNP)
Economy
Latin America and theAntigua and BarbudaArgentinaBarbadosBelizeBoliviaBrazilChileColombiaCosta RicaDominican RepublicEcuadorEl SalvadorGrenadaGuatemalaHaitiJamaicaMexico
Average1970s
Caribbean
17.67.8—
-3.812.6-1.86.7
13.013.20.7
11.4
9.20.3
-0.69.1
1930s
—3.8
12.215.9
-35.69.4
-3.44.2
12.29.7
-12.61.8
22.0-0.1-2.0-9.4-3.0
1990
13.78.2
11.525.2
-19.511.78.52.9
12.89.0
-21.3-0.116.7-2.6-1.1^».50.9
1991
10.62.99.7
17.3-12.4
9.37.37.9
15.23.8
-7.2-1.115.60.6
-7.1-1.8
2.0
1992
6.82.8
12.716.1
-12.611.09.44.6
14.72.5
-3.13.7
16.9-0.1
-16.35.41.9
1993
12.95.1
11.916.7
-15.411.813.25.2
10.3-4.1
5.99.91.2
-19.1-2.4
3.6

Hamilton and Clemens 349
Table 3. (continued)
Economy
ParaguayPeruSurinameTrinidad and TobagoUruguayVenezuela
East Asia and the PacificChinaHong Kong, ChinaIndonesiaKorea, Rep. ofMalaysiaMyanmarPapua New GuineaPhilippinesSingaporeTaiwan (China)Thailand
Middle East and North AfricaAlgeriaBahrainEgyptIran, Islamic Rep. ofIsraelJordanMoroccoSaudi ArabiaSyrian Arab RepublicTunisia
South AsiaBangladeshIndiaNepalPakistanSri Lanka
Sub-Saharan AfricaBeninBurkina FasoBurundiCameroonCentral African RepublicChadCongo, Rep. ofCote d'lvoireGabon
Average1970s
14.95.8
15.6-5.813.2
1.9
14.125.5
3.117.017.73.6—
14.117.823.916.4
-1.8—
10.5—
15.9—
12.3-27.6
10.311.6
-2.38.4
-0.63.5
12.3
8.114.8—
15.88.4—
-5.316.519.7
1980s
13.2-0.8
7.3-20.6
4.1-17.6
6.622.0
2.225.5
9.6-0.4-9.4
6.330.322.317.7
-9.00.80.5
-2.714.4—
11.8-25.5-2.3
3.8
-0.97.1
-1.55.48.9
-3.99.1—7.7
-0.2—
-16.8-0.3-7.3
1990
10.44.13.8
-19.94.7
-29.2
10.523.8
8.233.5
9.91.4
-2.95.7
37.118.627.0
-11.7-4.3
2.6-11.3
18.4-2.919.8
-27.3-9.010.1
-0.18.8
-9.53.87.8
1.97.0
-4.4-7.0-4.0-5.6
-28.0-9.8-2.7
1991
6.64.8
-15.0-15.4
4.0-17.6
15.521.7
5.328.2
9.94.7
-1.15.8
39.019.225.7
-2.2-26.7
9.4-5.818.5-0.215.6
-41.8-10.0
10.2
-2.78.1
-8.81.65.5
2.06.7
-1.5-2.5-0.3-7.7
-22.0-13.6
4.5
1992
1.010.0-2.4
-11.44.3
-16.1
16.4—6.9
27.415.23.6
-0.87.8
39.517.825.6
2.1-11.2
15.2-3.318.912.915.5
-33.0—
12.2
-0.18.2
-9.95.09.6
0.17.4
-1.2-3.6
0.2-9.1
-18.7-10.7-3.0
1993
1.06.6
15.4-7.9
3.9-14.5
21.5—13.829.618.62.46.48.0
37.917.228.1
6.7-2.713.6—
16.713.515.2
-20.2—
12.8
2.47.2
-12.34.7
12.4
0.88.60.0
-0.6-7.7-8.4
-28.6-12.3
2.0
(Table continues on the following page.)

3 SO THE WORLD BANK ECONOMIC REVIEW, VOL 13, NO. 2
Table 3. (continued)
EconomyGambia, TheGhanaGuineaGuinea-BissauKenyaMadagascarMalawiMaliMauritaniaMauritiusNamibiaNigerNigeriaRwandaSenegalSierra LeoneSouth AfricaTogoUgandaZambiaZimbabwe
Average1970s
0.34.1_—5.86.0
10.37.3
-18.413.3—8.53.34.16.5
-2.510.413.9—
-5.79.1
High-income industrial countriesAustraliaAustriaBelgiumCanadaDenmarkFinlandFranceGermany
11.818.317.916.116.015.419.3—
Germany, former Federal Rep. 19.9GreeceIrelandItalyJapanLuxembourgNetherlandsNew ZealandNorwayPortugalSpainSwedenSwitzerlandTurkeyUnited KingdomUnited States
15.89.5
17.326.510.121.016.314.515.216218.317.116.311.011.0
1980s3.5
-6.0_—5.1
-1.3-2.9
3.5-15.8
11.3-5.4
1.9-25.3
5.6-4.1
0.55.4
13.0-23.2-27.3
7.4
7.513.4
9.39.88.4
13.912.8—
13.54.69.3
13.321.7
9.713.89.28.7
12.611.012.119.112.38.49.0
1990
15.41.4
-11.68.82.81.13.5
11.1-10.2
19.5-2.0-5.8
-46.42.28.0
-10.45.5
12.4-13.7-32.0
15.6
6.118.818.310.317.418.518.6—
14.37.6
15.916.931.215.820.8
9.111.123.418.816.125.718.911.48.2
1991
12.81.8
-13.50.17.0
-8.7-2.212.5
-12.018.716.1-1.7
-33.9-3.2
2.3-2.7
6.25.6
-0.6-14.5
6.1
6.920.215.66.7
14.99.4
16.011.115.09.1
18.512.928.714.617.87.4
15.619.714.310.824.013.17.08.8
1992
20.2-3.2-9.4-9.4
3.9-3.9-9.8
9.5-11.4
19.816.2-7.5
-30.2-4.0
1.6_4.72.3
-0.2-5.3-0.8
7.219.215.96.2
15.57.0
15.410.813.8
8.016.911.828.312.816.99.7
14.220.412.57.5
22.011.96.78.3
19937.7
-4.60.16.41.4
-0.2-7.9
9.7-14.9
18.311.4-6.5
-37.1-1.43.2__5.2
-12.5-8.6
-16.18.7
5.516.216.77.4
14.25.5
13.510.012.2
8.017.412.326.213.915.613.6
7.018.112.35.6
19.915.46.69.6
— Not available.Sole: Values include current education expenditures.Source: Authors' estimates.

Hamilton and Clemens 351
extent do exports of exhaustible resources boost the rate of genuine savings?5
The answer to this lies in netting out the value of resource depletion from thevalue of gross exports.
More optimal natural resource extraction paths will, other things being equal,boost the value of genuine savings. The policy question for natural resource man-agement is therefore the extent to which stronger resource policies (royalty re-gimes, tenure) can boost the rate of genuine savings. Similarly, reducing pollu-tion emissions to socially optimal levels will boost the value of genuine savings.The policy issue with respect to pollution is the extent to which more optimalpollution control policies can increase the rate of genuine savings.
The policy prescriptions for boosting genuine savings should never be to stopextracting resources or emitting pollutants altogether. Rather, pricing resourcesand pollutants correctly and enforcing property rights will lead to efficient levelsof exploitation of the environment, reducing incentives to "high-grade" resources(meaning, to take the cheapest and most accessible resources first, without con-sidering dynamic efficiency) or pollute indiscriminately. Optimal resource andenvironmental policies will maximize genuine savings, subject to the macroeco-nomic policy regime in place. However, the sorts of issues raised by Gelb (1988)about the nature and effects of oil windfalls in developing countries are particu-larly relevant to the policy issues just addressed: without sound macroeconomicpolicies and prudent allocation of public resources, the effects of reliance onlarge resource endowments can be negative for many countries.
VI. CONCLUSIONS
Savings rules have been criticized because they are concerned only with weaksustainability (see, for example, Martinez-Alier 1995).6 One response to this criti-cism is to suggest that countries that fail the savings rule—exhibit persistentlynegative genuine savings—probably also fail to meet the criteria for strongsustainability, in the sense that critical natural assets are being depleted. It wouldbe surprising if this were not the case. And as Pearce, Hamilton, and Atkinson(1996) argue, even if some amount of a critical resource must be preserved tomeet the criteria of strong sustainability, savings rules are still required for theremaining resources if sustainability is to be achieved.
Thinking about sustainable development and its measurement leads naturallyto a conception of the process of development as one of portfolio management.Prudent governments will not only consider natural resources as assets and pol-lution stocks as liabilities in the national balance sheet, they will also be con-cerned with the appropriate mix of produced assets and human capital.
5. The question is also germane for unsustainable forest harvest programs.6. Pearce, Markandya, and Barbier (1989) define weak sustainability to mean that natural and produced
assets are fully substitutable. Strong sustainability implies that at least some natural assets have no substitutesand so may need to be conserved if development is to be sustainable.
352 THE WORLD BANK ECONOMIC REVIEW, VOL. U, NO. 2
Questions of the "appropriate mix" of assets are inherently questions aboutreturns on the marginal investment. This marginal investment may be in betterresource management, boosting the value of natural resources in the nationalbalance sheet; it may be in pollution control, decreasing the size of the pollutionliability to its efficient level; it may be in infrastructure, as has traditionally beenthe case; and it may be in primary education, as an essential building block inincreasing human capital.
The policy implications of measuring genuine savings are quite direct: persis-tently negative rates of genuine savings must lead, eventually, to declining well-being. For policymakers, linking sustainable development to rates of genuinesavings means that there are many possible interventions to increase sustainability,from the macroeconomic to the purely environmental.
There are several omissions in the foregoing empirical analysis: soils, fish, waterresources, water pollutants, and air pollutants (other than CO2), to name a few.Notwithstanding these omissions, the empirical evidence is that genuine savingsis negative in a wide range of countries when the environment and natural re-sources are included in the savings measure. Negative genuine savings is morethan a theoretical possibility, therefore, and the evidence is that many countries,particularly in Sub-Saharan Africa, are being progressively impoverished. Increas-ing the coverage of natural resources and pollutants in our calculations wouldlower the estimated levels of genuine savings overall.
In terms of further research there are obvious refinements that can be envi-sioned, including treating soil degradation and expanding the country coverageof data on the marginal social costs of pollution emissions. The latter is particu-larly important for rapidly growing countries: as countries grow, they tend tourbanize, and these urban areas tend to develop problem levels of pollution.
A particularly appealing topic for further research would be an exploration ofthe "resource curse" hypothesis. Sachs and Warner (1995) find that resourcedependence (under a variety of definitions) is negatively correlated with economicgrowth, based on an analysis of industrial and developing countries since the1970s. The data developed for the genuine savings analysis should allow moreprecise definitions of resource dependence, permitting the hypothesis to be re-tested. In addition, the estimated genuine savings rates may turn out to haveexplanatory power in the resource curse model.
REFERENCES
The word "processed" describes informally reproduced works that may not be com-monly available through library systems.
Adelman, M. A. 1991. "U.S. Oil/Gas Production Cost: Recent Changes." Energy Eco-nomics 13(October):235-37.
Asheim, Geir. 1994. "Net National Product as an Indicator of Sustainability." Scandina-vian Journal of Economics 96(2):257-65.
Hamilton and Clemens 353
Barnes, Douglas F. 1992. "Understanding Fuelwood Prices in Developing Nations." WorldBank, Energy, Mining, and Telecommunications Department, Washington, D.C. Processed.
Bhattacharya, Subhes C. 1995. "Estimation of Subsidies on Coal in India." Natural Re-sources Forum 19(2):135-42.
CDIAC (Carbon Dioxide Information and Analysis Center). 1994. Trends '93: A Compen-dium of Data on Global Change. With accompanying magnetic media. Oak Ridge,Tenn.: Oak Ridge National Laboratory.
Cornot-Gandolphe, Sylvie. 1994. Adequate and Secure Gas Supply for Europe: How toMeet the Growing Demand for Natural Gas? Paris: International Energy Agency, In-ternational Center for Gas Technology Information.
Dasgupta, Partha, and Geoffrey Heal. 1979. Economic Theory and Exhaustible Resources.Cambridge, U.K.: Cambridge University Press.
Doyle, Guy. 1987. China's Potential in International Coal Trade. London: InternationalEnergy Agency Coal Research.
Duvigneaud, Paul, ed. 1971. Productivity of Forest Ecosystems. Paris: United NationsEducational, Scientific, and Cultural Organization.
Fankhauser, Samuel. 1994. "Evaluating the Social Costs of Greenhouse Gas Emissions."The Energy Journal 15(2): 157-84.
FAO (Food and Agriculture Organization of the United Nations). 1983. Forest ProductsPrices, 1963-1982. Forestry Paper 46. Rome.
. 1994. Forest Products Yearbook 1993. Rome.
. 1995. Forest Products Prices, 1973-1992. Forestry Paper 125. Rome.FAO/UNECE (Food and Agriculture Organization of the United Nations/United Nations
Economic Commission for Europe). 1992. The Forest Resources of the TemperateZones. Vol. 1: General Forest Information. New York: United Nations.
Freeman, A. M. 1994. The Measurement of Environmental and Resource Values: Theoryand Methods. Washington, D.C: Resources for the Future.
Gelb, A. H. 1988. Oil Windfalls: Blessing or Curse? New York: Oxford University Press.Hamilton, Kirk. 1994. "Green Adjustments to GDP." Resources Policy 20(3):155-68.
. 1996. "Pollution and Pollution Abatement in the National Accounts." Review ofIncome and Wealth 42(1, March):13-33.
. 1997. "Defining Income and Assessing Sustainability." World Bank, Environ-ment Department, Washington, D.C. Processed.
Hamilton, Kirk, Giles Atkinson, and David W. Pearce. 1998. "Savings Rules andSustainability: Selected Extensions." Paper presented to the World Congress on Envi-ronment and Resource Economics, Venice, June 25-27. Processed.
Hartwick, John M. 1977. "Intergenerational Equity and the Investing of Rents from Ex-haustible Resources." American Economic Review 67(5):972-74.
. 1990. "Natural Resources, National Accounting and Economic Depreciation."Journal of Public Economics 43(3):291-304.
. 1992. "Deforestation and National Accounting." Environmental and ResourceEconomics 2(5):513-21.
Hill, Peter, and Anne Harrison. 1994. "Accounting for Subsoil Assets in the 1993 SNA."Paper presented to the London Group on National Accounts and the Environment,London, March 15-18. Processed.

354 THE WORLD BANK ECONOMIC REVIEW, VOL. 13, NO. 2
IDB (Inter-American Development Bank). 1981. Investment and Financing Requirementsfor Energy and Minerals in Latin America. Washington, D.C.
IEA (International Energy Agency). 1994a. Energy Policies of the Czech Republic. Paris:Organisation for Economic Co-operation and Development.
. 1994b. Russian Energy Prices, Taxes, and Costs. Paris: Organisation for Eco-nomic Co-operation and Development.
-. 1995a. Coal Information 1994. Paris: Organisation for Economic Co-operationand Development.
. 1995b. Energy Policies of Poland. Paris: Organisation for Economic Co-operation and Development.
. 1995c. Energy Policies of the Russian Federation, 1995 Survey. Paris: Organisationfor Economic Co-operation and Development.
1995d. Middle East Oil and Gas. Paris: Organisation for Economic Co-operation and Development.
. 1995e. Oil, Gas, and Coal: Supply Outlook. Paris: Organisation for EconomicCo-operation and Development.
1996. Energy Policies of Ukraine, 1996 Survey. Paris: Organisation for Eco-nomic Co-operation and Development.
Jenkins, Gilbert. 1989. Oil Economist's Handbook. 2 vols., 5th ed. New York:Elsevier.
Julius, DeAnn, and Afsaneh Mashayekhi. 1990. The Economics of Natural Gas: Pricing,Planning, and Policy. London: Oxford University Press, Oxford Institute for EnergyStudies.
Kanowski, P. J., and others. 1992. "Plantation Forestry." In Narendra P. Sharma, ed.,Managing the World's Forests: Looking for a Balance Between Conservation and De-velopment. Dubuque, Iowa: Kendall/Hunt Publishing Co.
Kellenberg, John. 1995. "Accounting for Natural Resources: Ecuador, 1971-1990." Ph.D.diss. Department of Geography and Environmental Engineering, Johns Hopkins Uni-versity, Baltimore, Md.
Khan, Amar R. 1986. "The Prospects for Gas in Developing Countries." In Robert Mabro,ed., Natural Gas: an International Perspective. London: Oxford University Press, Ox-ford Institute of Energy Studies.
Lamprecht, Hans. 1989. Silviculture in the Tropics. Eschborn, Germany: DeutscheGesellschaft fur Technische Zusammanarbeit.
Liefert, William Mark. 1988. "The Full Cost of Soviet Oil and Natural Gas Production."Comparative Economic Studies 30(summer):l-20.
Maler, K.-G. 1991. "National Accounts and Environmental Resources." Environmentaland Resource Economics 1(1):1—15.
Martinez-Alier, Juan. 1995. "The Environment as a Luxury Good or 'Too Poor to beGreen'?" Ecological Economics 13(l):l-10.
Mashayekhi, Afsaneh. 1983. "Marginal Cost of Natural Gas in Developing Countries:Concepts and Applications." World Bank, Energy Department, Washington, D.C. Pro-cessed.
Meyer, Sandra. 1994. Natural Gas Statistics Sourcebook. Tulsa, Oklahoma: PennWellPublishing Co., Oil and Gas Journal Energy Database Publications.

Hamilton and Clemens 355
Nehru, Vikram, and Ashok Dhareshwar. 1993. "A New Database on Physical Capital Stock:Sources, Methodology, and Results." Revista de Analysis Economico 8(l):37-59.
. 1994. "New Estimates of Total Factor Productivity Growth for Developing andIndustrial Countries." Policy Research Working Paper 1313. World Bank, Policy Re-search Department, Washington, D.C. Processed.
Openshaw, Keith, and Charles Feinstein. 1989. "Fuelwood Stumpage: Financing Renew-able Energy for the World's Other Half." Policy Research Working Paper 270. WorldBank, Policy Research Department, Washington, D.C. Processed.
Pearce, David W., and Giles Atkinson. 1993. "Capital Theory and the Measurement ofSustainable Development: An Indicator of Weak Sustainabiliry." Ecological Econom-ics 8(2):103-08.
Pearce, David W., Kirk Hamilton, and Giles Atkinson. 1996. "Measuring SustainableDevelopment: Progress on Indicators." Environment and Development Economics
Pearce, David, Anil Markandya, and Edward Barbier. 1989. Blueprint for a GreenEconomy. London: Earthscan.
Pezzey, John. 1989. "Economic Analysis of Sustainable Growth and Sustainable Devel-opment." Working Paper 15. World Bank, Environment Department, Washington,D.C. Processed.
Repetto, Robert, William Magrath, Michael Wells, Christine Beer, and F. Rossini. 1989.Wasting Assets: Natural Resources in the National Accounts. Washington, D.C: WorldResources Institute.
Sachs, Jeffrey, and Andrew Warner. 1995. "Natural Resource Abundance and EconomicGrowth." Development Discussion Paper 517a. Harvard Institute for InternationalDevelopment, Harvard University, Cambridge, Mass. Processed.
Sadoff, C. W. 1992. The Effects of Thailand's Logging Ban: Overview and PreliminaryResults. Bangkok: Thailand Development Research Institute.
Sagers, Matthew, Valeriy Kryukov, and Vladimir Shmat. 1995. "Resource Rent from theOil and Gas Sector and the Russian Economy." Post-Soviet Geography 36(7):389-425.
Smith, Roger. 1992. "Income Growth, Government Spending, and Wasting Assets:Alberta's Oil and Gas." Canadian Public Policy 18(4):387-412.
Tretyakova, Albina, and Meredith Heinemeier. 1986. Cost Estimates for the Soviet CoalIndustry: 1970 to 1990. Washington, D.C: U.S. Department of Commerce, Bureau ofthe Census, Center for International Research.
United Nations. 1993. Integrated Environmental and Economic Accounting. Series F 61.New York.
U.S. Bureau of Mines. 1987. "An Appraisal of Minerals Availability for 34 Commodi-ties." Bulletin 692. Department of the Interior, Washington, D.C. Processed.
van Buren, Ariane. 1990. The Woodfuel Market in Nicaragua: The Economics, Sociol-ogy, and Management of a Natural Energy Resource. Amsterdam: Centrum voor Studieen Documentatie van Latijns Amerika.
Vincent, Jeffrey, Theodore Panayotou, and John Hartwick. 1997. "Resource Depletionand Sustainabiliry in Small Open Economies." Journal of Environmental Economicsand Management 33(3):274-86.
Vitousek, Peter, Paul Ehrlich, Ann Ehrlich, and Pamela Matson. 1986. "Human Appro-priation of the Products of Photosynthesis." BioScience 36(6, June):368-73.

356 THE WORLD BANK ECONOMIC REVIEW, VOL. 13, NO. 2
Weitzman, M. L. 1976. "On the Welfare Significance of National Product in a DynamicEconomy." Quarterly journal of Economics 90(l):156-62.
Weitzman, M. L, and K.-G. Lofgren. 1997. "On the Welfare Significance of Green Ac-counting as Taught by Parable." Journal of Environmental Economics and Manage-ment 32(2):139-53.
World Bank. 1993. Commodity Trade and Price Trends, 1989-91. Baltimore, Md.: JohnsHopkins University Press.
. 1995. World Tables 199S. Washington, D.C.
. 1996a. International Economics Department data. Washington, D.C.
. 1996b. World Development Report 1996: From Plan to Market. New York:Oxford University Press.
. 1997. Expanding the Measure of Wealth, ESD Studies and Monographs Series 17.Washington, D.C.
. Various years. World Development Indicators. New York: Oxford UniversityPress.