IRENA-IEA-ETSAP Technology Brief 1: Concentrating Solar Power ...

For ETSAP meeting
Using Genuine Savings for climatepolicy evaluation with an integrated
assessement model
Koji Tokimatsu, Tokyo Institute of Technology &National Institute of Advanced Instrial Science and Technology
Louis Dupuy, APESA & University of St AndrewsNick Hanley, University of St Andrews

Presentation structure
1. What is “Genuine Savings”2. Model Criticism on climate‐economy IAM Our innovation Comparisons with other approaches
3. Example of Results4. Summary
2

Details are in DP from St. Andrews3
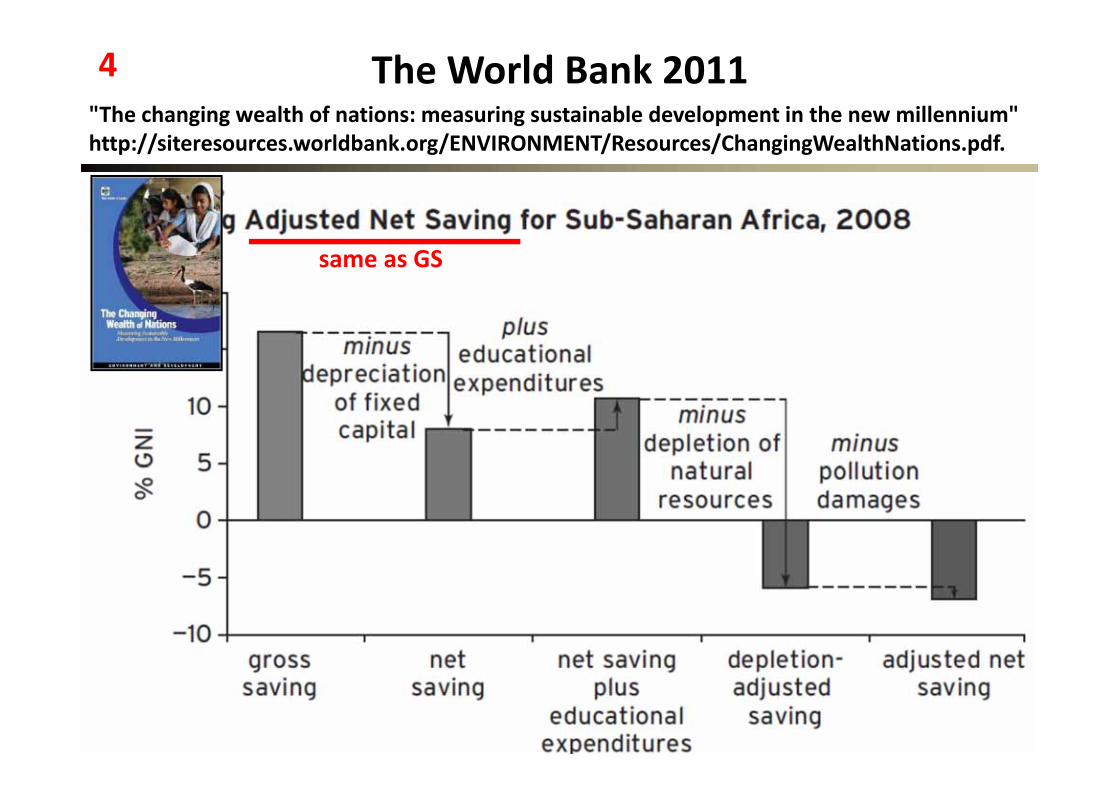
same as GS
The World Bank 2011"The changing wealth of nations: measuring sustainable development in the new millennium"http://siteresources.worldbank.org/ENVIRONMENT/Resources/ChangingWealthNations.pdf.
4

Difinition of GS/IW• The theory of Genuine Savings (or Adjusted Net Savings) :
– Sustainability as non declining well‐being over time
– Asset and consumption mapping through an economic program
– SD indicator since rate of change in wealth = rate of change in instantaneous well‐being
– Definition of Comprehensive/Inclusive Wealth
– GS as the rate of change in total wealth at shadow prices
5LD, KT, NH – Using GS for Climate Policy Evaluation
, , , , , ,
5

The Stiglitz Commission Report makes 12 recommendations on moving from production to well‐being. These range from including measures of income, consumption, and wealth – both market and non‐market, as well as their overall distribution – to objective and subjective measures of well‐being, such as health, education, personal activities, and environmental conditions.
Beyond GDP: Proposals for alternative measurement tools
Source: http://www3.weforum.org/docs/WEF_Forum_IncGrwth_2017.pdf
The European Commission, which has worked on the issue for a decade, has outlined a roadmap for new indicators that includes up‐to‐date measures on environmental protection and quality of life; distribution between income, health, education, and environmental quality; overall sustainability; and social issues.
6

Stiglitz Report 20097

1. State of the art IAM approach(1) highly aggregated, algebraic damage function• the modeller's choice of a particular algebraic formula• the common assumption of zero damage at the origin• the modeller's estimate of damages at a benchmark change
22111 TTTD
Pindyck 2013 criticized that • completely made up, with no theoretical or empirical foundation.• choice of values for these parameters is essentially guess work.• Nordhaus “global mean losses could be 1‐5 percent of GDP for 4℃ of
warming”…From its own survey of several IAMs. it’s a bit circular.
IPCC AR5 (WG3, 3.9.2 Aggregate climate damages)• A concern may be whether the curvature … is adequate. • The aggregated damage is … heroic extrapolations to … global scale
from a sparse set of studies … done at particular geographic locations.
8

22111 TTTD
Our strategy – interlinking our LCIA model
ep sbs
yrrgsbsyrrgsbsepyrrgepyrrg InvDRMWTPEXT ,,,,,,,,
LKFTDY ,
EXTTCLRMNEELHKFY ,,,,,
ep
yrrgyrrg
yrrgyrrgyrrgepyrrgep NY
NYMWTPMWTP
0000
00,,
,,,,,,
epi
yrrgiepiyrrgep dummyxaMWTP ,,,,,
Y: GDPN: population numberσ: income elasticity
ep: end points (human health, resources, biodiversity, photosynthetic NPP)sbs:global warming, ozone layer depletion, acid rain, local air pollution, mining and disposal of mineral resources, land use and its change
marginal willingness to pay
Dose‐Response relations
Inventory release
Environmental external cost
• face to face, internet
• G20+10 Asian• over 7,800ss, 100
(min) to 600 (max)
9

Japanese version of lifecycle impact assessment modeling (LIME)
ep sbs
yrrgsbsyrrgsbsepyrrgepyrrg InvDRMWTPEXT ,,,,,,,,
10

rg rgrgVNegWMax
102010,102010,14
0 11
rgrgrg uNV
1log
11
,
1,
,
yrrg
yrrg
yrrg
c
c
uyrrgyrrg
yrrgyrrgyrrg
XPIM
ICY
,,
,,,
Impact assessment model (LIME3)
Population, GDP (driver of demands)
Resource demands for energy, minerals, biomass (woods
and foods)
Energy systems supply model
GHG emissions→ temperature rise,
Sea Level RiseGHGs, SOx, NOx emissions→acid rain, air pollution
Resource extraction
Waste disposal
Land useLand‐use change
external environmental cost
Human health
Resource production
Biodiversity
Photosynthetic NPP
Mineral resource supply model
Bio‐resource supply Land‐use model
Demands to inventories Inventories to external cost
Simplified climate model
Supply costs of the resources
internal cost (FC,NFC,LC) external cost (EXT)Driver to demands
Macro‐economy model
H
Y
damage assessment
weighting

From inventories release to damages in our model12input data from other models to the impact assessment model
Model nameContents of the impact assessment model
Impact category endpoints
global mean temperature rise (endogenous)
Simplified climate model
Globalwarming
Humanhealth
Heart disease, diarrhea, malnutrition, flood, malaria
resources
Crop yield (rice, corn, wheat)Sea level rise (flooded surface)Energy consumption (cooling, warming for air conditioning)
biodiversityOzone Depletion Substances (14 kinds)(exogenous)
Simplified climate model
Ozonelayerdepletion
Human health, resources, netphotosynthetic primary productivity(NPP)
SOX, NOx(endogenous) Energy model
Acid rain resourcesLocal airpollution Human health, resources, NPP
Land use(endogenous)
Bio resource and land use model Land use NPP
Land-use change(endogenous)
Bio resource and land use model
Land usechange NPP, biodiversity
Copper, lead, zinc, bauxite, iron ore, limestone, coal(endogenous)
Mineral resource model
Resourceextraction NPP, biodiversity
Mineral resource waste,scrap of concrete(endogenous)
Mineral resource model waste NPP, biodiversity
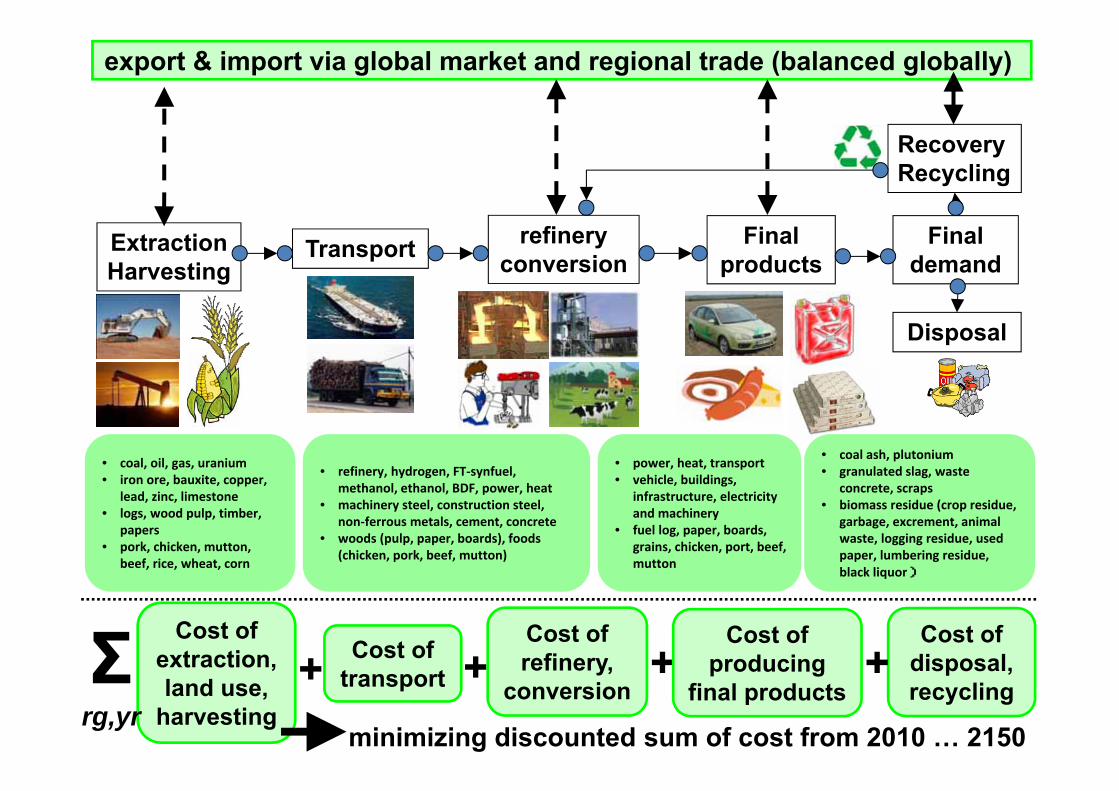
Disposal
RecoveryRecycling
refineryconversion
ExtractionHarvesting
Final demand
Final products
export & import via global market and regional trade (balanced globally)
Transport
Cost of extraction, land use,
harvesting+ Cost of
transport +Cost of refinery,
conversion+
Cost of producing
final products
Cost of disposal, recycling
+Σrg,yr
minimizing discounted sum of cost from 2010 … 2150
• coal, oil, gas, uranium• iron ore, bauxite, copper,
lead, zinc, limestone• logs, wood pulp, timber,
papers• pork, chicken, mutton,
beef, rice, wheat, corn
• refinery, hydrogen, FT‐synfuel, methanol, ethanol, BDF, power, heat
• machinery steel, construction steel, non‐ferrous metals, cement, concrete
• woods (pulp, paper, boards), foods (chicken, pork, beef, mutton)
• power, heat, transport• vehicle, buildings,
infrastructure, electricity and machinery
• fuel log, paper, boards, grains, chicken, port, beef, mutton
• coal ash, plutonium• granulated slag, waste
concrete, scraps• biomass residue (crop residue,
garbage, excrement, animal waste, logging residue, used paper, lumbering residue, black liquor)

econ (util & prod. func)
Energy (or mineral) model (+ climate)
3 resource models
(+climate)
3 resources + climate
+ LCA model (LIME3)
1 or 3 models
5 models = Full ‐ econ
Full models
3 resources + climate
+ LCA model (LIME3)
What models can do for sustainability/SD issues14targets• resource needs• climate change mitigation (energy conversion tech.)• ore degradation (scarce base metal e.g., copper)
SD indicators• Factor-4 (resource productivity or decoupling)• Factor-10 (fairness in per capita material consumption)
targets• cost-benefit; internalizing the externalities (e.g.CC&M)• alternative shadow price of carbon (or SCC)
SD indicators• Genuine Savings, Inclusive Wealth = non declining
wealth (consumption, utility) in capital based approach
targets• external environmental impacts and their costs
SD indicators• Eco-Efficiency = GDP/Externality• Human Appropriated Net Primary Productivity (HANPP)
= carrying capacity

Model typeclimate‐economy IAM (Integrated Assessment Model)
bottom‐up technology
typeCouple several systems
together
Lifecycleimpact assessment (LCIA)
Ours
Representativemodel name
DICE/RICE, PAGE, FUND
MARKAL,MESSAGE Extern E, LIME our original,
unique
Model framework
Welfaremaximization
Cost minimization
Dose‐Response, economic valuation
Welfaremaximization, interlinked bottom‐up technology and LCIA
Damageassessment
aggregated, algebraicdamage function
Most exclude damage functions
sector base impact models, choice experiments
LCIA
Feedback to economy Yes No No Yes
Natural resources None Various Various various

【results】 GS and breakdowns in the balance growth16

Climate Policy scenario analysis
-2
-1
0
1
2
3
2010 2030 2050 2070 2090
GSn
t [%
/yr]
GSnt BAU
GSnt Eeff
GSnt CO2
GSnt ZERO
17
Conclusion• We claim Genuine Savings are an effective indicator of the overall impact of policy options under climate change
• The forward looking nature of GS makes it impossible to produce a match for the theoretical concept…
• …But even our approximate method based on current mechanisms gives consistent results
• Using GS in IAM is a useful complement to using GS for the diagnosis of past and current performance
18LD, KT, NH – Using GS for Climate Policy Evaluation
18