GasSense: Appliance-Level, Single-Point Sensing of Gas ......There have been two prevailing...
18
GasSense: Appliance-Level, Single-Point Sensing of Gas Activity in the Home Gabe Cohn 1 , Sidhant Gupta 2 , Jon Froehlich 2 , Eric Larson 1 , Shwetak N. Patel 1,2 1 Electrical Engineering, 2 Computer Science & Engineering UbiComp Lab, DUB Group, University of Washington Seattle, WA, 98195 {gabecohn, sidhant, jfroehli, eclarson, shwetak } @ uw.edu Abstract. This paper presents GasSense, a low-cost, single-point sensing solution for automatically identifying gas use down to its source (e.g., water heater, furnace, fireplace). This work adds a complementary sensing solution to the growing body of work in infrastructure-mediated sensing. GasSense analyzes the acoustic response of a home's government mandated gas regulator, which provides the unique capability of sensing both the individual appliance at which gas is currently being consumed as well as an estimate of the amount of gas flow. Our approach provides a number of appealing features including the ability to be easily and safely installed without the need of a professional. We deployed our solution in nine different homes and initial results show that GasSense has an average accuracy of 95.2% in identifying individual appliance usage. Keywords: Ubiquitous Computing, Sustainability, Sensing, Gas 1 Introduction and Motivation Natural gas is the most widely consumed energy source in American homes [19]. It is used for furnaces, water heaters, stoves, fireplaces and, in some cases, clothes dryers. In the US, natural gas prices have quadrupled over the past decade due to growing demand and limited pipeline capacity [3]. As a result, government agencies and gas utilities have scrambled to implement conservation programs to reduce demand and better help customers manage energy costs (e.g., [7, 17]). Although recent work in the UbiComp and Pervasive research communities has focused on sensing electricity and water usage in the home [10, 12, 15, 16, 18], little attention has been directed towards sensing natural or propane gas usage. Unlike electricity and water usage, which are often the result of direct human actions such as watching TV, doing laundry, or taking a shower, gas usage is dominated by automated systems like the furnace or hot water heater. This disconnect between activity and consumption leads to a lack of consumer understanding about how gas is used in the home and, in particular, which appliances are most responsible for this usage [14]. Most people simply have no means of judging their household gas consumption other than a monthly bill, which, even then, does not provide itemized details about what accounts for this consumption.
Transcript of GasSense: Appliance-Level, Single-Point Sensing of Gas ......There have been two prevailing...

GasSense: Appliance-Level, Single-Point Sensing of Gas Activity in the Home
Gabe Cohn1, Sidhant Gupta2, Jon Froehlich2, Eric Larson1, Shwetak N. Patel1,2
1Electrical Engineering, 2Computer Science & Engineering UbiComp Lab, DUB Group, University of Washington
Seattle, WA, 98195 {gabecohn, sidhant, jfroehli, eclarson, shwetak } @ uw.edu
Abstract. This paper presents GasSense, a low-cost, single-point sensing solution for automatically identifying gas use down to its source (e.g., water heater, furnace, fireplace). This work adds a complementary sensing solution to the growing body of work in infrastructure-mediated sensing. GasSense analyzes the acoustic response of a home's government mandated gas regulator, which provides the unique capability of sensing both the individual appliance at which gas is currently being consumed as well as an estimate of the amount of gas flow. Our approach provides a number of appealing features including the ability to be easily and safely installed without the need of a professional. We deployed our solution in nine different homes and initial results show that GasSense has an average accuracy of 95.2% in identifying individual appliance usage.
Keywords: Ubiquitous Computing, Sustainability, Sensing, Gas
1 Introduction and Motivation
Natural gas is the most widely consumed energy source in American homes [19]. It is used for furnaces, water heaters, stoves, fireplaces and, in some cases, clothes dryers. In the US, natural gas prices have quadrupled over the past decade due to growing demand and limited pipeline capacity [3]. As a result, government agencies and gas utilities have scrambled to implement conservation programs to reduce demand and better help customers manage energy costs (e.g., [7, 17]). Although recent work in the UbiComp and Pervasive research communities has focused on sensing electricity and water usage in the home [10, 12, 15, 16, 18], little attention has been directed towards sensing natural or propane gas usage. Unlike electricity and water usage, which are often the result of direct human actions such as watching TV, doing laundry, or taking a shower, gas usage is dominated by automated systems like the furnace or hot water heater. This disconnect between activity and consumption leads to a lack of consumer understanding about how gas is used in the home and, in particular, which appliances are most responsible for this usage [14]. Most people simply have no means of judging their household gas consumption other than a monthly bill, which, even then, does not provide itemized details about what accounts for this consumption.

In this paper, we introduce GasSense, a significant step towards eliminating this knowledge gap by providing highly granular information about gas usage in the home. GasSense is a low-cost, single-point sensing solution that uses changes in acoustic intensities of gas events to automatically identify gas use down to its source appliance (e.g., water heater, furnace, fireplace) and provide estimates of gas flow. GasSense automatically classifies gas use down to its source based on flow volume and rate-of-change. Each gas device in the home draws a unique amount of gas when activated and the flow rate-of-change is based on the type of appliance and, to some extent, its location in the home (i.e., the pipe pathway to the gas appliance). Because GasSense analyzes the acoustic signatures of gas events, it does not require direct contact with the gas itself to perform its calculations. This is in contrast to traditional gas sensing approaches, which only provide aggregate measurements of usage and require in-line contact with the gas to operate.
Previous work in sensing in the home has been motivated by one of two independent concerns: (1) human activity sensing for assistive care environments (e.g., elder care monitoring) [6, 13, 18] or (2) in enabling highly detailed eco-feedback applications to reduce wasteful consumption practices [2, 15, 16]. Although automatically identifying gas usage in the home may indeed provide insights into corresponding human activities (e.g., stove use indicates cooking, long hot water use indicates showering), a large majority of gas use stems from automated mechanical systems (e.g., from a home’s furnace and water heater), which may or may not directly correspond to a human’s current activity.
Thus, a primary focus of our work is in supporting the second concern, that is, enabling new types of eco-feedback [11] about gas usage in the home. Such feedback may come in the form of redesigned bills, home internet portals, or ambient home displays. The key here is in providing utilities and consumers with sensing data that is more than just an aggregate number but rather an itemized breakdown of gas usage down to its source. This detailed data should allow residents to make informed decisions about the costs and benefits of how they consume gas in their home (e.g., the temperature settings on their hot water heater, using hot water in the clothes washer). For example, in a review of the past 25 years of research into the effects of feedback on electricity consumption, Fischer found that feedback resulted in typical energy savings of between 5 and 12% [8]. It is likely that gas usage feedback will result in a similar decrease. Without detailed measurement, however, these sorts of applications are not possible. The focus of GasSense, then, is providing an easy to install sensing system capable of estimating disaggregated gas usage.
Given the small number of natural gas appliances in each home, it is tempting to consider a distributed direct sensing approach (e.g., [6, 16, 20]) for sensing gas usage (e.g., installing a flow sensor behind each appliance). There are three potential challenges with this approach: first, it requires constructing sensors that are flexible and robust enough to fit a variety of pre-existing gas appliance models in a non-invasive way; second, it inherently involves multiple sensors, which increases both the technical complexity (e.g., network communications) and the complexity of deployment; finally, natural gas is a highly combustible compound, so we were particularly interested in pursuing sensing approaches that were safe and did not require the help of a professional for installation. To address these challenges, we adopted an infrastructure-mediated sensing approach (e.g., [12, 18]), which leverages

a home’s existing physical infrastructure to sense and infer higher-level information about events in the home.
GasSense is the first single-point sensing solution capable of inferring both the fixture source and the flow level of natural gas. In this paper, we show how a standard gas meter’s government mandated regulator can be instrumented with a simple microphone-based sensor to gather acoustic signals of gas usage. We provide an overview of our gas fixture identification and flow estimation algorithms and the results of an evaluation in nine diverse homes. In particular, we show that we can accurately detect and identify gas events with 95.2% accuracy. Unlike previous work in infrastructure-mediated electricity and water sensing, we focus on both isolated appliance usage as well as overlapping usage (i.e., multiple gas appliances in use at the same time). Of the 496 gas events that we collected, 175 were recorded in isolation and 321 were recorded with other appliances on.
2 Related Work
There have been two prevailing approaches to sensing home resource consumption at the appliance or fixture level: direct sensing, and infrastructure-mediated sensing (indirect sensing). Direct sensing is sensing at or near the point of consumption. For example, in ViridiScope, Kim et al. [16] use a combination of magnetic, acoustic, and light sensors to sense the internal power state of appliances. Similarly, Arroyo et al. developed the WaterBot system [2], which senses and provides feedback about water usage behaviors at the water fixture itself by using an inline water flow sensor. Others have used computer vision [1], microphones placed within the living environment [6], and many simple sensors dispersed throughout the home [20]. Although direct sensing can provide highly granular data, wide scale deployment of such an approach is often impractical. The installation and maintenance of many direct sensors can be cost prohibitive, direct sensing can also create significant privacy concerns and stigmatization (especially with cameras or microphones), and introduce concerns over the aesthetics in the home, eventually leading to adoption problems [4, 13].
Recent work has therefore examined home resource sensing using just a handful of inexpensive sensors and often just a single sensor at strategic locations in a home’s existing infrastructure (e.g., a home’s water [10, 12, 15] or electrical [18] infrastructures). In contrast to direct sensing, infrastructure mediated sensing leverages the existing home infrastructure to mediate the transduction of events. A primary goal of these systems is to reduce economic, aesthetic, installation, and maintenance barriers to adoption by reducing the cost and complexity of deploying and maintaining the sensing infrastructure. The key enabler in applying this approach to gas sensing is that the home’s gas infrastructure and, in particular, its gas meter is standardized across households due to government regulation. Thus, the gas meter offers a particularly attractive installation point, which is safe, accessible, and also provides an indirect means to sense gas usage.
We are unaware of any commercial gas monitoring solutions that attempt to provide appliance-level data on gas usage. Smart gas meters, which can be remotely read by utility companies, typically only provide aggregate data. Small, inline gas

sensors are also commercially available (e.g., [5]), but suffer from many of the same problems as the direct sensing approach (e.g., they require installation by a professional or direct access to the underlying pipe infrastructure). Industrial applications, especially for manufacturing systems, have motivated the development of highly granular ultrasonic gas flow meters (e.g., [1]) but these systems can cost over $1000 USD and therefore are not well suited for residential usage.
To the best of our knowledge, acoustic sensing has not been used for appliance-level identification and gas flow estimation as it is in GasSense. In leak detection, however, acoustics play a critical role. For example, several handheld devices, which are marketed towards utility companies, use high frequency response microphones to detect ultrasonic waves, which are characteristically emitted from small orifices (leak holes) in long haul gas pipes. These acoustic solutions only detect the presence of a leak and do not try to characterize the flow or any appliance activity. In our approach, the acoustic response produced at the gas regulator is at a much lower frequency because the chamber and orifice are significantly larger than that of most leaks.
3 Background and Theory of Operation
Figure 1: (left) A typical US gas meter and pressure regulator. (middle) The location of our microphone-based sensor on the pressure regulator relief vent. (right) The GasSense prototype and sensor mount attached to the relief vent.
Gas is delivered to homes through a pressurized piping infrastructure. High-pressure transmission pipelines move gas from the production company’s cleaning plants to gas distribution stations. Regulators and control valves control the high-pressure gas as it moves along the pipeline. At city gate stations, regulators reduce the pipeline gas pressure to distribution pressure. To provide a constant, measurable gas pressure, regulators control the gas pressure just before it enters the gas meter and into the home (Figure 1). In the case of propane, the gas is stored in an on-site tank, and enters the home only through a pressure regulator, as propane is typically unmetered.
Gas regulators are mandated by US national code (ANSI code B109.4-1998) to deliver safe pressure levels to the home’s piping system. Given these government regulations, there is a reasonable level of expectation that the gas regulators are both

consistent and present across homes. We leverage this fact in our sensing approach. The regulator consists of a diaphragm with a spring-loaded case that controls the amount of gas flow (Figure 2). If the regulator senses high or low pressure changes, it adjusts accordingly to restrict or increase gas flow. As an added safety feature, relief (or breather) valves exist to vent gas harmlessly if a line becomes over-pressurized or the regulator malfunctions. This relief valve is connected to the diaphragm chamber and expels the gas through an external steel tube (the relief vent). When gas is being consumed in the home it is possible to hear the gas flowing through the regulator at the inlet valve, which typically sounds like a slight hissing noise. This sound is amplified by the diaphragm chamber, which acts as a resonant cavity.
Figure 2: A cross-section of a typical regulator design. We sense gas flowing through the gas flow valve via a microphone placed on the relief vent.
Although a microphone may seem like a rather indirect way of measuring gas flow, it has several theoretical foundations. First, for a fixed chamber, the resonant frequency is also fixed, determined entirely by the size of the chamber [9]. This is analogous to resonance in a whistle—even when you blow harder into a whistle, you do not change the pitch, just the intensity of the sound. Second, we know that greater flow through the tube can only result from greater pressure at one end of the tube. If the flow of gas inside the tube is laminar, the relationship between pressure exerted at the tube ending is linearly related to the flow through the tube. Moreover, this pressure, which is directly proportional to flow, manifests as the amplitude of the resonant frequency, and is ideally suited for measurement via a microphone. The relief vent (visible in Figures 1, 2 and 3) of the regulator is the only opening in the diaphragm chamber for which the sound propagates outward into the environment, making it ideally suited for sensor placement. With proper filtering and de-noising techniques, this signal can be isolated and calibrated to reflect aggregate gas flow, even in the presence of ambient noise (Figures 4 and 5).

4 Hardware Implementation and Data Collection Details
Figure 3: (left) A close-up of our prototype system of GasSense with our sensor mount. (right) The GasSense unit attached to the relief vent of the pressure regulator. GasSense consists of an electret condenser microphone attached to a small printed circuit board (PCB), which contains the required amplification circuitry. The microphone is omni-directional, and has a sensitivity of -44 dB over the frequency range 100 Hz to 10 kHz. The PCB is attached to a sensor mount, which fits over the end of the relief vent on the gas regulator. The mounting bracket ensures that the microphone is level, centered directly under the regulator vent, and also protects the microphone from wind, rain and dust. Figure 1 (right image) and Figure 3 (right image) show the microphone mounted to a natural gas regulator. The microphone PCB requires external power which is provided by two AA batteries in a plastic enclosure.
The initial GasSense prototype is connected to the microphone input of a laptop’s soundcard, although future designs could be entirely self-contained with a microcontroller and wireless transmitter. We experimentally confirmed in the lab using a signal generator that the automatic gain control (AGC) on the laptop’s integrated soundcard was not attenuating or distorting the signal.
4.1 In-Home Data Collection
In order to validate our sensing approach, we collected labeled data in nine different homes of varying size and age located in four cities (Table 1). Each house contained a varying level of background noise depending on the locality (proximity to a freeway, sidewalk traffic, etc.). In each house, we tested all of the available gas appliances including furnace, hot water heater, stove, fireplace (with both manual and electric starters), and a pool heater. Although our focus was on natural gas appliances, we also tested GasSense on one house that used propane (H5). For each dataset we noted the timestamp and appliance, which served as ground truth labels for evaluating our approach.

Table 1: Demographic data for homes used in our data collection experiments and their available appliances tested.
All of the data was collected and initially processed using the soundcard from our
deployment laptops. The audio signal was sampled at 22,050 samples per second, enabling frequency analysis on the entire frequency range of the microphone. The raw data was recorded in an uncompressed WAV file using a 16-bit integer to represent each sample.
We followed a predefined experimental procedure to ensure that our data was consistent across deployment sites. For each home, we first attached the sensor to the relief vent on the gas regulator, as shown in Figure 1 and 3. We then individually turned each gas appliance on for a minimum of 15 seconds and then off. This was repeated at least three times for each appliance. This procedure allowed us to acquire a clean dataset where each appliance was the only gas device on in the entire house.
Many gas devices do not provide a mechanism to control the amount of gas flow—the device is simply on or off (furnaces, water heaters, dryers and some fireplaces). For all of the devices for which we could control flow, we slowly adjusted the device through each flow level to capture the effect of variable rate devices. For example, with gas stoves we would ramp a single burner from maximum to minimum flow and back again (Figure 4).
In addition to testing each appliance individually, we collected data involving more realistic scenarios in which more than one gas appliance was in use simultaneously (e.g., we would activate the furnace, water heater, and stove). These compound events are likely to be a common occurrence in any home and thus require special attention. To simulate compound events, we turned on multiple gas appliances at 15 second intervals up to four appliances at a time. Figure 4 (right image) shows data collected from a compound event test.
We also collected flow rate information for both automatically controlled (furnace and water heater) and manually controlled (stove and fireplace) gas appliances. We
House ID / Gas Type Style / Built Size / Floors Furnace / Water
Heater / Stove Fireplace /
Misc H1
Natural Gas Single-Family
1996 3400 sq. ft.
2 Yes / Yes / 4 burners
2 Manual Start
H2 Natural Gas
Single-Family 1998
3600 sq. ft. 2
Yes / Yes / 4 burners
2 Electric Start
H3 Natural Gas
Single-Family 1962
2000 sq. ft. 1
Yes / No / No
1 Manual Start / Pool Heater
H4 Natural Gas
Single-Family 2003
2900 sq. ft. 2
Yes / Yes / 6 burners
1 Electric Start
H5 Propane
Single-Family 1991
2100 sq. ft. 2
Yes / Yes / 4 burners
1 Electric Start
H6 Natural Gas
Single-Family ~1960s
1080 sq. ft. 1
Yes / Yes / 4 burners
No
H7 Natural Gas
Single-Family 1994
3360 sq. ft. 2
Yes / Yes / 4 burners
1 Manual Start
H8 Natural Gas
Single-Family 1991
3000 sq. ft. 2
Yes / Yes / 4 burners
1 Manual Start
H9 Natural Gas
Single-Family 1997
2600 sq. ft. 2
Yes / Yes / 4 burners
1 Electric Start

used two methods for collecting ground truth gas flow: the natural gas meter and gas appliance labels/manuals, neither of which, unfortunately, provided perfectly accurate ground truth. Although natural gas meters do indeed provide measurements of gas flow, they are not designed to visualize accurate data about instantaneous flow. Even when a constant rate of gas is flowing, gas meter dials would commonly stutter and then later jump as much as a whole turn. To mitigate these effects, we collected flow measurement data over longer periods—typically four minutes or more, which corresponds to at least two cubic feet of gas—and averaged the results to obtain flow rate. This method was used on all homes except H5, which used unmetered propane.
As an alternative to the gas meter, we also used consumption information listed on the gas appliance (or its manual) for ground truth. Most large appliances are directly labeled with their power consumption (typically in BTU/hr). Using this method provides estimates for the gas consumption for individual appliances. However, the power consumption obtained from the appliance documentation cannot simply be converted into a gas flow rate as this conversion varies with temperature, pressure, and humidity. Therefore, this method of calibration can only give rough estimates of usage. For homes in which there is no meter (e.g. propane gas homes) this may be the only method to estimate the flow. For our analysis we used this method on H5, the only residence using unmetered propane.
Figure 4: Flow rate sensed from a calibrated microphone during a typical test deployment
5 Flow and Event Detection
We pursued a three-step approach to transforming the collected audio data into gas flow estimates and inferring appliance-level activity. First, the raw audio files are cleaned using Fourier transforms and band pass filtering. Second, the linear relationship between acoustic intensity and gas flow are used to estimate the amount of gas usage. Finally, the calculated gas flow volume and rate-of-change are used to classify the appliance source.

5.1 Initial Processing
Figure 5: Frequency spectrogram of ambient noise and regulator activity for a stove appliance from Home 9.
The initial processing step involves preparing the raw audio files for analysis. For each home, the uncompressed WAV recording of the pressure regulator is grouped into non-overlapping time windows containing one second of data each. Using these one second windows, we compute a short-time Fourier transform (i.e., a spectrogram) of the audio signal. Figure 5 shows the resulting spectrogram, in decibels, as a function of both time and frequency. Notice that, as expected, the hissing sound primarily occupies a specific frequency in the spectrogram (in Figure 5, this is at 7.5 kHz). The frequency of resonance can change from regulator to regulator, but for all homes for which we have collected data, the resonance frequency stays in the range of 5 – 9 kHz.
Like all microphone-based approaches, our audio signal is susceptible to ambient noise. Fortunately, most of this noise (e.g., footsteps, wind, lawn-mowers) is low frequency (below 4 kHz)—note the wind, airplane and car noise in Figure 5. When noise does penetrate the 5 – 9 kHz range, it often has a wide-band frequency signature, making it easy to identify. In particular, if the mean energy outside the 5 – 9 kHz range is greater than one tenth of the energy at the resonance frequency, we discard the audio frame during this time and replace it with the median values from two seconds before and two seconds after the noise event (left image in Figure 6).
After removing environmental noise from the spectrogram, we find the resonant frequency by taking the maximum resonance in the range of 5 – 9 kHz. We extract the magnitudes of the resonant frequency across time to form a time-series vector of values (time, resonant frequency intensity) that correlates directly to flow (Figure 6). This vector is then smoothed using a moving average filter of five second length.

Figure 6: (left) Raw audio signal with broadband noise detection. (right) Step change detector.
5.2 Gas Flow and Consumption
In order to use our acoustic measurements to estimate gas flow, we must first show that the acoustic signals correspond in a predictable way with the rate of consumption. As described in the theory of operation section, we expect the audio intensity of gas passing over the pressure regulator valve to be linearly related to flow. Figure 7 (left image) plots the audio intensity vs. ground truth measurements of gas flow for Home 4, which is representative of our dataset as a whole. Note that because of the aforementioned challenges with ground truth data collection, this graph is not perfectly linear, particularly for low-flow values, which are especially difficult to measure. As a result, we devised another test for linearity.
If there is a linear relationship between audio intensity and gas flow, the overall audio intensity of a compound event should simply be the sum of its individually collected audio intensity parts. This is in the same way that overall gas flow should be the sum of the individual flows from each appliance. To test this, we use our individually collected (single-event) dataset to compare with our compound event dataset. Figure 7 (right) plots the relationship between the expected value based on summing the individual appliance intensities with measured audio intensity for both individual and compound events. Note that the points lie on a unity slope indicating that relationship between audio intensity and rate of gas flow is in-fact linear. The slight non-linearity at high gas flow rates can be attributed to the microphone op-amp distorting very high amplitude signals (i.e., slew rate distortion), which can be compensated.
Using either the flow rate obtained from the meter or the consumption rate obtained from the appliance label/manual, the audio intensity can be calibrated to absolute units of gas flow (such as in CCF or Therms). Because the relationship between intensity and flow is linear, we use a simple linear regression to map intensity to flow, measured in Centum Cubic Feet (CCF or 100 cubic feet). The regression requires that we either have two points on the flow vs. intensity graph or only one point and assume that the origin (background noise level) is part of the dataset. Thus, we can calibrate the entire system from two appliances with different

flow rates or from a single appliance with a variable flow rate. Of course, providing additional data points from additional appliances can improve the regression and, consequently, the gas flow estimate.
At very high volumes (when all appliances are on) the microphone op-amp begins to distort the signal and introduce a non-linearity due to its insufficient dynamic range. Future deployments will include a gain control to automatically reduce the volume if distortion occurs. After data analysis, it was discovered that this non-linearity was significant in H8 and H9 where the sound produced by the regulator was louder than other homes. To compensate for this effect, a quadratic regression was used to map intensity to flow. The data used to form the regression equation was not used for testing.
Figure 7: (left) The linearity curve obtained from calibrating using the gas meter and appliance ratings as ground truth. (right) The linearity curve obtained from plotting observed step increases vs. expected increases in the audio signal.
5.3 Appliance-level Event Detection & Identification
We use the smoothed resonant frequency vector as input to both our gas event detection and appliance identification algorithms. To identify gas usage events, we apply a sliding window step detector, which continuously looks for changes in magnitude of the resonant frequency intensity (e.g., Figure 4 or right image in Figure 6). The step detector triggers when it encounters a monotonically increasing or decreasing signal with a rate of change that is greater than a learned threshold. The threshold was determined for each house during calibration. The threshold is set to an arbitrarily large number and decreased in small steps. For each step, we segment a random subset of events that occur in isolation. If the correct number of events is calculated, the threshold is accepted. If not, the threshold is decreased and the process repeats. For example, if the subset contains four events, there should be four step increases and four step decreases segmented. We monotonically decrease the detection threshold until this pattern is seen. In this way, the threshold is set with minimal supervision.

After the step detector locates a step in the signal, the signal is passed to the appliance identification algorithm, which extracts three features: (1) the relative magnitude of the step change in flow, (2) the slope of the change-in-flow, (3) and the rise or fall time of the unknown event. The first feature (the step size) provides an estimate of the amount of gas the appliance consumes. This feature is useful in disambiguating appliances that have fixed flow rates (e.g., a water heater typically uses less gas than a furnace). Interestingly, the step size is also useful in disambiguating appliances that have variable flow (e.g., a stove or fireplace). This is because these systems are designed to turn on at maximum flow during activation, providing a reliable step increase. The second and third features (the step slope and rise time) are useful because electromechanically switched appliances have very steep operating slopes when compared with manually or human controlled appliances. Though it may seem that the slope does not add any additional information given the step change and rise time as features, we found that some of our datasets performed better by as much as 4.6% when using the slope.
Feature vectors are generated for each segmented event and then used to build a k-nearest neighbor (KNN) model using the Weka Toolkit [21]. KNN is used to automatically determine the source of the gas events. We applied KNN (k = 3) with a Euclidean distance metric and inverse weighting, which is well suited for this kind of feature vector because a small distance in the N-dimensional space corresponds to gas events having similar flow and slope. These parameters were derived through experimentation and cross validation of our entire dataset.
6 Performance Evaluation and Results
Our total dataset includes 496 gas events collected over nine homes and five separate appliance types (furnace, water heater, stove, fireplace, and pool heater). Of the 496 gas events, 175 were recorded in isolation and 321 were recorded in compound. In this section, we present the results of our event detection and appliance identification algorithms.
6.1 Event detection
To evaluate the accuracy of our event detection algorithm, we iterated over each gas appliance event in our dataset (including both single and compound events). We compared the output of the event detection algorithm to our ground truth labels. We were able to correctly detect 98.22% (1st column in Table 2) of all gas events, even in the presence of considerable ambient noise. For example, leaf blowers, passing cars, and speech were present in many of our datasets, but were not the cause of any failures. In fact, all homes, with the exception of H5, had 100% accuracy. H5, however, is a special case—it is the only home in our dataset that used propane rather than utility supplied natural gas. Unlike natural gas meters, which rely on a single pressure regulator to stabilize incoming gas, propane homes use two regulators (for safety and efficiency reasons). Since these two regulators do not regulate the pressure proportionally, the quantity of gas flow cannot accurately be determined by

monitoring only one regulator. The gas stove events, for example, were completely missed on four separate trials.
6.2 Appliance classification
Home (N=# of gas
events collected)
Events Detected
10-Fold Cross Validation Classification Results
Classification Results Using Minimal Training Set
H1 (N=72) 100% 93.05% 88.24% H2 (N=87) 100% 98.85% 99.05% H3 (N=24) 100% 100% 100% H4 (N=102) 100% 95.07% 98.34% H5 (N=50) 84% 85.71% 86.12% H6 (N=22) 100% 100% 83.34% H7 (N=32) 100% 100% 100% H8 (N=58) 100% 87.75% 80.98% H9 (N=49) 100% 96.55% 49.8%
Aggregate (N=496) 98.22% 95.22% 87.32% Table 2: Overall performance of event detection and classification categorized by home.
Appliance Type (N=# of gas
events collected)
10-Fold Cross Validation
Classification Results
Classification Results Using Minimal Training Set
Appliance On Appliance Off
Furnace (N=108) 98.13% 100% 98.5% Water Heater (N=88) 93.02% 100% 76.1%
Stove (N=206) 97.56% 96.8% 84.8% Fireplace (N=88) 91.66% 100% 93.2%
Pool Heater (N=6) 100% 100% 100% Aggregate (N=496) 96.07% 99.36% 90.52%
Table 3: Overall performance of event detection and classification categorized by fixture.
Fireplace Furnace Stove Water Heater Pool Heater Fireplace 77 0 2 5 0 Furnace 1 105 0 1 0
Stove 3 0 200 2 0 Water Heater 4 2 0 80 0 Pool Heater 0 0 0 0 6
Table 4: Confusion matrix from 10-fold cross validation classification.
Once a gas event is detected and isolated, its features are sent to our appliance classification algorithm to identify the source of the event. To test the accuracy of our appliance classification algorithm, we ran a 10-fold cross validation experiment across each detected gas event for every home. The 2nd column in Table 2 shows the

results of this experiment. The aggregate accuracy across all homes was 95.2% and the worst performing home, H5, was still above 85% accuracy. Again, the issue with H5 was with the intensity of the audio signal when monitoring only one of the two propane gas regulators.
Table 3 presents an alternate view of the same data as in Table 2 but categorized by appliance rather than by home. The cross validation reveals that the poorest appliance classification accuracies involved fireplaces and water heaters. Upon further analysis we observed that 75% of the incorrect water heater classifications, were misclassified as fireplace events. As we discuss later, there is a characteristic low frequency thump, which can be used to differentiate fireplace and water heater events. Note that our data was labeled according to individual appliance, not appliance type. This enabled us to investigate whether we could automatically distinguish between appliances of the same type but in different locations in the home. The H2 dataset, for example, contained two different fireplaces that were correctly distinguished from one another with 100% accuracy.
The 10-fold cross validation shows that our particular KNN-based classifier performed well at correctly classifying gas events down to the source appliance. Table 4 presents the confusion matrix summarizing the classifier’s prediction. However, in real-world deployment scenarios, our training dataset will likely be smaller. That is, a homeowner would likely only be willing to provide one example use of each appliance. To test this sort of scenario, we trained solely on one or two individual gas events for each appliance and tested on the rest of the dataset. These results are presented in the far right column of Table 2 and the last two columns in Table 3. The low accuracy in H9 is the result of the introduction of non-linearity to the sensed signal, which affected both H8 and H9 (as mentioned in Section 5.2). The induced non-linearity in the dataset made it impossible to find a calibration subset that effectively represented all data collected. As a result, step increases during compound events were not representative of the trained step increases. After thorough analysis, we found that this was due to the low dynamic range of the microphone op-amp. Future deployments will include a gain control to automatically reduce the volume if distortion occurs. We also noticed that as more gas appliances are running simultaneously (i.e., higher overall flow), the noise is also amplified, which explains some of the misclassifications for compounded events (especially small loads). Unlike the minimal training set results, H9 performs well in cross validation. This can be explained by the larger set of training data. Cross validation randomly selects 90% of total instances for training and rest for testing in each fold. This results in a classifier that learns from the nonlinear instances too, resulting in a more robust model.
7 Discussion
Our initial results show significant promise for appliance-level single-point sensing of all gas appliances in the home using a simple microphone-based sensing approach. After taking data from nine homes, we have shown that individual appliances can be reliably detected and classified with an average overall accuracy of 95.2%. This is an important advancement in gas monitoring, and we are not aware of any prior work in appliance-level single-point sensing of gas. Our microphone-based approach has the

added advantage of being safely installed by a non-professional. In this section, we discuss potential implementations for the end-user calibration process, alternative sensing approaches we explored, and outline the next steps and potential future work.
7.1 End-User Calibration
Our approach requires two training procedures by an end user: the association of relative flow produced by GasSense to absolute flow volume and providing ground truth labels of appliances to their respective audio signatures. We can imagine users employing one of three calibration methods for associating the relative flow inferred by our sensing approach to absolute consumption (such as in CCF or Therms). The first would involve using the readings from the home’s gas meter as we did in our own experiments. The second involves reading the flow ratings on certain appliances, such as the water heater or furnace (again, this is an approach we used in our experiments). Large appliances are typically required by national code to show their gas consumption. This method is particularly useful for homes that use propane as they do not typically have a gas meter. The third, less intensive method is to use the measurements reported on the gas bill. Since GasSense can record the duration of gas usage and its relative flow, we can use this term to calculate the total gas consumed over a period of time. In this way, the first gas bill (or even a set of sparse measurements from the meter) can be used to calibrate the system to absolute units of flow. The homeowner would only need to enter the dates of use and aggregate gas usage. Although many gas utilities in the United States charge gas consumption in units of energy (typically in Therms), the bill also reports the total volume of gas measured by the meter (typically in CCF), enabling the use of this type calibration method. For associating appliance labels to events, we can imagine the user simply activating each appliance in sequence and then entering the sequence of labels through a user interface.
7.2 Alternative Sensing Solutions
Before deciding on a microphone-based sensing solution, we explored the idea of using a methane sensor placed in the relief vent. This solution proved to be inadequate due to the sensitivity and response time of the sensor. The methane sensing approach relies on trace amounts of gas that escape from the regulator during changes in gas flow. However, for many appliances the flow is not great enough to exert backpressure on the regulator, and no methane escapes from the relief valve. Moreover, pellistor and infrared methane gas sensors both suffer from inadequate response times. Because we use the slope of the step increase in flow to classify appliances, response time proved to be a crucial issue. We also experimented with a thermistor placed just inside the relief vent. The idea behind this approach is that as the escaping gas leaves the pressurized atmosphere of the regulator, it cools as it expands into the ambient air. Unfortunately, the volume of gas released through the relief valve was not sufficient to reliably affect the thermistor.
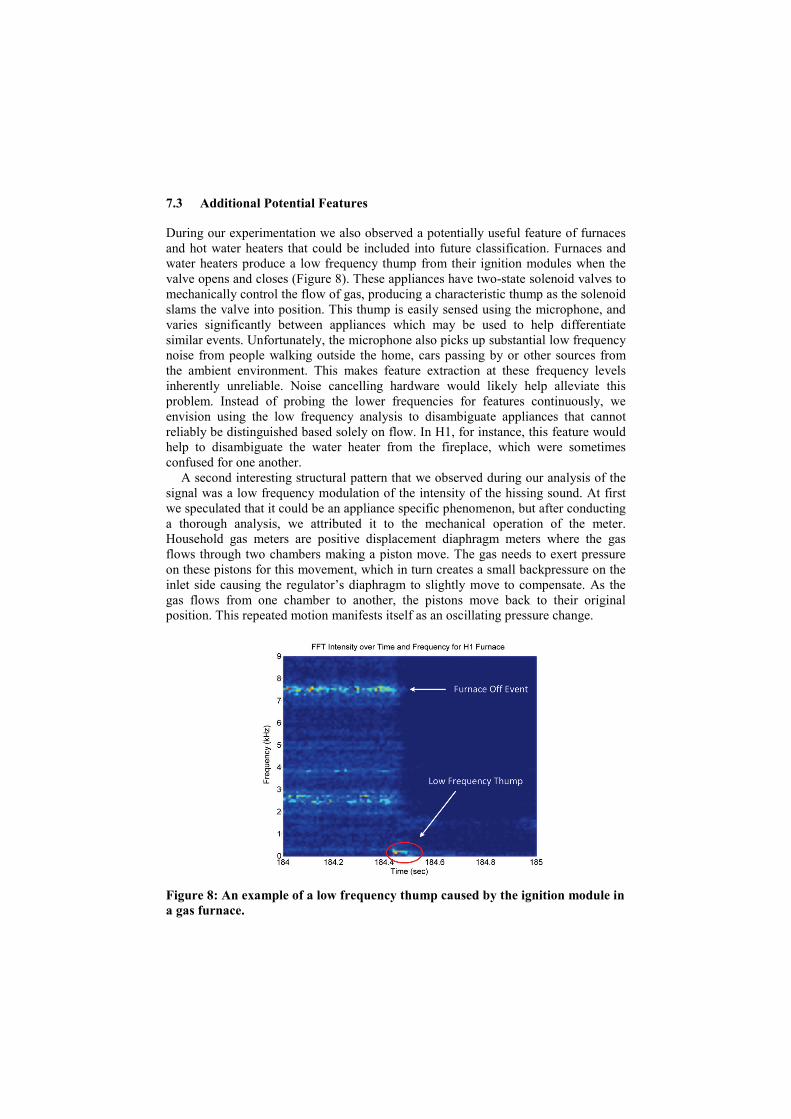
7.3 Additional Potential Features
During our experimentation we also observed a potentially useful feature of furnaces and hot water heaters that could be included into future classification. Furnaces and water heaters produce a low frequency thump from their ignition modules when the valve opens and closes (Figure 8). These appliances have two-state solenoid valves to mechanically control the flow of gas, producing a characteristic thump as the solenoid slams the valve into position. This thump is easily sensed using the microphone, and varies significantly between appliances which may be used to help differentiate similar events. Unfortunately, the microphone also picks up substantial low frequency noise from people walking outside the home, cars passing by or other sources from the ambient environment. This makes feature extraction at these frequency levels inherently unreliable. Noise cancelling hardware would likely help alleviate this problem. Instead of probing the lower frequencies for features continuously, we envision using the low frequency analysis to disambiguate appliances that cannot reliably be distinguished based solely on flow. In H1, for instance, this feature would help to disambiguate the water heater from the fireplace, which were sometimes confused for one another.
A second interesting structural pattern that we observed during our analysis of the signal was a low frequency modulation of the intensity of the hissing sound. At first we speculated that it could be an appliance specific phenomenon, but after conducting a thorough analysis, we attributed it to the mechanical operation of the meter. Household gas meters are positive displacement diaphragm meters where the gas flows through two chambers making a piston move. The gas needs to exert pressure on these pistons for this movement, which in turn creates a small backpressure on the inlet side causing the regulator’s diaphragm to slightly move to compensate. As the gas flows from one chamber to another, the pistons move back to their original position. This repeated motion manifests itself as an oscillating pressure change.
Figure 8: An example of a low frequency thump caused by the ignition module in a gas furnace.

7.4 Addressing Limitations and Future Work
GasSense has been primarily tested with natural gas meters supplied by the public utility; however, a single home was tested using a propane tank, which demonstrates that GasSense may also be a viable option for propane. Most homes with propane have two regulators instead of one, a regulator at the outlet of the tank and one at the inlet to the house. The additional regulator causes several complications for GasSense because it cannot be assumed that the task of regulating the pressure is shared equally by the two regulators, and it therefore may be necessary to monitor both regulators.
In future implementations, we will experiment with using a directional microphone to eliminate some background noise. In addition, non-linear signal distortion will be remedied with a higher dynamic range microphone op-amp and a gain control to automatically reduce the volume before distortion occurs. We will explore the use a second microphone near the main microphone, but not underneath the vent of the regulator, which can be used for noise cancellation. This would dramatically increase our signal to noise ratio and allow us to measure extremely quiet hissing.
We also plan to perform long-term deployments of GasSense to explore the reliability of the system over time in a naturalistic usage setting. In particular, we would like to study the effects of the environmental variables such as temperature, humidity, and barometric pressure on the acoustic signal produced by the regulator. Additionally, we would like to explore the possibility of classifying events that occur at the exact same time, despite the low probability of this occurrence (e.g., a furnace and hot water heater turning on simultaneously).
8 Conclusion
In this paper we have presented GasSense, a new complementary infrastructure-mediated sensing solution for the gas infrastructure. GasSense is extremely cost-effective using only a commodity microphone for its sensing approach and provides a novel single-point solution for sensing gas use down to the appliance level. Our approach provides a number of appealing features including having the ability to be easily and safely installed without the need of a professional. We deployed our solution in nine different homes and found that a KNN classifier could be used to classify audio signals to their appliance source with an accuracy of 95.2%. We hope to combine this solution with past infrastructure-mediated sensing systems to provide a complete picture of whole-house activity as well as support new eco-feedback applications that provide users with disaggregated energy consumption information.
References
1. Ao, X., Matson, J., Kucmas, P., Khrakovsky, O., Li, X.: UltraSonic Clamp-On Flow Measurement of Natural Gas, Steam, and Compressed Air, http://www.gesensing.com/ products/resources/whitepapers/ur268.pdf, last accessed 10/16/2009
2. Arroyo, E., Bonanni, L., and Selker, T.: Waterbot: exploring feedback and persuasive techniques at the sink. In: CHI 2005, pp. 631--639. ACM, New York (2005)
3. Balasch, P.: National Gas and Electricity Costs and Impacts on Industry. National Energy Technology Laboratory, prepared for US Dept. of Energy, DOE/NETL-2008/1320 (2008)
4. Beckmann, C., Consolvo, S. and LaMarca, A.: Some Assembly Required: Supporting End-User Sensor Installation in Domestic Ubiquitous Computing Environments. In: UbiComp 2004, pp. 107--124 (2004)
5. Captor In-line Type Flow Meter, http://www.captor.com/, last accessed 10/16/2009 6. Chen, J., Kam, A.H., Zhang, J., Liu, N. and Shue, L.: Bathroom Activity Monitoring
Based on Sound. In: Pervasive Computing 2005, pp. 47--61 (2005) 7. Chicagoland Natural Gas Savings Program, http://www.conservationrebates.com/
programs/chi/CHI_Index.aspx, last accessed on 10/16/2009 8. Fischer, C.: Feedback on household electricity consumption: a tool for saving energy?
Energy Efficiency 1, pp. 79--104 (2008) 9. Flanagan, J.: Speech analysis synthesis and perception. Springer, New York (1972) 10. Fogarty, J., Au, C. and Hudson, S.E.: Sensing from the Basement: A Feasibility Study of
Unobtrusive and Low-Cost Home Activity Recognition. In: UIST ‘06, pp. 91--100 (2006) 11. Froehlich, J., Findlater, L., & Landay, J.: The Design of Eco-Feedback Technology. In:
CHI 2010, To Appear (2010) 12. Froehlich, J., Larson, E., Campbell, T., Haggerty, C., Fogarty, J., Patel, S.N.: HydroSense:
infrastructure-mediated single-point sensing of whole-home water activity. In: UbiComp 2009, pp. 235--244 (2009)
13. Hirsch, T., Forlizzi, J., Hyder, E., Goetz, J., Kurtz, C. and Stroback, J.: The ELDer Project: Social and Emotional Factors in the Design of Eldercare Technologies. In: Conference on Universal Usability (CUU) 2000, pp. 72--29, ACM, New York (2000)
14. Kempton, W. and Layne, L.: The Consumer’s Energy Analysis Environment. Energy Policy, vol. 22, issue 10, pp. 857--866 (1994)
15. Kim, Y., Schmid, T., Charbiwala, Z.M., Friedman, J. and Srivastava, M.B.: NAWMS: Non-Intrusive Autonomous Water Monitoring System. In: Conference on Embedded Network Sensor Systems (SenSys) 2008, pp. 309--322, ACM, New York (2008)
16. Kim, Y., Schmid, T., Charbiwala, Z., Srivastava, M.B.: ViridiScope: design and implementation of a fine grained power monitoring system for homes. In: UbiComp 2009, pp. 245--254 (2009)
17. Natural Gas Conservation and Ratemaking Efficiency Act § 56-600 et seq. Virginia (2009) 18. Patel, S.N., Robertson, T., Kientz, J.A., Reynolds, M.S. and Abowd, G.D.: At the Flick of
a Switch: Detecting and Classifying Unique Electrical Events on the Residential Power Line. In: UbiComp 2007, pp. 271--288 (2007)
19. US Energy Information Administration, Using and Saving Energy in Homes, http://tonto.eia.doe.gov/kids/energy.cfm?page=us_energy_homes, last accessed 10/16/2009
20. Wilson, D. and Atkeson, C.G.: STAR: Simultaneous Tracking & Activity Recognition Using Many Anonymous Binary Sensors. In: Pervasive Computing 2005, pp. 62--79 (2005)
21. Witten, I. and Frank, E.: "Data Mining: Practical machine learning tools and techniques", 2nd Edition, Morgan Kaufmann, San Francisco (2005)