Portable Appliance Testing (PAT) - CSE Asset Manager Note - Portable Appliance... · Portable...
10
Portable Appliance Testing (PAT) Portable Appliance Testing (PAT) is a process by which electrical appliances are checked routinely for safety. Sometimes this is known as in-service inspection and testing of electrical equipment. Health and Safety regulations require that electrical appliances must be safe, while legislation requires simply that you must ensure that electrical equipment is maintained in order to prevent danger and harm to staff and pupils. Additionally, it is a common insurance requirement for electrical equipment to be inspected and tested, and as such, proof of inspection and tests carried out (commonly in the form of documented records) is required to be maintained. CSE Asset Manager has a PAT module designed specifically for this purpose. This application note describes a suitable procedure to help you meet this requirement. It is worth pointing out that a successful inspection or test of a piece of equipment is somewhat like an MOT test on a vehicle: it demonstrates that the equipment is safe at that particular point in time, but regular visual inspections of plugs and cables should be carried out looking for signs of obvious damage. The HSE says that this simple process can find more than 90% of faults and potential problems. PAT test instruments carry out basic and appropriate safety checks. Most equipment is equipped with earth continuity tests, insulation resistance tests and the ability to check the correct wiring of detachable mains leads. These are generally simple PASS/FAIL tests aimed at users who carry out in- house testing. Many schools adopt in-house testing as this is the cheapest and simplest method of conforming to HSE requirements. However, more rigorous testing is available from commercial organisations if the situation demands it. Creating a list of equipment to test You can use Asset Manager’s reporting system to create a spreadsheet containing a list of the equipment that needs to be tested. A spreadsheet is a practical way of presenting the data, as it allows the technician to use a laptop to record results as they test each item. In this scenario, let’s assume that we want to create a test list that our technicians can use to record the results of tests run on our inventory of computer monitors. We need to create a spreadsheet that contains all the monitors within our asset database, sorted by location so that the engineer can move from room to room and know what devices need to be tested.
Transcript of Portable Appliance Testing (PAT) - CSE Asset Manager Note - Portable Appliance... · Portable...
Portable Appliance Testing (PAT)
Portable Appliance Testing (PAT) is a process by which electrical appliances are checked routinely for
safety. Sometimes this is known as in-service inspection and testing of electrical equipment. Health
and Safety regulations require that electrical appliances must be safe, while legislation requires
simply that you must ensure that electrical equipment is maintained in order to prevent danger and
harm to staff and pupils. Additionally, it is a common insurance requirement for electrical equipment
to be inspected and tested, and as such, proof of inspection and tests carried out (commonly in the
form of documented records) is required to be maintained.
CSE Asset Manager has a PAT module designed specifically for this purpose. This application note
describes a suitable procedure to help you meet this requirement. It is worth pointing out that a
successful inspection or test of a piece of equipment is somewhat like an MOT test on a vehicle: it
demonstrates that the equipment is safe at that particular point in time, but regular visual
inspections of plugs and cables should be carried out looking for signs of obvious damage. The HSE
says that this simple process can find more than 90% of faults and potential problems.
PAT test instruments carry out basic and appropriate safety checks. Most equipment is equipped
with earth continuity tests, insulation resistance tests and the ability to check the correct wiring of
detachable mains leads. These are generally simple PASS/FAIL tests aimed at users who carry out in-
house testing.
Many schools adopt in-house testing as this is the cheapest and simplest method of conforming to
HSE requirements. However, more rigorous testing is available from commercial organisations if the
situation demands it.
Creating a list of equipment to test You can use Asset Manager’s reporting system to create a spreadsheet containing a list of the
equipment that needs to be tested. A spreadsheet is a practical way of presenting the data, as it
allows the technician to use a laptop to record results as they test each item.
In this scenario, let’s assume that we want to create a test list that our technicians can use to record
the results of tests run on our inventory of computer monitors. We need to create a spreadsheet
that contains all the monitors within our asset database, sorted by location so that the engineer can
move from room to room and know what devices need to be tested.
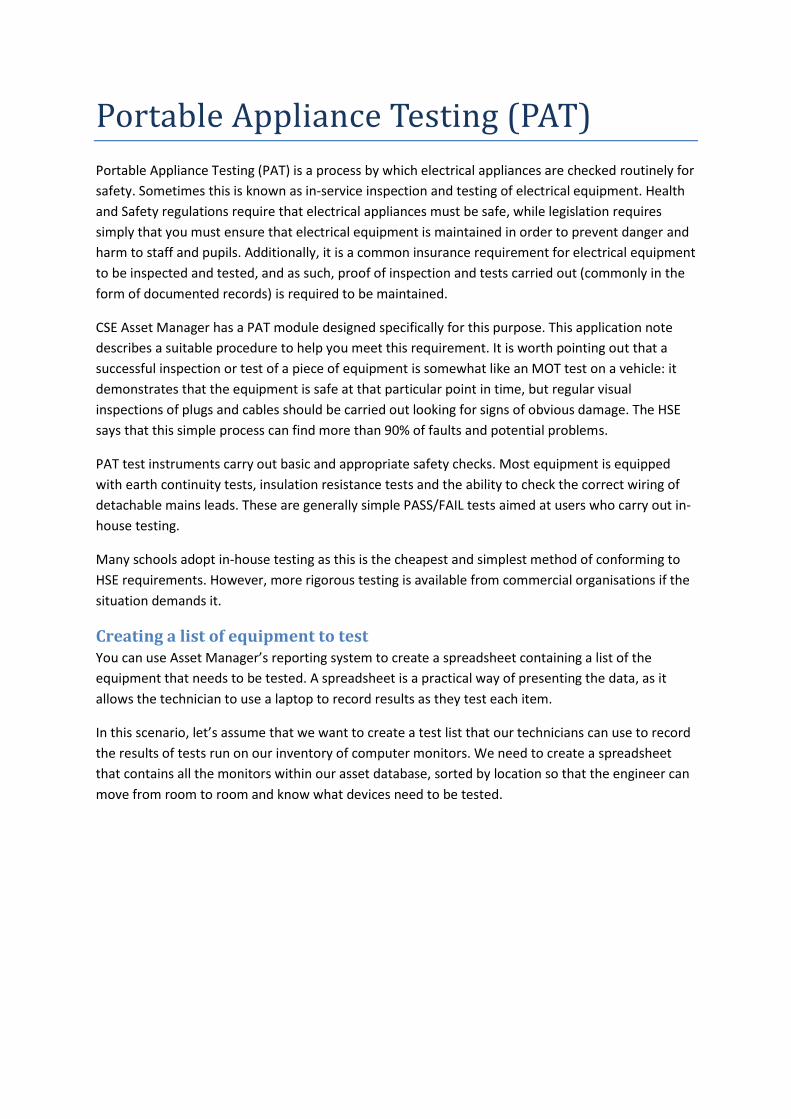
Creating the Report Navigate to the Admin Portal and select Reports from the menu. Select MyReports and then click on
the Add New Report button in the toolbar,
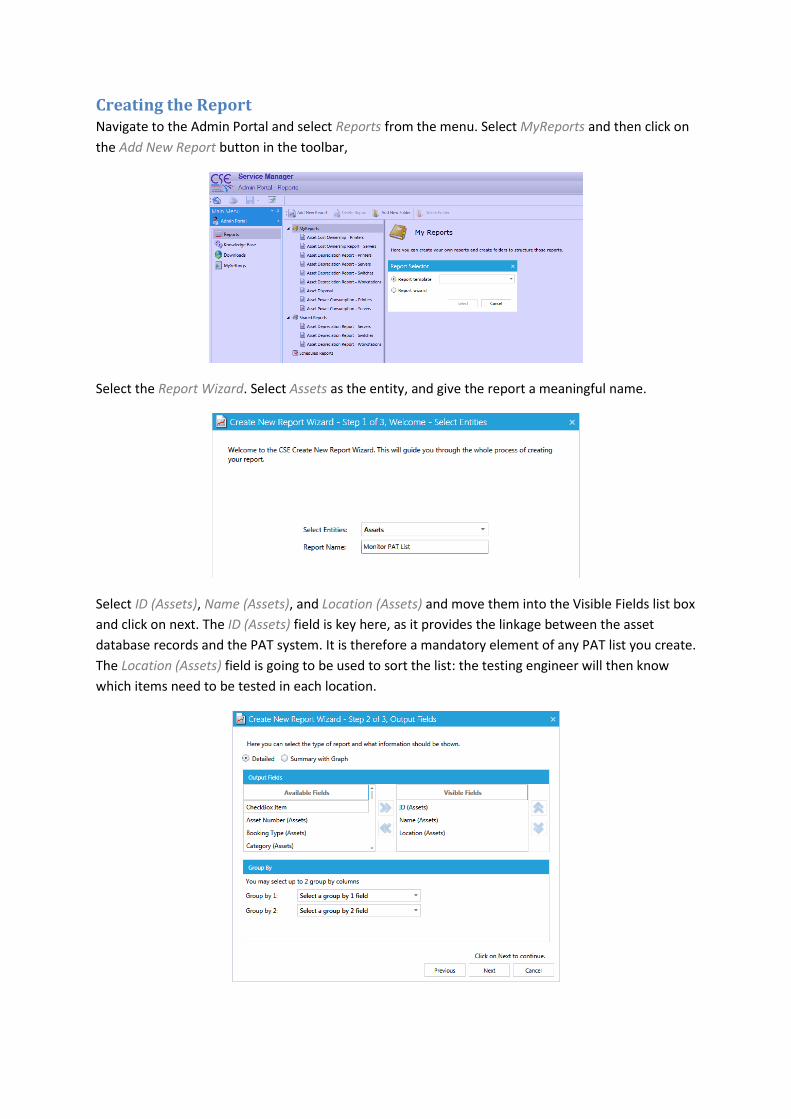
Select the Report Wizard. Select Assets as the entity, and give the report a meaningful name.
Select ID (Assets), Name (Assets), and Location (Assets) and move them into the Visible Fields list box
and click on next. The ID (Assets) field is key here, as it provides the linkage between the asset
database records and the PAT system. It is therefore a mandatory element of any PAT list you create.
The Location (Assets) field is going to be used to sort the list: the testing engineer will then know
which items need to be tested in each location.
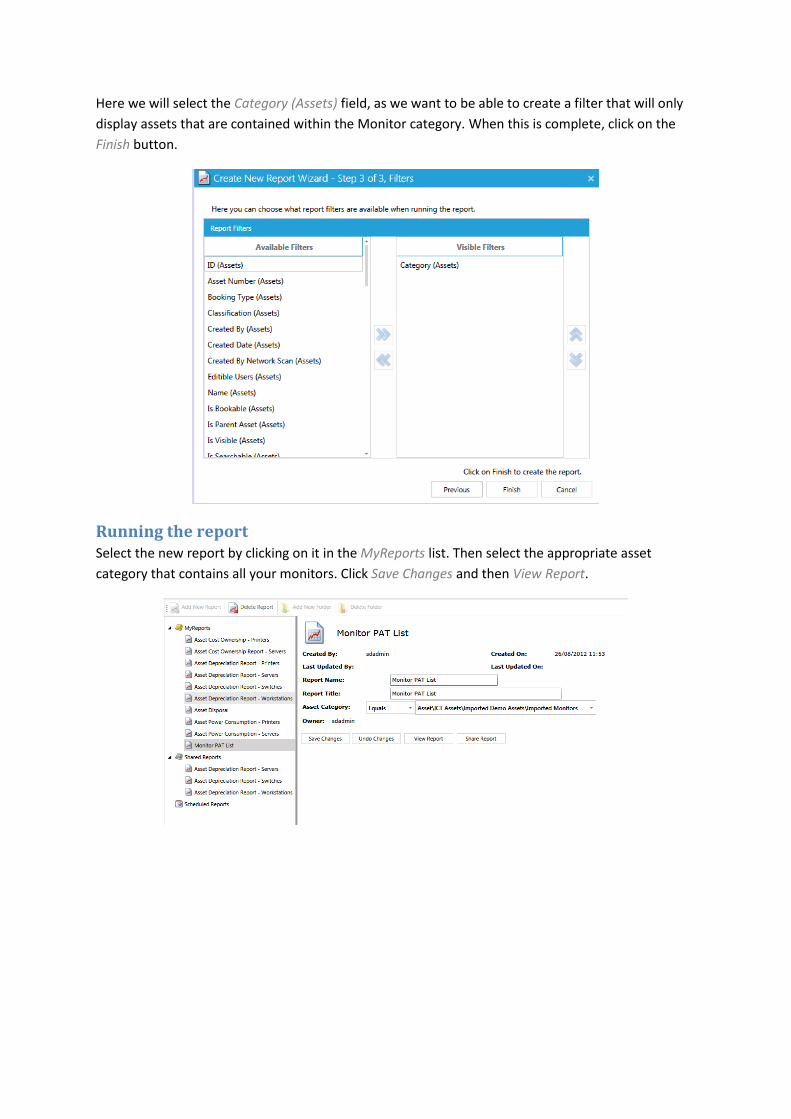
Here we will select the Category (Assets) field, as we want to be able to create a filter that will only
display assets that are contained within the Monitor category. When this is complete, click on the
Finish button.
Running the report Select the new report by clicking on it in the MyReports list. Then select the appropriate asset
category that contains all your monitors. Click Save Changes and then View Report.
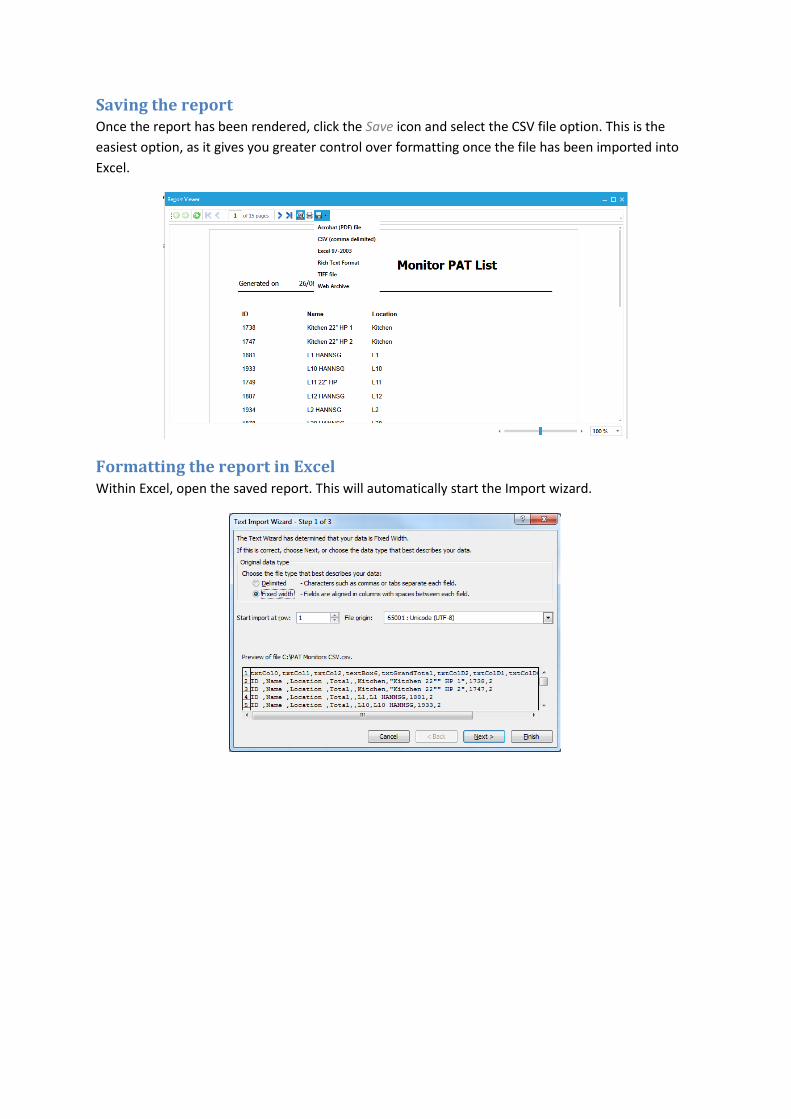
Saving the report Once the report has been rendered, click the Save icon and select the CSV file option. This is the
easiest option, as it gives you greater control over formatting once the file has been imported into
Excel.
Formatting the report in Excel Within Excel, open the saved report. This will automatically start the Import wizard.
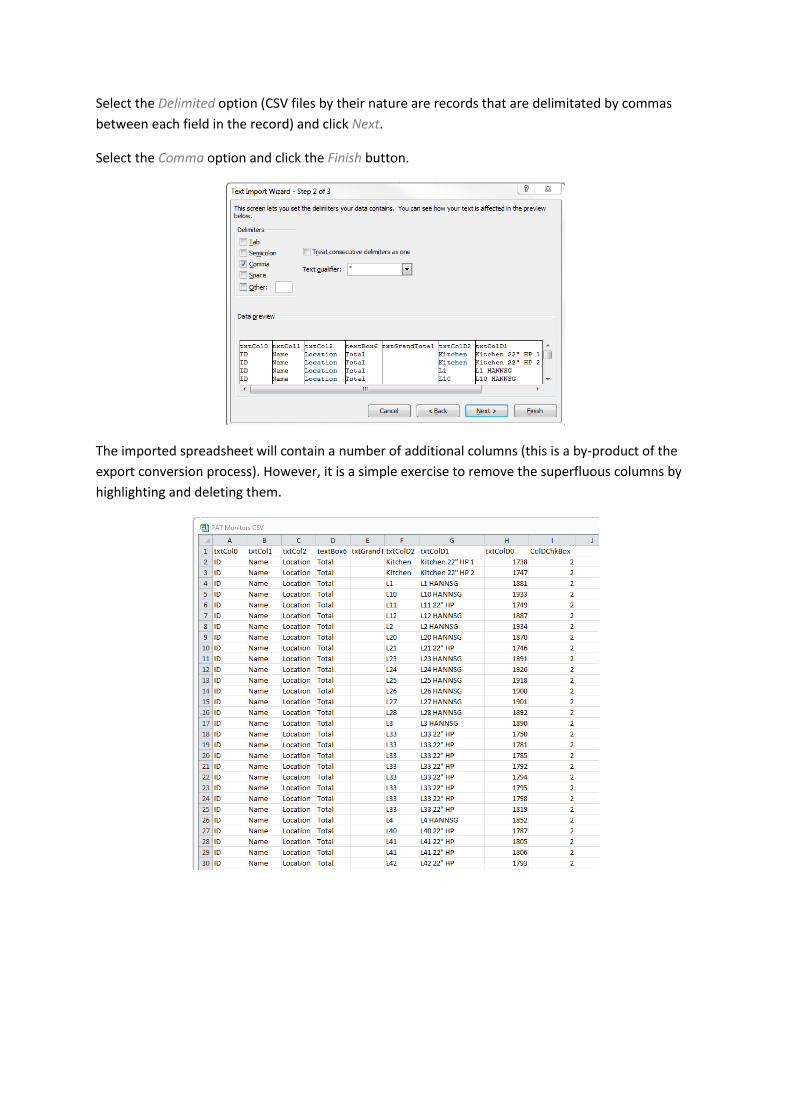
Select the Delimited option (CSV files by their nature are records that are delimitated by commas
between each field in the record) and click Next.
Select the Comma option and click the Finish button.
The imported spreadsheet will contain a number of additional columns (this is a by-product of the
export conversion process). However, it is a simple exercise to remove the superfluous columns by
highlighting and deleting them.
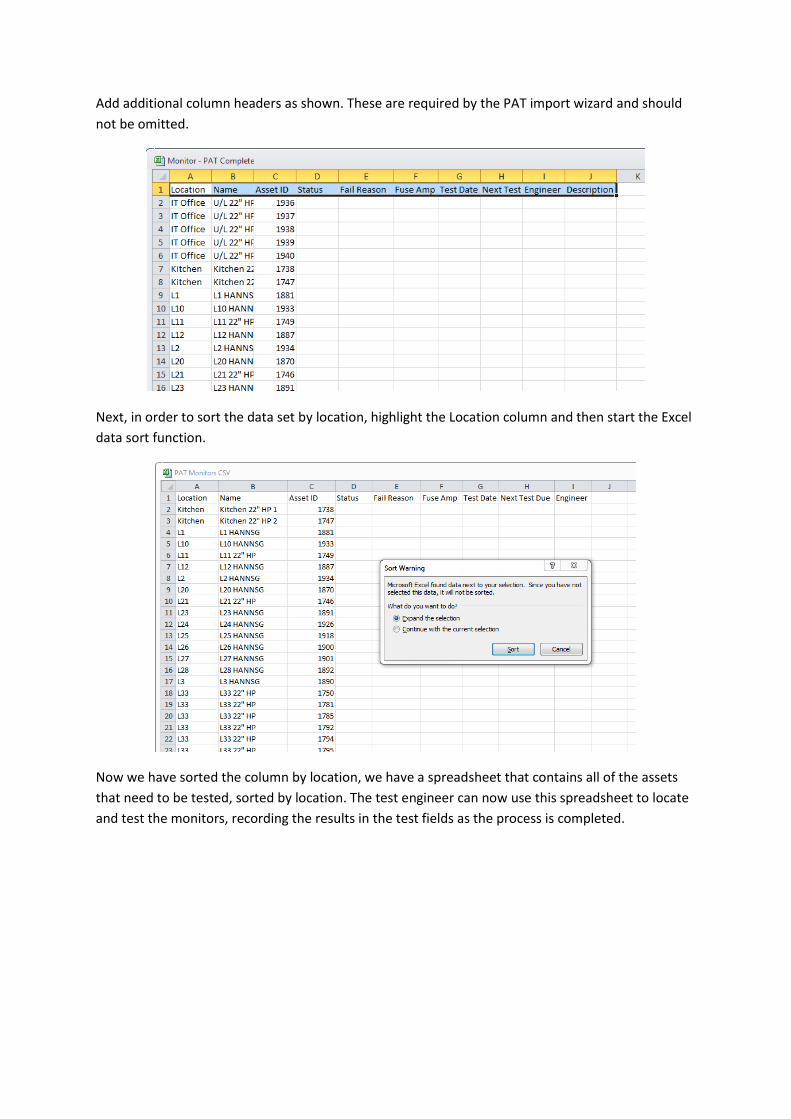
Add additional column headers as shown. These are required by the PAT import wizard and should
not be omitted.
Next, in order to sort the data set by location, highlight the Location column and then start the Excel
data sort function.
Now we have sorted the column by location, we have a spreadsheet that contains all of the assets
that need to be tested, sorted by location. The test engineer can now use this spreadsheet to locate
and test the monitors, recording the results in the test fields as the process is completed.
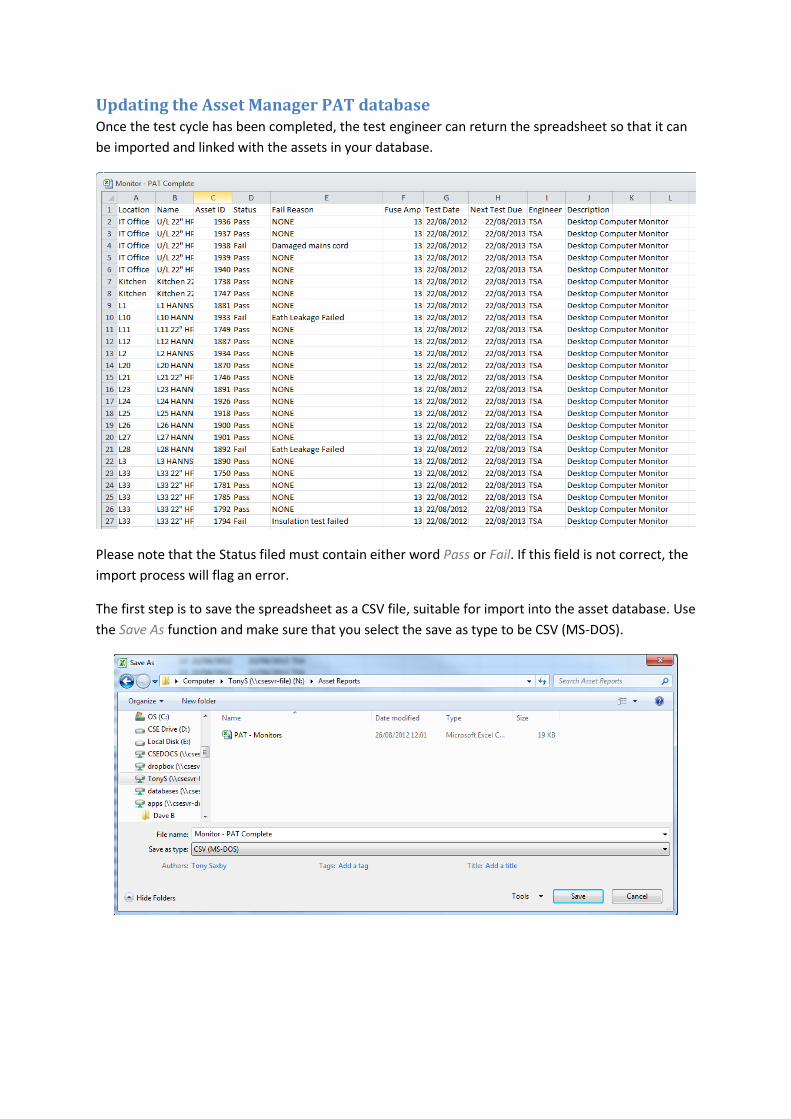
Updating the Asset Manager PAT database Once the test cycle has been completed, the test engineer can return the spreadsheet so that it can
be imported and linked with the assets in your database.
Please note that the Status filed must contain either word Pass or Fail. If this field is not correct, the
import process will flag an error.
The first step is to save the spreadsheet as a CSV file, suitable for import into the asset database. Use
the Save As function and make sure that you select the save as type to be CSV (MS-DOS).
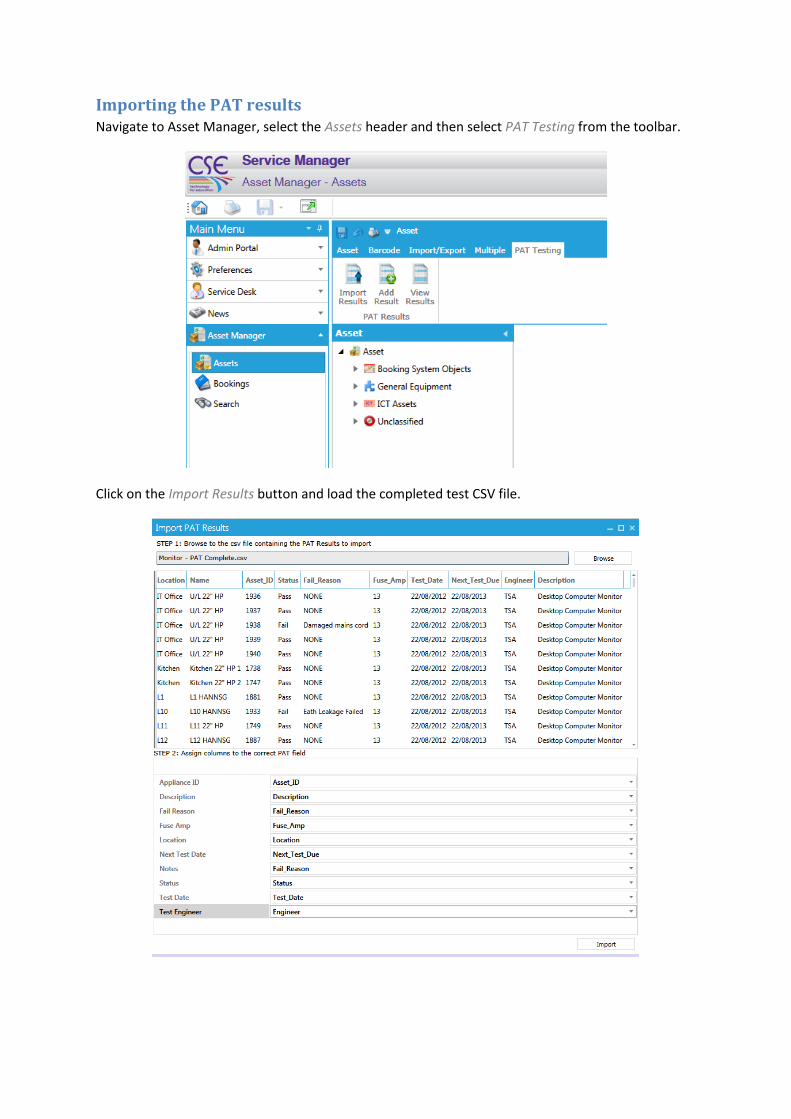
Importing the PAT results Navigate to Asset Manager, select the Assets header and then select PAT Testing from the toolbar.
Click on the Import Results button and load the completed test CSV file.
The final step is to match the columns with the various fields. Do this by selecting the appropriate
column header from the pull-down list box against each field. All fields must be matched with an
appropriate column. To complete the process, click the Import button.
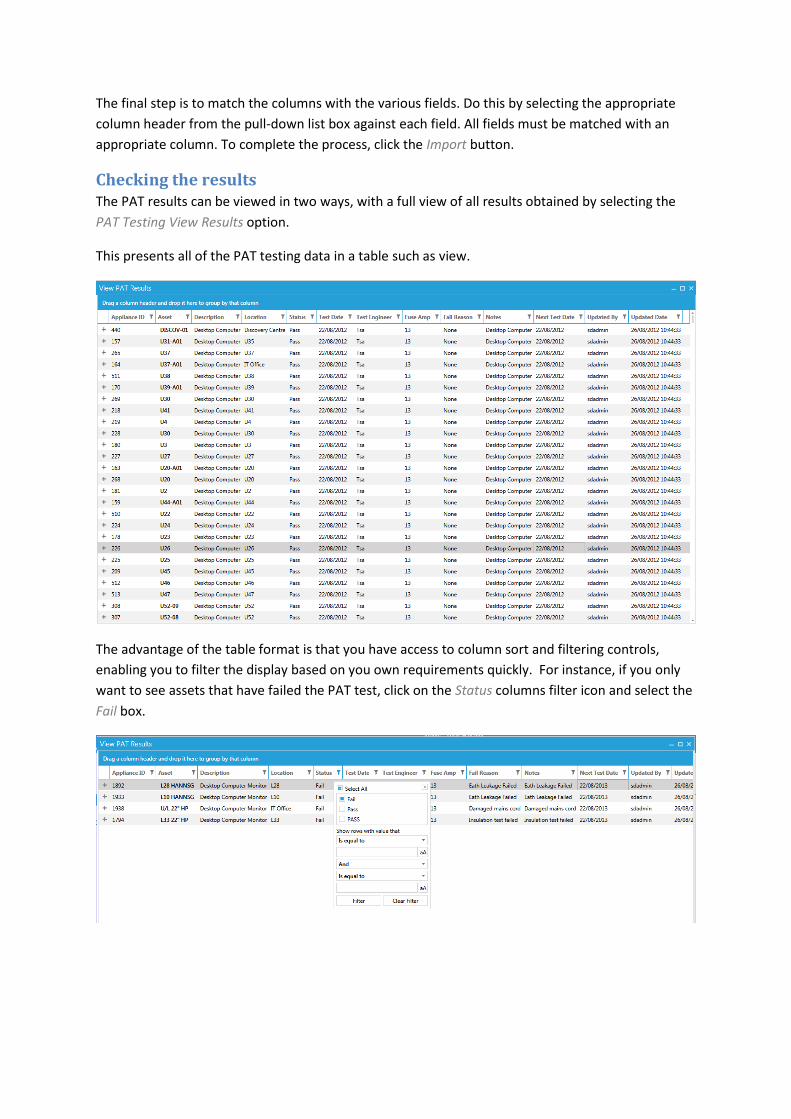
Checking the results The PAT results can be viewed in two ways, with a full view of all results obtained by selecting the
PAT Testing View Results option.
This presents all of the PAT testing data in a table such as view.
The advantage of the table format is that you have access to column sort and filtering controls,
enabling you to filter the display based on you own requirements quickly. For instance, if you only
want to see assets that have failed the PAT test, click on the Status columns filter icon and select the
Fail box.
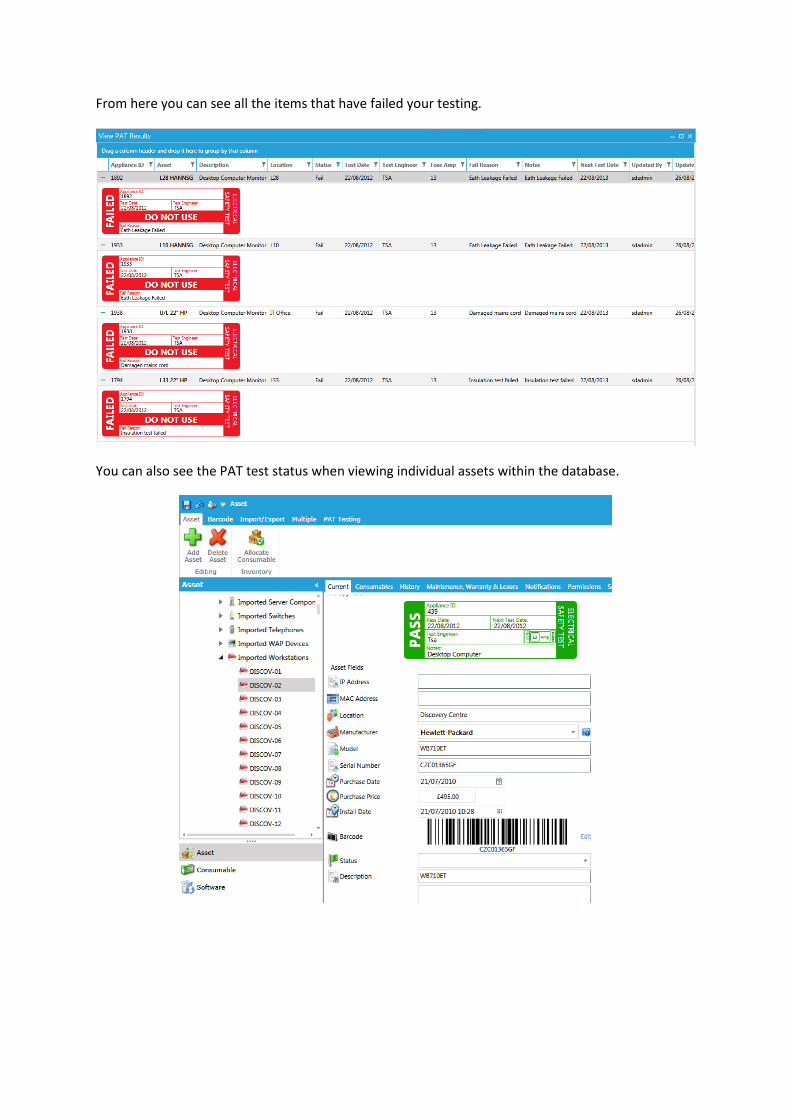
From here you can see all the items that have failed your testing.
You can also see the PAT test status when viewing individual assets within the database.


![[Brian Scaddan] PAT Portable Appliance Testing, S(Bookos.org)](https://static.fdocuments.us/doc/165x107/545d9e67b1af9f370a8b4895/brian-scaddan-pat-portable-appliance-testing-sbookosorg.jpg)