Gaelle Gouarin OECD Trade and Agriculture Food chain network meeting Mobilizing the food chain for...
22
Gaelle Gouarin OECD Trade and Agriculture Food chain network meeting Mobilizing the food chain for health OECD, PARIS, October 25-26 2012 Impacts on the agricultural sector of moving towards a ‘healthy diet’
-
Upload
coleen-norton -
Category
Documents
-
view
215 -
download
0
Transcript of Gaelle Gouarin OECD Trade and Agriculture Food chain network meeting Mobilizing the food chain for...

Gaelle Gouarin OECD Trade and Agriculture
Food chain network meeting Mobilizing the food chain for health
OECD, PARIS, October 25-26 2012
Impacts on the agricultural sector of moving towards a
‘healthy diet’

OECD Trade & Agriculture 2
Impacts of moving towards a ‘healthy diet’
• Measure impact on main agricultural sector aggregates of :
– Scenario 1 : Reduction in total fat consumption following a comprehensive prevention strategy.
– Scenario 2 : WHO dietary guideline target of saturated fat consumption at 10% or less of total calories
• Method: Simulations using the Aglink-Cosimo Model

OECD Trade & Agriculture 3
What is the AGLINK - COSIMO model?
• A partial equilibrium model covering the main agricultural markets (cereals, oilseeds, sugar, meats and dairy commodities), biofuels and fish & seafood
• A recursive-dynamic model (i.e. the market equilibrium in one year includes lagged variables)
• A Policy Specific Model: includes explicitly policy measures, such as import tariffs, tariff rate quotas, subsidies, etc.

OECD Trade & Agriculture 4
AGLINK
endogenous
European Union (15)
Mexico
Japan
European Union (12)
Canada
Australia
USANew ZealandKorea
Argentina Brazil RussiaChina
CHENOR
exogenous
30 countries18 regional aggregates
COSIMO
Aglink-Cosimo country coverage
OECD Trade & Agriculture 5
Decrease in fat consumption following the implementation of a comprehensive prevention strategy
• Reduction in total fat consumption following a comprehensive prevention strategy.

OECD Trade & Agriculture 6
Implementation of a comprehensive prevention strategy : % decrease required in fat consumption
COUNTRIES % decrease on average (2012-2021)
Argentina -0.9
Australia -1.4
Brazil -0.9
Canada -1.2
Chile -0.9
China -0.8
European Union -1.1
India -0.7
Japan -0.8
Korea -0.8
Mexico -1.4
New Zealand -1.4
Russian Federation -0.8
United States -1.4

OECD Trade & Agriculture 7
Scenario 1 results : Impacts on world prices of a comprehensive prevention strategy
2012 2013 2014 2015 2016 2017 2018 2019 2020 2021
-5
-4
-3
-2
-1
0
1
Atlantic beef world price % difference
2012 2013 2014 2015 2016 2017 2018 2019 2020 2021
-4
-3
-2
-1
0
Cheese world price% difference
2012 2013 2014 2015 2016 2017 2018 2019 2020 2021
-3
-2
-1
0
Vegetable oil world price% difference
2012 2013 2014 2015 2016 2017 2018 2019 2020 2021
-3
-2
-1
0
Coarse grains world price% difference

OECD Trade & Agriculture 8
Moving to WHO guidelines for saturated fats ( 10% of total calories)
• Calculate saturated fat consumption in grams for each country(based on FBS-FAO), aglink database and secretariat estimates
• Total Calories taken from national sources and assumptions applied over similar countries
• Select those countries whose consumption of saturated fat >=10 % of total calories

OECD Trade & Agriculture 9
Saturated fats as a share of total calories consumed
CHN MEX ARG RUS BRA USA AUS EU NZL0
2
4
6
8
10
12
14
16
Share of saturated fat in caloric intake

OECD Trade & Agriculture 10
SATURATED FAT REDUCTION needed to meet WHO guidelines
EU NZL AUS USA BRA RUS ARG MEX CHN
-40
-35
-30
-25
-20
-15
-10
-5
0
Reductions to meet 10% calorie intake

OECD Trade & Agriculture 11
Scenario2 results : saturated fat target 10% of total calories
baseline scenario 10% baseline scenario 10 %Consumption Production
0
2000
4000
6000
8000
10000
12000
14000
Bovine consumption and production (kt)
USA
BRA
E27
CHN
OECD Trade & Agriculture 12
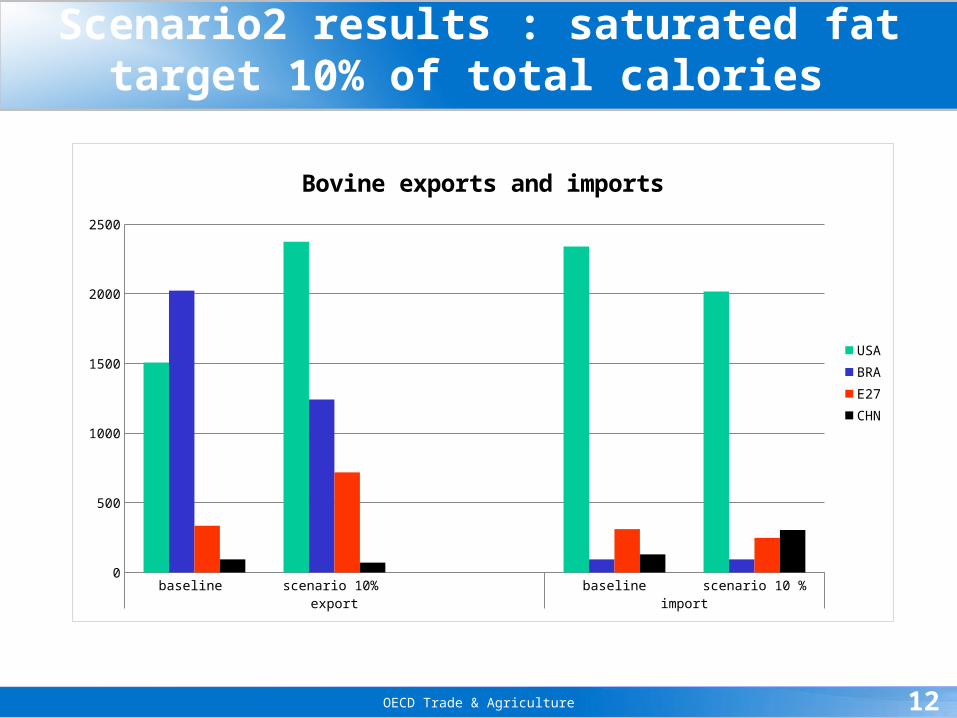
Scenario2 results : saturated fat target 10% of total calories
baseline scenario 10% baseline scenario 10 %export import
0
500
1000
1500
2000
2500
Bovine exports and imports
USA
BRA
E27
CHN

OECD Trade & Agriculture 13
Scenario 2 results : saturated fat target 10% of total calories
2012 2013 2014 2015 2016 2017 2018 2019 2020 20210
1000
2000
3000
4000
5000
6000
Pacific beef and veal price (USD/t)
baseline
scenario
OECD Trade & Agriculture 14
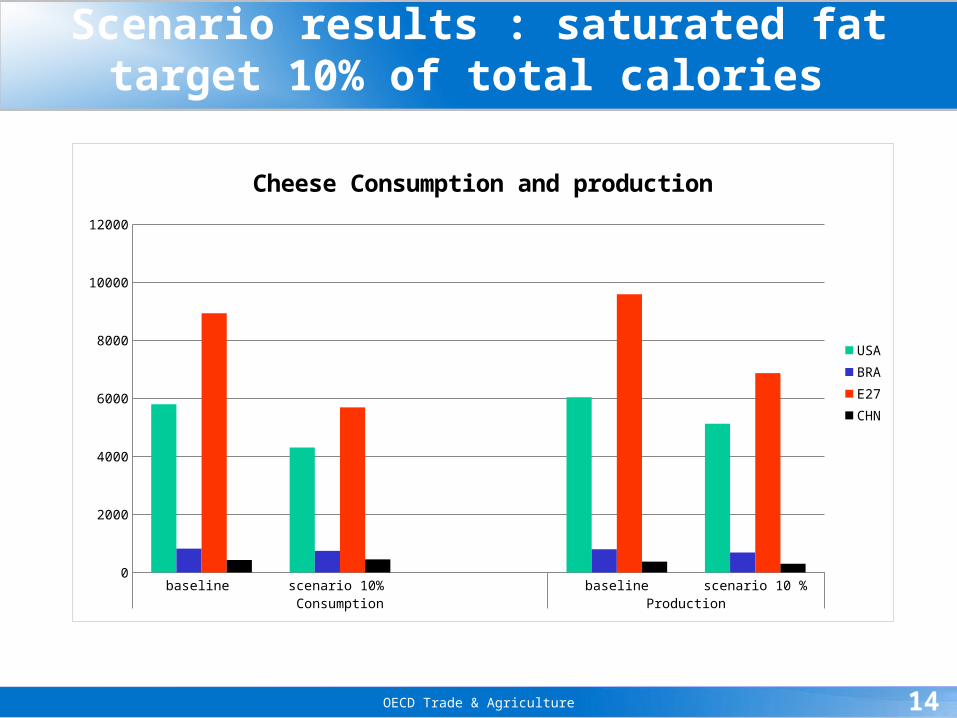
Scenario results : saturated fat target 10% of total calories
baseline scenario 10% baseline scenario 10 %Consumption Production
0
2000
4000
6000
8000
10000
12000
Cheese Consumption and production
USA
BRA
E27
CHN

OECD Trade & Agriculture 15
Scenario2 results : saturated fat target 10% of total calories
baseline scenario 10% baseline scenario 10 %Exports Imports
0
200
400
600
800
1000
1200
1400
Cheese exports and imports (kt)
USA
BRA
E27
CHN

OECD Trade & Agriculture 16
2012 2013 2014 2015 2016 2017 2018 2019 2020 20210
500
1000
1500
2000
2500
3000
3500
4000
4500
5000
Cheese world price USD/t
baseline
scenario

OECD Trade & Agriculture 17
Scenario 2 results : saturated fat target 10% of total calories
baseline scenario 10% baseline scenario 10 %Consumption Production
0
5000
10000
15000
20000
25000
30000
35000
40000
Vegetable oil consumption and production
USA
BRA
E27
CHN

OECD Trade & Agriculture 18
Scenario2 results : saturated fat target 10% of total calories
baseline scenario 10% baseline scenario 10 %exports imports
0
2000
4000
6000
8000
10000
12000
14000
Vegetable oil exports and imports
USA
BRA
E27
CHN

OECD Trade & Agriculture 19
Scenario 2 results : saturated fat target 10% of total calories
2012 2013 2014 2015 2016 2017 2018 2019 2020 2021950
1000
1050
1100
1150
1200
1250
Vegetable oil world price
baseline
scenario

OECD Trade & Agriculture 20
Scenario 2 results : saturated fat target 10% of total calories
baseline scenario 10% baseline scenario 10 %consumption production
0
50000
100000
150000
200000
250000
300000
350000
400000
450000
Coarse grains consumption and production (kt)
USABRAE27CHN

OECD Trade & Agriculture 21
Scenario 2 results : saturated fat target 10% of total calories
2012 2013 2014 2015 2016 2017 2018 2019 2020 2021200
210
220
230
240
250
260
Coarse grains world price USD/t
baselinescenario