FY 2016 Results - Bureau Veritas · Adjusted net profit at €409m, up 3.7% y/y at constant...
57
© Bureau Veritas FY 2016 Results February 24, 2017 2016
Transcript of FY 2016 Results - Bureau Veritas · Adjusted net profit at €409m, up 3.7% y/y at constant...

© B
ure
au V
erita
s
FY 2016 Results February 24, 2017
2016

© B
ure
au V
erita
s
Agenda / FY 2016 Results
Highlights
Financial Review
Business Review
Outlook
Q&A
Appendix

© B
ure
au V
erita
s
Highlights

© B
ure
au V
erita
s
2016 Highlights
Group full-year revenue at €4.55 bn, up 1.4% y/y at constant currency
Slight negative organic growth of (0.6)%, in line with recent guidance Improving trend in Q4 at (0.3)% Growth Initiatives contributing 1.7pts to organic growth China now #1 country of BV: 16% of Group revenue
Adjusted Operating Margin at 16.2% Operational Excellence vs. impact from cyclical markets Adapting cost base: €42.6m of proactive restructuring
Adjusted net profit at €409m, up 3.7% y/y at constant currency
Net income at €319m, up 34.2% at constant currency
High cash conversion ratio with lower FCF due to working cap & specific one-offs
Dividend up 7.8% at 55 cents / share (to be proposed at the AGM of May 16, 2017)
FY 2016 Results February 24, 2017 4

© B
ure
au V
erita
s
-5.0%
0.2%
4.9% 5.8%
1.8%
6.0%
3.2%
Improving trends in Q4 2016
6 out of 8 businesses (representing 72% of group revenue) posted positive organic growth
3 businesses growing at c.+5%
5%
Industry
M&O
GSIT
IVS
Consumer Products
Commodities
Org
an
ic g
row
th
0%
Size of bubbles indicates size of
business
Positive organic growth
Stable / Negative organic growth
Certification
Construction
-10.3% -10%
FY 2016 Results February 24, 2017 5

© B
ure
au V
erita
s
Strengthening of BV’s transformation journey
New
organization
and reporting
Focus on five
Growth
Initiatives
2020 strategy
confirmed
A more compact
Executive Committee
A more agile Group
A cleaner new reporting
Re-assessment of Growth
Initiatives
Mid-term ambition intact
Timing delayed by one
year overall due to cyclical
headwinds in some
activities
FY 2016 Results February 24, 2017 6

© B
ure
au V
erita
s
Financial Review

© B
ure
au V
erita
s
FY 2016 Revenue Growth
FY 2015 Organic* Acquisitions Currencies FY 2016
*Organic growth is the increase in revenue versus last year, at constant currency and scope (i.e. acquisitions excluded)
(0.6)%
+2.0%
(3.2)%
4,549.2 4,634.8
(in € millions)
FY 2016 Results February 24, 2017 8

© B
ure
au V
erita
s
11 Acquisitions in 2016 & YTD
2016: €124m - c3% of annualized
revenue
YTD 2017: c€60m – c1.5% of
annualized revenue
* Closed on Feb. 21 2017
2016 2017
Building & Infrastructure
OPEX O&G/Power/Chem.
Agri-Food
Automotive
Marine & Offshore
SmartWorld
Growth Initiative
HCD
Chongqing Liansheng
Summit
DTS
KMA
VEO
TMC
MAC
UK
China
USA
Australia
Brazil
China
UK
Scotland
€10m
€30m
€13m
€35m
€13m
€8.5m
€8.5m
€6m
Feb.
March
June
April
Dec.
May
May
Nov.
SPM * China €50m Feb.
SIEMIC USA €9.5m Jan.
FY 2016 Results February 24, 2017 9
Certification Italy < €1m June CEPAS

© B
ure
au V
erita
s
FY 2016 revenue growth by business
6.0%
3.8%
3.5%
2.0%
1.0%
(2.2)%
(2.4)%
(9.7)%
(0.6)%
2.7%
2.8%
7.5%
1.6%
0.6%
2.0%
Organic Acquisitions
+4.8%
+8.5%
+6.1%
+6.5%
+3.5%
(0.6)%
(9.1)%
8%
% revenue
14%
13%
18%
13%
9%
5%
20%
(2.4)%
@ constant currencies
+1.4% 100%
5.7%
XX% X%
XX%
XX% Construction
Consumer Products
Certification
GSIT
Industry
Total Group
IVS
Commodities
M&O
2/3rd of businesses
growing organically
1/3rd of
businesses
declining
organically
FY 2016 Results February 24, 2017 10

© B
ure
au V
erita
s
4,635
(70)
(20) (20)
80*
95 (150)
4,549
FY 2015 O&G capex M&Mupstream,
GSIT
Base business GrowthInitiatives
Acquisitions Currency FY 2016
V2
FY 2016: overview of BV 2020 Growth Initiatives
*€89m excluding Marine & Offshore, +1.9-point contribution to organic growth
(in € millions)
Businesses facing a down
cycle (1.9)pts
Growth initiatives
+1.7pts* organic
FY 2016 Results February 24, 2017 11

© B
ure
au V
erita
s
FY 2016 key financial metrics
FY 2016 FY 2015 y/y y/y at constant
currency
Revenue 4,549.2 4,634.8 -1.8% +1.4%
Adjusted operating profit * 734.9 775.2 (5.2)% (0.7)%
Adjusted operating margin * 16.2% 16.7% (55)bp (35)bp
Operating profit 609.7 576.9 +5.7% +10.9%
Adjusted net profit 409.0 420.3 (2.7)% +3.7%
Net profit 319.4 255.3 +25.1% +34.2%
Adjusted EPS 0.94 0.96 (2.1)% +3.8%
Operating cash flow 594.4 706.1 (15.8)% (14.4)%
Free cash flow 362.5 462.1 (21.6)% (20.1)%
Adjusted net debt 1,996.4 1,862.7 7.2% 5.8%
Adjusted operating
margin down 25 bp
organically, flat
excluding GSIT
Adjusted EPS up 3.8% at
constant currency (€1.0)
* Adjusted operating profit and adjusted net profit exclude amortization of acquisition intangibles, goodwill impairment, restructuring, acquisition
and disposal-related items
FY 2016 Results February 24, 2017 12

© B
ure
au V
erita
s
Adjusted operating margin
FY 2016 y/y (bp)
Organic
group
impact (bp)
Commodities 12.1% +70 +10
Construction 16.0% +60 +10
Certification 17.1% - +5
IVS 13.8% - -
Marine & Offshore 25.3% (110) -
Consumer Products 24.6% (110) (10)
Industry 13.1% (120) (20)
GSIT 9.9% (660) (25)
Total Group 16.2% (55)
16.7%
-25 bps -10 bps
-20 bps
16.2%
FY 2015 Organic* Underlyingmargin
Acquisitions Currencies FY 2016
ADJUSTED OPERATING MARGIN EVOLUTION Y/Y ADJUSTED OPERATING MARGIN BY BUSINESS
Group adjusted operating margins flat y/y excluding GSIT
shortfall
16.5%
FY 2016 Results February 24, 2017 13

© B
ure
au V
erita
s
Non-recurring items
(in € millions)
FY 2016 FY 2015 y/y
Adjusted operating profit 734.9 775.2 -40.3
Amortization of intangibles (79.5) (86.7) +7.2
Restructuring (42.6) (20.8) -21.8
Acquisitions and disposals (3.1) (0.8) -2.3
Goodwill impairment - (90.0) +90.0
Operating profit 609.7 576.9 +32.8
FY 2016 includes €9.6m
of accelerated
amortization of
Customer relationships
in the Americas
Higher restructuring
primarily focused on
declining businesses
No goodwill impairment
FY 2016 Results February 24, 2017 14

© B
ure
au V
erita
s
Net financial expenses
(in € millions)
FY 2016 FY 2015 y/y
Net financial charges (89.9) (80.0) -9.9
Foreign exchange gain/loss +8.7 (3.6) +12.3
Interest charge on pension plans (3.0) (2.8) -0.2
Other financial expenses (2.3) (2.9) +0.6
Net financial expenses (86.5) (89.3) +2.8
Increase of financial
charges due to average
net debt increase on the
anticipated refinancing
of May 2017 bond
FX gains linked to FX
movements in emerging
countries having €/$
denominated assets
FY 2016 Results February 24, 2017 15
© B
ure
au V
erita
s
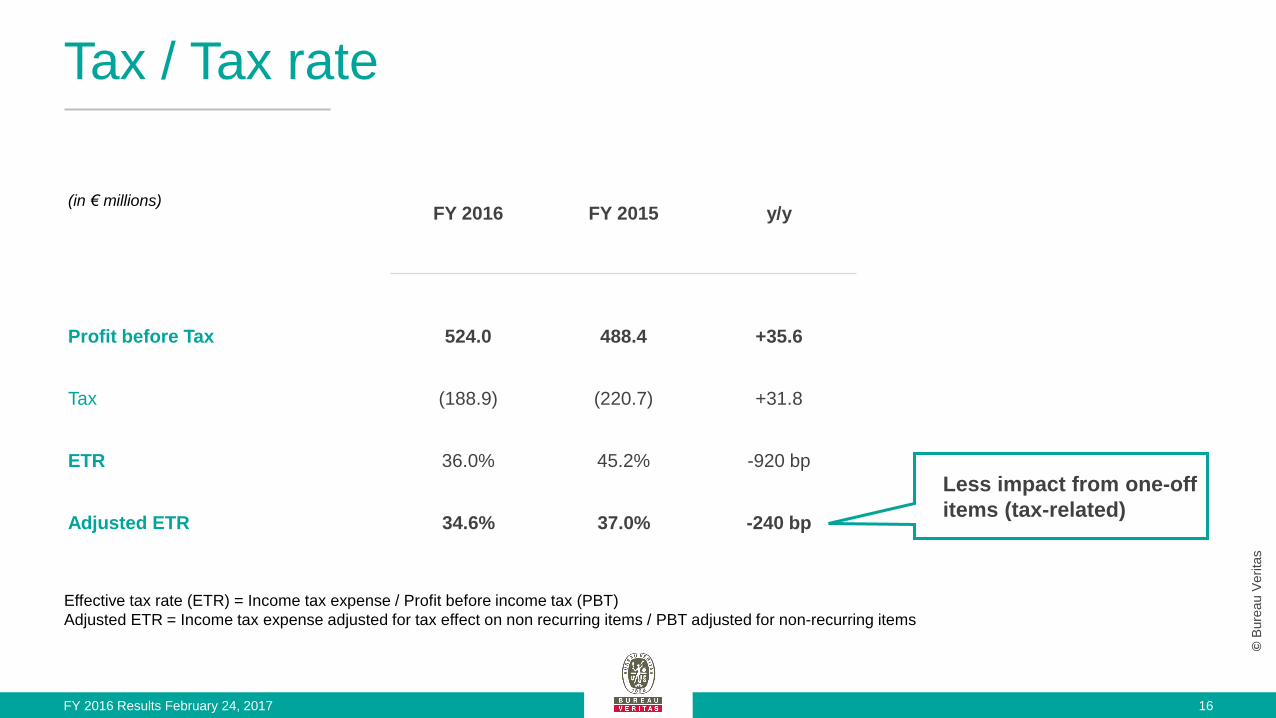
(in € millions)
FY 2016 FY 2015 y/y
Profit before Tax 524.0 488.4 +35.6
Tax (188.9) (220.7) +31.8
ETR 36.0% 45.2% -920 bp
Adjusted ETR 34.6% 37.0% -240 bp
Tax / Tax rate
Effective tax rate (ETR) = Income tax expense / Profit before income tax (PBT)
Adjusted ETR = Income tax expense adjusted for tax effect on non recurring items / PBT adjusted for non-recurring items
Less impact from one-off
items (tax-related)
FY 2016 Results February 24, 2017 16

© B
ure
au V
erita
s
Cash flow statement
(in € millions)
FY 2016 FY 2015 y/y
Profit before income tax 524.0 488.4 +35.6
Elimination of financing and investing activities 61.1 60.6 +0.5
Provisions and other non-cash items 57.9 46.9 +11.0
Depreciation, amortization and impairment 202.4 293.3 -90.9
Income tax paid (213.8) (231.6) +17.8
Movements in working capital (37.2) 48.5 -85.7
Net cash generated from operating activities 594.4 706.1 -111.7
Net capex (145.9) (165.6) +19.7
% of revenue +3.2% +3.6% -40 bp
Interest paid (86.0) (78.4) -7.6
Free cash flow 362.5 462.1 -99.6
Adjusted for restructuring cash-out and one-off tax items, FCF reaches €405m vs. €472m in 2015 translating into a 99% cash conversion*
*Cash conversion defined as FCF excluding one-offs as a % of Adjusted net profit
Mainly impacted by more
difficult cash collection
for activities in downturn
and change of payment
timing on indirect
taxes/social
contributions in France
Due to above,
restructuring cash-out
and one-off tax items
FY 2016 Results February 24, 2017 17
© B
ure
au V
erita
s
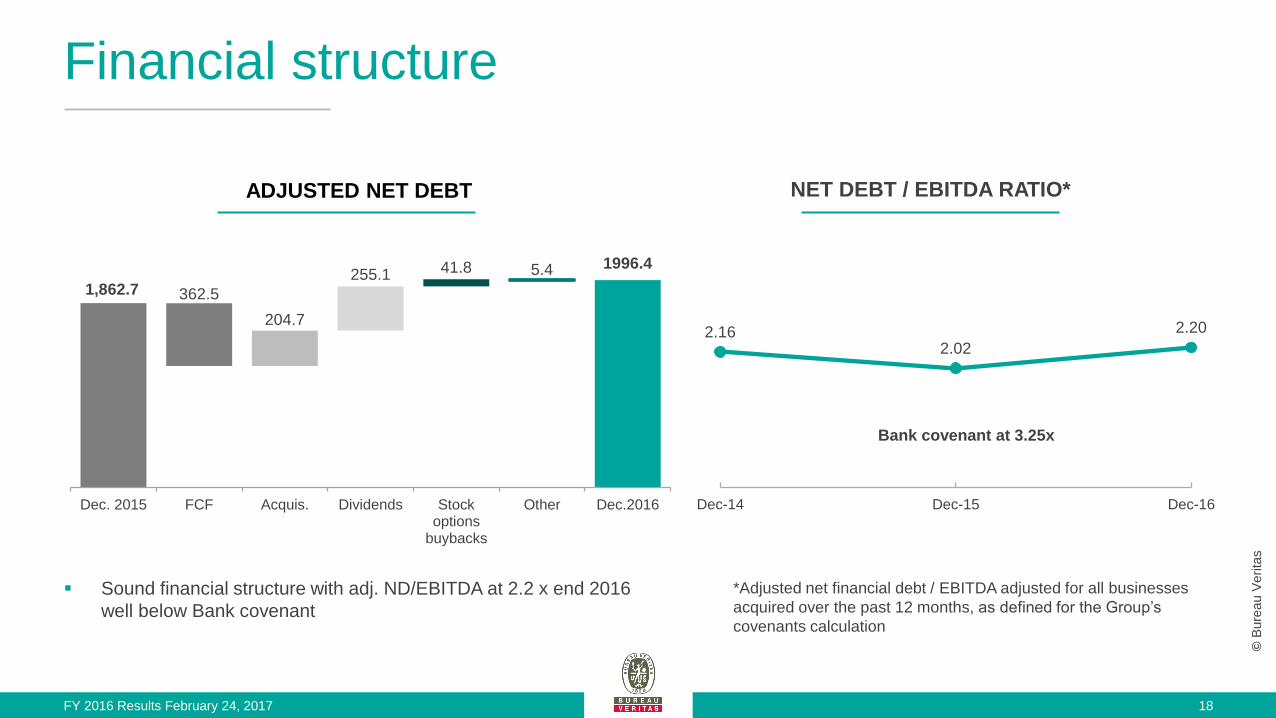
Financial structure
NET DEBT / EBITDA RATIO* ADJUSTED NET DEBT
Sound financial structure with adj. ND/EBITDA at 2.2 x end 2016
well below Bank covenant
*Adjusted net financial debt / EBITDA adjusted for all businesses
acquired over the past 12 months, as defined for the Group’s
covenants calculation
Bank covenant at 3.25x
1,862.7 362.5
204.7
255.1 41.8 5.4 1996.4
Dec. 2015 FCF Acquis. Dividends Stockoptions
buybacks
Other Dec.2016
FY 2016 Results February 24, 2017
2.16 2.02
2.20
Dec-14 Dec-15 Dec-16
18

© B
ure
au V
erita
s
Business Review

2016 HIGHLIGHTS KEY FINANCIALS 2017 MARKET / BV OUTLOOK
2020 STRATEGIC INITIATIVES
© B
ure
au V
erita
s
Marine & Offshore (9% of revenue, 14% of profit)
FY 2016 FY 2015 Var.
Revenue
Organic 391.9 405.3
(3.3)%
(2.2)%
AOP 99.2 107.1 (7.4)%
AOP
margin 25.3% 26.4% (110bp)
Acquisitions:
Opex TMC (salvage)
MAC (Maritime Assurance &
Consulting)
Digital levers:
Digital TWIN (DS partnership)
Connected surveyors app
Excellence @ BV
Workforce alignment
New construction down cycle
Core In-Service: Fleet up YTD in GT vs.
surge in vessels put into lay-up
Services: double-digit decline in Offshore
Order book of 13.6 (GRTm) year-end
Margin impacted by FX and scope
New construction under pressure
New orders down c.70% y/y
Most impacted ship categories: Bulk, Container
Passenger ship supportive
In-service: classed fleet up low single digit
New positive regulations: Water Ballast, MRV, IHM
41%
42%
17% New Construction
Core In-Service
Services (incl.Offshore)
FY 2016 Results February 24, 2017 20

© B
ure
au V
erita
s
BV’S OVERALL STRONG RESILIENCE
THROUGH THE CYCLE
0
50
100
150
200
250
300
350
400
450
500
2007 2008 2009 2010 2011 2012 2013 2014 2015 2016
In-service revenue
New construction revenue
Adjusted EBITA
59%
Marine & Offshore: market downturn
BV MARINE BUSINESS RECENTLY HIT BY THE
DOWNTURN IN SHIPPING
New ship orders (GT, market) down c80% from 2013
levels
BV new orders down c75% from 2013 levels
Source: Clarkson data, IHS, BV
BV
-20%
0%
20%
40%
0
20
40
60
80
100
120
140
160
180
2007 2008 2009 2010 2011 2012 2013 2014 2015 2016
New ship orders (GT, market) lhs
BV Marine OG
BV New construction OG
Increased the resilient in-service business over time to
c60% from c45% ten years ago
Limited scrapping and high customer loyalty
(€ m)
43% 43% 47% 46% 51%
57%
60%
57% 48%
(mGT)
FY 2016 Results February 24, 2017 21

2016 HIGHLIGHTS KEY FINANCIALS 2017 MARKET / BV OUTLOOK
2020 STRATEGIC INITIATIVES
© B
ure
au V
erita
s
IVS (13% of revenue, 11% of profit)
FY 2016 FY 2015 Var.
Revenue
Organic 602.5 598.4
0.7%
3.5%
AOP 82.9 82.7 0.2%
AOP
margin 13.8% 13.8% -
Opex +6%
Building & Infrastructure +4%
organic growth in 2016
Commercial wins:
Nike, SNCF
Digital levers:
‘BV regulatory watch’ services
Digital platform Building in One
Excellence @ BV
Automated on site offering
Robust growth
Low single-digit growth in Western
Europe o/w France (weak Q4 on comps)
High single digit growth in Americas
(Latam and US)
Underlying margin slightly up
Sustain solid growth trends expected on:
Large contract wins (Europe)
New services
26%
2% 67%
5% Americas
Asia-Pacific
Europe
EE, ME, Africa
o/w 44% France
FY 2016 Results February 24, 2017 22

2016 HIGHLIGHTS KEY FINANCIALS 2017 MARKET / BV OUTLOOK
2020 STRATEGIC INITIATIVES
© B
ure
au V
erita
s
Construction (13% of revenue, 13% of profit)
FY 2016 FY 2015 Var.
Revenue
Organic 592.8 552.2
7.4%
1.0%
AOP 94.6 85.3 10.9%
AOP
margin 16.0% 15.4% 60bp
+7.5% M&A growth in B&I
in 2016
Acquisitions:
Chongqing Liansheng, Shanghai
Project Management (China),
HCD (UK)
Commercial wins:
Société du Grand Paris, Chinese
EPC
Digital levers:
Drone-based inspection /
Parrot’s partnership
Building Information Modeling
Excellence @ BV
Reengineering process
France pickup delayed
Capex slightly up
Opex down double-digit on challenging comps (regulatory blockbusters)
China negative (O&G), Q4 recovery
Japan dynamic
Latam successful expansion
Margin improved
France recovery: Capex / first impact from the Grand Paris project
Latam good outside Brazil
China infrastructure spend support
US infrastructure potential
11%
42%
6%
32%
9% North America
Europe
Africa, ME & EE
Asia-Pacific
Latam
o/w 37%
France
FY 2016 Results February 24, 2017 23

2016 HIGHLIGHTS KEY FINANCIALS 2017 MARKET / BV OUTLOOK
2020 STRATEGIC INITIATIVES
© B
ure
au V
erita
s
Industry (20% of revenue, 16% of profit)
FY 2016 FY 2015 Var.
Revenue
Organic 900.7 1,046.7
(13.9)%
(9.7)%
AOP 118.0 149.4 (21.0)%
AOP
margin 13.1% 14.3% (120bp)
25%
22%
14%
11%
6%
5% 3%
14% Oil & Gas capex
Oil & Gas opex
Power & Utilities
Manufacturing
Construction
Transportation
Chemicals
Other
Acquisition:
Summit (Opex chemicals)
Commercial wins:
Exxon (Opex), Shell (Opex)
Large Gas co. in Latam
Digital levers:
Asset management via 3D
modeling systems
Excellence @ BV
US shop inspection back office
transferred to SSC in India
Oil & Gas Capex decline: -20%
Americas, Australia: strong double-digit capex-related decline
Middle East growth
Price pressure in O&G Opex offset by
volume increase
Contract wins
Nuclear: Argentina contract ending
Margin primarily impacted by O&G
Oil & Gas Capex: NOC / Majors not resuming / tail end of large contracts
Oil & Gas Opex: volume (+), Price (-)
Power: (+) / new wins vs contract ending
Nuclear: post Fukushima regulation in France
Opex diversification gradually paying off
+5% OPEX O&G
+8% OPEX P&U
organic growth in 2016
FY 2016 Results February 24, 2017 24

© B
ure
au V
erita
s
Industry: drag from O&G capex but reaching a low point
CAPEX OIL MAJORS VS BV
INDUSTRY ORGANIC GROWTH
BV PEAK TO 2016 REVENUE FROM
TOP 25 CLIENTS IN OIL & GAS
(BY TYPE OF CLIENTS)
BV POWER & UTILITIES + O&G:
FOCUS ON OPEX
-20%
-15%
-10%
-5%
0%
5%
10%
15%
(15%)
(10%)
(5%)
0%
5%
10%
15%
20%
2011 2012 2013 2014 2015 2016 2017E 2018E
BV Industry services organic growth (LHS)
Majors capex (2yr average)
Source: Datastream, IHS, BV
Oil Majors capex from peak (2013) to
2016: -c40% on a cumulated basis
BV O&G capex down c35% from
peak
OPEX CAPEX
47%
53%
52%
48%
2016
2015
+5pts
O&G Top 25 clients (c10% of Group
revenue): decrease c75m€ over last 2
years (impact -1.6%)
Major Oil Co
IOC
NOC Latam
NOC Asia NOC ME
0.9
9
-60% -40% -20% 0% 20%
2. Source: BV
FY 2016 Results February 24, 2017 25
2016 HIGHLIGHTS KEY FINANCIALS 2017 MARKET / BV OUTLOOK
2020 STRATEGIC INITIATIVES
© B
ure
au V
erita
s
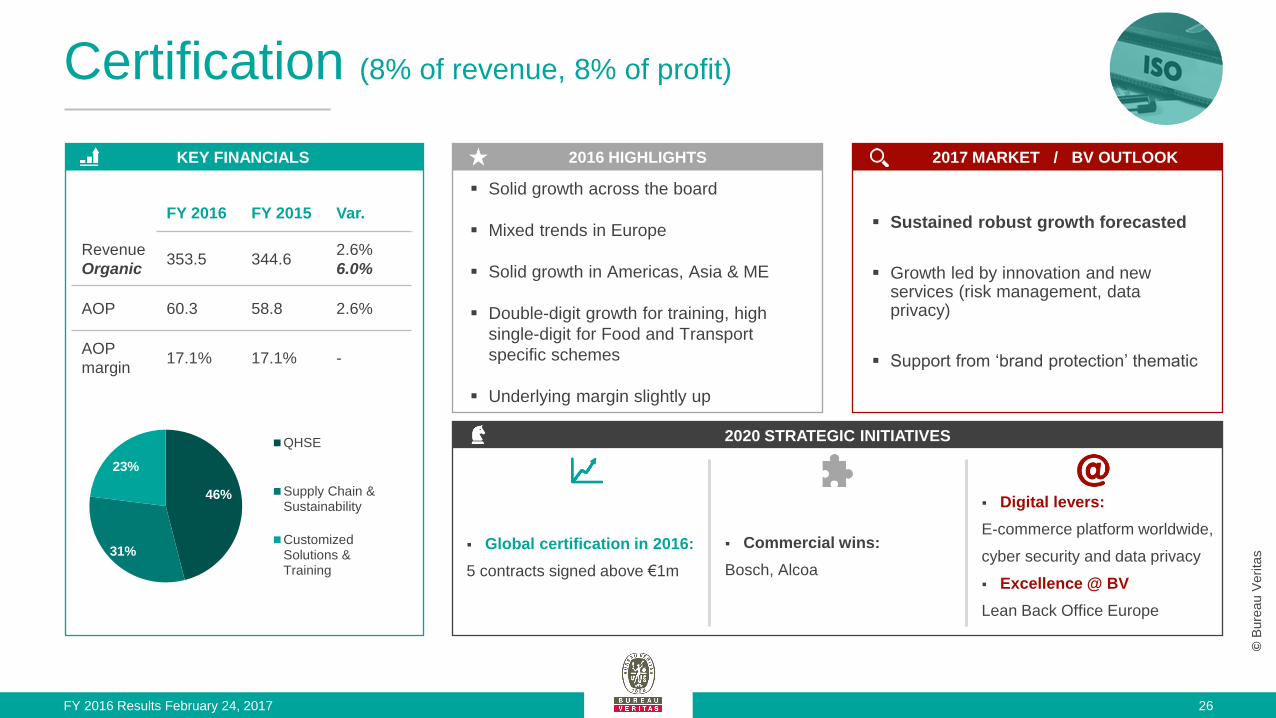
Certification (8% of revenue, 8% of profit)
FY 2016 FY 2015 Var.
Revenue
Organic 353.5 344.6
2.6%
6.0%
AOP 60.3 58.8 2.6%
AOP
margin 17.1% 17.1% -
Global certification in 2016:
5 contracts signed above €1m
Commercial wins:
Bosch, Alcoa
Digital levers:
E-commerce platform worldwide,
cyber security and data privacy
Excellence @ BV
Lean Back Office Europe
Solid growth across the board
Mixed trends in Europe
Solid growth in Americas, Asia & ME
Double-digit growth for training, high
single-digit for Food and Transport
specific schemes
Underlying margin slightly up
Sustained robust growth forecasted
Growth led by innovation and new services (risk management, data privacy)
Support from ‘brand protection’ thematic
46%
31%
23%
QHSE
Supply Chain &Sustainability
CustomizedSolutions &Training
FY 2016 Results February 24, 2017 26

2016 HIGHLIGHTS KEY FINANCIALS 2017 MARKET / BV OUTLOOK
2020 STRATEGIC INITIATIVES
© B
ure
au V
erita
s
Consumer Products (14% of revenue, 21% of profit)
FY 2016 FY 2015 Var.
Revenue
Organic 629.9 603.2
4.4%
3.8%
AOP 155.1 154.9 0.1%
AOP
margin 24.6% 25.7% (110bp)
+c.6% SmartWorld
despite the E&E contract
reduction
+c.25% Automotive
In 2016
Acquisition:
VEO (auto / China),
Lab opening in Shanghai
Commercial wins:
Tesco (UK)
Digital levers:
Connected cars (7layers)
One Source tools for data
analysis
Excellence @ BV
Lean deployed on acquisitions
Improving trends through the year with
H2 growing mid-single digit, impact of 2
key accounts annualized
High single-digit growth in Softlines
(primarily Asia led)
E&E back to mid single-digit growth
Margin decline on business mix & FX
Robust growth expected
Challenging (price) environment with retailers ; mature toys segment
Easier comps in H1 for E&E
Expansion in strategic markets (auto, domestic China)
SmartWorld support
37%
32%
31%
Softlines
Hardlines, Toys,Audits
Electrical &Electronics
FY 2016 Results February 24, 2017 27
2016 HIGHLIGHTS KEY FINANCIALS 2017 MARKET / BV OUTLOOK
2020 STRATEGIC INITIATIVES
© B
ure
au V
erita
s
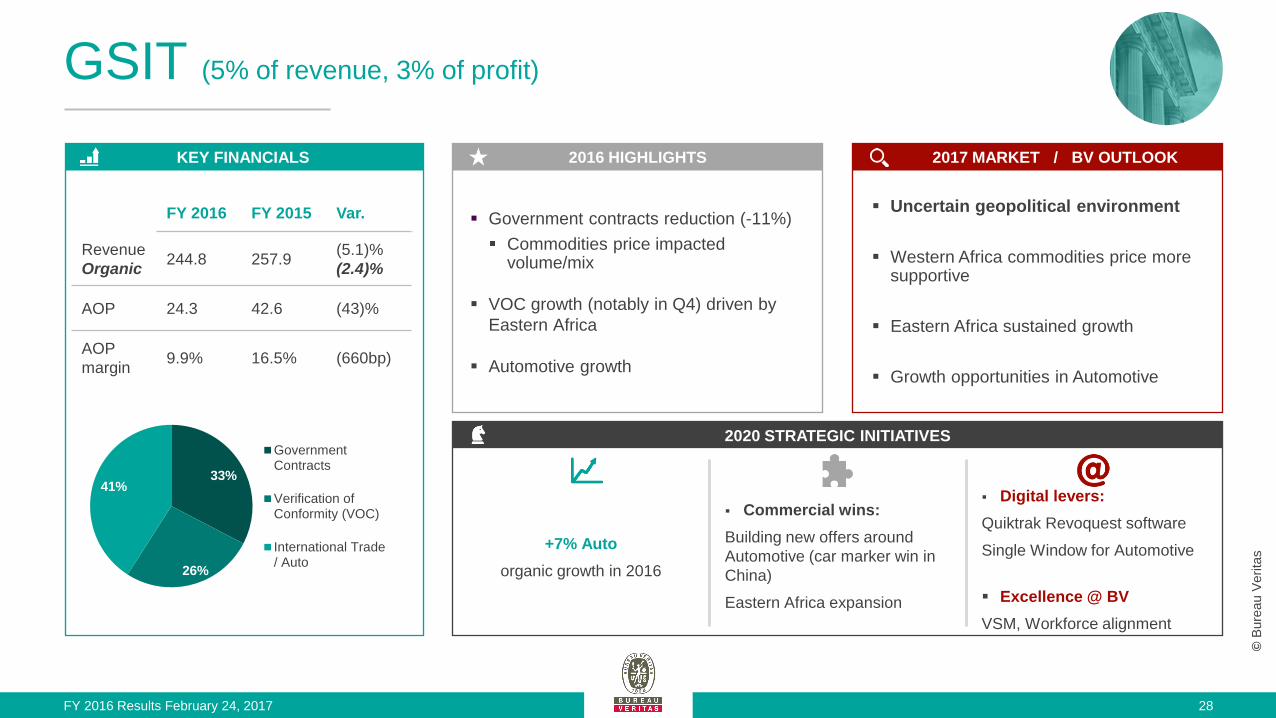
GSIT (5% of revenue, 3% of profit)
FY 2016 FY 2015 Var.
Revenue
Organic 244.8 257.9
(5.1)%
(2.4)%
AOP 24.3 42.6 (43)%
AOP
margin 9.9% 16.5% (660bp)
+7% Auto
organic growth in 2016
Commercial wins:
Building new offers around
Automotive (car marker win in
China)
Eastern Africa expansion
Digital levers:
Quiktrak Revoquest software
Single Window for Automotive
Excellence @ BV
VSM, Workforce alignment
Government contracts reduction (-11%)
Commodities price impacted volume/mix
VOC growth (notably in Q4) driven by
Eastern Africa
Automotive growth
Uncertain geopolitical environment
Western Africa commodities price more supportive
Eastern Africa sustained growth
Growth opportunities in Automotive
33%
26%
41%
GovernmentContracts
Verification ofConformity (VOC)
International Trade/ Auto
FY 2016 Results February 24, 2017 28

2016 HIGHLIGHTS KEY FINANCIALS 2017 MARKET / BV OUTLOOK
2020 STRATEGIC INITIATIVES
© B
ure
au V
erita
s
Commodities (18% of revenue, 14% of profit)
FY 2016 FY 2015 Var.
Revenue
Organic 833.1 826.5
0.8%
2.0%
AOP 100.5 94.4 6.5%
AOP
margin 12.1% 11.4% 70bp
Agri-Food +10% = fastest
growing sector of portfolio
in 2016
Acquisitions:
DTS in Australia, KMA in Brazil
Commercial wins:
BHP / Codelco
Digital levers:
SafeSupply / data analytics
Predictive analysis for oil
conditioning monitoring
Excellence @ BV
VSM Maxxam
O&P market outperformance (+3.1%)*
M&M upstream recovery starting H2
(+3.7%)
M&M trade slow growth (price pressure
and mix)
Agri-food double-digit growth
Margin up on M&M recovery
Growth across the board
M&M recovery supported by commodities prices
O&P market share gains, new services, new locations against challenging comps
Agri slower growth (comps)
49%
33%
18% Oil &Petrochemicals
Metals & Minerals
Agri-Food
* +4.8% organic excluding Upstream O&G
FY 2016 Results February 24, 2017 29

© B
ure
au V
erita
s
Commodities: back to healthier dynamics
BV M&M UPSTREAM VS MINING
MAJORS CAPEX
AGRI-FOOD: BV GROWING
EXPOSURE TO A GROWING MARKET
O&P GLOBAL TRADE
PLATFORM
M&M Majors Capex investment dropped by 60%
from peak
Low point reached in 2016
Source: M&M Majors Capex spend,
EBNPP based on 17 companies, BV
-50%
-25%
0%
25%
50%
0
25
50
75
100
2012 2013 2014 2015 2016 2017e
M&M Major Capex spend (€bn)
M&M Major Capex growth (RHS)
BV M&M upstream OG
BV
0
25
50
75
100
125
150
175
200
0%
5%
10%
15%
20%
25%
2011 2012 2013 2014 2015 2016
Food Revenue in €m (RHS)
BV organic growth
Market organic growth
0
100
200
300
400
2011 2012 2013 2014 2015 2016
4.8%
7.3%
14.3%
14.1%
7.3%
Organic Growth
O&P Trade Revenue
%
Consistent growth outperformance for BV’s Oil
& Petrochemicals trade-related business
Source: BV, 2016 pro forma revenue (including DTS)
Source: BV
FY 2016 Results February 24, 2017 30

© B
ure
au V
erita
s
Outlook

© B
ure
au V
erita
s
2017 Outlook
Full-year organic revenue growth expected to be slightly positive, accelerating in second-half
Full-year adjusted operating margin c.16%
Full-year cash flow generation to improve from FY 2016
FY 2016 Results February 24, 2017 32

© B
ure
au V
erita
s
Leaner Executive Committee with 9 Members to support BV’s 2020 strategic plan
Nomination of a Senior EVP to drive the implementation of BV’s transformation plan
CEO
Strengthening of BV’s transformation
Business Operations
Group Fonctions
New streamlined organization
FY 2016 Results February 24, 2017 33

© B
ure
au V
erita
s
Full reassessment of the Growth Initiatives
After a year through the strategic plan
Based on a more in depth review with market leaders
Factoring in recent market dynamics (oil & gas and Marine down-cycle)
Decision to focus on 5 Growth Initiatives
c30% of Group revenue
Bring additional growth drivers and diversification
Global Certification, Adjacent segments for Retail-Mining and M&O continue to be developed within the base business
Strengthening the transformation of the whole of the portfolio based on BV four levers
Strengthening of BV’s transformation
Global transformation focused on 5 growth initiatives
Building &
Infrastructure
Opex Oil & Gas, Power, Chem.
Agri-Food
Automotive
SmartWorld
Growth Initiative Ambition (Incremental revenue by 2020)
€350 – 400m
€300 – 350m
€250 – 300m
€130 – 150m
€110 – 150m Fo
cu
s o
n 5
Gro
wth
In
itia
tives
FY 2016 Results February 24, 2017 34

© B
ure
au V
erita
s
New segment profit reporting in FY 2017
Alignment of segment profit reporting with organization / strategic plan
From 8 to 6 business 2016 Business
% group
revenue % group AOP AOP margin
Marine & Offshore 9% 14% 25.3%
Agri, Food & Commodities 22% 16% 11.6%
Industry 25% 20% 12.6%
Building & Infrastructure 22% 21% 15.6%
Certification 8% 8% 17.1%
Consumer Products 14% 21% 24.6%
Marine & Offshore
Industry
IVS
Construction
Certification
Commodities
Consumer Products
GSIT
FY 2016 Results February 24, 2017 35

© B
ure
au V
erita
s
Mid-term ambition
The Group’s ambition remains:
Enhancing its growth profile, resilience and profitability in the medium to long term
A focus on 2 countries: USA and China
4 BV levers
Confirmed return to a 5-7% organic revenue growth pace by 2020
Increased Group revenue by c€1.5bn in 2020 vs. 2015*
An adjusted operating margin target above 17% by 2020
Continuous high free cash flow generation
Mid-term ambition intact with timing delayed by one year overall
MARKET POTENTIAL CONFIRMED
Source: BV 2015 Investor Days
* At initial plan exchange rates (as presented during October 2015 Investor Days)
FY 2016 Results February 24, 2017 36

© B
ure
au V
erita
s
Conclusion
Mid-term ambition intact and timing delayed by one year overall TIC market potential intact
Return to 5-7% organic revenue growth by 2020
Adjusted operating margin target above 17% by 2020
3
2
1
Strengthening the Group transformation to execute BV 2020 plan New management organization and reporting
Focus on 5 Growth Initiatives
FY 2016 Results February 24, 2017 37
2017: slightly positive organic revenue growth expected Stabilization in the commodities divisions
Ramp-up of the Growth Initiatives
Acceleration in the second-half

© B
ure
au V
erita
s
Q&A

© B
ure
au V
erita
s
Appendix
© B
ure
au V
erita
s
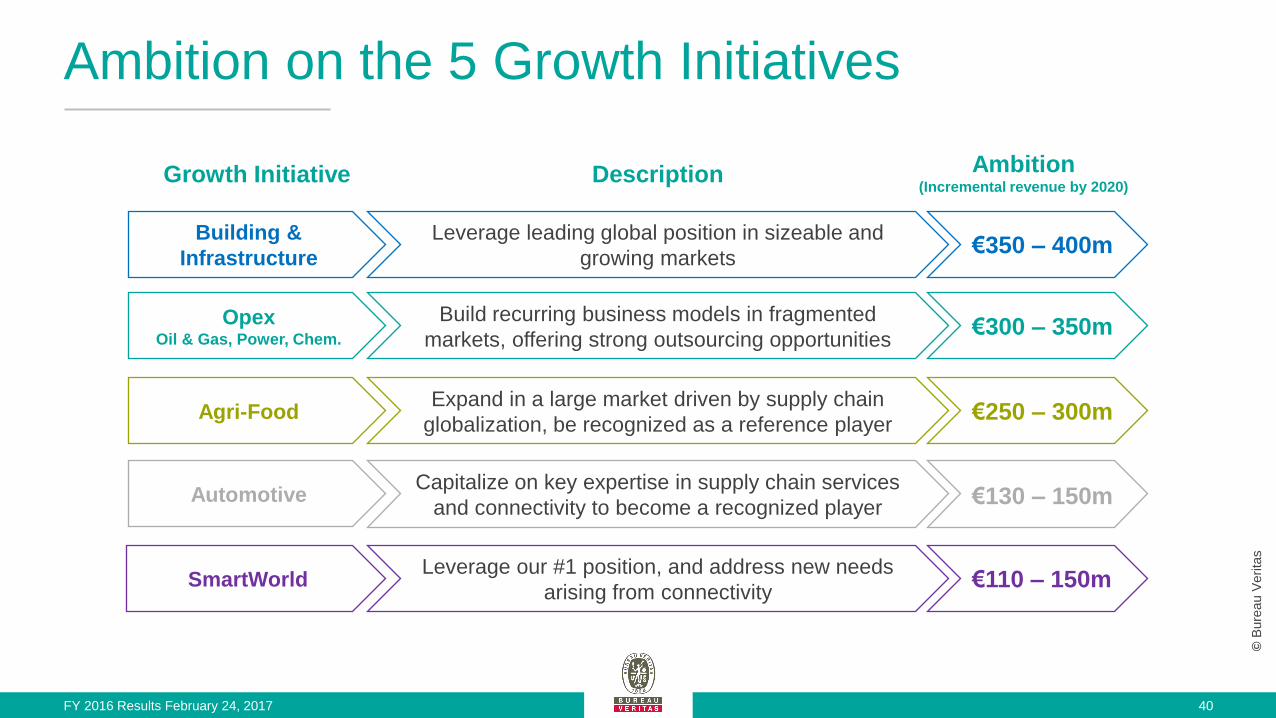
Ambition on the 5 Growth Initiatives
Building &
Infrastructure
Leverage leading global position in sizeable and
growing markets
Opex Oil & Gas, Power, Chem.
Agri-Food
Automotive
SmartWorld
Build recurring business models in fragmented
markets, offering strong outsourcing opportunities
Expand in a large market driven by supply chain
globalization, be recognized as a reference player
Capitalize on key expertise in supply chain services
and connectivity to become a recognized player
Leverage our #1 position, and address new needs
arising from connectivity
Growth Initiative Description Ambition (Incremental revenue by 2020)
€350 – 400m
€300 – 350m
€250 – 300m
€130 – 150m
€110 – 150m
FY 2016 Results February 24, 2017 40

© B
ure
au V
erita
s
Digital@BV – a business ambition
MARKET DIFFERENTIATOR (win rate)
CLIENT RETENTION (attrition)
NEW BUSINESS (additional OP)
Order BV’s services through eCommerce
platforms
http://lead.bureauveritas.com
Building in One: B&I related platform
http://www.building-in-one.com
Creation of a new label regarding data
privacy
http://www.move-forward-with-privacy.bureauveritas.com/en/
SafeOps: digital support to food retailers
http://www.bureauveritas.com/home/safeops
4 AXIS TO CAPTURE THE FULL
BV AMBITIONS IN DIGITAL 3 KPIs MONITORED FOR SUCCESS
Digital is one of the 4
levers of BV 2020
Strategic Plan…
…already translated
into concrete actions
FY 2016 Results February 24, 2017 41

© B
ure
au V
erita
s
Q4 2016 revenue Growth
Q4 2015 Organic* Acquisitions Currencies Q4 2016
1,173.1
(0.3)%
+2.6%
(0.7)%
1,191.4
*Organic growth is the increase in revenue versus last year, at constant currency and scope (i.e. acquisitions excluded)
(in € millions)
FY 2016 Results February 24, 2017 42

© B
ure
au V
erita
s
Q4 2016 Revenue Growth by Business
4.9%
3.2%
1.8%
0.2%
(5.0)%
(10.3)%
0.1%
7.7%
4.9%
1.7%
1.4%
Organic Acquisitions2.6% (0.3)%
+3.2%
+6.7%
+9.1%
+5.9%
+12.6%
+0.2%
(8.9)%
14%
% revenue
9%
13%
5%
18%
14%
8%
19%
(3.3)%
@ constant currencies
+2.3% 100%
6.0%
5.8%
XX% X%
XX%
XX%
1.2%
Commodities
Certification
Consumer Products
Marine & Offshore
Industry
Total Group
Construction
GSIT
IVS
3.1%
FY 2016 Results February 24, 2017 43

© B
ure
au V
erita
s
Revenue by business
Q4 2016
€m Organic Scope FX
Marine & Offshore 96.1 (5.0)% 1.7% (2.0)%
Industry 226.2 (10.3)% 1.4% (0.5)%
IVS 162.5 0.2% - (2.0)%
Construction 159.6 4.9% 7.7% 1.1%
Certification 100.5 5.8% 0.1% (2.2)%
Commodities 219.1 1.8% 4.9% (0.7)%
Consumer products 164.0 6.0% 3.1% (0.7)%
GSIT 63.4 3.2% - 0.2%
Total Group 1,191.4 (0.3)% 2.6% (0.7)%
FY 2016
€m Organic Scope FX
391.9 (2.2)% 1.6% (2.7)%
900.7 (9.7)% 0.6% (4.8)%
602.5 3.5% - (2.8)%
592.8 1.0% 7.5% (1.1)%
353.5 6.0% 0.1% (3.5)%
833.1 2.0% 2.8% (4.0)%
629.9 3.8% 2.7% (2.1)%
244.8 (2.4)% - (2.7)%
4,549.2 (0.6)% 2.0% (3.2)%
FY 2016 Results February 24, 2017 44

© B
ure
au V
erita
s
Adjusted operating profit by business
Adjusted operating profit (€m)
FY 2016 FY 2015 Var. (%)
Marine & Offshore 99.2 107.1 (7.4)%
Industry 118.0 149.4 (21.0)%
IVS 82.9 82.7 0.2%
Construction 94.6 85.3 10.9%
Certification 60.3 58.8 2.6%
Commodities 100.5 94.4 6.5%
Consumer products 155.1 154.9 0.1%
GSIT 24.3 42.6 (43.0)%
Total Group 734.9 775.2 (5.2)%
Adjusted operating margin (%)
FY 2016 FY 2015 Var. (bp)
25.3% 26.4% (110)
13.1% 14.3% (120)
13.8% 13.8% -
16.0% 15.4% +60
17.1% 17.1% -
12.1% 11.4% +70
24.6% 25.7% (110)
9.9% 16.5% (660)
16.2% 16.7% (55)
FY 2016 Results February 24, 2017 45

© B
ure
au V
erita
s
2016 revenue by main currencies
CURRENCY CHANGE Y/Y 2016 REVENUE BY CURRENCY
EURO 29%
USD (and pegged)
19% CNY 10%
CAD 4%
GBP 4%
AUD 4%
BRL 3%
CLP 3%
JPY 2%
SGD 2%
KRW 2%
TWD 2% INR 2%
ARS 1% COP 1%
TRY 1%
OTHER 11%
-9.7%
-9.5%
-37.2%
-1.3%
-4.3%
-2.2%
11.7%
-0.1%
-2.9%
-4.0%
-0.7%
-11.4%
-3.2%
-5.2%
0.2%
-40% -30% -20% -10% 0% 10% 20%
COP
TRY
ARS
TWD
INR
KRW
JPY
SGD
CLP
BRL
AUD
GBP
CAD
CNY
USD (and pegged)
FY 2016 Results February 24, 2017 46
© B
ure
au V
erita
s
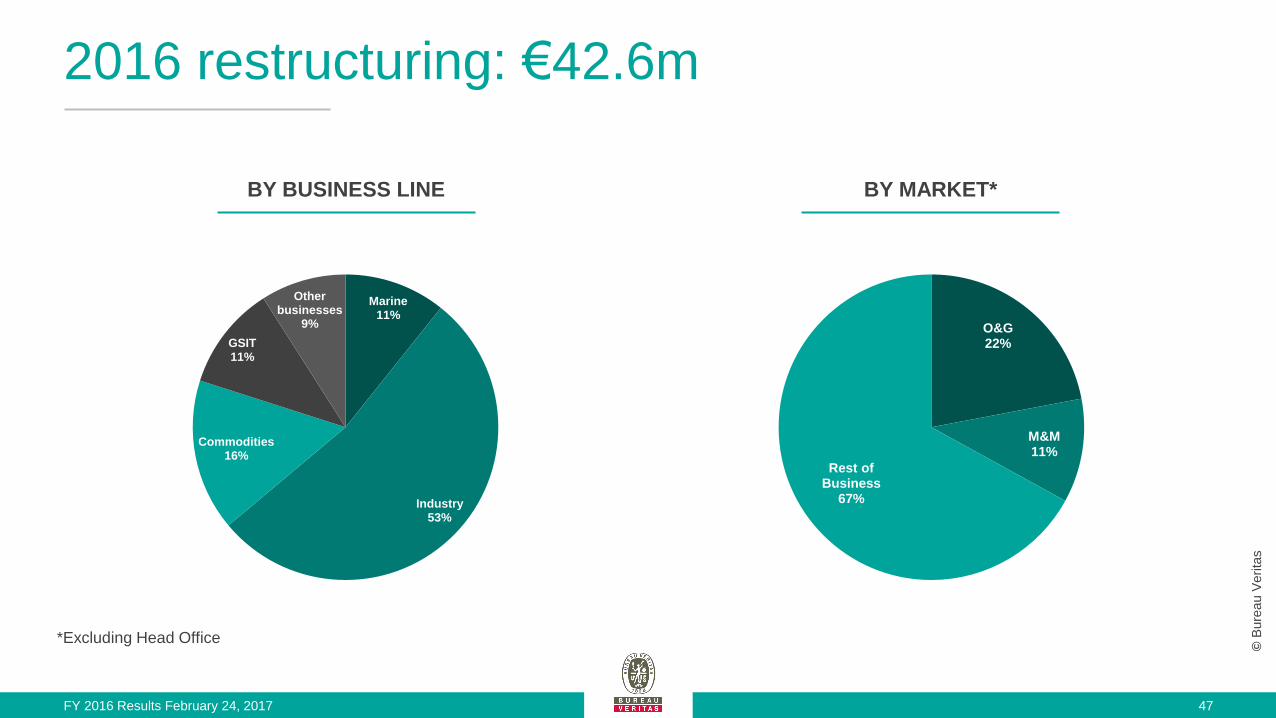
2016 restructuring: €42.6m
BY BUSINESS LINE BY MARKET*
47 FY 2016 Results February 24, 2017
Marine 11%
Industry 53%
Commodities 16%
GSIT 11%
Other businesses
9% O&G 22%
M&M 11%
Rest of Business
67%
*Excluding Head Office

© B
ure
au V
erita
s
Portfolio of businesses
REVENUE ADJUSTED OPERATING PROFIT
9%
20%
13%
13% 8%
18%
14%
5%
Marine & Offshore
Industry
IVS
Construction
Certification
Commodities
Consumer Products
GSIT
14%
16%
11%
13% 8%
14%
21%
3%
Marine & Offshore
Industry
IVS
Construction
Certification
Commodities
Consumer Products
GSIT
FY 2016 Results February 24, 2017 48

© B
ure
au V
erita
s
FY 16 under the new reporting (6 businesses)
FY 2016 Results February 24, 2017 49
In € millions Rev. 2016 o/w H1 16 o/w H2 16 2016 OG (%) AOP 2016 Adj. margin 2016
Agri, Food & Commodities 1,004.6 485.4 519.2 0.8% 117.1 11.7%
Industry 1,126.8 549.2 577.7 (6.8)% 144.4 12.8%
Building & Infrastructure 1,034.1 506.5 527.6 1.5% 158.0 15.3%
Certification 353.5 172.5 181.0 6.0% 60.3 17.1%
Marine & Offshore 391.9 203.7 188.1 (2.2)% 99.2 25.3%
Consumer products 638.3 304.1 334.2 3.7% 155.9 24.4%
Total 4,549.2 2,221.4 2,327.8 (0.6)% 734.9 16.2%
© B
ure
au V
erita
s
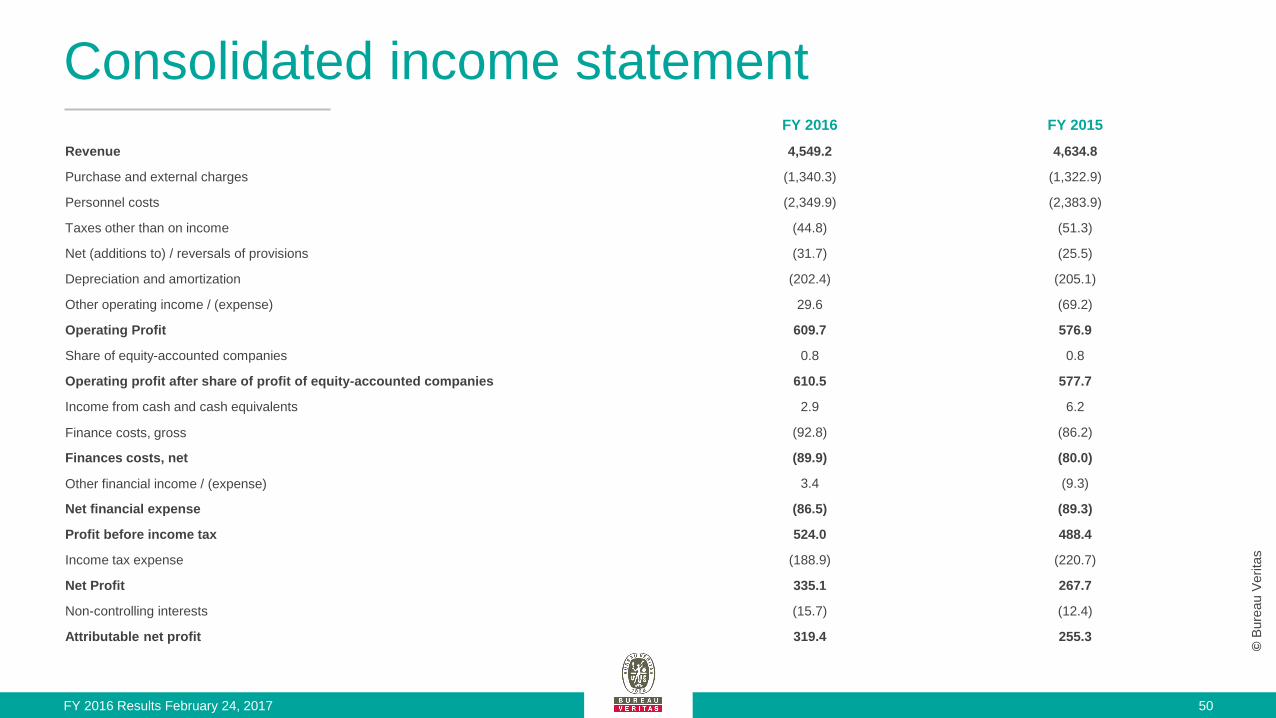
Consolidated income statement FY 2016 FY 2015
Revenue 4,549.2 4,634.8
Purchase and external charges (1,340.3) (1,322.9)
Personnel costs (2,349.9) (2,383.9)
Taxes other than on income (44.8) (51.3)
Net (additions to) / reversals of provisions (31.7) (25.5)
Depreciation and amortization (202.4) (205.1)
Other operating income / (expense) 29.6 (69.2)
Operating Profit 609.7 576.9
Share of equity-accounted companies 0.8 0.8
Operating profit after share of profit of equity-accounted companies 610.5 577.7
Income from cash and cash equivalents 2.9 6.2
Finance costs, gross (92.8) (86.2)
Finances costs, net (89.9) (80.0)
Other financial income / (expense) 3.4 (9.3)
Net financial expense (86.5) (89.3)
Profit before income tax 524.0 488.4
Income tax expense (188.9) (220.7)
Net Profit 335.1 267.7
Non-controlling interests (15.7) (12.4)
Attributable net profit 319.4 255.3
FY 2016 Results February 24, 2017 50

© B
ure
au V
erita
s
Consolidated financial position
FY 2016 FY 2015
Goodwill 1,977.6 1800.4
Intangible assets 686.8 629.4
Property, plant and equipment 518.6 497.9
Other non-current assets 218.4 218.6
Total non-current assets 3,401.4 3,146.3
Trade and other receivables 1,496.1 1374.2
Other current assets 103.6 107.2
Cash and cash equivalents 1,094.1 522.9
Total current assets 2,693.8 2,004.3
Assets held for sale - 6.6
Total assets 6,095.2 5,157.2
Equity attributable to shareholders of the Company 1,197.4 1,095.3
Minority interests 45.6 29.6
Total equity 1,243.0 1,124.9
Non-current borrowing and debt 2,492.9 2,311.0
Other non-current liabilities 547.60 487.0
Total non-current liabilities 3,040.5 2,798.0
Trade and other payables 1,041.5 962.8
Current income tax liabilities 66.4 72.1
Current financial liabilities 703.8 197.6
Total current liabilities 1,811.7 1,232.5
Liabilities held for sale - 1.8
Total equity and liabilities 6,095.2 5,157.2
FY 2016 Results February 24, 2017 51

© B
ure
au V
erita
s
Cash flow statement
FY 2016 FY 2015
Profit before income tax 524.0 488.4 Elimination of cash flows from financing and investing activities 61.1 60.6 Provisions and other non-cash items 57.9 46.9 Depreciation, amortization and impairment 202.4 293.3 Movements in working capital attributable to operations (37.2) 48.5 Income tax paid (213.8) (231.6) Net cash generated from operating activities 594.4 706.1 Acquisitions of subsidiaries (189.8) (99.7) Proceeds from sales of subsidiaries 0.7 (1.6) Purchases of property, plant and equipment and intangible assets (156.6) (169.4) Proceeds from sales of property, plant and equipment and intangible assets 10.7 3.8 Purchases of non-current financial assets (10.7) (13.7)
Proceeds from sales of non-current financial assets 19.3 6.1
Change in loans and advances granted 1.0 10.5
Dividends received from equity affialites 0.5 - Net cash used in investing activities (324.9) (264.0)
Capital increase 1.0 11.7 Purchaes / sale of treasury shares (42.8) (45.2) Dividends paid (255.1) (249.7) Increase in borrowings and other debt 742.5 387.1
Repayments of borrowing and other debt (35.9) (161.4) Repayments of amounts owed to shareholders (13.3) (3.9) Interest paid (86.0) (78.4) Net cash generated from (used in) financing activities 310.4 (139.8) Impact of currency translation differences / change in methodology (2.6) (1.8) Net increase in cash, cash equivalents and bank overdrafts 577.3 300.5
FY 2016 Results February 24, 2017 52

© B
ure
au V
erita
s
Adjusted net financial debt
FY 2016 FY 2015
Non-current borrowings and debt 2,492.9 2,311.0
Current borrowings and debt 583.5 66.8
Bank overdrafts 6.0 12.1
Gross financial debt 3,082.4 2,389.9
Total cash and cash equivalents 1,094.1 522.9
Net financial debt 1,988.3 1,867.0
Impact of currency hedging instruments 8.1 (4.3)
Adjusted net financial debt 1,996.4 1,862.7
FY 2016 Results February 24, 2017 53

© B
ure
au V
erita
s
Earnings per share
FY 2016 FY 2015
Basic EPS 0.73 0.58
Basic adjusted EPS 0.94 0.96
Weighted average number of shares 437,147,988 437,776,451
Diluted EPS 0.73 0.58
Diluted adjusted EPS 0.93 0.95
Weighted average number of shares for diluted earnings 440,143,701 443,217,857
FY 2016 Results February 24, 2017 54

© B
ure
au V
erita
s
Ownership at December 31, 2016
1.2%
40.7%
2.0%
56.1%
Treasury shares
Wendel
Managers andemployees
Free float
FY 2016 Results February 24, 2017 55

© B
ure
au V
erita
s
Upcoming events
Investor Relations Information
Bureau Veritas Head Office – 40 Boulevard du Parc
92200 Neuilly-sur-Seine
Laurent Brunelle
+33 (0)1 55 24 76 09
Mark Reinhard
+33 (0)1 55 24 77 80
Q1 2017 trading update - April 27, 2017 H1 2017 results - July 28, 2017
Shareholders’ meeting - May 16, 2017 Q3 2017 trading update - October 25, 2017
Dividend payment date (estimated)- May 22, 2017 Investor Days - H2 2017
FY 2016 Results February 24, 2017 56

© B
ure
au V
erita
s
Glossary
Organic growth is the increase in revenue versus last year, at constant currency and scope (i.e. acquisitions excluded)
Adjusted Operating Profit (AOP) excludes amortization of acquisition intangibles, goodwill impairment, restructuring, acquisition and disposal-related items (non-recurring items)
Adjusted Operating Margin is defined as Adjusted Operating Profit / Revenue
Adjusted Net Profit is defined as net profit adjusted for non-recurring items after tax
Adjusted Net Debt is defined as net financial debt after currency hedging instruments, as defined in the calculation of banking covenants
GSIT: Government Services & International Trade
y/y: year-on-year
VSM: Value Stream Mapping
GRT (Marine): Gross Register Ton
IVS: In-Service Inspection & Verification
O&G: Oil & Gas
P&U: Power & Utilities
M&M: Metals & Minerals
O&P: Oil & Petrochemicals
SSC: Shared Service Center
FY 2016 Results February 24, 2017 57


![Proposing!Constant!Currency!as!a!Revenue]Based!Denominator ... · Journal(of(Environmental(Investing(8,!no!1!(2017)!Proposing!Constant!Currency!as!a!Revenue]Based!Denominator!to!](https://static.fdocuments.us/doc/165x107/5f43fbc4e53cda44b01ce0b4/proposingconstantcurrencyasarevenuebaseddenominator-journalofenvironmentalinvesting8no12017proposingconstantcurrencyasarevenuebaseddenominatorto.jpg)