Cross Currency Derivatives at NSE Currency PPT.pdfCross Currency Derivatives at NSE 1. Contents 1....
31
Cross Currency Derivatives at NSE 1
Transcript of Cross Currency Derivatives at NSE Currency PPT.pdfCross Currency Derivatives at NSE 1. Contents 1....

Cross Currency Derivatives at NSE
1
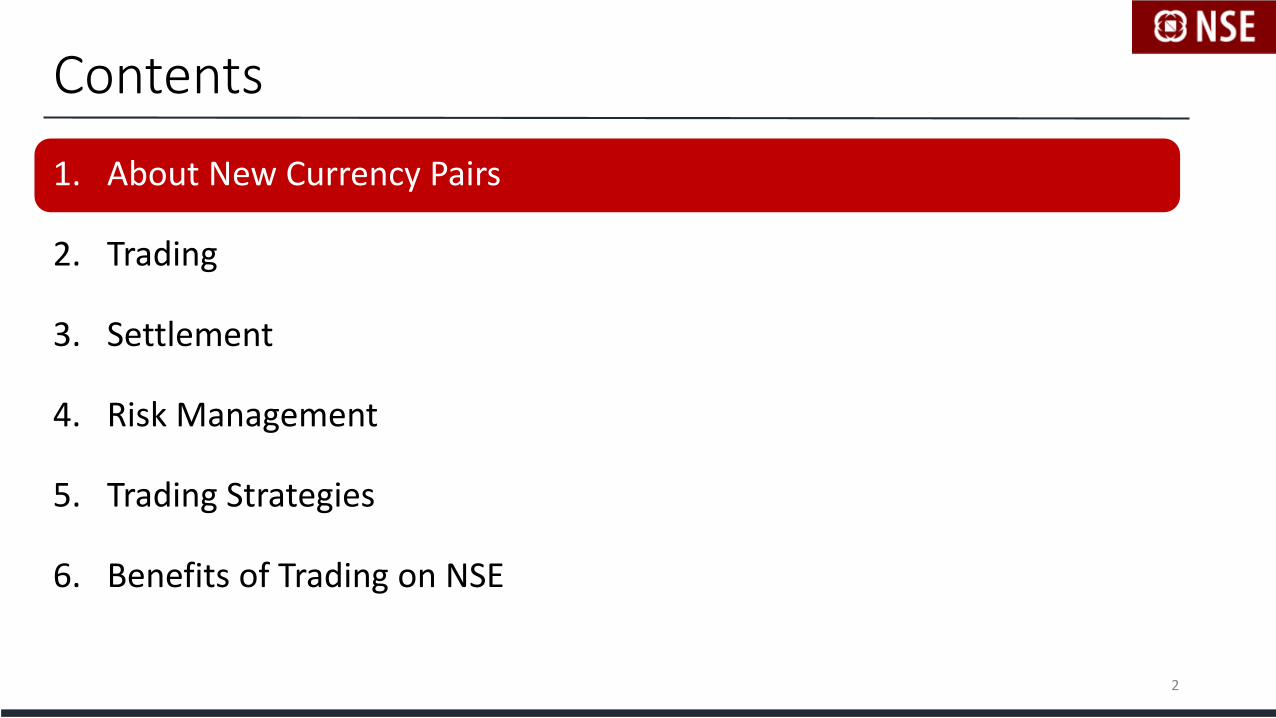
Contents
1. About New Currency Pairs
2. Trading
3. Settlement
4. Risk Management
5. Trading Strategies
6. Benefits of Trading on NSE
2
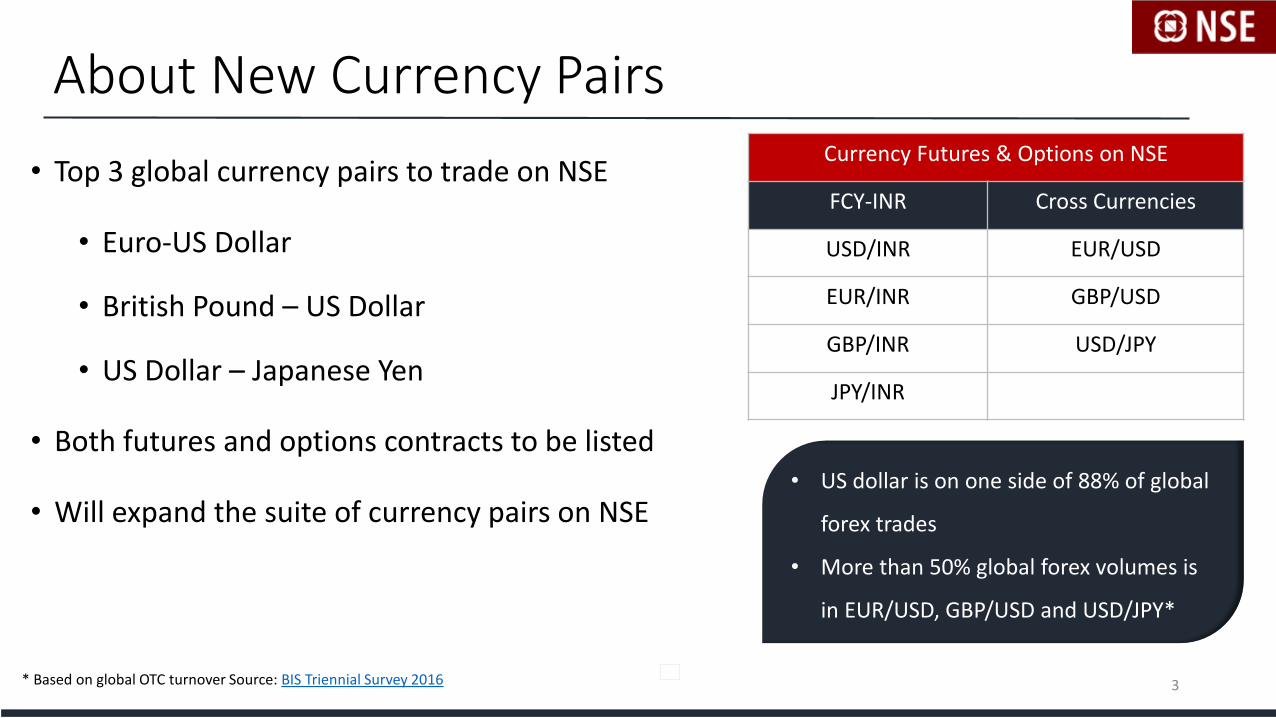
About New Currency Pairs
• Top 3 global currency pairs to trade on NSE
• Euro-US Dollar
• British Pound – US Dollar
• US Dollar – Japanese Yen
• Both futures and options contracts to be listed
• Will expand the suite of currency pairs on NSE
* Based on global OTC turnover Source: BIS Triennial Survey 2016
• US dollar is on one side of 88% of global
forex trades
• More than 50% global forex volumes is
in EUR/USD, GBP/USD and USD/JPY*
3
Currency Futures & Options on NSE
FCY-INR Cross Currencies
USD/INR EUR/USD
EUR/INR GBP/USD
GBP/INR USD/JPY
JPY/INR
Contents
1. About New Currency Pairs
2. Trading
3. Settlement
4. Risk Management
5. Trading Strategies
6. Benefits of Trading on NSE
4

Currency Pair Description
• First currency in the pair is always the base currency
• The second is always the quote currency
EUR/USD
Bid Price Ask Price
1.2315 1.2316
1.2314 1.2317
1.2313 1.2318
EUR / USD
GBP / USD
USD / JPY
Base Quote
Example: While trading EURUSD, participants shall quote in USD for 1 Euro
Ready to buy 1 EUR for 1.2315 USD
Ready to sell 1 EUR for 1.2316 USD
5

Contract Size
6
EUR/USD
1 Contract = EUR 1000
GBP/USD
1 Contract = GBP 1000
USD/JPY
1 Contract = USD 1000

Price Steps
7
Tick Size
1.2314
1.2315
1.2313
• Price Steps or tick size for futures and options
• EURUSD = 0.0001
• GBPUSD = 0.0001
• USDJPY = 0.01
Example: Last traded price of EURUSD futures is 1.2314. The next minimum price change can be:
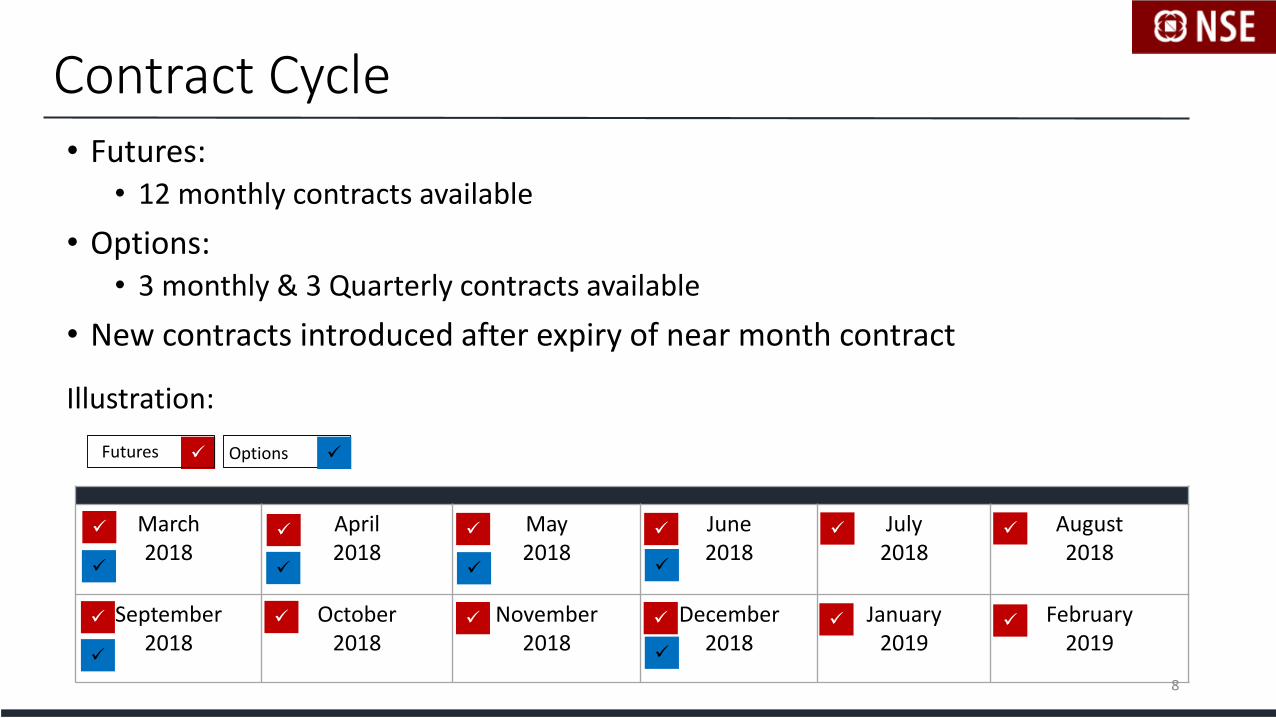
Contract Cycle• Futures:
• 12 monthly contracts available
• Options: • 3 monthly & 3 Quarterly contracts available
• New contracts introduced after expiry of near month contract
March 2018
April 2018
May 2018
June 2018
July 2018
August2018
September2018
October2018
November 2018
December 2018
January2019
February 2019
8
Futures Options
Illustration:
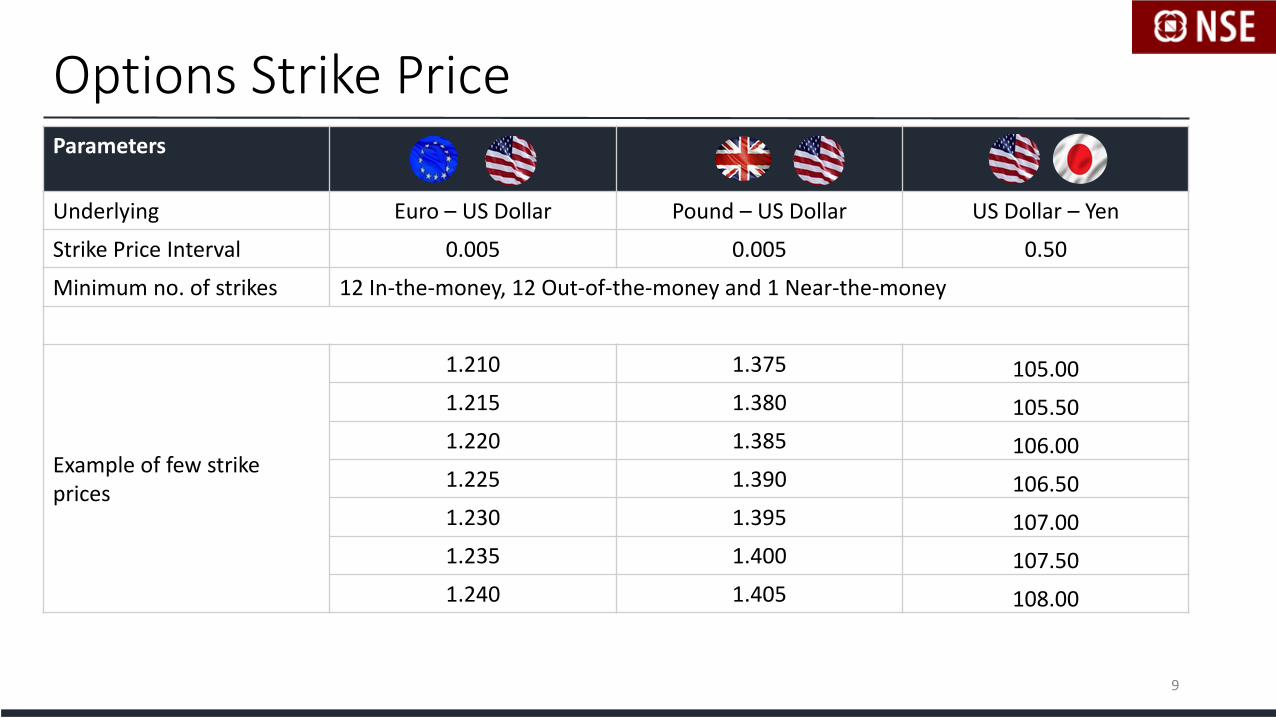
Options Strike PriceParameters
Underlying Euro – US Dollar Pound – US Dollar US Dollar – Yen
Strike Price Interval 0.005 0.005 0.50
Minimum no. of strikes 12 In-the-money, 12 Out-of-the-money and 1 Near-the-money
Example of few strike prices
1.210 1.375 105.00
1.215 1.380 105.50
1.220 1.385 106.00
1.225 1.390 106.50
1.230 1.395 107.00
1.235 1.400 107.50
1.240 1.405 108.00
9
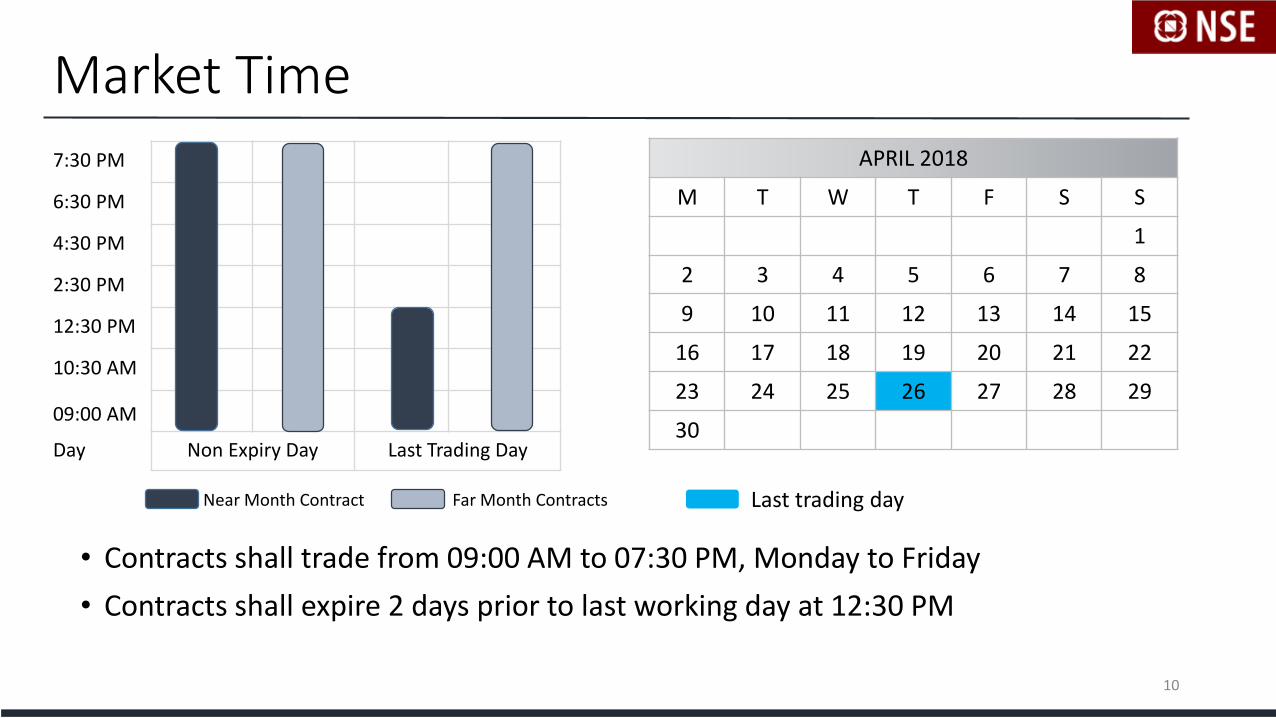
Market Time
7:30 PM
6:30 PM
4:30 PM
2:30 PM
12:30 PM
10:30 AM
09:00 AM
Day Non Expiry Day Last Trading Day
Near Month Contract Far Month Contracts
APRIL 2018
M T W T F S S
1
2 3 4 5 6 7 8
9 10 11 12 13 14 15
16 17 18 19 20 21 22
23 24 25 26 27 28 29
30
• Contracts shall trade from 09:00 AM to 07:30 PM, Monday to Friday
• Contracts shall expire 2 days prior to last working day at 12:30 PM
Last trading day
10

Contents
1. About New Currency Pairs
2. Trading
3. Settlement
4. Risk Management
5. Trading Strategies
6. Benefits of Trading on NSE
11
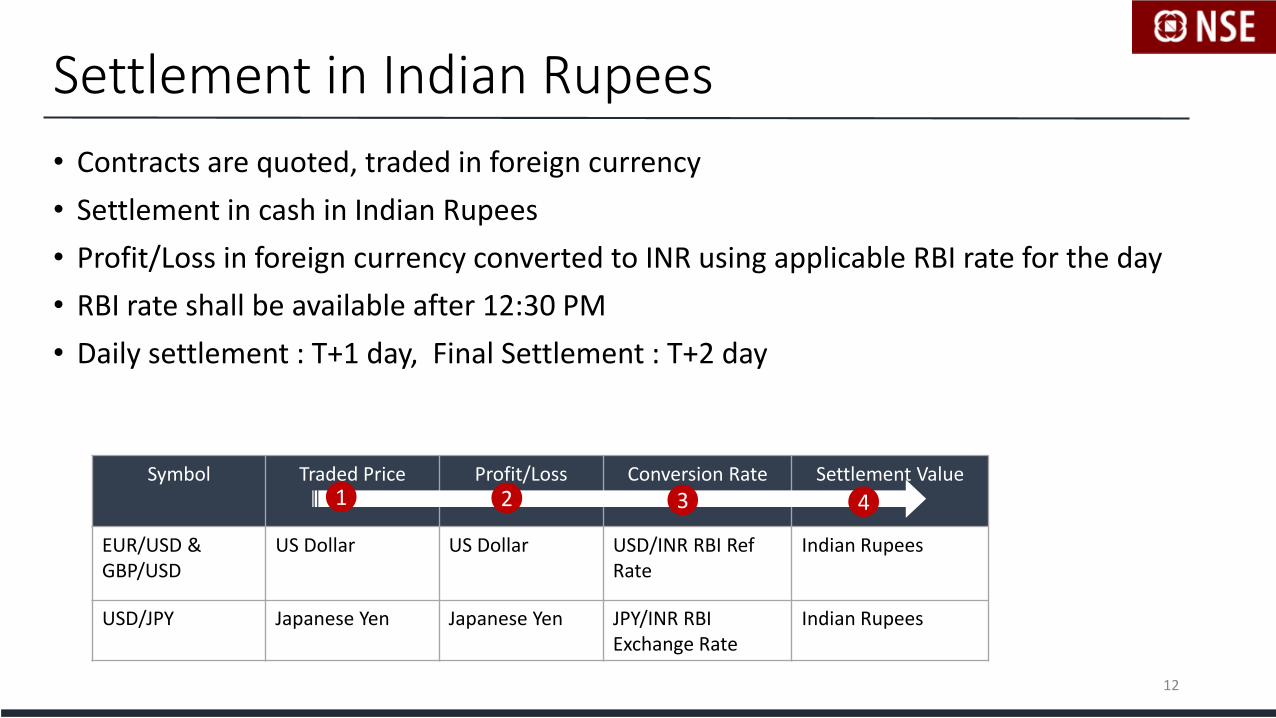
Settlement in Indian Rupees
• Contracts are quoted, traded in foreign currency
• Settlement in cash in Indian Rupees
• Profit/Loss in foreign currency converted to INR using applicable RBI rate for the day
• RBI rate shall be available after 12:30 PM
• Daily settlement : T+1 day, Final Settlement : T+2 day
Symbol Traded Price Profit/Loss Conversion Rate Settlement Value
EUR/USD &GBP/USD
US Dollar US Dollar USD/INR RBI Ref Rate
Indian Rupees
USD/JPY Japanese Yen Japanese Yen JPY/INR RBI Exchange Rate
Indian Rupees
12
3 41 2
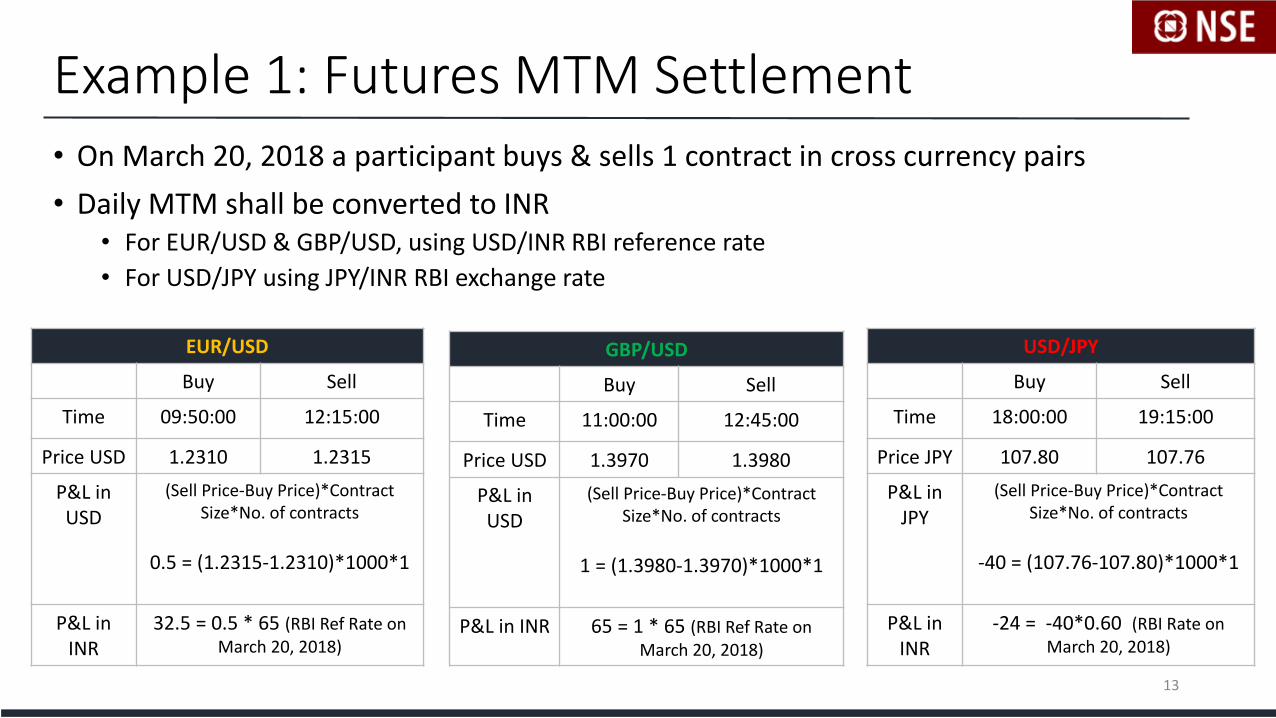
Example 1: Futures MTM Settlement• On March 20, 2018 a participant buys & sells 1 contract in cross currency pairs
• Daily MTM shall be converted to INR• For EUR/USD & GBP/USD, using USD/INR RBI reference rate
• For USD/JPY using JPY/INR RBI exchange rate
EUR/USD
Buy Sell
Time 09:50:00 12:15:00
Price USD 1.2310 1.2315
P&L in USD
(Sell Price-Buy Price)*Contract Size*No. of contracts
0.5 = (1.2315-1.2310)*1000*1
P&L in INR
32.5 = 0.5 * 65 (RBI Ref Rate on March 20, 2018)
GBP/USD
Buy Sell
Time 11:00:00 12:45:00
Price USD 1.3970 1.3980
P&L in USD
(Sell Price-Buy Price)*Contract Size*No. of contracts
1 = (1.3980-1.3970)*1000*1
P&L in INR 65 = 1 * 65 (RBI Ref Rate on March 20, 2018)
USD/JPY
Buy Sell
Time 18:00:00 19:15:00
Price JPY 107.80 107.76
P&L in JPY
(Sell Price-Buy Price)*Contract Size*No. of contracts
-40 = (107.76-107.80)*1000*1
P&L in INR
-24 = -40*0.60 (RBI Rate on March 20, 2018)
13
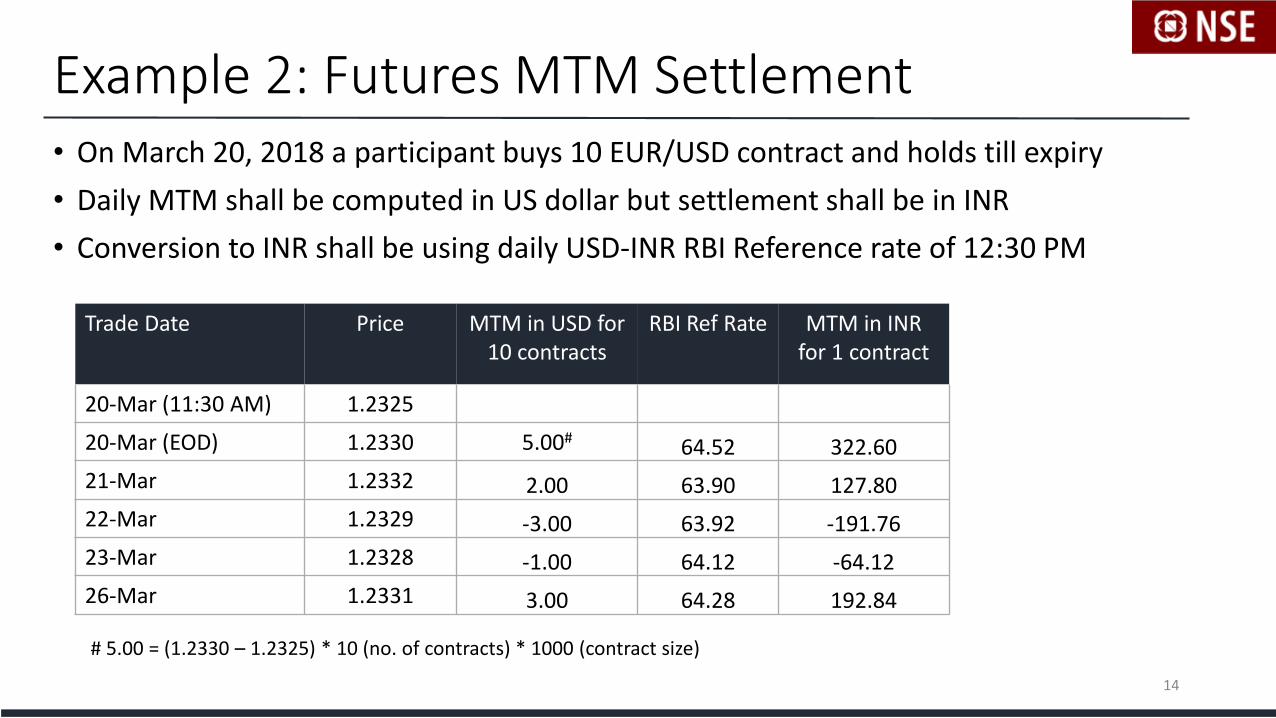
Example 2: Futures MTM Settlement• On March 20, 2018 a participant buys 10 EUR/USD contract and holds till expiry
• Daily MTM shall be computed in US dollar but settlement shall be in INR
• Conversion to INR shall be using daily USD-INR RBI Reference rate of 12:30 PM
Trade Date Price MTM in USD for 10 contracts
RBI Ref Rate MTM in INRfor 1 contract
20-Mar (11:30 AM) 1.2325
20-Mar (EOD) 1.2330 5.00# 64.52 322.60
21-Mar 1.2332 2.00 63.90 127.80
22-Mar 1.2329 -3.00 63.92 -191.76
23-Mar 1.2328 -1.00 64.12 -64.12
26-Mar 1.2331 3.00 64.28 192.84
# 5.00 = (1.2330 – 1.2325) * 10 (no. of contracts) * 1000 (contract size)
14
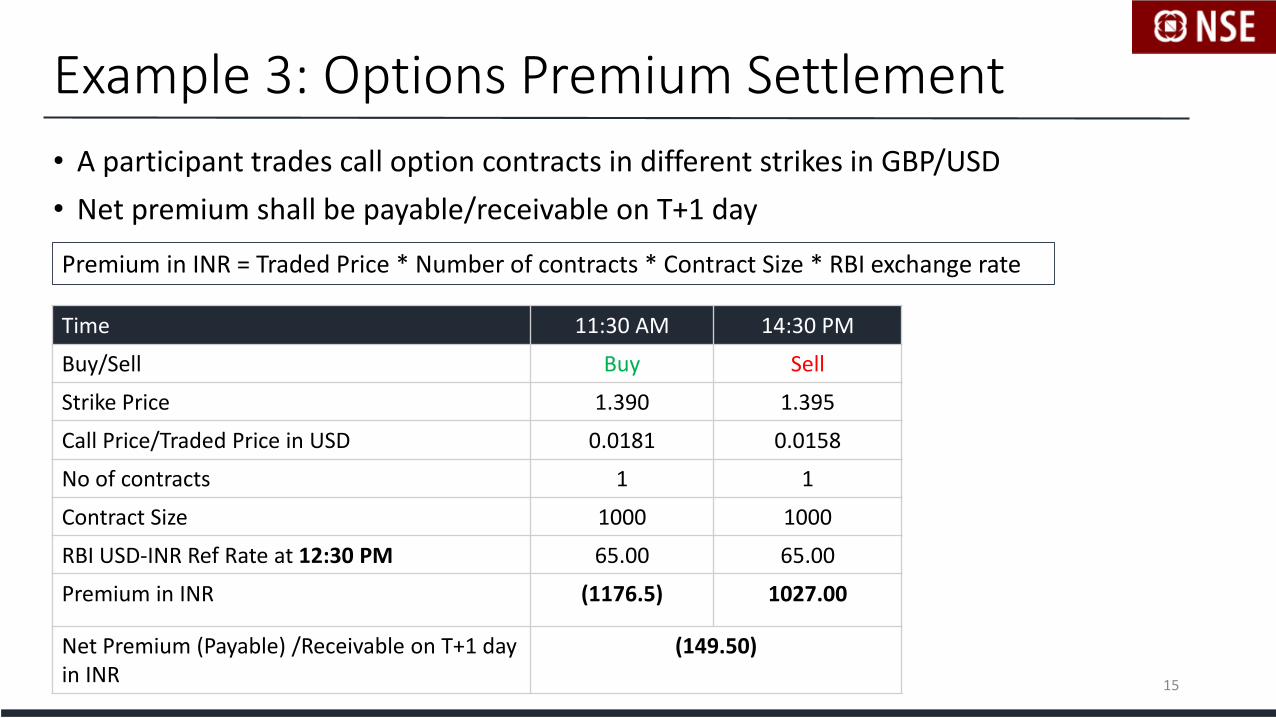
Example 3: Options Premium Settlement
• A participant trades call option contracts in different strikes in GBP/USD
• Net premium shall be payable/receivable on T+1 day
Premium in INR = Traded Price * Number of contracts * Contract Size * RBI exchange rate
Time 11:30 AM 14:30 PM
Buy/Sell Buy Sell
Strike Price 1.390 1.395
Call Price/Traded Price in USD 0.0181 0.0158
No of contracts 1 1
Contract Size 1000 1000
RBI USD-INR Ref Rate at 12:30 PM 65.00 65.00
Premium in INR (1176.5) 1027.00
Net Premium (Payable) /Receivable on T+1 day in INR
(149.50)
15
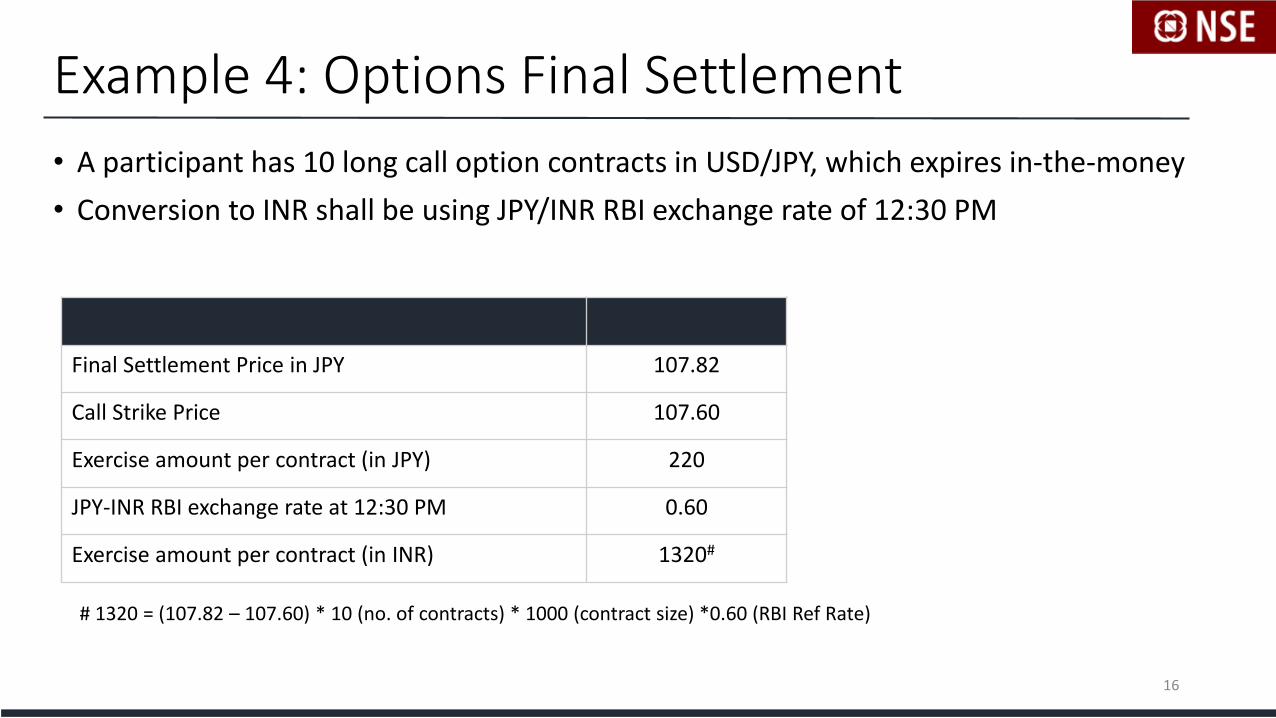
Example 4: Options Final Settlement
• A participant has 10 long call option contracts in USD/JPY, which expires in-the-money
• Conversion to INR shall be using JPY/INR RBI exchange rate of 12:30 PM
Final Settlement Price in JPY 107.82
Call Strike Price 107.60
Exercise amount per contract (in JPY) 220
JPY-INR RBI exchange rate at 12:30 PM 0.60
Exercise amount per contract (in INR) 1320#
# 1320 = (107.82 – 107.60) * 10 (no. of contracts) * 1000 (contract size) *0.60 (RBI Ref Rate)
16

Daily Settlement Price
• Open future positions are marked-to-market at daily settlement price (DSP)
• DSP = Last Half Hour Weighted Average Price
• In absence of last half hour trading, theoretical price shall be considered
17
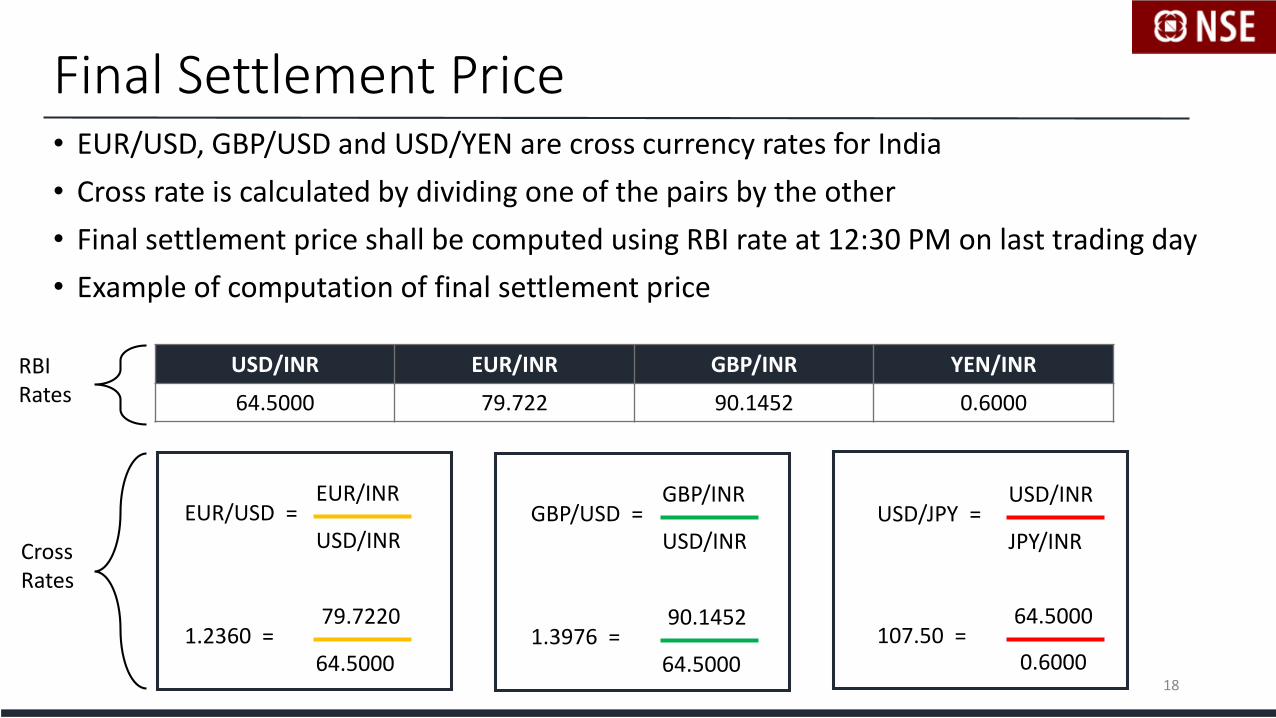
Final Settlement Price• EUR/USD, GBP/USD and USD/YEN are cross currency rates for India
• Cross rate is calculated by dividing one of the pairs by the other
• Final settlement price shall be computed using RBI rate at 12:30 PM on last trading day
• Example of computation of final settlement price
USD/INR EUR/INR GBP/INR YEN/INR
64.5000 79.722 90.1452 0.6000
EUR/USD =EUR/INR
USD/INR
1.2360 =79.7220
64.5000
GBP/USD =GBP/INR
USD/INR
1.3976 =90.1452
64.5000
USD/JPY =USD/INR
JPY/INR
107.50 =64.5000
0.6000
Cross Rates
RBI Rates
18
Contents
1. About New Currency Pairs
2. Trading
3. Settlement
4. Risk Management
5. Trading Strategies
6. Benefits of Trading on NSE
19
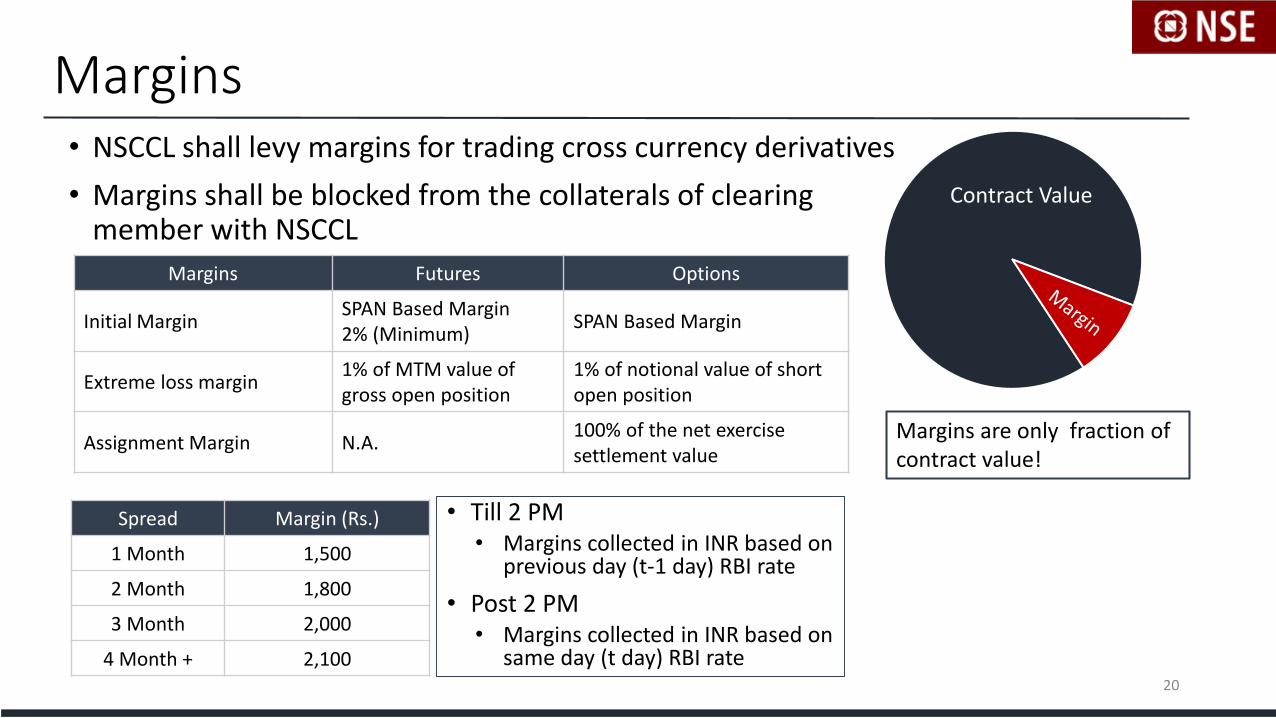
Margins
• Till 2 PM• Margins collected in INR based on
previous day (t-1 day) RBI rate
• Post 2 PM• Margins collected in INR based on
same day (t day) RBI rate
Margins Futures Options
Initial MarginSPAN Based Margin2% (Minimum)
SPAN Based Margin
Extreme loss margin1% of MTM value of gross open position
1% of notional value of short open position
Assignment Margin N.A.100% of the net exercise settlement value
Spread Margin (Rs.)
1 Month 1,500
2 Month 1,800
3 Month 2,000
4 Month + 2,100
• NSCCL shall levy margins for trading cross currency derivatives
• Margins shall be blocked from the collaterals of clearing member with NSCCL
Contract Value
Margins are only fraction of contract value!
20
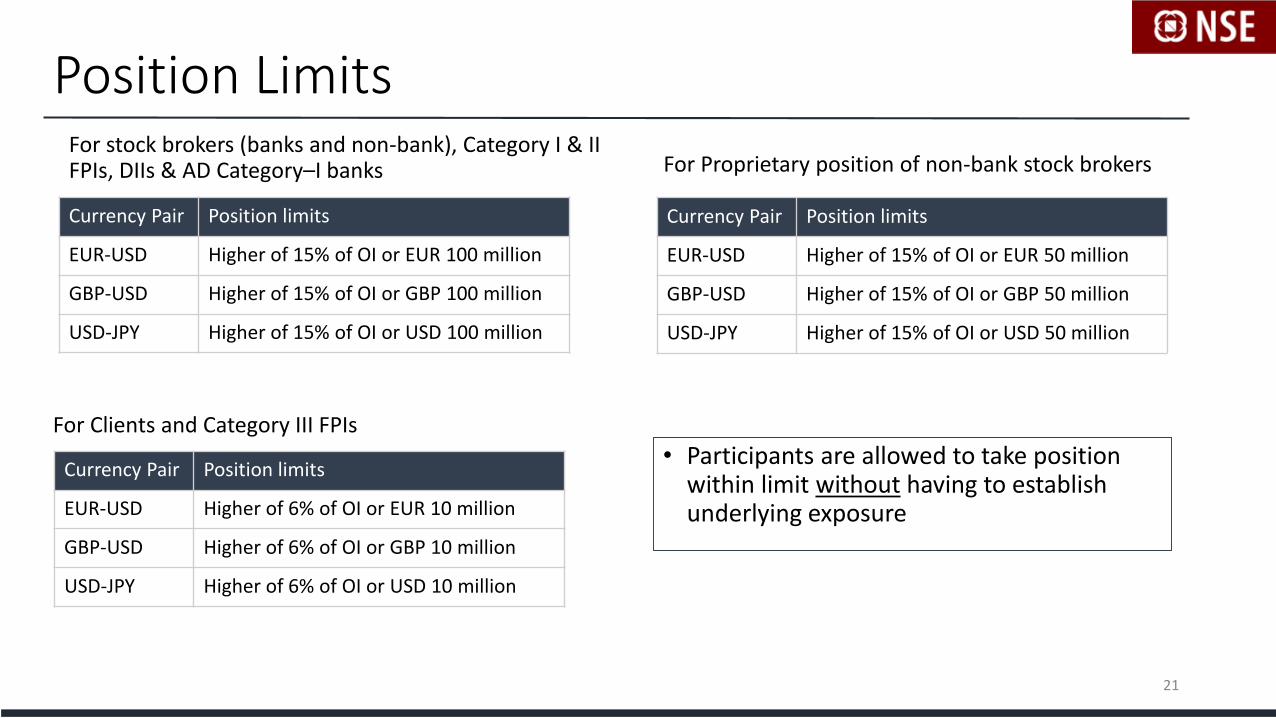
Position LimitsFor stock brokers (banks and non-bank), Category I & II FPIs, DIIs & AD Category–I banks
Currency Pair Position limits
EUR-USD Higher of 15% of OI or EUR 100 million
GBP-USD Higher of 15% of OI or GBP 100 million
USD-JPY Higher of 15% of OI or USD 100 million
For Proprietary position of non-bank stock brokers
Currency Pair Position limits
EUR-USD Higher of 15% of OI or EUR 50 million
GBP-USD Higher of 15% of OI or GBP 50 million
USD-JPY Higher of 15% of OI or USD 50 million
For Clients and Category III FPIs
Currency Pair Position limits
EUR-USD Higher of 6% of OI or EUR 10 million
GBP-USD Higher of 6% of OI or GBP 10 million
USD-JPY Higher of 6% of OI or USD 10 million
• Participants are allowed to take position within limit without having to establish underlying exposure
21
Contents
1. About New Currency Pairs
2. Trading
3. Settlement
4. Risk Management
5. Trading Strategies
6. Benefits of Trading on NSE
22
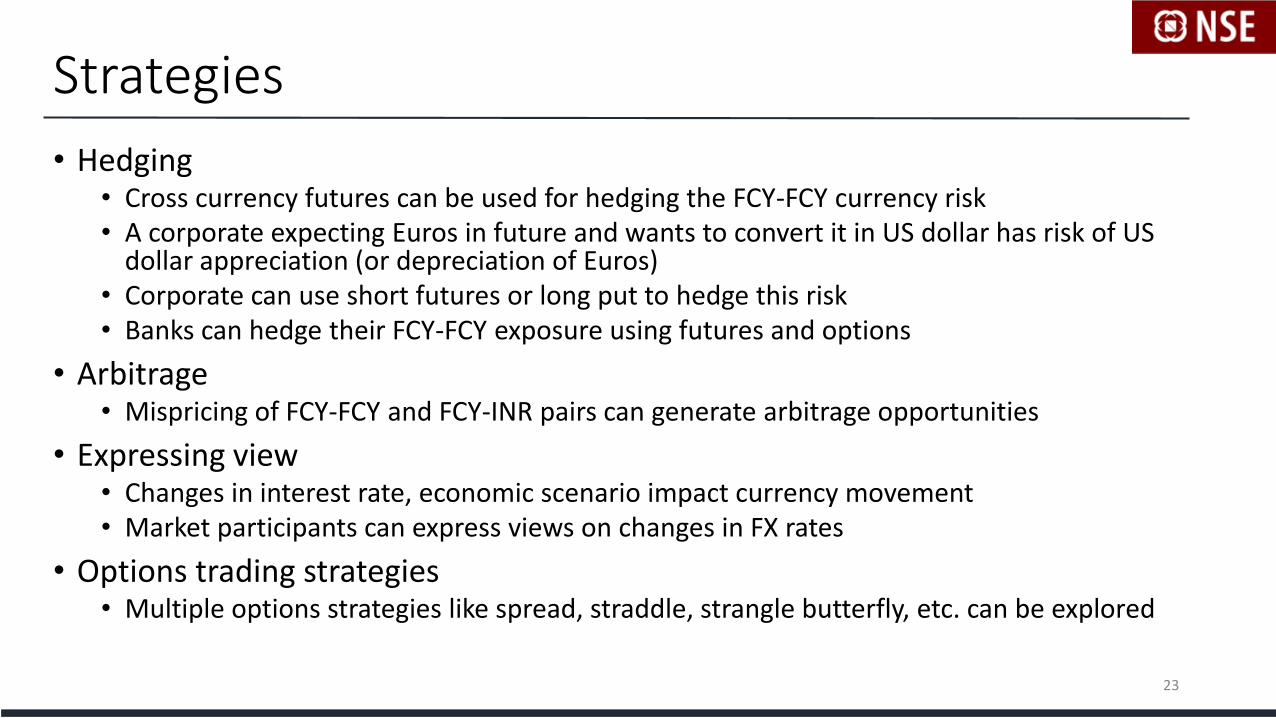
Strategies
• Hedging• Cross currency futures can be used for hedging the FCY-FCY currency risk• A corporate expecting Euros in future and wants to convert it in US dollar has risk of US
dollar appreciation (or depreciation of Euros)• Corporate can use short futures or long put to hedge this risk• Banks can hedge their FCY-FCY exposure using futures and options
• Arbitrage• Mispricing of FCY-FCY and FCY-INR pairs can generate arbitrage opportunities
• Expressing view• Changes in interest rate, economic scenario impact currency movement• Market participants can express views on changes in FX rates
• Options trading strategies• Multiple options strategies like spread, straddle, strangle butterfly, etc. can be explored
23
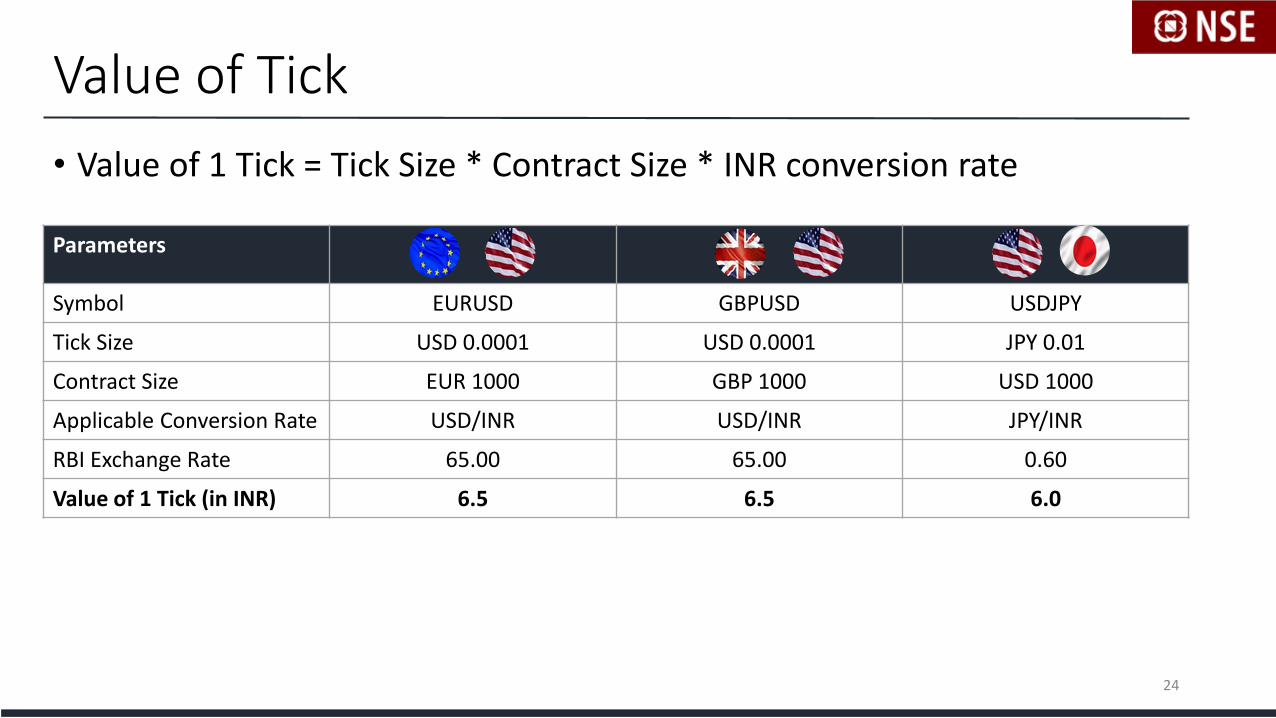
Value of Tick
Parameters
Symbol EURUSD GBPUSD USDJPY
Tick Size USD 0.0001 USD 0.0001 JPY 0.01
Contract Size EUR 1000 GBP 1000 USD 1000
Applicable Conversion Rate USD/INR USD/INR JPY/INR
RBI Exchange Rate 65.00 65.00 0.60
Value of 1 Tick (in INR) 6.5 6.5 6.0
• Value of 1 Tick = Tick Size * Contract Size * INR conversion rate
24

Market Trends – EUR/USD
25
All currencies rebased to 100 as on Jan 01, 2009
AnnualizedVolatility*
EUR-USD USD-INR EUR-INR
5 yrs 10.49% 8.59% 12.01%
3 Yrs 11.65% 5.50% 11.76%
1 Year 8.51% 5.04% 8.32%
70
80
90
100
110
120
130
140
150
Jan
-09
Jul-
09
Jan
-10
Jul-
10
Jan
-11
Jul-
11
Jan
-12
Jul-
12
Jan
-13
Jul-
13
Jan
-14
Jul-
14
Jan
-15
Jul-
15
Jan
-16
Jul-
16
Jan
-17
Jul-
17
Jan
-18
USD/INR EUR/INR Euro/USD
Period ending December 31, 2017
• In 2017 USD has depreciated against Rupee and Euro
• USD has depreciated from 1.05 on Jan 01, 2017 to 1.24 as on Feb 20, 2018 against Euro
• In 2017 EUR-USD had annualised volatility of 8.51%
Standard deviation of daily returns
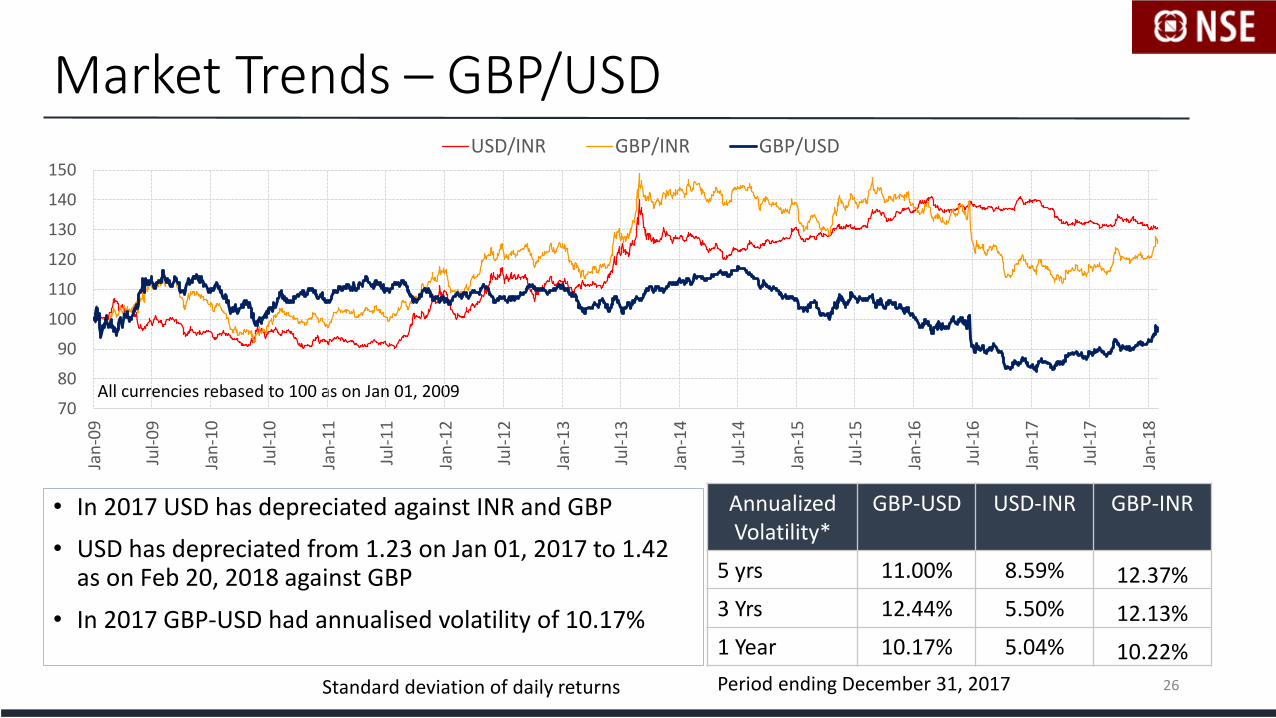
Market Trends – GBP/USD
26
All currencies rebased to 100 as on Jan 01, 2009
AnnualizedVolatility*
GBP-USD USD-INR GBP-INR
5 yrs 11.00% 8.59% 12.37%
3 Yrs 12.44% 5.50% 12.13%
1 Year 10.17% 5.04% 10.22%
Period ending December 31, 2017
• In 2017 USD has depreciated against INR and GBP
• USD has depreciated from 1.23 on Jan 01, 2017 to 1.42 as on Feb 20, 2018 against GBP
• In 2017 GBP-USD had annualised volatility of 10.17%
70
80
90
100
110
120
130
140
150
Jan
-09
Jul-
09
Jan
-10
Jul-
10
Jan
-11
Jul-
11
Jan
-12
Jul-
12
Jan
-13
Jul-
13
Jan
-14
Jul-
14
Jan
-15
Jul-
15
Jan
-16
Jul-
16
Jan
-17
Jul-
17
Jan
-18
USD/INR GBP/INR GBP/USD
Standard deviation of daily returns
70
80
90
100
110
120
130
140
150
Jan
-09
Jul-
09
Jan
-10
Jul-
10
Jan
-11
Jul-
11
Jan
-12
Jul-
12
Jan
-13
Jul-
13
Jan
-14
Jul-
14
Jan
-15
Jul-
15
Jan
-16
Jul-
16
Jan
-17
Jul-
17
Jan
-18
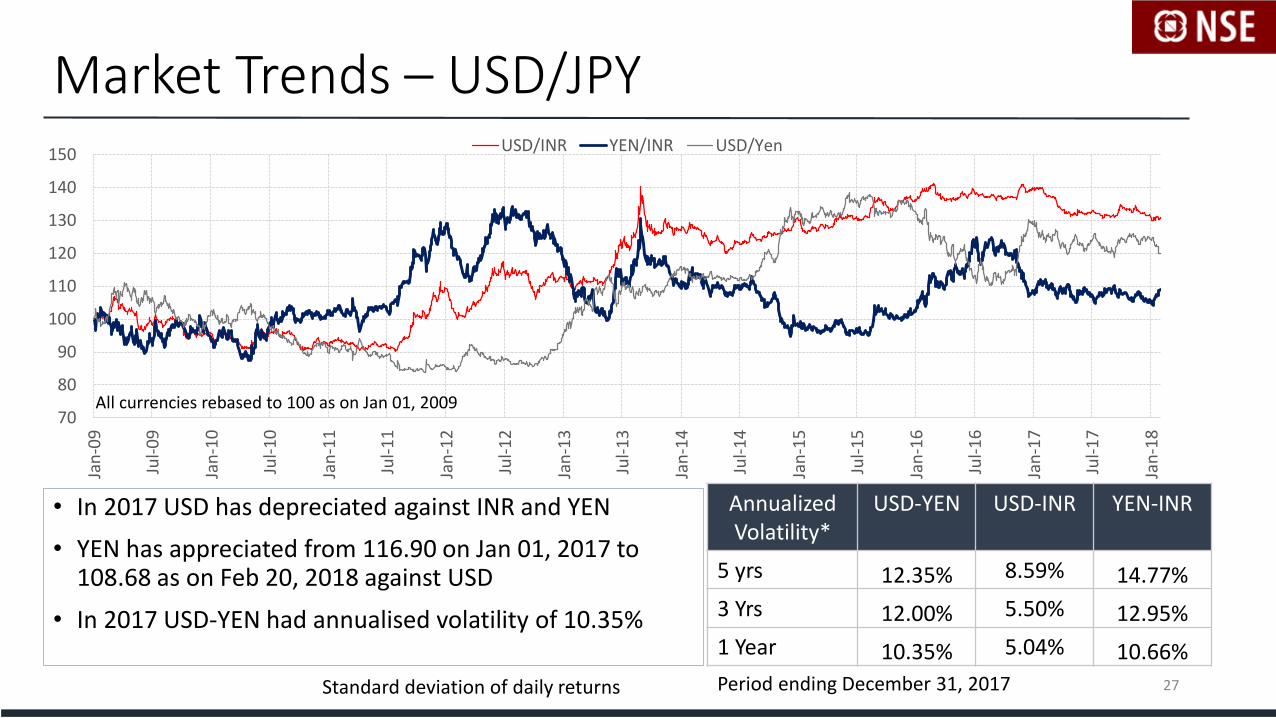
USD/INR YEN/INR USD/Yen
Market Trends – USD/JPY
27
All currencies rebased to 100 as on Jan 01, 2009
AnnualizedVolatility*
USD-YEN USD-INR YEN-INR
5 yrs 12.35% 8.59% 14.77%
3 Yrs 12.00% 5.50% 12.95%
1 Year 10.35% 5.04% 10.66%
Period ending December 31, 2017
• In 2017 USD has depreciated against INR and YEN
• YEN has appreciated from 116.90 on Jan 01, 2017 to 108.68 as on Feb 20, 2018 against USD
• In 2017 USD-YEN had annualised volatility of 10.35%
Standard deviation of daily returns
Contents
1. About New Currency Pairs
2. Trading
3. Settlement
4. Risk Management
5. Trading Strategies
6. Benefits of Trading on NSE
28
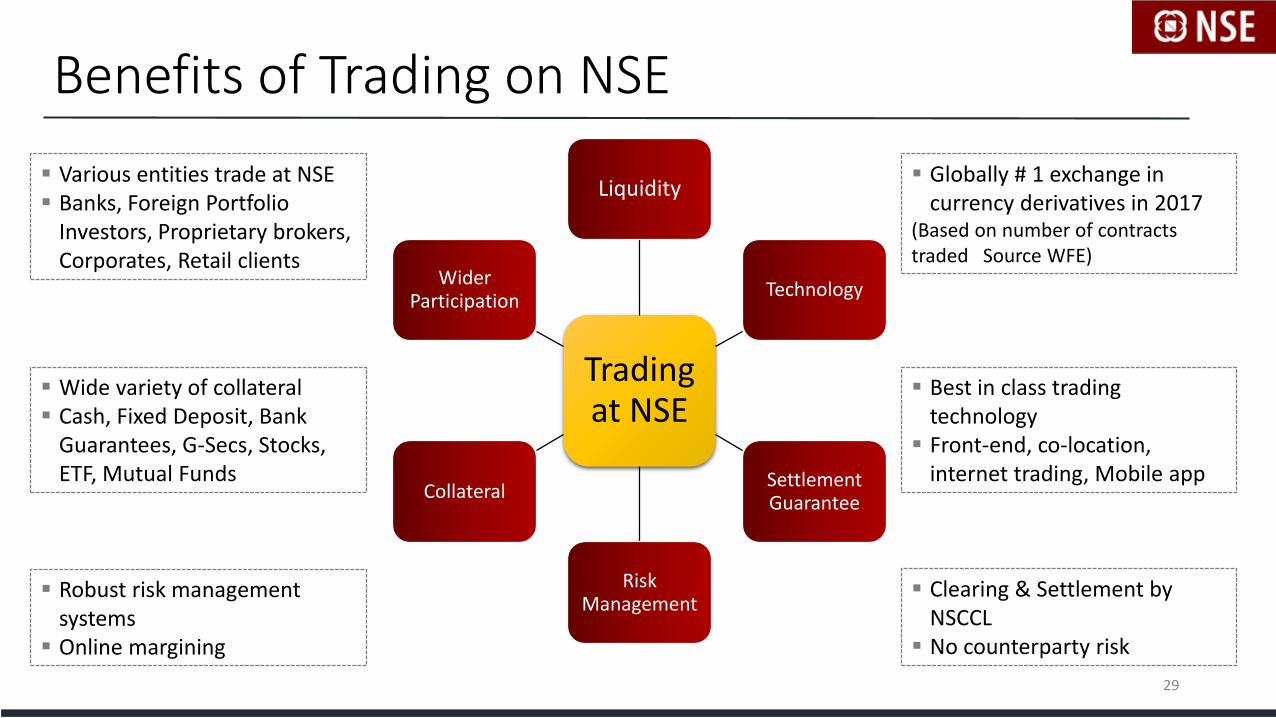
Benefits of Trading on NSE
Trading at NSE
Liquidity
Technology
Settlement Guarantee
Risk Management
Collateral
Wider Participation
29
Globally # 1 exchange in currency derivatives in 2017
(Based on number of contracts traded Source WFE)
Best in class trading technology
Front-end, co-location, internet trading, Mobile app
Clearing & Settlement by NSCCL
No counterparty risk
Robust risk management systems
Online margining
Wide variety of collateral Cash, Fixed Deposit, Bank
Guarantees, G-Secs, Stocks, ETF, Mutual Funds
Various entities trade at NSE Banks, Foreign Portfolio
Investors, Proprietary brokers, Corporates, Retail clients
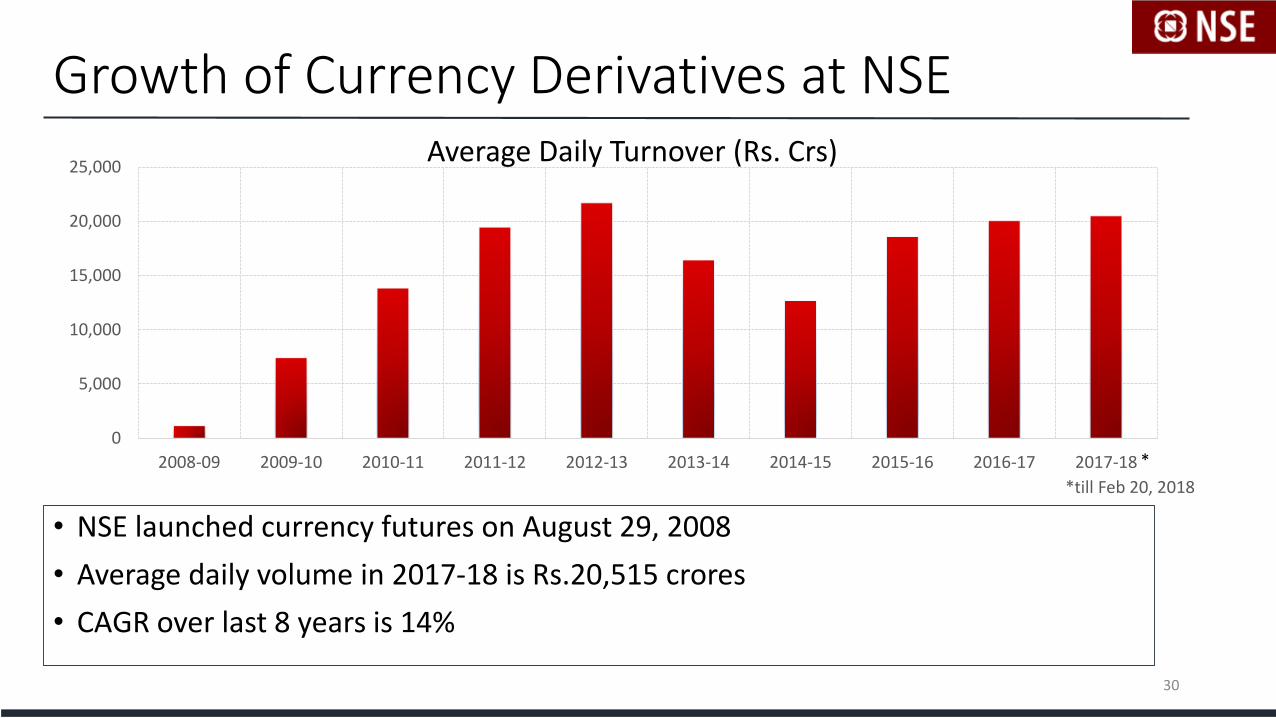
Growth of Currency Derivatives at NSE
• NSE launched currency futures on August 29, 2008
• Average daily volume in 2017-18 is Rs.20,515 crores
• CAGR over last 8 years is 14%
30
0
5,000
10,000
15,000
20,000
25,000
2008-09 2009-10 2010-11 2011-12 2012-13 2013-14 2014-15 2015-16 2016-17 2017-18
Average Daily Turnover (Rs. Crs)
*
*till Feb 20, 2018

THANK YOU
31