Annual Report 2013€¦ · Strategic report Governance Financial Statements Low & Bonar PLcAnnual...
112
Delivering on our strategy Low & Bonar PLC Annual Report 2013
Transcript of Annual Report 2013€¦ · Strategic report Governance Financial Statements Low & Bonar PLcAnnual...

Low
& B
on
ar PLC A
nn
ual R
epo
rt 2013
Delivering on our strategy
Low & Bonar PLC Annual Report 2013

We are an international business to business performance materials group.We design and manufacture components which add value to, and improve the performance of, our customers’ products by engineering a wide range of polymers using our own technologies to create yarns, fibres, industrial and coated fabrics and composite materials. We sell globally and manufacture in Europe, North America, the Middle East and China.
Civil engineering
Sport and leisure
The sectors we operate in
Transport
Building products
Industrial and others
Flooring
Strategic Report Governance Financial Statements
1 Highlights 2 Low & Bonar at a Glance 4 Our Markets 6 Our Business Model and Strategy 8 Strategic Progress and KPIs10 Strategy in Action12 Chairman’s Statement14 Performance Review 16 Bonar 18 Technical Coated Fabrics 19 Yarns 20 Financial Review22 Principal Risks and Uncertainties24 Corporate Social Responsibility
30 Board of Directors32 Report of the Directors35 Corporate Governance41 Audit Committee Report44 Directors’ Report on Remuneration61 Statement of Directors’ Responsibilities62 Independent Auditor’s Report
64 Consolidated Income Statement65 Consolidated Statement of
Comprehensive Income66 Balance Sheets67 Consolidated Cash Flow Statement68 Company Cash Flow Statement69 Consolidated Statement of Changes in
Equity70 Company Statement of Changes in
Equity71 Significant Accounting Policies77 Notes to the Accounts106 Five Year History107 Advisers and Financial Calendar
Welcome to Low & Bonar

Strategic Report Governance Financial Statements
1 Low & Bonar PLC Annual Report 2013 |
Revenue £m
£403.1m +2.8%(2012: £380.5m)
* At constant currency exchange rates** Continuing operations before tax, amortisation and non-recurring items
Profit £m
£26.1m +2.7%(2012: £24.5m)
2010 2011
23.4
18.6
2012
24.5
2013
26.1
2010 2011
388.7344.6
2012
380.5
2013
403.1
Revenue £m
£403.1m +2.8%(2012: £380.5m)
* At constant currency exchange rates** Continuing operations before tax, amortisation and non-recurring items
Profit £m
£26.1m +2.7%(2012: £24.5m)
2010 2011
23.4
18.6
2012
24.5
2013
26.1
2010 2011
388.7344.6
2012
380.5
2013
403.1
1 Continuing operations before tax, amortisation and non-recurring items2 Constant currency is calculated by retranslating comparative period
results at current period exchange rates
Our Financial PerformanceAnother year of profit growth, PBTA1 up 2.7% on a constant currency2 basis.• Revenue of £403.1m (2012: £380.5m), up 2.8% on a
constant currency2 basis.• Profit before tax1 of £26.1m (2012: £24.5m), an increase
of 2.7% on a constant currency2 basis.• Operating margin maintained at 8.0% (2012: 8.0%),
return on capital at 16.8% (2012: 17.2%).
Investing to drive future growth• £21.2m invested to support management initiatives for
future growth.• The Group’s joint venture, Bonar Natpet, now
manufacturing.
Full year dividend increased 8% to 2.6 pence per share (2012: 2.4 pence per share).
Operational HighlightsSustained growth in a difficult year• Momentum regained in the second half of the year in
Europe after a weather-impacted first half.• Accelerating growth outside Europe.
Acquisition and share placing drives future growth• Texiplast acquisition enables the Group to extend its
product range in demanding civil engineering applications.
• Share placing raised £20m and maintains flexibility and headroom to continue to pursue growth ambitions.
Highlights
Visit us online Our website contains a full investor relations section with news, reports, webcasts, financial calendar and share price information. Visit www.lowandbonar.com and click on Investor Centre.

2 | Low & Bonar PLC Annual Report 2013
north america
19%WeStern eUroPe
59%
miDDLe eaSt
4%reSt oF WorLD
4%
aSia
6%eaStern eUroPe
8%
1
2
3
45 6
1
2
3
4
5
6
How and where we deliver performance materials
Low & Bonar at a Glance
Bonar MAnuFAcTurInG FAcILITIeSBelgium – Zele and Lokerennetherlands – Arnhem and EmmenGermany – Obernburg Hungary – Tiszaújváros uSA – Asheville, NCchina – YizhengSlovakia – Ivanka pri NitreSaudi Arabia – Yanbu
Technical Coated Fabrics MAnuFAcTurInG FAcILITIeSGermany – Hückelhoven and Fuldaczech republic – Lomnice
Yarns MAnuFAcTurInG FAcILITIeSuK – DundeeuAe – Abu Dhabi
Revenue by destination 2013
1. north america2. Western europe3. eastern europe4. asia5. middle east6. rest of World

Strategic Report Governance Financial Statements
3 Low & Bonar PLC Annual Report 2013 |
1
2
3
45 6
1
2
3
4
5
6
Sales2013 £245.6m2012 £238.7m2011 £238.7m
Sales2013 £124.7m2012 £115.3m2011 £119.4m
Sales2013 £32.8m2012 £26.5m2011 £30.6m
* Continuing operations before amortisation and non-recurring items.
* Continuing operations before amortisation and non-recurring items.
* Continuing operations before amortisation and non-recurring items.
Sales fabrics yarns
61% 31% 8%
Our Divisions Revenue by end sector 2013
1. civil engineering 24%2. Flooring 19%3. industrial 16%4. Building products 17%5. Sport and Leisure 10%6. transport 14%
Positive global trends in infrastructure spending and urbanisation, which are largely taking place in emerging markets, are creating significant growth opportunities in civil engineering, flooring and niche building products. Our joint venture in Saudi Arabia will service the Middle East and Indian subcontinent, and we continue to assess options to develop our business further in North America, Latin America and Asia.
BonarOur Bonar division serves these markets:
cOMPAnIeSBonar – Belgium, The Netherlands, USA and UKBonar Geosynthetics – HungaryBonar Xeroflor – GermanyYihua Bonar – China (60%) Bonar natpet – Saudi Arabia (50%)Texiplast – Slovakia
BOnAr PrOducTS• Woven and non-woven geotextiles• Speciality geosynthetics• Construction fibres• Primary backing for carpet tiles and
broadloom carpets• Horticulture screens and groundcovers• Roofing components for commercial and
residential property
Technical Coated FabricsOur Technical coated Fabrics division serves these markets:
cOMPAnIeSMehler Texnologies (“MTX”) – Germany, Czech Republic and 17 sales offices and warehouses throughout the world.
TecHnIcAL cOATed FABrIcS PrOducTS• Architectural fabrics for permanent and
temporary building structures• Trailer side curtains and transport
protection• Printable fabrics for large format
advertising• Coated fabrics for storage and
containment• Coated fabrics for sunshading, boat,
pool, camping and sports
YarnsOur Yarns division serves these markets:
cOMPAnIeSBonar Technical Yarns – UK, Belgium and USABonar emirates Technical Yarns – UAE (49%)
YArnS PrOducTS• Monofilament and fibrillated artificial
grass yarns for sports pitches and landscaping
• Polypropylene carpet backing yarns for woven carpets
• Civil engineering
• Flooring
• Transport
• Industrial
• Building products
• Building products
• Transport
• Leisure
• Industrial
• Artificial grass yarns
• Woven carpet backing

4 | Low & Bonar PLC Annual Report 2013
Growth drivers • Urbanisation and need for more and
better infrastructure• Lower carbon footprint and
environmental benefits compared to traditional materials of lower total-life costs, faster, safer construction and better durability
• Increased quality control in performance and safety
Growth drivers • Ease of installation, aesthetic and
design flexibility drive substitution of wall-to-wall solutions around the world
• Recovery in the North American markets and development of the Chinese markets
• Environmental leadership to differentiate for end consumer
Growth drivers • Clean air and water • Higher agricultural productivity• Sustainable and environmentally
acceptable solutions in the supply, control and management of waste, liquids and gases
• Continued growth in outdoor advertising
24% of revenue 19% of revenue 16% of revenue
Civil engineeringA wide range of products used in major infrastructure projects, including road and rail building, land reclamation and coastal defence. Woven and non-woven geotextiles have a wide range of uses including separation and filtration, membrane protection in landfills and reservoirs and for erosion control on riverbanks and coastlines. Speciality geosynthetics for erosion control, drainage, soil reinforcement and stabilisation and soil consolidation. Construction fibres used in concrete to reduce shrinkage and settlement cracking and as an alternative to steel mesh reinforcement.
FlooringA range of high-performance primary backings for tufted carpet tiles, broadloom carpets and other flooring products.
IndustrialA wide range of products for multiple application areas, including screens and groundcover products in the professional horticulture market to improve yield and reduce energy consumption in the production of food, plants and cut flowers. Printable fabrics for large format prints used in large area outdoor and indoor advertising and smaller fabrics for point of sale displays. Coated fabrics for storage and containment, with application areas including waste water, biogas, food and oil. Supplier of support media for automotive cabin air and combi filters.
Leading positions in niche industrial markets
Our Markets

Strategic Report Governance Financial Statements
5 Low & Bonar PLC Annual Report 2013 |
Growth drivers• Safe, ‘green’ environmental building
solutions• Innovative and cost effective added
functionality• Steady global economic recovery• More need for sun protection through
design
Growth drivers• Highly innovative, cost effective
aesthetics and functionality• Highly bespoke solutions to different
segments
17% of revenue 10% of revenue 14% of revenue
Growth drivers• Environmental leadership including light
weighting vehicles• Auto manufacture moving East to
support fast growing Asian markets• North America vehicle market recovery• Wide product range, flexible and fast
response times to haulage tarpaulin market
Building productsA range of products in niche application areas of the commercial and residential building market. Specialist architectural coated fabrics used as membranes for roofing, in frame-supported industrial, event and sports halls, and marquees for leisure and business events. Roofing and flooring products based on both three-dimensional monofilament mats, composites and non-wovens with a variety of applications, including metal roof ventilation, subsurface drainage for green roofs, hard floor sound control and reinforcement for waterproof bituminous roofing membranes.
Sport and LeisureA diverse range of products for the sports and leisure sector. Monofilament and fibrillated synthetic yarns used in the construction of artificial grass for sports and landscaping applications. Coated fabric product range used in a variety of application areas, including sunshading, boat and pool, camping and sports.
TransportProducts used in both heavy and light vehicle manufacture. Primary and secondary non-woven backings for moulded car carpets and option mats, also used as reinforcement and carrier substrates in hood liners, trunk liners, door panels, package trays and car seats. Tarpaulins which are highly resilient and weatherproof and used in transport applications, including trailer side curtain manufacture and transport protection in air, road, rail and sea freight.
Key growth driversWe supply engineered polymers to a wide range of niche industrial applications with above-GDP growth potential.

6 | Low & Bonar PLC Annual Report 2013
Our Business Model and Strategy
Core capabilitiesOur business model
competitive advantage through technologies and innovationOur manufacturing processes begin with the sourcing of widely available polymers, including polypropylene, polyethylene, polyester and nylon, and formulating these using speciality additives and colours which help determine performance, aesthetics and processing efficiencies.
Leading positions in niche industrial marketsWe hold leading positions in attractive niche markets, sustained with innovative design and manufacture of components to meet the evolving demands of our customers and markets.
Strong customer focusWe populate our development pipelines with ideas and insight from our customers and markets. Our research and development teams focus on meeting customer needs with engineered products for specific applications.
excellence in innovationWe have dedicated research and development teams within each of our businesses. Our innovation is focused on delivering improved sustainability, increased functionality and greater efficiencies.
Operational capability and efficiencyOur efficient operations and talented people will underpin our aspiration to build a global business. We continue to invest in capability and efficiency across the Group.
Strengthening Group resourcesWe are investing in sales, marketing and strategy development to drive growth and build a more market-driven Group with global reach. We also continue to invest and increase effectiveness in procurement and health and safety.
POLYMer SOurcInG
NEW PRODUCTdeVeLOPMenT
cuSTOMer InSIGHT
APPLIed TecHnOLOGY
SPecIALITYYArnS
SPecIALITY FABrIcS
cOATed And cOMPOSITe MATerIALS
Our proprietary polymer formulations are subsequently processed using our broad range of proprietary technologies, and are tailored to enable the final product to deliver the desired performance characteristics.
Our end product is a speciality yarn, fabric or a coated or composite material. They are typically components which are important determinants of the performance and/or efficiency of our customer’s final product or process.

Strategic Report Governance Financial Statements
7 Low & Bonar PLC Annual Report 2013 |
Strategic Report Governance Financial Statements
7 Low & Bonar PLC Annual Report 2013 |
1.accelerating growth
We seek to accelerate our expansion into markets which have the opportunity to grow faster than the global average.
Geographically, these include China, the Middle East, North America and South America, where industrialisation, urbanisation and high infrastructure expenditure are driving growth. We also target global markets where they are supported by strong, long-term growth trends.
Key priorities• Civil engineering• Flooring products• Niche building
products
Growth geographies• China• North America• South America• Middle East
deliverables• Accelerated growth• Global business• Scale benefits
2. excelling in innovation
Our leading position in niche industrial markets is based on the innovative design and manufacture of components to meet specific customer needs.
We work closely with our customers to create products that add real value to their business, by helping their manufacturing processes become more efficient, adding functionality to their products or by improving their environmental sustainability.
Key priorities• Sustainability• Functionality• Efficiency
Key areas• Europe• North America• Emerging markets
later
deliverables• Share gain• Customer traction• High quality business
3.Driving efficiencies and building capability
We strive to ensure our product offering is underpinned by cost and efficiency leadership.
Improvements in productivity and working capital efficiency will be coupled with group-wide initiatives to invest in our organisational capability and to leverage our expertise in manufacturing, procurement and health and safety to build the foundations of a global business.
Key priorities• Organisational
capability• Technical Coated
Fabrics
Key areas• Health and safety• Productivity• Procurement
deliverables• Leverage all expertise
to build global business
• Underpin speciality offer with cost and efficiency leadership
4. complementary m&a
We will complement our organic growth strategies with “bolt-on” M&A which either accelerates our exposure to global markets or gives us access to new products in existing markets.
The acquisition of Texiplast in September 2013 is aligned to our strategy and highly complementary to our activities in the civil engineering sector. The placing which funded the acquisition provides flexibility to support further growth.
“Bolt-on” investmentsaccelerating growth in under-developed markets• Creating business and
technology platforms outside our ‘heartland’
• Leveraging existing technology, products and expertise to exploit opportunities
Accelerating growth in target segments• Product and
technology in-fills• Improving innovation
capability
Core capabilities Our strategy
8 | Low & Bonar PLC Annual Report 2013
2010
2011
2012
2013
2010
2011
2012
2013
2010
2011
2012
2013
2010
2011
2012
2013
Sales outside Europe %
The percentage of sales made from products launchedin the last three years %
Asset Efficiency %1
Operating margins %2
29
29
32
33
15.2
16.8
17.2
16.8
17.0
50
10.0Target
Target
14.3
15.8
13.0
15.7
16.0Target
Target
7.5
7.9
8.0
8.0
2010
2011
2012
2013
2010
2011
2012
2013
2010
2011
2012
2013
2010
2011
2012
2013
Sales outside Europe %
The percentage of sales made from products launchedin the last three years %
Asset Efficiency %1
Operating margins %2
29
29
32
33
15.2
16.8
17.2
16.8
17.0
50
10.0Target
Target
14.3
15.8
13.0
15.7
16.0Target
Target
7.5
7.9
8.0
8.0
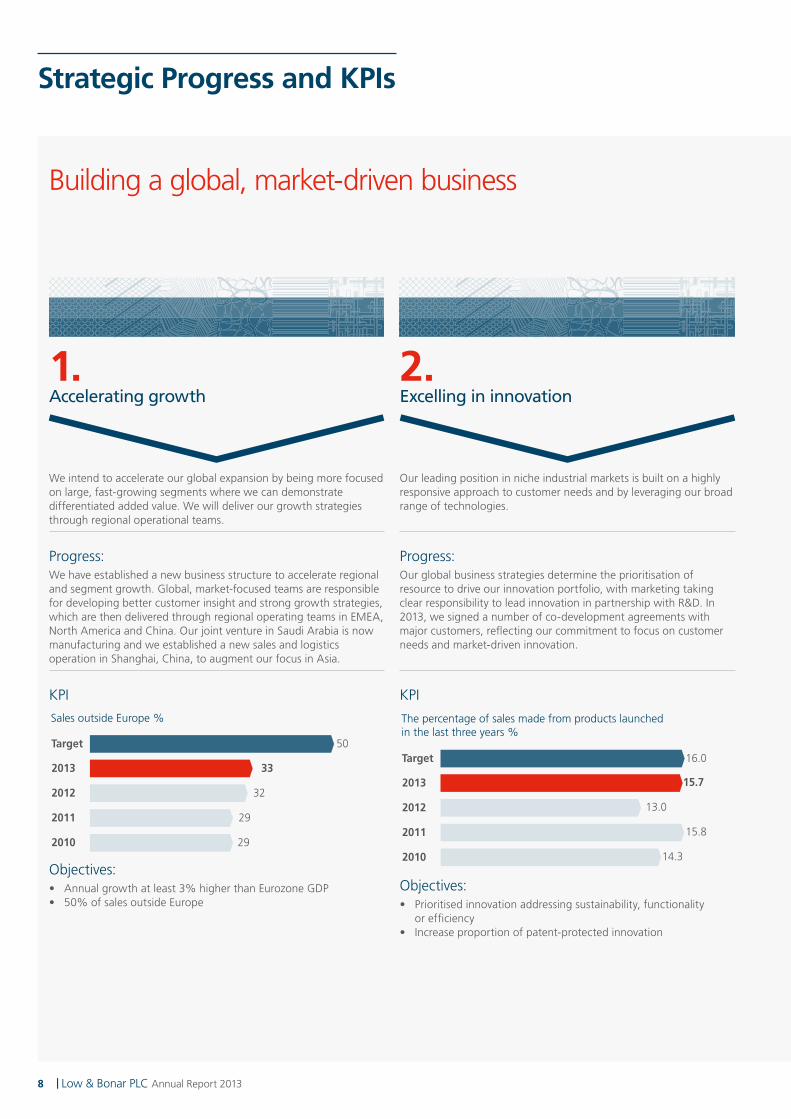
Building a global, market-driven business
Strategic Progress and KPIs
1. accelerating growth
We intend to accelerate our global expansion by being more focused on large, fast-growing segments where we can demonstrate differentiated added value. We will deliver our growth strategies through regional operational teams.
Progress:We have established a new business structure to accelerate regional and segment growth. Global, market-focused teams are responsible for developing better customer insight and strong growth strategies, which are then delivered through regional operating teams in EMEA, North America and China. Our joint venture in Saudi Arabia is now manufacturing and we established a new sales and logistics operation in Shanghai, China, to augment our focus in Asia.
KPI
Objectives:• Annual growth at least 3% higher than Eurozone GDP• 50% of sales outside Europe
2. excelling in innovation
Our leading position in niche industrial markets is built on a highly responsive approach to customer needs and by leveraging our broad range of technologies.
Progress:Our global business strategies determine the prioritisation of resource to drive our innovation portfolio, with marketing taking clear responsibility to lead innovation in partnership with R&D. In 2013, we signed a number of co-development agreements with major customers, reflecting our commitment to focus on customer needs and market-driven innovation.
KPI
Objectives:• Prioritised innovation addressing sustainability, functionality
or efficiency• Increase proportion of patent-protected innovation

Strategic Report Governance Financial Statements
9 Low & Bonar PLC Annual Report 2013 |
2010
2011
2012
2013
2010
2011
2012
2013
2010
2011
2012
2013
2010
2011
2012
2013
Sales outside Europe %
The percentage of sales made from products launchedin the last three years %
Asset Efficiency %1
Operating margins %2
29
29
32
33
15.2
16.8
17.2
16.8
17.0
50
10.0Target
Target
14.3
15.8
13.0
15.7
16.0Target
Target
7.5
7.9
8.0
8.0
2010
2011
2012
2013
2010
2011
2012
2013
2010
2011
2012
2013
2010
2011
2012
2013
Sales outside Europe %
The percentage of sales made from products launchedin the last three years %
Asset Efficiency %1
Operating margins %2
29
29
32
33
15.2
16.8
17.2
16.8
17.0
50
10.0Target
Target
14.3
15.8
13.0
15.7
16.0Target
Target
7.5
7.9
8.0
8.0
3. Driving efficiencies and building capability
Our product and service offering is underpinned by relentless focus on leadership in the following five areas: health & safety, quality, deliveries, cost and innovation.
Progress:We have maintained operating margins at 8.0% despite a tough first half of the year. Our asset efficiency ratio has reduced to 16.8% due primarily to increased stock levels at the year-end.
KPI
Objectives:• Organisational capability, leadership and marketing• Texiplast integration to maximise efficiencies and synergies
1 Operating profit before amortisation and non-recurring items as a percentage of operating capital (property, plant & equipment, trade working capital and prepayments and accruals).
2 Operating profit before amortisation and non-recurring items as a percentage of sales.
4. complementary m&a
We will augment our organic growth with M&A, which either accelerates our global expansion or supports our strategies in existing markets.
Progress:The acquisition of Texiplast in September 2013 adds a broad range of high-value geosynthetic products, which complements our existing Bonar EMEA civil offer. Based in Slovakia, Texiplast provides a strategic low-cost manufacturing base from which to also export into other regions.
Objectives:• Build presence in North America and Asia• Develop a global civil business• Bolt-on leverageable products and technologies

10 | Low & Bonar PLC Annual Report 2013
Texiplast AcquisitionLow & Bonar’s latest acquisition is an exciting addition to the Group’s civil engineering activities. Acquired in September 2013, Texiplast is a Slovakian producer of high-strength geosynethic products for demanding applications, particularly in soil reinforcement, with a strong market position in central and eastern europe.
Texiplast is an attractive business with a strong product range and innovative new technologies which will complement our existing products. It is a key building block for our Civil Engineering growth strategy, where we are looking to become a more integrated solution provider in this growing market. The acquisition will also strengthen our presence in Central and Eastern European markets and we see further benefits from leveraging and bundling our existing Bonar products through enhanced sales channels.
The Group paid €18.9m (£15.9m) to acquire Texiplast and expects to invest a further €1.5m over 2014 to bring health, safety and environmental performance up to Group standards. It has one manufacturing plant in Ivanka pri Nitre, near Bratislava, Slovakia, where it employs around 80 people on a full-time basis.
At the same time, the Group successfully raised net proceeds of £20m from shareholders. The share placing financed the acquisition and gives the Group the flexibility to pursue other near-term growth ambitions.
Strategy in Action

Strategic Report Governance Financial Statements
11 Low & Bonar PLC Annual Report 2013 |
credit – Shaw industries Group inc.
Geographical ExpansionLow & Bonar (Shanghai) Trading company Limited is a wholly-owned subsidiary of the Group, set up as a commercial hub to serve the chinese and Asia Pacific markets.
The establishment of a trading company in Shanghai in September 2013 represents an important step in accelerating our growth in the region. China is the fastest growing of our target markets within the Interior and Transportation business unit, accounting for one third of the global demand for floor covering. It is also a high-growth market for car filtration and, with a huge investment in infrastructure, an important potential market for the Group’s civil engineering products.
The office is a central point for our staff, clients and partners to meet and exchange ideas, to support our local relationships and build our cultural understanding. In addition, we opened a warehouse and distribution hub in Chanzhou to optimise our service levels.
Several of Bonar’s major flooring customers already have manufacturing facilities in the region and producing products tailored to local requirements will be key to building market share. Many Bonar staff are already spending time in the region providing technical and commercial support and this is set to expand.

12 | Low & Bonar PLC Annual Report 2013
chairman’s Statementmartin Flower
I am pleased to report that the Group had a strong second half and delivered another year of profit growth.
Profit before tax, amortisation and non-recurring items on a constant currency basis increased by 2.7% on revenues up 2.8% on last year. The second half of the year saw like-for-like revenues increase by 5.1% and pre-tax profits by 16.6% against a background of continuing macroeconomic weakness in Europe which accounts for about two thirds of Group sales. Including Texiplast, reported sales increased by 6.3% and pre-tax profits by 19.1% in the second half. Demand for our products remains robust and reflects the diversity and strength of our niche market positions and products.
Profit before tax, amortisation and non-recurring items rose 6.5% to £26.1m (2012: £24.5m). Earnings per share (“EPS”) were broadly unchanged at 6.2 pence (2012: 6.3 pence) taking into account the 10% placing in September. Statutory profit before tax from continuing operations was £17.8m (2012: £6.1m) after non-recurring charges of £2.7m (2012: £12.6m) and an amortisation charge of £5.6m (2012: £5.8m). Non-recurring charges in 2013 principally relate to costs associated with acquiring Texiplast and starting-up our geotextile joint venture, Bonar Natpet, in Saudi Arabia.
Investing to drive future growthDuring the year, the Group has made further investments totalling £21.2m to support management initiatives for future growth.
To drive growth within the Group’s civil engineering sector, we acquired Texiplast, a manufacturer of soil reinforcement, separation, filtration and erosion control products for a net cash payment of €18.9m (£15.9m) on 6 September. The acquisition of Texiplast, which is performing well, enables Bonar to become a more integrated provider of solutions for civil engineering projects, provides sales leverage for the extended product range and improves access to Texiplast’s principal Central and Eastern European markets. We continue to seek other investment opportunities, including those outside of Europe.
The Group invested £11.3m (2012: £13.2m) in property, plant and equipment during the year to support volume growth in key markets. In addition, the Group’s joint venture in Saudi Arabia, Bonar Natpet, began manufacturing from its new factory. The joint venture, which will supply geotextiles to the fast growing Middle East civil engineering market, will gradually build sales during 2014. We are also planning to make further capital investments in Asia in the coming year.
We have continued to invest in organisational capability, particularly within sales and marketing in Bonar, both in North America and Asia. We have also strengthened the leadership team in Technical Coated Fabrics to support its strategy of driving growth through expansion in attractive niche markets and operational efficiency. Both of these investments are now delivering benefits.
These are good results during a period of continued macroeconomic challenge in Europe and poor weather in the first half of the year, providing further evidence of the quality and resilience of our business and its growth prospects.
martin FlowerNon-Executive Chairman

Strategic Report Governance Financial Statements
13 Low & Bonar PLC Annual Report 2013 |
Strategic Report Governance Financial Statements
13 Low & Bonar PLC Annual Report 2013 |
IntegrityWe maintain the highest ethical standards wherever we operate. We will ensure the health and safety of all our people and minimise our impact on the environment.
Open communicationWe encourage and are committed to communicating in an open, honest and timely way.
Freedom to operateWe empower our talented people to take initiative, to think and act for themselves.
AccountabilityWe accept our individual and team responsibilities and we meet our commitments and take responsibility for our performance in all our decisions and actions.
InnovationWe innovate in everything we do from products to processes and in our organisations to create value for our stakeholders.
Share PlacingThe Group successfully completed a placing of ordinary shares representing 10% of its share capital on 11 September raising £20m. The proceeds funded the acquisition of Texiplast and will provide the Group with the flexibility and headroom to continue to pursue its growth ambitions.
Yarns Although conditions remain tough within the artificial grass yarns market, we are pleased that actions taken to reduce costs and improve performance have produced a small, but encouraging, profit this year. Further actions are being taken to improve performance within the Yarns business.
Increased dividendTo reflect the Board’s continuing confidence in the Group’s future, we are proposing a final dividend payment of 1.75 pence per share (2012: 1.6 pence per share). Subject to shareholders’ approval at the Annual General Meeting (“AGM”) in March, the dividend will be paid on 17 April 2014 to members registered as of 21 March 2014. The proposed full year dividend of 2.6 pence per share (2012: 2.4 pence per share) is covered 2.4 times (2012: 2.6 times) by earnings before amortisation and non-recurring items.
PeopleOur key asset is our people. Our current and future success rests entirely with them. I believe that Low & Bonar has a highly skilled and motivated team, which is ambitious to achieve further success. I would like to take this opportunity to thank them for their hard work during a challenging year.
Steve Good has informed the Board of his intention to retire from full time executive roles. A search for a new Chief Executive has begun. Steve will remain in his current role until the second half of the year before handing over to his successor.
OutlookThe Group has continued to make investments to drive further growth: extending its product range in attractive segments with the acquisition of Texiplast and increasing its geographical reach. These investments are already contributing to the current year and further underpin the Board’s confidence in a continuation of cash generative, profitable growth.
martin Flower4 February 2014
Our Values

14 | Low & Bonar PLC Annual Report 2013
Performance reviewSteve Good and mike holt
The Group has continued to make investments to drive further growth: extending its product range in attractive segments with the acquisition of Texiplast, and increasing its geographic reach.
These investments are already contributing to the current year and further underpin the Board’s confidence in a continuation of cash generative, profitable growth.
Steve GoodGroup Chief Executive
mike holtGroup Finance Director

Strategic Report Governance Financial Statements
15 Low & Bonar PLC Annual Report 2013 |
Strategic Report Governance Financial Statements
15 Low & Bonar PLC Annual Report 2013 |
Revenue
£403.1m(2012: £380.5m)
Group Operating Margin
8.0%*(2012: 8.0%)
* Before amortisation and non-recurring items
Low & Bonar PLc is an international performance materials group using proprietary technologies to engineer polymers for a wide range of applications in niche industrial markets.
Sales and profit momentum resumed in second half
2013£m
2012£m Actual
Constant currency(1)
Revenues from external customers
Bonar 245.6 238.7 +2.9% -0.3%Technical Coated Fabrics 124.7 115.3 +8.2% +4.9%Yarns 32.8 26.5 +23.8% +21.4%
403.1 380.5 +5.9% +2.8%
Group operating margin(2) 8.0% 8.0%
(1) Constant currency is calculated by retranslating comparative period results at current period exchange rates
(2) Before amortisation and non-recurring items
It is pleasing to report strong sales and profit growth in both Technical Coated Fabrics and Yarns, where management actions are now beginning to deliver real improvement in these businesses including market share gains. Bonar faced difficult market conditions in Europe particularly during the first half of the year and a constrained recovery in the second half within Civil engineering.
After a difficult first half, due to abnormal weather conditions across Europe which saw sales decline by 4.2% within Europe and 1.1% overall, sales for the second half were 5.1% ahead of last year on a like-for-like constant currency basis and 6.3% ahead including an in-line fourth quarter contribution of £2.5m from our recently acquired geosynthetic business in Slovakia, Texiplast. This resulted in like-for-like constant currency sales growth of 2.1% for the year as a whole, 2.8% up on last year with the inclusion of Texiplast.
Group operating margins for the year were unchanged at 8.0%, but comfortably ahead during the second half of the year at 9.9% (H2 2012: 9.1%). Margins in the second half were buoyed by a small profit within Yarns and generally better volumes throughout the Group, particularly in North America and Europe, offsetting further investment in organisational capability.
Investing and building for the futureThe Group has continued to make investments to accelerate growth, increase capability and create a stronger business. As with last year, there have been three areas of focus: bolt-on acquisitions to expand either the Group’s product range or its geographic reach; capital expenditure; and investing in people and organisational change.
On 6 September 2013, we announced the acquisition of Texiplast for €18.9m (£15.9m). Texiplast manufactures high strength geosynthetic products for demanding applications in the Civil Engineering market such as soil reinforcement, separation, filtration and erosion control. The acquisition extends our technology base and product range within civil engineering and enables a stronger solution sell within this important market for the Group. It also provides sales synergies for both Texiplast’s products and Bonar’s existing products and strengthens our position in the growing Central and East European market. Texiplast is performing in line with our expectations and is being integrated within the Bonar division.
We have made further capital investments to increase capacity and capability for target growth markets within Bonar and to improve operational efficiency within Technical Coated Fabrics. Full year expenditure was £11.3m, of which £5.3m was on expansion. In addition, our Saudi Arabian joint venture with NATPET, Bonar Natpet, has begun manufacturing products for the Civil Engineering market in the Middle East and will provide a strong platform to access this fast growing market over the next two years.
The merger and reorganisation of Colbond and Fabrics, the two major businesses within the former Performance Technical Textiles division, to create Bonar has been completed, increasing its scope and scale to grow more globally. The enlarged business is organised regionally with global business roles directing overall strategy for our key civil engineering, flooring and building and industrial markets. In January 2013, the merged business was re-branded “Bonar”. Bonar has a clear opportunity to leverage its successful European business and expertise in other regions and this organisational change is designed to accelerate this development and put it on a clear path to globalisation. In July 2013, the second phase was completed with regional management teams established for EMEA, North America and Asia accountable for the execution of the key market strategies. A new sales and logistics organisation was set up during the year in Shanghai, China to augment our focus in Asia, particularly in the fast growing Flooring market.
The Group therefore enters the new year in a much stronger position strategically, both in terms of market positioning and organisational capability and with capacity to deliver a year of significant progress. The successful share placing in September also provides the financial headroom and flexibility to continue to pursue growth opportunities.

16 | Low & Bonar PLC Annual Report 2013
Performance review(continued)
BonarOur Bonar division supplies products such as geosynthetics, carpet tile backing, agrotextiles and construction fibres to the civil engineering, flooring, transport, industrial and construction sectors.
2013 2012 ActualConstantcurrency(1)
Revenue £245.6m £238.7m +2.9% -0.3%Operating profit(2) £23.0m £25.0m -8.0% -11.5%Operating margin(2) 9.4% 10.5%
(1) Constant currency is calculated by retranslating comparative period results at current period exchange rates
(2) Before amortisation and non-recurring items
Reported sales were 2.9% above last year. Sales on a constant currency basis, including a £2.5m contribution from Texiplast, were flat. First half sales were 5.3% lower than last year on a like-for-like basis, due to the abnormal weather conditions across Europe affecting civil engineering and building products markets which were both nearly 10% down and account for about 50% of divisional sales. Second half sales on a like-for-like basis were 2.2% ahead of last year as Civil Engineering (+2.6%) and Building Products (+8.9%) sales recovered, albeit the recovery within Civil Engineering was constrained by inventory shortages and extended lead-times. A maiden contribution from Texiplast advanced civil engineering sales by a further 5.2% in the second half, in line with our expectations. The acquisition provides a strong platform for future growth. Building product sales were strong in the USA with increased demand within the residential property market offsetting softness in the European commercial market.
Underlying sales to the Flooring market were steady throughout the year. North American and Asian volumes continue to grow; however demand has been lacklustre in Europe. Automotive sales were disappointing, down 5.6% on last year, as a key customer switched sourcing on one of its platforms part-way through the year. Industrial markets were mixed. Good progress continued in new filtration applications; however, this was offset by a more subdued agricultural screens market.
The integration of the Colbond and Fabrics commercial activities was completed during the year creating a new “go-to-market” organisation.
The focus is now on accelerating growth, particularly outside of Europe. The division continues to seek investment opportunities in the USA and has recently set up a new sales team and warehousing in Shanghai, China to support and drive growth in Asia, with a particular focus on China, Taiwan, Malaysia and Australia.
Our joint venture geotextile plant in Saudi Arabia began manufacturing shortly before the year-end. Utilisation is expected to gradually build up during the upcoming year and the joint venture is expected to make a small but positive profit contribution. Importantly, the ramp-up will free up much needed capacity within Europe to support growth in civil engineering. Capital expenditure totalled £7.5m within Bonar, which includes £2.5m on extending capacity and £2.9m relating to health and safety projects. Accident rates have reduced significantly this year and, whilst there remains some way to go to achieve all of our objectives, this year’s progress has been excellent.
Bonar remains well positioned to grow in its European markets and continues to invest to accelerate its exposure to markets outside Europe, where significant growth opportunities exist for its products and technologies.

Strategic Report Governance Financial Statements
17 Low & Bonar PLC Annual Report 2013 |
Strategic Report Governance Financial Statements
17 Low & Bonar PLC Annual Report 2013 |
Mina de Cobre in PanamaThe Mina de cobre is a large open-pit copper development project in Panama, located 120 kilometres west of Panama city and 20 kilometres from the caribbean Sea coast, in the district of donoso, colon province, in the republic of Panama.
During the year, construction commenced on:
• connection roads between the copper mine and storage facilities at the nearby port;
• a storage facility for the copper ores at the port; and
• a new terminal for overseas transportation.
Bonar has supplied a large quantity of Bontec NW non-woven products and EnkaGrid Max 20 to assist in this construction. Examples of the use of Bonar products in this project include:
• installation of silt fences as an environmental measure in order to avoid landsliding during construction;
• road construction and the installation of a 60,000m2 platform on the site as a storage area; and
• installation of ditches around this platform to act as protection.
BonarRevenue
£245.6m(2012: £238.7m)
Operating Profit
£23.0m(2012: £25.0m)
Operating Margin
9.4%(2012: 10.5%)

18 | Low & Bonar PLC Annual Report 2013
Performance review(continued)
Technical coated Fabrics Our Technical Coated Fabrics division, Mehler Texnologies (“MTX”), supplies products such as side curtains for lorry trailers, advertising banners, tensioned structures, awnings, marquees and tarpaulins to the print, architectural and transport markets.
2013 2012 ActualConstant currency(1)
Revenue £124.7m £115.3m +8.2% +4.9%Operating profit(2) £12.1m £10.7m +13.1% +13.2%Operating margin(2) 9.7% 9.3%
(1) Constant currency is calculated by retranslating comparative period results at current period exchange rates
(2) Before amortisation and non-recurring items
Sales on a constant currency basis grew by 4.9%. Sales were better than last year in all major sectors and margins improved by 40bps to 9.7% with constant currency operating profits growing by 13.2%. The rate of sales growth was particularly strong in the second half of the year (+6.1%). Improved margins reflect increased volumes, but more importantly management’s focus on margins within the trailer and niche industrial markets.
In the Transport sector, sales to the trailer side curtain market advanced 7.1% due to share gains and increased activity in the new truck market. Sales in the Industrial sector were also strong, up 6.7% on last year with growth in container applications and increased demand in higher-end print applications, whilst competition from low-cost Asian competitors continued to take uncontested share gains in low-end applications. In the Leisure sector, sales to boat and pool applications were also lower as these markets continue to suffer from reduced discretionary spending; Southern Europe was, as expected, particularly weak. The division has continued to build its capability to directly service regions outside of Europe with new investments having been made to accelerate progress in India, Brazil and the USA. Capital expenditure totalled £4.6m and included £2.0m on improving manufacturing capability.
Further progress has been made in improving operating efficiencies, a key focus of the leadership team. Despite significant improvement in the management of health and safety risk, accident rates increased. Health and safety related capital expenditure was £0.9m.
The division has attractive growth opportunities in Architectural, Industrial and other niches and this, combined with a commitment to operational excellence, will drive further improvements in the growth and quality of earnings.
Palais ThermalAt Palais Thermal, located at the Bad Wildbad in the Black Forest, Germany, MTX worked in close co-operation with the architect to construct a highly aesthetic screen and wind shield on a multistory building housing a health resort. Valmex FR 1600, Mehatop F, the strongest tensile architecture fabric available in the market, was selected as the right solution. This product can absorb forces from the most severe weather conditions and transfer them to the steel poles and into the building. Technical
coated FabricsRevenue
£124.7m(2012: £115.3m)
Operating Profit
£12.1m(2012: £10.7m)
Operating Margin
9.7%(2012: 9.3%)

Strategic Report Governance Financial Statements
19 Low & Bonar PLC Annual Report 2013 |
Al AinAl Ain is the most successful football club in the UAE, and the only UAE side to win the AFC Champions League. Founded in 1968, the club has already won 54 major tournaments in the region, including 14 league titles.
Their new stadium field is natural turf, but uses the Bonar Yarns MN Ultra yarn in the pitch surround. Outside and next to the stadium are four large size five-a-side pitches, featuring Bonar Yarns FB Ultra yarn in Sports Green for the play areas and Olive Green for the surround. The installation was carried out by Support in Sport, the same company that constructed and installed the Saracens rugby pitch at Allianz Park, London utilising Bonar yarns. Yarns
Revenue
£32.8m(2012: £26.5m)
Operating Profit
£0.5m(2012: loss of £1.8m)
Operating Margin
1.5%(2012: (6.8)%)
Yarns Our Yarns division supplies yarns used in the manufacture of artificial grass in sports and landscaping applications as well as yarns used as a backing material in the manufacture of woven carpets.
2013 2012 ActualConstant currency(1)
Revenue £32.8m £26.5m +23.8% +21.4%Operating profit/(loss)(2) £0.5m £(1.8)mOperating margin(2) 1.5% (6.8)%
(1) Constant currency is calculated by retranslating comparative period results at current period exchange rates
(2) Before amortisation and non-recurring items
The business, which represents 8% of Group sales, made significant progress this year. Sales volumes increased by 24% partly through slightly easier, although still tough, market conditions but mainly through share gains. Sales to the USA and the Middle East were particularly strong. Actions taken last year to reduce costs across the business added to operational leverage to deliver a small operating profit of £0.5m. We are continuing to work on additional measures to improve performance and the Group is confident that the business will make further progress in 2014.

20 | Low & Bonar PLC Annual Report 2013
Financial review
Pre-tax profitProfit before tax, amortisation and non-recurring items from continuing operations increased by 6.5% to £26.1m (2012: £24.5m), an increase of 2.7% on a constant currency (underlying) basis. Operating profits were 5.6% higher than last year at £32.2m (2012: £30.5m) including a contribution of £0.4m from Texiplast, acquired on 6 September 2013. On an underlying basis, operating profits were 1.9% ahead. Statutory profit before tax was £17.8m (2012: £6.1m) after a net non-recurring charge of £2.7m (2012: £12.6m) and a £5.6m charge for amortisation (2012: £5.8m).
non-recurring itemsThe Group incurred £0.9m of costs in connection with its acquisition of Texiplast and £0.1m in relation to potential acquisitions. In 2012, costs of £0.7m were incurred in relation to acquisitions, mainly in respect of the acquisition of Xeroflor. A further £1.2m (2012: £0.2m) of non-recurring costs arose in relation to the start-up of the Group’s joint venture, Bonar Natpet, which was commissioned during the second half of the year. This included £0.6m (2012: nil) of the Group’s share of costs borne by the joint venture.
Other non-recurring costs related to the set-up of a new legal entity, sales office and warehousing facility in China (£0.3m) and the integration of the Group’s principal Performance Technical Textile operations into a single global business, Bonar, which began last year (£0.2m (2012: £0.5m)).
The carrying value of assets within each Cash Generating Unit has been reviewed and no impairment or write-back has been booked. Last year, an impairment charge of £11.2m was booked against the assets within the Yarns business.
TaxationThe overall tax charge on the profit before tax was £5.0m (2012: £4.7m). The tax charge on profit from continuing operations before amortisation and non-recurring items was £6.8m (2012: £6.4m), a rate of 26.0% (2012: 26.0%). The full effective tax rate during 2013 was 27.9% (2012: 77.5%), substantially lower than last year due to the non-deductible asset impairment arising in 2012. Prior year adjustments increased the tax rate by 1.2% (2012: reduced by 2.3%) and relate primarily to changing estimates in respect of earlier years. The tax rate on profit from continuing operations before amortisation and non-recurring items for 2014 is expected to be marginally higher than 2013 due principally to recent legislative changes in the Netherlands.
AcquisitionsOn 6 September 2013, the Group acquired Texiplast for a net cash consideration of €18.9m (£15.9m). The fair value of assets totalled £10.2m including marketing and customer relationship intangible assets of £0.7m. Goodwill arising on the acquisition was £5.7m. Texiplast’s business has been integrated into our Bonar segment, and contributed £2.5m and £0.4m to the Group’s sales and operating profit before amortisation and non-recurring items for the year respectively.
The acquisition was funded by a 10% placing of ordinary shares, which raised £19.8m net of costs. The placing also provides flexibility and headroom for the Group to pursue its growth ambitions.
cashOverall net debt increased to £86.8m from £82.6m at November 2012. Cash inflow from operations was £39.6m (2012: £40.3m) excluding a shareholder loan of £9.1m to the Group’s 50/50 Saudi Arabian joint venture, Bonar Natpet. Since year-end, £6.0m has been repaid and the balance of the loan is expected to be repaid in the coming year.
Trade working capital as a percentage of sales increased from 22% last year to 23%, contributing to a cash outflow into working capital of £4.8m (2012: £4.3m) excluding the joint venture loan.
During the year, the Group spent £15.9m (2012: £8.6m) on acquisitions and joint ventures, £11.3m (2012: £13.2m) on property, plant and equipment and £2.1m (2012: £1.0m) on intangible assets. Excluding replacement and health and safety capital expenditure, the amount invested in driving future growth was £5.3m (2012: £9.5m).
The analysis of the Group’s total net debt is as follows:
2013 2012£m £m
Cash and cash equivalents 17.9 26.9Total bank debt (104.7) (109.5)
Total net debt (86.8) (82.6)
The gearing ratio of total net debt to EBITDA was unchanged at 1.9 times.
PensionsThe charges for pensions are calculated in accordance with the requirement of IAS 19 Employee Benefits. During the year, the Group’s UK defined benefit scheme continued to adopt a lower risk investment strategy in which the interest rate and inflation risks were more closely hedged and the exposure to equities was held at 27% of the scheme’s assets (2012: 25%). The UK scheme deficit has reduced to £3.8m (2012: £15.1m), principally due to the outperformance of the scheme’s assets against their expected return. The deficit in the Group’s overseas schemes in Belgium, Germany and the USA reduced to £8.9m (2012: £9.7m).

Strategic Report Governance Financial Statements
21 Low & Bonar PLC Annual Report 2013 |
Strategic Report Governance Financial Statements
21 Low & Bonar PLC Annual Report 2013 |
EPS*
6.2p(2012: 6.3p)
PBTA*
£26.1m(2012: £24.5m)
Full Year Dividend
2.6p(2012: 2.4p)
* Before amortisation and non-recurring items
return on capitalThe Group’s return on operating capital employed at the year end was 16.8% (2012: 17.2%).
earnings per share Earnings per share before amortisation and non-recurring items were marginally lower than last year at 6.2 pence per share (2012: 6.3 pence) due to a higher number of shares following the share placing in September. The weighted average number of shares was 301.0 million (2012: 288.4 million).
dividendsTaking into account performance during the second half of the year and our confidence in the future prospects of the Group, the Board is recommending a final dividend of 1.75 pence per share (2012: 1.6 pence), increasing the full year dividend to 2.6 pence per share (2012: 2.4 pence). Subject to shareholders’ approval at the Annual General Meeting in March, the dividend will be paid on 17 April 2014 to members registered as of 21 March 2014. The proposed full year dividend is covered 2.4 times by earnings before amortisation and non-recurring items.

22 | Low & Bonar PLC Annual Report 2013
Principal risks and uncertainties
rISK MITIGATInG STrATeGY
Global economic activityThe Group may be adversely affected by global economic conditions, particularly in its principal markets in mainland Europe and North America. The volatility of international markets could result in reduced levels of demand for the Group’s products, a greater risk of customers defaulting on payment terms, supply chain risk and a higher risk of inventory obsolescence.
Local operating management monitor their own markets and are empowered to respond quickly to changing conditions. Production costs may be quickly flexed to balance production with demand, including the use of short-time working arrangements where available. Further actions, such as reducing the Group’s cost base and cancelling or delaying capital investment plans, are available to allow continued profitability and cash generation in the face of a sustained reduction in volumes.The Group has a broad base of customers. Group policies ensure customers are given an appropriate level of credit based on their trading history and financial status, and a prudent approach is adopted towards credit control. Credit insurance is used where available.Procurement management mitigate supply chain risk by identifying and qualifying alternative sources of key raw materials.
Growth strategy The Board believes that growth, both organic and through acquisitions, is a fundamental part of its strategy for the Group. The Board reviews such growth opportunities on an ongoing basis and its acquisition strategy is based on appropriate acquisition targets being available and on acquired companies being integrated rapidly and successfully into the Group.
The current focus of the Group is on profitable, cash-generative organic growth supplemented by acquisitions where appropriate.The senior management team is experienced and has successfully executed and integrated several acquisitions and joint ventures in the past. Acquisitions are made subject to clearly defined criteria in existing or adjacent segments whose products and technologies are well understood, and only after extensive pre-acquisition due diligence. Acquisition proposals are supported by a detailed post-acquisition integration plan that is rigorously managed through to completion.
Organic growth/competition The markets in which the Group operates are competitive with respect to price, geographic distinction, functionality, brand recognition and the effectiveness of sales and marketing.
The Group has chosen to operate in attractive niche markets within the technical textile industry, using proprietary technology to manufacture products which are important determinants of the performance and/or efficiency of our customers’ final product or process.Significant resources are dedicated to developing and maintaining strong relationships with our customers, and to developing new and innovative products which meet their precise needs. The Board believes that these factors maintain the Group’s strong competitive position.
Identify
Formal responsibility for risk matters set out in the Group Risk Register is divided between the Board, the Audit Committee, the Remuneration Committee and the Risk Oversight Committee. Internal audit also has a direct reporting line to the Audit Committee and attends Audit Committee meetings by invitation. As careful management of risk is also a key management activity, the Group’s work in the area of operational risk management has been facilitated by the Risk Oversight Committee.
The key risks noted below are evaluated by these bodies as a standing agenda item at each of the relevant meetings in terms of the probability of the risk occurring and the impact it would have on the Group.
The Group has an established risk management framework which is designed to identify, evaluate and manage the risks and uncertainties facing the Group. Within this framework we classify risks into four distinct categories according to their potential impact upon the Group:
Evaluate Mitigate
Strategic – risks impacting long-term strategic objectives.
Operational – risks arising during day-to-day activities which if not managed could impact upon the running of the business.
Financial – risks impacting directly upon the finances of the business.
compliance – risks relating to legal and regulatory sanctions and damage to goodwill arising from failure to comply with applicable laws and regulations.
Each identified risk has a mitigation process developed for it including how often the mitigation activity takes place, who is accountable for the process, the timetable for the assessment of the adequacy of the mitigation strategy and who will undertake the assurance to ensure that the risk is mitigated.

Strategic Report Governance Financial Statements
23 Low & Bonar PLC Annual Report 2013 |
Strategic Report Governance Financial Statements
23 Low & Bonar PLC Annual Report 2013 |
rISK MITIGATInG STrATeGY
cyber securityDisruption to or penetration of our information technology platforms could have a material adverse effect on the Group.
The Group has business continuity measures in place to minimise the impact of any disruption to its operations. The Group’s information technology resources are continuously monitored and maintained by appropriately trained staff and safeguards are in place to provide security of our networks and data.
Business continuity The occurrence of major operational problems could have a material adverse effect on the Group. These may include risks of fire or major environmental damage.
The Group has business continuity/disaster recovery plans in place to minimise the impact of any disruption to its operations and has process controls and proactive maintenance programmes designed to avoid problems arising. These are supported by regular site visits from risk management and internal audit staff, and training programmes provided by the Health, Safety and Environment Committee.Where appropriate, risks are partially transferred through insurance programmes.
raw material pricing The Group’s profitability can be affected by the purchase price of its key raw materials and its ability to reflect any changes through its selling prices. The Group’s main raw materials are polypropylene, polyester, nylon, polyethylene and PVC. The prices of these raw materials are volatile, and they are influenced ultimately by oil prices and the balance of supply and demand for each polymer.
The Group has a good level of expertise in polymer purchasing and uses a number of suppliers to ensure a balance between competitive pricing and continuity of supply.The Group’s focus on operating efficiencies and the strength of its product propositions has in the past allowed the effect of raw material cost increases to be successfully mitigated.
employees The Group is reliant on its ability to attract, develop and retain key employees.
Employee retention and development is a key feature in ensuring the continued success of the Group. Employees are recruited and regularly appraised against a formal job specification. Formal policies cover all material aspects of employment and we are committed to high standards of health and safety at work, effective communication with employees and employee development.We empower our people to take initiative, to think and act for themselves.
FundingThe Group, like many other companies, is dependent on its ability to both service its existing debts and to access sufficient funding to refinance its liabilities when they fall due and to provide sufficient capital to finance its growth strategy.
The Group manages its capital to safeguard its ability to continue as a going concern, to optimise its capital structure and to provide sufficient liquidity to support its operations and the Board’s strategic plans. The Group’s borrowing requirements are regularly reforecast to ensure funding is in place to support its operations and growth plans. Compliance with the covenants associated with these facilities is closely monitored.
TreasuryForeign exchange is the most significant treasury risk for the Group. The reported value of profits earned by the Group’s overseas entities is sensitive to the strength of Sterling, particularly against the Euro and, to a lesser extent, the US Dollar. The Group is exposed to a lesser extent to other treasury risks such as interest rate risk and counterparty credit risk.
Group policy aims to naturally hedge transactional foreign exchange risks by buying and selling in the same currency. Policy in relation to residual risk ensures treasury activities are focused on the management of risk with high quality counterparties; no speculative transactions are undertaken. The Group uses financial instruments to manage the exposures that may arise from its business operations as a result of movements in financial markets.
Pension fundingThe Group may be required to increase its contributions into its defined benefit pension schemes to cover funding shortfalls. The funding may be affected by poor investment performance of pension fund investments, changes in the discount rate applied and longer life expectancy of members.
The main Group scheme is closed to new members and to future benefit accrual; and assumptions, including funding rates, are set in line with the actuaries’ recommendations. Regular dialogue takes place with pension fund trustees and the Board regularly discusses pension fund strategy.
Laws and regulationsThe Group’s operations are subject to a wide range of laws and regulations, including employment, environmental and health and safety legislation, along with product liability and contractual risks.
The Group’s policy manuals ensure all applicable legal and regulatory requirements are met or exceeded in all territories in which it operates, and ongoing programmes and systems monitor compliance and provide training for relevant employees.Product liability risks are managed through stringent quality control procedures covering review of goods on receipt and prior to despatch and all manufacturing processes. Insurance cover, appropriate for the nature of the Group’s business and its size, is maintained. The Group also seeks to minimise risks through its terms and conditions of trading.

24 | Low & Bonar PLC Annual Report 2013
corporate Social responsibility
Corporate responsibility lies at the heart of Low & Bonar’s business values, and we understand that our stakeholders, ranging from our site neighbours and employees through to our customers and investors, have rising expectations of both our corporate responsibility commitment and performance. Whilst each of our business values has a corporate responsibility context, it remains our value of integrity, which we describe as “maintaining the highest ethical standards wherever we operate ...and to ensure the health and safety of all our people and minimise our impact on the environment”, through which we bring corporate responsibility into our day-to-day business operations and practices.
2013 has again been a period during which we have focussed significant effort, resource and capital in key areas of our corporate responsibility management programmes across all of our businesses. We remain committed to reviewing all aspects of our corporate responsibility management processes and looking for opportunities to improve them, as we are clear that by doing so we will secure the long-term strategy of the Group.
environmentEnvironmental management remains a key area of focus for the Group. We recognise that we have an environmental impact through our use of raw materials, our manufacturing processes and our products. We continually seek to improve in all aspects of our environmental management and regard compliance with environmental regulation as the minimum standard to be achieved.
Currently, Low & Bonar is reviewing its environmental programme, and is developing a new Environmental Management Policy statement. We are also considering our environmental management system approach and key performance indicators for environmental performance across all of our businesses and manufacturing sites.
Our businesses play a key role in environmental management and their environmental impacts are specific to their manufacturing processes and locations, as well as to their product portfolios. Each business has local environmental policies and improvement plans in place to support the Group environmental policy, and environmental performance metrics form an integral part of their management information. Each business therefore seeks to continuously improve the management of their environmental impacts, ensure that their existing products provide the best environmental performance available and, where possible, to innovate with new products that have sustainability at their core, and to add real value to our customers.
Environmental management systems Currently, Bonar’s two manufacturing sites in Belgium and our operation in China have been certified to the Environmental Management Systems ISO 14001:2004. Bonar are currently looking to expand the number of sites certified to this standard, and are in the process of developing a two-year programme to include the majority of its sites. A similar review is being undertaken by Yarns.
Meanwhile, all of MTX’s and Bonar’s manufacturing sites in Germany are looking to implement the ISO 50001:2011 Energy Management Systems Standard over a two year period.
Greenhouse gas emissionsThis year, we also report for the first time our Global Greenhouse Gas Emission Footprint. This emission data covers all direct and indirect emissions for all relevant Group companies. More information is included on page 29.
Divisional environmental overviewMTX continues to operate its “Eco-care” programme to demonstrate its commitment to environmental issues. The programme has been designed to bring the responsible management of energy and resources, sustainable materials and recycling of coated textiles under one all-embracing label. The Eco-care concept accompanies products throughout their life cycle, including incorporation of ecological criteria in the selection of raw materials, the use of less environmentally harmful production processes, the use of recyclable packaging materials and participation in the development of recycling systems. More information and a brochure on Eco-care can be found at www.mehler-texnologies.com/EN/texnologies/eco-care.php.
Bonar focuses its efforts on energy efficiency, the reduction of process emissions, the replacement of virgin raw materials with recycled material, where possible, and the minimisation of waste. Active plans are in place to support continuous improvement and these plans will be enhanced by improved reporting metrics and the broader adoption of certified environmental management systems as described above.
Yarns also places environmental management and performance at the heart of its business. Yarns use a technology which allows recycling of much of the polymer waste from the production process by re-extruding it into pellets, which are then reused as raw material in specific products, making the production process both environmentally and financially efficient.
Low & Bonar productsThe Group is proud of its many products, which, as well as providing excellent quality and value, often support our customers in reducing the environmental footprint within their supply chain. As an example of our work on implementing plans for continuous improvement in this area, Xeroflor was awarded silver “cradle-to-cradle” certification in 2013 for its XF 300, XF 301, XF 317 and XF 324 products. Bonar’s Belgian operations produced 40 tons of biodegradable tapes made from PLA this year and, following a review of its manufacturing process in Germany, is planning a new winder which will lead to tighter rolls, ensuring that more rolls can be transported in one customer delivery and thereby reducing the product miles impact.
Alternative energy infrastructure and energy saving productsAlternative energy sources such as biogas are becoming increasingly important. Biogas is highly volatile and explosive, and must be stored in containers that offer maximum levels of safety. Flexible VALMEX® enviro pro gas tanks, manufactured by Mehler Texnologies, are ideally suited to this application due to their special fabric design meeting strict safety standards. Further details can be found at www.mehler-texnologies.com/EN/products/ environment/index.php. There has been a further expansion of our range of greenhouse screens with two recent product lines (Lumina and Clima ranges) which have been designed to reduce energy consumption in greenhouses.

Strategic Report Governance Financial Statements
25 Low & Bonar PLC Annual Report 2013 |
Strategic Report Governance Financial Statements
25 Low & Bonar PLC Annual Report 2013 |
Texiplast ProductsThe acquisition this year of Texiplast, based in Slovakia, adds to our civil engineering market sector product range and complements our solutions sales strategy for this sector. This is especially the case in the extension of our grids and high-tensile woven geotextiles product ranges.
The main functionality of these geogrid and high-tensile woven textiles products, produced by a weaving or knitting process, is the reinforcement of infrastructure works such as roads, steep slopes, bridge abutments and embankments.
The products can have a valuable environmental impact. When used as part of a precision engineering design the soil is reinforced to such an extent that the amount of traditional building materials like gravel, stones and concrete needed to create a stable structure can be significantly reduced.
Case studies issued by the Geosynthetical Institute show that, when replacing traditional material solutions with geosynthetic reinforcement materials, not only are costs significantly reduced, but the carbon footprint of that element of the project is also reduced.

26 | Low & Bonar PLC Annual Report 2013
corporate Social responsibility(continued)
Ground management and groundcover materialsBonar continues to supply its weed-controlling groundcovers (which reduce or eliminate the need for pesticides) and soil-stabilising and filtering geotextiles which provide protection against soil erosion and contamination. A key component of Bonar’s sustainable groundcover product range is Duracover, a 100% bio-based textile/compostable groundcover earning a 4-star certificate from AIB Vinçotte1.
1 Worldwide AIB Vinçotte provides more than 130 specialised and independent inspection, monitoring and certification services, analyses and tests for the most wide ranging applications in the field of electricity, hoisting apparatus, pressure equipment, civil engineering, safety in the work place, environmental protection and radiant protection.
Artificial grassYarns is a leading manufacturer of artificial grass yarns. The use of artificial grass reduces customer water consumption, along with consequent reductions in energy use and other emissions related to water production. Artificial grass also allows the end user to eliminate completely the use of fossil fuels for lawn or pitch maintenance and to avoid the harmful dispersion of fertilisers and herbicides into the environment.
Green building infrastructure materialsBonar recognises the importance of “Green Building” design and that LEED2 Certification of buildings (along with other green building rating schemes) is becoming increasingly prominent. Bonar’s green roof products, compliance with energy performance criteria and optimisation of energy performance provide important aids to architects, landscape architects and engineers to help their buildings achieve LEED Certification.
2 LEED certification is a recognised standard for measuring building sustainability. The LEED green building rating system, developed and administered by the U.S. Green Building Council, is designed to promote design and construction practices that increase profitability while reducing the negative environmental impacts of buildings and improving occupant health and well-being.
A significant enhancement of our green roof range took place recently as a result of our acquisition of the Xeroflor business in 2012. Xeroflor’s core activity is in the design and supply of value-added pre-vegetated mats used in green roof construction in both new and refurbished buildings. Xeroflor also supplies other key functional components in green roofing systems to a network of customers globally.
environmental impacts and examples of improvement programmesRaw material usageRaw material usage is an important impact for all manufacturing businesses. Sourcing and the efficient use of raw material, including, where possible, the use of previously used or recycled material, remain important environmental management activities.
Bonar recently launched Colback® Green, a high-performance carpet backing made of 100% recycled raw materials. It contains post-consumer recycled polyester and polyamide-6 generated from carpet waste and creates the first recycling loop for the face side of carpet tiles and broadloom carpet. Bonar’s Colbonddrain® range of products, a pre-fabricated vertical drain for accelerating soil consolidation in civil engineering projects, has a patented high-performance drainage core made of polyolefin from recycled bottles, caps and labels. Bonar also offers EnkaRetain & Drain®, a drainage, protection and insulation layer developed to suit the demands of the growing North American green roof market, with a composite made from post-industrial recycled polypropylene.
Meanwhile MTX is now selling 1.8 million m2 of coated fabric based on recycled material, per annum, an increase of 20% compared to the prior year.
Yarns innovative Bonaeco® carpet yarns are made from 100% recycled material.
Energy management and the use of renewable energyEnergy use is a key manufacturing impact for Low & Bonar, as well as a significant cost. The Group’s businesses continually review opportunities to reduce energy use and review the balance of renewable energy in their energy mix.
Yarns are part of the UK Government’s Carbon Reduction Commitment (“CRC”) energy efficiency scheme and share the information across their international operations.
Since 2005, Bonar’s two sites in Belgium have been working with an energy audit organisation established under the framework of the Kyoto Protocol. Bonar’s non-woven and woven fabrics production site has been screened for its energy consumption and all significant energy uses in the plant were measured separately, enabling us to take targeted measures where necessary. For example, at our Lokeren site, a new lighting system was installed in the weaving department which resulted in a 50% increase in light intensity, creating a more pleasant work environment for our employees, and will also result in an annual energy saving of 170,000 KWh due to the use of the latest generation of lamps. This exercise will also be repeated in parts of the extrusion department.
In addition, at Lokeren, there was an investment in a new chiller unit covering all extruders in the extrusion department. As a result of the investment, an older type refrigerant has been replaced and there will be an energy saving due to the higher efficiency of the installation and the use of free cooling capacity.
At our Arnhem site in the Netherlands, modifications were made to allow additional adjustments to plant controls which make it easier to control energy consumption. Compared to 2008, a saving on electricity of 15%, and 7% for gas, per m2 of production was reached in 2013. For 2014, a further investment is planned which will further reduce the gas consumption per m2 by 10%.
Our Xeroflor business has recently switched to a 100% renewable energy supply as part of its programme on “cradle-to-cradle” certification.
Waste management Waste generation is a key environmental impact of our business, as well as a cost, and a waste hierarchy process which starts with avoiding waste production through to reuse and recycling has been adopted throughout our operations.
At MTX the recycling of PVC waste is key to environmental performance, and MTX is a member of and financial supporter of:
http://www.pvc-partner.comhttp://www.aktion-pvc-recycling.dehttp://www.vinyl2010.org

Strategic Report Governance Financial Statements
27 Low & Bonar PLC Annual Report 2013 |
In seeking to minimise waste for customers, Bonar is taking advantage of its two-step Colback® manufacturing process which allows production of tailor-made widths. The Detection Cut Compensate (DCC) system on the Colback® fleecing lines in the Netherlands reduces length waste and also improves operator safety. This technology has been expanded into our Bonar operation in Asheville, USA, this year.
Following the installation of an online waste recycling unit on one of the extrusion lines at Lokeren to reduce waste levels last year, a second online recycling installation was completed this year.
At our manufacturing site in Asheville, circa 275 US tons of waste materials, such as process by-product, waste packaging materials and obsolete materials, were diverted from landfill disposal. These were instead redirected toward reuse and recycling processes (equivalent to preventing 14 tractor trailer loads of waste from being placed in landfill).
WaterWater usage is not a significant environmental impact for the Group due to the nature of our manufacturing operations. However, as an important resource, water usage is tracked and monitored by Group companies and water management activities are reviewed. As an example, in 2013, the Zele site executed a water management programme which involved the separation of the waste water and process water circuit from the rainwater circuit, resulting in cleaner surface water in the non-woven plant. At the same site, in the construction fibre plant at Zele, a significant part of rainwater is now guided to a rain water basin, again resulting in cleaner surface water.
Management of health and safety The health and safety of our employees, as well as others who may be affected by the Group’s operations, remains a key management responsibility and priority throughout the business. Our focus on health and safety has continued this year as we continue to aim for improvement both in our health and safety performance and in our arrangements for managing health and safety.
In the year to 30 November 2013, the Group recorded an accident rate3 of 380, compared to a rate of 696 in 2012 and 748 in 2011. This represents a substantial improvement on last year’s performance and means that we have exceeded the interim Group accident rate target of 580, to be reached during this period. Our current performance compares well to the EU 27 accident rate of 1,6574, based on the same definition of accident rate used by Low & Bonar. This also meant that, during 2013, the number of sites that experienced a 3+ Day lost time accident (“LTA”) reduced to three.
3 Number of work related accidents with more than 3 days’ absence that occurred during the year per 100,000 employees.
4 Based on EU Eurostat data – H&S at Work Statistics 2012.
However, we remain mindful that there is still room for improvement, and that accident statistics such as these continue to reveal only part of the story on successful health and safety management. As such, and as the Group reached the end of its interim target period in 2013, it has set a new interim target, this time based on total lost time accidents, not just 3+ day lost time accidents, in an attempt to further improve our health and safety management. Thus, whilst our goal remains zero accidents, the new total lost time accident incident rate5 target is 1,000, to be reached by 30 November 2015, representing a target of a further 33% improvement in the incidence rate.
5 Number of work related accidents that involve the loss of any time from work per 100,000 employees.
We are also aware that health and safety culture is a key component of any health and safety management system. In order to understand our health and safety culture better, a survey of 156 plant managers, supervisors, shift leaders and health, safety and environmental (“HSE”) professionals was carried out across all Group companies this year. The 87% response rate gives us a high degree of confidence in the survey findings which overall were positive, indicating high levels of understanding of our health and safety programme and strong commitment to deliver it. Many constructive comments were provided about what measures should be considered to support our on-going work to achieve a proactive health and safety culture and these are being followed up.
The group-wide health and safety strategy developed by the Global Health, Safety & Environmental Committee, a sub-committee of the Risk Oversight Committee, and approved by the Board of Directors in February 2012 remains in place, with good progress again made in implementing the strategy this year. The strategy supports both our “Zero Accident Goal” and “Best in Class” aspirations, and aims to embed a strong and proactive health and safety culture across all aspects of our business. The cornerstones of the strategy encompass improvements to visible leadership, risk-based management and health and safety competence, and a number of initiatives were either started this year or fully implemented group-wide. These included:
• the addition of three senior operations members to the Global HSE Committee to ensure enhanced employee engagement on HSE matters and ensure we are focussing on real risks within the Group;
• continuing the theme of employee engagement, Low & Bonar held its first global health and safety week this year, involving all group sites and focussing on fire prevention;
• enhancement of our HSE resourcing continues in order to support our ambitious health and safety improvement program, as well as changes to supplement local site HSE resource with regional co-ordinators. Similarly, enhancements to health and safety operating expenditure and capital expenditure have been approved to facilitate our ability to deliver these changes;
• the embedding of a broader range of health and safety metrics which has enabled us to better understand our risk improvement opportunities. Within these new metrics, a first aid/ medical treatment category has been fully integrated, and the new category of “Near Miss” incident introduced last year has led to 636 near miss reports being submitted in the last 12-month period, providing substantial information allowing us to further improve our focus on accident avoidance;

28 | Low & Bonar PLC Annual Report 2013
corporate Social responsibility(continued)
• the development of risk management and accountability improvements via the enhancement of the Group, divisional and site risk registers;
• our Global Health and Safety Community, involving all plant managers and HSE professionals, which facilitates best practice exchange and is a key forum for professional development, continues to meet. A key focus this year was an industrial theatre event on behavioural safety interventions;
• a process of best practice exchange visits has commenced, and will involve all business operations. These visits aim to identify best practices at locations and then share the information across the group so that we share the knowledge and experience that exists in the business;
• a global IT platform for Group health and safety information has been developed to improve accessibility to Group health and safety policies and standards, and population of this intranet site has commenced. Access to the site is being broadened to include all of our Global HSE Community members; and
• new Global Improvement Programmes on hand safety, slips, trips and falls and manual handling, which account for circa 80% of all of our accidents, have been developed with the aid of the Global HSE Community, and we have set ourselves the goal of implementing these improvement programmes over the next 18 months.
The Group has maintained its strong working relationship with its insurance risk surveyors, insurance brokers and underwriters during the year, and recognises the important role played by these partners. Risk improvement recommendations made by risk surveyors as a result of site visits continue to provide valuable information to support risk improvement activities.
Human rightsAs we do not believe it is necessary for an understanding of the development, performance or position of the Company’s business, this document does not contain detailed information about human rights issues or the Company’s policies in relation to those matters. However, the Company does wish to record its commitment to respecting the human rights of its employees and its commitment to operating in accordance with its legal obligations. Other parts of this report refer to its policies with regard to diversity amongst its workforce and our commitment to corporate social responsibility.
Gender diversityThe Board is mindful, in the context of the current focus on the value of gender diversity, of the Company’s approach to the diversity of its management and of the representation of women in senior roles. During the on-going process for appointment of our new Non-Executive Director, a number of female candidates for the role were considered, and one ultimately appointed. We have not set, and do not intend to set, a specific target for the number of female members of the Board and wish to continue to appoint the best candidate available to us for any particular role. However, in setting the criteria for selection of candidates, for both executive and non-executive roles, the Group is conscious that it is possible to inadvertently discourage the successful candidacy of women and we intend to bear this in mind for all future appointments and to continue to have regard to the benefits of diversity, including as to gender. We have requested of our search consultants that they provide a sufficient number of female candidates for any future roles.
The Group has a diversity policy under which Low & Bonar is committed to: ensuring that everyone should have the same opportunities for employment and promotion based on their ability, qualifications and suitability for the work in question; seeking excellence in our employees through the implementation of recruitment, incentivisation, performance review, development and promotion processes that are fair to all; and capitalising on the added value that diversity brings. We consider discrimination in the workplace on the basis of age, gender, disability, ethnic origin, nationality, sexual orientation, gender reassignment, religion or belief, marital status and pregnancy and maternity to be unacceptable.
The following table sets out a breakdown by gender showing at 30 November 2013 (i) the number of persons who were directors of the Company; (ii) the number of persons who were senior managers of the Group (other than persons falling within sub-paragraph (i)); and (iii) the number of persons who were employees of the Group.
Number of men %
Number of women %
Directors 5 83% 1 17%Senior managers1 3 100% 0 0%Employees2 1,529 75% 529 25%
1 The Group has three senior managers: the managing directors of the business units, Bonar EMEA, Bonar NAFTA and MTX.
2 Employees of its consolidated subsidiaries excluding Bonar Natpet LLC.

Strategic Report Governance Financial Statements
29 Low & Bonar PLC Annual Report 2013 |
Strategic Report Governance Financial Statements
29 Low & Bonar PLC Annual Report 2013 |
Greenhouse Gas EmissionsThis is our first greenhouse gas (“GHG”) emissions report in line with uK mandatory reporting requirements as set out under the companies Act 2006 (Strategic and directors’ Reports) Regulations 2013. We have used the methodology set out by the department for environment, Food and rural Affairs (“deFrA”) environmental reporting guidelines 2013 to compile this report. As required, we have reported on our scope 1 and 2 emissions. These are direct emissions, such as heating and vehicle fuel, and indirect emissions such as purchased electricity. We have captured all material qualifying emissions from around the Group.
These sources fall within our consolidated financial statement. We do not have responsibility for any emission sources that are not included in our consolidated financial statements. Where data relates to a joint venture (or similar) the emissions have been apportioned on the basis of equity ownership.
We have computed our emissions using the DEFRA Environmental Reporting Guidelines: including mandatory greenhouse gas emissions reporting guidance issued in June 2013.
For our UK operations, we have used the UK Government’s 2013 conversion factors. For non-UK operations we have used the relevant government data where that is available. Where no local government data was available to us, we have used the best available source. Our total GHG footprint in line with these guidelines is 121,892 tonnes of CO
2e equivalent to 302.4 tonnes of
CO2e per £1m of Group revenue.
We continue to work on initiatives to improve our energy efficiency, and reduce the carbon intensity of our operations as described elsewhere in this Corporate Social Responsibility section.
Low & Bonar PLC emission data for period1 december 2012 to 30 november 20131 Tonnes
of CO2e
Energy for own use 102,347Process emissions 19,361Fugitive emissions 100Vehicle related emissions 84
Total cO2e 121,892
company’s chosen intensity
measurement:
emissions reported above per £1m of Group revenue2 302.4
1. As this is the first year of reporting on mandatory GHG there is no prior year comparative.
2. This is based on the revenue of Low & Bonar PLC for the year to 30 November 2013. The diverse and complex nature of the company’s operations means that a metric based on units of production would not provide a consistent picture. Similarly, there is no meaningful relationship between occupied floor area or employee numbers and the carbon intensity of our operations. The management team will continue to monitor and review the appropriateness of the intensity ratio.

30 | Low & Bonar PLC Annual Report 2013
Board of directors
Martin Flowerchairman (67)
Steve GoodGroup chief executive (52)
Mike HoltGroup Finance Director (53)
Steve HannamSenior non-executive Director, chairman of remuneration committee (64)
John Sheldricknon-executive Director, chairman of audit committee (64)
Trudy Schoolenbergnon-executive Director (54)
Appointed Non-Executive Director: January 2007. Appointed Chairman: June 2010.
Appointed as a Director and Group Chief Executive: September 2009.
Appointed as Director and Group Finance Director: November 2010.
Appointed as a Non-Executive Director: September 2002.
Appointed as a Non-Executive Director: October 2011.
Appointed as a Non-Executive Director: May 2013.
experience:Previously Chief Executive of Coats plc, a company in which he spent his entire executive career having joined in 1968. Former Deputy Chairman of Severn Trent Plc and formerly Chairman of Alpha Group plc.
experience:Joined Low & Bonar in 2004, serving first as the Managing Director of its Plastics Division, until its sale in 2005, and then as Director of New Business helping to shape the Group’s strategy. From 2006 to 2009, he was Managing Director of the Technical Textiles Division, which has been the sole business activity of Low & Bonar since the disposal of the Floors Division in 2008. Prior to joining Low & Bonar, he spent 10 years with Clariant (formerly BTP plc) in a variety of leadership positions managing international speciality chemical businesses. He is a chartered accountant.
experience:A chartered accountant, he was previously Group Finance Director of Vp plc for six years and, prior to that, held a number of senior financial positions with Rolls-Royce Group plc in the UK, the USA and Hong Kong.
experience:Formerly Non-Executive Director with Clariant AG, Chairman of Aviagen International Inc., Non-Executive Director of AZ Electronic Materials Services Limited and Group Chief Executive of BTP Chemicals plc.
experience:Group Finance Director of Johnson Matthey Plc until his retirement in 2009. Formerly Non-Executive Director of GKN plc and API Group Plc.
experience:Formerly Vice-president of Global Research and Development at Wartsila Oy, having previously worked for 21 years for Royal Dutch Shell plc.
external appointments:Chairman of Croda International Plc and a Non-Executive Director of Morgan Advanced Materials plc.
external appointments:None.
external appointments:Trustee and treasurer of Target Ovarian Cancer.
external appointments:Chairman of Devro plc and a Non-Executive Director of McBride plc.
external appointments:Non-Executive Director of Fenner PLC.
external appointments:Director of Research, Development and Innovation for AKZO Nobel’s Paints Division.
Non-Executive Director of COVA and of Spirax-Sarco Engineering Plc.
committee membership:Member of the Remuneration and Nomination Committees.
committee membership:Member of the Nomination Committee and Risk Oversight Committee.
committee membership:Chairman of the Risk Oversight Committee.
committee membership:Chairman of the Remuneration Committee. Member of the Audit and Nomination Committees.
committee membership:Chairman of the Audit Committee and a member of the Remuneration and Nomination Committees.
committee membership:A member of the Audit, Remuneration and Nomination Committees.

Strategic Report Governance Financial Statements
31 Low & Bonar PLC Annual Report 2013 |
Martin Flowerchairman (67)
Steve GoodGroup chief executive (52)
Mike HoltGroup Finance Director (53)
Steve HannamSenior non-executive Director, chairman of remuneration committee (64)
John Sheldricknon-executive Director, chairman of audit committee (64)
Trudy Schoolenbergnon-executive Director (54)
Appointed Non-Executive Director: January 2007. Appointed Chairman: June 2010.
Appointed as a Director and Group Chief Executive: September 2009.
Appointed as Director and Group Finance Director: November 2010.
Appointed as a Non-Executive Director: September 2002.
Appointed as a Non-Executive Director: October 2011.
Appointed as a Non-Executive Director: May 2013.
experience:Previously Chief Executive of Coats plc, a company in which he spent his entire executive career having joined in 1968. Former Deputy Chairman of Severn Trent Plc and formerly Chairman of Alpha Group plc.
experience:Joined Low & Bonar in 2004, serving first as the Managing Director of its Plastics Division, until its sale in 2005, and then as Director of New Business helping to shape the Group’s strategy. From 2006 to 2009, he was Managing Director of the Technical Textiles Division, which has been the sole business activity of Low & Bonar since the disposal of the Floors Division in 2008. Prior to joining Low & Bonar, he spent 10 years with Clariant (formerly BTP plc) in a variety of leadership positions managing international speciality chemical businesses. He is a chartered accountant.
experience:A chartered accountant, he was previously Group Finance Director of Vp plc for six years and, prior to that, held a number of senior financial positions with Rolls-Royce Group plc in the UK, the USA and Hong Kong.
experience:Formerly Non-Executive Director with Clariant AG, Chairman of Aviagen International Inc., Non-Executive Director of AZ Electronic Materials Services Limited and Group Chief Executive of BTP Chemicals plc.
experience:Group Finance Director of Johnson Matthey Plc until his retirement in 2009. Formerly Non-Executive Director of GKN plc and API Group Plc.
experience:Formerly Vice-president of Global Research and Development at Wartsila Oy, having previously worked for 21 years for Royal Dutch Shell plc.
external appointments:Chairman of Croda International Plc and a Non-Executive Director of Morgan Advanced Materials plc.
external appointments:None.
external appointments:Trustee and treasurer of Target Ovarian Cancer.
external appointments:Chairman of Devro plc and a Non-Executive Director of McBride plc.
external appointments:Non-Executive Director of Fenner PLC.
external appointments:Director of Research, Development and Innovation for AKZO Nobel’s Paints Division.
Non-Executive Director of COVA and of Spirax-Sarco Engineering Plc.
committee membership:Member of the Remuneration and Nomination Committees.
committee membership:Member of the Nomination Committee and Risk Oversight Committee.
committee membership:Chairman of the Risk Oversight Committee.
committee membership:Chairman of the Remuneration Committee. Member of the Audit and Nomination Committees.
committee membership:Chairman of the Audit Committee and a member of the Remuneration and Nomination Committees.
committee membership:A member of the Audit, Remuneration and Nomination Committees.

32 | Low & Bonar PLC Annual Report 2013
Report of the Directors
The Directors present their report and the accounts of the Company and the Group for the year ended 30 November 2013.
Strategic ReportThe Directors have presented their Strategic Report on pages 1 to 29, which contains (a) a fair review of the Company’s business, and (b) a description of the principal risks and uncertainties facing the Company. The review is intended to be a balanced and comprehensive analysis of (a) the development and performance of the Company’s business during the financial year, and (b) the position of the Company’s business at the end of that year, consistent with the size and complexity of the business. The review includes, to the extent necessary for an understanding of the development, performance or position of the Company’s business, analysis using financial key performance indicators. As the Company is a quoted company, the strategic report also, to the extent necessary for an understanding of the development, performance or position of the Company’s business, includes (a) the main trends and factors likely to affect the future development, performance and position of the Company’s business, and (b) information about (i) environmental matters (including the impact of the Company’s business on the environment), (ii) the Company’s employees, and (iii) social, community and human rights issues, including information about policies of the Company in relation to those matters and the effectiveness of those policies. The Report of the Directors should be read in conjunction with the Strategic Report, which forms part of this report and contains details of the principal activities of the Group during the year and an indication of likely future developments and an indication of the activities of the Group in the field of research and development.
The Strategic Report was approved by the Board of Directors on 4 February 2014.
Greenhouse gas reportingThe Directors are required to set out in this report the annual quantity of emissions in tonnes of carbon dioxide equivalent from activities for which the Group is responsible, including the combustion of fuel; and the operation of any facility. The report must state the annual quantity of emissions in tonnes of carbon dioxide equivalent resulting from the purchase of electricity, heat, steam or cooling by the Company for its own use. This report is shown on page 29 and forms part of this report.
Results and dividendsThe Group’s consolidated profit for the year attributable to equity holders of the Company was £12.3m (2012: £1.4m).
The Company paid an interim dividend for the year ended 30 November 2013 of 0.85 pence per share on 26 September 2013 to ordinary shareholders whose names appeared in the register at the close of business on 30 August 2013. The Directors recommend that a final dividend of 1.75p (2012: 1.6p) be paid on 17 April 2014 to ordinary shareholders on the register at close of business on 21 March 2014.
Dividends 2013 2012 % Increase
Interim 0.85 0.80 6.3%Final 1.75 1.60 9.4%
Total 2.60 2.40 8.3%
DirectorsThe present Directors of the Company are shown on pages 30 and 31. They all held office throughout the financial year under review, with the exception of Trudy Schoolenberg who joined the Board with effect from 1 May 2013. Folkert Blaisse served as a Director of the Company until 30 April 2013.
The Company has purchased and maintained throughout the year directors’ and officers’ liability insurance in respect of itself and its Directors. The Directors also have the benefit of the indemnity provision contained in the Company’s Articles of Association. The Company has executed deeds of indemnity for the benefit of each Director of the Company in respect of liabilities which may attach to them in their capacity as Directors of the Company or of associated companies. These provisions, which are qualifying third party indemnity provisions as defined by section 234 of the Companies Act 2006, were entered into in June 2009 for Mr Flower and Mr Hannam, September 2009 for Mr Good, November 2010 for Mr Holt, October 2011 for Mr Sheldrick and May 2013 for Ms Schoolenberg and are currently in force.
Re-election of DirectorsSteve Hannam retires by rotation and, being eligible, offers himself for reappointment. Mr Hannam’s appointment may be terminated by either him or the Company giving six months’ notice in writing. Mr Hannam was appointed as Non-Executive Director of the Company in September 2002 for an initial term of three years and was last reappointed in 2013 for a term of one year up to 31 August 2014. Mr Hannam’s reappointment has taken into account his performance and commitment to the role, the need for progressive refreshing of the Board and the Company’s overall corporate governance standards. The Board continues to believe that it benefits substantially from Mr Hannam’s experience and expertise and notes that he is subject to annual re-election due to his long tenure on the Board. Further details regarding Mr Hannam’s reappointment are set out on page 36.
Mike Holt retires by rotation and, being eligible, offers himself for reappointment. Mr Holt was appointed as a Director of the Company in 2010. His employment may be terminated by the Company giving him not less than twelve months’ notice in writing or by Mr Holt giving the Company not less than six months’ notice in writing.
Ms Schoolenberg was appointed during the year and, in accordance with the Company’s Articles of Association, offers herself for reappointment. Her appointment was for a period of three years from 1 May 2013.
The Chairman confirms to shareholders that, following formal performance evaluation, the performance of each of the Directors proposed for reappointment continues to be effective and to demonstrate commitment to the role.
Directors’ interestsDirectors’ interests in shares and debentures of the Company are shown on page 58.

Strategic Report Governance Financial Statements
33 Low & Bonar PLC Annual Report 2013 |
Substantial interestsAs at 30 November 2013, the Company’s register of substantial shareholdings showed the following interests in 3% or more of the Company’s issued Ordinary Shares, which include interests disclosed to the Company in accordance with Rule 5 of the UKLA’s Disclosure and Transparency Rules:
No. of Ordinary % of OrdinaryShares Shares
Cazenove Capital Management 44,999,200 13.79AXA Framlington Investment Managers 32,907,813 10.09M&G Investments 27,872,063 8.54JO Hambro Capital Management 27,743,177 8.50Aberforth Partners 21,106,305 6.47Unicorn Asset Management 18,557,965 5.69Schroders Investment Management 18,458,964 5.66Henderson Global Investors 10,712,338 3.28
At the date of this report, the Company’s register of substantial shareholdings showed the following interests in 3% or more of the Company’s issued Ordinary Shares, which include the interests disclosed to the Company in accordance with Rule 5 of the UKLA’s Disclosure and Transparency Rules:
No. of Ordinary Shares
% of Ordinary Shares
Cazenove Capital Management 45,298,400 13.88AXA Framlington Investment Managers 33,302,813 10.21M&G Investments 29,109,306 8.92JO Hambro Capital Management 28,090,563 8.61Aberforth Partners 21,121,305 6.47Unicorn Asset Management 19,057,965 5.84Schroders Investment Management 17,958,964 5.50
Ordinary share capitalThe Company’s issued share capital as at 30 November 2013 consisted of 326,293,606 ordinary shares with voting rights, 154,571,152 deferred shares without voting rights and £100,000 6 per cent first cumulative preference stock, £100,000 6 per cent second cumulative preference stock and £200,000 5.5 per cent third cumulative preference stock (the “preference stock”). Provided that preference dividends remain paid in accordance with the Company’s Articles of Association, the preference stock does not carry voting rights. The Company does not hold any ordinary shares in treasury. The total number of voting rights in the Company is, therefore, 326,293,606. Further details of the Company’s issued share capital at 30 November 2013 and of options granted and shares issued pursuant to the Company’s employee share option schemes and long-term incentive plans are shown in Note 25 to the accounts. The Company operates an employee benefit trust to hold shares in relation to satisfying awards made under certain employee share schemes. At 30 November 2013, the trust held 26,752 ordinary shares (2012: 26,752 ordinary shares). During the year, 4,723,986 new ordinary shares were subscribed for by the Trust to satisfy employee share awards which vested. The Company issued a total of 5,752,808 ordinary shares to employees, including 4,723,986 issued on the exercise of long-term incentive awards to senior executives and the remainder to employees on the exercise of options under the Group’s save-as-you-earn plans. Allotment of these shares took place at various points during the year at prices ranging from £0.26 to £0.75725 pence per share according to the terms of the options and awards.
At a general meeting of the Company, on a show of hands, every member who (being an individual) is present in person or (being a corporation) is present by a duly authorised representative, shall have one vote and every proxy present who has been duly appointed by a member entitled to vote on the resolution shall have one vote. No member shall, unless the directors otherwise determine, be entitled to be present or to be counted in a quorum or to vote either personally or by proxy or otherwise at any general meeting of the Company or at any separate general meeting of the holders of any class of the shares of the Company or upon a poll or to exercise any other right conferred by membership in relation to meetings of the Company if any call or other sum presently payable by him to the Company in respect of shares in the Company of which he is the holder (whether alone or jointly with any other person), together with interest, costs, charges and expenses (if any), remains unpaid. If any member, or any other person appearing to be interested in shares held by such member, has been duly served with a notice under section 793 of the Companies Act 2006 and is in default for the prescribed period in supplying to the Company the information thereby required, then (unless the directors otherwise determine) in respect of: the shares comprising the shareholding account in the Register of Members which comprises or includes the shares in relation to which the default occurred (all or the relevant number as appropriate of such shares being the default shares which expression shall include any further shares which are issued in respect of such shares); and any other shares held by the member, the member shall (for so long as the default continues) not nor shall any transferee to which any of such shares are transferred other than pursuant to an approved transfer or pursuant to the Articles be entitled to be present or to vote either personally or by proxy at a general meeting of the Company or a meeting of the holders of any class of shares of the Company or to exercise any other right conferred by membership in relation to general meetings of the Company or meetings of the holders of any class of shares of the Company. The profits which the Company may determine to distribute in respect of any financial year or other period for which its accounts are made up shall be applied, in the first place, in paying to the holders of the first cumulative preference stock a fixed cumulative preferential dividend at the rate of 6 per cent., per annum: in the second place, in paying to the holders of the second cumulative preference stock a fixed cumulative preferential dividend at the rate of 6 per cent., per annum: and, in the third place, in paying to the holders of the third cumulative preference stock a fixed cumulative preferential dividend at the rate of 5½ per cent. per annum, and, subject to any special rights which may be attached to any shares hereafter created or issued, the balance of the said profits shall be distributed among the holders of the ordinary shares. On a return of assets on liquidation or otherwise, the assets of the Company available for distribution among the members shall be applied, in the first place, in repaying to the holders of the first cumulative preference stock the sum of £1 for each £1 of such stock held (together with a sum equal to any arrears or deficiency of the fixed dividend thereon to be calculated down to the date of the return of capital): in the second place, in repaying to the holders of the second cumulative preference stock the sum of £1 for each £1 of such stock held (together with a sum equal to any arrears or deficiency of the fixed dividend thereon to be calculated down to the date of the return of capital): and, in the third place, in repaying to the holders of the third cumulative preference stock the sum of £1 for each £1 of such stock held (together with a sum equal to any arrears or deficiency of the fixed dividend thereon to be calculated down to the date of the return of capital), and, subject to any special rights which may be attached to any shares hereafter created or issued, the

34 | Low & Bonar PLC Annual Report 2013
balance shall belong to and be distributed among the holders of the ordinary shares. The full rights and obligations attaching to ownership of shares in the Company are contained in its Articles of Association.
The Directors have authority to allot relevant securities and to allot equity securities for cash without first offering them pro rata to existing shareholders granted at last year’s Annual General Meeting. The Directors will seek to renew this authority at the upcoming Annual General Meeting as those existing authorities will expire.
The current authority to allot “Relevant Securities” in accordance with section 551 of the Companies Act 2006 (the 2006 Act) is as follows: 1. in relation to a pre-emptive rights issue only, equity securities up to
a maximum nominal amount of £9,700,112.30, which represented approximately 66.66% of the Company’s issued ordinary shares at the date the authority was granted (reduced by the nominal amount of any Relevant Securities allotted under the next paragraph); and
2. in any other case, Relevant Securities up to a maximum nominal amount of £4,850,056.15, (approximately 33.33% of the Company’s issued ordinary shares), reduced by the nominal amount of any equity securities allotted under the previous paragraph.
The current authority to allot equity securities (as defined by section 560 of the 2006 Act) or sell treasury shares for cash without first offering them to existing shareholders in proportion to their existing holdings is as follows:
1. in relation to a pre-emptive rights issue only, up to a maximum nominal amount of £9,700,112.30; or
2. in any other case, up to a maximum nominal amount of £727,508.40, which represented approximately 5% of the Company’s issued ordinary shares (excluding treasury shares) as at the date the authority was granted.
In compliance with the guidelines issued by the Pre-emption Group, the Directors will ensure that, other than in relation to a rights issue, no more than 7.5% of the issued ordinary shares (excluding treasury shares) will be allotted for cash on a non pre-emptive basis over a rolling three-year period unless shareholders have been notified and consulted in advance.
Annual General MeetingThe Annual General Meeting will be held at The Pullman Hotel, London St Pancras, 100-110 Euston Road, London NW1 2AJ on 25 March 2014 commencing at 10am. The notice of meeting is contained in the separate booklet which is enclosed. The booklet contains the text of the resolutions to be proposed and explanatory notes concerning the proposals to authorise the Directors to allot relevant securities and to allot equity securities for cash other than on a pre-emptive basis.
Going concernHaving reviewed the medium-term forecasts and compared the cash flow with available bank facilities, taking into account the planned refinancing of the Group’s revolving credit facility ahead of its expiry in February 2015,the Directors are of the opinion that the Group has adequate resources to continue in operational existence for the foreseeable future. For this reason, the Directors continue to adopt the going concern basis in preparing the accounts.
Report of the Directors (continued)
Employee involvementThe Group’s overall policy is to keep employees informed on matters of concern to them and to encourage employee involvement. This policy is implemented in a wide variety of ways, which are reported on by the Group’s businesses, including the regular publication of a company newsletter, “Your Low & Bonar”, which is translated into the main languages of our employees, at least twice a year, and regular meetings with employees’ representatives, including a European Works Council. The Group’s employees are invited to participate in sharesave plans to encourage equity ownership.
Disabled employeesThe Group has a policy for giving full and fair consideration to applications for employment made by disabled persons, having regard to their particular aptitudes and abilities, for continuing the employment of, and for arranging appropriate training for, employees who have become disabled persons during the period when they were employed by the company, and for their training, career development and promotion. The terms of the Group’s diversity policy is given on page 28.
Information to the auditorThe Directors who held office at the date of this Directors’ Report confirm that, so far as they are each aware, there is no relevant audit information of which the Company’s auditor is unaware, and that each Director has taken all steps that he ought to have taken as a Director to make himself aware of any relevant audit information and to establish that the Company’s auditor is aware of that information.
AuditorKPMG Audit Plc will not continue in office as auditor and a resolution to appoint KPMG LLP as auditor will be proposed at the forthcoming Annual General Meeting.
Fair, balanced and understandableThe Directors consider this annual report and accounts, taken as a whole, is fair, balanced and understandable and provides the information necessary for shareholders to assess the Company’s performance, business model and strategy.
By order of the Board
Matthew JoyCompany Secretary4 February 2014

Strategic Report Governance Financial Statements
35 Low & Bonar PLC Annual Report 2013 |
In my Chairman’s Statement I have highlighted the priorities and main areas of focus for the Board during the last financial year. In this report, I am pleased to discuss more fully the work and operation of the Board and the framework of governance it deploys to lead and control the business and report on the Group’s performance.
Corporate Governance
We are committed to maintaining high standards of corporate governance and to applying the principles of good governance as set out in the UK Corporate Governance Code (the “Code”) published by the FRC. The Directors can confirm compliance throughout the year with the Code except in the following respect: Provision D.2.2 of the Code requires that the Remuneration Committee should have delegated responsibility for setting the remuneration of the Chairman. At Low & Bonar, the remuneration of the Chairman is determined by the Board based on the recommendation of the Remuneration Committee. This gives full transparency and allows the views of the Executive Directors to be taken into account.
The BoardThe Group is controlled through its Board of Directors, which provides entrepreneurial leadership of the Group and is ultimately responsible for its long-term success. Our main objectives are to create value for shareholders, to set the Group’s strategic objectives, to ensure that the necessary financial and human resources are made available to enable it to meet those objectives and to review executive management performance, all within a framework of prudent and effective controls which enable risk to be assessed and managed. The Board also sets the Group’s values and standards and ensures that its obligations to shareholders and others are understood and met.
We have a formal schedule of reserved powers which we retain for Board decision-making on a range of key issues, including the formulation of Group strategy, the approval of the annual budget, the approval of reported financial statements and dividends, the approval of acquisitions, divestments and significant items of capital expenditure and the Group’s risk management strategy.
I chair the Board. The Group Chief Executive is Steve Good and the Senior Independent Non-Executive Director is Steve Hannam. As I have said elsewhere, we have already begun a process to recruit a replacement for Steve Good when he retires later this year.
Our current thoughts on the issue of diversity as it pertains to membership of the Board are given on page 28.
The roles of the Chairman and Group Chief ExecutiveMy role and that of the Group Chief Executive are separate and clearly defined. I am responsible for leading the Board, facilitating the effective contribution of all members and ensuring that it operates effectively in the interests of shareholders. The Group Chief Executive is responsible for leadership of the business and implementation of strategy.
Directors and Directors’ independenceThe Board currently comprises a Non-Executive Chairman, three independent Non-Executive Directors and two Executive Directors. The names of the Directors, together with their biographical details, are set out on pages 30 and 31. In determining the membership of the Board, we are mindful that it should be of sufficient size that the requirements of the business can be met and that changes to its composition and that of the committees can be managed without undue disruption, but should not be so large as to be unwieldy. I believe that our Board has the appropriate combination of Executive and Non-Executive directors (and, in particular, independent Non-Executive directors) and that no individual or small group of individuals can dominate decision making.
Martin Flower Non-Executive Chairman

36 | Low & Bonar PLC Annual Report 2013
Corporate Governance (continued)
I am also concerned to ensure that the Board and its committees should have the appropriate balance of skills, experience, independence and knowledge of the Group to enable them to discharge their respective duties and responsibilities effectively. This principle was under active consideration during the search for a new Non-Executive Director which led to the appointment of Trudy Schoolenberg.
The independent Non-Executive Directors challenge constructively and help develop proposals on strategy and bring strong, independent judgement, knowledge and experience to the Board’s deliberations. We believe that an effective balance of power and authority is maintained through the number and calibre of Non-Executive Directors. All Directors have access to the advice and services of the Company Secretary and Directors may take independent professional advice at the Company’s expense.
Details of my professional commitments are included in my biography. The Board is satisfied that these are not such as to interfere with the performance of my duties for the Group, which are based around a commitment of at least one day and no more than two days per week.
The Chairman and the Non-Executive Directors are not employees of the Group.
The Board considers that Steve Hannam, John Sheldrick and Trudy Schoolenberg, the Non-Executive Directors, are independent in character and judgement and we continue to monitor whether there are relationships or circumstances which are likely to affect, or could appear to affect, a Director’s judgement. Although he has served on the Board for more than eleven years, we continue to view Steve Hannam as independent in character and judgement. Steve is highly experienced in both relevant executive and non-executive roles and continues to offer a regular and substantive challenge to the Executive Directors on their strategy for and management of the business. Steve is asked to submit himself for re-election to the Board annually given his long tenure and we consider his continued membership of the Board rigorously. In light of the significant changes which the Board has undergone since late 2009, we continue to value his contribution (and the continuity which it brings) highly.
I ensure that the Non-Executive Directors meet without the Executive Directors present from time to time.
Professional development and performance evaluationThe Board has adopted a policy of providing appropriate training for all new Directors who have not previously received such training. A personal induction programme is provided for each new Director, depending on the experience and needs of the individual. On appointment, they receive information about the Group, the role of the Board and the matters reserved for its decision, the terms of reference and membership of the principal Board and management committees, and the powers delegated to those committees, and the latest financial information about the Group. This is supplemented by visits to key locations and meetings with key senior executives. I work to ensure that the Directors continually update their skills and the knowledge and familiarity with the Group required to fulfill their role both on the Board and its committees and to make sure that the necessary resources for developing and updating Directors’ knowledge and capabilities are made available. I encourage Directors to avail themselves of opportunities to meet our major shareholders.
The Board has established a process, led by me, for the annual evaluation of the performance of the Board and its principal committees. A list of questions is drawn up by me with the assistance of the Company Secretary to provide a framework for the evaluation process during a meeting of the Board. Again this year, we considered the merits of using external assistance in connection with the evaluation but determined that it was not necessary to do so given the size of the Board, the good working practices and relationships which we have established over the years and the open and constructive way in which Directors express their views in relation to the operation of the Board on an ongoing basis.
I have also reviewed the contribution of individual Directors, in conjunction with my colleagues as appropriate, to reassure myself and the Board that each Director continues to contribute effectively and to demonstrate commitment to the role (including commitment of time for Board and committee meetings and any other duties). The Senior Independent Non-Executive Director leads the Non-Executive Directors in conducting my annual performance evaluation, taking into account the views of the Executive Directors.
Information and meetingsThe Board meets regularly to review the performance of the Company and to formulate strategy and is supplied in advance of each meeting with an agenda and papers covering the financial and operating performance of the Group’s businesses and other matters to be considered at the meeting. It is my goal to ensure that the information available to the Board is accurate, timely and clear. Executive management reports on a continuing basis against the Group’s budget (set at the start of the financial year) and the quarterly forecasts for the year which are made three times a year. The Board also considers other key developments, such as the implementation of major projects. I encourage the Non-Executive Directors to seek clarification and amplification of information where necessary.
I set the agenda in discussion with executive management and the Company Secretary and consideration is given to ensuring that adequate time is available for discussion of all agenda items. The papers are supplemented by information specifically requested by the Directors from time to time. Other members of senior management attend the Board meetings from time to time to present to the Board on the strategy for and performance of businesses within the Group. I also now arrange for the Board to meet in separate session to consider and approve the strategy for the Group so that adequate time can be given to this vital aspect of its role away from the normal business of monthly Board meetings. As we reorganise our business into regional and market-focused divisions, we continue to consider and improve the strategic input from the Board and Directors’ understanding of our business and its place in its markets.
I also arrange for the Board to meet in more informal surroundings several times a year to discuss topics of interest and relevance to the Group and our external advisers are often invited to these sessions to offer their counsel.

Strategic Report Governance Financial Statements
37 Low & Bonar PLC Annual Report 2013 |
The full Board had eight scheduled meetings during the year and all Directors who served throughout the year attended each scheduled meeting. The full details of the meetings of the Board and its main committees are set out below:
Board Meetings
8 meetings
Audit Committee
Meetings3 meetings
Remuneration Committee
Meetings3 meetings
Nomination Committee
Meetings3 meetings
Martin Flower 8 – 3 3Steve Good 8 – – 3Mike Holt 8 – – –Steve Hannam 8 3 3 3John Sheldrick 8 3 3 3Trudy Schoolenberg1 6 3 1 1
1 Ms Schoolenberg joined the Board on 1 May 2013 and has attended all its meetings and those of its committees held since that date.
I also encourage the Board to establish closer links with the Group’s subsidiaries and their key executive management by visiting the Group’s facilities and, in 2013, one of the Board meetings was held at the Group’s manufacturing facility in Fulda, Germany. I am considering ways in which the Board’s links to the subsidiaries and their executive management might be strengthened further in 2014. The scheduled Board meetings concentrate on strategy, financial and business performance. Additional meetings, including of certain ad hoc committees, were called during the year to deal with specific matters. I also encourage individual Non-Executive Directors to meet with executive management to ensure constructive relations between them and to continue to promote a culture of openness and debate and to improve the effectiveness of the contribution of our Non-Executive Directors as I believe that, to function effectively, all Directors need appropriate knowledge of the Group and access to its operations and staff.
The Company Secretary is tasked with advising the Board on governance matters through me. I use the Board agenda to ensure that Directors, especially Non-Executive Directors, have access to independent professional advice at the Company’s expense where we judge it necessary to discharge our responsibilities as Directors. This includes the Group’s corporate finance, insurance, public relations, legal and pensions advisers attending Board meetings from time to time.
ConflictsA director has a duty under the Companies Act 2006 (the “Act”) to avoid a situation in which he has or can have a direct or indirect interest that conflicts or possibly may conflict with the interests of the company. The Act allows directors of public companies to authorise conflicts and potential conflicts where the Articles of Association contain a provision to that effect and the Company’s Articles of Association include such provisions. The Board considers each Director’s conflicts or potential conflicts of interest. Only Directors that have no interest in the matter under consideration take the relevant decision. In addition, the Board considers each conflict situation separately on its particular facts; considers the conflict situation in conjunction with the rest of a Director’s duties under the Act; keeps records and minutes of authorisations granted by Directors and the scope of any approvals given; and regularly reviews conflict authorisations (at least annually). In addition, the Directors are able to impose limits or conditions when giving authorisation if they think this is appropriate.

38 | Low & Bonar PLC Annual Report 2013
CommitteesIn accordance with the Code, the Board has established Audit, Remuneration and Nomination Committees. All of the committees have written terms of reference, approved by the Board. The terms of reference of the committees are available on the Company’s website via the following link: http://www. lowandbonar.com/investor-centre/corporate-governance.aspx, or on request from the Company Secretary. The Board has also established a Risk Oversight Committee which is discussed in more detail on page 40.
Committee Key members Invited to attend regularly
Audit Committee John Sheldrick, ChairmanSteve HannamTrudy SchoolenbergFolkert Blaisse, until his retirement on 30 April 2013
ChairmanGroup CEOGroup FDDeputy Group FDRepresentative of the internal audit functionExternal auditor
Remuneration Committee Steve Hannam, ChairmanMartin FlowerJohn SheldrickTrudy SchoolenbergFolkert Blaisse, until his retirement on 30 April 2013
Group CEORemuneration consultants
Nomination Committee Martin Flower, ChairmanSteve HannamJohn SheldrickTrudy SchoolenbergSteve GoodFolkert Blaisse, until his retirement on 30 April 2013
Risk Oversight Committee Group Chief ExecutiveGroup Finance Director, ChairmanOther members of senior executive management, including the Managing Directors of Bonar EMEA, Bonar NA, MTX, the Deputy Group Finance Director, the Group Health and Safety Director, a representative of internal audit and the Head of Legal Affairs
The Board recognises the value of ensuring that committee membership is refreshed and that undue reliance is not placed on particular individuals in deciding chairmanship and membership of committees. Membership of our committees has been refreshed over the last three years and all of the main committees have appointed new chairmen since July 2010.
We adhere to the principle that no one other than the committee chairman and members are entitled to be present at a meeting of the Nomination, Audit or Remuneration Committees, but others may attend at the invitation of the committee and our practice in this respect is addressed below.
Audit CommitteeThe work of our Audit Committee is addressed in more detail on pages 41 to 43 by its Chairman, John Sheldrick.
Remuneration CommitteeThe work of our Remuneration Committee is addressed in more detail on pages 44 to 60 by its Chairman, Steve Hannam. The Remuneration Committee is responsible for recommending to the Board the Company’s broad policy for executive remuneration, including both short-term and long-term incentive arrangements, and for reviewing and approving, at least annually, the entire remuneration packages of the Executive Directors and certain other senior executives of the Group. The Committee is also responsible for recommending the Chairman’s remuneration to the Board. The Committee is entitled to obtain, at the expense of the Company, such external advice as it sees fit on any matters falling within its terms of reference.
Nomination CommitteeThe Nomination Committee is responsible for regularly reviewing the structure, size and composition of the Board and for making recommendations to the Board with regard to any changes, including recommending candidates for appointment as both Executive and Non-Executive Directors. Appointments are discussed fully before a proposal is made to the Board and, as Chairman of the Committee, I am mindful that there should be a formal, rigorous and transparent procedure for the appointment of new Directors. The selection criteria are agreed by me in conjunction with my colleagues and we make use of independent recruitment consultants and the final appointment rests with the full Board.
As part of its review of non-executive succession, the Committee identified the need for the recruitment of a new Non-Executive director in 2013 and discussed the appropriate role specification and time commitment expected. It was agreed that this should include the requirement for recent experience in an international “B2B” manufacturing business. An independent consultant, Korn/Ferry Whitehead Mann, was appointed to conduct the search and a long list of names was developed by them in consultation with me. A short-list of candidates was developed and the best candidates for the role were interviewed by myself and the Group Chief Executive and our favoured candidate, Trudy Schoolenberg, was also seen by all members of the Board prior to formal appointment. Korn/Ferry Whitehead Mann has no other connection with the Company. The Committee has also set a specification to assist in the recruitment of a new Group Chief Executive.
In 2013, I also used the Nomination Committee to assist me in reviewing the training and development needs for each Director.
Corporate Governance (continued)

Strategic Report Governance Financial Statements
39 Low & Bonar PLC Annual Report 2013 |
Relations with shareholdersI work to ensure that there is a dialogue with shareholders based on the mutual understanding of objectives. The Board as a whole has responsibility for ensuring that a satisfactory dialogue with shareholders takes place. Whilst recognising that most shareholder contact is with the Group Chief Executive and Group Finance Director, I ensure that all Directors are made aware of major shareholders’ issues and concerns in whatever ways are most practical and efficient. This includes meeting directly with our brokers and public relations advisers and receiving written reports from them, as well as through direct meetings with shareholders. The Board is also given copies of the reports on the Group written by analysts. It is also our practice to consider feedback from shareholders following results presentations. Our Non-Executive Directors have opportunities to meet with shareholders on request and, in 2014, I will again encourage them to attend results presentations and investor days so that they have an opportunity to meet with key stakeholders in person.
The Company maintains good communications with its shareholders through its Interim and Annual Reports and through information posted on its website at www.lowandbonar.com. The Company holds regular meetings throughout the year with major shareholders, analysts and the financial press, in particular following the announcements of its interim and full year results. Visits for analysts and large shareholders are also arranged from time to time to operating units. I have met with a number of the Group’s largest shareholders during the year to discuss governance and strategy with them.
The Company’s Annual General Meeting is used as an opportunity to communicate with private investors. Shareholders attending the Annual General Meeting are invited to ask questions and to meet with the Directors informally after the meeting. I, as Chairman of the Board and Nomination Committee, Steve Hannam as Senior Independent Non-Executive Director and as Chairman of the Remuneration Committee, and John Sheldrick as Chairman of the Audit Committee, will answer questions, as appropriate, at the Annual General Meeting.
Shareholders are given the opportunity to vote separately on each proposal, including on the report and accounts. For each resolution, proxy appointment forms provide shareholders with the option to direct their proxy to vote either for or against the resolution or to withhold their vote. The proxy form and any announcement of the results of a vote make it clear that a “vote withheld” is not a vote in law and will not be counted in the calculation of the proportion of the votes for and against the resolution.
The numbers of proxy votes cast in respect of each resolution are announced after the resolution has been voted on by a show of hands. The Company ensures that all valid proxy appointments received for general meetings are properly recorded and counted by its registrar. For each resolution, where a vote has been taken on a show of hands, we ensure that the following information is given at the meeting and made available as soon as reasonably practicable on our website:• the number of shares in respect of which proxy appointments have been validly made;• the number of votes for the resolution;• the number of votes against the resolution; and• the number of shares in respect of which the vote was directed to be withheld.
Notice of the Annual General Meeting is sent to shareholders at least 20 working days prior to the date of the meeting.
Internal control and risk managementThe Directors acknowledge their responsibility for the systems of internal control within the Group. The purpose of these systems is to provide reasonable assurance as to the reliability of financial information and to maintain proper control over the income, expenditure, assets and liabilities of the Group. The Board has also reviewed in detail the areas of major risk that the Group faces in its operations. It has noted and is satisfied with the current control mechanisms and reporting lines that have been in place throughout the year. However, no system of control can provide absolute assurance against material misstatement or loss. In carrying out our review, the Directors have regard to what controls in our judgement are appropriate to the Group’s businesses, to the materiality and the likelihood of the risks inherent in these businesses and to the relative costs and benefits of implementing specific controls.
Risk Oversight
Board of Directorsoversees risk management as a whole and delegates responsibility for addressing individual risk issues to
Audit Committee Board Risk Oversight Committee
delegated responsibility for control of funding and capital, financial controls, evaluation and control of acquisitions, information, valuation and reporting in respect of pensions and treasury matters
political risks, take-overs, funding and capital, acquisitions, the funding of pensions and investor relations
delegated responsibility for risks in the areas of health and safety, the environment, major physical or operational incidents, raw materials, product failure, new product development, competition, customers, human resources and regulatory and compliance issues
Remuneration Committee considers risks associated with remuneration structures and advises the Board, the Audit Committee and the
Risk Oversight Committee as appropriate

40 | Low & Bonar PLC Annual Report 2013
Corporate Governance (continued)
In recognition of its responsibility for risk issues, the Board has reviewed the key risks associated with the business and will continue to do so as a regular agenda item at its meetings in the coming year. Formal responsibility for risk matters set out in the Group Risk Register is divided between the Board, the Audit Committee and the Risk Oversight Committee. The Board has primary responsibility for those risks broadly categorised as political risks, take-overs, funding and capital, acquisitions, the funding of pensions and investor relations. The Audit Committee has delegated responsibility for control of funding and capital, financial controls, evaluation and control of acquisitions, information, valuation and reporting in respect of pensions and treasury matters. The internal audit function has a direct reporting line to the Audit Committee and relevant representatives attend Audit Committee meetings by invitation. The Remuneration Committee considers risks associated with remuneration structures and advises the Board, the Audit Committee and the Risk Oversight Committee accordingly.
As careful management of risk is also a key management activity, the Group’s work in the area of operational risk management is facilitated by the Risk Oversight Committee. The Risk Oversight Committee has delegated responsibility for risks in the areas of health and safety, the environment, major physical or operational incidents, raw materials, product failure, new product development, competition, customers, human resources and regulatory and compliance issues. Health and safety and environmental matters have been overseen by a sub-committee, known as the Global Environmental, Health and Safety Committee, which is chaired by the Group Health and Safety Director.
The Risk Oversight Committee meets at least three times a year and operates under formal terms of reference established by the Board and is committed to continuing to develop and embed risk management processes within the Group. The Risk Oversight Committee is specifically charged with developing Group management of, and policy towards, environmental, social and governance (“ESG”) risks so that the Board may take account of their significance to the business of the Group in both the short and long term and to ensure that the Group has in place effective systems for managing and mitigating significant ESG risks, including appropriate key performance indicators. The work of all of the Board committees relating to risk management are discussed at full Board meetings on a regular basis in addition to the work undertaken by the Board on key risk issues. The Risk Oversight Committee receives reports from the Global Environmental, Health and Safety Committee and reports on relevant matters to the Board. The Group Health and Safety Director, who deals with health, safety and environmental issues, reports to the Risk Oversight Committee in his capacity as Chairman of the Global Environmental, Health and Safety Committee.
In addition to the risk review process and the internal audit function, the Group operates within an established internal financial control framework, which can be described under three headings:• Financial reporting: there is a comprehensive budgeting system
with an annual budget approved by the Directors. Monthly actual results are reported against budget and revised forecasts for the year, which are prepared regularly.
• Operating unit controls: financial controls and procedures, including information system controls, are detailed in the Group Policies and Procedures Manual. All operating units are required to confirm quarterly their compliance with policies and procedures set out in the manual (including those relating to health, safety and the environment), local laws and regulations and report any control weaknesses identified in the past year. Independent confirmation of compliance is obtained annually for selected operating units.
• Investment appraisal: the Group has clearly defined guidelines for capital expenditure which are also set out in the Group Policies and Procedures Manual. These include detailed appraisal and review procedures, levels of authority and post-completion audits. Where businesses are being acquired, detailed due diligence is undertaken in advance of acquisition.
The Company is committed to ensuring that all employees comply with all anti-trust legislation. To ensure that relevant employees are aware of the issues and receive the appropriate level of training and information, the Group has a personalised online anti-trust compliance training programme which all relevant personnel within the Group are required to complete on a regular basis.
The continued development and implementation of the risk management and internal control system across the Group has allowed the Directors to comply with the Code provisions on internal control in the course of the financial year ended 30 November 2013.
The Risk Oversight Committee also ensures that the Group is able to respond adequately to the UK’s Bribery Act 2010 and has overseen an enterprise-wide risk assessment process and developed a detailed set of polices and procedures in response to the findings of that assessment. The Group values its reputation for ethical behaviour and for financial integrity and has a commitment to carry out business fairly, honestly and openly. We will not tolerate bribery in our dealings. It is illegal and harmful for business. Any involvement with improper inducements in order to secure business or gain any advantage for either any Group company or our employees reflects adversely on our image and reputation and undermines the confidence of our customers and other business partners in us. We seek to eliminate bribery in our business dealings by:
• setting out a clear anti-bribery policy;• training all of our employees so that they can recognise and avoid
the use of bribery by themselves and others;• encouraging our employees to be vigilant and to report any
suspicion of bribery through suitable channels of communication and ensuring sensitive information is treated appropriately;
• rigorously investigating instances of alleged bribery and assisting the police and other appropriate authorities in any resultant prosecution; and
• taking firm and vigorous action against any individual(s) involved in bribery.
Martin FlowerNon-Executive ChairmanOn behalf of the Board of Directors 4 February 2014

Strategic Report Governance Financial Statements
41 Low & Bonar PLC Annual Report 2013 |
Audit Committee ReportThe responsibilities and work carried out by the Audit Committee in the year under review are set out in the following report.
Composition and governanceThe Committee comprises the three independent Non-Executive Directors, John Sheldrick (Chairman of the Committee), Steve Hannam and Trudy Schoolenberg, who, collectively, have the skills and experience required to fully discharge their duties. Trudy Schoolenberg joined the Committee in May 2013 on her appointment to the Board following the retirement of Folkert Blaisse on 30 April 2013. John Sheldrick meets the requirements of recent and relevant financial experience having been Group Finance Director of Johnson Matthey Plc from 1995 until his retirement in 2009.
The Chairman, Group Chief Executive and Group Finance Director also generally join at least part of Audit Committee meetings by invitation.
The Committee Chairman may call a meeting at the request of any member, the Company’s external auditor or internal audit. The Audit Committee meets privately with the external auditor and internal audit at least once a year. Both internal audit and the external auditor have direct access to the Chairman of the Committee outside of formal Committee meetings.
The Audit Committee meets at least three times a year. The primary role of the Committee, which reports its findings to the Board, is to ensure the integrity of the financial reporting and audit process and the maintenance of sound internal control and risk management systems. It is responsible for monitoring and reviewing:
• the integrity of the Group’s financial statements and any formal announcements relating to its financial performance;
• the Group’s internal financial controls and internal control and risk management systems;
• the effectiveness of the Group’s internal audit function;• the effectiveness of the external audit process and making
recommendations to the Board on the appointment, re-appointment and removal of the external auditor;
• policy on the engagement of the external auditor to supply non-audit services; and
• taking specific responsibility for certain key areas of risk management to support the Board’s role in overseeing an enterprise-wide approach to risk identification, management and mitigation.
Its terms of reference are available on the Company’s website at www.lowandbonar.com.
The Audit Committee is entitled to obtain, at the expense of the Company, such external advice as it sees fit on any matters falling within its terms of reference.
Audit Committee Report
John Sheldrick Non-Executive Director and Chairman of the Audit Committee

42 | Low & Bonar PLC Annual Report 2013
Activities in 2013The Audit Committee met on three occasions during 2013. The meetings of the Committee coincided with key dates in the financial reporting and audit cycle. The external auditor, KPMG Audit Plc, attended all of the meetings and the Group’s internal auditor attended two of the meetings but was absent from one by prior arrangement.
The Audit Committee discharged its responsibilities by:
• reviewing the Group’s draft financial statements and interim results statement prior to Board approval and reviewing the external auditor’s detailed reports thereon and also reporting to the Board the significant issues that the Committee considered in relation to the financial statements and how those issues were addressed, having regard to matters communicated to it by the auditor;
• reviewing the appropriateness of the Group’s accounting policies;• reviewing and approving the audit fee and reviewing non-audit
fees payable to the Group’s external auditor in accordance with the policy it has adopted;
• reviewing the external auditor’s plan for the audit of the Group’s accounts, which included key areas of extended scope work, key risks on the accounts, confirmations of auditor independence and the proposed audit fee;
• reviewing an annual report on the Group’s system of internal control and its effectiveness and reporting to the Board on the results of the review;
• assisting the Board with overseeing an enterprise-wide approach to risk identification, management and mitigation;
• receiving regular reports from the Group internal auditor following operational audits;
• reviewing the performance and effectiveness of internal and external audit; and
• reviewing the arrangements by which staff of the Company may, in confidence, raise concerns about possible improprieties in matters of financial reporting or other matters.
Financial reporting and significant areas of judgementThe Audit Committee reviewed a wide range of financial reporting and related matters in respect of the Company’s half year and annual results statements and the Annual Report prior to their consideration by the Board. Reports highlighting key accounting matters and significant judgements were also received from KPMG Audit Plc in respect of the year-end statements and discussed by the Committee. In particular, these included the significant judgement areas of the impairment of goodwill and the valuation of pension-related liabilities. Under IFRS, goodwill arising on acquisitions is tested for impairment at each reporting date based on projected cash flows discounted to calculate their net present value. Details of the assumptions used in these valuations are set out in note 11 on pages 86 and 87. The Committee discussed with KPMG the cashflow projections and discount rates used in these calculations and the headroom for each group of cash generating units. The valuation of the Group’s post-employment obligations requires demographic and financial assumptions to be made which are set out in note 4 on pages 80 to 83. These assumptions have been chosen based on advice from the Group’s actuaries. The Committee discussed the
Audit Committee Report(continued)
appropriateness of these assumptions with KPMG and whether these assumptions were consistent with externally derived data. Analysis to support the going concern statement given on page 34 was also reviewed with the Committee receiving reports from management and the external auditor on this matter.
Following consideration of the matters presented to it and discussion with both management and KPMG, the Committee was satisfied that the significant judgements made were justified and that the financial reporting disclosures made were appropriate.
WhistleblowingLow & Bonar operates a Group-wide international telephone hotline to support whistleblowing. The hotline is facilitated by an independent third party with a market-leading reputation in the provision of such services. The hotline facilitates arrangements whereby employees can make confidential disclosures about suspected impropriety and wrongdoing, in compliance with local laws and regulations in the relevant jurisdiction. Any matters so reported are investigated by management as appropriate considering the nature of the issues involved and can, where relevant and appropriate, be reported to the Audit Committee. A report summarising all disclosures made during the period is considered by the Audit Committee annually.
External auditorThe Audit Committee is responsible for ensuring that an appropriate relationship between the Group and the external auditor is maintained, including reviewing non-audit services and fees. It has developed and implemented a policy on the supply of non-audit services by the external auditor to ensure their continued objectivity and independence. The Committee is satisfied that the provision by KPMG Audit Plc of non-audit services currently provided does not impair their independence or objectivity. The Audit Committee has approved the range of services that may be provided by the external auditor. These include taxation compliance services, transaction due diligence and accountancy assistance on projects. Subject to approved authorisation limits, the services require prior authorisation from either the Group Finance Director, the Chairman of the Audit Committee or the full Audit Committee. The Committee is satisfied that the majority of the tax services supplied by KPMG Audit Plc during the year were compliance related or related principally to foreign advisory work that required a detailed understanding of the Group and which did not impair their independence.
The Committee received and reviewed written confirmation from the external auditors on all relationships that, in their judgement, may bear on their independence. The external auditors have also confirmed that they consider themselves independent within the meaning of UK regulatory and professional requirements.

Strategic Report Governance Financial Statements
43 Low & Bonar PLC Annual Report 2013 |
The current overall tenure of the external auditor, KPMG Audit Plc, dates from 1975, although a re-tender exercise was conducted in 2002 and a limited review was conducted in 2008. Any decision to open the external audit to tender is taken on the recommendation of the Audit Committee. There are no contractual obligations that restrict the Company’s current choice of external auditor. In 2012, a new lead partner was appointed in line with KPMG’s policy of partner rotation to ensure continued auditor independence. At the upcoming AGM, it will be proposed that a parent entity of KPMG Audit PLC, KPMG LLP, will be recommended to the shareholders to become the auditor for the 2014 financial year. This is because, following an internal review, KPMG have informed us that they are seeking to wind down the activity of KPMG Audit Plc.
The UK Corporate Governance Code has recommended that companies in the FTSE 350 index put their external audit contract out to tender at least every ten years. The Committee has considered this recommendation and it has recommended to the Board that the external audit contract be put out to tender when the current audit partner is due to rotate out of the post in 2017. Mindful of FRC advice on the impracticality of all companies conducting a tender exercise at the same time, the precise timing of this exercise will be kept under review.
The performance and effectiveness of the external auditor was formally reviewed by the Committee taking into account the views of Directors and senior management on such matters as independence, objectivity, proficiency, resourcing and audit strategy and planning. The Committee concluded that the performance of the external auditor remained satisfactory following the review. The performance of the external auditor will continue to be reviewed annually. The Committee has recommended to the Board that KPMG LLP should be appointed as the Company’s external auditors for the next financial year in succession to KPMG Audit PLC. Following this recommendation, the Board is proposing what effectively amounts to the re-appointment of the external auditor to shareholders at the Annual General Meeting.
Internal auditDuring the year, the Committee reviewed the results of audits undertaken by internal audit and management responses, including the implementation of any recommendations made. The Committee considered and approved the 2013 internal audit programme. The effectiveness of internal audit was formally reviewed. For 2014, the Company has decided to co-source its internal audit function with PricewaterhouseCoopers LLP (“PwC”) following the retirement of the Head of Internal Audit who left the Company at the end of 2013. The PwC partner-in-charge will attend Audit Committee meetings.
John SheldrickNon-Executive Director and Chairman of the Audit CommitteeOn behalf of the Board of Directors4 February 2014
44 | Low & Bonar PLC Annual Report 2013
Directors’ Report on Remuneration
Steve HannamSenior Independent Non-Executive Director, Chairman of the Remuneration Committee
This report sets out details of the remuneration policy for Executive and Non-Executive Directors, describes how the remuneration policy is implemented and discloses the amounts paid relating to the year ended 30 November 2013.
The remuneration Policy Report (set out on pages 45 to 53) will be put to shareholders for approval in a binding vote at the AGM on 25 March 2014. The formal effective date of the policy will be from the date of the approval by shareholders at the AGM (i.e. 25 March 2014, the “Effective Date”). The Annual Report on Remuneration (set out on pages 54 to 60), which describes how policy has been implemented in the year under review and how it will be implemented for the year ahead, will be subject to an advisory vote at the AGM.
ANNUAL STATEMENT BY THE CHAIRMAN OF THE REMUNERATION COMMITTEEI am pleased to present the Remuneration Committee’s report outlining our future remuneration policy and providing details of the remuneration of the Directors for the year ended 30 November 2013.
This is the first time we are reporting to you following the enforcement of new regulations governing the reporting and approval of Directors’ remuneration. The format this year will include a Policy Report, setting out our future remuneration policy, and an Annual Report on Remuneration, setting out how we went about implementing our policy over the year to 30 November 2013 and how we intend to implement our policy in the future.
Performance and rewardAs described in the Chairman’s Statement, having experienced a very slow start to the year due to abnormal weather conditions across Europe, the Group had a strong second half and delivered another year of profit growth. Under the circumstances, these are good results during a period of continued macroeconomic challenge, particularly within Europe, providing further evidence of the quality and resilience of our business and its growth prospects.
As a result of the difficult conditions at the start of the year, there will be no bonus payable to our senior executive team this year, despite the increase in profitability over 2012, as the targets set at the beginning of the year were narrowly missed.
With regard to the Company’s longer-term performance, reflecting the Company’s successful implementation of its growth strategy since the appointment of the current Group Chief Executive, the awards made under the Company’s 2003 Long Term Incentive Plan (“LTIP awards”) in 2010 vested in March 2013 in full. This level of vesting was triggered as a result of exceeding the maximum three-year EPS target set by 16.3% and delivering a three-year total shareholder return of 110.4%, which was above the upper quartile level of the FTSE Small Cap Index over the three-year period. The LTIP awards made in 2011 will also vest as to approximately 44% in respect of the EPS target, with EPS for 2013 being 6.23p against an original target range of 5.9p to 7.0p. We have not yet estimated how much of the 2011 LTIP awards will vest in relation to the TSR target as the performance period has not yet finished. The 2011 awards will formally vest in March 2014 and we will make announcements about vesting of the awards at that time. Given the challenging economic conditions that have operated during these performance periods, the level of performance delivered was considered to be an exceptional result by the management team. At the AGM, 98.4% of shareholders

Strategic Report Governance Financial Statements
45 Low & Bonar PLC Annual Report 2013 |
also voted to approve last years Director’s Report on Remuneration and we thank them for their support. As described in last year’s report, our 2003 Long-Term Incentive Plan expired in 2013 and, after a new plan was prepared in consultation with our major shareholders, the 2013 Long-Term Incentive Plan was approved at the last AGM (with 98.5% of proxy votes in favour) and awards made in April 2013.
Implementation of policy in the current yearThere are to be no substantive changes in relation to remuneration policy for the current financial year. However, Executive Directors’ salary levels have been increased by just over 3% with effect from 1 December 2013, which is consistent with the performance-related salary increases awarded to UK-based employees and to maintain our policy objective of offering base salaries that are in line with those offered by companies of a similar size, international reach and complexity.
Retirement of Steve GoodAs mentioned in the Chairman’s Statement, Steve Good, our Chief Executive, has announced his intention to retire later in the year. He remains a full-time employee of the Group until his retirement. His remuneration will continue to reflect the policy outlined in the following pages except that he will not receive a new LTIP award in 2014. We are not making any payments to him in connection with his retirement other than as his existing terms provide (which are consistent with policy).
RiskIn terms of risk, the Committee is comfortable that the current arrangements do not inadvertently encourage undue risk-taking given the clear long-term focus in our policy. The operation of the 2013 Long-Term Incentive Plan will continue to ensure that a substantial proportion of pay is earned based on long-term performance, with the Company’s share ownership guidelines ensuring further long-term alignment between our executive team and shareholders. The Committee has also embedded clawback provisions in its incentive structures for Executive Directors providing a further safeguard to shareholders in the event of a misstatement in results.
The Committee looks forward to your continuing support of our remuneration policy at the 2014 Annual General Meeting.
Yours sincerely
Steve HannamSenior Independent Non-Executive Director and Chairman of the Remuneration CommitteeOn behalf of the Board of Directors4 February 2014
POLICY REPORTThis part of the Directors’ Report on Remuneration sets out the remuneration policy for the Company and has been prepared in accordance with The Large and Medium-sized Companies and Groups (Accounts and Reports) (Amendment) Regulations 2013 (‘the Regulations’). The policy has been developed taking into account the principles of the UK Corporate Governance Code and the views of our major shareholders and describes the policy to be applied in relation to the current financial year and future financial years. The Policy Report will be put to a binding shareholder vote at the 2014 AGM and, subject to it receiving majority shareholder support, it will be effective immediately from the Effective Date for the purposes of complying with the Regulations. In practice, however, the Committee intends to apply the policy detailed in the Policy Report from the beginning of the current financial year and throughout the three-year period that commences from the Effective Date.
Overview of the remuneration policyThe Group’s remuneration policy is to ensure that the remuneration of Executive Directors and senior executives properly reflects their duties and responsibilities and is sufficient to recruit, retain and motivate high-quality executive talent, taking into account their geographical location and the territories which their responsibilities cover, whilst aligning the interests of senior executives as closely as possible with the interests of shareholders. The remuneration of the Executive Directors has been structured to provide a significant performance-related element linked to the achievement of stretching performance targets. The Committee keeps the Company’s remuneration policy under review to ensure that an appropriate balance between fixed and variable pay is maintained.
More generally, the Committee also takes into account the principles of sound risk management when setting pay and takes action to satisfy itself that the remuneration structure at Low & Bonar does not encourage undue risk.
There are three main elements of the remuneration package for Executive Directors, and the senior executive population:
1. Fixed pay, comprising base salary, pension scheme contributions and other benefits.
2. Annual performance-related remuneration.3. Long-term performance-related remuneration in the form of share
awards.

46 | Low & Bonar PLC Annual Report 2013
Directors’ Report on Remuneration(continued)
The policies relating to each of the constituent parts of these main components of the Executive Directors’ remuneration packages are summarised in the table below:
SalaryPurpose and link to strategy To provide competitive fixed remuneration that will attract, retain and motivate high quality key employees
and reflect their experience, duties and geographical location.
Operation Reviewed annually.
Benchmarked periodically against relevant market comparators as appropriate, including companies of a similar international reach and complexity.
Individual pay levels determined by reference to performance, skills and experience in post.
Consideration given to the pay levels in the country in which the Executive Director lives and works and the wider salary increases across the Group more generally.
Maximum opportunity Salaries for the year ended 30 November 2014, effective 1 December 2013, are as follows:
• Group Chief Executive £353,000; and
• Group Finance Director: £268,500.
These salary levels will be eligible for increases during the three-year period that the Remuneration Policy operates from the Effective Date.
During this time, salaries may be increased each year. The Committee will be guided by general conditions (such as the level of inflation) in the country in which the Director lives, the salary increase budget set within that country for the Group and the salary budget across the workforce generally, as well as the overall financial performance of the Group.
Increases beyond those linked to the workforce (in percentage of salary terms) may be awarded in certain circumstances at the Board’s discretion (based on the recommendation of the Committee) such as where there is a change in responsibility, experience or a significant increase in the scale of the role and/or size, value and/or complexity of the Group.
Framework used to assess performance and for the recovery of sums paid
The Committee considers individual salaries at the appropriate Committee meeting each year taking due account of the factors noted in operation of the salary policy.
BenefitsPurpose and link to strategy To provide competitive benefits in line with market practice.
Operation The Company typically provides the following benefits:
• Car allowance
• Private health insurance
• Death in service cover
• Other ancillary benefits, including relocation expenses/arrangements (as required).
Where Executive Directors are recruited from overseas, benefits more tailored to their geographical location may be provided.
Where revised benefits are offered to employees more generally within a geographic location or across the Group, Executive Directors are likely to be eligible to receive those benefits.
Maximum opportunity In the year ended 30 November 2013, the maximum cost of providing benefits (based on taxable value of the benefits) was 5.8% of salary in total. However, the cost of some of these benefits is not pre-determined and may vary from year to year based on the overall cost to the Company in securing these benefits for a population of employees (particularly health insurance and death-in-service cover).
Framework used to assess performance and for the recovery of sums paid
None.

Strategic Report Governance Financial Statements
47 Low & Bonar PLC Annual Report 2013 |
PensionPurpose and link to strategy To provide a market competitive, yet cost-effective, long-term retirement benefit.
Operation A Company contribution to a defined contribution scheme or the provision of a cash supplement equivalent.
Maximum opportunity Company contributions of up to 25% of salary.
Framework used to assess performance and for the recovery of sums paid
None.
Annual BonusPurpose and link to strategy To incentivise annual delivery of performance objectives relating to the short-term goals of the Company.
Operation Annual cash bonus awards are earned with the majority based on performance against a sliding scale of challenging profit-based targets and with a minority based on targets related to the Company’s other key performance indicators (e.g. return on capital employed). The Committee adjusts these targets each year to ensure there is alignment with the Group’s strategic objectives.
Maximum opportunity Maximum (% salary): 100%
Framework used to assess performance and for the recovery of sums paid
Details of the performance measures used for the bonus relating to the previous financial year and targets set for the year under review and performance against them is provided in the Annual Report on Remuneration.
Bonus is determined based on performance against a range of the Company’s key performance indicators and paid following the approval of the Group’s audited results for the year by the Board.
The majority of the bonus will be earned on the basis of stretching profit-based targets.
A minority may be based on targets related to the Company’s other key performance indicators (e.g. return on capital employed).
Some guidance on targets for the bonus for the coming year is set out in the Directors’ Report on Remuneration below but the specific targets are considered by the committee to be commercially sensitive and will not be disclosed in advance.
No more than 30% of salary in total is earned at the threshold performance levels, with a graduated scale operating thereafter through to maximum bonuses being earned for out-performance of the Company’s targets for the year.
Payments under the annual bonus plan may be subject to clawback in the event of a material misstatement of the Company’s financial results or misconduct that leads to such material misstatement or if an error is made in assessing the extent to which any target and/or any other condition imposed on the bonus was satisfied. The clawback provisions will operate for a two-year period following the date on which the bonus is paid.
Long-Term Incentive Plan Awards Purpose and link to strategy To drive superior long-term financial performance and shareholder returns, aid retention and align the
interests of Executive Directors with shareholders.
Operation An annual award of free shares (i.e. either conditional shares or nil-cost options) which vest after three-years subject to continued service (save in “good leaver” circumstances) and the achievement of challenging performance conditions.
A dividend equivalent provision operates enabling dividends to be paid (in cash or shares) on shares that vest.
Maximum opportunity Maximum (% salary):
125%
In exceptional circumstances (e.g. recruitment), awards can be made up to 200% of salary.
Framework used to assess performance and for the recovery of sums paid
Granted subject to challenging financial (e.g. adjusted EPS) and total shareholder return performance targets tested over three years.
20% of awards will vest for threshold performance, with full vesting taking place for equalling, or exceeding, the maximum performance targets.
The Committee may scale back the level of vesting of an award if it considers underlying financial performance over the performance period has been significantly worse than the level of vesting would otherwise indicate.
Payments may be subject to clawback in the event of a material misstatement of the Company’s financial results or misconduct that leads to such material misstatement or if an error is made in assessing the extent to which any target and/or any other condition imposed on the award was satisfied. The clawback provisions will operate for a two-year period following the date on which awards vest.

48 | Low & Bonar PLC Annual Report 2013
Directors’ Report on Remuneration(continued)
All-employee Save-As-You-Earn PlanPurpose and link to strategy Encourages long-term shareholding in the Company.
Provides all employees with the opportunity to become owners in the Company on similar terms.
Operation Periodic invitations are made to participate in the Group’s Save-As-You-Earn (“SAYE”) Plan.
Shares acquired through the SAYE Plan (via exercising an option to acquire shares at the end of a savings contract) have significant tax benefits in the UK, subject to satisfying certain HMRC requirements.
The SAYE Plan can only operate on an “all employee” / equal terms basis. A plan operates on similar terms, but on a non-tax favoured basis, outside the UK as appropriate.
Maximum opportunity The maximum participation level in the SAYE Plan is as per HMRC limits (maximum monthly savings towards share purchases have been limited to £250 per calendar month but will increase to £500 per month for savings contracts begun in 2014) with participants granted linked share options (by reference to projected savings) with a strike price currently up to a 20% discount to the prevailing share price at the time of grant. On the maturity of the savings contracts, participants can elect to (i) use the accumulated savings to exercise the option or (ii) request the return of their savings.
Framework used to assess performance and for the recovery of sums paid
In line with the relevant HMRC legislation (applicable to UK-based employees), there are no post-grant performance targets applicable to awards.
Share Ownership GuidelinesPurpose and link to strategy To align interests of Executive Directors with shareholders.
Operation Executive Directors are expected to retain 50% of the after-tax number of vested shares issued under long-term incentive awards until the guideline is achieved (applicable to awards granted from 2011 onwards).
The Committee will monitor progress towards the guideline on an annual basis.
Maximum opportunity A 100% of salary share ownership guideline applies to the Executive Directors.
Framework used to assess performance and for the recovery of sums paid
None.
Bonus Plan & LTIP PolicyThe Committee will operate the annual bonus plan, the LTIP and SAYE Plan according to their respective rules and in accordance with the Listing Rules and HMRC rules, where relevant. The Committee retains discretion, consistent with market practice, in a number of regards to the operation and administration of these plans. These include the following (albeit with quantum and performance targets restricted to the descriptions detailed in the policy table above):
• Who participates in the plans;• The timing of grant of award and/or payment;• The size of an award and/or a payment;• The determination of vesting and/or meeting targets; • Discretion required when dealing with a change of control (e.g. the timing of testing performance targets) or restructuring of the Group;• Determination of a good/bad leaver for incentive plan purposes based on the rules of each plan and the annual bonus and the appropriate
treatment chosen;• Adjustments required in certain circumstances (e.g. rights issues, corporate restructuring, events and special dividends); and• The annual review of performance measures weighting, and targets for the annual bonus plan and the LTIP from year to year.
The Committee also retains the ability to adjust the targets and/or set different measures and alter weightings for the annual bonus plan and to adjust targets for the LTIP if events occur (e.g. material divestment of a Group business) which cause it to determine that the conditions are no longer appropriate and the amendment is required so that the conditions achieve their original purpose and are not materially less difficult to satisfy.
All historic awards that were granted under the 2003 and 2013 LTIPs and remain outstanding (detailed on page 57 of the Annual Report on Remuneration) remain eligible to vest based on their original award terms. With regards to any promotions to the executive Board, the Company will retain the ability to honour payments agreed prior to joining the Board (such as, for example, an annual bonus formulated to reflect divisional performance), albeit that any payments agreed in consideration of being promoted to the Board will be consistent with the Recruitment and Promotion Policy on page 51. A bonus may be forfeit on cessation of employment in certain circumstances as outlined in “Directors’ service contracts and payments for loss of office” on page 52.

Strategic Report Governance Financial Statements
49 Low & Bonar PLC Annual Report 2013 |
Choice of performance measures and approach to target settingThe performance metrics that are used for annual bonus and LTIP awards are a subset of the Group’s key performance indicators.
Under the annual bonus plan, profit is used as the primary performance metric. Other metrics based on the Company’s key performance indicators (which for the current year includes return on capital employed) are also used to provide clear alignment with the overarching strategy of achieving profitable cash-generative growth whilst ensuring that efficient management of capital is fully encouraged.
In terms of long-term performance targets, LTIP awards vest subject to (i) challenging EPS growth targets that are aligned with the long-term levels of earnings growth targeted by the Company and (ii) relative TSR targets which provide clear alignment of interests between shareholders and executives.
Targets are set based on sliding scales that take account of internal planning and external market expectations for the Company. Only modest rewards are available for delivering threshold performance levels, with maximum rewards requiring substantial out-performance of the challenging plans approved at the start of each year.
No performance targets are applied to the SAYE Plan, which is aimed at encouraging broad-based equity ownership.
Further details of the annual bonus metrics used for the year ended 30 November 2013 are set out in the Annual Report on Remuneration. The targets relating to the annual bonus for the year ended 30 November 2014 are considered to be commercially sensitive and will not therefore be disclosed in advance. They will be disclosed in next year’s Annual Report on Remuneration, along with disclosure of performance against them and the payments resulting. The targets for awards to be granted under the LTIP in 2014 are consistent with the policy set out above and are set out in the Annual Report on Remuneration.
Differences in remuneration policy for Executive Directors compared to other employeesThe Committee is made aware of pay structures in the different countries in which the Group operates when setting the remuneration policy for Executive Directors.
The workforce at Low & Bonar is increasingly geographically diverse and so local salary budgets are often influenced by the differing working conditions, regulations and economic conditions (including rates of inflation) in each location. As a result, when determining basic salary increases, the Committee considers the general basic salary increase and prevailing conditions for the country in which the Executive Director is based and, also, the general basic salary increase across the broader Group. Given the diverse nature of the Group, it is not as relevant to tie remuneration practices to those of the workforce more generally as, perhaps, would be the case in a UK-centric company.
The key difference between Executive Directors’ remuneration and that of other employees is that, overall, the remuneration policy for Executive Directors is more heavily weighted towards variable pay. In particular, long-term incentives are not provided outside of the most senior executive population as they are reserved for those considered to have the greatest potential to influence overall levels of performance. Share ownership guidelines require lower levels of share retention for non-Directors. Annual bonuses are not made available to all employees, again being targeted at those with greater potential to influence performance, and performance targets, whilst being in line with Group objectives, are tailored to incentivise employees against targets which are relevant to the business in which they operate.
The level of variable pay varies by level of employee within the Group and is informed by the specific responsibilities of each role and local market practice as appropriate.
How the views of employees are taken into accountThe Company does not actively consult with employees on executive remuneration. The Group has a diverse workforce operating in many different countries, with various local pay practices, which would make any cost-effective consultation impractical. However, the Committee is made aware of overall pay and employment conditions in the wider workforce and takes this into account when determining executive remuneration policy.
How the views of shareholders are taken into accountThe Remuneration Committee considers shareholder feedback received in relation to the AGM each year. This feedback, together with any additional feedback received during any communications from time to time, is then considered as part of the Company’s annual review of remuneration policy. The Committee consulted with key investors ahead of its 2013 AGM in relation to the adoption of the 2013 Long-term Incentive Plan.

50 | Low & Bonar PLC Annual Report 2013
Directors’ Report on Remuneration(continued)
Reward scenarios The Company’s policy results in a significant proportion of remuneration received by Executive Directors being dependent on Company performance. The graph below illustrates how the total pay opportunities for the Executive Directors vary under three different performance scenarios: below target, on-target and maximum. When reviewing the table, it should be noted that it has been prepared based on the policy detailed above and ignores, for simplicity, the potential impact of future share price growth and the effect of Steve Good’s retirement later this year.
0
300
600
900
1,200
1,500
Below target On-target Maximum
£’oo
o
100% 100%51% 51%37% 37%
£461
£354
£902
£690
£1,255
£958
20%
19%
28%
28%
29%
29%
35%
35%
Chief Executive Finance DirectorBelow target
PSPAnnual IncentiveFixed Pay
On-target Maximum
Assumptions:
Below target = fixed pay only (base salary, benefits and pension);
On-target = 50% payable of the 2013/14 annual bonus and 60% vesting of the 2013/14 LTIP awards (based on the mid-point being achieved between threshold and maximum performance levels); and
Maximum = 100% payable of the 2013/14 annual bonus and 100% vesting of the 2013/14 LTIP awards.
Salary levels (on which other elements of the package are calculated) are based on those applying on 1 December 2013. The value of taxable benefits is based on the cost of supplying those benefits (as disclosed on page 56) for the year ending 30 November 2013. The pension value is set at 25% of the salary.
The Executive Directors can participate in the SAYE Plan on the same basis as other employees. The value that may be received under this scheme is subject to tax-approved limits. For simplicity, the value that may be received from participating in this scheme has been excluded from the graph above.
Amounts have been rounded to the nearest £1,000. Share price growth on vesting of shares under LTIP awards has been ignored for the purposes of simplicity.
2013/2014 LTIP awards will only be made in March 2014 and provided that the Company is able to make such awards at such time. For the purposes of the table, it has been assumed that awards at 125% of current salary are made. Mr Good will not be granted an LTIP award in 2014 due to his retirement so this information is for illustration purposes only.

Strategic Report Governance Financial Statements
51 Low & Bonar PLC Annual Report 2013 |
Recruitment and Promotion PolicyFor Executive Director recruitment and/or promotion situations, the Committee will follow the guidelines outlined below:
Remuneration Element Policy
Base Salary Salary for a new hire (or on promotion to Executive Director) would be set at a level sufficient to attract the best candidate available to fill the role, taking into account the Group’s position and strategy and the country in which the new hire will live and work. For example, it may set the salary of a new hire at a premium to those paid to the predecessor if this was necessary to attract a candidate with experience in a business of the size which the Group aspires to become or, conversely, could be set at a discount to those offered in companies of a similar size, geographical reach and complexity initially, with a series of planned increases over subsequent years, in order to bring the salary to the desired level, subject to individual performance.
Benefits Benefits will be set in accordance with the Company’s remuneration policy. In addition, where necessary, the Committee may approve the payment of relocation expenses to facilitate recruitment and flexibility is retained to pay for legal fees and other costs incurred by the individual in relation to their appointment. Consideration may need to be given to particular elements of benefit packages if a new Director was recruited outside of the UK.
Pension A defined contribution or cash supplement at the level provided to current Executive Directors, again subject to particular considerations for a recruit from outside the UK.
Annual Bonus The annual bonus will operate as outlined for current Executive Directors, with the respective maximum opportunity, albeit usually pro-rated for the period of employment. Depending on the timing and responsibilities of the appointment, it may be necessary to set different performance measures and targets initially.
The maximum ongoing incentive opportunity under the Company’s policy is 100% of salary.
Long-Term Incentives LTIP awards will be granted in line with the policy outlined for the current Executive Directors. An award may (and would usually) be made upon appointment (subject to the Company not being prohibited from doing so). For an internal hire, existing awards would continue over their original vesting period and remain subject to their terms as at the date of grant and further awards may also be considered.
The maximum ongoing annual award level is 125% of salary but an award, in exceptional circumstances (as determined by the Committee) (e.g. as in the case of a “buy-out” as detailed below), may be granted up to 200% of salary under the rules of the LTIP.
Buy-out Awards In the case of an external hire, the Committee may offer additional cash and/or share-based elements when it considers these to be in the best interests of the Company (and therefore shareholders) to facilitate the buy-out of value forfeit on joining the Company. This includes the use of awards made under Rule 9.4.2 of the Listing Rules. Such payments would take account of remuneration relinquished when leaving a former employer and would reflect (as far as possible) the nature and time horizons attaching to that remuneration and the impact of any performance conditions. Shareholders will be informed of any such payments at the time of appointment.

52 | Low & Bonar PLC Annual Report 2013
Directors’ Report on Remuneration(continued)
Directors’ service contracts and payments for loss of office The policy of the Company is to have service contracts for all the Executive Directors that continue indefinitely unless determined by their notice period.
The Committee’s policy is to set notice periods of up to 12 months for the Company to dismiss an Executive Director. Should notice be served by either party, the executive will be able to continue to receive basic salary and other emoluments (but not bonus) for the duration of their notice period during which time the Company may require the individual to continue to fulfill their current duties or may assign a period of garden leave.
A bonus has only been payable if the relevant Director is in the employment of Low & Bonar PLC on the date on which bonuses are paid by the Company following the end of the relevant financial year (the “Payment Date”) and he/she has not given notice of intention to leave employment. The Company’s policy in future years (including 2013/2014), will include the ability for payments to be made to Executive Directors on a pro-rata basis if the Director is a “good leaver” during the year: i.e. in certain prescribed circumstances, such as ill health, injury or disability, redundancy, retirement, transfer or sale of the employing company, or other circumstances at the discretion of the Committee. If the Company dismisses the Director on or after the final date of the financial year but before the Payment Date (other than for reasons of gross misconduct) he/she will remain eligible to receive the bonus.
Executive Director’s service contracts may be terminated without notice for certain events, such as gross misconduct. No payment or compensation beyond sums accrued up to the date of termination will be made if such event occurs.
At the Company’s discretion, Executive Directors may receive a payment in lieu of notice. The payment in lieu of notice would relate to the unexpired notice period and include base salary and other emoluments (but not bonus). The contracts of the current Executive Directors provide that, if a payment in lieu of notice is made, then on the date of notice of termination a payment of six months’ salary is made. Further payments are made only if the Director is not in full-time employment at the time at which the payments fall to be made. The policy for a new hire would be that a payment in lieu of notice may be made but that it would be subject to full, on-going mitigation.
The treatment for share-based incentives previously granted to an Executive Director will be determined based on the relevant plan rules. The default treatment will be for outstanding awards to lapse on cessation of employment. However, in relation to awards granted under the 2013 LTIP, in certain prescribed circumstances, such as retirement, injury or disability, redundancy, transfer or sale of the employing company, or other circumstances at the discretion of the Committee (reflecting the circumstances that prevail at the time) “good leaver” status may be applied. If treated as a good leaver, awards will remain subject to performance conditions, which will be measured over the performance period from grant to the normal vesting date, and will be reduced pro-rata to reflect the proportion of the performance period actually served (although the Committee can decide not to pro-rate if it considers it inappropriate to do so). The Committee can also decide, in exceptional circumstances, to allow the award to vest on the date of cessation, subject to performance to that date and pro-rating. Options held under the SAYE Plan generally lapse when employment ceases, subject again to certain good leaver provisions.
The Company may enable the provision of outplacement services to a departing Director, where appropriate.
With regards to awards previously granted under the 2003 LTIP, the extent of early vesting that takes place in certain good leaver circumstances is broadly equivalent to that described for the 2013 LTIP. No further awards can be granted under this arrangement. Awards made to Steve Good (under both the 2003 LTIP and 2013 LTIP) will remain eligible to vest, subject to performance, under these provisions in light of his retirement.
In relation to the current Executive Directors’ service contracts, Steve Good entered into a service agreement in November 2003 (as amended in 2008 and again in 2009 following his becoming Group Chief Executive) and Mike Holt entered into a service agreement in September 2010, in respect of his appointment which commenced on 22 November 2010.
External appointmentsThe Committee recognises that Executive Directors may be invited to become Non-Executive Directors in other companies and that these appointments can enhance their knowledge and experience to the benefit of the Company. It is the Company’s policy that Board approval is required before any external appointment may be accepted by an Executive Director. The Executive Director is permitted to retain any fees paid for such services. Neither of the current Executive Directors holds any such remunerated external appointment.
Non-Executive Directors’ letters of appointmentNon-Executive Directors do not have service contracts but are appointed pursuant to letters of appointment renewable usually for periods of three years. The appointment of the Non-Executive Directors may be terminated by either the Director or the Company giving six months’ notice in writing. Continuation of an appointment is contingent on re-election by the shareholders as required by the Articles.

Strategic Report Governance Financial Statements
53 Low & Bonar PLC Annual Report 2013 |
Non-Executive Director’s service contractMartin Flower has a service contract with the Company dated 12 February 2010 (which replaced his letter of appointment relating to his previous service as a Non-Executive Director dated 1 January 2007). Mr Flower’s appointment is for a period of three years from 30 June 2013, which can be extended for a further three-years upon expiry. The appointment may be terminated at any time by either party giving to the other six months’ prior written notice. If the Company gives notice it may, at its discretion, terminate the appointment with immediate effect by paying an amount in respect of the fee for the notice period. Mr Flower’s appointment as Chairman will terminate forthwith and without any compensation for loss of office if he is removed as a Director by resolution passed at a general meeting or if he ceases to be a Director pursuant to any provision of the Articles of Association.
Originalappointment date Renewed from
Steve Hannam 1/9/2002 1/9/2013 for 1 yearTrudy Schoolenberg 1/5/2013 N/AMartin Flower 1/1/2007 30/6/2013 for 3 yearsJohn Sheldrick 1/10/2011 N/A
The policy on Non-Executive Directors’ fees is:
FeesPurpose and link to strategy To provide a competitive fee which will attract those high-calibre individuals with the relevant skills and
experience necessary to contribute to a high performing board.
Operation The fees for Non-Executive Directors (including the Chairman) are reviewed every year, although not always changed.
Fee levels are set by reference to the expected time commitments and responsibility and are periodically market tested to determine if fee levels are in line with those offered in companies of a comparable size, international reach and complexity for each role.
The Chairman and Non-Executive Directors are paid an annual fee and do not participate in any of the Company’s incentive arrangements or receive any pension provision.
The Non-Executive Directors receive a basic fee, with additional fees payable for chairmanship of the Company’s key committees.
The Committee recommends the remuneration of the Chairman to the Board.
The Chairman’s fee is considered by the Remuneration Committee (during which the Chairman has no part in discussions) and the Non-Executive Directors’ fee is determined by the Board excluding the Non-Executives.
Maximum opportunity Fees for the year ended 30 November 2014 are:
• Chairman: £135,757• Non-Executive Director base fee: £40,000• Chairman of the Audit Committee: £7,000• Chairman of the Remuneration Committee: £7,000
The above fee levels will be eligible for increases during the three-year period that the remuneration policy operates to ensure they continue to appropriately recognise the time commitment of the role, increases to fee levels for non-executive directors in general and fee levels in companies of a similar size and complexity.
Framework used to assess performance and for the recovery of sums paid
None.

54 | Low & Bonar PLC Annual Report 2013
Directors’ Report on Remuneration(continued)
ANNUAL REPORT ON REMUNERATIONThis part of the report has been prepared in accordance with Part 4 of The Large and Medium-sized Companies and Groups (Accounts and Reports) (Amendment) Regulations 2013 and Rule 9.8.6R of the Listing Rules. The Annual Remuneration Report will be put to an advisory shareholder vote at the 2014 AGM. The information on pages 56 to 58 has been audited.
Unaudited information
The Remuneration CommitteeThe Committee currently comprises the following Non-Executive Directors of the Company: Steve Hannam, Chairman of the Committee; Trudy Schoolenberg; Martin Flower; and John Sheldrick, who were all members of the Committee throughout the year under review, with the exception of Ms Schoolenberg who joined the Committee on her appointment to the Board on 1 May 2013 in succession to Mr Folkert Blaisse, who left the Board and the Committee on 30 April 2013. All of the Committee members, with the exception of Mr Flower, are considered by the Board to be independent. Mr Flower became a member of the Committee on 6 July 2010 and, while it is no longer appropriate to apply the test of independence to him following his appointment as Chairman, he was considered by the Board to be independent on his initial appointment as a Non-Executive Director.
The Group Chief Executive and the Group Finance Director may be invited to attend meetings of the Committee. The Committee keeps itself informed of all relevant developments and best practice in the field of remuneration and seeks advice where appropriate from external advisers. The Group Chief Executive, the Group Finance Director and the Company Secretary also assist the Committee, except in relation to their own remuneration. The attendance of each Director at meetings during the year is shown on page 37.
The Committee continues to consider, in line with the Association of British Insurers’ Guidelines on Responsible Investment Disclosures, whether the incentive policies for Executive Directors and senior executives raise any ESG issues or risks by inadvertently motivating irresponsible behaviour (with liaison between the Risk Oversight, Audit and Remuneration Committees where appropriate). As part of this action, the Committee periodically commissions a remuneration risk assessment, the last one being undertaken during 2013. This assessment confirmed that the Company’s remuneration policy is aligned with the Group’s strategy and does not encourage undue risk taking given the internal controls operated by the Group, the range of performance measures used for incentive purposes and the significant weighting placed on long-term performance.
The Committee’s remit is set out in the terms of reference, a copy of which is available on the Company’s website. In 2013, the Committee recommended to the Board the broad policy for the remuneration of the Chairman, the Executive Directors and other senior executives.
External advisersThe Committee has authority to obtain the advice of external independent remuneration consultants. It is solely responsible for their appointment, retention and termination and for approval of the basis of their fees and other terms. During the year, the Committee sought advice from New Bridge Street, a trading name of Aon Hewitt Limited (an Aon plc company), and, in relation to certain matters of legal compliance only, Freshfields Bruckhaus Deringer. New Bridge Street has no connection with the Company other than in the
provision of advice in relation to executive remuneration and Non-Executive Director fees and nor do any other companies within the Aon plc group provide other services to the Company. The total fees paid to New Bridge Street in respect of its services during the year were £50,303. New Bridge Street is a signatory to the Remuneration Consultants Group Code of Conduct. Freshfields Bruckhaus Deringer provides legal advice to the Company on matters other than remuneration on a regular and continuing basis. The Committee regularly reviews the external advisor relationship and is comfortable that the advice it is receiving remains objective and independent.
Implementation of remuneration policy for year ending 30 November 2013i) Basic salary The Executive Directors’ base salaries were reviewed during the final quarter of the financial year ending 30 November 2013. The Committee took account of progression in the role as well as a consideration of each individual’s developing responsibilities, performance, skills and experience. The Committee also considered the wider pay levels and salary increases being proposed across the Group as a whole. As a result, the Committee decided to increase the Executive Directors salaries by around 3% with effect from 1 December 2013.
Salary as at 1 December
2013
Salary as at 1 December
2012 Increase
Group Chief Executive £353,000 £342,140 3.2%Group Finance Director £268,500 £260,000 3.3%
The increase awarded to the Executive Directors took due account of the performance-related salary increases awarded to UK-based employees and our policy objective of offering base salaries that are in line with those offered by companies of a similar size, international reach and complexity.
ii) Pension and benefitsExecutive Directors receive a car allowance, private health insurance, death in service cover and a Company pension contribution of 25% of salary.
iii) Performance-related bonus In 2014, the Executive Directors will again be eligible to receive a performance-related bonus of up to 100% of salary with the metrics and opportunity composed as follows:
Metric Opportunity (% Salary)
Profit* 70%ROCE** 30%
* Profit before tax, amortisation and non-recurring items, at budgeted exchange rates on a constant basis throughout the year.
** ROCE targets are subject to achieving a threshold level of profit before tax, amortisation and non-recurring items to ensure that the sales growth and returns are delivered on a profitable basis.
In line with the policy detailed in the Policy Report, the bonus targets operating for the year ended 30 November 2014 will be structured on a graduated scale around targeted levels of performance. In relation to the profit element of a bonus (maximum of 70% of salary), the bonus payable at the threshold performance level is 17.5% of salary through to a maximum bonus being earned at up to 70% of salary in relation to delivering performance ahead of the Company’s target. In relation to the ROCE element of the bonus (maximum of 30% of salary), the bonus payable at the threshold performance level is 7.5%
Strategic Report Governance Financial Statements
55 Low & Bonar PLC Annual Report 2013 |
of salary through to a maximum bonus being earned at up to 30% of salary in relation to delivering performance ahead of the Company’s target. No bonus is earned against non-financial targets. As was the case with the bonuses for the year ended 30 November 2013, the annual bonus for the year ended 30 November 2014 will also be subject to clawback provisions which will enable the Committee to recover the value overpaid to an Executive Director in respect of 2014 performance in the event of a material misstatement of the Company’s financial results or misconduct that leads to such material misstatement or if an error is made in assessing the extent to which any target and/or any other condition imposed on the bonus was satisfied. The clawback provisions will operate for a two-year period following the date on which the bonus is paid. The specific targets set are considered by the Committee to be commercially sensitive and will thus not be disclosed in advance in this year’s report. Disclosure of the specific targets, along with performance against them and payments resulting, will be provided on a retrospective basis in next year’s Annual Report on Remuneration. Bonuses for Executive Directors are subject to provisions allowing for payment on a pro rata basis to “good leavers” during the year as outlined above.
iv) Long-term Incentive PlanThe maximum normal award limit under the 2013 LTIP is 125% of salary and it is intended that awards will be granted at this level in the current financial year as nil-cost options. No award will be made to Steve Good. The quantum of awards has been set after taking due account of (i) the need to motivate and retain the Executive Directors and other participants and (ii) the challenging nature of the performance targets set.
The performance targets to apply to the awards to be granted in the current financial year under the 2013 LTIP will be, as in prior years, split so that half will vest dependent on challenging EPS growth targets and half dependent on relative TSR measured against the constituents of the FTSE Small Cap Index (excluding investment trusts). The targets, each tested over three years, are as follows:
Relative Total Shareholder Return (50% of an award)
Low & Bonar TSR Ranking versus FTSE Small Cap Index(excluding investment trusts)
Percentage vesting
Below median 0%Median 20%Upper quartile 100%
Straight-line vesting between performance points
Earnings Per Share (50% of an award)
Adjusted annualized EPS growth1
Percentage vesting
Below 6% p.a. 0%6% p.a. 20%14% p.a. 100%
Straight-line vesting between performance points
1 The base-year EPS (i.e. that for the year ended 30 November 2013) is 6.23p, being our reported adjusted EPS adjusted to include administration costs but excluding net pension interest costs relating to the Group’s pension schemes as calculated in accordance with IAS 19 Revised (after such revisions the adjusted EPS is the same as the reported EPS for 2013). The Remuneration Committee will also adjust reported EPS for these same pension-related elements when assessing achievement of performance targets at the end of the performance period in order that the volatility in results which may arise from pension scheme investment strategy, which is managed by independent trustees is excluded from consideration of management performance.
The Committee will have a power to reduce vesting if the Company’s overall financial performance over the performance period is significantly worse than the level of vesting indicates. In such circumstances, the Committee may reduce the level of vesting of an award so that, in the reasonable opinion of the Committee, it reflects the Company’s overall financial performance over the performance period. In making its assessment, the Committee will consider the Company’s broad range of key performance indicators from time to time (which currently include profit before tax and return on capital employed).
The use of EPS and relative TSR, consistent with the approach taken in prior years, reflects our continued long-term focus on delivering long-term profitable growth and creating above market levels of shareholder value. Setting absolute EPS growth targets is considered to provide a clear and transparent approach to incentivising Executive Directors and mirrors the approach taken in recent years. The range of EPS targets reflects the current trading environment and is aligned with the continued focus on profitable growth, which is a key factor in our strategy. Use of relative TSR provides clear alignment between the Executive Directors and the Company’s shareholders. We believe the targets to be appropriately challenging given the proposed level of the awards.
When testing these targets, the Committee’s policy will be to (i) request from its advisers an independent assessment of the extent to which the relative TSR target has been satisfied and (ii) consider the Company’s audited results (and the need to make any adjustments) when determining the extent of vesting in respect of EPS targets.
The awards will be subject to clawback provisions which will enable the Committee to recover the value overpaid to an Executive Director under an award in respect of performance to the year ending 30 November 2016 in the event of a material misstatement of the Company’s financial results or misconduct that leads to such material misstatement or an error is made in assessing the extent to which any target and/or any other condition imposed on vesting was satisfied. The clawback provisions will operate for a two-year period following the date on which the awards vest.
v) Other share-based incentivesExecutive Directors remain eligible to participate in the SAYE Plan on the same terms as any other eligible employee.
vi) Non-Executive Directors’ remunerationNon-Executive Directors are not eligible to participate in short or long-term incentive plans or to receive any pension from the Group.
During the year under review, the remuneration of the Non-Executive Directors was reviewed by the Board (without the Non-Executive Directors participating in Board decisions) and was increased to £40,000, the first increase in fees for four years. The fee for chairing the Remuneration Committee was also increased to £7,000 and the fee for chairing the Audit Committee remains at £7,000. The increases to fees for the coming year were made after considering the results of a benchmarking exercise encompassing companies of a comparable size, international reach and complexity.
The Chairman’s fee of £135,757 was reviewed by the Committee, but not increased, for the year ending 30 November 2014.

56 | Low & Bonar PLC Annual Report 2013
Directors’ Report on Remuneration(continued)
Audited InformationTable 1 Analysis of individual Directors’ emoluments
Salariesand fees
Benefitsin kind1
Annualbonus2
LTIP awards3 Pensions4 Total
£ £ £ £ £ £
Executive Directors
S Good 2013 342,140 19,735 – 615,906 85,535 1,063,3162012 332,175 19,649 263,425 610,434 83,044 1,308,727
M Holt 2013 260,000 18,535 – 438,994 65,000 782,5292012 252,350 18,449 200,114 345,450 63,087 879,450
Non-Executive DirectorsSJ Hannam5 2013 47,000 47,000
2012 41,762 41,762C Littmoden6 2013 – –
2012 10,753 10,753MC Flower 2013 135,757 135,757
2012 135,757 135,757FB Blaisse7 2013 15,838 15,838
2012 38,012 38,012T Schoolenberg8 2013 22,174 22,174
2012 – –JN Sheldrick9 2013 45,000 45,000
2012 45,000 45,000
1 Benefits in kind are a car allowance and health insurance for the Director and his spouse/children under 21. In relation to the benefits detailed in the above table, the benefit which is considered to be significant in value terms is the provision of a car allowance, which was limited to an annual cost of £16,200 for Mr Good and £15,000 for Mr Holt.
2 The annual bonus is the only payment made to Directors which falls within paragraph 7(1)(c) of Part 3 of Schedule 8 to the Regulations. In setting the bonus plan for 2012, the metrics used were chosen to be aligned with the Group’s stated medium-term objectives and were set out in more detail on page 44 of last year’s Annual Report.
The metrics used in the annual bonus plan in the year under review were chosen to be aligned with the Group’s stated medium-term objectives. This resulted in a combination of profit and ROCE targets being set. The sliding scales of targets set took due account of both internal planning and the external market’s expectations for the Company’s performance. The bonus earned against the targets set, and a summary of the targets and weightings applying to each measure for 2013, is set out below:
Metric Opportunity (% salary) Payment (% salary)
Profit* 70% 0%
ROCE** 30% 0%
* Profit before tax, amortisation and non-recurring items at budgeted exchange rates. A “profit” element of the bonus was to be paid if profit before tax, amortisation and non-recurring items (“PBTA”) equalled or exceeded the lower limit of £25.0m. At the lower limit, a ‘profit’ bonus of 21% of salary was payable. Below the lower limit, no “profit” element of the bonus was to be paid. At a PBTA of £26.3m (the mid-point), a profit element of the bonus of 45% of salary was to be payable. A maximum “profit” element of the bonus of 70% of salary was to be payable if PBTA was equal to or more than £27.5m (the upper limit). Between the lower and mid point and between the mid point and the upper limits, the profit bonus percentage was to increase on a straight-line basis. As the targets were set at budgeted exchange rates, the level of profit determined to have been made during the year would differ from reported profits, which are based upon actual exchange rates during the year. Certain other minor adjustments to reported profits may also be taken into account when determining profits for the purposes of annual bonuses.
** ROCE targets were subject to achieving a threshold level of PBTA (calculated as set out above) to ensure that the returns were delivered on a profitable basis. A return on capital employed element of the bonus was to be payable if return on capital employed for the relevant periods equalled or exceeded the rates for the periods referred to in the table below. Return on capital employed was operating profit before non-recurring items and amortisation for the twelve-month period ending on 31 May or 30 November 2013 (as applicable) divided by the total sum of fixed assets (property, plant and equipment), inventories, trade debtors, prepayments, trade creditors and accruals at budgeted exchange rates). Below the lower limit specified, no ‘“return on capital employed” element of the bonus was to be paid. A maximum “return on capital employed” element of the bonus of 15% of salary was only to be payable if return on capital employed was equal to or more than the rate specified (the upper limit).
Period-end return on capital employed
Bonus entitlement (as % of salary)
31 May 2013 15.5% 0.0%16.5% 15.0%
30 November 2013 16.5% 0.0%17.5% 15.0%
Between the lower and upper limits, the return on capital employed bonus percentage was to increase on a straight line basis. The “return on capital employed” element of the bonus was only to become payable if actual PBTA was at least £25.0m.
No bonuses became payable for the Executive Directors as the adjusted PBTA for the year was below the lower limit.

Strategic Report Governance Financial Statements
57 Low & Bonar PLC Annual Report 2013 |
3 The amounts stated for 2012 comprise the value of ordinary shares vesting and being received in that financial year under (a) LTIP awards made in 2009 in relation to the TSR performance target (but not the EPS target) as the performance period in relation to the TSR target ended in that financial year and the shares vested and were issued to the relevant Directors in September 2012 and (b) LTIP awards made in 2010 in relation to the EPS performance target (but not the TSR target) as the performance period in relation to the EPS target ended in that financial year, although those shares vested and were issued to the relevant Directors in April 2013. The amounts stated for 2013 comprise the value of ordinary shares (a) vesting and being received in that financial year under LTIP awards made in 2010 in relation to the TSR performance target (but not the EPS target) as the performance period in relation to the TSR target ended in that financial year and the shares vested and were issued to the relevant Directors in April 2013 and (b) to vest and be issued under LTIP awards made in 2011 in relation to the EPS performance target (but not the TSR target) as the performance period in relation to the EPS target ended in that financial year, although those shares have not yet vested or been issued to the relevant Directors, which is expected to occur in March 2014. The values stated are the prices at which the relevant shares (or a portion of them) were sold in the market immediately after their allotment to the Director in respect of the shares issued under the 2009 and 2010 awards and based on the market price of the shares over the last quarter of the 2013 financial year in relation to the shares to be issued under the 2011 award.
The 2009 LTIP awards vested as to 97.4% of the maximum level in relation to the TSR performance condition in September 2012 based on a three-year total shareholder return of 87.9%, which was marginally below the upper quartile level of the FTSE Small Cap Index (excluding investment trusts) over the three-year period of 91.4%. The 2010 LTIP awards vested as to the maximum level in relation to both the EPS and TSR performance conditions in April 2013. This level of vesting was triggered as a result of achieving (i) EPS of 6.28p in the year ending 30 November 2012 which was above the maximum EPS target of 5.4p and thus resulted in maximum vesting in respect of this part of the award and (ii) a three-year total shareholder return of 110.4%, which was above the upper quartile level of the FTSE Small Cap Index (excluding investment trusts) over the three-year period of 94.5%, which triggered vesting in respect of 100% of this part of the award. The 2011 LTIP awards are due to vest in March 2014 to 44% of the maximum in relation to the EPS performance targets (22% of the total of the award). This level of vesting was triggered as a result of achieving (i) EPS of 6.23p in the year ending 30 November 2013 compared to the EPS target range of 5.7p to 7.0p. At vesting (14 March 2014), the value of the vested shares to Executive Directors is estimated at £123,135 for Mr Good and £93,544 for Mr Holt (using the average share price over the final quarter of the year ended 30 November 2013 of 74.28p). The LTIP Awards made in 2011 are subject to clawback as described elsewhere in this report.
4 In addition to their salaries, the Executive Directors are entitled to a percentage of their basic salary to enable them to make retirement benefit arrangements. Payments made under this arrangement during the year were a contribution of 25% of salary.
5 Steve Hannam received a fee of £5,000 for his Chairmanship of the Remuneration Committee from 1 March 2012 onwards (a pro-rata portion of which is included in the number in the table).
6 Chris Littmoden received a fee of £5,000 for his Chairmanship of the Remuneration Committee (which is included in the number in the table). He ceased to be a Director of the Company on 28 February 2012 and the information in this report for 2012 relates only to the period up to that date.
7 Folkert Blaisse ceased to be a director on 30 April 2013 and the information in this report for 2013 relates only to the period up to that date.
8 Trudy Schoolenberg became a Director on 1 May 2013 and the information in this report for 2013 relates only to the period from that date until 30 November 2013.
9 John Sheldrick received a fee of £7,000 for his chairmanship of the Audit Committee (which is included in the number in the table).
Table 2 The Low & Bonar Long-Term Incentive PlanAwards held by Directors under the LTIP are as follows:
At 1 December 2012 Awarded in year Vested in year Lapsed in year
At 30 November 2013
Share price at date of award Date of award
S Good 1,397,932 – 1,397,932 – – 33.00p 1/3/20102
M Holt 980,000 – 980,000 – – 45.00p 22/11/20102
S Good1 753,505 – – – 753,505 53.50p 15/3/20113
M Holt 572,430 – – – 572,430 53.50p 15/3/20113
S Good1 570,926 – – – 570,926 64.00p 16/3/20124
M Holt 394,297 – – – 394,297 64.00p 16/3/20124
S Good1 – 575,993 – – 575,993 74.25p 9/4/20135
M Holt – 437,710 – – 437,710 74.25p 9/4/20135
1 The outstanding awards made to Steve Good may vest in whole or in part once performance against the relevant targets is assessed and such vesting and the number of shares which are issued to Mr Good will be determined under the rules of the relevant plan.
2 The performance criteria applying to these awards were structured as follows: 50% of the shares were subject to an EPS growth target and 50% a relative TSR target measured against the constituents of the FTSE Small Cap Index. Under the EPS element, 25% of shares vested for EPS in the year ended 30 November 2012 of 4.7 pence, rising on a straight-line basis to full vesting for EPS of 5.4 pence. Under the TSR element, 25% of shares vested for median TSR, rising on a straight-line basis to full vesting for upper quartile. The award vested in full in April 2013 having fully met the performance conditions. The gains made by the directors on vesting of these awards were £985,542.06 for Mr Good (2012: £238,466.25) and £690,900.00 for Mr Holt (2012: £nil).
3 The performance criteria applying to these awards are structured as follows: 50% of the shares are subject to an EPS growth target and 50% a relative TSR target measured against the constituents of the FTSE Small Cap Index. Under the EPS element, 20% of shares vest for EPS in the year ended 30 November 2013 of 5.9 pence, rising on a straight-line basis to full vesting for EPS of 7.0 pence. Under the TSR element, 20% of shares vest for median TSR, rising on a straight-line basis to full vesting for upper quartile.
4 The performance criteria applying to these awards are structured as follows: 50% of the shares are subject to an EPS growth target and 50% a relative TSR target measured against the constituents of the FTSE Small Cap Index. Under the EPS element, 20% of shares vest for EPS in the year ended 30 November 2014 of 7.1 pence, rising on a straight-line basis to full vesting for EPS of 8.8 pence. Under the TSR element, 20% of shares vest for median TSR, rising on a straight-line basis to full vesting for upper quartile.
5 The performance criteria applying to these awards are structured as follows: 50% of the shares are subject to an EPS growth target and 50% a relative TSR target measured against the constituents of the FTSE Small Cap Index over the period until 8 April 2016. Under the EPS element, 20% of shares vest for EPS in the year ended 30 November 2015 of 7.5 pence, rising on a straight-line basis to full vesting for EPS of 9.3 pence. Under the TSR element, 20% of shares vest for median TSR, rising on a straight-line basis to full vesting for upper quartile.

58 | Low & Bonar PLC Annual Report 2013
Directors’ Report on Remuneration(continued)
LTIP award granted in the yearOn 9 April 2013, an LTIP award was made to each of the Executive Directors at 125% of salary. The award was made on the following basis:
Type of AwardBasis of award
grantedShare price at date
of grantNumber of shares
awarded Face value of award
% of face value which vests at
threshold
S Good Nil-cost option 125% of salary £0.7425 575,993 £427,675 20%M Holt Nil-cost option 125% of salary £0.7425 437,710 £325,000 20%
Details of the performance conditions attaching to this award are provided as a footnote to table 2 on page 57.
Directors’ share optionsAs at 30 November 2013, Steve Good held 10,543 options under the SAYE Plan. As at 30 November 2013, Mike Holt held 36,039 options under the SAYE Plan. No options have been granted to any Director during the period 1 December 2013 to 4 February 2014.
The market price of a share at 30 November 2013 was 70p and the range during the year to 30 November 2013 was 52.75p to 80.00p.
Table 3 Directors’ interests in sharesThe interests of the Directors and their connected persons in the shares of the Company were:
Beneficially owned as at 30 November
2013Beneficially owned as at 1 December 2012
Target shareholding guideline level (%
salary)Outstanding LTIP
awards
Outstanding options (vested but
unexercised)Outstanding options
(unvested)
S Good 1,010,915 429,842 100% 1,900,424 – 10,543MC Flower 481,912 388,142 – – – –M Holt 366,535 65,000 100% 1,404,437 – 36,039SJ Hannam 348,232 348,232 – – – –J Sheldrick 76,993 70,000 – – – –T Schoolenberg 36,231 – – – – –FB Blaisse1 – 189,285 – – – –
1 Mr Blaisse ceased to be a director on 30 April 2013.
The Executive Directors are expected to retain 50% of the after-tax number of vested long-term incentive awards until they hold shares of a value equivalent to 100% of their salary (applicable to awards granted from 2011 onwards). As at 31 January 2014 (the latest practical date prior to the completion of this report), the value of the holdings of shares held by the Executive Directors were as follows:
Director Number of shares held Value of holding (£) % of salary
S Good 1,010,915 874,441 247.7%M Holt 366,535 317,053 118.1%
During the period 1 December 2013 to 4 February 2014, no changes in Directors’ interests have been notified to the Company.
No Director held any beneficial interest in or options over shares in or debentures of any other Group company at 30 November 2013 or at 4 February 2014, save as set out above.

Strategic Report Governance Financial Statements
59 Low & Bonar PLC Annual Report 2013 |
Unaudited InformationPerformance graphThe following graph illustrates the TSR performance of the Company compared to the FTSE Small Cap Total Return Index (the “Index”) over the past five years. The Index has been chosen as the appropriate benchmark for the Company. It is a recognised broad equity market index of which the Company has been a member throughout the period. The Index constituents are also used for the purposes of measuring the Company’s relative TSR performance which governs 50% of the vesting of each LTIP award. Performance, as required by legislation, is measured by TSR, being the increase in the share price over the period including the value of net dividends which are assumed to be reinvested in the Company’s shares on the ex-dividend date by the Company.
This graph shows the value, at 30 November 2013, of £100 invested in the Company’s Ordinary Shares on 30 November 2008 compared with the value of £100 invested in the FTSE Small Cap Total Return Index. The other points plotted are the values at intervening financial year-ends.
0
50
100
150
200
250
300
30-Nov-1330-Nov-1230-Nov-1130-Nov-1030-Nov-0930-Nov-08
FTSE Small Cap IndexLow & Bonar
Valu
e £
Total shareholders return – Source: Thomson Reuters
Remuneration of the Group Chief ExecutiveThe table below shows the total remuneration figure for the Group Chief Executive during each of the past five financial years. The total remuneration figure includes the annual bonus and LTIP awards which vested based on performance in those years. The annual bonus and LTIP percentages show the payout for each year as a percentage of the maximum.
20091 2010 2011 2012 2013
Total remuneration (£) 479,922 710,067 803,309 1,308,727 1,063,316Annual bonus (%) 0% 100% 81% 79.3% 0%LTIP vesting2 (%) 0% 0% 50%3 98.7%4 72%
1 In 2009, the Group had two Chief Executive Officers. Mr Paul Forman, until 3 September 2009, and Steve Good, from 3 September 2009. The total remuneration for 2009 represents those amounts paid to Mr Forman (£382,800) until 31 October 2009 (the date on which he ceased to be a director, some two months later than he ceased to be CEO) and those amounts paid to Mr Good (£97,122) from 3 September 2009 to the end of that year. No bonus was paid to Paul Forman following his resignation from the Board on 31 October 2009 or to Steve Good, who voluntarily waived his bonus entitlement for the year.
2 The LTIP awards are included in relation to any financial year on the same basis as those set out in table 2 on page 57. 3 Awards made to Paul Forman in 2009 lapsed when he left the Company in 2009 and are not reflected in this column. The stated figure relates only to awards held by Mr Steve Good
and relates to vesting in relation to the EPS performance condition relating to awards made in 2009. 4 Awards made to Paul Forman in 2009 lapsed when he left the Company in 2009 and are not reflected in this column. The stated figure relates only to awards held by Mr Steve Good
and relates to vesting in relation to the TSR performance condition relating to awards made in 2009 and the EPS performance condition relating to awards made in 2010.

60 | Low & Bonar PLC Annual Report 2013
Directors’ Report on Remuneration(continued)
Percentage change in remuneration levels The table below shows the movement in the salary, benefits and annual bonus for the Group Chief Executive between the current and previous financial year compared to that for the average UK employee. The Committee has chosen this comparator as it feels that it provides a more appropriate reflection of the earnings of the average worker than the movement in the Group’s total wage bill, which is distorted by movements in the number of employees and variations in wage practices in our overseas markets. For the benefits and bonus per employee, this is based on those employees eligible to participate in such schemes.
2012 2013 % change
Chief Executive (£)– salary 332,175 342,140 3.0%– benefits 19,649 19,735 0.4%– bonus 263,425 – -100%
Average per employee1 (£)– salary 51,970 53,601 3.1%– benefits 2,231 2,002 -10.3%– bonus 9,928 3,940 -60.3%
1 The Group operates from four locations in the UK: its head office and one facility for each of Yarns, Bonar and MTX. The average is a weighted-average across those four locations.
Relative importance of the spend on payThe table below shows the movement in spend on staff costs versus that in dividends.
2012 2013 % change
– Staff costs £74.6m £79.8m 7.0%– Dividends1 £7.0m £8.2m 17.1%
1 Dividends declared in respect of the year.
External DirectorshipsDuring the year under review the Executive Directors did not hold any external non-executive roles.
Statement of shareholder voting At last year’s AGM, the Directors’ Remuneration Report received the following votes from shareholders:
2013 AGM
– Votes cast in favour 239,656,305 98.42%– Votes cast against 3,851,954 1.58%
– Total votes cast 243,508,259 100%– Abstentions 47,451
During the year, the Remuneration Committee engaged with the Company’s major shareholders on the following issue:
– the adoption of the 2013 LTIP
All shareholders were broadly supportive of the Committee’s approach on this matter.
Steve HannamChairman, Remuneration Committee On behalf of the Board of Directors 4 February 2014

Strategic Report Governance Financial Statements
61 Low & Bonar PLC Annual Report 2013 |
Statement of Directors’ Responsibilities in respect of the Annual Report and the Financial Statements
The Directors are responsible for preparing the Annual Report and the group and parent company financial statements in accordance with applicable law and regulations.
Company law requires the Directors to prepare group and parent company financial statements for each financial year. Under that law they are required to prepare the group financial statements in accordance with IFRSs as adopted by the EU and applicable law and have elected to prepare the parent company financial statements on the same basis.
Under company law the Directors must not approve the financial statements unless they are satisfied that they give a true and fair view of the state of affairs of the group and parent company and of their profit or loss for that period. In preparing each of the group and parent company financial statements, the Directors are required to: • select suitable accounting policies and then apply them consistently; • make judgements and estimates that are reasonable and prudent; • state whether they have been prepared in accordance with IFRSs as adopted by the EU; and • prepare the financial statements on the going concern basis unless it is inappropriate to presume that the group and the parent company
will continue in business.
The Directors are responsible for keeping adequate accounting records that are sufficient to show and explain the parent company’s transactions and disclose with reasonable accuracy at any time the financial position of the parent company and enable them to ensure that its financial statements comply with the Companies Act 2006. They have general responsibility for taking such steps as are reasonably open to them to safeguard the assets of the group and to prevent and detect fraud and other irregularities.
Under applicable law and regulations, the directors are also responsible for preparing a Strategic Report, Directors’ Report, Directors’ Remuneration Report and Corporate Governance Statement that complies with that law and those regulations.
The Directors are responsible for the maintenance and integrity of the corporate and financial information included on the Company’s website. Legislation in the UK governing the preparation and dissemination of financial statements may differ from legislation in other jurisdictions.
Responsibility Statement of the Directors in respect of the Annual Financial ReportWe confirm that to the best of our knowledge:• the financial statements, prepared in accordance with IFRS, as adopted by the European Union, give a true and fair view of the assets,
liabilities, financial position and profit or loss of the Company and the undertakings included in the consolidation taken as a whole; and• the Strategic Report includes a fair review of the development and performance of the business and the position of the Company and
undertakings included in the consolidation taken as a whole, together with a description of the principal risks and uncertainties that they face.
Steve Good Mike Holt4 February 2014 4 February 2014

62 | Low & Bonar PLC Annual Report 2013
Independent Auditor’s Report to the Members of Low & Bonar PLC only
Opinions and conclusions arising from our audit1 Our opinion on the financial statements is
unmodified We have audited the financial statements of Low & Bonar PLC for the year ended 30 November 2013 set out on pages 64 to 105. In our opinion: • the financial statements give a true and fair view of the state of
the group’s and of the parent company’s affairs as at 30 November 2013 and of the group’s profit for the year then ended;
• the group financial statements have been properly prepared in accordance with International Financial Reporting Standards as adopted by the European Union (IFRSs as adopted by the EU);
• the parent company financial statements have been properly prepared in accordance with IFRSs as adopted by the EU and as applied in accordance with the provisions of the Companies Act 2006; and
• the financial statements have been prepared in accordance with the requirements of the Companies Act 2006 and, as regards the group financial statements, Article 4 of the IAS Regulation.
2 Our assessment of risks of material misstatementIn arriving at our audit opinion above on the financial statements the risks of material misstatement that had the greatest effect on our audit were as follows:
Impairment of goodwillRefer to page 42 (Audit Committee Report), page 76 (accounting policy) and pages 86 to 87 (financial disclosures).• The risk – The group has significant goodwill allocated to three of
the five groups of cash generating units (‘CGUs’). The risk is that for some or all of the groups of CGUs with significant goodwill allocated to them, the aggregated book value of the assets exceeds their recoverable amount (as defined in accounting standards), and therefore these assets are impaired and should be written down in value. The calculation of recoverable amount involves inherent uncertainty in the forecasting and discounting of future cash flows. The assumptions and estimates used in the forecasts and the calculation of a discount rate are therefore key judgmental areas that our audit is concentrated on.
• Our response – Our audit procedures included, among others, testing of the group’s budgeting process upon which the forecasts are based; we challenged the assumptions in the budget with reference to historical trends, externally published expected future growth rates in the markets and our own expectations based on our knowledge of the business. For each group of CGUs we compared the group’s assumptions to externally derived data for inputs such as projected economic growth and discount rates. We also applied sensitivities to these key inputs, focusing on the discount rate as we considered the calculation of recoverable amount to be most sensitive to this input. We calculated the discount rate at which the recoverable amount of assets equalled the net book value and considered this as part of our sensitivity analysis. We compared the sum of the discounted cash flows to the group’s market capitalisation to assess the reasonableness of the aggregate discounted cash flow. This was performed to establish that the market capitalisation of the group is comparable to the total discounted cash flows that are being used to assess impairment of the group’s assets. We utilised our own valuation specialist to provide an independent view of the applicable discount rates. We also assessed whether the group’s disclosures about the sensitivity of the outcome of the impairment assessment to changes in key assumptions reflected our own sensitivity analysis.
UK post-retirement benefits (net deficit of £3.8 million, being gross liabilities of £163.2 million and assets of £159.4 million)Refer to page 42 (Audit Committee Report), page 76 (accounting policy) and pages 80 to 83 (financial disclosures).• The risk - Significant estimates are made in valuing the defined
benefit obligations within the group’s post-retirement defined benefit schemes and small changes in assumptions and estimates used to value the group’s UK defined benefit obligation would have a significant effect on the results and financial position of the group.
• Our response - In this area our audit procedures included, among others, critically assessing the competency of the external actuary engaged by management used to advise management on the appropriateness of the key assumptions used to determine the UK pension deficit at 30 November 2013. We considered the key assumptions to be the discount rate, inflation rate and mortality/life expectancy. We used our own actuarial specialists to critically assess and benchmark these key assumptions against externally derived data. We also considered the adequacy of the group’s disclosures in respect of the sensitivity of the deficit to these assumptions.
3 Our application of materiality and an overview of the scope of our audit
The materiality for the group financial statements as a whole was set at £2.5 million. This has been determined with reference to a benchmark of group turnover (of which it represents 0.6%) which we consider to be one of the principal considerations for members of the company in assessing the financial performance of the group.
We agreed with the audit committee to report to it all corrected and uncorrected misstatements we identified through our audit with a value in excess of £50,000, in addition to other audit misstatements below that threshold that we believe warranted reporting on qualitative grounds.
Audits for group reporting purposes were performed by component auditors at the key reporting components in the following countries: The Netherlands, Germany, Belgium, USA, UK, Czech Republic and by the group audit team in the UK. In addition, specified procedures work was performed on components in Italy and Slovakia. Group reporting procedures covered 77% of total group revenue, 76% of underlying group profit before taxation and 79% of total group assets.
The audits undertaken for group reporting purposes at the key reporting components of the company were all performed to component materiality levels set by the group audit team. The component materiality applied was £1,875,000.
Detailed instructions were sent to all the auditors in these locations. These instructions covered the significant areas that should be covered by these audits (which included the relevant risks of material misstatement detailed above) and set out the information required to be reported back to the group audit team. The group audit team visited the component auditors of the following locations: The Netherlands, Germany and Belgium. Telephone meetings were also held with the auditors at these locations. In addition we held telephone meetings with the US component audit team in advance of, and following completion of, the audit. We also held telephone meetings with other component auditors as necessary throughout the financial year.

Strategic Report Governance Financial Statements
63 Low & Bonar PLC Annual Report 2013 |
4 Our opinion on other matters prescribed by the Companies Act 2006 is unmodified
In our opinion: • the part of the Directors’ Remuneration Report to be audited
has been properly prepared in accordance with the Companies Act 2006;
• the information given in the Strategic Report and Directors’ Report for the financial year for which the financial statements are prepared is consistent with the financial statements; and
• information given in the Corporate Governance Statement set out on page 39 to 40 with respect to internal control and risk management systems in relation to financial reporting processes and about share capital structures is consistent with the financial statements.
5 We have nothing to report in respect of the matters on which we are required to report by exception
Under ISAs (UK and Ireland) we are required to report to you if, based on the knowledge we acquired during our audit, we have identified other information in the annual report that contains a material inconsistency with either that knowledge or the financial statements, a material misstatement of fact, or that is otherwise misleading.
In particular, we are required to report to you if: • we have identified material inconsistencies between the
knowledge we acquired during our audit and the directors’ statement that they consider that the annual report and financial statements taken as a whole is fair, balanced and understandable and provides the information necessary for shareholders to assess the group’s performance, business model and strategy; or
• the section of the annual report describing the work of the Audit Committee does not appropriately address matters communicated by us to the Audit Committee.
Under the Companies Act 2006 we are required to report to you if, in our opinion: • adequate accounting records have not been kept by the parent
company, or returns adequate for our audit have not been received from branches not visited by us; or
• the parent company financial statements and the part of the Directors’ Remuneration Report to be audited are not in agreement with the accounting records and returns; or
• certain disclosures of directors’ remuneration specified by law are not made; or
• we have not received all the information and explanations we require for our audit.
Under the Listing Rules we are required to review: • the directors’ statement, set out on page 34 in relation to going
concern; and• the part of the Corporate Governance Statement on pages 35 to
40 relating to the company’s compliance with the nine provisions of the 2010 UK Corporate Governance Code specified for our review.
We have nothing to report in respect of the above responsibilities.
Scope of report and responsibilitiesAs explained more fully in the Directors’ Responsibilities Statement set out on page 61, the directors are responsible for the preparation of the financial statements and for being satisfied that they give a true and fair view. A description of the scope of an audit of financial statements is provided on the Financial Reporting Council’s website at www.frc.org.uk/auditscopeukprivate. This report is made solely to the company’s members as a body and is subject to important explanations and disclaimers regarding our responsibilities, published on our website at www.kpmg.com/uk/auditscopeukco2013a, which are incorporated into this report as if set out in full and should be read to provide an understanding of the purpose of this report, the work we have undertaken and the basis of our opinions.
Wayne Cox (Senior Statutory Auditor)for and on behalf of KPMG Audit Plc, Statutory Auditor Chartered Accountants St Nicholas HousePark Row NottinghamNG1 6FQ4 February 2014

64 | Low & Bonar PLC Annual Report 2013
Consolidated Income Statement for the year ended 30 November
2013 2012
Continuing operations Note
Beforeamortisation
andnon-recurring
items£m
Amortisationand
non-recurringitems
(Note 5)£m
Total£m
Beforeamortisation
andnon-recurring
items£m
Amortisationand
non-recurringitems
(Note 5)£m
Total£m
Revenue 1 403.1 – 403.1 380.5 – 380.5
Operating profit/(loss) 1 32.2 (7.7) 24.5 30.5 (18.4) 12.1
Financial income 6 6.7 – 6.7 7.0 – 7.0Financial expense 6 (12.8) – (12.8) (13.0) – (13.0)
Net financing costs (6.1) – (6.1) (6.0) – (6.0)
Share of results of joint venture 15 – (0.6) (0.6) – – –
Profit/(loss) before taxation 2 26.1 (8.3) 17.8 24.5 (18.4) 6.1Taxation 7 (6.8) 1.8 (5.0) (6.4) 1.7 (4.7)
Profit/(loss) after taxation 19.3 (6.5) 12.8 18.1 (16.7) 1.4
Profit/(loss) for the year 19.3 (6.5) 12.8 18.1 (16.7) 1.4
Attributable to
Equity holders of the Company 18.8 (6.5) 12.3 18.1 (16.7) 1.4Non-controlling interest 28 0.5 – 0.5 – – –
19.3 (6.5) 12.8 18.1 (16.7) 1.4
Earnings per share 10Continuing operations and Total: Basic 6.23p 4.08p 6.28p 0.47p Diluted 6.09p 3.98p 6.08p 0.46p

Strategic Report Governance Financial Statements
65 Low & Bonar PLC Annual Report 2013 |
Consolidated Statement of Comprehensive Incomefor the year ended 30 November
Note2013
£m2012
£m
Profit for the year 12.8 1.4
Other comprehensive incomeItems that will not be reclassified subsequently to profit or loss:Actuarial gain/(loss) on defined benefit pension schemes 4 9.3 (13.9)Deferred tax on defined benefit pension schemes 4 (0.3) 0.7Items that may be reclassified subsequently to profit or loss:Exchange differences on translation of foreign operations, net of hedging 0.1 (8.3)
Total other comprehensive income for the year, net of tax 9.1 (21.5)
Total comprehensive income for the year 21.9 (20.1)
Attributable to
Equity holders of the parent 21.5 (20.2)Non-controlling interest 28 0.4 0.1
21.9 (20.1)

66 | Low & Bonar PLC Annual Report 2013
Balance Sheetsas at 30 November
Group Company
Note2013
£m2012
£m2013
£m2012
£m
Non-current assetsGoodwill 11 81.2 74.2 – –Intangible assets 12 34.0 36.7 – –Property, plant and equipment 13 114.2 108.8 0.3 0.2Investment in subsidiaries 14 – – 93.6 93.6Investment in joint venture 15 4.7 5.3 – –Investment in associate 16 0.4 0.4 – –Deferred tax assets 21 3.1 3.3 – –Other receivables 18 – – 23.9 76.8
237.6 228.7 117.8 170.6
Current assetsInventories 17 86.8 75.1 – –Trade and other receivables 18 81.7 69.3 138.6 85.4Cash and cash equivalents 20 17.9 26.9 – 3.8
186.4 171.3 138.6 89.2
Current liabilitiesInterest-bearing loans and borrowings 20 – – 4.6 0.8Current tax liabilities 19 5.4 6.2 1.7 1.7Trade and other payables 19 82.9 76.2 15.9 15.8Provisions 22 – 0.1 – –Derivative liabilities 20 0.1 – – –
88.4 82.5 22.2 18.3
Net current assets 98.0 88.8 116.4 70.9
Total assets less current liabilities 335.6 317.5 234.2 241.5
Non-current liabilitiesInterest-bearing loans and borrowings 20 104.7 109.5 88.5 109.5Deferred tax liabilities 21 23.2 23.5 – –Post employment benefits 4 12.7 24.8 3.8 15.1Other payables 23 1.9 1.8 – –
142.5 159.6 92.3 124.6
Net assets 193.1 157.9 141.9 116.9
Equity attributable to equity holders of the parentShare capital 25 47.2 45.5 47.2 45.5Share premium account 26 73.9 55.5 73.9 55.5Translation reserve 27 (36.9) (37.0) – –Retained earnings 102.5 87.9 20.8 15.9
Total equity attributable toEquity holders of the parent 186.7 151.9 141.9 116.9Non-controlling interest 28 6.4 6.0 – –
Total equity 193.1 157.9 141.9 116.9
The consolidated financial statements on pages 64 to 105 were approved by the Board on 4 February 2014 and signed on its behalf by:
Steve Good Mike Holt4 February 2014 4 February 2014
Registered number: SC008349

Strategic Report Governance Financial Statements
67 Low & Bonar PLC Annual Report 2013 |
Consolidated Cash Flow Statementfor the year ended 30 November
Note2013
£m2012
£m
Profit for the year and from continuing operations 12.8 1.4
Adjustments for:Depreciation 12.8 12.1Impairment of non-current assets – 11.2Amortisation 6.3 6.4Income tax expense 5.0 4.7Net financing costs 6.1 6.0Share of results of joint venture 0.6 –Partial EU fine refund – 2.2Increase in inventories (7.3) (2.8)Decrease/(Increase) in trade and other receivables 0.5 (1.6)Short-term loan to joint venture (9.1) –Increase in trade and other payables 2.0 0.1Decrease in provisions (0.1) (0.4)Loss/(gain) on disposal of non-current assets 0.3 (0.2)Equity-settled share-based payment 0.6 1.2
Cash inflow from operations 30.5 40.3Interest received – 0.1Interest paid (4.8) (4.9)Tax paid (6.8) (3.9)Pension cash contributions in excess of operating charge (3.7) (3.9)
Net cash inflow from operating activities 15.2 27.7
Acquisition of subsidiaries (15.9) (5.0)Equity investment in joint ventures – (5.3)Prepaid participation in joint ventures – 1.7Acquisition of property, plant and equipment (11.3) (13.2)Intangible assets purchased (2.1) (1.0)Proceeds from disposal of non-current assets – 0.4
Net cash outflow from investing activities (29.3) (22.4)
Drawdown of borrowings – 9.1Repayment of borrowings (8.5) (1.7)Proceeds of share issues from the share placing 19.8 –Proceeds of other share issues to employees 0.1 0.2Equity dividends paid (7.2) (6.3)
Net cash inflow from financing activities 4.2 1.3
Net cash (outflow)/inflow 29 (9.9) 6.6Cash and cash equivalents at start of year 26.9 20.9Foreign exchange differences 0.9 (0.6)
Cash and cash equivalents at end of year 17.9 26.9

68 | Low & Bonar PLC Annual Report 2013
Company Cash Flow Statement for the year ended 30 November
Note2013
£m2012
£m
Profit for the year 3.1 3.2Adjustments for:Depreciation 0.1 0.1Income tax credit – (0.2)Net financing income (0.6) (0.7)Increase in receivables (0.4) (7.4)Decrease in payables (0.2) (5.7)Partial EU fine refund – 1.0Increase in provision against investment in subsidiary – 1.1Equity-settled share-based payment 0.6 1.2
Cash inflow/(outflow) from operations 2.6 (7.4)Interest received 6.4 6.4Interest paid (4.6) (4.7)Pension cash contributions in excess of operating charge (3.3) (3.3)
Net cash inflow/(outflow) from operating activities 1.1 (9.0)
Net cash (outflow)/inflow from investing activities (0.1) –
Proceeds of share issues from the share placing 19.8 –Proceeds of other share issues to employees 0.1 0.2(Repayment)/drawdown of borrowings (17.5) 9.1Equity dividends paid (7.2) (6.3)
Net cash (outflow)/inflow from financing activities (4.8) 3.0
Net cash outflow 29 (3.8) (6.0)Cash and cash equivalents at start of year 3.8 9.8Foreign exchange differences – –
Cash and cash equivalents at end of year – 3.8

Strategic Report Governance Financial Statements
69 Low & Bonar PLC Annual Report 2013 |
Consolidated Statement of Changes in Equityfor the year ended 30 November
Sharecapital
£m
Sharepremium
£m
Translationreserve
£m
Retainedearnings
£m
Equityattributable
to equityholders ofthe parent
£m
Non-controlling
interest£m
Totalequity
£m
At 1 December 2011 45.3 54.1 (28.6) 106.1 176.9 5.9 182.8Total comprehensive income for the year – – (8.4) (11.8) (20.2) 0.1 (20.1)Dividends paid to Ordinary Shareholders – – – (6.3) (6.3) – (6.3)Shares issued 0.2 1.4 – (1.3) 0.3 – 0.3Share-based payment – – – 1.2 1.2 – 1.2
Net increase / (decrease) for the year 0.2 1.4 (8.4) (18.2) (25.0) 0.1 (24.9)
At 30 November 2012 45.5 55.5 (37.0) 87.9 151.9 6.0 157.9
Total comprehensive income for the year – – 0.1 21.4 21.5 0.4 21.9Dividends paid to Ordinary Shareholders – – – (7.2) (7.2) – (7.2)Shares issued 1.7 18.4 – (0.2) 19.9 – 19.9Share-based payment – – – 0.6 0.6 – 0.6
Net increase for the year 1.7 18.4 0.1 14.6 34.8 0.4 35.2
At 30 November 2013 47.2 73.9 (36.9) 102.5 186.7 6.4 193.1

70 | Low & Bonar PLC Annual Report 2013
Company Statement of Changes in Equityfor the year ended 30 November
Sharecapital
£m
Sharepremium
£m
Retainedearnings
£m
Total equity
£m
At 1 December 2011 45.3 54.1 30.7 130.1Profit for the year – – 3.2 3.2Actuarial loss on defined benefit pension scheme – – (11.6) (11.6)Dividends paid to Ordinary Shareholders – – (6.3) (6.3)Shares issued 0.2 1.4 (1.3) 0.3Share-based payment – – 1.2 1.2
Net increase / (decrease) for the year 0.2 1.4 (14.8) (13.2)
At 30 November 2012 45.5 55.5 15.9 116.9
Profit for the year – – 3.1 3.1Actuarial gain on defined benefit pension scheme – – 8.6 8.6Dividends paid to Ordinary Shareholders – – (7.2) (7.2)Shares issued 1.7 18.4 (0.2) 19.9Share-based payment – – 0.6 0.6
Net increase for the year 1.7 18.4 4.9 25.0
At 30 November 2013 47.2 73.9 20.8 141.9
Strategic Report Governance Financial Statements
71 Low & Bonar PLC Annual Report 2013 |
General informationLow & Bonar PLC (the “Company”) is a company domiciled in Scotland and incorporated in Scotland under the Companies (Consolidation) Act 1908. The address of the registered office is Whitehall House, 33 Yeaman Shore, Dundee, DD1 4BJ. The management head office is 10th Floor, 1 Eversholt Street. London, NW1 2DN.
The consolidated financial statements of the Company for the year ended 30 November 2013 comprise the Company and its subsidiaries (together referred to as the “Group”).
(A) Basis of preparationThe financial statements are presented in Pounds Sterling, rounded to the nearest hundred thousand Pounds. They are prepared on the historical cost basis except for the revaluation to fair value of certain financial instruments. UK company law requires directors to consider whether it is appropriate to prepare the financial statements on the basis that the Company and the Group are a going concern.
The Group’s business activities, together with the factors likely to affect its future development, performance and position, together with details of cash flows and borrowing requirements, are set out in the Strategic Report on pages 1 to 29. The further information contained in the Strategic Report and Note 20 to the financial statements includes the Group’s objectives, policies and processes for managing its capital, financial risks and hedging activities together with its exposure to credit and liquidity risks. The principal risks and uncertainties section on pages 22 and 23 provides further details of the principal risks affecting the Group and Company.
The current global economic conditions create uncertainty, particularly over the level of demand for the Group’s products and the price of its raw materials.
The Group funds its day-to-day working capital requirements by using the facilities available to it (see Note 20). The Directors have reviewed the Group’s medium-term forecasts to determine whether the committed banking facilities are sufficient to support the Group’s projected liquidity requirements, taking into account the planned refinancing of the Group’s revolving credit facility, which is discussed further in Note 20, ahead of its expiry in February 2015. The Directors have also considered whether the Group’s forecast earnings are sufficient to meet the covenants associated with its committed facilities.
After making enquiries, including assessing the likelihood of a successful refinancing of the Group’s revolving credit facility, the Directors have a reasonable expectation that the Company and the Group have adequate resources to continue in operational existence for the foreseeable future, and are not aware of any material uncertainties related to events or conditions that may cast significant doubt on the ability of the Company and the Group to continue as a going concern. Accordingly, they have continued to adopt the going concern basis in preparing the financial statements.
Both the parent Company financial statements and the Group financial statements have been prepared in accordance with IFRS as adopted by the EU (“adopted IFRS”). At the date of authorisation of these financial statements, there are a number of Standards, Interpretations and Amendments in issue but not yet effective and which have therefore not yet been applied in these financial statements (accounting policy X).
Significant Accounting Policies
On publishing the parent Company financial statements here together with the Group financial statements, the Company has taken advantage of the exemption in section 408 of the Companies Act 2006 not to present its individual income statement and related Notes which form a part of these approved financial statements.
The adopted IFRS applied by the Group in the preparation of these financial statements are those that were effective at 30 November 2013. The Group has adopted the following new Standards, Interpretations and Amendments which became effective during the year with no significant impact on the Group’s consolidated financial results or position:
• Amendments to IAS 1 (June 2011) (Presentation of Items of Other Comprehensive Income)
(B) Basis of consolidation(i) SubsidiariesSubsidiaries are those entities controlled by the Group. The financial statements of subsidiaries are included in the consolidated financial statements from the date that control commences until the date that control ceases. In the parent Company financial statements, investments in subsidiaries are carried at cost less impairment.
The interest of non-controlling interests is initially stated at the non-controlling interest’s share of the fair values of the identifiable assets and liabilities recognised on the date of acquisition.
(ii) AssociatesAssociates are those entities in which the Group has significant influence, but not control, over the financial and operating policies. The consolidated financial statements include the Group’s share of the total recognised gains and losses of associates on an equity-accounted basis, from the date that significant influence commences until the date that significant influence ceases. When the Group’s share of losses exceeds its interest in an associate, the Group’s carrying amount is reduced to nil and recognition of further losses is discontinued except to the extent that the Group has incurred legal or constructive obligations or made payments on behalf of an associate.
(iii) Joint venturesJoint ventures are those entities over whose activities the Group has joint control, established by contractual agreement.
The Group accounts for its joint ventures using the equity method. The investment in the joint venture is recognised initially at cost and is adjusted thereafter for the post-acquisition change in the Group’s share of net assets of the joint venture.
(iv) Transactions eliminated on consolidationIntra-Group balances and transactions and any unrealised gains arising from intra-Group transactions are eliminated in preparing the consolidated financial statements.
(v) Discontinued operationsA discontinued operation is a component of the Group’s businesses that represents a separate major line of business or geographical area of operations that has been disposed of or is held for sale, or is a subsidiary acquired exclusively with a view to resale. Classification as a discontinued operation occurs upon disposal or when the operation meets the criteria to be classified as held for sale, if earlier. When an operation is classified as a discontinued operation, the comparative income statement is re-presented as if the operation had been discontinued from the start of the comparative period.
72 | Low & Bonar PLC Annual Report 2013
Significant Accounting Policies(continued)
(C) Foreign currency(i) Foreign currency transactionsTransactions in foreign currencies are translated at the foreign exchange rate ruling at the date of the transaction. Monetary assets and liabilities denominated in foreign currencies at the balance sheet date are translated into Pounds Sterling at the foreign exchange rate ruling at that date. Foreign exchange differences arising on translation are recognised in the income statement. Non-monetary assets and liabilities denominated in foreign currencies that are stated at fair value are translated into Pounds Sterling at exchange rates ruling at the date the fair values were determined. Non-monetary assets and liabilities that are measured in terms of historical cost in a foreign currency are translated using the exchange rate at the date of the transaction.
(ii) Translation of foreign operationsThe assets and liabilities of foreign operations, including goodwill and fair value adjustments arising on consolidation, are translated at foreign exchange rates ruling at the balance sheet date. The income statements of foreign operations are translated at an average rate for the period where this rate approximates to the foreign exchange rates ruling at the date of the transactions. Exchange differences arising from the translation of foreign operations, and of related qualifying hedges, are taken to Other Comprehensive Income. They are released to the income statement upon disposal. Monetary items receivable from or payable to a foreign operation for which settlement is neither planned nor likely to occur in the foreseeable future are treated as part of the net investment in the foreign operation.
(iii) Hedging of risksIn order to hedge its exposure to certain foreign exchange risks, the Group enters into forward exchange contracts (see accounting policies D and E).
(D) Derivative financial instrumentsThe Group uses derivative financial instruments to hedge its exposure to foreign exchange risks arising from operational and investment activities. The Group does not hold or issue derivative financial instruments for trading purposes.
Derivative financial instruments are recognised initially at fair value. Derivative financial instruments are subsequently remeasured to their fair value with the resulting gain or loss being recognised in profit or loss. However, where derivatives qualify for hedge accounting, recognition of any resulting gain or loss depends on the nature of the item being hedged (see accounting policy E).
Financial instruments carried at fair value are required to be measured by reference to the following levels:
Level 1: quoted prices in active markets for identical instruments;
Level 2: inputs other than quoted prices included within Level 1 that are observable for the instrument, either directly (i.e. as prices) or indirectly (i.e. derived from prices); or
Level 3: inputs for the instrument that are not based on observable market data (unobservable inputs).
All financial instruments have been measured using a Level 2 valuation method.
(E) Hedging(i) Cash flow hedgesWhere a derivative financial instrument is designated as a hedge of the variability in cash flows of a recognised asset or liability, a firm commitment or a highly probable forecast transaction, the effective part of any gain or loss on the derivative financial instrument is recognised in Other Comprehensive Income. When the firm commitment or forecast transaction results in the recognition of a non-financial asset or liability, the cumulative gain or loss is removed from equity and included in the initial measurement of the asset or liability. Otherwise, the cumulative gain or loss is removed from equity and recognised in the income statement at the same time as the hedged transaction. The ineffective part of any gain or loss is recognised in the income statement immediately.
When a hedging instrument or hedge relationship is terminated but the hedged transaction is still expected to occur, the cumulative gain or loss at that point remains in equity and is recognised in accordance with the above policy when the transaction occurs. If the hedged transaction is no longer expected to take place, the cumulative unrealised gain or loss recognised in equity is recognised in the income statement immediately.
(ii) Hedge of net investment in foreign operationsExchange differences arising from the translation of the net investment in foreign operations, and of related hedges, are taken to the translation reserve. They are released to the income statement upon disposal of the foreign operation.
In respect of all foreign operations, any differences that have arisen since 1 December 2004, the date of transition to IFRS, are presented as a separate component of equity in the Group financial statements. When foreign operations have been disposed of, any cumulative differences are recycled to retained earnings.
The Group tests effectiveness on a prospective and retrospective basis to ensure compliance with IAS 39.
(F) Property, plant and equipment(i) Owned assetsItems of property, plant and equipment are stated at cost less accumulated depreciation (see below) and impairment losses (see accounting policy K). The cost of self-constructed assets includes the cost of materials, direct labour and an appropriate proportion of production overheads. Borrowing costs related to the acquisition or construction of qualifying assets are capitalised.
Where an item of property, plant and equipment comprises major components with different useful lives, the components are accounted for as separate items of plant, property and equipment.
(ii) Leased assetsLeases whereby the Company or the Group assumes substantially all the risks and rewards of ownership are classified as finance leases. Plant and equipment acquired by way of finance lease is stated at an amount equal to the lower of its fair value and the present value of the minimum lease payments at inception of the lease, less accumulated depreciation (see below) and impairment losses (see accounting policy K). Lease payments are accounted for as described in accounting policy R. Where land and buildings are held under lease the accounting treatment of the land is considered separately from that of buildings.

Strategic Report Governance Financial Statements
73 Low & Bonar PLC Annual Report 2013 |
(iii) Subsequent expenditureThe Company and the Group recognise in the carrying amount of an item of property, plant and equipment the cost of replacing part of such an item when that cost is incurred, if it is probable that the future economic benefits associated with the item will flow to the Company or the Group and the cost of the item can be measured reliably. Subsequent costs are capitalised if it is probable that the future economic benefits will flow to the entity, and the costs can be reliably measured.
(iv) DepreciationDepreciation is charged to the income statement on a straight-line basis over the estimated useful lives of items of property, plant and equipment and major components that are accounted for separately. Land is not depreciated.
The estimated useful lives for significant classes of assets are as follows:
– property 10–50 years– plant and equipment 3–15 years
For other assets, the useful economic lives are:
– fixtures and fittings 3–7 years– computer hardware 2–5 years– tooling 1–5 years– motor vehicles 3–5 years
(G) Intangible assets(i) GoodwillGoodwill is recognised only in a business combination and is measured as a residual. Goodwill represents the excess of the fair value of the consideration paid over the share of the identifiable assets acquired and liabilities assumed.
Goodwill is stated at deemed cost less any accumulated impairment losses (see accounting policy K).
(ii) Research and developmentExpenditure on research activities, undertaken with the prospect of gaining new scientific or technical knowledge and understanding, is recognised in the income statement when it is incurred.
Expenditure on development activities, where research findings are applied to a plan or design for the production of new or substantially improved products and processes, is capitalised if the product or process is technically and commercially feasible and the Group has sufficient resources to complete development, future economic benefits are probable and if the Group can measure reliably the expenditure attributable to the intangible asset during its development. The expenditure capitalised includes the cost of materials, direct labour and an appropriate proportion of overheads. Other development expenditure is recognised in the income statement as an expense is incurred. Capitalised development expenditure is stated at cost less accumulated amortisation and impairment losses (see accounting policy K).
(iii) Other intangible assetsOther intangible assets that are acquired by the Group are stated at cost less accumulated amortisation and impairment losses (see accounting policy K). Expenditure on internally generated goodwill and brands is recognised in the income statement when it is incurred.
(iv) AmortisationAmortisation is charged to the income statement on a straight-line basis over the estimated useful lives of intangible assets unless such lives are indefinite. Goodwill and intangible assets with an indefinite life are not amortised but are systematically tested for impairment annually and further tested at each balance sheet date if there is any evidence of potential impairment. Other intangible assets are amortised from the date that they are available for use.
The estimated useful lives of the identified intangible assets are as follows:
– technology based 5–10 years– customer relationships 4–11 years– marketing related 10 years– order backlog 3 months– non-compete agreements 4–5 years– software 3–5 years
(H) Trade and other receivablesTrade and other receivables are initially recognised at fair value and thereafter stated at their amortised cost less impairment losses (see accounting policy K).
(I) InventoriesInventories are stated at the lower of cost and net realisable value. Net realisable value is the estimated selling price in the ordinary course of business, less the estimated costs of completion and selling expenses.
The cost of inventories is based on the first-in first-out principle and includes expenditure incurred in acquiring the inventories and bringing them to their existing location and condition. In the case of manufactured inventories and work in progress, cost includes an appropriate share of overheads based on normal operating capacity.
(J) Cash and cash equivalentsCash and cash equivalents comprise cash balances and call deposits. Bank overdrafts that are repayable on demand and form an integral part of the Company’s or the Group’s cash management are included as a component of cash and cash equivalents for the purpose of the Statement of Cash Flows.
(K) ImpairmentThe carrying amounts of the Company’s and the Group’s assets, other than inventories (accounting policy I), and deferred tax assets (accounting policy T) are reviewed at each balance sheet date to determine whether there is any indication of impairment. If any such indication exists, the asset’s recoverable amount is estimated. For goodwill, assets that have an indefinite useful life and intangible assets that are not yet available for use, the recoverable amount is estimated at each balance sheet date. An impairment loss is recognised whenever the carrying amount of an asset or its cash generating unit exceeds its recoverable amount. Impairment losses recognised in respect of cash generating units are allocated first to reduce the carrying amount of any goodwill allocated to cash generating units (group of units) and then to reduce the carrying amount of other assets in the unit (group of units) on a pro rata basis. Impairment losses are recognised in the income statement.

74 | Low & Bonar PLC Annual Report 2013
Significant Accounting Policies(continued)
An impairment loss in respect of goodwill is not reversible. Other impairment losses are reversed only to the extent that the asset’s carrying amount does not exceed the carrying amount that would have been determined, net of depreciation or amortisation, if no impairment loss had been recognised.
(i) Calculation of recoverable amountReceivables with a short duration are not discounted.
The recoverable amount of other assets is the greater of their fair value less costs to sell and value in use. In assessing value in use, the estimated future cash flows are discounted to their present value using a pre-tax discount rate that reflects current market assumptions of the time value of money and the risks specific to the asset. For an asset that does not generate largely independent cash inflows, the recoverable amount is determined for the cash generating unit to which the asset belongs.
(L) Share capital(i) Preference share capitalFinancial instruments issued by the Company are treated as equity only to the extent that they meet the following two conditions:
(a) they include no contractual obligations upon the Company to deliver cash or other financial assets or to exchange financial assets or financial liabilities with another party under conditions that are potentially unfavourable to the Company; and
(b) where the instrument will or may be settled in the Company’s own equity instruments, it is either a non-derivative that includes no obligation to deliver a variable number of the Company’s own equity instruments or is a derivative that will be settled by the Company exchanging a fixed amount of cash or other financial assets for a fixed number of its own equity instruments.
To the extent that this definition is not met, the proceeds of issue are classified as a financial liability. Where the instrument so classified takes the legal form of the Company’s own shares, the amounts presented in these financial statements for called up share capital and share premium account exclude amounts in relation to those shares.
Finance payments associated with financial liabilities are dealt with as part of financial expenses. Finance payments associated with financial instruments that are classified in equity are dividends, and are recorded directly in equity.
(ii) DividendsDividends on redeemable Preference Shares are recognised as a liability on an accruals basis. Dividends on Ordinary Shares are recognised as a liability in the period in which they are declared. Dividend income is recognised in the income statement on the date that the dividend is declared.
(iii) Equity transaction costsDirectly attributable and incremental transaction costs of an equity transaction are accounted for as a deduction from equity, net of any related income tax benefit.
(M) Interest-bearing borrowingsInterest-bearing borrowings are recognised initially at fair value, less attributable transaction costs. Subsequent to initial recognition, interest-bearing borrowings are stated at amortised cost with any difference between cost and redemption value being recognised in the income statement over the period of the borrowings on an effective-interest basis.
(N) Employee benefitsThe Company and the Group operate defined benefit pension plans and defined contribution pension plans. The Company also offers share-based compensation benefits to certain employees of the Group.
(i) Defined contribution plansA defined contribution pension plan is one under which fixed contributions are paid to a third party. The Company and the Group have no further payment obligations once these contributions have been paid. Obligations for contributions to defined contribution pension plans are recognised as an expense in the income statement as incurred.
(ii) Defined benefit plansA defined benefit pension plan is one that specifies the amount of pension benefit that an employee will receive on retirement. The Company’s and the Group’s net obligation in respect of defined benefit pension plans is calculated separately for each plan by estimating the amount of future benefits that employees have earned in return for their service in the current and prior periods; that benefit is discounted to determine the present value, and the fair value of any plan assets is deducted. The discount rate is the yield at the balance sheet date on AA credit-rated bonds that have maturity dates approximating to the terms of the Company’s or the Group’s obligations. The calculation is performed by a qualified actuary using the projected unit credit method.
Where the calculation results in a benefit to the Company or the Group, the recognised asset is limited to the net total of any unrecognised actuarial losses and past service costs and the present value of any future refunds from the plan or reductions in future contributions to the plan.
The Group determines the extent to which payments made which fulfil obligations to make future contributions to cover an existing shortfall will be available as a refund or reduction in future contributions after they are paid in to the plan. To the extent that the contributions payable will not be available after they are paid in to the plan, the Group recognises a liability when the obligation arises.
Actuarial gains and losses are recognised immediately in Other Comprehensive Income.
(iii) Equity and equity-related compensation benefitsThe Company and Group have applied the requirements of IFRS 2. In accordance with the exemption available within the transitional provisions of IFRS 1, IFRS 2 has been applied to all grants of equity instruments after 7 November 2002 that were unvested as of 1 January 2005.
The Company operates various equity-settled and cash-settled share option schemes. Equity-settled share-based payments are measured at fair value at the date of the grant, and the fair value determined at the grant date of these payments is expensed on a straight-line basis over the vesting period, based on the Group’s estimate of shares that will eventually vest. Fair value is measured taking into account market conditions and by use of the Black-Scholes model or a Stochastic model, as appropriate. Measurement inputs include share price at the measurement date, exercise price of the instrument, expected

Strategic Report Governance Financial Statements
75 Low & Bonar PLC Annual Report 2013 |
volatility (based on historic volatility patterns), the expected dividend yield and the risk-free interest rate (calculated based on UK Gilts with a term commensurate with the expected term remaining of the performance period at grant). The fair values of cash-settled payments are re-measured at each balance sheet date and the cost of these payments is recognised over the vesting period, taking into account the re-measurement of fair value at each balance sheet date.
The Low & Bonar 1995 Employees’ Share Ownership Plan Trust (the “ESOP”) purchases shares in the Company in order to satisfy awards made under the Company’s Long-term Incentive Plan. Shares held by the ESOP are treated as treasury shares and a deduction is computed in the Company’s issued share capital for the purposes of calculating EPS.
(O) ProvisionsA provision is recognised in the balance sheet when the Company or the Group has a present legal or constructive obligation as a result of a past event, it is probable that an outflow of economic benefits will be required to settle the obligation and a reliable estimate can be made of the obligation. Provisions for restructuring costs are recognised when the Group has a detailed formal plan for the restructuring that has been communicated to the affected parties.
(P) Trade and other payablesTrade and other payables are initially recognised at fair value and thereafter stated at their amortised cost. They are not interest-bearing.
(Q) RevenueRevenue is measured at the fair value of the consideration received or receivable and represents amounts receivable for goods provided in the normal course of business, net of discounts, VAT and other sales related taxes. Sales of goods are recognised when the Group has transferred the significant risks and rewards of ownership of the goods to the buyer (which is predominantly on despatch as most items are sold on a CIF basis), the amount of revenue can be measured reliably and it is probable that the economic benefits of the transaction will flow to the Group.
(R) Expenses(i) Operating lease paymentsPayments made under operating leases are recognised in the income statement on a straight-line basis over the term of the lease. Lease incentives are recognised in the income statement as an integral part of the total lease expense.
(ii) Finance lease paymentsPayments made under finance leases are apportioned between the finance charges and reduction of the lease liability so as to achieve a constant rate of interest on the remaining balance of the liability.
(iii) Net financing costsNet financing costs comprise interest payable on borrowings calculated using the effective interest rate method, dividends on redeemable preference shares, return on scheme assets and interest costs on scheme liabilities in respect of defined benefit pension schemes, interest receivable on funds invested, dividend income, foreign exchange gains and losses, and gains and losses on hedging instruments that are recognised in the income statement (see accounting policy E). Interest income is recognised in the income statement as it accrues, using the effective interest rate.
(S) Non-recurring itemsItems which are both material and non-recurring are presented within their relevant consolidated income statement category and are described in more detail in Note 5. The separate reporting of non-recurring items helps to provide a better indication of the Group’s underlying business performance.
(T) TaxationIncome tax on the profit or loss for the year comprises current and deferred tax. Income tax is recognised in the income statement except to the extent that it relates to items recognised in Other Comprehensive Income or directly in equity.
Current tax is the expected tax payable on the taxable income for the year, using tax rates enacted or substantively enacted at the balance sheet date, and any adjustment to tax payable in respect of previous years.
Deferred tax is provided using the balance sheet liability method, providing for timing differences between the carrying amounts of assets and liabilities for financial reporting purposes and the amounts used for taxation purposes. The following timing differences are not provided for: the initial recognition of assets or liabilities that affect neither accounting nor taxable profit; and differences relating to investments in subsidiaries to the extent that the Group is able to control the timing of the reversal of the timing difference and it is probable that the timing difference will not reverse in the future. The amount of deferred tax provided is based on the expected manner of realisation or settlement of the carrying amount of assets and liabilities, using tax rates enacted or substantively enacted at the balance sheet date.
A deferred tax asset is recognised only to the extent that it is probable that future taxable profits will be available against which the asset can be utilised. Deferred tax assets are reduced to the extent that it is no longer probable that the related tax benefit will be realised.
(U) Segment reportingOperating segments are reported in a manner consistent with the internal reporting provided to the chief operating decision maker. The chief operating decision maker has been identified as the Board of Directors.
(V) Significant judgements and estimatesThe preparation of financial statements in conformity with IFRS requires management to make judgements, estimates and assumptions that affect the application of policies and reported amounts of assets and liabilities, income and expenses. The estimates and associated assumptions are based on historical experience and various other factors that are believed to be reasonable under the circumstances, the results of which form the basis of making the judgements about carrying values of assets and liabilities that are not readily apparent from other sources. Actual results may differ from these estimates.
The estimates and underlying assumptions are reviewed on an ongoing basis. Revisions to accounting estimates are recognised in the period in which the estimate is revised if the revision affects only that period, or in the period of the revision and future periods if the revision affects both current and future periods.

76 | Low & Bonar PLC Annual Report 2013
Significant Accounting Policies(continued)
The significant judgement areas for the Group include the valuation of the Group’s goodwill and intangible assets and the accounting estimates and judgements which are incorporated within the provision for post employment obligations. Impairment tests have been undertaken with respect to goodwill and intangible assets (Notes 11 and 12) using commercial judgement and key assumptions and estimates including the discount rate, the long term growth rate and the cash flow projections to be used. Estimating a value in use amount requires management to make an estimate of the future expected cash flows from each cash generating unit and also to choose a suitable discount rate in order to calculate the present value of those cash flows.
Note 4 outlines the key assumptions used to value the Group’s post employment obligations and the sensitivity of obligations to changes in these assumptions. The key assumptions include the discount rate, the rate of inflation, the mortality assumptions and the rate of future pension increases. Measurement of the UK Scheme’s defined benefit obligation is particularly sensitive to changes in certain key assumptions including the discount rate. An increase or decrease of 0.1% in the discount rate would result in a decrease or increase in the defined benefit obligation of c £2m – £2.5m.
Other judgement areas include the valuation of the Group’s property, plant and equipment, the impairment provision for trade receivables, the valuation of the share based payments within the Group and key taxation judgements.
In relation to the Group’s property, plant and equipment (Note 13), useful economic lives and residual values of assets have been established using historical experience and an assessment of the nature of the assets involved
A number of accounting estimates and judgements are incorporated within the impairment provisions for trade receivables which are described in more detail in Note 18. A number of accounting estimates and judgements are incorporated within the provisions for share-based payments. These are described in more detail in Note 25.
The Group has a number of taxation judgements to consider including the recoverability of deferred tax assets, the estimation of the corporation tax in each of the jurisdictions in which it operates and the total provision for income tax based on management’s interpretation of country specific tax law and the likelihood of settlement. Management evaluate each of these risks on a case by case basis and regularly re-evaluate their assessment of the likely outcome based on the latest fact pattern and information.
(W) Financial guarantee contractsWhere the Company enters into contracts to guarantee the indebtedness of other companies within the Group, these are considered to be insurance arrangements and are accounted for as such. In this respect, the Company treats the guarantee contract as a contingent liability unless it becomes probable that the Group will be required to make a payment under the guarantee.
(X) New IFRS not yet appliedOn the date on which these financial statements were authorised the following Standards, Interpretations and Amendments had been issued but were not effective for the year ended 30 November 2013 (and in some cases had not yet been adopted by the EU) and have not yet been adopted by the Group:• IFRS 1 (amended) (Government Loans) – effective for the year
ending 30 November 2014• IFRS 1 (amended) (Severe Hyperinflation and Removal of Fixed
Dates for First-time Adopters) – effective for the year ending 30 November 2014
• IFRS 7 (amended) (Disclosures – Offsetting Financial Assets and Financial Liabilities) – effective for the year ending 30 November 2014
• Annual Improvements to IFRS’s (2009-2011 cycle) – effective for the year ending 30 November 2014
• IFRS 9 Financial Instruments and additions to IFRS 9 (issued October 2010) – not yet endorsed by the EU
• IFRS 10 Consolidated Financial Statements – effective for the year ending 30 November 2015.
• IFRS 10, IFRS 12 and IAS 27 (amended) (Investment Entities) – effective for the year ending 30 November 2015.
• IFRS 11 Joint Arrangements – effective for the year ending 30 November 2015.
• IFRS 12 Disclosure of Interests in Other Entities – effective for the year ending 30 November 2015.
• IFRS 13 Fair Value Measurement – effective for the year ending 30 November 2014.
• IAS 12 (amended) (Deferred Tax: Recovery of Underlying Assets) – effective for the year ending 30 November 2014.
• IAS 19 Employee Benefits – effective for the year ending 30 November 2014.
• IAS 27 Separate Financial Statements – effective for the year ending 30 November 2015.
• IAS 28 Investments in Associates and Joint Ventures – effective for the year ending 30 November 2015.
• IAS 32 Financial Instruments (amended) (offsetting financial assets and financial liabilities) – effective for the year ending 30 November 2015.
• IAS 36 (amended) (Recoverable Amount Disclosures for Non-Financial Assets) – effective for the year ending 30 November 2014
• IAS 39 (amended) (Novation of Derivatives and continuation of Hedge Accounting) – effective for the year ending 30 November 2014
• IFRIC 20 Stripping Costs in the Production Phase of a Surface Mine – effective for the year ending 30 November 2014.
• IFRIC 21 Levies – not yet endorsed by the EU
It is anticipated that adoption of these Standards and Interpretations in future periods will not have a material impact on the Group’s financial results except for the following standards that will alter measurement and disclosure:• The amendments to IAS 19 will alter the recognition and disclosure
requirements for the Group’s defined benefit plans.• The adoption of IFRS 9 will affect the measurement and disclosure
of the Group’s financial instruments. • IFRS 12 will impact the disclosures of interests the Company has in
other entities• IFRS 13 will impact the measurement of fair value for certain assets
and liabilities as well as associated disclosures.
If the amendment to IAS 19 had been applied to these accounts, the current year’s operating profit and profit before tax, amortisation and non-recurring items would both have been c.£0.8m lower; and statutory profit before tax would have been c.£1.1m lower; due to:• pension administration costs of c.£1.1m, which are currently
reported within interest costs, being reclassified into administrative expenses. c.£0.8m of these costs would have been charged against operating profit before tax, amortisation and non-recurring items, and c.£0.3m against non-recurring items, due to the nature of the costs concerned; and
• interest costs being c.£1.1m higher, due to the interest cost and expected return on scheme assets having been replaced by a single net interest charge, calculated by applying the discount rate to the net defined benefit liability.
Beyond the information above, it is not practicable to provide a reasonable estimate of the effect of these standards until a detailed review has been completed.

Strategic Report Governance Financial Statements
77 Low & Bonar PLC Annual Report 2013 |
1. Segmental informationThe Group’s principal activities are in the international manufacturing and supply of those performance materials commonly referred to astechnical textiles. For the purposes of management reporting to the chief operating decision maker, the Group is organised into three reportable operating divisions: Bonar, Technical Coated Fabrics and Yarns. Financial information for each operating division is also available in a disaggregated form in line with the identified cash generating units. Segment assets and liabilities include items directly attributable to segments as well as those that can be allocated on a reasonable basis.
Unallocated items comprise mainly cash and cash equivalents, interest-bearing loans, borrowings, goodwill and intangible assets, derivative assets and liabilities, post-employment benefits and corporate assets and expenses. Inter-segment sales are not material.
2013
Bonar£m
TechnicalCoatedFabrics
£mYarns
£m
UnallocatedCentral
£mTotal
£m
Revenue from external customers – continuing operations 245.6 124.7 32.8 – 403.1
Operating profit/(loss) before amortisation and non-recurring items 23.0 12.1 0.5 (3.4) 32.2Amortisation of acquired intangible assets (2.7) (2.9) – – (5.6)
Operating profit/(loss) before non-recurring items 20.3 9.2 0.5 (3.4) 26.6Non-recurring items (2.1) – – – (2.1)
Operating profit/(loss) 18.2 9.2 0.5 (3.4) 24.5Financial income 6.7Financial expense (12.8)
Net financing costs (6.1)Share of results of joint venture (0.6)
Profit before taxation 17.8Taxation (5.0)
Profit for the year – continuing operations 12.8
Reportable segment assets 168.1 86.5 27.7 – 282.3Intangible assets and goodwill 115.2Investment in joint venture 4.7Investment in associate 0.4Cash and cash equivalents 17.9Other unallocated assets 3.5
Total Group assets 424.0
Reportable segment liabilities (52.2) (23.5) (8.5) – (84.2)Loans and borrowings (104.7)Post employment benefits (12.7)Derivative liabilities (0.1)Other unallocated liabilities (29.2)
Total Group liabilities (230.9)
Other information
Additions to property, plant and equipment 6.2 4.5 0.6 0.3 11.6Additions to intangible assets and goodwill 8.3 0.2 – – 8.5Impairment to intangible assets, goodwill and property, plant and equipment – – – – –Depreciation 8.3 3.7 0.8 – 12.8
Notes to the Accounts

78 | Low & Bonar PLC Annual Report 2013
Notes to the Accounts(continued)
1. Segmental information (continued)2012
Bonar£m
TechnicalCoatedFabrics
£mYarns
£m
UnallocatedCentral
£mTotal
£m
Revenue from external customers – continuing operations 238.7 115.3 26.5 – 380.5
Operating profit/(loss) before amortisation and non-recurring items 25.0 10.7 (1.8) (3.4) 30.5Amortisation of acquired intangible assets (3.0) (2.8) – – (5.8)
Operating profit/(loss) before non-recurring items 22.0 7.9 (1.8) (3.4) 24.7Non-recurring items (0.8) – (11.2) (0.6) (12.6)
Operating profit/(loss) 21.2 7.9 (13.0) (4.0) 12.1Financial income 7.0Financial expense (13.0)
Net financing costs (6.0)
Profit before taxation 6.1Taxation (4.7)
Profit for the year – continuing operations 1.4
Reportable segment assets 145.6 83.9 23.4 – 252.9Intangible assets and goodwill 110.9Investment in joint venture 5.3Investment in associate 0.4Cash and cash equivalents 26.9Other unallocated assets 3.6
Total Group assets 400.0
Reportable segment liabilities (49.0) (21.8) (6.2) – (77.0)Loans and borrowings (109.5)Post employment benefits (24.8)Other unallocated liabilities (30.8)
Total Group liabilities (242.1)
Other information
Additions to property, plant and equipment 10.9 2.1 0.1 – 13.1Additions to intangible assets and goodwill 2.4 0.1 – – 2.5Impairment to intangible assets, goodwill and property, plant and equipment – – 11.2 – 11.2Depreciation 7.4 3.5 1.2 – 12.1
The geographical analysis of external revenue by location of customers and non-current assets by location of assets, as presented to the chief operating decision maker, is as follows:
External revenue by location of customersNon-current assets by
location of assets
2013£m
2013%
2012£m
2012%
2013£m
2012£m
Western Europe 238.0 59.0 233.5 61.4 189.5 178.4Eastern Europe 33.2 8.2 27.3 7.2 10.0 10.6North America 74.8 18.6 67.3 17.7 22.9 23.3Middle East 17.9 4.4 13.7 3.6 7.2 7.7Asia 23.2 5.8 24.5 6.4 4.9 5.4Rest of the World 16.0 4.0 14.2 3.7 – –
Total 403.1 100.0 380.5 100.0 234.5 225.4
Revenues arising in the UK, which is the parent Company’s country of domicile, were £24.3m (2012: £24.2m). The net book value of non-current assets located in the UK at 30 November 2013 was £0.9m (2012: £3.2m). In the current and prior year more than 10% of the Group’s revenues arose in Germany. The net book value of non-current assets located in Germany at 30 November 2013 was £85.2m (2012: £86.4m) and revenues in the year to 30 November 2013 were £71.1m (2012: £65.4m).

Strategic Report Governance Financial Statements
79 Low & Bonar PLC Annual Report 2013 |
2. Profit before taxation 2013
£m2012
£m
Total operating costs 378.6 368.4Total operating costs above include:Staff costs 79.8 74.6Inventories Cost of inventories recognised as an expense 196.6 185.1 Write down of inventories recognised as an expense – 0.6 Change in provisions held against inventories (0.1) (0.4)Depreciation of property, plant and equipment 12.8 12.1Amortisation of intangible assets 6.3 6.4Impairment of non-current assets – 11.2Exchange differences recognised as a gain (0.6) (0.1)Loss / (gain) on disposal of non-current assets 0.3 (0.2)Amounts payable under operating leases: Property 4.1 4.1 Plant and equipment 1.5 1.3Research and development expenditure recognised as an expense 3.8 3.3
The balance of operating costs relates to other external charges.
Auditor’s remunerationDuring the year the Group obtained the following services from its auditor at costs detailed below:
2013£m
2012£m
Fees payable to the Company’s auditor and their associates for the audit of the Company’s annual accounts 0.2 0.2Fees payable to the Company’s auditor and their associates for other services to the Group: The audit of the Company’s subsidiaries 0.3 0.3Non-audit services: Corporate tax compliance – – Corporate tax consultancy 0.1 0.1 Other non-audit services 0.1 0.1
The total amount paid to the auditor was £0.7m (2012: £0.7m).
3. Staff numbers and costsThe average number of persons employed by the Group during the year including Executive Directors was:
Group
2013 2012
Production 1,499 1,415Sales 255 235Administrative 251 236
2,005 1,886
The average number of persons employed by the Company during the year was 20 (2012:17).
The aggregate staff costs were:Group
2013£m
2012£m
Wages and salaries 62.9 59.2Social security costs 13.7 12.1Pension costs 3.2 3.3
79.8 74.6
Company
2013£m
2012£m
Wages and salaries 2.6 2.5Social security costs 0.3 0.3Pension costs 0.2 0.2
3.1 3.0
The Directors of the Company are listed on pages 30 and 31.

80 | Low & Bonar PLC Annual Report 2013
Notes to the Accounts(continued)
4. Post employment benefitsThe Group operates a number of pension schemes in the UK and overseas. These are either defined benefit or defined contribution in nature. The assets of all the schemes are held separately from those of the Group.
(a) Defined contribution schemesVarious defined contribution pension schemes exist around the Group. These are accounted for on a contribution payable basis. The total cost charged to income in respect of defined contribution pension schemes was £2.9m (2012: £3.0m).
(b) Defined benefit schemes(i) United KingdomThe UK defined benefit scheme (the “Scheme”) was independently valued by a qualified actuary at 31 March 2011 using the projected unit method. The main assumption in carrying out the valuation was for investment returns of 6.4% per annum in respect of investments in higher risk assets and 4.65% in respect of lower risk assets. At 31 March 2011, the total market value of assets in the UK scheme was £142.2m. The overall level of funding was 86%. The net income statement charge for the year ended 30 November 2013 for the UK pension scheme was £0.7m (2012: £0.7m charge). The Scheme is held by the Company and all of the UK disclosures relate to the Company and the Group.
Following the 2011 valuation of the UK scheme, the Company has agreed a schedule of contributions with the Trustee of the Scheme under which the Company will pay contributions of £3.3m per annum from the year ending 30 November 2012. The Company may be required to make further contributions to the UK scheme if the Group’s net cash inflow exceeds certain agreed levels provided that the total contributions payable in any one year will be no more than £4.0m and the total contributions payable under the revised schedule (which runs to 2019) shall not exceed £28.4m. The Company made a payment of £3.3m during the year ending 30 November 2013 (2012: £3.3m).
(ii) Non-UKDefined benefit schemes are held in Germany, Belgium and the United States relating to the Bonar business and the Mehler Texnologies business in Germany. Further disclosure on these schemes is detailed below, given the relative immateriality of these schemes their results have been combined in the following disclosures. Defined benefit schemes also exist in the Group’s Dutch businesses, which are members of an industry-wide scheme; it is not possible to separately identify assets and liabilities and therefore these schemes are accounted for on a contribution payable basis. The Group will share in the actuarial gains and losses of the schemes which are members of the industry-wide schemes.
(iii) Financial assumptionsThe valuations require the exercise of judgement in relation to various assumptions, including employee and pensioner demographics and the future expected return on assets. Management determine the assumptions to be adopted in discussion with their actuaries. The application of different assumptions could have a significant effect on the amounts reflected in the income statement, the statement of comprehensive income and balance sheet in respect of post employment benefits. The assumptions vary among the countries in which the Group operates and there may be an interdependency between some of the assumptions.
The financial assumptions used to estimate defined benefit obligations are:
UK schemes Non-UK schemes
2013%
2012%
2013%
2012%
Discount rate 4.40 4.20 3.00–4.60 3.40–3.70Expected return on scheme assets – 4.10 – 3.70–7.00Future salary increases – – 2.25 2.25Future pension increases 3.30 2.80 2.00 2.00Inflation increase 2.40 2.00 2.00 2.00
In assessing the Group’s post employment liabilities, management monitor mortality assumptions and use up-to-date mortality tables. Allowance is made for expected future increases in life expectancy. The figures assume that a UK Scheme male member, currently aged 65, will survive a further 21 years and a female member for a further 23 years (2012: male – 21 years, female – 23 years). Management consider that the assumptions used are appropriate approximations to the life expectancy of Scheme members in the light of scheme specific experience and more widely available statistics.
To develop the expected long-term rate of return on assets assumption, management consider the level of expected returns on risk-free investments (primarily government bonds), the historical level of risk premium associated with the other asset classes in which the portfolio is invested and the expectations for future returns of each asset class. The expected return for each asset class is then weighted based on the target asset allocation to develop the expected long-term rate of return on assets assumption for the portfolio and an allowance made for expected expenses.
Measurement of the Scheme’s defined benefit obligations is particularly sensitive to changes in certain key assumptions including the discount rate. An increase or decrease of 0.1% in the discount rate would result in a decrease or increase in the defined benefit obligation of c£2m – £2.5m.

Strategic Report Governance Financial Statements
81 Low & Bonar PLC Annual Report 2013 |
4. Post employment benefits (continued)iv) Financial impact of plansThe total amount recognised for defined benefit schemes is as follows:
UK schemes Non-UK schemes Total
2013£m
2012£m
2013£m
2012£m
2013£m
2012£m
Fair value of scheme assets 159.4 148.3 9.6 9.3 169.0 157.6Present value of defined benefit obligations (163.2) (163.4) (18.5) (19.0) (181.7) (182.4)
Net liability recognised in the balance sheet (3.8) (15.1) (8.9) (9.7) (12.7) (24.8)
Amounts recognised as a charge/(credit) to the income statement in respect of the defined benefit pension schemes are as follows:
UK schemes Non-UK schemes Total
2013£m
2012£m
2013£m
2012£m
2013£m
2012£m
Current service cost – – 0.3 0.3 0.3 0.3Interest cost 6.7 7.1 0.7 0.7 7.4 7.8Expected return on scheme assets (6.0) (6.4) (0.6) (0.5) (6.6) (6.9)
0.7 0.7 0.4 0.5 1.1 1.2
Amounts recognised in Other Comprehensive Income are as follows:
Group Company
2013£m
2012£m
2013£m
2012£m
Actuarial gain/(loss) 9.3 (13.9) 8.6 (11.6)Associated deferred tax (0.3) 0.7 – –
The cumulative actuarial loss recognised in Other Comprehensive Income is £20.9m (2012: £30.2m). The Company has not recorded a deferred tax asset against the movement recognised in Other Comprehensive Income as it is not probable that a tax benefit will be realised in the future.
Changes in the present value of the defined benefit obligation are as follows:
UK schemes Non–UK schemes Total
2013£m
2012£m
2013£m
2012£m
2013£m
2012£m
Opening defined benefit obligation 163.4 151.7 19.0 17.1 182.4 168.8Current service cost – – 0.3 0.3 0.3 0.3Interest cost 6.7 7.1 0.7 0.7 7.4 7.8Actuarial loss/(gain) 1.1 13.7 (0.3) 2.3 0.8 16.0Benefits paid (8.0) (9.1) (1.1) (0.7) (9.1) (9.8)Benefits paid directly by the employer – – (0.2) (0.1) (0.2) (0.1)Exchange adjustments – – 0.1 (0.6) 0.1 (0.6)
Closing defined benefit obligation 163.2 163.4 18.5 19.0 181.7 182.4
Changes in the fair value of scheme assets are as follows:
UK schemes Non–UK schemes Total
2013£m
2012£m
2013£m
2012£m
2013£m
2012£m
Opening fair value of scheme assets 148.3 145.6 9.3 9.0 157.6 154.6Expected return 6.0 6.4 0.6 0.5 6.6 6.9Actuarial gain 9.8 2.1 0.3 – 10.1 2.1Contributions by employers 3.3 3.3 0.7 0.8 4.0 4.1Benefits paid (8.0) (9.1) (1.3) (0.7) (9.3) (9.8)Exchange adjustments – – – (0.3) – (0.3)
Closing fair value of scheme assets 159.4 148.3 9.6 9.3 169.0 157.6

82 | Low & Bonar PLC Annual Report 2013
Notes to the Accounts(continued)
4. Post employment benefits (continued)The fair value of the UK scheme assets at the balance sheet date is analysed as follows:
2013£m
2013%
2012£m
2012%
Equity securities 43.4 27 36.5 25Debt securities 28.7 18 30.9 21Diversified growth funds 43.4 27 28.8 19LDI funds 19.5 12 16.5 11Property 15.3 10 13.8 9Cash and other 9.1 6 21.8 15
159.4 100 148.3 100
The fair value of the non-UK scheme assets at the balance sheet date is analysed as follows:
2013£m
2013%
2012£m
2012%
Equity securities 3.8 40 3.3 35Debt securities 5.1 53 5.6 60Property 0.1 1 0.1 2Cash and other 0.6 6 0.3 3
9.6 100 9.3 100
History of experience gains and losses – UK scheme:
2013£m
2012£m
2011£m
2010£m
2009£m
Fair value of scheme assets 159.4 148.3 145.6 138.2 136.4Present value of defined benefit obligation (163.2) (163.4) (151.7) (156.1) (155.9)
Deficit in the scheme (3.8) (15.1) (6.1) (17.9) (19.5)
Experience adjustments to scheme assetsAmount 9.8 2.1 4.6 0.3 13.3Percentage of present value of scheme assets 6% 1% 3% 0% 10%Experience adjustments to scheme liabilitiesAmount (0.1) (1.0) 3.4 3.1 (2.5)Percentage of present value of scheme liabilities (0%) (1%) 2% 2% (2%)
History of experience gains and losses – non-UK schemes: 2013
£m2012
£m2011
£m2010
£m2009
£m
Fair value of scheme assets 9.6 9.3 9.0 8.8 6.0Present value of defined benefit obligation (18.5) (19.0) (17.1) (16.9) (13.7)
Deficit in the scheme (8.9) (9.7) (8.1) (8.1) (7.7)
Experience adjustments to scheme assets:Amount 0.3 – (0.2) – 0.6Percentage of fair value of scheme assets 3% 0% (2%) 0% 10%Experience adjustments to scheme liabilities:Amount (0.1) 0.6 0.2 0.2 0.1Percentage of present value of scheme liabilities (1%) 3% 1% 1% 1%
c) Post retirement medical plans in the USAThe assumed medical trend rates for the Group’s post-retirement medical schemes in the USA are as follows:
2013 2012
Assumed healthcare trend rate:Immediate 7.2% 7.4%Ultimate 4.5% 4.5%

Strategic Report Governance Financial Statements
83 Low & Bonar PLC Annual Report 2013 |
4. Post employment benefits (continued)The effect of an increase of one percentage point and the effect of a decrease of one percentage point in the assumed trend is shown by the table below:
2013+1%
£’000
2013–1%
£’000
2012+1%
£’000
2012–1%
£’000
Effect on total service cost and interest cost components 4 (4) 5 (4)Effect on defined benefit obligation 34 (30) 46 (40)
5. Amortisation and non-recurring itemsDuring the year the Group recognised significant non-recurring items and amortisation of acquired intangible assets as detailed below:
2013 2012£m £m
Amounts charged to operating profitJoint venture start-up costs 0.6 0.2Acquisition related costs 1.0 0.7China office set-up costs 0.3 –Reorganisation costs 0.2 0.5Impairment of assets – 11.2
Total non-recurring items 2.1 12.6Amortisation of acquired intangible assets 5.6 5.8
Total charge to operating profit 7.7 18.4
Share of results of joint venture 0.6 –
Total charge to profit before tax 8.3 18.4
Current yearDuring the current year, the Group incurred £0.6m (2012: £0.2m) of costs in respect of Bonar Natpet LLC, its joint venture in Saudi Arabia; and £0.3m (2012: £nil) of initial costs in respect of setting up a sales and distribution office in China.
The Group incurred £1.0m of costs in the period in connection with the acquisition of Texiplast (see Note 24) and in connection with another potential acquisition.
£0.2m (2012: £0.5m) of costs were incurred in relation to the integration of the Group’s principal Performance Technical Textile operations into a single business, Bonar.
The Group also incurred a £0.6m loss (2012:£nil) in the year from their share of the results of the joint venture, Bonar Natpet LLC.
Prior yearDuring the prior year, the Group incurred £0.7m of costs in the period in connection with the acquisition of the trade and assets of Xero Flor International GmbH and in connection with another potential acquisition.
In the year ended 30 November 2012, an impairment charge of £11.2m was recognised against the carrying value of the Yarns business, in response to deteriorating market conditions, of which £8.4m was allocated against goodwill and £2.8m was allocated to property, plant and equipment.
6. Financial income and financial expense2013 2012
£m £m
Financial incomeInterest income 0.1 0.1Expected return on pension scheme assets 6.6 6.9
6.7 7.0
Financial expenseInterest on bank overdrafts and loans (4.8) (4.9)Interest payable on all other loans (0.1) –Amortisation of bank arrangement fees (0.5) (0.5)Interest on pension scheme liabilities (7.4) (7.8)Amounts capitalised within property, plant and equipment – 0.2
(12.8) (13.0)

84 | Low & Bonar PLC Annual Report 2013
Notes to the Accounts(continued)
7. TaxationRecognised in the income statement
2013 2012£m £m
Current taxUK corporation tax– current year – –– prior year – (0.2)Overseas tax– current year 6.3 5.5– prior year 0.2 (0.4)
Total current tax 6.5 4.9Deferred tax (1.5) (0.2)
Total tax charge in the income statement 5.0 4.7
The amount of deferred tax income relating to changes in tax rates is £nil (2012: £0.1m).
Reconciliation of effective tax rateThe differences between the total tax charge shown above and the amount calculated by applying the standard rate of UK corporation tax of 23% (2012: 24%) to the profit before tax are as follows:
2013 2012£m £m
Profit before tax from continuing and total operations 17.8 6.1
Tax charge at 23% (2012: 24%) 4.1 1.5Expenses not deductible and income not taxable (2.0) 0.8Higher tax rates on overseas earnings 1.0 1.3Current tax losses not utilised 1.2 1.9Other short-term timing differences 0.5 (0.2)Prior period adjustments 0.2 (0.6)
Total tax charge for the year 5.0 4.7
Deferred tax recognised directly in Other Comprehensive Income2013 2012
£m £m
Actuarial gains and losses relating to post employment benefit obligations (0.3) 0.7
Total of items that will not be reclassified subsequently to profit or loss (0.3) 0.7
In March 2013 the Chancellor of the Exchequer announced a further phased reduction in the main UK corporation tax rate from 21% to 20% by April 2015. A 1% reduction from 24% to 23% took effect from 1 April 2013 and a 2% reduction from 23% to 21% will take effect from 1 April 2014. Given that the Group does not expect to pay corporation tax in the UK in the foreseeable future, these changes are not considered to have any material impact on the Group.
8. Profits of the CompanyThe Company has not presented its own income statement as permitted by section 408 of the Companies Act 2006. The profit after tax was £3.1m (2012: £3.2m).

Strategic Report Governance Financial Statements
85 Low & Bonar PLC Annual Report 2013 |
9. DividendsAmounts recognised as distributions to equity shareholders in the year were as follows:
2013 2012£m £m
Final dividend for the year ended 30 November 2012 – 1.6 pence per share (2011: 1.4 pence per share) 4.7 4.0Interim dividend for the year ended 30 November 2013 – 0.85 pence per share (2012: 0.8 pence per share) 2.5 2.3
7.2 6.3
The Directors have proposed a final dividend in respect of the financial year ended 30 November 2013 of 1.75 pence per share which will absorb an estimated £5.7m of shareholders’ funds. This has not been provided for in these accounts because the dividend was proposed after the year end. If it is approved by shareholders at the Annual General Meeting of the Company to be held on 25 March 2014, it will be paid on 17 April 2014 to Ordinary Shareholders who are on the register of members at close of business on 21 March 2014.
During the year the Board declared a final dividend on Ordinary Shares in relation to the year ended 30 November 2012 of 1.6 pence per share, which was paid to Ordinary Shareholders on the register of members at close of business on 22 March 2013.
The Directors declared an interim dividend on Ordinary Shares in relation to the year ended 30 November 2013 of 0.85 pence per share, which was paid to Ordinary Shareholders on the register of members at close of business on 30 August 2013.
10. Earnings per shareBasic earnings per share is calculated by dividing the earnings attributable to Ordinary Shareholders by the weighted average number of Ordinary Shares outstanding, excluding those held by the ESOP which are treated as cancelled for the purpose of this calculation. For diluted earnings per share, the weighted average number of Ordinary Shares in issue is adjusted to assume conversion of all dilutive potential Ordinary Shares. The Group has two classes of dilutive potential Ordinary Shares: those share options granted to employees where the exercise price is less than the average market price of the Company’s Ordinary Shares during the year; and those long-term incentive plan awards for which the performance criteria have been satisfied.
Reconciliations of the earnings and weighted average number of shares used in the calculations are set out below:
2013 2012
Weighted Weightedaverage average
number of Per share number of Per shareEarnings shares amount Earnings shares amount
£m (millions) pence £m (millions) pence
Statutory – continuing and total operations Basic earnings per share 12.3 301.035 4.08 1.4 288.447 0.47 Earnings attributable to Ordinary Shareholders Effect of dilutive items Share-based payment – 7.249 – 9.215
Diluted earnings per share 12.3 308.284 3.98 1.4 297.662 0.46
Before amortisation and non-recurring items Basic earnings per share 18.8 301.035 6.23 18.1 288.447 6.28 Earnings attributable to Ordinary Shareholders Effect of dilutive items Share-based payment – 7.249 – 9.215
Diluted earnings per share 18.8 308.284 6.09 18.1 297.662 6.08

86 | Low & Bonar PLC Annual Report 2013
Notes to the Accounts(continued)
11. GoodwillGroup
2013 2012£m £m
CostAt 1 December 82.6 84.9Exchange adjustments 1.3 (3.8)Arising on acquisition (Note 24) 5.7 1.5
At 30 November 89.6 82.6
Accumulated impairment lossesAt 1 December 8.4 –Impairment loss recognised – 8.4
At 30 November 8.4 8.4
Net book value at 30 November 81.2 74.2
Cash generating unitsGoodwill is allocated to the grouping of cash generating units (“CGUs”) which have been identified according to the principal markets in which each business operates. A summary of the carrying value presented at CGU level is shown below:
Group
2013 2012Net book Net book
value value£m £m
Cash generating unitSpecialist yarns – –Bonar EMEA 31.2 25.3Bonar North America 12.9 12.7Bonar APAC 0.3 0.3Technical coated fabrics 36.8 35.9
At 30 November 81.2 74.2
There has been a change in the composition of the CGUs in the current year based upon a reorganisation of the reporting structure in the Group. In line with IAS 36 “Impairment of Assets”, goodwill has therefore been reallocated to the units affected using the relative value approach. The change in the reporting structure has only impacted the Bonar entities with the previous Fabrics and fibres, Polymeric mats and composites and Other CGUs now being reported on a regional basis, Bonar EMEA, Bonar North America and Bonar APAC.
The Group tests goodwill values annually for impairment or more frequently if there are indications that goodwill might be impaired. The recoverable amounts are determined using value in use calculations for each CGU based on projected cash flows, discounted to calculate the net present value. We have outlined our approach to what we consider to be the key assumptions within the impairment reviews below:
Cash flow projectionsCash flow projections for each CGU are derived from the most recent annual budgets and five-year plans approved by the Board, which take into account the long-term average and projected growth rates for each of the key markets served by the CGUs, along with forecast changes to selling prices and direct costs and CGU specific forecast risks and potential cash volatilities. These cash flow projections are based on past experience and management’s expectations of future changes in markets using external sources of information.
Long-term growth ratesThe value in use calculations assume terminal growth rates of between 2% and 2.5% (2012: between 2% and 3%) beyond year five.
Discount rateForecast pre-tax cash flows for each CGU are discounted to net present value using the Group’s discount rate, calculated based on external advice. Pre-tax discount rates ranged from 11.8% to 11.9% (2012: 9.7% to 11.9%) to calculate value in use for CGUs.
Sensitivity analysis has shown that with an increase of 750 basis points in the pre-tax discount rate applied to each CGU, excluding Specialist yarns, there would be no impairment at a terminal growth rate of 2.0% (2012: no impairment with an increase of 510 basis points and 2.0% terminal growth rate, excluding Specialist yarns).

Strategic Report Governance Financial Statements
87 Low & Bonar PLC Annual Report 2013 |
11. Goodwill (continued)ConclusionNo impairment arose as a result of the valuations of the CGUs. Management believe that the valuations are sufficiently robust such that reasonably foreseeable variations in the key assumptions would not result in significant changes to the results of the impairment tests. The assumptions have been reviewed in the light of the current economic environment and are considered appropriate. The value in use calculations, show at least 68% headroom (2012: 62% headroom) compared to the book values of the CGUs (excluding Specialist yarns).
In the prior year, the performance of the Yarns business was affected by deteriorating market conditions, particularly by further reductions in discretionary public funding for artificial sports pitches, which had an adverse impact on the projected value in use of the Specialist yarns CGU, and consequently resulted in an impairment to goodwill of £8.4m and an impairment to property, plant and equipment of £2.8m. The pre-tax discount rate used to measure the CGU’s value in use was 11.9%.
12. Intangible assetsComputer Research and Order Customer Marketing Technology Non-competesoftware development backlog relationships related based agreements Total
Group £m £m £m £m £m £m £m £m
CostAt 30 November 2011 2.6 2.8 0.1 33.0 13.9 20.5 1.3 74.2
Exchange adjustment (0.1) (0.1) – (1.4) (0.7) (1.0) – (3.3)Additions 0.2 0.8 – – – – – 1.0Arising on acquisitions – – 0.3 1.5 0.7 1.0 – 3.5
At 30 November 2012 2.7 3.5 0.4 33.1 13.9 20.5 1.3 75.4
Exchange adjustment – 0.1 – 0.5 0.4 0.5 – 1.5Additions 1.3 0.8 – – – – – 2.1Retirements (0.1) – – – – – – (0.1)Arising on acquisition (Note 24) – – – 0.4 0.3 – – 0.7
At 30 November 2013 3.9 4.4 0.4 34.0 14.6 21.0 1.3 79.6
Aggregate amortisationAt 30 November 2011 1.8 0.9 0.1 13.1 4.5 11.9 1.3 33.6
Exchange adjustment (0.1) – – (0.4) (0.3) (0.5) – (1.3)Charge for the year 0.3 0.3 0.3 2.4 1.1 2.0 – 6.4
At 30 November 2012 2.0 1.2 0.4 15.1 5.3 13.4 1.3 38.7
Exchange adjustment – 0.1 – 0.1 0.2 0.3 – 0.7Retirements (0.1) – – – – – – (0.1)Charge for the year 0.3 0.4 – 2.6 1.1 1.9 – 6.3
At 30 November 2013 2.2 1.7 0.4 17.8 6.6 15.6 1.3 45.6
Net book valueAt 30 November 2013 1.7 2.7 – 16.2 8.0 5.4 – 34.0
At 30 November 2012 0.7 2.3 – 18.0 8.6 7.1 – 36.7
At 30 November 2011 0.8 1.9 – 19.9 9.4 8.6 – 40.6
Notes 1 Marketing related intangible assets are assets that are primarily used in the marketing or promotion of products or services. Such assets include trademarks, trade names,
service marks and internet domain names. 2 Non-compete agreements prohibit a seller from competing with the purchaser of a business. 3 Customer relationships consist of customer lists, customer contracts and relationships and non-contractual customer relationships. 4 Technology based intangible assets relate to innovations and technological advances and include patented and unpatented technology, databases and trade secrets.5 Research and development assets relate to expenditure incurred in the course of research where findings can be applied to a plan or design for the production of new or
substantially improved products and processes.

88 | Low & Bonar PLC Annual Report 2013
Notes to the Accounts(continued)
13. Property, plant and equipmentGroup Company
Plant and Plant andProperty equipment Total Property equipment Total
£m £m £m £m £m £m
CostAt 30 November 2011 49.2 207.2 256.4 0.5 – 0.5
Exchange adjustment (2.2) (7.8) (10.0) – – –Additions 1.2 11.9 13.1 – – –Capitalisation of interest – 0.2 0.2 – – –Disposals (0.1) (2.1) (2.2) – – –
At 30 November 2012 48.1 209.4 257.5 0.5 – 0.5
Exchange adjustment 0.1 0.3 0.4 – – –Additions 0.6 11.0 11.6 0.3 – 0.3Reclassifications 0.3 – 0.3 – – –Disposals (0.8) (3.5) (4.3) (0.4) – (0.4)Acquisition of subsidiary (Note 24) 2.9 3.6 6.5 – – –
At 30 November 2013 51.2 220.8 272.0 0.4 – 0.4
Accumulated depreciationAt 30 November 2011 17.7 123.7 141.4 0.2 – 0.2
Exchange adjustment (0.8) (4.8) (5.6) – – –Charge for the year 1.1 11.0 12.1 0.1 – 0.1Impairment – 2.8 2.8 – – –Disposals (0.1) (1.9) (2.0) – – –
At 30 November 2012 17.9 130.8 148.7 0.3 – 0.3
Exchange adjustment – 0.2 0.2 – – –Charge for the year 1.1 11.7 12.8 0.1 – 0.1Reclassifications 1.5 (1.5) – – – –Disposals (0.6) (3.3) (3.9) (0.3) – (0.3)
At 30 November 2013 19.9 137.9 157.8 0.1 – 0.1
Net book valueAt 30 November 2013 31.3 82.9 114.2 0.3 – 0.3
At 30 November 2012 30.2 78.6 108.8 0.2 – 0.2
At 30 November 2011 31.5 83.5 115.0 0.3 – 0.3
The carrying value of freehold land not depreciated at 30 November 2013 was £3.2m (2012: £3.2m). Committed capital expenditure at 30 November 2013 totalled £0.5m (2012: £0.2m).
The prior year impairment charge to plant and equipment related to the Yarns business (see Note 11).
14. Investment in subsidiariesCompany
2013 2012£m £m
Cost at 1 December and 30 November 103.5 103.5
Provision for impairment at 1 December (9.9) (8.8)Increase in provision – (1.1)
Provision for impairment at 30 November (9.9) (9.9)
Net book value at 1 December 93.6 94.7
Net book value at 30 November 93.6 93.6
The subsidiary undertakings whose results, or financial position, in the opinion of the Directors, principally affected the results shown in these accounts are shown within Note 33.

Strategic Report Governance Financial Statements
89 Low & Bonar PLC Annual Report 2013 |
15. Investment in joint ventureGroup
2013 2012£m £m
Cost and net book valueAt 1 December 5.3 –Equity investment in joint venture – 5.3Share of retained loss (0.6) –Exchange adjustment – –
At 30 November 4.7 5.3
The Group’s share of the assets, liabilities, income and expenses of its joint venture is shown below:
2013 2012£m £m
Total assets 26.2 17.6Total liabilities (16.9) (7.0)
Net assets 9.3 10.6
Group share of net assets 4.7 5.3
Revenue – –
Loss for the year (1.2) –
Group share of loss for the year (0.6) –
The joint venture whose results, or financial position, in the opinion of the Directors, principally affected the results shown in these accounts is shown within Note 33.
16. Investment in associateGroup
2013 2012£m £m
Cost and net book valueAt 1 December 0.4 0.4Share of retained profit 0.1 0.1Dividends received (0.1) (0.1)
At 30 November 0.4 0.4
The Group’s share of the assets, liabilities, income and expenses of its associated undertakings is shown below:
2013 2012£m £m
Total assets 1.4 1.4Total liabilities (0.1) (0.1)
Net assets 1.3 1.3
Group share of net assets 0.4 0.4
Revenue 4.0 4.1
Profit for the year 0.4 0.4
Group share of profit for the year 0.1 0.1
The associate whose results, or financial position, in the opinion of the Directors, principally affected the results shown in these accounts is shown within Note 33.

90 | Low & Bonar PLC Annual Report 2013
Notes to the Accounts(continued)
17. InventoriesGroup
2013 2012£m £m
Raw materials 17.7 17.6Work in progress 16.2 13.9Finished goods 52.9 43.6
86.8 75.1
Inventories are presented in the balance sheet net of provision for impairment of obsolete and slow moving items. Impairment is estimated by management based upon prior experience and their assessment of the current and future economic environment. The write down of inventories is included in cost of sales.
18. Trade and other receivablesGroup
2013 2012£m £m
CurrentTrade receivables 66.9 63.6Provision for impairment of receivables (3.1) (3.3)
Net trade receivables 63.8 60.3Other receivables 16.1 7.6Prepayments and accrued income 1.8 1.4
81.7 69.3
Company
2013 2012£m £m
Non-currentAmounts owed by subsidiaries 23.9 76.8
CurrentAmounts owed by subsidiaries 137.9 84.6Other receivables 0.3 0.4Prepayments and accrued income 0.4 0.4
138.6 85.4
Included within the Group’s other receivables is £9.1m (2012: £0.1m) owed by Bonar Natpet LLC, a joint venture. In January 2014, £6.0m of this receivable was collected.
The Group has an established credit policy under which each new customer is analysed individually for creditworthiness before the Group’s standard payment terms and conditions are offered. The Group’s review includes external ratings and bank references, where available. Purchase limits are established for each customer; these limits are reviewed quarterly. The Group has a long history of trading with a number of its customers.
The Group establishes an allowance for impairment that represents its estimate of incurred losses in respect of trade and other receivables.
Impairment lossesThe age profile of gross trade receivables at the balance sheet date was:
Group
2013 2012£m £m
Not past due 55.1 53.70–30 days past due 4.3 3.531–120 days past due 2.0 2.0More than 120 days past due 5.5 4.4
66.9 63.6

Strategic Report Governance Financial Statements
91 Low & Bonar PLC Annual Report 2013 |
18. Trade and other receivables (continued)The movement in the allowance for impairment in respect of trade receivables during the year was as follows:
Group
2013 2012£m £m
Balance at 1 December (3.3) (3.7)Increased during the year (0.7) (0.8)Released during the year 0.3 –Utilised during the year 0.7 1.0Arising on acquisition (0.1) –Exchange adjustments – 0.2
At 30 November (3.1) (3.3)
The allowance for impairment in respect of trade receivables at the end of the year was allocated against aged receivables as follows:
Group
2013 2012£m £m
Not past due – –0–30 days past due – –31–120 days past due (0.1) (0.1)More than 120 days past due (3.0) (3.2)
At 30 November (3.1) (3.3)
Provisions for impairment of receivables are estimated by management based on prior experience and their assessment of the current economic environment. The trade receivables impairment provision as at 30 November 2013 was £3.1m (2012: £3.3m). Management believe that this provision is adequate to cover the risk of bad debts and exposure to credit risk. At 30 November 2013, 61.8% (2012: 64.5%) of trade receivables were insured.
19. Trade and other payablesGroup
2013 2012£m £m
CurrentTrade payables 59.9 51.8Other taxes and social security 3.4 2.4Other payables 5.0 5.5Accruals 14.6 16.5
82.9 76.2Current tax liabilities 5.4 6.2
88.3 82.4
Company
2013 2012£m £m
CurrentAmounts owed to subsidiaries 13.5 12.5Other taxes and social security 0.1 0.1Other payables 1.2 1.1Accruals 1.1 2.1
15.9 15.8Current tax liabilities 1.7 1.7
17.6 17.5

92 | Low & Bonar PLC Annual Report 2013
Notes to the Accounts(continued)
20. Financial assets, liabilities, derivatives and financial risk managementThe objectives of the Group’s treasury policies are to ensure sufficient liquidity to meet the Group’s operational and strategic needs and the management of financial risk at optimal cost. The main financial risks to which the Group is exposed are foreign currency risk, credit risk and interest rate risk. Group treasury policies are set by the Board and permit the use of conventional financial instruments and certain derivative instruments to manage and mitigate these risks. There were no changes to this policy in the year ended 30 November 2013.
The Group treasury function is responsible for implementing Group policy and for managing the Group’s relationships with its key providers of debt and other treasury services. The treasury function is operated as a cost centre and no speculative transactions are permitted. Underlying policy assumptions and activities are reviewed by the Board. Controls over exposure changes and transaction authenticity are in place. The treasury function is subject to periodic independent review by the internal audit department.
Fair value of financial assets and liabilitiesThe fair value of the Group’s financial assets and liabilities together with the carrying amounts shown in the balance sheet are as follows:
Group Company
Fair value Book value Fair value Book value Fair value Book value Fair value Book value2013 2013 2012 2012 2013 2013 2012 2012
£m £m £m £m £m £m £m £m
Cash at bank and in hand 17.9 17.9 26.9 26.9 – – 3.8 3.8Trade and other receivables 79.9 79.9 67.9 67.9 162.1 162.1 161.8 161.8Trade and other payables (90.2) (90.2) (84.2) (84.2) (17.6) (17.6) (17.5) (17.5)Derivative liabilities (0.1) (0.1) – – – – – –Bank overdrafts – – – – (4.6) (4.6) (0.8) (0.8)Preference shares (0.4) (0.4) (0.4) (0.4) (0.4) (0.4) (0.4) (0.4)Prepaid arrangement fees 0.6 0.6 1.1 1.1 0.6 0.6 1.1 1.1Floating rate borrowings (67.5) (67.5) (73.7) (73.7) (51.3) (51.3) (73.7) (73.7)Fixed rate borrowings (39.1) (37.4) (38.7) (36.5) (39.1) (37.4) (38.7) (36.5)
(98.9) (97.2) (101.1) (98.9) 49.7 51.4 35.6 37.8
Estimation of fair value The major methods and assumptions used in estimating the fair values of financial instruments reflected in the table are summarised as follows:
Cash and cash equivalents The fair value of cash and cash equivalents is estimated as its carrying amount where the cash is repayable on demand. Where it is not repayable on demand then the fair value is estimated as the present value of future cash flows, discounted at the market rate of interest at the balance sheet date.
Trade and other receivables/payables The fair value of trade and other receivables and trade and other payables is estimated as the present value of future cash flows, discounted at the market rate of interest at the balance sheet date if the effect is material.
Interest-bearing financial assets and liabilities The fair value of interest-bearing assets and liabilities that bear interest at floating rates approximates to their carrying value. The fair value of the fixed interest financial liabilities is determined by discounting future contracted cash flows, using appropriate yield curves, to their net present value.
Forward exchange contracts The fair value of forward foreign exchange contracts is based on their publicly available market price. If this is not available, forward contracts are marked to market based on the current spot rate.

Strategic Report Governance Financial Statements
93 Low & Bonar PLC Annual Report 2013 |
20. Financial assets, liabilities, derivatives and financial risk management (continued)Funding and liquidity The Group’s committed borrowing facilities at 30 November 2013 totalled €175.0m (£145.5m) (2012: €175.0m (£142.0m)), comprising:• a €130m unsecured multicurrency revolving credit facility with a syndicate of five of its key relationship banks, committed until February
2015, which bears interest at between 1.40% to 2.40% above LIBOR depending on the ratio of the Group’s net debt to EBITDA at each of its half-year and year-end reporting dates; and
• a €45m senior loan note raised by private placement with Pricoa Capital Group Limited; this funding is unsecured and is scheduled for repayment in September 2016, and bears interest at a fixed rate of 5.90% per annum for the term of the loan.
Negotiations to refinance the €130m unsecured multicurrency revolving credit facility, which expires in February 2015, are underway with a selected group of current and potential relationship banks. Discussions to date have been positive and the Group expects these to reach a successful conclusion prior to the announcement of its May 2014 interim results.
The Group’s objectives when managing capital are:• to safeguard the Group’s ability to continue as a going concern, so that it can continue to provide returns for shareholders and benefits for
other stakeholders; and• to provide an adequate return to shareholders commensurate with the level of risk.
The Group sets the amount of capital in proportion to risk. The Group manages its capital structure and makes changes in the light of changes in economic conditions and risk characteristics of the underlying assets. In order to maintain or adjust the capital structure, the Group may adjust the amount of dividends paid to shareholders, return capital to shareholders, issue new shares or sell assets to reduce debt. There were no changes in the Group’s approach to capital management during the year. Neither the Company nor any of its subsidiaries are subject to externally imposed capital requirements.
The Group’s capital structure is as follows:Group
2013 2012£m £m
Net debt 86.8 82.6Total equity 193.1 157.9
279.9 240.5
Analysis of cash and cash equivalentsGroup Company
2013 2012 2013 2012£m £m £m £m
Sterling (0.4) 0.3 – –Euro 7.3 19.0 – 3.8US Dollar 5.5 5.0 – –Other 5.5 2.6 – –
17.9 26.9 – 3.8
Analysis of interest-bearing borrowingsGroup Company
2013 2012 2013 2012£m £m £m £m
Borrowings falling due within one year or on demandBank loans and overdrafts – – 4.6 0.8
– – 4.6 0.8
Borrowings falling due after more than one yearBank loans and overdrafts 67.2 72.9 51.0 72.95.9% €45m Senior Note due 2016 37.1 36.2 37.1 36.2Other borrowings– Preference shares 0.4 0.4 0.4 0.4
104.7 109.5 88.5 109.5
All of the Company’s and Group’s borrowings are unsecured.

94 | Low & Bonar PLC Annual Report 2013
Notes to the Accounts(continued)
20. Financial assets, liabilities, derivatives and financial risk management (continued)The following tables show the undiscounted contracted cash flows and maturities of financial liabilities together with their carrying amounts and average effective interest rates as at the balance sheet date:
Group 2013
Effective Carrying Contractualrate amount cash flows <1 year 1–2 years 2–5 years >5 years
% £m £m £m £m £m £m
Non-derivative financial liabilities:Multicurrency revolving facility– Sterling 2.5 (17.0) (17.5) (0.4) (17.1) – –– Euro 2.2 (40.7) (41.8) (0.9) (40.9) – –– US Dollar 2.2 (9.8) (10.1) (0.2) (9.9) – –5.9% €45m Senior Note due 2016 5.9 (37.4) (43.6) (2.2) (2.2) (39.2) –Bank overdrafts– Sterling – – – – – –– Euro – – – – – –– Other – – – – – –Preference shares 5.8 (0.4) (0.4) – – – (0.4)Prepaid arrangement fees 0.6 – – – – –
(104.7) (113.4) (3.7) (70.1) (39.2) (0.4)Trade and other payables (90.2) (90.2) (88.3) (1.9) – –Derivative financial liabilities:Forward exchange contracts used for hedging– Outflow (0.1) (0.1) (0.1) – – –
(195.0) (203.7) (92.1) (72.0) (39.2) (0.4)
Group 2012
Effective Carrying Contractualrate amount cash flows <1 year 1–2 years 2–5 years >5 years
% £m £m £m £m £m £m
Non-derivative financial liabilities:Multicurrency revolving facility– Sterling 2.4 (23.5) (25.3) (0.6) (0.6) (24.1) –– Euro 2.0 (40.2) (42.8) (0.8) (0.8) (41.2) –– US Dollar 2.1 (10.0) (10.7) (0.2) (0.2) (10.3) –5.9% €45m Senior Note due 2016 5.9 (36.5) (46.9) (2.2) (2.2) (42.5) –Bank overdrafts– Sterling – – – – – –– Euro – – – – – –– Other – – – – – –Preference shares 5.8 (0.4) (0.4) – – – (0.4)Prepaid arrangement fees 1.1 – – – – –
(109.5) (126.1) (3.8) (3.8) (118.1) (0.4)Trade and other payables (84.2) (84.2) (82.4) (1.8) – –Derivative financial liabilities:Forward exchange contracts used for hedging– Outflow – – – – – –
(193.7) (210.3) (86.2) (5.6) (118.1) (0.4)

Strategic Report Governance Financial Statements
95 Low & Bonar PLC Annual Report 2013 |
20. Financial assets, liabilities, derivatives and financial risk management (continued)
Company 2013
Effective Carrying Contractualrate amount cash flows <1 year 1-2 years 2-5 years >5 years
% £m £m £m £m £m £m
Non-derivative financial liabilities:Multicurrency revolving facility– Sterling 2.5 (17.0) (17.5) (0.4) (17.1) – –– Euro 2.2 (24.5) (25.1) (0.5) (24.6) – –– US Dollar 2.2 (9.8) (10.1) (0.2) (9.9) – –5.9% €45m Senior Note due 2016 5.9 (37.4) (43.6) (2.2) (2.2) (39.2) –Bank overdrafts– Sterling 3.0 (0.6) (0.6) (0.6) – – –– Euro 1.3 (3.7) (3.7) (3.7) – – –– Other 1.6 (0.3) (0.3) (0.3) – – –Preference shares 5.8 (0.4) (0.4) – – – (0.4)Prepaid arrangement fees 0.6 – – – – –
(93.1) (101.3) (7.9) (53.8) (39.2) (0.4)Trade and other payables (17.6) (17.6) (17.6) – – –Derivative financial liabilities:Forward exchange contracts used for hedging– Outflow – – – – – –
(110.7) (118.9) (25.5) (53.8) (39.2) (0.4)
Company 2012
Effective Carrying Contractualrate amount cash flows <1 year 1-2 years 2-5 years >5 years
% £m £m £m £m £m £m
Non-derivative financial liabilities:Multicurrency revolving facility– Sterling 2.4 (23.5) (25.3) (0.6) (0.6) (24.1) –– Euro 2.0 (40.2) (42.8) (0.8) (0.8) (41.2) –– US Dollar 2.1 (10.0) (10.7) (0.2) (0.2) (10.3) –5.9% €45m Senior Note due 2016 5.9 (36.5) (46.9) (2.2) (2.2) (42.5) –Bank overdrafts– Sterling 2.8 (0.7) (0.7) (0.7) – – –– Euro – – – – – –– Other 2.5 (0.1) (0.1) (0.1) – – –Preference shares 5.8 (0.4) (0.4) – – – (0.4)Prepaid arrangement fees 1.1 – – – – –
(110.3) (126.9) (4.6) (3.8) (118.1) (0.4)Trade and other payables (17.5) (17.5) (17.5) – – –Derivative financial liabilities:Forward exchange contracts used for hedging– Outflow – – – – – –
(127.8) (144.4) (22.1) (3.8) (118.1) (0.4)
At 30 November 2013 and 30 November 2012, the Group’s committed borrowing facilities comprised a multi-currency revolving credit facility of €130m, expiring in February 2015, and a €45m Senior Note falling due in September 2016.

96 | Low & Bonar PLC Annual Report 2013
Notes to the Accounts(continued)
20. Financial assets, liabilities, derivatives and financial risk management (continued)Foreign exchange risk(a) TranslationalThe Group has significant net assets based outside of the UK, predominantly in the Eurozone and the USA, with further amounts held in the Czech Republic, Hungary, Middle East and China. The Group has elected to use its direct currency borrowings under the private placement and its €130m multicurrency revolving facility as hedges against movements in the Sterling value of its Euro and US Dollar investments. Profit before tax, amortisation and non-recurring items for the year ended 30 November 2012 retranslated using 2013 average exchange rates would have been £0.9m higher.
(b) TransactionalThe Company and Group have limited transactional currency exposures, arising on sales and purchases made in currencies other than the functional currency of the entity making the sale or purchase. Significant exposures which are deemed at least highly probable are matched where possible, and the remaining transactional risk is mitigated using forward foreign exchange contracts, all of which mature within one year of the balance sheet date.
The following tables show the derivative assets/(liabilities) recognised in the accounts in respect of these hedging instruments:
Carrying and fair value amount 2013
DesignatedNotional Designated as net Notcontract as cash flow investment designated Derivative Derivativeamount hedges hedges as hedges assets liabilities
£m £m £m £m £m £m
Forward exchange contracts 3.3 – – – – (0.1)
Carrying and fair value amount 2012
DesignatedNotional Designated as net Notcontract as cash flow investment designated Derivative Derivativeamount hedges hedges as hedges assets liabilities
£m £m £m £m £m £m
Forward exchange contracts 4.4 – – – – –
The gains and losses on ineffective portions of such derivatives are recognised immediately in the income statement. During the year to 30 November 2013, an amount of £nil (2012: £nil) was recognised due to hedge ineffectiveness. The amount recognised in equity in the year in respect of hedges was a loss of £0.1m (2012: gain of £1.3m).
Forward exchange contractsThe Group had the following forward foreign exchange contracts in place at the balance sheet date, all of which mature within one year of the balance sheet date:
2013 2012
Average AverageCurrency exchange Currency exchange
million rate million rate
Sterling/Euro 1.1 1.17 1.8 1.22Euro/US Dollar 0.1 1.38 0.6 1.30Euro/Hungarian Forint 814.0 296.1 906.9 282.17
The Company had the following forward foreign exchange contracts in place at the balance sheet date:
2013 2012
Average AverageCurrency exchange Currency exchange
million rate million rate
Sterling/Euro – – – –
The following significant exchange rates applied during the year:Average
rateAverage
rateYear end
rateYear end
rate2013 2012 2013 2012
Sterling/Euro 1.18 1.23 1.20 1.23Sterling/US Dollar 1.56 1.59 1.64 1.60Sterling/Czech Crown 30.52 30.93 32.94 31.13Sterling/Hungarian Forint 350.83 356.69 362.54 346.51Sterling/Chinese Yuan 9.61 10.011 9.98 9.979
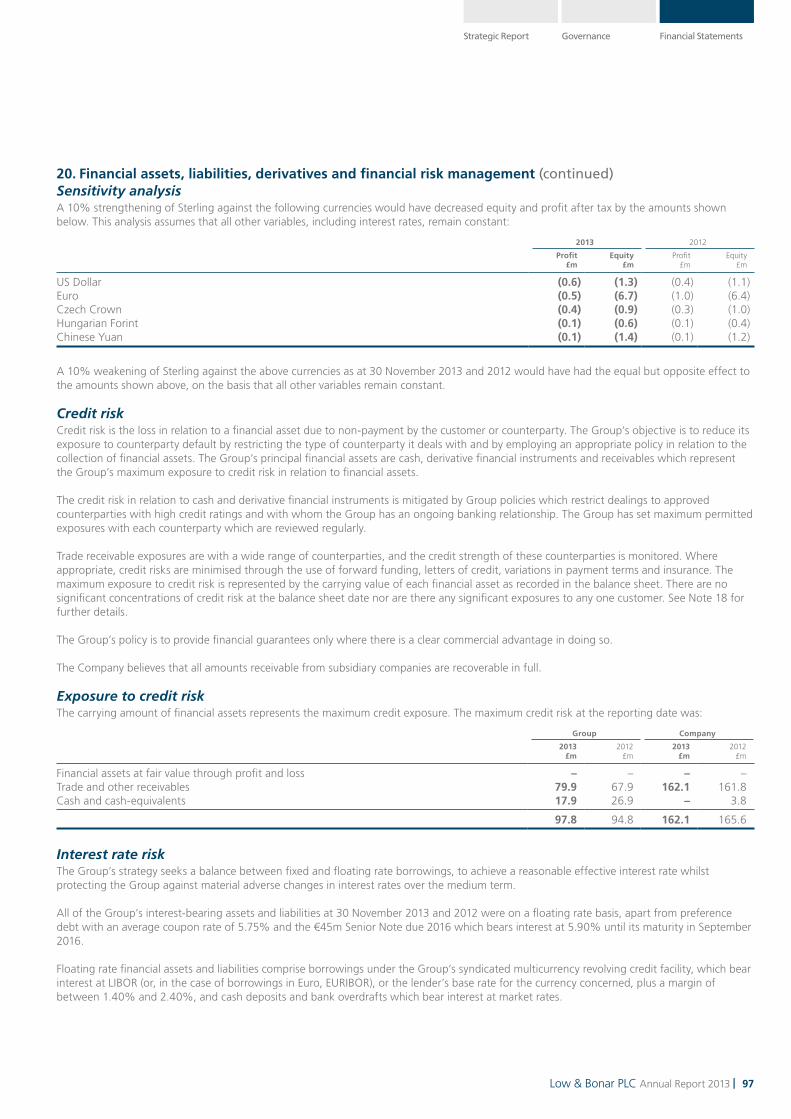
Strategic Report Governance Financial Statements
97 Low & Bonar PLC Annual Report 2013 |
20. Financial assets, liabilities, derivatives and financial risk management (continued)Sensitivity analysisA 10% strengthening of Sterling against the following currencies would have decreased equity and profit after tax by the amounts shown below. This analysis assumes that all other variables, including interest rates, remain constant:
2013 2012
Profit Equity Profit Equity£m £m £m £m
US Dollar (0.6) (1.3) (0.4) (1.1)Euro (0.5) (6.7) (1.0) (6.4)Czech Crown (0.4) (0.9) (0.3) (1.0)Hungarian Forint (0.1) (0.6) (0.1) (0.4)Chinese Yuan (0.1) (1.4) (0.1) (1.2)
A 10% weakening of Sterling against the above currencies as at 30 November 2013 and 2012 would have had the equal but opposite effect to the amounts shown above, on the basis that all other variables remain constant.
Credit riskCredit risk is the loss in relation to a financial asset due to non-payment by the customer or counterparty. The Group’s objective is to reduce its exposure to counterparty default by restricting the type of counterparty it deals with and by employing an appropriate policy in relation to the collection of financial assets. The Group’s principal financial assets are cash, derivative financial instruments and receivables which represent the Group’s maximum exposure to credit risk in relation to financial assets.
The credit risk in relation to cash and derivative financial instruments is mitigated by Group policies which restrict dealings to approved counterparties with high credit ratings and with whom the Group has an ongoing banking relationship. The Group has set maximum permitted exposures with each counterparty which are reviewed regularly.
Trade receivable exposures are with a wide range of counterparties, and the credit strength of these counterparties is monitored. Where appropriate, credit risks are minimised through the use of forward funding, letters of credit, variations in payment terms and insurance. The maximum exposure to credit risk is represented by the carrying value of each financial asset as recorded in the balance sheet. There are no significant concentrations of credit risk at the balance sheet date nor are there any significant exposures to any one customer. See Note 18 for further details.
The Group’s policy is to provide financial guarantees only where there is a clear commercial advantage in doing so.
The Company believes that all amounts receivable from subsidiary companies are recoverable in full.
Exposure to credit riskThe carrying amount of financial assets represents the maximum credit exposure. The maximum credit risk at the reporting date was:
Group Company
2013 2012 2013 2012£m £m £m £m
Financial assets at fair value through profit and loss – – – –Trade and other receivables 79.9 67.9 162.1 161.8Cash and cash-equivalents 17.9 26.9 – 3.8
97.8 94.8 162.1 165.6
Interest rate riskThe Group’s strategy seeks a balance between fixed and floating rate borrowings, to achieve a reasonable effective interest rate whilst protecting the Group against material adverse changes in interest rates over the medium term.
All of the Group’s interest-bearing assets and liabilities at 30 November 2013 and 2012 were on a floating rate basis, apart from preference debt with an average coupon rate of 5.75% and the €45m Senior Note due 2016 which bears interest at 5.90% until its maturity in September 2016.
Floating rate financial assets and liabilities comprise borrowings under the Group’s syndicated multicurrency revolving credit facility, which bear interest at LIBOR (or, in the case of borrowings in Euro, EURIBOR), or the lender’s base rate for the currency concerned, plus a margin of between 1.40% and 2.40%, and cash deposits and bank overdrafts which bear interest at market rates.

98 | Low & Bonar PLC Annual Report 2013
Notes to the Accounts(continued)
20. Financial assets, liabilities, derivatives and financial risk management (continued)ProfileAt the balance sheet date, the interest rate profile of the Group’s and Company’s interest-bearing net debt and financial instruments was:
Group Company
2013 2012 2013 2012£m £m £m £m
Fixed rateNet debt (37.5) (36.6) (37.5) (36.6)Financial instruments – – – –
Total fixed rate (37.5) (36.6) (37.5) (36.6)
Floating rateNet debt (49.3) (46.0) (55.6) (69.9)Financial instruments (0.1) – – –
Total floating rate (49.4) (46.0) (55.6) (69.9)
Total interest-bearing net debt and financial instruments (86.9) (82.6) (93.1) (106.5)
Sensitivity analysisA change of 100 basis points in interest rates would have increased or decreased equity by £0.8m (2012: £0.7m). The impact on the profit or loss for the period would have been to increase or decrease profit by £0.8m (2012: £0.7m). This analysis assumes that all other variables, in particular foreign currency rates, remain constant.
21. Deferred taxationGroupRecognised deferred tax assets and liabilities:
2013 2012
Net assets/ Net assets/Assets Liabilities (liabilities) Assets Liabilities (liabilities)
£m £m £m £m £m £m
Intangible assets – (7.7) (7.7) – (8.8) (8.8)Retirement benefit liabilities 1.5 – 1.5 1.7 – 1.7Accelerated tax depreciation – (13.7) (13.7) – (14.0) (14.0)Other 1.6 (1.8) (0.2) 1.6 (0.7) 0.9
Tax assets/(liabilities) 3.1 (23.2) (20.1) 3.3 (23.5) (20.2)
Unrecognised deferred tax assets:
2013 2012£m £m
Tax losses 27.9 30.1Retirement benefit liabilities 0.8 4.5Employee share schemes 0.6 1.0Accelerated tax depreciation 0.9 1.0
30.2 36.6
Tax losses include an amount of £7.6m (2012: £8.8m) in respect of capital losses. The tax losses have no expiry date.
Movement in deferred tax during the year ended 30 November 2013:
Recognisedin Other Arising on
Balance Comprehensive Recognised acquisitions Exchange Balance1 Dec 2012 Income in income (Note 24) adjustments 30 Nov 2013
£m £m £m £m £m £m
Intangible assets (8.8) – 1.4 (0.1) (0.2) (7.7)Retirement benefit liabilities 1.7 (0.3) 0.1 – – 1.5Accelerated tax depreciation (14.0) – 0.4 – (0.1) (13.7)Other 0.9 – (0.4) (0.7) – (0.2)
(20.2) (0.3) 1.5 (0.8) (0.3) (20.1)

Strategic Report Governance Financial Statements
99 Low & Bonar PLC Annual Report 2013 |
21. Deferred taxation (continued)GroupMovement in deferred tax during the year ended 30 November 2012:
Recognisedin Other
Balance Comprehensive Recognised in Exchange Balance1 Dec 2011 Income income adjustments 30 Nov 2012
£m £m £m £m £m
Intangible assets (10.9) – 1.5 0.6 (8.8)Retirement benefit liabilities 1.2 0.7 (0.2) – 1.7Accelerated tax depreciation (13.6) – (0.9) 0.5 (14.0)Other 1.0 – (0.2) 0.1 0.9
(22.3) 0.7 0.2 1.2 (20.2)
The Group has recognised deferred tax assets of £3.1m (2012: £3.3m) as the Directors believe it is probable that future taxable profits will be available against which the assets can be utilised as they reverse over the coming years.
The Group has not recognised deferred tax liabilities in respect of investments in subsidiaries as the Group is able to control the timing of the reversal of the timing difference and it is probable that the timing difference will not reverse in the foreseeable future. In the majority of cases, it is likely that sufficient underlying tax credits will be available to offset the tax liability arising and it is not considered practicable to disclose the amount of the timing difference in respect of the deferred tax liabilities which have not been recognised.
CompanyThe Company has no recognised deferred tax assets or liabilities.
Unrecognised deferred tax assets:2013 2012
£m £m
Tax losses 16.1 18.4Retirement benefit liabilities 0.8 3.5Employee share schemes 0.6 1.2
17.5 23.1
Tax losses include an amount of £5.2m (2012: £5.9m) in respect of capital losses. The tax losses have no expiry date.
There are no timing differences arising in respect of the deferred tax liabilities which have not been recognised.
22. ProvisionsRestructuring
£m
CurrentAt 30 November 2011 0.5Utilised in the year (0.4)Exchange difference –
At 30 November 2012 0.1Utilised in the year (0.1)Exchange difference –
At 30 November 2013 –

100 | Low & Bonar PLC Annual Report 2013
Notes to the Accounts(continued)
23. Other payablesGroup
2013 2012£m £m
Non-currentOther payables 1.9 1.8
Company
2013 2012£m £m
Non-currentAmounts owed to subsidiaries – –
24. Business combinationOn 6 September 2013, the Group acquired Texiplast a.s (“Texiplast”), a Slovakian producer of high strength geosynthetic products serving the civil engineering market, on a cash-free debt-free basis for a cash consideration of €18.9m (£15.9m).
Costs of £0.9m relating to the acquisition have been charged to non-recurring items. Results of the acquired business are included within the results of the Bonar segment.
The acquired business contributed £2.5m to the Group’s consolidated revenue for the period and increased the Group’s consolidated profit before interest, tax, amortisation and non-recurring items for the period by £0.4m. Had the business been owned by the Group for the entire period, the contribution to the Group’s consolidated revenue and consolidated profit before interest, tax, amortisation and non-recurring items would have been £9.0m and £1.3m respectively.
In 2014, the Group expects to spend €1.5m on site clean-up costs and environmental rectification work to ensure that the site meets the Group’s health, safety and environmental standards.
The provisional fair values of the identifiable assets and liabilities acquired are as follows:
Book value Fair value Provisionalat acquisition adjustments fair value
£m £m £m
Intangible assetsMarketing related (Note 12) – 0.3 0.3Customer relationships (Note 12) – 0.4 0.4
Property, plant and equipment (Note 13) 4.7 1.8 6.5Inventories 2.4 (0.3) 2.1Trade and other receivables 2.1 – 2.1Deferred tax liabilities (Note 21) (0.3) (0.5) (0.8)Trade and other payables (0.4) – (0.4)
Net assets acquired 8.5 1.7 10.2
ConsiderationCash consideration 15.9
Fair value of consideration 15.9
Goodwill arising on acquisition 5.7
The customer relationship intangible assets acquired were internally valued at the acquisition date. Goodwill on acquisition reflects synergies arising from extended sales networks and enabling Bonar to develop a stronger solution sell capability for demanding civil engineering applications.
The fair values ascribed to the assets and liabilities above are provisional. Should new information be obtained within one year of the acquisition date about facts and circumstances that existed at the acquisition date which would necessitate adjustments to the above amounts or the recognition of additional liabilities that existed at the acquisition date, then the acquisition accounting will be revised.
On 1 March 2012, the Group acquired the trade and assets of Xero Flor International GmbH (“Xeroflor”), an innovative business with astrong position in the fast growing green roofing market, on a cash-free debt-free basis for a cash consideration of €6.0m (£5.0m). Therehave been no changes to the provisional fair value of the acquired assets and liabilities in the current year.

Strategic Report Governance Financial Statements
101 Low & Bonar PLC Annual Report 2013 |
25. Share capitalGroup and Company 2013 Group and Company 2012
Ordinary Deferred Ordinary DeferredShares Shares Shares Shares
£m £m £m £m
Allotted, called up and fully paidAt 1 December290,914,798 (2012: 287,927,609) Ordinary Shares at 5 pence each 14.6 – 14.4 –154,571,152 Deferred Shares at 20 pence each – 30.9 – 30.9
5,752,808 Ordinary Shares (2012: 2,987,189) issued under share option plans and long-term incentive plan 0.2 – 0.2 –
Shares issued in placing – 29,626,000 Ordinary Shares 1.5 – – –
At 30 November326,293,606 (2012: 290,914,798) Ordinary Shares of 5 pence each 16.3 – 14.6 –154,571,152 Deferred Shares of 20 pence each – 30.9 – 30.9
Capital reorganisationOn 11 March 2009, the Company’s Ordinary Share capital was reorganised by means of a capital reorganisation involving: (i) the subdivision and reclassification of each issued Ordinary Share into one new Ordinary Share of 5 pence and one Deferred Share of 20 pence; and (ii) the subdivision of each authorised but unissued Ordinary Share into five new Ordinary Shares of 5 pence each. On completion of the capital reorganisation, each Ordinary Shareholder held one new Ordinary Share and one Deferred Share for each Ordinary Share previously held.
A Deferred Share: (i) does not entitle its holder to receive any dividend or other distribution; (ii) does not entitle its holder to receive notice of, nor to attend, speak or vote at, any general meeting of the Company; (iii) entitles its holder on a return of capital on a winding-up (but not otherwise) only to the repayment of the amount paid up on that share after payment of (a) the amounts entitled to be paid up to holders of the Preference Shares and (b) the capital paid up on each Ordinary Share of 5 pence in the share capital of the Company and the further payment of £10m on each such Ordinary Share; and, (iv) does not entitle its holder to any further participation in the capital, profits or assets of the Company.
Shares issued during the yearDuring the year ended 30 November 2013, 1,028,822 shares (2012: 627,709 shares) were issued to employees who exercised share options. 4,723,986 shares were issued pursuant to awards made under the LTIP granted in 2010 (2012: 2,359,480). 29,626,000 shares were issued as part of the share placing which took place in September 2013.
Preference SharesGroup and Company
2013 2012£m £m
Allotted, called up and fully paid100,000 (2012: 100,000) 6% first cumulative preference stock of £1.00 each 0.1 0.1100,000 (2012: 100,000) 6% second cumulative preference stock of £1.00 each 0.1 0.1200,000 (2012: 200,000) 5.5% third cumulative preference stock of £1.00 each 0.2 0.2
0.4 0.4
Preference Shares are included within borrowings. Preference Shares have priority over Ordinary Shares on a winding up of the Company. Provided that preference dividends remain paid in accordance with the Company’s Articles of Association, Preference Shares do not carry voting rights.
Potential issues of Ordinary SharesAn element of senior executive remuneration is provided in the form of share options and long-term incentive plan awards. More details of these options and awards can be found in the Directors’ Report on Remuneration on pages 44 to 60. Employees are also invited to participate in the Low & Bonar Sharesave schemes.

102 | Low & Bonar PLC Annual Report 2013
Notes to the Accounts(continued)
25. Share capital (continued)Share optionsUnder the provisions of the employee share option schemes there were options for a total of 3.5 million Ordinary Shares outstanding at 30 November 2013 (2012: 3.6 million Ordinary Shares). The number of options outstanding which were granted in the last financial year was 1.1 million (2012: 0.3 million).
Details of the options included in the IFRS 2 charge are as follows:
Average fairvalue in pence
Exercise pricein pence
Ordinary Shares of 5p each
Year of grant Exercise period 1 Dec 2012 Granted Exercised Forfeited 30 Nov 2013
Share options2004 29.30 91.45 2007 to 2014 53,322 – – – 53,3222006 27.23 108.18 2009 to 2016 442,126 – – – 442,1262007 31.41 101.95 2012 to 2013 5,780 – – (5,780) –2008 19.98 75.73 2013 to 2014 8,594 – (2,578) – 6,0162008 18.31 75.73 2013 to 2014 44,307 – – (32,449) 11,8582009 14.08 32.18 2012 to 2015 119,195 – (2,256) (6,768) 110,1712009 14.07 32.18 2012 to 2015 368,889 – (139,770) (12,424) 216,6952010 13.50 26.00 2013 to 2015 669,162 – (508,880) – 160,2822010 13.50 26.00 2013 to 2015 784,830 – (375,338) – 409,4922011 22.17 42.80 2014 to 2016 119,461 – – (3,373) 116,0882011 22.16 42.80 2014 to 2016 123,187 – – (3,577) 119,6102012 19.61 51.20 2015 to 2017 119,686 – – (33,092) 86,5942012 19.31 51.20 2015 to 2017 146,833 – – (2,936) 143,8972013 18.55 58.80 2016 to 2018 – 347,363 – (25,101) 322,2622013 20.29 58.80 2016 to 2018 – 751,123 – (20,583) 730,540Phantom share options2004 1.95 91.45 2007 to 2014 267,677 – – – 267,6772006 2.93 108.18 2009 to 2016 336,836 – – – 336,836
Total 3,609,885 1,098,486 (1,028,822) (146,083) 3,533,466
The weighted-average exercise price of share options outstanding at 30 November 2013 was 65.13p (2012: 55.97p). The weighted average exercise prices of share options granted, exercised and lapsed in the year to 30 November 2012 were 58.80p, 27.19p and 58.34p, respectively (2012: 51.20p, 33.75p and 32.16p, respectively). 1.1 million share options were exercisable at 30 November 2013 (2012: 1.2 million).
The fair values of share options granted in the year to 30 November 2013 ranged from 17.96p to 26.26p and were derived using the Black-Scholes model (2012: 19.06p to 20.96p and were derived using the Black-Scholes model). The assumed future volatility ranged from 40% to 55% (2012: 54% to 55%), the dividend yield was 3.7% (2012: 3.7%), the expected term ranged from 3.4 years to 5.4 years (2012: 3.4 years to 5.4 years) and the risk-free rate ranged from 0.4% to 1.0% (2012: 0.6% to 1.0%).
The fair values of the phantom share options were recalculated based on data at 30 November 2013 using the Stochastic model. The assumed future volatility ranged from 41% to 42% (2012: 41% to 42%) the dividend yield was 3.7% (2012: 3.7%), the expected term ranged from 1.6 years to 3.4 years (2012: 1.6 years to 3.4 years) and the risk-free rate ranged from 0.3% to 0.4% (2012: 0.3% to 0.4%).
The average share price in the year ended 30 November 2013 was 67.86p (2012: 55.45p).
Long-term incentive plan awards Under the provisions of the long-term incentive plans there were awards for a total of 8.9 million Ordinary Shares outstanding at 30 November 2013 (2012: 11.1 million Ordinary Shares). The number of awards outstanding which were granted in the last financial year was 2.5 million (2012: 3.3 million).
Details of the awards included in the IFRS 2 charge are shown below:
Average fairvalue in pence
Award pricein pence
Ordinary Shares of 5p each
Year of grant Vesting period 1 Dec 2012 Awarded Exercised Forfeited 30 Nov 2013
2009 28.33 35.25 2009 to 2012 – – – – –2009 30.48 35.00 2009 to 2012 – – – – –2010 25.19 33.00 2010 to 2013 4,044,256 – (3,743,986) (35,000) 265,2702010 36.87 45.00 2010 to 2013 980,000 – (980,000) – –2011 41.11 53.50 2011 to 2014 2,845,028 – – – 2,845,0282012 45.40 61.00 2012 to 2015 3,030,194 – – – 3,030,1942012 45.02 62.00 2012 to 2015 229,839 – – – 229,8392013 53.07 70.50 2013 to 2016 – 2,549,496 – – 2,549,496
Total 38.18 49.59 11,129,317 2,549,496 (4,723,986) (35,000) 8,919,827
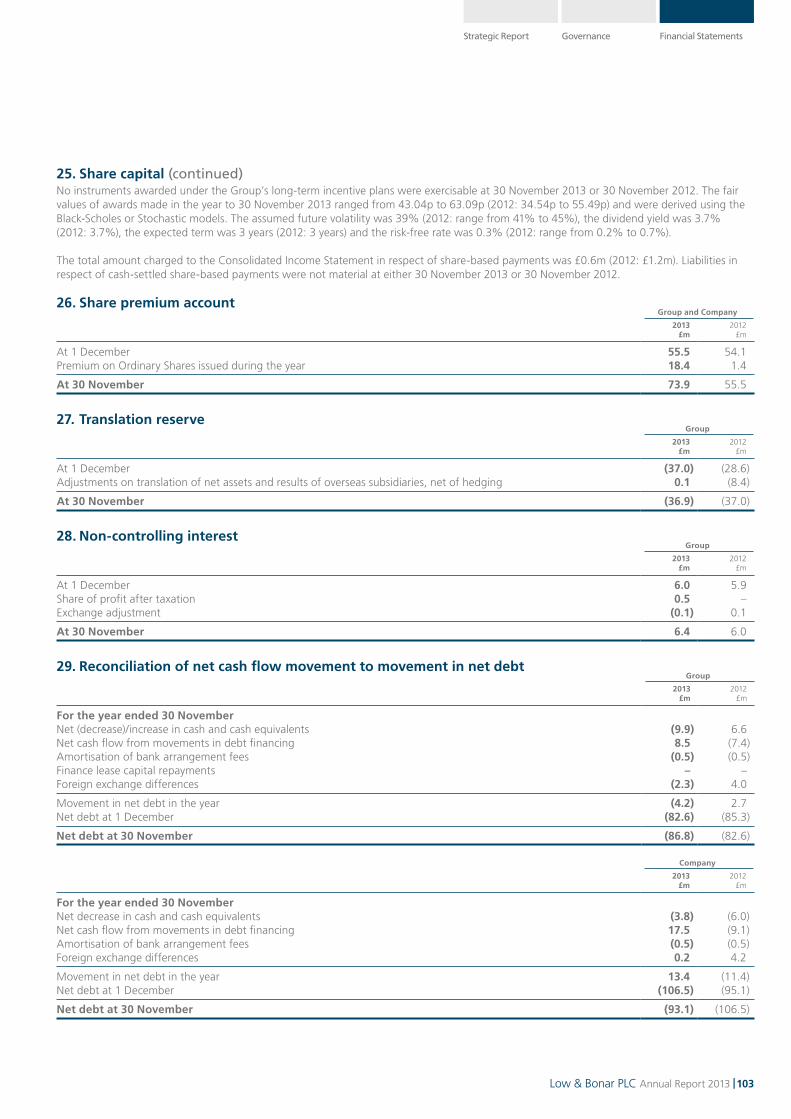
Strategic Report Governance Financial Statements
103 Low & Bonar PLC Annual Report 2013 |
25. Share capital (continued)No instruments awarded under the Group’s long-term incentive plans were exercisable at 30 November 2013 or 30 November 2012. The fair values of awards made in the year to 30 November 2013 ranged from 43.04p to 63.09p (2012: 34.54p to 55.49p) and were derived using the Black-Scholes or Stochastic models. The assumed future volatility was 39% (2012: range from 41% to 45%), the dividend yield was 3.7% (2012: 3.7%), the expected term was 3 years (2012: 3 years) and the risk-free rate was 0.3% (2012: range from 0.2% to 0.7%).
The total amount charged to the Consolidated Income Statement in respect of share-based payments was £0.6m (2012: £1.2m). Liabilities in respect of cash-settled share-based payments were not material at either 30 November 2013 or 30 November 2012.
26. Share premium accountGroup and Company
2013 2012£m £m
At 1 December 55.5 54.1Premium on Ordinary Shares issued during the year 18.4 1.4
At 30 November 73.9 55.5
27. Translation reserveGroup
2013 2012£m £m
At 1 December (37.0) (28.6)Adjustments on translation of net assets and results of overseas subsidiaries, net of hedging 0.1 (8.4)
At 30 November (36.9) (37.0)
28. Non-controlling interestGroup
2013 2012£m £m
At 1 December 6.0 5.9Share of profit after taxation 0.5 –Exchange adjustment (0.1) 0.1
At 30 November 6.4 6.0
29. Reconciliation of net cash flow movement to movement in net debtGroup
2013 2012£m £m
For the year ended 30 NovemberNet (decrease)/increase in cash and cash equivalents (9.9) 6.6Net cash flow from movements in debt financing 8.5 (7.4)Amortisation of bank arrangement fees (0.5) (0.5)Finance lease capital repayments – –Foreign exchange differences (2.3) 4.0
Movement in net debt in the year (4.2) 2.7Net debt at 1 December (82.6) (85.3)
Net debt at 30 November (86.8) (82.6)
Company
2013 2012£m £m
For the year ended 30 NovemberNet decrease in cash and cash equivalents (3.8) (6.0)Net cash flow from movements in debt financing 17.5 (9.1)Amortisation of bank arrangement fees (0.5) (0.5)Foreign exchange differences 0.2 4.2
Movement in net debt in the year 13.4 (11.4)Net debt at 1 December (106.5) (95.1)
Net debt at 30 November (93.1) (106.5)

104 | Low & Bonar PLC Annual Report 2013
Notes to the Accounts(continued)
30. Operating lease commitmentsAt 30 November, the Group had total non-cancellable commitments under operating leases as follows:
Group Company
2013 2012 2013 2012£m £m £m £m
Plant and equipment Lease payments within one year 1.1 1.0 – – Lease payments between one and two years 0.8 0.8 – – Lease payments between two and five years 0.5 0.7 – – Lease payments beyond five years 0.1 0.2 – –
2.5 2.7 – –
Property Lease payments within one year 3.9 3.9 0.1 0.2 Lease payments between one and two years 3.7 3.6 – – Lease payments between two and five years 9.4 10.9 – – Lease payments beyond five years 5.4 10.8 – –
22.4 29.2 0.1 0.2
31. Contingent liabilitiesAt the time of disposing of the Group’s North American packaging operations in March 2000, the Company entered into an Environmental Agreement with the purchasers of the business. The Environmental Agreement contains provisions regarding the remediation of known environmental contamination in the vicinity of one of the facilities which was sold in Burlington, Ontario. The Environmental Agreement expired in September 2006 and the Group has an ongoing liability only in respect of outstanding claims notified prior to this date. At 30 November 2013, an accrual of £nil (2012: £0.1m) remains in the Group’s balance sheet for the ongoing remediation costs as the Directors now believe that all costs have been incurred.
In addition, the Company from time to time guarantees certain obligations of its subsidiaries arising in the normal course of trade. At 30 November 2013, £0.4m of guarantees were outstanding (2012: £1.2m).
32. Related party transactionsAt 30 November 2013, the Group was owed £9.1m (2012: £0.1m) by Bonar Natpet LLC, a joint venture.
At 30 November 2013, the Group was owed £0.3m (2012: £0.2m) by the Low & Bonar Group Retirement Benefit Scheme.
The Company provides debt finance to various operating subsidiaries. A total of £161.8m was outstanding at 30 November 2013 (2012: £161.4m). The Company also borrows surplus funds from its subsidiaries. At 30 November 2013, the total amount payable to subsidiaries was £13.5m (2012: £12.5m). The Company received income in respect of management services provided to its subsidiaries totalling £4.0m (2012: £3.5m). The Company received interest income from related parties totalling £6.5m (2012: £6.5m) and accrued interest payable to related parties of £0.1m (2012: £0.1m). The Company received dividend income from its subsidiaries of £3.4m (2012: £11.6m).
All related party transactions were conducted on an arm’s-length basis.
The remuneration of key personnel (including Directors) of the Group was:2013 2012
£m £m
Short-term benefits 1.7 2.2Post employment benefits 0.3 0.3Share-based payments 1.9 0.8
3.9 3.3
Key personnel comprise two Executive Directors (2012: two), three Business Unit Managing Directors (2012: three) who are directly responsible for the Group’s operating companies and one Director of Marketing and Strategy (2012: one).
The aggregate amount of Directors remuneration was £0.9m (2012:£1.4m) and the aggregate gain made by the Directors on the exercise of share options was £1.7m (2012: £0.2m). The cash paid into defined contribution schemes was £0.1m (2012: £0.1m) and two Directors were members of defined contribution schemes (2012: two). Full details of Directors’ emoluments, pension benefits and interests in the shares of the Company are set out in the Directors’ Report on Remuneration on pages 44 to 60.
As part of the share placing, the Company agreed to place 7,025,000 new ordinary shares with direct and indirect subsidiaries of Cazenove Capital Management and 3,000,000 new ordinary shares with direct and indirect subsidiaries of Axa Framlington Investment Managers, each a substantial shareholder of the Company and a related party of the Company for the purposes of the Listing Rules.

Strategic Report Governance Financial Statements
105 Low & Bonar PLC Annual Report 2013 |
33. Group companies
Subsidiary undertakings Principal product areas Country %
BonarBonar NV Woven and non-woven fabrics Belgium 100.0Yihua Bonar Yarns & Fabrics Co. Ltd Woven fabrics People’s Republic of China 60.0Bonar Limited (trading as ADFIL) Construction fibres England and Wales 100.0Bonar Geosynthetics Kft Non-woven fabrics Hungary 100.0Bonar BV Polymeric mats and composites The Netherlands 100.0Bonar Produktions GmbH Polymeric mats and composites Germany 100.0Bonar GmbH and Co.KG Polymeric mats and composites, and Germany 100.0
holding companyBonar SARL Polymeric mats and composites France 100.0Bonar Inc Polymeric mats and composites USA 100.0Bonar Xeroflor GmbH Green roofs Germany 100.0XF Technologies BV Intellectual property The Netherlands 100.0Texiplast a.s Non-woven fabrics Slovakia 100.0Low & Bonar (Shanghai) Trading Company Limited Woven fabrics People’s Republic of China 100.0
Technical Coated FabricsMehler Texnologies Logistics GmbH Technical coated fabrics Germany 100.0Mehler Texnologies GmbH Technical coated fabrics Germany 100.0Mehler Texnologies S.R.L. Technical coated fabrics Romania 100.0Mehler Texnologies Ltd Technical coated fabrics England and Wales 100.0Mehler Texnologies S.p.A. Technical coated fabrics Italy 100.0Mehler Texnologies SARL Technical coated fabrics France 100.0Mehler Texnologies Inc Technical coated fabrics USA 100.0Mehler Texnologies s.r.o. Technical coated fabrics Czech Republic 100.0Mehler Texnologies Sp. Z o.o. Technical coated fabrics Poland 100.0Mehler Texnologies Teknik Tekstil Limited Sirketi Technical coated fabrics Turkey 100.0Mehler Texnologies s.i.a. Technical coated fabrics Latvia 100.0Mehler Texnologies Middle East General Trading LLC Technical coated fabrics UAE 100.0Low & Bonar Technical Textiles Russia OOO Technical coated fabrics Russia 100.0Mehler Texnologies India Private Limited Technical coated fabrics India 100.0
YarnsBonar Yarns & Fabrics Limited Specialist yarns Scotland 100.0*Bonar Emirates Technical Yarns Industries LLC Specialist yarns United Arab Emirates 49.0Bonar Xirion NV Specialist yarns Belgium 100.0Bonar Technical Yarns Inc Specialist yarns USA 100.0
Holding companiesBonar International Holdings Limited Holding company Scotland 100.0*Bonar International Sarl Holding company Luxembourg 100.0Low & Bonar (Nederland) BV Holding company The Netherlands 100.0LCM Construction Products Ltd Holding company England and Wales 100.0*Low & Bonar Technical Textiles Holding BV Holding company The Netherlands 100.0Colbond Holding BV Holding company The Netherlands 100.0Low & Bonar Verwaltungs GmbH Holding company Germany 100.0Colbond (Nederland) BV Holding company The Netherlands 100.0Bonar Yarns BV Holding company The Netherlands 100.0
Joint venture
Bonar Natpet LLC Geotextiles Saudi Arabia 50.0
Associated undertaking
CPW GmbH Intellectual property Germany 33.3
1 Unless otherwise stated, shares held are ordinary, common or unclassified. 2 The percentage of the nominal value of issued shares held is shown following the name of each company.3 An asterisk* indicates that the percentage of share capital shown is held directly by the Company. 4 A number of subsidiary undertakings, the trading results and assets of which are not material in relation to the Group as a whole, have been omitted from the above list. In
compliance with the Companies Act 2006, particulars of these undertakings will be annexed to the next annual return. 5 The companies listed were incorporated in the country shown against each of them and, with the exception of Bonar International Sarl which operates primarily in England, that
country is also the principal country of operation.

106 | Low & Bonar PLC Annual Report 2013
2013 2012 2011 2010 2009£m £m £m £m £m
RevenueContinuing operations 403.1 380.5 388.7 344.6 304.8Discontinued operations – – – – –
Total (including discontinued operations) 403.1 380.5 388.7 344.6 304.8Operating profit before amortisation and non-recurring itemsContinuing operations 32.2 30.5 30.6 25.8 22.1Discontinued operations – – – – –
Total (including discontinued operations) 32.2 30.5 30.6 25.8 22.1Operating profitContinuing operations 24.5 12.1 30.6 12.0 9.2Discontinued operations – – – – –
Total (including discontinued operations) 24.5 12.1 30.6 12.0 9.2Profit before tax, amortisation and non-recurring itemsContinuing operations 26.1 24.5 23.4 18.6 15.8Discontinued operations – – – – –
Total (including discontinued operations) 26.1 24.5 23.4 18.6 15.8Profit before taxContinuing operations 17.8 6.1 23.4 10.2 0.7Discontinued operations – – 2.2 – 0.4
Total (including discontinued operations) 17.8 6.1 25.6 10.2 1.1Net debt (86.8) (82.6) (85.3) (62.0) (67.4)
Per Ordinary ShareBasic earnings/(loss) per share (including discontinued operations) (pence) 4.08 0.47 7.29 2.19 (0.25)Dividends declared per share (pence) 2.6 2.4 2.1 1.6 0.8
Discontinued operations in 2009 represent the Floors Division (discontinued in 2008) and, in 2011, a non-recurring profit arising from the Group’s Belgian packaging business (discontinued in 1997).
Five Year History
Strategic Report Governance Financial Statements
107 Low & Bonar PLC Annual Report 2013 |
Company SecretaryMatthew Joy
Registered OfficeWhitehall House33 Yeaman ShoreDundeeDD1 4BJ
Head Office10th Floor1 Eversholt StreetLondonNW1 2DN
Telephone: 020 7535 3180Fax: 020 7535 3181Website: www.lowandbonar.com
Registered number: SC008349
Advisers
RegistrarComputershare Investor Services PLCLeven House10 Lochside PlaceEdinburgh ParkEdinburghEH12 9DF
Telephone: 0870 702 0010
AuditorKPMG Audit Plc
SolicitorsFreshfields Bruckhaus Deringer LLPSquire Sanders LLP
Principal bankersThe Royal Bank of Scotland PlcBarclays Bank PLCKBC Bank NVING Bank NVComerica Bank
Corporate finance advisersNM Rothschild & Sons Limited
BrokersNumis Securities Limited
Financial CalendarAnnual General Meeting 25 March 2014
Announcements for results for the yearending 30 November 2014Half year July 2014Full year February 2015
Final dividend payment for the year ended30 November 2013Ordinary Shares 17 April 2014
First, second and third 1 March 2014 andcumulative preference stock 1 September 2014
Advisers and Financial Calendar

108 | Low & Bonar PLC Annual Report 2013
Notes


Low
& B
on
ar PLC A
nn
ual R
epo
rt 2013
Low & Bonar PLC10th Floor, 1 Eversholt Street London NW1 2DN
Telephone: 020 7535 3180Fax: 020 7535 3181Website: www.lowandbonar.com