FULL-YEAR RESULTS 2017 PRESENTATION - Valora · GROUP • EBIT of 79 mCHF ... 15.4% 5.9% 2017...
44
FULL-YEAR RESULTS 2017 PRESENTATION 28 February, 2018 Franz Julen, Chairman Michael Mueller, CEO Tobias Knechtle, CFO
Transcript of FULL-YEAR RESULTS 2017 PRESENTATION - Valora · GROUP • EBIT of 79 mCHF ... 15.4% 5.9% 2017...

FULL-YEAR RESULTS 2017 PRESENTATION 28 February, 2018 Franz Julen, Chairman Michael Mueller, CEO Tobias Knechtle, CFO

Full-Year Results 2017 Presentation, 28 February 2018 Page 2 Page 2
AGENDA
Content Page
Full-Year Results 2017 Financial Review 2017 5
Financial Structure 21
Guidance 26
Strategic Initiatives 28
Next Events 34
Q&A 36
Appendix 37

Full-Year Results 2017 Presentation, 28 February 2018 Page 3 Page 3
KEY HIGHLIGHTS 2017
GROUP
• EBIT of 79 mCHF, in line with guidance
• EBIT adjusted for BackWerk acquisition cost at upper end of guidance
• Medium term profitability goals achieved one year ahead of guidance
FOOD SERVICE
• Strong topline growth in B2B and B2C
• Acquisition of BackWerk and Pretzel Baron as key milestones
• New production line installed, further capacity expansion in Germany and the US announced
RETAIL
• Strong increase in profitability, especially in Switzerland, in absolute and relative terms and also in ROCE
• Various efficiency initiatives bearing fruit
• New concept developments well advanced

Full-Year Results 2017 Presentation, 28 February 2018 Page 4 Page 4
KEY FIGURES 2017
3.8% +0.4%pt
EBIT Margin
79.0 mCHF
+6.8 mCHF
EBIT
42.0% +0.5%pt
GP Margin
8.6% +0.3%pt
ROCE
82.0 mCHF
+9.5 mCHF
FCF
1.7x +0.1x
Leverage Ratio
Full-Year Results 2017 Presentation, 28 February 2018 Page 5
Financial Review 2017

Full-Year Results 2017 Presentation, 28 February 2018 Page 6 Page 6
KEY FINANCIALS 2017
* Including other for corporate
** Margins in % of net revenues
Figures in mCHF
RETAIL GROUP* FOOD
SERVICE
2,242 External Sales: 2,562 316
647
36.2%
Gross Profit 872
GP Margin** 42.0%
222
77.4%
70
3.9%
EBIT 79
EBIT Margin** 3.8%
26
9.1%
31 Capex 53 20
19.8%
33.3% w/o Goodwill
ROCE 8.6%
15.5% w/o Goodwill
5.9% 14.7% w/o Goodwill
Note: BackWerk, included only for two
months in Group and Food Service segment
1,785 Net Revenues: 2,075 287
Full-Year Results 2017 Presentation, 28 February 2018 Page 7 Page 7
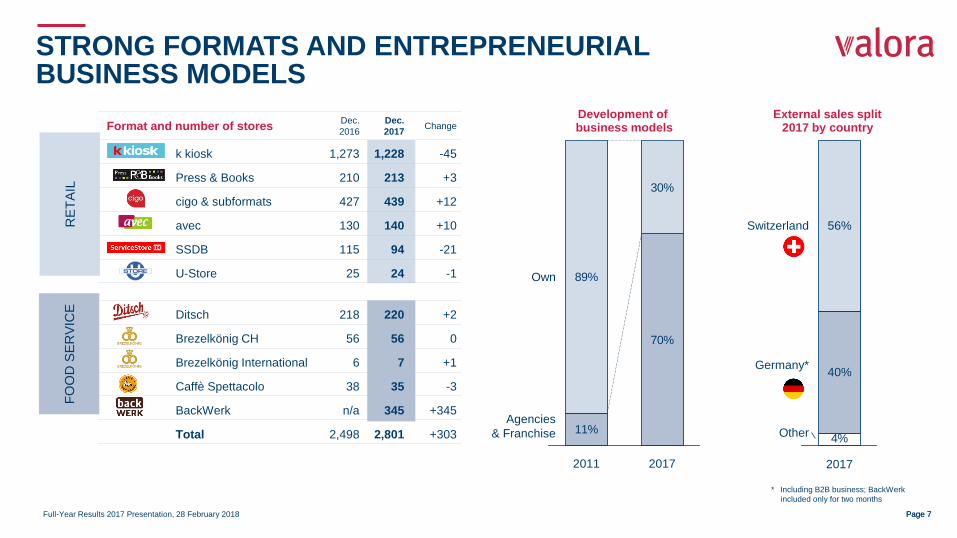
Format and number of stores Dec.
2016
Dec.
2017 Change
k kiosk 1,273 1,228 -45
Press & Books 210 213 +3
cigo & subformats 427 439 +12
avec 130 140 +10
SSDB 115 94 -21
U-Store 25 24 -1
Ditsch 218 220 +2
Brezelkönig CH 56 56 0
Brezelkönig International 6 7 +1
Caffè Spettacolo 38 35 -3
BackWerk n/a 345 +345
Total 2,498 2,801 +303
STRONG FORMATS AND ENTREPRENEURIAL BUSINESS MODELS
RE
TA
IL
FO
OD
SE
RV
ICE
11%
70%
89%
30%
Agencies
& Franchise
Own
2017 2011
4%Other
Germany*
Switzerland
2017
40%
56%
External sales split 2017 by country
* Including B2B business; BackWerk
included only for two months
Development of business models

Full-Year Results 2017 Presentation, 28 February 2018 Page 8
ROCE
0.0%
0.0%
2017
8.6%
+0.3%pt
2016
8.2%
2017
19.8%
+4.4%pt
2016
15.4%
5.9%
2017
-1.1%pt
2016
6.9%
Valora Group
• ROCE increase of +0.3%pt to 8.6%, thanks to strong EBIT development
• ROCE at 9.0%, adjusted for sold Naville building and BackWerk (including acquisition cost)
• ROCE without goodwill at 15.5%
• Capital employed slightly higher at 922 mCHF (+5.1%)
INCREASE OF ROCE TO 8.6% DRIVEN BY STRONG EBIT INCREASE
ROCE calculation basis: EBIT for the last 12 months / average capital employed over the last 13 months; operational cash allocated to Group only (not divisions)
Food Service
• ROCE decrease by -1.1%pt to 5.9% driven by investments in production capacities
• ROCE without goodwill at 14.7%
Retail
• Retail CH/AT: ROCE improvement of +10.0%pt to 27.5%. Adjusted for book gain of sold Naville building, ROCE at 26.4%
• Retail DE/LU: ROCE decrease by -1.2%pt to 10.4% mainly due to higher capital employed (higher capex and NWC)
Retail
Food Service
Valora Group

Full-Year Results 2017 Presentation, 28 February 2018 Page 9 Page 9
NET REVENUES
Valora Group
• Net revenue increase of +0.9%* versus last year
• Net revenue increase driven by Food Service and Retail DE/LU compensating decline in Retail CH/AT
NET REVENUE INCREASE BY +0.9%* VERSUS LAST YEAR
2,075.3
18.3
2016 adj.
2,056.9
-38.0
2016
2,095.0 +0.9%
2017 Naville
Distribution
In mCHF
* Adjusted for sold Naville Distribution

Full-Year Results 2017 Presentation, 28 February 2018 Page 10 Page 10
Division | Country
in mCHFFY 2016 FY 2017 ∆ in % ∆ % in LC
∆ Same
Store in %
Retail 1,833.8 1,785.1 -2.7% -3.2% -
Retail w/o Naville Distribution 1,795.7 1,785.1 -0.6% -1.1% -
CH/AT 1,309.3 1,264.5 -3.4% -3.4% -2.2%
Naville Distribution* 63.2 0.0 -100.0% -100.0% -
DE/LU 486.4 520.7 +7.0% +5.0% +0.1%
Intrasegment elimination -25.2 0.0 n.a. n.a. -
Food Service 259.4 286.7 +10.5% +9.2% +2.3%
Ditsch** 162.8 176.9 +8.7% +6.6% +1.5%
Food Service Switzerland*** 96.5 98.8 +2.3% +2.3% +2.9%
BackWerk 0.0 11.0 n.a. n.a. n.a.
Other 1.9 3.4 n.a. n.a. -
Valora Group 2,095.0 2,075.3 -0.9% -1.6% -
Valora Group w/o Naville Distribution 2,056.9 2,075.3 +0.9% +0.3% -
NET REVENUES STRONG INCREASE IN FOOD SERVICE AND RETAIL DE/LU OVERCOMPENSATING DECLINE IN RETAIL CH/AT
Retail CH/AT
• Net revenue decline (-3.4%) resulting from closure of net 21 POS and SST-Index of -2.2%
Retail DE/LU
• Net revenue increase (+5.0% in LC) attributable to more own stores
• SST sales comparable to last year with +0.1%
• SST development in food (+10.6%), non-food (+7.1%) and tobacco (+2.8%) overcompensating declining press sales (-5.6%)
Food Service
• Net revenues increase (+9.2% in LC) driven by:
Positive SST-Index in Food Service Switzerland (+2.9%)
Positive SST-Index with Ditsch / B2C in Germany (+1.5%)
Strong growth with Ditsch / B2B (+3.7%), despite exchange of production line
BackWerk contributing 2 months in 2017
SST = Same Store; LC = Local Currency
* Naville Distribution deconsolidated in August 2016
** Including Pretzel Baron
*** Including Brezelkönig Switzerland, Brezelkönig International and Caffè Spettacolo

Full-Year Results 2017 Presentation, 28 February 2018 Page 11 Page 11
GROSS PROFIT
Valora Group
• Gross profit increase of +3.0%* versus last year
• Gross profit margin increase to 42.0%, already meeting gross profit margin target for 2018
GROSS PROFIT MARGIN INCREASE OF +0.5%pt TO 42.0%
25.7
2016 adj.
846.5 -23.1
2016
869.7
+3.0%
2017
872.2
42.0.% 41.2% 41.5%
Naville
Distribution
In mCHF; GP margin in %
* Adjusted for sold Naville Distribution
Full-Year Results 2017 Presentation, 28 February 2018 Page 12 Page 12
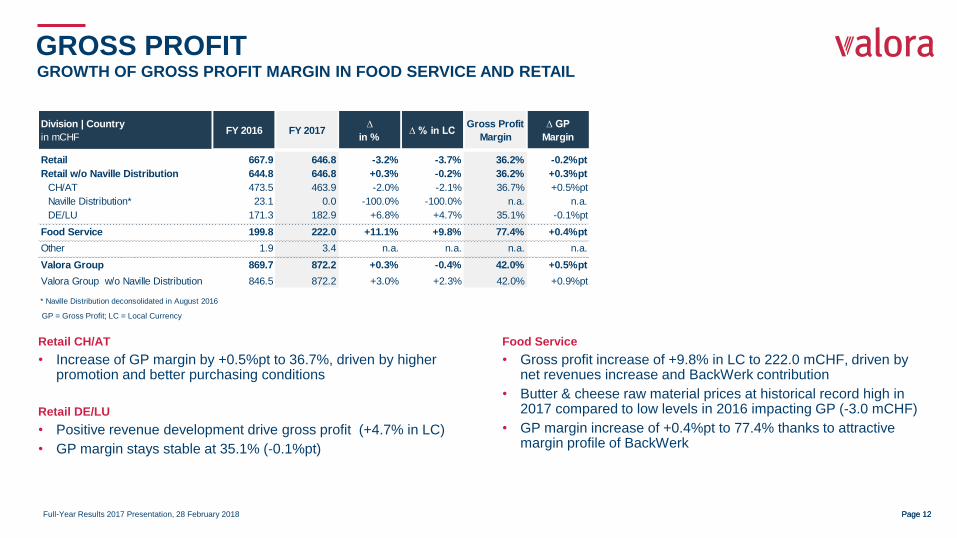
GROSS PROFIT GROWTH OF GROSS PROFIT MARGIN IN FOOD SERVICE AND RETAIL
Retail CH/AT
• Increase of GP margin by +0.5%pt to 36.7%, driven by higher promotion and better purchasing conditions
Retail DE/LU
• Positive revenue development drive gross profit (+4.7% in LC)
• GP margin stays stable at 35.1% (-0.1%pt)
Food Service
• Gross profit increase of +9.8% in LC to 222.0 mCHF, driven by net revenues increase and BackWerk contribution
• Butter & cheese raw material prices at historical record high in 2017 compared to low levels in 2016 impacting GP (-3.0 mCHF)
• GP margin increase of +0.4%pt to 77.4% thanks to attractive margin profile of BackWerk
GP = Gross Profit; LC = Local Currency
Division | Country
in mCHFFY 2016 FY 2017
∆
in %∆ % in LC
Gross Profit
Margin
∆ GP
Margin
Retail 667.9 646.8 -3.2% -3.7% 36.2% -0.2%pt
Retail w/o Naville Distribution 644.8 646.8 +0.3% -0.2% 36.2% +0.3%pt
CH/AT 473.5 463.9 -2.0% -2.1% 36.7% +0.5%pt
Naville Distribution* 23.1 0.0 -100.0% -100.0% n.a. n.a.
DE/LU 171.3 182.9 +6.8% +4.7% 35.1% -0.1%pt
Food Service 199.8 222.0 +11.1% +9.8% 77.4% +0.4%pt
Other 1.9 3.4 n.a. n.a. n.a. n.a.
Valora Group 869.7 872.2 +0.3% -0.4% 42.0% +0.5%pt
Valora Group w/o Naville Distribution 846.5 872.2 +3.0% +2.3% 42.0% +0.9%pt
* Naville Distribution deconsolidated in August 2016

Full-Year Results 2017 Presentation, 28 February 2018 Page 13 Page 13
OPERATING COSTS
Valora Group
• Cost increase of +1.9%* as a consequence of higher food production in Food Service and BackWerk
• Cost ratio increase of -0.4%pt* to -38.2% mainly driven by BackWerk
COST INCREASE OF 1.9%* DRIVEN BY EXPANSION ACTIVITIES IN FOOD SERVICE
2017
+1.9%
793.2
15.1
2016 adj.
778.1 -19.3
2016
797.4
-38.2% -37.8% -38.1%
Naville
Distribution
In mCHF; Cost ratio in %
* Adjusted for sold Naville Distribution

Full-Year Results 2017 Presentation, 28 February 2018 Page 14 Page 14
OPERATING COSTS LOWER COSTS IN RETAIL CH/AT COMPENSATE HIGHER COSTS IN FOOD SERVICE AND RETAIL DE/LU
Division | Country
in mCHFFY 2016 FY 2017
∆
in %∆ % in LC
Cost
Ratio
∆
Cost Ratio
Retail -608.3 -576.7 -5.2% -5.7% -32.3% +0.9%pt
Retail w/o Naville Distribution -589.0 -576.7 -2.1% -2.6% -32.3% +0.5%pt
CH/AT -434.0 -410.2 -5.5% -5.5% -32.4% +0.7%pt
Naville Distribution* -19.3 0.0 -100.0% -100.0% n.a. n.a.
DE/LU -154.9 -166.4 +7.4% +5.4% -32.0% -0.1%pt
Food Service -173.0 -195.8 +13.2% +11.8% -68.3% -1.6%pt
Corporate / Other -16.2 -20.7 +28.1% +28.0% n.a. n.a.
Valora Group -797.4 -793.2 -0.5% -1.2% -38.2% -0.2%pt
Valora Group w/o Naville Distribution -778.1 -793.2 +1.9% +1.3% -38.2% -0.4%pt
* Naville Distribution deconsolidated in August 2016
Food Service
• Higher costs of -22.8 mCHF or +11.8% in LC, mainly as a consequence of higher production volumes and two months of BackWerk
• Special charges for replacement of production line (-1.0 mCHF)
• Integration costs of Pretzel Baron (-0.5 mCHF)
• Increase of cost ratio by -1.6%pt to -68.3% mainly driven by BackWerk
Corporate / Other
• Other operating expenses higher with -4.5 mCHF, mainly due to project costs for the acquisition of BackWerk
Retail CH/AT
• Decrease of costs by +23.8 mCHF to a cost ratio of -32.4% (+0.7%pt)
• Improved efficiency initiatives and processes and lower number of stores (personnel & op. expenses)
• Book gain of sold Naville building of +2.9 mCHF
Retail DE/LU
• Higher costs of -11.5 mCHF (+5.4% in LC) mainly as result of higher number of own stores and increase of minimum wages in Germany
• However, cost ratio stable at -32.0% (-0.1%pt)
LC = Local Currency

Full-Year Results 2017 Presentation, 28 February 2018 Page 15 Page 15
EBIT
Valora Group
• EBIT reaches 79 mCHF with an increase of +15.5%* or +10.6* mCHF mainly driven by Retail CH/AT
• EBIT margin at 3.8%
• Book gain of sold Naville building (+2.9 mCHF) nearly compensates BackWerk EBIT contribution including acquisition costs (-3.2 mCHF)
• EBIT w/o net effect of BackWerk acquisition (-3.2 mCHF) at the upper end of communicated expectations and EBIT margin at 4.0%
EBIT AT 79 CHF MILLION AND EBIT MARGIN OF 3.8%
+15.5%
2017
79.0
10.6 68.4 -3.8
2016
72.3
2016 adj.
3.8% 3.3% 3.4%
In mCHF; EBIT margin in %
Naville
Distribution * Adjusted for sold Naville Distribution

Full-Year Results 2017 Presentation, 28 February 2018 Page 16 Page 16
EBIT STRONG EBIT AND MARGIN INCREASE
Division | Country
in mCHFFY 2016 FY 2017
∆
in %∆ % in LC
EBIT
Margin
∆ EBIT
margin
Retail 59.6 70.1 +17.5% +16.8% 3.9% +0.7%pt
Retail w/o Naville Distribution 55.8 70.1 +25.6% +24.8% 3.9% +0.8%pt
CH/AT 39.4 53.6 +36.0% +36.0% 4.2% +1.2%pt
Naville Distribution* 3.8 0.0 -100.0% -100.0% n.a. n.a.
DE/LU 16.4 16.5 +0.7% -1.7% 3.2% -0.2%pt
Food Service 26.9 26.2 -2.5% -3.6% 9.1% -1.2%pt
Corporate / Other -14.2 -17.3 n.a. n.a. n.a. n.a.
Valora Group 72.3 79.0 +9.3% +8.3% 3.8% +0.4%pt
Valora Group w/o Distribution 68.4 79.0 +15.5% +14.3% 3.8% +0.5%pt
* Naville Distribution deconsolidated in August 2016
Retail CH/AT
• Strong EBIT increase of +14.2 mCHF or +36.0% to 53.6 mCHF including book gain of sold Naville building of +2.9 mCHF
• Cost efficiency initiatives and improved processes as main driver
• EBIT margin increase of +1.2%pt to 4.2%; w/o book gain at 4.0%
Retail DE/LU
• EBIT stable at 16.5 mCHF (+0.7%)
• EBIT margin at 3.2% slightly lower than last year (-0.2%pt) mainly due to higher costs (increase of min. wages in Germany & more own stores)
Food Service
• EBIT at 26.2 mCHF, lower than last year by -0.7 mCHF as a result of:
One-off cost reimbursement last year (change of -1.0 mCHF)
Record-high prices for butter & cheese (-3.0 mCHF)
Special charges for line replacement (-1.0 mCHF)
Integration costs Pretzel Baron (-0.5 mCHF)
• Without above mentioned special items, EBIT increase by +4.8 mCHF, supported by strong revenue development and BackWerk consolidation since November 2017
Full-Year Results 2017 Presentation, 28 February 2018 Page 17 Page 17
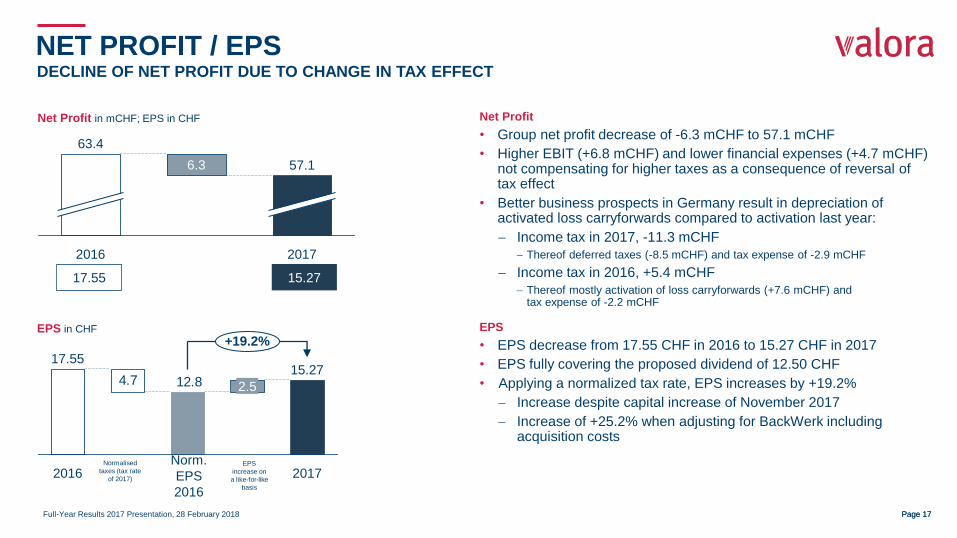
NET PROFIT / EPS DECLINE OF NET PROFIT DUE TO CHANGE IN TAX EFFECT
6.3
2017
57.1
2016
63.4
15.27 17.55
Net Profit in mCHF; EPS in CHF Net Profit
• Group net profit decrease of -6.3 mCHF to 57.1 mCHF
• Higher EBIT (+6.8 mCHF) and lower financial expenses (+4.7 mCHF) not compensating for higher taxes as a consequence of reversal of tax effect
• Better business prospects in Germany result in depreciation of activated loss carryforwards compared to activation last year:
Income tax in 2017, -11.3 mCHF
Thereof deferred taxes (-8.5 mCHF) and tax expense of -2.9 mCHF
Income tax in 2016, +5.4 mCHF
Thereof mostly activation of loss carryforwards (+7.6 mCHF) and tax expense of -2.2 mCHF
EPS
• EPS decrease from 17.55 CHF in 2016 to 15.27 CHF in 2017
• EPS fully covering the proposed dividend of 12.50 CHF
• Applying a normalized tax rate, EPS increases by +19.2%
Increase despite capital increase of November 2017
Increase of +25.2% when adjusting for BackWerk including acquisition costs
12.84.7
2017
+19.2%
2.5
15.27 17.55
2016 Normalised
taxes (tax rate
of 2017)
Norm.
EPS
2016
EPS
increase on
a like-for-like
basis
EPS in CHF
Full-Year Results 2017 Presentation, 28 February 2018 Page 18 Page 18
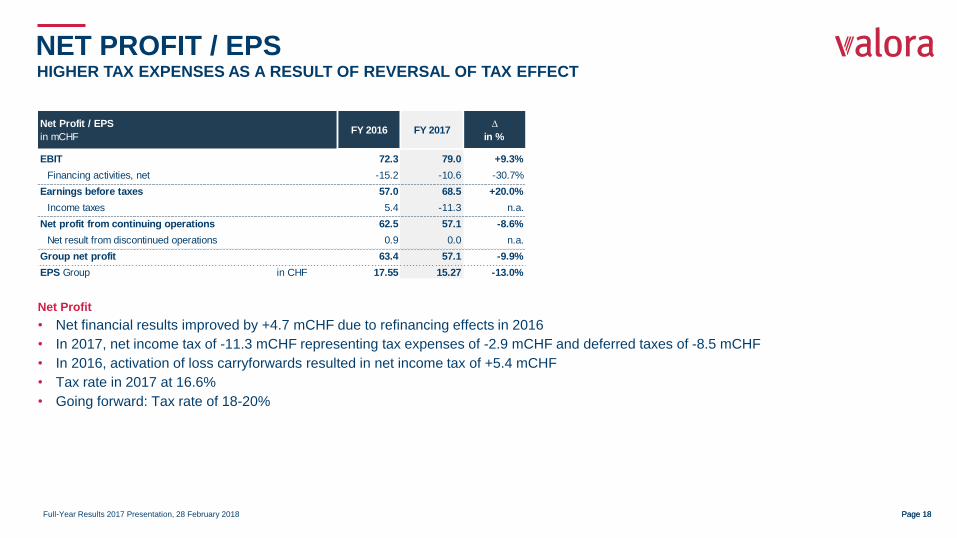
FY 2016 FY 2017∆
in %
EBIT 72.3 79.0 +9.3%
Financing activities, net -15.2 -10.6 -30.7%
Earnings before taxes 57.0 68.5 +20.0%
Income taxes 5.4 -11.3 n.a.
Net profit from continuing operations 62.5 57.1 -8.6%
Net result from discontinued operations 0.9 0.0 n.a.
Group net profit 63.4 57.1 -9.9%
EPS Group in CHF 17.55 15.27 -13.0%
Net Profit / EPS
in mCHF
NET PROFIT / EPS HIGHER TAX EXPENSES AS A RESULT OF REVERSAL OF TAX EFFECT
Net Profit
• Net financial results improved by +4.7 mCHF due to refinancing effects in 2016
• In 2017, net income tax of -11.3 mCHF representing tax expenses of -2.9 mCHF and deferred taxes of -8.5 mCHF
• In 2016, activation of loss carryforwards resulted in net income tax of +5.4 mCHF
• Tax rate in 2017 at 16.6%
• Going forward: Tax rate of 18-20%

Full-Year Results 2017 Presentation, 28 February 2018 Page 19 Page 19
52.7
CAPEX CAPITAL EXPENDITURES DIRECTED TOWARDS GROWTH AND EXPANSION
43%
Retail
Food Service
Corporate
57% Innovation
& Expansion
Maintenance
Valora Group
• Capex of 52.7 mCHF higher than previous year (49.0 mCHF)
Innovation & Expansion
• Investments in innovation and expansion of 29.9 mCHF (57% of total capex)
• Increase of capex by -4.4 mCHF compared to last year (25.5 mCHF) driven by replacement of one production line in Food Service
Maintenance
• Maintenance capex of 22.9 mCHF (43% of total capex)
• Decrease in capex by +0.6mCHF due to lower number of stores in Retail Switzerland (-21)
Capex in mCHF
31.3
20.5
0.9
2017

Full-Year Results 2017 Presentation, 28 February 2018 Page 20 Page 20
FREE CASH FLOW STRONG FREE CASH FLOW GENERATION
Free Cash Flow
• Cash flow increase of +13.0% to 82.0 mCHF supported by EBITDA increase (+6.1 mCHF)
• Higher capex overcompensated by sale of Naville building (20.0 mCHF)
• Change in NWC slightly higher than last year because of expansion activities
• Free cash flow next two years impacted by higher capital expenditures in Food Service
FY 2016 FY 2017∆
in %
EBIT 72.3 79.0 +9.3%
D&A 55.4 54.7 -1.2%
EBITDA 127.6 133.7 +4.8%
Elimination of other non-cash items 7.4 0.8 n.a.
NWC and current assets & liabilities -6.5 -8.4 +30.6%
Interest, tax expense (net) -15.6 -11.9 -23.8%
CF from operating activities 113.0 114.2 +1.1%
CF from investing activities (net) -40.4 -32.1 -20.4%
Capex -46.8 -53.5 +14.3%
Asset disposal 6.4 21.3 n.a.
Free Cash Flow (before M&A) 72.6 82.0 +13.0%
Free Cash Flow per share in CHF 21.74 23.93 +10.1%
Free Cash Flow (from continuing business)
in mCHF

Full-Year Results 2017 Presentation, 28 February 2018 Page 21
Financial Structure

Full-Year Results 2017 Presentation, 28 February 2018 Page 22 Page 22
BALANCE SHEET STRONG EQUITY RATIO AND STABLE NET DEBT DESPITE BACKWERK ACQUISITION
737.9
530.9
+39.0%
2017
207.1
2016
52.4% 45.5%
Shareholder’s equity in mCHF; Equity ratio in %
Shareholder’s equity
• Shareholder’s equity increase of +207.1 mCHF, driven by rights issue (+166 mCHF) in November 2017
• Equity ratio increase to 52.4% well above minimum target of 30%
• Hybrid bond, as part of equity, to be redeemed in October 2018
• Equity ratio at 43.9% w/o hybrid bond
246.144.1202.0
+21.9%
2017 2016
1.7x 1.6x
Net debt in mCHF; Leverage ratio in x (Leverage ratio: EBITDA contribution for BackWerk in 2017 annualised)
Net debt
• Net debt increase by +44.1 mCHF as a result of the BackWerk acquisition and due to currency effects on the Schuldschein issues
• Interest-bearing debt at 398.6 mCHF
• Leverage ratio at 1.7x
• Leverage ratio with hybrid bond treated as debt at 2.5x
• With IFRS 16 (effective as from 2019), net debt increases:
Lease obligations to be treated as liability
Right of use to be activated on balance sheet
Banks adjust the covenants for leverage and equity ratio accordingly

Full-Year Results 2017 Presentation, 28 February 2018 Page 23 Page 23
FY 2016 FY 2017∆
in %
Total assets 1,167.2 1,408.9 +20.7%
Cash, cash equivalents 159.4 152.5 -4.3%
Goodwill and intangible assets 469.0 707.8 +50.9%
Net debt (from continuing operations) 202.0 246.1 +21.9%
Leverage ratio* (excl. Hybrid Bond) 1.6x 1.7x +0.1x
Shareholders' equity (incl. Hybrid Bond) 530.9 737.9 +39.0%
Equity ratio 45.5% 52.4% +6.9%pt
Capital employed (average) 876.8 921.7 +5.1%
ROCE 8.2% 8.6% +0.3%pt
* EBITDA contribution for BackWerk in 2017 annulised
Balance Sheet
in mCHF
BALANCE SHEET STRENGTHENING OF ALL BALANCE SHEET RATIOS
Balance sheet impacts of the BackWerk acquisition
• Assets increase of +242.2 mCHF, driven by:
Goodwill: +160.2 mCHF
Intangibles assets: +58.1 mCHF (purchase price allocation of franchise agreements) resulting in additional amortisation of 5.8 mCHF p.a.
• Increase of interest bearing debt to partially finance BackWerk acquisition
• Equity increase of +207.1 mCHF driven by rights issue in November 2017 (+166 mCHF)

Full-Year Results 2017 Presentation, 28 February 2018 Page 24 Page 24
CURRENT FINANCIAL STRUCTURE
0
50
100
150
200
250
300
350
400
2023 or later 2022 2021 2020 2019 2018
in mCHF
Debt maturity profile after 2018 refinancing
Planned new
CHF-Debt
~150
CFA 40
SSD I: 90*
(78 mEUR)
CFA 160 SSD III: 196*
(170 mEUR)
* At current FX (27/02/2018): 1 EUR = 1.15 CHF
SSD II: 83*
(72 mEUR)
EUR Maturity
SSD I: 78 30-04-2019
SSD II: 72 29-04-2021
SSD III: 170 11-01-2023
CHF Maturity
CHF-Debt: ~150 2023 +
CFA I: 40 (unused) 27-06-2019
Financing strategy
• Well diversified set of debt instruments in terms of maturities, currencies and investors
• New EUR-Debt «Schuldscheindarlehen» (SSD) of 170 mEUR completed in January 2018 with a maturity of 5 years and attractive interest rates
• Straight bond of 200 mCHF due in March 2018 refinanced by rights issue and newly issued SSD III
• New to-be-issued CHF-Debt of ~150 mCHF (planned for Q2/Q3 2018) to refinance hybrid bond due in October 2018
• Target to stay < 2.5x EBITDA leverage ratio
Maintain strategic flexibility
Account for seasonality and NWC fluctuations
• Further acquisition financing secured by undrawn syndicated loan (CFA) and cash on balance sheet
CFA II: 160 (unused) 29-06-2020
Hybrid
Bond**
SSD = Schuldschein issue; CFA = Credit Facility Agreement
** First call date per 30-10-2018 (thereafter 500bps step-up)
Full-Year Results 2017 Presentation, 28 February 2018 Page 25 Page 25
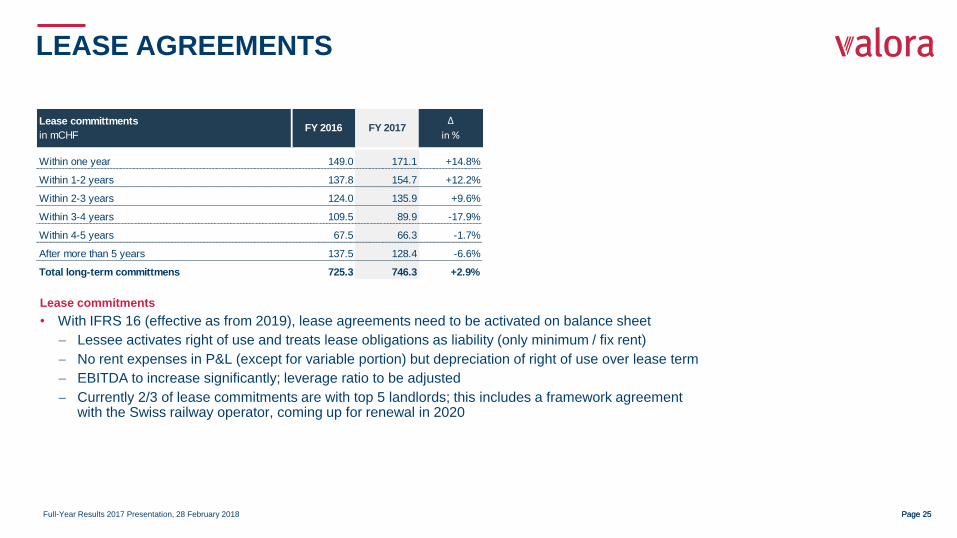
Lease committments
in mCHF
Within one year 149.0 171.1 +14.8%
Within 1-2 years 137.8 154.7 +12.2%
Within 2-3 years 124.0 135.9 +9.6%
Within 3-4 years 109.5 89.9 -17.9%
Within 4-5 years 67.5 66.3 -1.7%
After more than 5 years 137.5 128.4 -6.6%
Total long-term committmens 725.3 746.3 +2.9%
FY 2016 FY 2017∆
in %
LEASE AGREEMENTS
Lease commitments
• With IFRS 16 (effective as from 2019), lease agreements need to be activated on balance sheet
Lessee activates right of use and treats lease obligations as liability (only minimum / fix rent)
No rent expenses in P&L (except for variable portion) but depreciation of right of use over lease term
EBITDA to increase significantly; leverage ratio to be adjusted
Currently 2/3 of lease commitments are with top 5 landlords; this includes a framework agreement with the Swiss railway operator, coming up for renewal in 2020

Full-Year Results 2017 Presentation, 28 February 2018 Page 26
Guidance
Full-Year Results 2017 Presentation, 28 February 2018 Page 27 Page 27
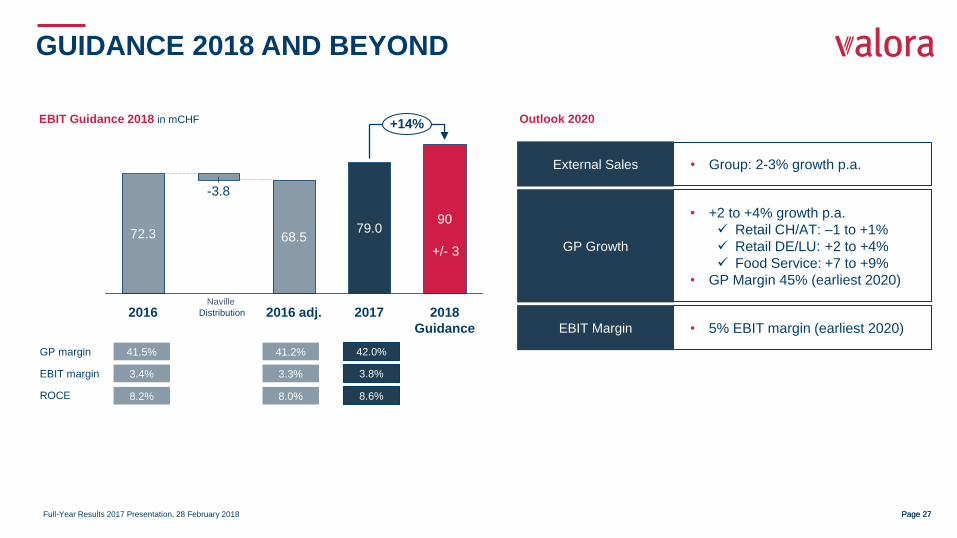
GUIDANCE 2018 AND BEYOND
EBIT Guidance 2018 in mCHF
Naville
Distribution
72.3
+14%
2018
Guidance
-3.8
68.5
90
2017 2016 2016 adj.
79.0
GP margin
EBIT margin
ROCE
41.5%
3.4%
8.2%
41.2%
3.3%
8.0%
42.0%
3.8%
8.6%
+/- 3
• Group: 2-3% growth p.a. External Sales
• +2 to +4% growth p.a.
Retail CH/AT: –1 to +1%
Retail DE/LU: +2 to +4%
Food Service: +7 to +9%
• GP Margin 45% (earliest 2020)
GP Growth
• 5% EBIT margin (earliest 2020) EBIT Margin
Outlook 2020

Full-Year Results 2017 Presentation, 28 February 2018 Page 28
Strategic Initiatives
Full-Year Results 2017 Presentation, 28 February 2018 Page 29 Page 29
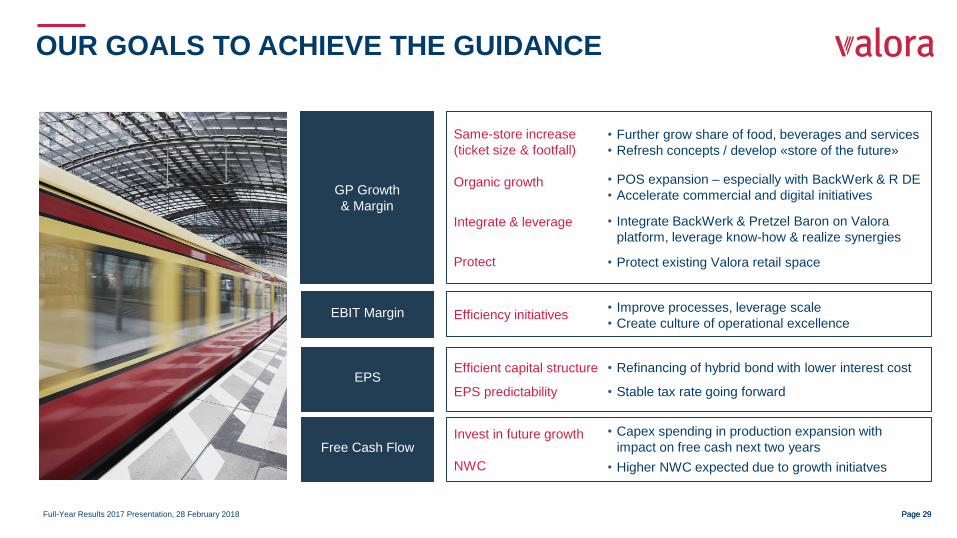
OUR GOALS TO ACHIEVE THE GUIDANCE
• Further grow share of food, beverages and services
• Refresh concepts / develop «store of the future»
• POS expansion – especially with BackWerk & R DE
• Accelerate commercial and digital initiatives
• Integrate BackWerk & Pretzel Baron on Valora
platform, leverage know-how & realize synergies
• Protect existing Valora retail space
• Refinancing of hybrid bond with lower interest cost
• Stable tax rate going forward
• Capex spending in production expansion with
impact on free cash next two years
• Higher NWC expected due to growth initiatves
Same-store increase
(ticket size & footfall)
Organic growth
Integrate & leverage
Protect
GP Growth
& Margin
EPS Efficient capital structure
EPS predictability
Free Cash Flow Invest in future growth
NWC
EBIT Margin Efficiency initiatives • Improve processes, leverage scale
• Create culture of operational excellence

Full-Year Results 2017 Presentation, 28 February 2018 Page 30 Page 30
MARKET DYNAMICS
VALORA BENEFITS FROM POSITIVE MACRO-TRENDS
• Increasing commuting: Work-related travel with public transport stimulates consumption at high-traffic locations
• Transport hubs as convenience destinations: Increased importance of transport hubs for daily convenience shopping
• Economic development: More people with need and willingness to pay for convenience
• Out-of-home consumption: Urbanisation with more people living in vicinity of snacking and food «on-the-go» offering
• Single households: Increased number of single-households with more out-of-home consumption
• Consumer lifestyle: Changing consumer lifestyle, people more «on-the-move»
• Digitalisation in retail: Several opportunities to use technology to improve customer experience
• New services: Opportunities to introduce new services at the POS
• Loyalty: Traditional customer loyalty moves online
• Retail analytics: IT-based automatisation of processes (shelf and inventory monitoring / management)
Mobility
CH
AN
GIN
G C
US
TO
ME
R B
EH
AV
IOU
R
DIG
ITA
LIS
AT
ION
Convenience Digitalisation
Full-Year Results 2017 Presentation, 28 February 2018 Page 31
Purchasing conditions
& promotions
Process improvements
Leverage international platform
Realize cost synergies
Incre
ase p
rofita
bili
ty
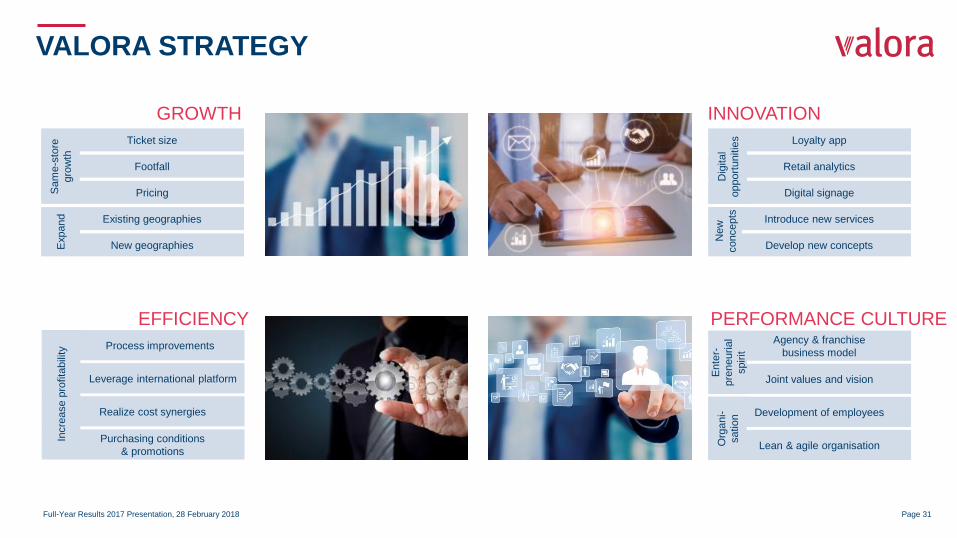
VALORA STRATEGY
GROWTH
PERFORMANCE CULTURE EFFICIENCY
INNOVATION
Ticket size
Pricing
Footfall
Sam
e-s
tore
gro
wth
Existing geographies
New geographies Expand
Introduce new services
Develop new concepts
New
concepts
Digital signage
Loyalty app
Retail analytics
Dig
ital
opport
unitie
s
Agency & franchise
business model
Joint values and vision
Ente
r-
pre
neurial
spirit
Lean & agile organisation
Development of employees
Org
ani-
satio
n

Full-Year Results 2017 Presentation, 28 February 2018 Page 32
ENLARGED «FOOD» AS NEW DRIVER
Food Service as growth and profitability driver
• Value chain ownership of vertical integrated pretzel production and B2C network
• Invest in capacity expansion to meet strong B2B growth
• Expand in existing and new geographies with proven franchise model (higher «foodprint»)
• Leverage on mega-trends of convenience and of out-of-home consumption with a large array of concepts
Retail with strong backbone of POS network at high-frequency locations
• Expand food & beverage offering to compensate for declining press
• Increase share of fresh food offerings
• Change of product mix within categories to improve margins
• Tobacco still a strong and profit-contributing category; strengthen competence and partnership with industry to introduce new products
• Leverage network of attractive locations with new services and cross-selling
MAINTAINING PROFIT-CONTRIBUTION FROM TOBACCO
External Sales Split Gross Profit Split
23%
2017
46%
35%
12%
2011
47%
22%
11%10%
8% 5%
12%
2017
22%
52%
2011
22%
36%
23%
4% 3%
4% 4%
* *
Tobacco
Food
Press
Services
Non-Food
Tobacco
Food
Press
Services Non-Food
Note: Only Retail Core (Retail CH/AT and Retail DE/LU) and Food Service (as of
2012) included, no Trade or Services division included
* BackWerk in 2017 annualized
Full-Year Results 2017 Presentation, 28 February 2018 Page 33 Page 33
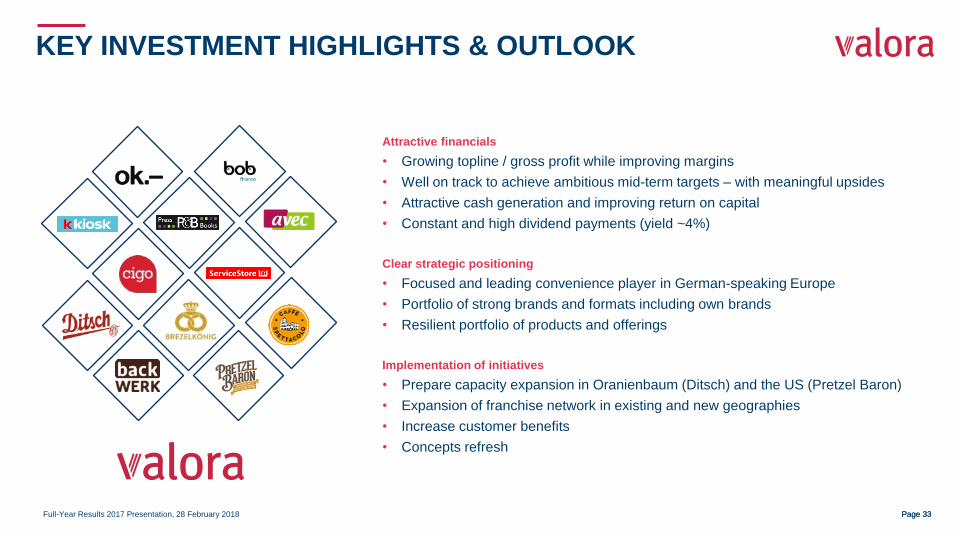
KEY INVESTMENT HIGHLIGHTS & OUTLOOK
Attractive financials
• Growing topline / gross profit while improving margins
• Well on track to achieve ambitious mid-term targets – with meaningful upsides
• Attractive cash generation and improving return on capital
• Constant and high dividend payments (yield ~4%)
Clear strategic positioning
• Focused and leading convenience player in German-speaking Europe
• Portfolio of strong brands and formats including own brands
• Resilient portfolio of products and offerings
Implementation of initiatives
• Prepare capacity expansion in Oranienbaum (Ditsch) and the US (Pretzel Baron)
• Expansion of franchise network in existing and new geographies
• Increase customer benefits
• Concepts refresh

Full-Year Results 2017 Presentation, 28 February 2018 Page 34
NEXT EVENTS Next Events
Full-Year Results 2017 Presentation, 28 February 2018 Page 35 Page 35
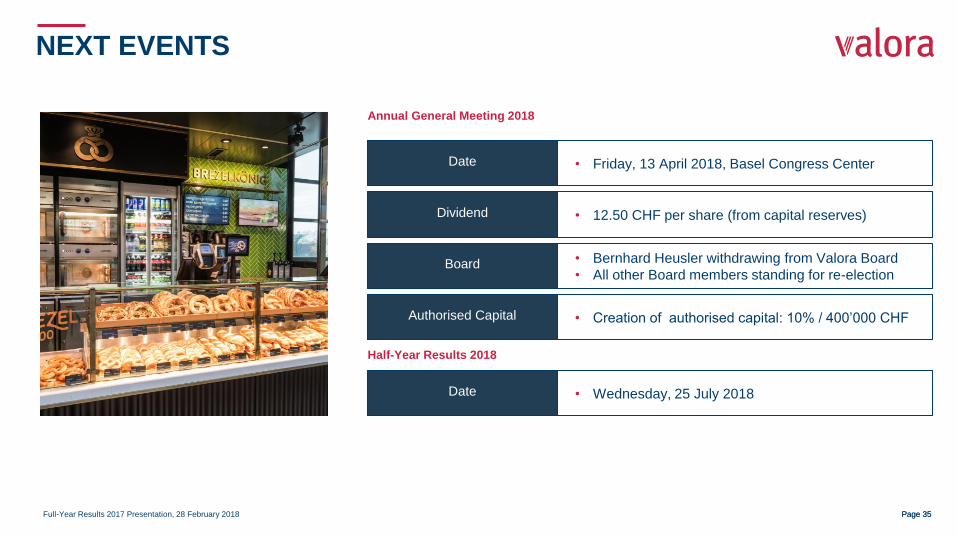
NEXT EVENTS
• Friday, 13 April 2018, Basel Congress Center Date
Annual General Meeting 2018
Half-Year Results 2018
• 12.50 CHF per share (from capital reserves) Dividend
• Bernhard Heusler withdrawing from Valora Board
• All other Board members standing for re-election Board
• Wednesday, 25 July 2018 Date
• Creation of authorised capital: 10% / 400’000 CHF Authorised Capital

Q&A Q&A

APPENDIX - DETAILS DIVISIONS

Full-Year Results 2017 Presentation, 28 February 2018 Page 38 Page 38
Retail CH/AT
in mCHFFY 2016 FY 2017 ∆ in %
External sales 1,384.1 1,340.6 -3.1%
Net revenues 1,309.3 1,264.5 -3.4%
Gross Profit 473.5 463.9 -2.0%
Gross Profit Margin (in %) 36.2% 36.7% +0.5%pt
EBIT 39.4 53.6 +36.0%
EBIT Margin (in %) 3.0% 4.2% +1.2%pt
ROCE (in %) 17.5% 27.5% 10.0%
RETAIL SWITZERLAND
Format Own Agency Franchise Total
264 660 - 924
7 24 - 31
62 - 74 136
AT 10 - - 10
Total (vs. 2016) 343 (-31) 684 (+4) 74 (+6) 1,101 (-21)
• Further strengthen own brands
• avec refresh roll-out
• Improve price perception to influence customer frequency and overall satisfaction
• Introduce central logistic platform as basis for growth and innovation in fresh foods
• Increase efficiency with digitalisation of processes and tools
• Innovation and testing of new concepts and modules
• Further develop competence for fresh food across all brands
• New CEO Retail CH/AT Roger Vogt started in January 2018
• Implement and live corporate values within organisation and towards customers
Network (as per Dec. 2017)
Gro
wth
Ef
fici
ency
In
no
vati
on
C
ult
ure
Key Financials Initiatives 2018
CH = Switzerland; AT = Austria

Full-Year Results 2017 Presentation, 28 February 2018 Page 39 Page 39
RETAIL GERMANY
• Increase same-store growth with tobacco, food and services as main driver to compensate
declining market development in press
• Focus on roll-out of avec to strengthen competence as convenience player
• Continue to transfer partner* business model into own or franchise stores
• Different cost efficiency initiatives introduced and planned
• Introduce & finalise SAP implementation in LU and start SAP implementation in Retail DE
• Further strengthen and promote own branded products e.g. Caffè Spettacolo, ok.-, avec
• Continue roll-out of e-smoke with increased competence and assortment
• Further develop (sales) management
• Implement and live corporate values within organisation and towards customers
Network (as per Dec. 2017)
Gro
wth
Ef
fici
ency
In
no
vati
on
C
ult
ure
Format Own Agency Franchise Partner* Total
99 - 139 - 238
133 - 267 39 439
64 - 58 - 122
167 5 (LU) - - 172
LU - 66 - - 66
Total (vs. 2016) 463 (+29) 71(+5) 464 (-11) 39 (-44) 1,037 (-21)
+ sub formats
* Partner: Business model without Valora branding and 100% purchase obligations; orders on one’s own account
Key Financials Initiatives 2018
DE = Germany; LU = Luxembourg
Retail DE&LU
in mCHFFY 2016 FY 2017 ∆ in %
External sales 890.3 901.3 +1.2%
Net revenues 486.4 520.7 +7.0%
Gross Profit 171.3 182.9 +6.8%
Gross Profit Margin (in %) 35.2% 35.1% -0.1%pt
EBIT 16.4 16.5 +0.7%
EBIT Margin (in %) 3.4% 3.2% -0.2%pt
ROCE (in %) 11.5% 10.4% -1.2%pt

Full-Year Results 2017 Presentation, 28 February 2018 Page 40 Page 40
FOOD SERVICE
Key Financials
• Focus on sustainable POS expansion in existing markets with Ditsch and Brezelkönig CH
• Prepare capacity expansion in Oranienbaum (Ditsch) and in Cincinnati/US (Pretzel Baron)
• BackWerk: Expand network in existing countries and spur expansion/introduction in CH
• Introduce & maintain price increases in B2C & B2B to mitigate raw material price increases
• Expedite international franchise expansion of Brezelkönig; first franchise store with SSP in
Austria; drive further partnerships with institutional franchisees; stores in France to close
• Further optimize supply chain processes
• Build-out logistic hub Food-Service Switzerland (combined for Spettacolo and Brezelkönig)
• Create strong centre of competence for coffee (cross-units/divisions)
• Further pursue digital innovation initiatives
• Further strengthen modern leadership style, along corporate values
Initiatives 2018
Gro
wth
Ef
fi-
cien
cy
Inn
o-
vati
on
C
ult
ure
Format Own Agency Franchise Total
- 220 - 220
2 CH 6 International 54 1 International 63
33 2 (LU)* - 35
3 342 345
Total (vs. 2016) 44 (-6) 276 (+8) 343 (+343) 663 (+345)
Network (as per Dec. 2017)
* Part of Retail DE/LU reporting
Food Service
in mCHFFY 2016 FY 2017 ∆ in %
External sales 259.4 316.3 +22.0%
Net revenues 259.4 286.7 +10.5%
Gross Profit 199.8 222.0 +11.1%
Gross Profit Margin (in %) 77.0% 77.4% +0.4%pt
EBIT 26.9 26.2 -2.5%
EBIT Margin (in %) 10.4% 9.1% -1.2%pt
ROCE (in %) 6.9% 5.9% -1.1%pt
CH = Switzerland; DE = Germany; LU = Luxembourg
Full-Year Results 2017 Presentation, 28 February 2018 Page 41 Page 41
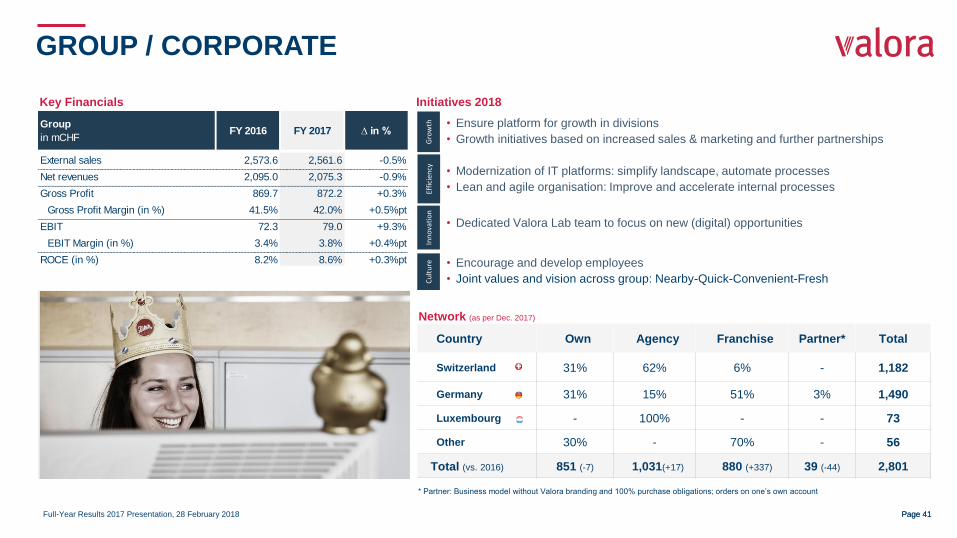
GROUP / CORPORATE
• Ensure platform for growth in divisions
• Growth initiatives based on increased sales & marketing and further partnerships
• Modernization of IT platforms: simplify landscape, automate processes
• Lean and agile organisation: Improve and accelerate internal processes
• Dedicated Valora Lab team to focus on new (digital) opportunities
• Encourage and develop employees
• Joint values and vision across group: Nearby-Quick-Convenient-Fresh
Gro
wth
Ef
fici
ency
In
no
vati
on
C
ult
ure
Country Own Agency Franchise Partner* Total
Switzerland 31% 62% 6% - 1,182
Germany 31% 15% 51% 3% 1,490
Luxembourg - 100% - - 73
Other 30% - 70% - 56
Total (vs. 2016) 851 (-7) 1,031(+17) 880 (+337) 39 (-44) 2,801
* Partner: Business model without Valora branding and 100% purchase obligations; orders on one’s own account
Network (as per Dec. 2017)
Key Financials Initiatives 2018
Group
in mCHFFY 2016 FY 2017 ∆ in %
External sales 2,573.6 2,561.6 -0.5%
Net revenues 2,095.0 2,075.3 -0.9%
Gross Profit 869.7 872.2 +0.3%
Gross Profit Margin (in %) 41.5% 42.0% +0.5%pt
EBIT 72.3 79.0 +9.3%
EBIT Margin (in %) 3.4% 3.8% +0.4%pt
ROCE (in %) 8.2% 8.6% +0.3%pt

Full-Year Results 2017 Presentation, 28 February 2018 Page 42 Page 42
FROM AN OWN STORES SALES NETWORK TO AN AGENCY & FRANCHISE MODEL
Own stores Agency Franchise
Operations Valora Agent Franchisee
Inventory Valora Valora Franchisee
Lease agreement Valora Valora Valora
Store investment Valora Valora
Fee None Valora pays
commission to agent
Valora receives
franchise fee
# number of stores 2017*
(vs. last year) 851 (-7); 31% 1,031 (+17); 37% 880 (+337); 32%
Valora (R DE)
Franchisee (BW)
*Without partner (#39) R = Retail; DE = Germany; BW = BackWerk
1,182 36
2
73
3
15
1,490
70% of network already operated as agencies or by franchisees Strong presence in German-Speaking Europe

Brightens up your journey.

Full-Year Results 2017 Presentation, 28 February 2018 Page 44 Page 44
NOT FOR RELEASE, PUBLICATION OR DISTRIBUTION IN OR INTO THE UNITED STATES
THIS DOCUMENT IS NOT BEING ISSUED IN THE UNITED STATES OF AMERICA AND SHOULD NOT BE DISTRIBUTED TO U.S. PERSONS OR PUBLICATIONS WITH A GENERAL CIRCULATION IN THE UNITED STATES. THIS DOCUMENT DOES NOT CONSTITUTE AN OFFER OR INVITATION TO SUBSCRIBE FOR OR PURCHASE ANY SECURITIES. IN ADDITION, THE SECURITIES OF VALORA HOLDING AG HAVE NOT BEEN REGISTERED UNDER THE UNITED STATES SECURITIES LAWS AND MAY NOT BE OFFERED, SOLD OR DELIVERED WITHIN THE UNITED STATES OR TO U.S. PERSONS ABSENT REGISTRATION UNDER OR AN APPLICABLE EXEMPTION FROM THE REGISTRATION REQUIREMENTS OF THE UNITED STATES SECURITIES LAWS
THIS DOCUMENT CONTAINS SPECIFIC FORWARD-LOOKING STATEMENTS, E.G. STATEMENTS INCLUDING TERMS LIKE “BELIEVE”, “EXPECT” OR SIMILAR EXPRESSIONS. SUCH FORWARD-LOOKING STATEMENTS ARE SUBJECT TO KNOWN AND UNKNOWN RISKS, UNCERTAINTIES AND OTHER FACTORS WHICH MAY RESULT IN A SUBSTANTIAL DIVERGENCE BETWEEN THE ACTUAL RESULTS, FINANCIAL SITUATION, DEVELOPMENT OR PERFORMANCE OF VALORA AND THOSE EXPLICITLY PRESUMED IN THESE STATEMENTS. AGAINST THE BACKGROUND OF THESE UNCERTAINTIES READERS SHOULD NOT RELY ON FORWARD-LOOKING STATEMENTS. VALORA ASSUMES NO RESPONSIBILITY TO UPDATE FORWARD-LOOKING STATEMENTS OR ADAPT THEM TO FUTURE EVENTS OR DEVELOPMENTS.
DISCLAIMER