FTE Holding GmbH
54
FTE Holding GmbH Financial results for the six months ended June 30, 2016 August 19, 2016
Transcript of FTE Holding GmbH

FTE Holding GmbH Financial results for the six months ended June 30, 2016 August 19, 2016

2
Contents
1. Presentation of financial and other information .............................................. 3
2. Consolidated Income Statement Consolidated Statement of EBITDA Consolidated Statement of Cash Flows ......................................................... 6
3. Consolidated Statement of Balance Sheet ................................................... 22
4. Capitalization, liquidity and other financial data ............................................ 25
5. Changes in material debt instruments .......................................................... 29
6. Subsequent events and material changes to risk factors ............................. 29
7. Summary of significant accounting policies .................................................. 30
8. Interim Consolidated Financial Statements as of June 30, 2016 of FTE Holding GmbH .................................................. 42
3
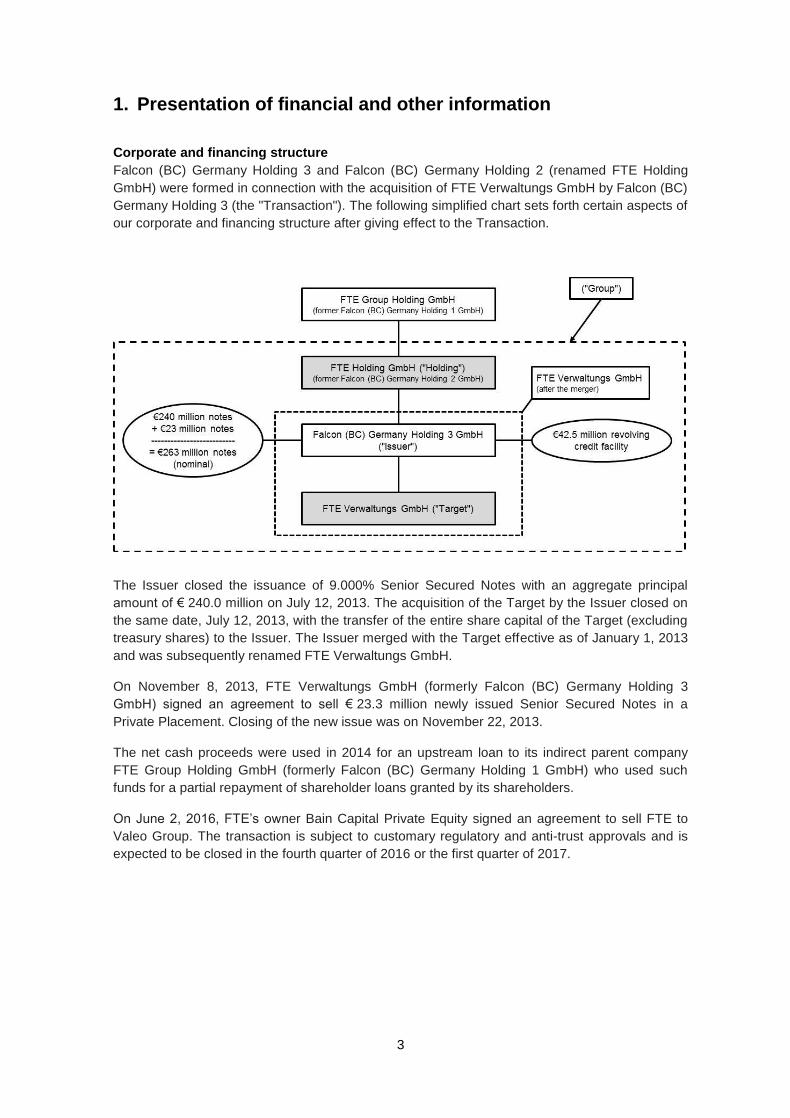
1. Presentation of financial and other information Corporate and financing structure
Falcon (BC) Germany Holding 3 and Falcon (BC) Germany Holding 2 (renamed FTE Holding
GmbH) were formed in connection with the acquisition of FTE Verwaltungs GmbH by Falcon (BC)
Germany Holding 3 (the "Transaction"). The following simplified chart sets forth certain aspects of
our corporate and financing structure after giving effect to the Transaction.
The Issuer closed the issuance of 9.000% Senior Secured Notes with an aggregate principal
amount of € 240.0 million on July 12, 2013. The acquisition of the Target by the Issuer closed on
the same date, July 12, 2013, with the transfer of the entire share capital of the Target (excluding
treasury shares) to the Issuer. The Issuer merged with the Target effective as of January 1, 2013
and was subsequently renamed FTE Verwaltungs GmbH.
On November 8, 2013, FTE Verwaltungs GmbH (formerly Falcon (BC) Germany Holding 3
GmbH) signed an agreement to sell € 23.3 million newly issued Senior Secured Notes in a
Private Placement. Closing of the new issue was on November 22, 2013.
The net cash proceeds were used in 2014 for an upstream loan to its indirect parent company
FTE Group Holding GmbH (formerly Falcon (BC) Germany Holding 1 GmbH) who used such
funds for a partial repayment of shareholder loans granted by its shareholders.
On June 2, 2016, FTE’s owner Bain Capital Private Equity signed an agreement to sell FTE to
Valeo Group. The transaction is subject to customary regulatory and anti-trust approvals and is
expected to be closed in the fourth quarter of 2016 or the first quarter of 2017.
4
Financial and operational data
The Holding and the Issuer were formed on February 21, 2013; opening balance sheets for these
entities were created on April 5, 2013 and they were registered on April 9, 2013. These
companies obtained control over the Target within the meaning of IFRS 3 on July 12, 2013.
The Holding prepared IFRS consolidated financial information as of June 30, 2016 and for the
period from January 1, 2016 to June 30, 2016 with comparative data as of December 31, 2015
and for the period from January 1, 2015 to June 30, 2015.
The financial results of the Holding and its subsidiaries are reported on a consolidated basis. This
report contains data that was neither prepared in accordance with IFRS nor any other generally
accepted accounting principles. It is for informational purposes only and does not purport to
represent or to be indicative of the consolidated results of operations or financial position that the
Group would have reported had the transaction and related financing as defined in the Offering
Memorandum been completed as of the dates presented, and should not be taken as
representative of the Group’s future consolidated results of operations or financial position, nor
does it purport to project the Group’s financial position as of any future date or results of
operations for any future period.
The following financial data, among other, is included herein:
the consolidated income statements for the six-month periods and three-month periods
ended June 30, 2016 and June 30, 2015;
the consolidated statements of cash flows for the six-month periods and three-month
periods ended June 30, 2016 and June 30, 2015;
the consolidated statement of balance sheet as of June 30, 2016 and
December 31, 2015.
The financial data as of December 31, 2015 is based on the audited IFRS consolidated financial
statements of the Holding as of December 31, 2015. The financial data for the six-month periods
and three-month periods ended June 30, 2016 and June 30, 2015 is based on the unaudited
financial statements of the Holding for the respective periods in accordance with International
Financial Reporting Standards (IFRS), which are included in section 8 of this report.
Some financial information in this report has been rounded and, as a result, the figures shown as
totals in this report may vary slightly from the exact arithmetic aggregation of the figures that
precede them. Percentage figures have not been calculated on the basis of rounded figures, but
have instead been calculated on the basis of such amounts prior to rounding.
Unless otherwise indicated, all financial information in this report has been prepared on the basis
of IFRS applicable at the relevant date and is presented in million Euro. IFRS differs in certain
material aspects from generally accepted accounting principles in the US.
Other financial measures
Certain financial measures and ratios related thereto in this report, including EBITDA and
Adjusted EBITDA (collectively, the “EBITDA Metrics”), are not specifically defined under IFRS or
any other generally accepted accounting principles. These measures are presented in this report
because we believe that they are among the measures used by management to evaluate the
cash available to us to fund ongoing, long-term obligations and they are frequently used by
securities analysts, high yield investors and other interested parties for valuation purposes or as a
common measure of the ability of issuers to incur and meet debt service obligations. These
measures may not be comparable to other similarly titled measures of other companies and are
not measurements under IFRS or other generally accepted accounting principles, and you should
not consider such items as alternatives to net income (loss), operating income or any other
performance measures derived in accordance with IFRS.
5
We believe that this information, along with comparable IFRS measures, may be useful to
investors because it provides a basis for measuring the operating performance of the periods
presented. These measures are used to manage our business, along with the most directly
comparable IFRS financial measures and to evaluate the operating performance.
The EBITDA Metrics have limitations as analytical tools, and you should not consider them in
isolation or as a substitute for analysis of our results or any performance measures under IFRS
as set forth in our financial statements. Some of these limitations are:
they do not reflect our cash expenditures or future requirements for capital expenditures;
they do not reflect changes in, or cash requirements for, our working capital needs;
they do not reflect the interest expense or cash requirements necessary to service
interest or principal payments on our debt;
they do not reflect any cash income taxes that we may be required to pay;
they are not adjusted for all non-cash income or expense items that are reflected in our
consolidated income statement;
they do not reflect the impact of earnings or charges resulting from certain matters that
we consider not to be indicative of our ongoing operations;
assets are depreciated or amortized over differing estimated useful lives and often have
to be replaced in the future, and these measures do not reflect any cash requirements for
such replacements; and
other companies in our industry may calculate these measures differently than we do,
limiting their usefulness as comparative measures.
Because of these limitations, the EBITDA Metrics should not be considered as measures of
discretionary cash available to us to invest in the growth of our business or as measures of cash
that will be available to us to meet our obligations. You should compensate for these limitations
by relying primarily on our IFRS results and using these non-IFRS measures only supplementary
to evaluate our performance. You are encouraged to evaluate each of the adjustments reflected
in our presentation of the EBITDA Metrics and whether you consider each to be appropriate.
Industry Data
In this report, we may rely on and refer to information regarding our business and the market in
which we operate and compete. We have obtained this information from various third party
sources, including providers of industry data, discussions with our customers and our own
internal estimates. We cannot assure you that any of this information is accurate or correctly
reflects our position in the industry, and none of our internal surveys or information has been
verified by any independent sources. We do not make any representation or warranty as to the
accuracy or completeness of any such information set forth in this report.
Forward looking statements and other qualifications
The following discussion and analysis is based on and should be read in conjunction with our
historical financial information included elsewhere in this annual report. Certain capitalized terms
used herein defined have the meaning set out in the Offering Memorandum relating to the
issuance of € 240.0 million senior secured notes dated July 9, 2013.
The discussion may include forward looking statements, which, although based on assumptions
that we consider reasonable, are subject to risks and uncertainties, which could cause actual
events or conditions to differ materially from those implied herein. You are cautioned not to place
undue reliance on these forward looking statements. These forward looking statements are made
as of the date of this report and are not intended to give any assurance as to future results.

6
2. Consolidated Income Statement
Consolidated Statement of EBITDA
Consolidated Statement of Cash Flows
2.1 Quarterly results from April 1 to June 30, 2016
Consolidated Income Statement
Holding
three months
ended June 30,
three months
ended June 30,
(€ million) 2015 2016 Change % Change
Revenues 134.4 147.9 13.5 10.0%
Cost of sales -107.1 -114.1 -7.0 -6.6%
Gross profit 27.3 33.7 6.4 23.6%
Distribution expenses -4.1 -3.6 0.5 13.0%
Administrative expenses -5.5 -5.5 0.1 1.3%
Research and development expenses -5.6 -7.5 -2.0 -35.4%
Restructuring expenses -0.5 0.0 0.6 >100.0%
Profit from operations 11.6 17.2 5.7 48.9%
Results from associated companies and joint ventures 0.4 0.3 -0.1 -35.5%
Finance income 0.6 1.2 0.6 >100.0%
Finance expenses -6.4 -6.8 -0.4 -5.6%
Finance result -5.4 -5.3 0.1 2.1%
Profit before income taxes 6.1 11.9 5.8 94.0%
Income taxes -2.8 -4.6 -1.8 -64.3%
Deferred taxes 0.9 0.8 -0.1 -10.4%
Net profit 4.3 8.2 3.9 90.5%

7
Revenues
Revenues increased by € 13.5 million, or 10.0%, to € 147.9 million in the three months ended
June 30, 2016 from € 134.4 million in the three months ended June 30, 2015. This increase was
primarily due to higher sales volume of Electric Shift Transmission (EST) and Electric Pump
Transmission (EPT) products in China and Germany.
The following table sets forth our revenues by customer location for the three months ended
June 30, 2015 and 2016:
Holding
three months
ended June 30,
three months
ended June 30,
(€ million) 2015 2016 Change % Change
Revenues (by customer location)
Germany(1) 33.4 44.2 10.7 32.1%
Europe (excluding Germany)(1) 60.6 60.8 0.2 0.3%
Americas 19.6 19.1 -0.5 -2.3%
Asia 19.9 23.1 3.2 16.3%
Rest of world 1.0 0.7 -0.2 -25.2%
Total 134.4 147.9 13.5 10.0%
(1) Figures 2015 have been adjusted for caliper sales-split Europe / Germany.
The following table sets forth our revenues by product categories (to the extent reported so far)
for the three months ended June 30, 2015 and 2016, reflecting our product portfolio changes:
Holding
three months
ended June 30,
three months
ended June 30,
(€ million) 2015 2016 Change % Change
Revenues (by product categories)
Clutch systems 81.6 93.0 11.4 14.0%
Brake systems 33.4 37.0 3.5 10.6%
Other(1) 19.4 17.9 -1.5 -7.7%
Total 134.4 147.9 13.5 10.0%
(1) Other revenues contain primarily spare parts and merchandise including CPx (controlled piston unit) .

8
The following table sets forth our revenues by new product categories for the three months ended
June 30, 2015 and 2016, reflecting our product portfolio changes:
Holding
three months
ended June 30,
three months
ended June 30,
(€ million) 2015 2016 Change % Change
Revenues (by product categories)
BAT(1) 33.4 37.0 3.5 10.6%
thereof brake calipers 13.4 12.9 -0.5 -3.5%
MST(2) 75.6 76.1 0.5 0.7%
EST(3) 16.0 22.3 6.3 39.2%
EPT(4) 0.5 1.9 1.4 >100.0%
Other(5) 8.8 10.5 1.7 19.5%
Total 134.4 147.9 13.5 10.0%
(1) BAT is an acronym for Brake Actuation Technology including brake caliper business. (2) MST is an acronym for Manual Shift Transmission. (3) EST is an acronym for Electric Shift Transmission including CPx (controlled piston unit). (4) EPT is an acronym for Electric Pump Transmission. (5) Other revenues contain primarily spare parts and merchandise.
Germany
Revenues in Germany increased by € 10.7 million, or 32.1%, to € 44.2 million in the three months
ended June 30, 2016 from € 33.4 million in the three months ended June 30, 2015 primarily due
to increased sales volume of EST and EPT products.
Europe (excluding Germany)
Revenues in Europe (excluding Germany) increased by € 0.2 million, or 0.3%, to € 60.8 million in
the three months ended June 30, 2016 from € 60.6 million in the three months ended
June 30, 2015, in line with market growth in manual shift transmission vehicles.
Americas
Revenues in Americas decreased by € 0.5 million, or 2.3%, to € 19.1 million in the three months
ended June 30, 2016 from € 19.6 million in the three months ended June 30, 2015, primarily due
to continuing difficult economical market conditions in Brazil and unfavorable currency effects.
Asia
Revenues in Asia increased by € 3.2 million, or 16.3%, to € 23.1 million in the three months
ended June 30, 2016 from € 19.9 million in the three months ended June 30, 2015 due to
increased sales volume of EST products.

9
Cost of Sales
Cost of sales increased by € 7.0 million, or 6.6%, to € 114.1 million (or 77.2% of revenues) in the
three months ended June 30, 2016 from € 107.1 million (or 79.7% of revenues) in the three
months ended June 30, 2015. The increase was mainly driven by higher sales volume.
Gross Profit
Gross profit increased by € 6.4 million, or 23.6%, to € 33.7 million in the three months ended
June 30, 2016 from € 27.3 million in the three months ended June 30, 2015. Gross profit was
mainly affected by higher sales volume.
Distribution Expenses
Distribution expenses decreased by € 0.5 million, or 13.0%, to € 3.6 million in the three months
ended June 30, 2016 from € 4.1 million in the three months ended June 30, 2015 due to lower
advertising expenses and one-time expenses in the previous year.
Administrative Expenses
Administrative expenses decreased by € 0.1 million, or 1.3%, to € 5.5 million in the three months
ended June 30, 2016 from € 5.5 million in the three months ended June 30, 2015.
Research and Development Expenses
Research and development expenses increased by € 2.0 million, or 35.4%, to € 7.5 million in the
three months ended June 30, 2016 from € 5.6 million in the three months ended
June 30, 2015. This increase was mainly the result of increased depreciation from capitalized
new R&D projects, higher R&D expenses and lower R&D capitalization in 2016.
Restructuring Expenses
Restructuring expenses decreased by 0.5 million in the six months ended June 30, 2016
compared to previous year, primarily comprising for severance expenses in connection with
production relocations in Europe and NAFTA in 2015.
Finance Result
Finance expenses decreased by € 0.1 million to € 5.3 million in the three months ended
June 30, 2016 from € 5.4 million in the three months ended June 30, 2015, primarily as a result of
revaluation of existing intercompany loans caused by currency changes.
Taxes
Tax expenses increased by € 1.9 million to € 3.7 million in the three months ended
June 30, 2016 from € 1.8 million in the three months ended June 30, 2015, mainly as a result of
increased profits.
Net Profit
Net profit increased by € 3.9 million to a profit of € 8.2 million in the three months ended
June 30, 2016 from a profit of € 4.3 million in the three months ended June 30, 2015.
This increase of net profit was mainly driven by higher sales volume and gross profit with lower
restructuring expenses.

10
The following table presents the reconciliation from net profit for the period to Adjusted EBITDA:
Consolidated Statement of EBITDA
Holding
three months
ended June 30,
three months
ended June 30,
(€ million) 2015 2016 Change % Change
Net profit 4.3 8.2 3.9 90.5%
Deferred taxes -0.9 -0.8 0.1 10.4%
Current income taxes 2.8 4.6 1.8 64.3%
Finance result 5.4 5.3 -0.1 -2.1%
Profit from operations 11.6 17.2 5.7 48.9%
Depreciation and amortization 8.7 8.9 0.2 2.0%
EBITDA(1) (14)
20.3 26.1 5.8 28.7%
EBITDA Margin(2) (14)
15.1% 17.7%
Personnel restructuring(3)
0.5 -0.0 -0.6 >-100.0%
Operational excellence projects(4)
0.7 0.4 -0.4 -50.2%
Management reorganization(5)
0.0 0.0 0.0 N/A
Pension interests(6)
0.4 0.4 -0.0 -0.3%
Bank charges(7)
0.1 0.1 0.0 37.5%
Allowances for doubtful accounts and customer insolvency
(8) 0.0 0.0 0.0 N/A
Consumption of revalued inventories(9)
0.1 0.1 -0.0 -1.4%
Integration projects(10)
0.0 0.1 0.1 N/A
Transaction costs(11)
0.6 0.2 -0.4 -63.6%
Non-recurring items(12)
0.3 0.0 -0.3 -100.0%
Adjusted EBITDA(13) (15)
23.0 27.4 4.3 18.9%
Adjusted EBITDA Margin(14) (15)
17.1% 18.5%
(1) EBITDA represents profit from operations (representing net profit for the period before deferred income taxes, current income taxes and finance result) before depreciation, amortization (including impairment losses). (2) EBITDA Margin represents EBITDA divided by revenues. (3) Represents costs relating to severance payments for employees in connection with restructuring our manufacturing capacity, mainly in Europe and NAFTA. (4) Includes consulting fees in connection with the optimization and improvement of several processes such as for supply chain, logistics, human resources and sales and distribution and consulting fees in connection with the Group strategy review. (5) Includes costs related to the reorganization of our management structure and strategy. (6) Represents non-cash accrued interest on defined benefit pension obligations. These items have been included in personnel costs, but are regarded by management as financial in nature. (7) Represents costs related to the collection and factoring of customer receivables, particularly in the aftermarket business. These items are included in administration costs, but are regarded by management as financial in nature. (8) Net sum of the recognition and release of allowances for doubtful accounts and customer insolvency, based on management’s determination of the likelihood of receipt of payment from certain customers. These items are recognized in costs of goods sold and administration costs, but are regarded as non-operational in nature. (9) Represents the part of the PPA 2013 based revaluation of inventories that were sold/consumed and therefore recognized in cost of sales. (10) Represents costs relating to integration of acquisitions. (11) Transaction costs include mainly costs for the acquisition of the Target and new acquisitions. (12) Includes non-recurring impacts in the reported period (e.g. accrual for risk of lawsuits, potential warranty claims) (13) Adjusted EBITDA represents EBITDA as adjusted for certain infrequent charges and nonoperational costs identified, showed in the table above. (14) Adjusted EBITDA Margin represents Adjusted EBITDA divided by revenues.

11
(15) EBITDA, EBITDA Margin, Adjusted EBITDA and Adjusted EBITDA Margin are not specifically defined under IFRS or any other generally accepted accounting principles and you should not consider them as an alternative to net income (loss) or any other performance measures derived in accordance with IFRS. Our management believes that EBITDA, EBITDA Margin, Adjusted EBITDA and Adjusted EBITDA Margin are meaningful for investors because they provide an analysis of our operating results, profitability and ability to service debt and because EBITDA, EBITDA Margin, Adjusted EBITDA and Adjusted EBITDA Margin are used by our management to track our business development, establish operational and strategic targets and make important business decisions. EBITDA, EBITDA Margin, Adjusted EBITDA and Adjusted EBITDA Margin are also measures commonly reported and widely used by analysts, investors and other interested parties in our industry. To facilitate the analysis of our operations, these indicators exclude amortization, impairment and depreciation expenses from operating profit in order to eliminate the impact of general long-term capital investment. Although we are presenting these measures to enhance the understanding of our historical operating performance, EBITDA, EBITDA Margin, Adjusted EBITDA and Adjusted EBITDA Margin should not be considered an alternative to operating profit as indicators of our operating performance, or as alternatives to cash flows from operating activities as measures of our liquidity.
EBITDA, EBITDA Margin
EBITDA increased by € 5.8 million, or 28.7%, to € 26.1 million (or 17.7% of revenues) in the three
months ended June 30, 2016 from € 20.3 million (or 15.1% of revenues) in the three months
ended June 30, 2015. EBITDA increased mainly due to growing sales volume and gross profit
with lower restructuring expenses.
The Adjusted EBITDA increased by € 4.3 million, or 18.9%, to € 27.4 million (or 18.5% of
revenues) in the three months ended June 30, 2016 from € 23.0 million (or 17.1% of revenues) in
the three months ended June 30, 2015 mainly due to higher sales volume and gross profit with
lower restructuring expenses.

12
Consolidated Statement of Cash Flows
Holding
three months
ended June 30,
three months
ended June 30,
(€ million) 2015 2016 Change % Change
Cash Flows from Operating Activities
Profit before income taxes 6.1 11.9 5.8 94.0%
Adjustments for
Depreciation and amortization 8.7 8.9 0.2 2.0%
Finance result 5.8 5.7 -0.1 -2.0%
Other non-cash expenses and income 0.1 -0.3 -0.4 >-100.0%
Total adjustments 14.6 14.3 -0.3 -2.1%
Changes in Working Capital and Other Assets and Liabilities
Trade receivables -9.2 -8.7 0.5 5.0%
Other assets 0.8 -0.3 -1.1 >-100.0%
Inventories 0.1 0.8 0.7 >100.0%
Trade payables 0.3 6.4 6.1 >100.0%
Total change in working capital -8.1 -1.8 6.3 77.5%
Changes in pension provisions -0.4 -0.5 -0.0
-8.3%
Changes in provisions -0.2 -0.2 -0.0 -0.6%
Changes in other liabilities 1.2 2.1 1.0 83.0%
Total change in working capital and other assets and liabilities -7.6 -0.4 7.2
95.3%
Interests paid / received -0.2 -0.2 0.0 15.1%
Income taxes paid / received -2.2 -2.5 -0.4 -17.2%
Net cash flows from operating activities 10.8 23.2 12.3
>100.0%
Cash Flows from Investing Activities
Investments in property, plant and equipment -4.7 -6.1 -1.3
-28.3%
Investments in intangible assets -0.0 -0.2 -0.2 >-100.0%
Proceeds from disposals of tangible and intangible assets 0.1 0.0 -0.0 -64.3%
Investments in development costs -2.6 -1.8 0.8 30.2%
Net cash flows from investing activities -7.3 -8.1 -0.8
-10.5%
13
Holding
three months
ended June 30,
three months
ended June 30,
(€ million) 2015 2016 Change % Change
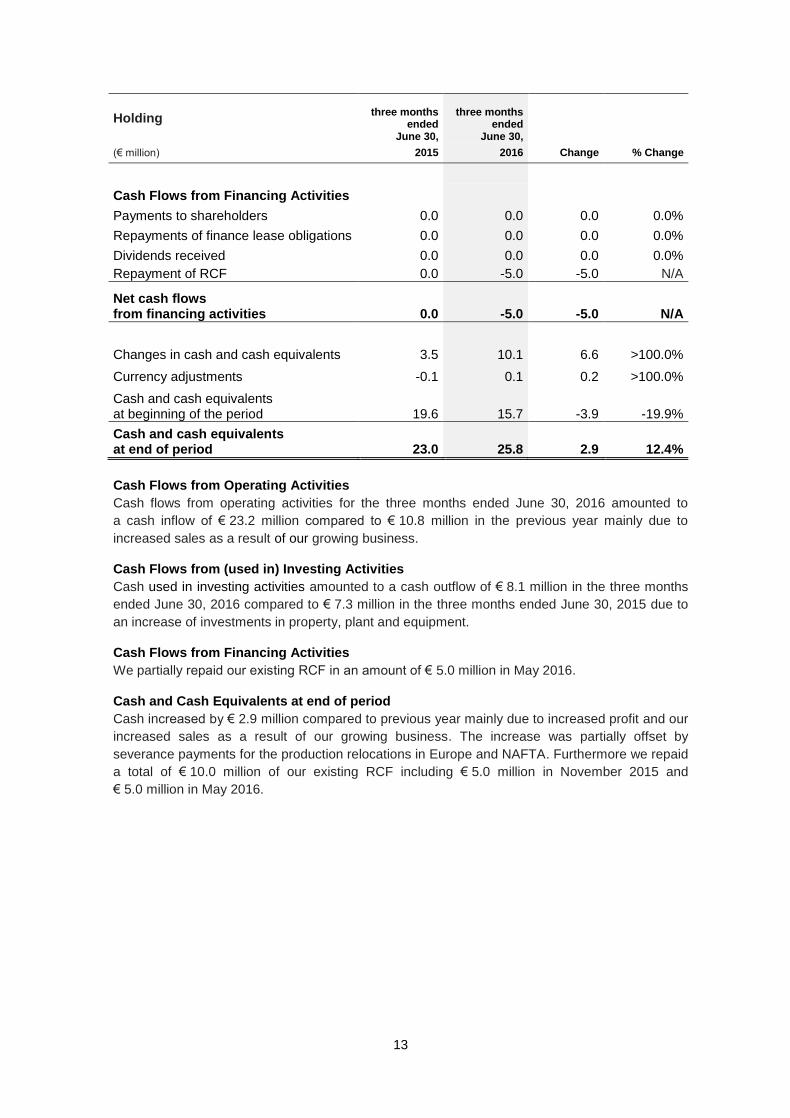
Cash Flows from Financing Activities
Payments to shareholders 0.0 0.0 0.0 0.0%
Repayments of finance lease obligations 0.0 0.0 0.0 0.0%
Dividends received 0.0 0.0 0.0 0.0%
Repayment of RCF 0.0 -5.0 -5.0 N/A
Net cash flows from financing activities 0.0 -5.0 -5.0 N/A
Changes in cash and cash equivalents 3.5 10.1 6.6 >100.0%
Currency adjustments -0.1 0.1 0.2 >100.0%
Cash and cash equivalents at beginning of the period 19.6 15.7 -3.9
-19.9%
Cash and cash equivalents at end of period 23.0 25.8 2.9
12.4%
Cash Flows from Operating Activities
Cash flows from operating activities for the three months ended June 30, 2016 amounted to
a cash inflow of € 23.2 million compared to € 10.8 million in the previous year mainly due to
increased sales as a result of our growing business.
Cash Flows from (used in) Investing Activities
Cash used in investing activities amounted to a cash outflow of € 8.1 million in the three months
ended June 30, 2016 compared to € 7.3 million in the three months ended June 30, 2015 due to
an increase of investments in property, plant and equipment.
Cash Flows from Financing Activities
We partially repaid our existing RCF in an amount of € 5.0 million in May 2016.
Cash and Cash Equivalents at end of period
Cash increased by € 2.9 million compared to previous year mainly due to increased profit and our
increased sales as a result of our growing business. The increase was partially offset by
severance payments for the production relocations in Europe and NAFTA. Furthermore we repaid
a total of € 10.0 million of our existing RCF including € 5.0 million in November 2015 and
€ 5.0 million in May 2016.

14
2.2 Year to date results ended June 30, 2016
Consolidated Income Statement
Holding
January 1
to June 30,
January 1
to June 30,
(€ million) 2015 2016 Change % Change
Revenues 260.2 286.7 26.5 10.2%
Cost of sales -207.9 -224.1 -16.3 -7.8%
Gross profit 52.4 62.6 10.2 19.5%
Distribution expenses -7.8 -7.1 0.8 9.8%
Administrative expenses -11.5 -11.0 0.5 4.0%
Research and development expenses -11.4 -14.5 -3.1 -27.3%
Restructuring expenses -2.9 -0.4 2.5 86.6%
Profit from operations 18.8 29.6 10.8 57.5%
Results from associated companies and joint ventures 0.6 0.4 -0.1 -23.1%
Finance income 1.7 2.1 0.4 24.2%
Finance expenses -15.0 -13.6 1.4 9.1%
Finance result -12.7 -11.0 1.6 13.0%
Profit before income taxes 6.1 18.6 12.5 >100.0%
Income taxes -3.8 -7.9 -4.1 >-100.0%
Deferred taxes 0.6 1.7 1.1 >100.0%
Net profit 2.9 12.4 9.5 >100.0%

15
Revenues
Revenues increased by € 26.5 million, or 10.2%, to € 286.7 million in the six months ended
June 30, 2016 from € 260.2 million in the six months ended June 30, 2015. This increase was
primarily due to higher sales volume Electric Shift Transmission (EST) and Electric Pump
Transmission (EPT) products in China and Germany.
The following table sets forth our revenues by customer location for the six months ended June
30, 2015 and 2016:
Holding
January 1
to June 30,
January 1
to June 30,
(€ million) 2015 2016 Change % Change
Revenues (by customer location)
Germany(1) 67.4 84.5 17.1 25.4%
Europe (excluding Germany)(1) 119.7 116.0 -3.8 -3.1%
Americas 39.0 37.6 -1.4 -3.7%
Asia 32.3 47.3 14.9 46.2%
Rest of world 1.8 1.4 -0.3 -19.6%
Total 260.2 286.7 26.5 10.2%
(1) Figures 2015 have been adjusted for caliper sales-split Europe / Germany.
The following table sets forth our revenues by product categories (to the extent reported so far)
for the six months ended June 30, 2015 and 2016, reflecting our product portfolio changes:
Holding
January 1
to June 30,
January 1
to June 30,
(€ million) 2015 2016 Change % Change
Revenues (by product categories)
Clutch systems 158.9 182.8 23.9 15.1%
Brake systems 66.2 71.5 5.2 7.9%
Other(1) 35.2 32.5 -2.7 -7.6%
Total 260.2 286.7 26.5 10.2%
(1) Other revenues contain primarily spare parts and merchandise including CPx (controlled piston unit).

16
The following table sets forth our revenues by new product categories for the six months ended
June 30, 2015 and 2016, reflecting our product portfolio changes:
Holding
January 1
to June 30,
January 1
to June 30,
(€ million) 2015 2016 Change % Change
Revenues (by product categories)
BAT(1) 66.2 71.5 5.2 7.9%
thereof brake calipers 25.9 25.3 -0.6 -2.2%
MST(2) 149.4 149.9 0.5 0.3%
EST(3) 26.6 43.7 17.1 64.2%
EPT(4) 1.0 3.9 2.9 >100.0%
Other(5) 17.0 17.8 0.8 4.7%
Total 260.2 286.7 26.5 10.2%
(1) BAT is an acronym for Brake Actuation Technology including brake caliper business. (2) MST is an acronym for Manual Shift Transmission. (3) EST is an acronym for Electric Shift Transmission including CPx (controlled piston unit). (4) EPT is an acronym for Electric Pump Transmission. (5) Other revenues contain primarily spare parts and merchandise.
Germany
Revenues in Germany increased by € 17.1 million, or 25.4%, to € 84.5 million in the six months
ended June 30, 2016 from € 67.4 million in the six months ended June 30, 2015 primarily due to
increased sales volume of EST and EPT products.
Europe (excluding Germany)
Revenues in Europe (excluding Germany) decreased by € 3.8 million, or 3.1%, to € 116.0 million
in the six months ended June 30, 2016 from € 119.7 million in the six months ended
June 30, 2015 due to temporary higher demand of a series product in 2015.
Americas
Revenues in Americas decreased by € 1.4 million, or 3.7%, to € 37.6 million in the six months
ended June 30, 2016 from € 39.0 million in the six months ended June 30, 2015 primarily due to
continuing difficult economical market conditions in Brazil and unfavorable currency effects.
Asia
Revenues in Asia increased by € 14.9 million, or 46.2%, to € 47.3 million in the six months ended
June 30, 2016 from € 32.3 million in the six months ended June 30, 2015 due to increasing sales
of EST products.

17
Cost of Sales
Cost of sales increased by € 16.3 million, or 7.8%, to € 224.1 million (or 78.2% of revenues) in the
six months ended June 30, 2016 from € 207.9 million (or 79.9% of revenues) in the six months
ended June 30, 2015. The increase was mainly driven by higher sales volume.
Gross Profit
Gross profit increased by € 10.2 million, or 19.5%, to € 62.6 million in the six months ended
June 30, 2016 from € 52.4 million in the six months ended June 30, 2015. Gross profit was mainly
affected by higher sales volume, partially offset by unfavorable currency effects compared to
previous year.
Distribution Expenses
Distribution expenses decreased by € 0.8 million, or 9.8%, to € 7.1 million in the six months
ended June 30, 2016 from € 7.8 million in the six months ended June 30, 2015 due to lower
advertising expenses and one-time expenses in the previous year.
Administrative Expenses
Administrative expenses decreased by € 0.5 million, or 4.0%, to € 11.0 million in the six months
ended June 30, 2016 from € 11.5 million in the six months ended June 30, 2015 mainly due to
one-time expenses in the previous year.
Research and Development Expenses
Research and development expenses increased by € 3.1 million, or 27.3%, to € 14.5 million in the
six months ended June 30, 2016 from € 11.4 million in the six months ended
June 30, 2015. This increase was mainly the result of increased depreciation from capitalized
new R&D projects, higher R&D expenses and lower R&D capitalization in 2016.
Restructuring Expenses
Restructuring expenses decreased by 0.6 million in the six months ended June 30, 2016
compared to previous year, primarily comprising of severance expenses in connection with
production relocations in Europe and NAFTA in 2015.
Finance Result
Finance expenses decreased by € 1.6 million to € 11.0 million in the six months ended
June 30, 2016 from € 12.7 million in the six months ended June 30, 2015, primarily as a result of
the revaluation of existing intercompany loans caused by changes in currency exchange rates.
Taxes
Tax expenses increased by € 3.0 million to € 6.2 million in the six months ended
June 30, 2016 from € 3.2 million in the six months ended June 30, 2015, which was mainly a
result of increased profits.
Net Profit
Net profit increased by € 9.5 million to a profit of € 12.4 million in the six months ended
June 30, 2016 from a profit of € 2.9 million in the six months ended June 30, 2015.
This increase of net profit was mainly driven by higher sales volume and gross profit with lower
restructuring expenses.

18
The following table presents the reconciliation from net profit for the period to Adjusted EBITDA:
Consolidated Statement of EBITDA
Holding
January 1
to June 30,
January 1
to June 30,
(€ million) 2015 2016 Change % Change
Net profit 2.9 12.4 9.5 >100.0%
Deferred taxes -0.6 -1.7 -1.1 >-100.0%
Income taxes 3.8 7.9 4.1 >100.0%
Finance result 12.7 11.0 -1.6 -13.0%
Profit from operations 18.8 29.6 10.8 57.5%
Depreciation and amortization 17.0 17.8 0.8 4.4%
EBITDA(1) (14)
35.8 47.4 11.6 32.3%
EBITDA Margin(2) (14)
13.8% 16.5%
Personnel restructuring(3)
2.9 0.4 -2.5 -86.6%
Operational excellence projects(4)
1.2 0.6 -0.6 -47.8%
Management reorganization(5)
0.0 0.0 0.0 N/A
Pension interests(6)
0.8 0.8 -0.0 -0.5%
Bank charges(7)
0.1 0.2 0.0 32.7%
Allowances for doubtful accounts and customer insolvency
(8) 0.0 0.0 0.0 N/A
Consumption of revalued inventories(9)
0.1 0.1 -0.0 -1.4%
Integration projects(10)
0.0 0.1 0.1 N/A
Transaction costs(11)
0.8 0.5 -0.3 -40.2%
Non-recurring items(12)
2.9 0.0 -2.9 -100.0%
Adjusted EBITDA(13) (15)
44.6 50.1 5.5 12.2%
Adjusted EBITDA Margin(14) (15)
17.2% 17.5%
(1) EBITDA represents profit from operations (representing net profit for the period before deferred income taxes, current income taxes and finance result) before depreciation, amortization (including impairment losses). (2) EBITDA Margin represents EBITDA divided by revenues. (3) Represents costs relating to severance payments for employees in connection with restructuring our manufacturing capacity, mainly in Europe and NAFTA. (4) Includes consulting fees in connection with the optimization and improvement of several processes such as for supply chain, logistics, human resources and sales and distribution and consulting fees in connection with the Group strategy review. (5) Includes costs related to the reorganization of our management structure and strategy. (6) Represents non-cash accrued interest on defined benefit pension obligations. These items have been included in personnel costs, but are regarded by management as financial in nature. (7) Represents costs related to the collection and factoring of customer receivables, particularly in the aftermarket business. These items are included in administration costs, but are regarded by management as financial in nature. (8) Net sum of the recognition and release of allowances for doubtful accounts and customer insolvency, based on management’s determination of the likelihood of receipt of payment from certain customers. These items are recognized in costs of goods sold and administration costs, but are regarded as non-operational in nature. (9) Represents the part of the PPA 2013 based revaluation of inventories that were sold/consumed and therefore recognized in cost of sales. (10) Represents costs relating to integration of acquisitions. (11) Transaction costs include mainly costs for the acquisition of the Target and new acquisitions. (12) Includes non-recurring impacts in the reported period (e.g. accrual for risk of lawsuits, potential warranty claims) (13) Adjusted EBITDA represents EBITDA as adjusted for certain infrequent charges and nonoperational costs identified, showed in the table above. (14) Adjusted EBITDA Margin represents Adjusted EBITDA divided by revenues.

19
(15) EBITDA, EBITDA Margin, Adjusted EBITDA and Adjusted EBITDA Margin are not specifically defined under IFRS or any other generally accepted accounting principles and you should not consider them as an alternative to net income (loss) or any other performance measures derived in accordance with IFRS. Our management believes that EBITDA, EBITDA Margin, Adjusted EBITDA and Adjusted EBITDA Margin are meaningful for investors because they provide an analysis of our operating results, profitability and ability to service debt and because EBITDA, EBITDA Margin, Adjusted EBITDA and Adjusted EBITDA Margin are used by our management to track our business development, establish operational and strategic targets and make important business decisions. EBITDA, EBITDA Margin, Adjusted EBITDA and Adjusted EBITDA Margin are also measures commonly reported and widely used by analysts, investors and other interested parties in our industry. To facilitate the analysis of our operations, these indicators exclude amortization, impairment and depreciation expenses from operating profit in order to eliminate the impact of general long-term capital investment. Although we are presenting these measures to enhance the understanding of our historical operating performance, EBITDA, EBITDA Margin, Adjusted EBITDA and Adjusted EBITDA Margin should not be considered an alternative to operating profit as indicators of our operating performance, or as alternatives to cash flows from operating activities as measures of our liquidity.
EBITDA, EBITDA Margin
EBITDA increased by € 11.6 million, or 32.3%, to € 47.4 million (or 16.5% of revenues) in the six
months ended June 30, 2016 from € 35.8 million (or 13.8% of revenues) in the six months ended
June 30, 2015. EBITDA increased due to growing sales volume and gross profit with lower
restructuring expenses.
The Adjusted EBITDA increased by € 5.5 million, or 17.5%, to € 50.1 million (or 17.5% of
revenues) in the six months ended June 30, 2016 from € 44.6 million (or 17.2% of revenues) in
the six months ended June 30, 2015 due to higher sales volume and gross profit with lower
restructuring expenses.

20
Consolidated Statement of Cash Flows
Holding
January 1
to June 30,
January 1
to June 30,
(€ million) 2015 2016 Change % Change
Cash Flows from Operating Activities
Profit before income taxes 6.1 18.6 12.5 >100.0%
Adjustments for
Depreciation and amortization 17.0 17.8 0.8 4.4%
Finance result 13.5 11.9 -1.6 -12.2%
Other non-cash expenses and income -2.3 -0.1 2.2 95.5%
Total adjustments 28.2 29.5 1.3 4.5%
Changes in Working Capital and Other Assets and Liabilities
Trade receivables -23.8 -26.3 -2.5 -10.4%
Other assets 5.8 0.3 -5.5 -95.1%
Inventories -1.6 -0.0 1.6 99.4%
Trade payables -3.5 -8.2 -4.7 >-100.0%
Total change in working capital -23.1 -34.2 -11.1 >-47.7%
Changes in pension provisions -0.8 -0.9 -0.2
-21.1%
Changes in provisions 4.0 -1.0 -4.9 >-100.0%
Changes in other liabilities 7.7 8.4 0.7 9.3%
Total change in working capital and other assets and liabilities -12.2 -27.7 -15.4
>-100.0%
Interests paid / received -12.3 -12.2 0.1 1.1%
Income taxes paid / received -3.4 -3.2 0.1 4.4%
Net cash flows from operating activities 6.4 5.0 -1.4
-22.1%
Cash Flows from Investing Activities
Investments in property, plant and equipment -7.9 -10.2 -2.3
-29.1%
Investments in intangible assets -0.1 -0.3 -0.2 >-100.0%
Proceeds from disposals of tangible and intangible assets 0.1 0.1 -0.0
-22.9%
Investments in development costs -5.0 -4.0 1.0 20.6%
Net cash flows from investing activities -12.9 -14.3 -1.5
-11.4%

21
Holding
January 1
to June 30,
January 1
to June 30,
(€ million) 2015 2016 Change % Change
Cash Flows from Financing Activities
Payments to shareholders 0.0 0.0 0.0 0.0%
Repayments of finance lease obligations 0.0 0.0 0.0 0.0%
Dividends received 0.0 0.0 0.0 0.0%
Repayment of RCF 0.0 -5.0 -5.0 N/A
Net cash flows from financing activities 0.0 -5.0 -5.0 N/A
Changes in cash and cash equivalents -6.5 -14.4 -7.9 >-100.0%
Currency adjustments 0.4 -0.3 -0.7 >-100.0%
Cash and cash equivalents at beginning of the period 29.1 40.5 11.4
39.3%
Cash and cash equivalents at end of period 23.0 25.8 2.9
12.4%
Cash Flows from Operating Activities
Cash flows from operating activities for the six months ended June 30, 2016 amounted to
a cash inflow of € 5.0 million compared to € 6.4 million in the previous year mainly due to higher
working capital resulting from increased sales as a result of our growing business and severance
payments for the production relocations in Europe and NAFTA.
Cash Flows from (used in) Investing Activities
Cash used in investing activities amounted to a cash outflow of € 14.3 million in the six months
ended June 30, 2016 compared to € 12.9 million in the six months ended June 30, 2015 due to
an increase of investments in property, plant and equipment.
Cash Flows from Financing Activities
We partially repaid our existing RCF in an amount of € 5.0 million in May 2016.
Cash and Cash Equivalents at end of period
Cash increased by € 2.9 million compared to previous year mainly due to increased profit and
growing business. The increase was partially offset by severance payments for the production
relocations in Europe and NAFTA. Furthermore we repaid a total of € 10.0 million of our existing
RCF including € 5.0 million in November 2015 and € 5.0 million in May 2016.

22
3. Consolidated Statement of Balance Sheet
Holding
(€ million)
December 31, 2015
June 30, 2016
Change
% Change
Non-Current Assets
Property, plant and equipment 110.3 110.4 0.2 0.2%
Shares in associated companies and joint ventures 4.3 3.8 -0.5 -12.6%
Other assets 0.5 0.4 -0.1 -15.4%
Goodwill 97.5 97.5 0.0 0.0%
Other intangible assets 121.7 118.5 -3.2 -2.6%
Deferred tax assets 1.9 2.3 0.4 23.0%
Non-current assets 336.2 333.0 -3.2 -0.9%
Current Assets
Inventories 73.7 73.5 -0.2 -0.2%
Trade receivables 65.2 91.1 25.9 39.6%
Receivables shareholder 0.2 0.2 0.0 24.2%
Income tax receivables 3.9 1.7 -2.2 -56.6%
Other current assets 26.3 26.7 0.4 1.7%
Cash and cash equivalents 40.5 25.8 -14.7 -36.3%
Current assets 209.8 219.1 9.3 4.4%
Total assets 546.0 552.1 6.1 1.1%
Holding
(€ million)
December 31, 2015
June 30, 2016
Change
% Change
Equity
Share capital 0.0 0.0 0.0 0.0%
Capital reserve 90.6 90.6 0.0 0.0%
Currency translation reserve -1.4 -3.2 -1.8 >-100.0%
Retained earnings -19.1 -21.1 -2.0 -10.3%
Net result for the period 6.7 12.4 5.7 84.3%
Total equity 76.8 78.7 1.9 2.5%
Liabilities
Non-Current Liabilities
Notes 255.1 255.9 0.7 0.3%
Pension provisions 66.0 78.2 12.1 18.3%
Provisions 2.3 1.9 -0.5 -19.4%
Other liabilities 0.7 0.4 -0.3 -41.2%
Deferred tax liabilities 27.5 22.6 -4.9 -17.7%
Non-current liabilities 351.7 358.9 7.2 2.1%

23
Holding
(€ million)
December 31, 2015
June 30, 2016
Change
% Change
Current Liabilities
Other financial liabilities 8.1 3.4 -4.7 -58.4%
Trade payables 45.4 36.9 -8.5 -18.7%
Pension provisions 1.8 1.7 -0.1 -7.1%
Provisions 19.4 18.9 -0.5 -2.6%
Other current liabilities 41.0 49.3 8.3 20.3%
Current income tax liabilities 1.8 4.3 2.5 >100.0%
Current liabilities 117.5 114.5 -3.1 -2.6%
Total liabilities 469.2 473.4 4.2 0.9%
Total equity and liabilities 546.0 552.1 6.1 1.1%
Property, Plant and Equipment
Property, plant and equipment increased by € 0.2 million, or 0.2%, to € 110.4 million as of
June 30, 2016 from € 110.3 million as of December 31, 2015 due to investments exceeding
depreciation.
Intangible Assets
Intangible assets decreased by € 3.2 million, or 1.5%, to € 216.1 million as of June 30, 2016 from
€ 219.3 million as of December 31, 2015. This decrease was mainly due to the amortization of
the purchase price allocation for the acquisition of the Holding.
Inventories
Inventories decreased by € 0.2 million, or 0.2%, to € 73.5 million as of June 30, 2016 from
€ 73.7 million as of December 31, 2015. This decrease resulted from seasonal effects. See also
“Capitalization, liquidity and other financials – Trade Working Capital" (Note 4).
Trade Receivables
Trade receivables increased by € 25.9 million, or 39.6%, to € 91.1 million as of June 30, 2016
from € 65.2 million as of December 31, 2015 due to low levels of sales and trade receivables in
December 2015 as well as growing business in 2016. See also “Capitalization, liquidity and other
financials – Trade Working Capital" (Note 4).
Income Tax Receivables
Income tax receivables decreased by € 2.2 million, or 56.6%, to € 1.7 million as of June 30, 2016
from € 3.9 million as of December 31, 2015 due to tax reimbursement for 2014.
Equity
Equity increased by € 1.9 million, or 2.5%, to € 78.7 million as of June 30, 2016 from
€ 76.8 million as of December 31, 2015. The positive net result in first half year 2016 was partly
offset by negative foreign currency translation effects as well as actuarial losses on defined
benefit pension plans.
24
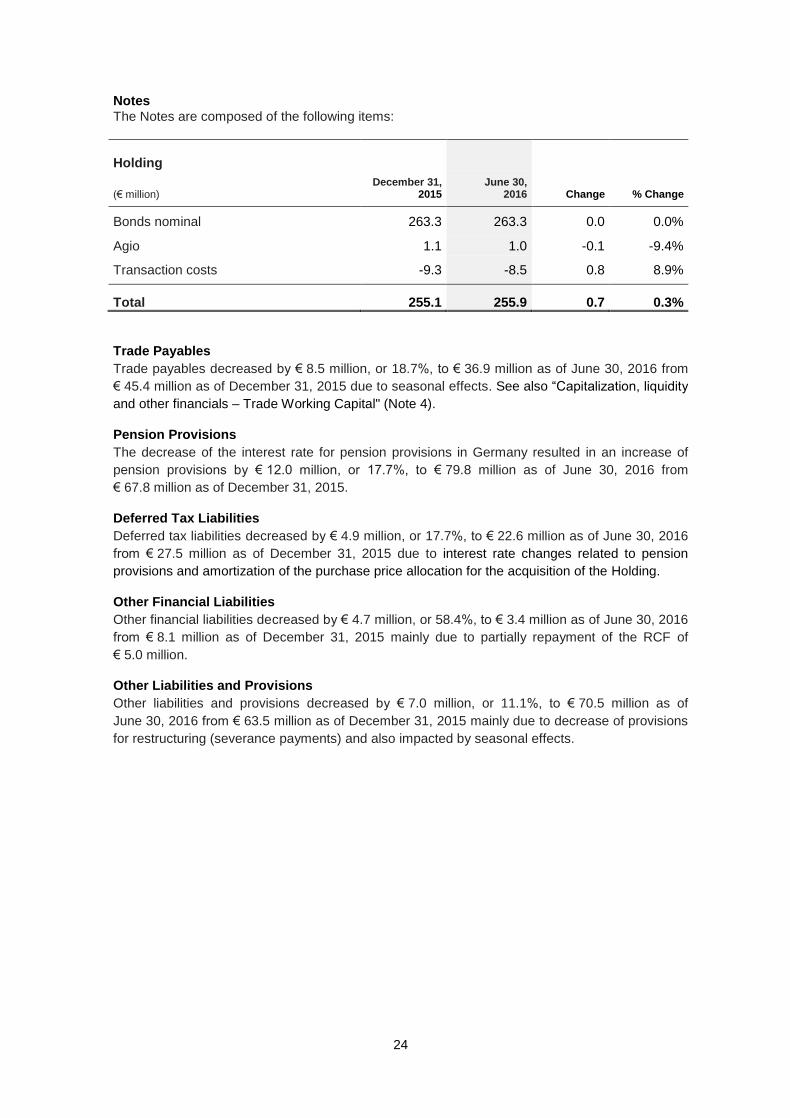
Notes
The Notes are composed of the following items:
Holding
(€ million)
December 31, 2015
June 30, 2016
Change
% Change
Bonds nominal 263.3 263.3 0.0 0.0%
Agio 1.1 1.0 -0.1 -9.4%
Transaction costs -9.3 -8.5 0.8 8.9%
Total 255.1 255.9 0.7 0.3%
Trade Payables
Trade payables decreased by € 8.5 million, or 18.7%, to € 36.9 million as of June 30, 2016 from
€ 45.4 million as of December 31, 2015 due to seasonal effects. See also “Capitalization, liquidity
and other financials – Trade Working Capital" (Note 4).
Pension Provisions
The decrease of the interest rate for pension provisions in Germany resulted in an increase of
pension provisions by € 12.0 million, or 17.7%, to € 79.8 million as of June 30, 2016 from
€ 67.8 million as of December 31, 2015.
Deferred Tax Liabilities
Deferred tax liabilities decreased by € 4.9 million, or 17.7%, to € 22.6 million as of June 30, 2016
from € 27.5 million as of December 31, 2015 due to interest rate changes related to pension
provisions and amortization of the purchase price allocation for the acquisition of the Holding.
Other Financial Liabilities
Other financial liabilities decreased by € 4.7 million, or 58.4%, to € 3.4 million as of June 30, 2016
from € 8.1 million as of December 31, 2015 mainly due to partially repayment of the RCF of
€ 5.0 million.
Other Liabilities and Provisions
Other liabilities and provisions decreased by € 7.0 million, or 11.1%, to € 70.5 million as of
June 30, 2016 from € 63.5 million as of December 31, 2015 mainly due to decrease of provisions
for restructuring (severance payments) and also impacted by seasonal effects.

25
4. Capitalization, liquidity and other financial data Liquidity
Our principal source of liquidity is, in general, our operating cash flow. The ability to generate
cash from our operations depends on our future operating performance, which is in turn
dependent, to some extent, on general economic, financial, competitive, market, regulatory and
other factors, many of which are beyond our control.
Our long-term indebtedness primarily consists of the Notes. The amounts available under the
Revolving Credit Facility are subject to our compliance with certain conditions, including certain
financial maintenance ratios.
Although we believe that our expected cash flows from operations, together with available
borrowings and cash on hand, will be adequate to meet our anticipated liquidity and debt service
needs, we cannot assure that our business will generate sufficient cash flows from operations or
that future debt and equity financing will be available to us in an amount sufficient to enable us to
pay our debts when due, including the Notes, or to fund our other liquidity needs.
We believe that the potential risks to our liquidity include:
a reduction in operating cash flows due to a decrease of operating profit from our
operations, which could be the result of a downturn in our performance or in the industry
as a whole;
the failure or delay of our customers to make payments due to us;
a failure to maintain working capital requirements; and
the need to fund expansion and other development capital expenditures.
If our future cash flows from operations and other capital resources (including borrowings under
our current or any future credit facility) are insufficient to pay our obligations as they mature or to
fund our liquidity needs, we may be forced to:
reduce or delay our business activities and capital expenditures;
sell our assets;
obtain additional debt or equity financing; or
restructure or refinance all or a portion of our debt, including the Notes, on or before
maturity.
We cannot assure you that we would be able to accomplish any of these alternatives on a timely
basis or on satisfactory terms, if at all. In addition, the terms of the Notes and any future debt may
limit our ability to pursue any of these alternatives.
Available Sources of Liquidity
Our principal sources of liquidity in the medium term are cash provided by operations and cash
from our short- and long-term borrowings.
26
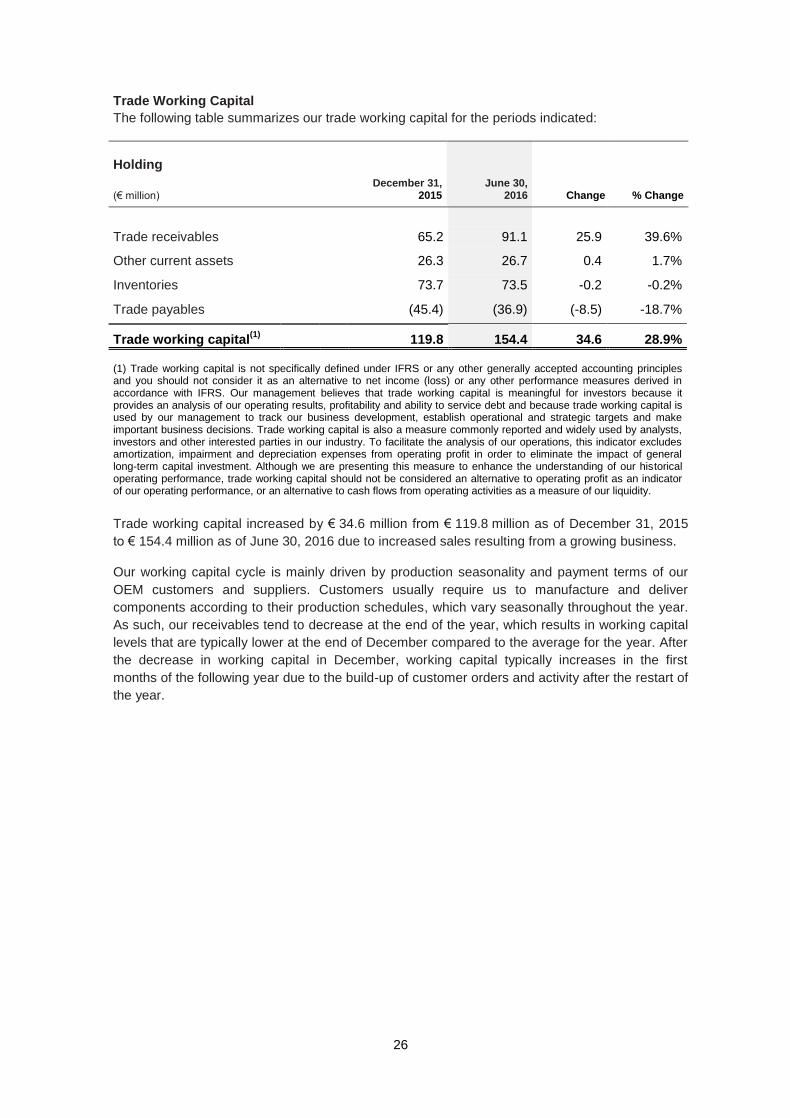
Trade Working Capital
The following table summarizes our trade working capital for the periods indicated:
Holding
(€ million)
December 31, 2015
June 30, 2016
Change
% Change
Trade receivables
65.2 91.1 25.9 39.6%
Other current assets
26.3 26.7 0.4 1.7%
Inventories
73.7 73.5 -0.2 -0.2%
Trade payables
(45.4) (36.9) (-8.5) -18.7%
Trade working capital(1)
119.8 154.4 34.6 28.9%
(1) Trade working capital is not specifically defined under IFRS or any other generally accepted accounting principles and you should not consider it as an alternative to net income (loss) or any other performance measures derived in accordance with IFRS. Our management believes that trade working capital is meaningful for investors because it provides an analysis of our operating results, profitability and ability to service debt and because trade working capital is used by our management to track our business development, establish operational and strategic targets and make important business decisions. Trade working capital is also a measure commonly reported and widely used by analysts, investors and other interested parties in our industry. To facilitate the analysis of our operations, this indicator excludes amortization, impairment and depreciation expenses from operating profit in order to eliminate the impact of general long-term capital investment. Although we are presenting this measure to enhance the understanding of our historical operating performance, trade working capital should not be considered an alternative to operating profit as an indicator of our operating performance, or an alternative to cash flows from operating activities as a measure of our liquidity.
Trade working capital increased by € 34.6 million from € 119.8 million as of December 31, 2015
to € 154.4 million as of June 30, 2016 due to increased sales resulting from a growing business.
Our working capital cycle is mainly driven by production seasonality and payment terms of our
OEM customers and suppliers. Customers usually require us to manufacture and deliver
components according to their production schedules, which vary seasonally throughout the year.
As such, our receivables tend to decrease at the end of the year, which results in working capital
levels that are typically lower at the end of December compared to the average for the year. After
the decrease in working capital in December, working capital typically increases in the first
months of the following year due to the build-up of customer orders and activity after the restart of
the year.

27
LTM Adjusted EBITDA
As of June 30, 2016, LTM Adjusted EBITDA amounted to € 92.3 million and net financial debt
amounted to € 242.5 million. This resulted in a ratio of net financial debt to LTM Adjusted EBITDA
of 2.63.
Holding
twelve
months ended
June 30,
twelve
months ended
September 30,
twelve
months ended
December 31,
twelve
months ended March
31,
twelve
months ended
June 30,
Change June
to March
(€ million) 2015 2015 2015 2016 2016 Change % Change
Net financial debt(1) (3)
255.3 255.5 232.8 257.6 242.5 -15.1 -5.9%
LTM Adjusted EBITDA
(2)(3) 79.7 83.1 86.8 87.9 92.3 4.3 4.9%
Ratio of net financial debt to LTM Adjusted EBITDA 3.20 3.07 2.68 2.93 2.63 -0.30 -10.3%
(1) Represents the amount of the Notes minus the amount of cash available. (2) Adjusted EBITDA represents EBITDA as adjusted for certain infrequent charges and nonoperational costs identified. (3) Net financial debt and LTM Adjusted EBITDA are not specifically defined under IFRS or any other generally accepted accounting principles and you should not consider them as an alternative to net income (loss) or any other performance measures derived in accordance with IFRS. Our management believes that net financial debt and LTM Adjusted EBITDA are meaningful for investors because they provide an analysis of our operating results, profitability and ability to service debt and because net financial debt and LTM Adjusted EBITDA are used by our management to track our business development, establish operational and strategic targets and make important business decisions. Net financial debt and LTM Adjusted EBITDA are also measures commonly reported and widely used by analysts, investors and other interested parties in our industry. To facilitate the analysis of our operations, these indicators exclude amortization, impairment and depreciation expenses from operating profit in order to eliminate the impact of general long-term capital investment. Although we are presenting these measures to enhance the understanding of our historical operating performance, net financial debt and LTM Adjusted EBITDA should not be considered an alternative to operating profit as indicators of our operating performance, or as alternatives to cash flows from operating activities as measures of our liquidity.

28
Gross Total Capital Expenditure
The following table sets forth our gross total capital expenditure for the periods indicated:
Holding
January 1 to
January 1
to
(€ million)
June 30, 2015
June 30, 2016
Change
% Change
Gross total capital expenditure (1)
12.9 14.3 1.5 11.4%
(1) Gross total capital expenditure is not specifically defined under IFRS or any other generally accepted accounting principles and you should not consider it as an alternative to net income (loss) or any other performance measures derived in accordance with IFRS. Our management believes that gross total capital expenditure is meaningful for investors because it provides an analysis of our operating results, profitability and ability to service debt and because gross total capital expenditure is used by our management to track our business development, establish operational and strategic targets and make important business decisions. Gross total capital expenditure is also a measure commonly reported and widely used by analysts, investors and other interested parties in our industry. To facilitate the analysis of our operations, this indicator excludes amortization, impairment and depreciation expenses from operating profit in order to eliminate the impact of general long-term capital investment. Although we are presenting this measure to enhance the understanding of our historical operating performance, gross total capital expenditure should not be considered an alternative to operating profit as an indicator of our operating performance, or an alternative to cash flows from operating activities as a measure of our liquidity.
Gross total capital expenditure increased by € 1.5 million, or 11.4%, to € 14.3 million in the six
months ended June 30, 2016 from € 12.9 million in the six months ended June 30, 2015 due to
increased investments, particularly in connection with our new Electric Shift Transmission (EST)
and Electric Pump Transmission (EPT) projects.

29
5. Changes in material debt instruments Changes in material debt instruments
Based on the agreement, dated June 2, 2016, between Bain Capital Private Equity and Valeo
Group it is our understanding that the Valeo Group intends to redeem the Notes on or about the
closing date of the acquisition. Any redemption will be within the buyer’s discretion (subject to the
terms of the identure).
6. Subsequent events and material changes to risk factors Subsequent events
No event with material impact on the unaudited financials occurred after the reporting date.
Material changes to risk factors
We are not aware of any material changes to the risk factors disclosed in the most recent
consolidated financial statements of the Holding for the period ended June 30, 2016.

30
7. Summary of significant accounting policies Financial information
A. Principles and methods
The consolidated interim financial statements of the Holding as of June 30, 2016 are prepared in
accordance with the International Financial Reporting Standards in effect and to be mandatorily
applied as of the balance sheet date; particularly the requirements of IAS 34 relating to interim
financial reporting were applied.
B. Consolidated companies and principles of consolidation
The consolidated interim financial statements as of June 30, 2016 include the interim financial
statements of the Parent and its subsidiaries.
The following table shows the list of consolidated entities and the interests held by the Group:
Subsidiary Location Country Share
FTE Verwaltungs GmbH
FTE automotive GmbH
Ebern
Ebern
Germany
Germany
100 %
100 %
FTE automotive systems GmbH Fischbach Germany 100 %
FTE automotive Möve GmbH Mühlhausen Germany 100 %
FTE Asia GmbH Ebern Germany 100 %
FTE automotive Slovakia s.r.o. Presov Slovakia 100 %
SFMC s.r.o. (until March 31, 2016) Presov Slovakia 100 %
FTE automotive France S.a.r.l. Nanterre Cedex France 100 %
FTE automotive Czechia s.r.o. Podborany Czech Republic 100 %
FTE automotive UK Limited Coventry Great Britain 100 %
FTE automotive Denmark ApS Stoevring Denmark 100 %
FTE Indústria e Comércio Ltda. Maua Brazil 100 %
FTE automotive USA Inc. Auburn Hills USA 100 %
FTE automotive North America Inc. Auburn Hills USA 100 %
FTE Mexicana S.A. de C.V. Puebla Mexico 100 %
FTE automotive (Taicang) Co. Ltd. Taicang China 100 %
On April 1, 2016 SFMC s.r.o. was merged into FTE automotive Slovakia s.r.o.
Companies over which FTE Holding GmbH can execute joint control are either included in the
consolidated financial statements with the proportionate assets, liabilities, earnings & expenses or
measured according to the equity method, depending on their type. In the absence of other
contractual agreements, a majority of the voting rights generally takes control. If the voting rights
are distributed equally, joint control generally results unless other (contractual) rights result in
control by the shareholder.
Associates on which FTE Holding GmbH can execute material influence within the meaning of
IAS are also measured according to the equity method. Significant influence is generally deemed
to exist if FTE is directly or indirectly entitled to a voting rights interest of at least 20%, but less
than 50%.

31
Associates are aggregated as equity-accounted investments.
Associated companies Headquarters Country Interest
APG-FTE automotive Co. Ltd Hangzhou China 49%
The financial year of FTE Holding GmbH ends on 31 December 2015. The reporting date for the
separate financial statements of the Group companies that are included in the scope of
consolidation is the same as the reporting date for the consolidated financial statements.
For consolidation purposes, the consolidated financial statements of FTE Holding GmbH were
prepared on the basis of uniform accounting principles pursuant to IFRS 10.
The consolidation of a portfolio company commences on the day on which the investor obtains
control over the company. It ends when the investor relinquishes control over the portfolio
company.
In case of a step merger, the previously-acquired equity share of the company is redetermined
using the fair value valid when the acquisition took place. The resulting profit or loss is to be
recorded in the income statement.
Interests in subsidiaries
Capital consolidation is performed by applying the purchase method pursuant to IFRS 3
(Business Combinations).
The purchase costs for the acquisition correspond to the fair value of the transferred assets, the
issued equity capital instruments, and the liabilities that arise or are transferred on the transaction
date. Incidental acquisition costs are expensed. Upon first consolidation, assets, liabilities and
contingent liabilities identified as part of a merger are generally valued at their fair value on the
date of acquisition, irrespective of the extent of the minority shares. The excess of the acquisition
costs over the Group's share in the net assets measured at fair value is recognized as goodwill. If
the acquisition costs are less than the fair value of the acquired identifiable assets and liabilities,
the difference is reported directly in the consolidated income statement. Acquisition costs are
expensed.
All receivables and liabilities, revenues, expenses and income, as well as intragroup profits and
losses between the companies included in the consolidated financial statements are eliminated
as part of consolidation.
These companies' financial statements are included by way of full consolidation.
Equity-accounted investments The shares in associated companies are balanced using the equity method and initially carried at
their acquisition cost. The Group’s share in associated companies includes the goodwill arising
upon acquisition. In subsequent periods, the acquisition costs are carried forward to include the
proportion of net assets attributable to the FTE Group.
This entails increasing or decreasing the carrying amounts annually by the proportional net profits
and losses, dividends distributed, and other equity changes. Impairment losses are applied to
equity accounted investments if their recoverable amounts are less than their carrying amounts.
Profits that require elimination arising from transactions with associates are offset against the
participating interest's carrying amount through profit or loss.
32
Currency translation
Functional currency
The items in the annual financial statements of each Group subsidiary are carried with the
currency that best reflects the economic content of the underlying business transactions and
circumstances relevant to the Company (functional currency). All transactions denominated in a
currency other than the functional currency are regarded as foreign currency transactions.
The consolidated financial statements are prepared in Euros, the functional currency of FTE
Holding GmbH. The annual financial statements of foreign subsidiaries with functional currencies
other than the Euro are translated in the consolidated financial statements into the Group
currency of the Euro according to the modified balance sheet date rate method on the basis of
the functional currency concept pursuant to IAS 21 (The Effects of Changes in Foreign Exchange
Rates).
Accounting for business transactions
Foreign currency transactions are translated into the functional currency by applying the rates
prevailing on the transaction date. Currency gains and losses arising from the settlement of such
business transactions and from the currency translation of monetary assets and liabilities are
reported in the consolidated income statement.
Group companies
Assets and liabilities of foreign Group companies with functional currencies other than the Euro
are translated at the exchange rate prevailing on the balance sheet date (reporting date rate),
while average exchange rates are applied to the translation of the consolidated income
statement.
The difference arising from the currency translation is recognized directly in equity under the
"foreign currency translation reserve" item.
Currency differences arising compared to the previous year's translation, or from the translation
as of the first-time consolidation date within the FTE Group, are also recognized directly in equity
under the "foreign currency translation reserve" item.
C. Accounting policies
(1) Revenue recognition The revenues are generated mainly from the sale of goods. Pursuant to IAS 18, these revenues
are reported excluding value added tax, and after deducting price reductions such as customer
rebates and price discounts. Revenue from the sale of goods is recognized if the significant risks
and opportunities connected with the asset's ownership have transferred to the buyer.
License income is recognized on an accrual basis in line with the underlying contract. Interest
income is reported pro rata temporis on the basis of outstanding amounts and effective interest
until the maturity date, if it is ascertained that such income is likely to be received. Dividend
income is reported when the legal entitlement to payment arises.
(2) Cost of sales Cost of sales comprises costs that have been incurred to produce and acquire merchandise to
the extent that such merchandise has been sold. It comprises all costs of sales reported for
revenue recognition.

33
(3) Balance sheet structure Pursuant to IAS 1.66, assets are classified as current if
the realization of the asset is expected within the normal business cycle, or the asset is held for
sale within this period,
the asset is primarily held for trading purposes,
the realization of the asset is expected within twelve months after the balance sheet date, or
it is in cash or cash equivalents, unless the exchange or utilization of the asset is restricted to
the purpose of fulfilling an obligation for a period of at least twelve months after the balance
sheet date.
All other assets are classified as non-current.
Pursuant to IAS 1.69, liabilities are classified as current if
the liabilities are expected to be settled within the normal business cycle,
the liabilities are primarily held for trading purposes,
the liabilities are expected to be settled within twelve months of the balance sheet date, or
the company does not have an unlimited right to postpone the settlement of the liability by at
least twelve months after the balance sheet date. If the liability is associated with terms and
conditions that allow it to be settled by issuing equity capital instruments thanks to a
counterparty option, this does not affect its classification.
All other liabilities are classified as non-current.
Claims and obligations arising from deferred taxes are generally reported as non-current assets
or liabilities. If assets and liabilities comprise both current and non-current components, they are
divided into their maturity components and reported as current and non-current assets or
liabilities according to the balance sheet structure.
(4) Property, plant, and equipment Property, plant and equipment are reported at cost less depreciation based on the estimated
normal useful operating lives of the assets. The revaluation method pursuant to IAS 16.31 - 42 is
not applied.
Along with costs directly attributable to the production process, costs for self-produced property,
plant, and equipment comprise an appropriate proportion of production-related overhead costs.
These include production-related depreciation and impairment losses, and an appropriate portion
of administrative and social costs. Borrowing costs are not reported, as no qualified assets exist.
Depreciation is applied straight-line in accordance with prospective useful economic lives:
Useful life
Years
Buildings 25-50 years
Improvements to buildings 3-10 years
Equipment and machinery 6-15 years
Furniture and office equipment and vehicle fleet 3-10 years

34
Land is not appreciated. Property, plant, and equipment with a cost of between € 150 and € 1,000
(low-cost assets) are written off fully in the year of purchase and reported correspondingly as
asset additions and as depreciation in the analysis of non-current assets.
Disposal gains and losses are calculated by comparing sales proceeds with the corresponding
carrying amounts, and reported through profit or loss.
Repair and maintenance expenses are expensed in the period in which they occur. Costs for
major repairs and maintenance are allocated to the asset's carrying amount if the recognition
criteria for property, plant and equipment are satisfied. Major repairs are depreciated over the
residual useful life of the related assets. Carrying amounts of previous repairs and maintenance
work are derecognized. The same accounting treatment is applied if assets need to be replaced
at regular intervals.
Carrying amounts, normal operating useful lives, and depreciation methods are reviewed
annually pursuant to IAS 16.51 and 16.61.
(5) Intangible assets Intangible assets comprise goodwill, customer lists, brands, technology, patents, software,
licenses and similar rights, as well as self-produced intangible assets deriving from development.
Goodwill
Purchased goodwill is capitalized and tested at least annually for impairment pursuant to IAS 36,
and whenever indications of impairment exist (so-called "triggering events"). Goodwill is tested for
impairment in a single-step process at the level of the cash-generating units, or groups of cash-
generating units to which it is allocated.
This entails comparing the carrying amount of the cash-generating unit to its recoverable amount.
If the carrying amount exceeds the recoverable amount, an impairment exists, and the goodwill is
written down to the recoverable amount.
The recoverable amount of the cash-generating unit corresponds to the higher of fair value less
costs to sell and value in use.
Subsequent reversals to goodwill impairment losses are not permitted if the reasons for previous
impairment no longer apply.
Development costs
Research costs are not capitalized but are instead expensed in the period in which they are
incurred pursuant to IAS 38.
Development costs are capitalized if the IAS 38 recognition criteria have been satisfied. After first-
time capitalization, the asset is carried at cost less cumulative amortization and cumulative
impairment losses. Capitalized development costs include all directly attributable specific costs,
proportional overhead costs, and borrowing costs pursuant to IAS 23, and are amortized over the
budgeted product life-cycle.
Other intangible assets Intangible assets with finite normal useful operating lives are capitalized according to the
purchase cost principle pursuant to IAS 38, and amortized straight-line over their normal
operating useful lives
By contrast, intangible assets with indeterminate useful lives cannot be amortized. Borrowing
costs for intangible assets whose production requires a considerable period of time (qualified
asset), and which can be directly attributable to the production of these assets, are capitalized
under the preconditions of IAS 23.
35
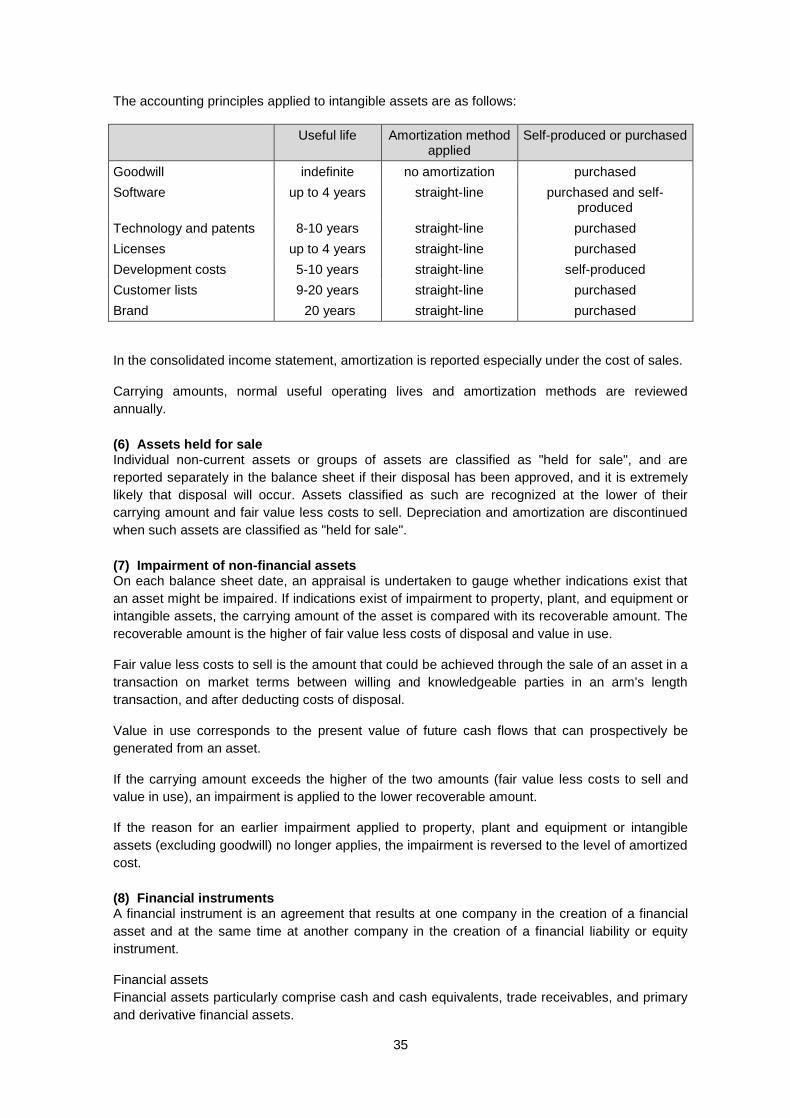
The accounting principles applied to intangible assets are as follows:
Useful life Amortization method applied
Self-produced or purchased
Goodwill indefinite no amortization purchased
Software up to 4 years straight-line purchased and self-produced
Technology and patents 8-10 years straight-line purchased
Licenses up to 4 years straight-line purchased
Development costs 5-10 years straight-line self-produced
Customer lists 9-20 years straight-line purchased
Brand 20 years straight-line purchased
In the consolidated income statement, amortization is reported especially under the cost of sales.
Carrying amounts, normal useful operating lives and amortization methods are reviewed
annually.
(6) Assets held for sale Individual non-current assets or groups of assets are classified as "held for sale", and are
reported separately in the balance sheet if their disposal has been approved, and it is extremely
likely that disposal will occur. Assets classified as such are recognized at the lower of their
carrying amount and fair value less costs to sell. Depreciation and amortization are discontinued
when such assets are classified as "held for sale".
(7) Impairment of non-financial assets On each balance sheet date, an appraisal is undertaken to gauge whether indications exist that
an asset might be impaired. If indications exist of impairment to property, plant, and equipment or
intangible assets, the carrying amount of the asset is compared with its recoverable amount. The
recoverable amount is the higher of fair value less costs of disposal and value in use.
Fair value less costs to sell is the amount that could be achieved through the sale of an asset in a
transaction on market terms between willing and knowledgeable parties in an arm's length
transaction, and after deducting costs of disposal.
Value in use corresponds to the present value of future cash flows that can prospectively be
generated from an asset.
If the carrying amount exceeds the higher of the two amounts (fair value less costs to sell and
value in use), an impairment is applied to the lower recoverable amount.
If the reason for an earlier impairment applied to property, plant and equipment or intangible
assets (excluding goodwill) no longer applies, the impairment is reversed to the level of amortized
cost.
(8) Financial instruments A financial instrument is an agreement that results at one company in the creation of a financial
asset and at the same time at another company in the creation of a financial liability or equity
instrument.
Financial assets
Financial assets particularly comprise cash and cash equivalents, trade receivables, and primary
and derivative financial assets.

36
Financial liabilities
Financial liabilities comprise a contractual obligation to render cash or another financial asset to
another company. Financial liabilities mainly comprise mainly trade payables, bonds, bank
borrowings, finance lease liabilities, and derivative financial liabilities.
The Group categorizes its financial instruments as follows:
a. Loans and receivables
b. Financial assets and liabilities measured at fair value through profit or loss
c. Available-for-sale financial assets
d. Financial liabilities which are measured at amortized cost
Categorization depends on the respective purpose for which the financial instruments were
concluded. The management determines categorization of the financial instruments used in the
reporting period.
Categorization of the financial instruments to the respective measurement categories occurs on
first-time recognition. To the extent permitted and required, re-categorizations occur at the end of
each financial year.
a. Loans and receivables Financial assets with fixed or determinable payments that are not listed on an active market are categorized as loans and receivables.
b. Financial assets and liabilities measured at fair value through profit or loss Financial assets measured at fair value through profit or loss comprise financial assets that are
held for trading. A financial asset is allocated to this category if it was generally acquired with the
intention of short-term resale. Derivatives also belong to this category. Assets of this category are
reported as current assets if it is expected that the asset will be realized within twelve months. All
other assets are classified as non-current.
c. Available-for-sale financial assets
Available-for-sale financial assets are non-derivative financial assets that are not allocated to any
of the other categories.
Financial assets are allocated to non-current assets if the management does not intend to sell
them within twelve months after the balance sheet date, or if they are not due within twelve
months after the balance sheet date. If the management has expressed its firm intention to hold
the financial instruments for less than twelve months from the balance sheet date, or if they must
be sold or paid due to working capital requirements, they are reported as current assets.
Recognition and measurement of financial assets and liabilities
Financial assets are measured at fair value on initial recognition. The carrying amount of financial
instruments that are not measured at fair value through profit or loss includes directly attributable
transaction costs.
The fair value of financial instruments that are traded on organized markets is determined by the
listed market price on the balance sheet date. The fair value of financial instruments for which no
active market exists is calculated by applying recognized valuation methods. If the market value
of shares cannot be calculated reliably, they are measured at cost less impairment. The FTE
Group reports financial assets and financial liabilities in the balance sheet, if the FTE Group
obtains contractual rights or obligations.
37
Financial assets are derecognized if the rights to payments arising from the financial assets have
expired or have been transferred, and the Group has essentially transferred all risks and
opportunities connected with ownership. Financial liabilities are derecognized if the obligations
have been satisfied, cancelled or expire.
"Financial assets and liabilities measured at fair value through profit or loss" and "available-for-
sale financial assets" are subsequently measured at fair value. Loans and receivables, as well as
financial liabilities which are measured at amortized cost are measured at amortized cost
applying the effective interest method.
Realized and unrealized gains and losses arising from the market value changes to financial
assets and financial liabilities that are "measured at fair value through profit or loss" are carried
through profit or loss in the period in which they arise. Unrealized gains and losses arising from
fair value changes to financial instruments categorized as "available-for-sale" are recognized
directly in equity.
All standard market purchases and sales of financial assets are recognized on the settlement
date, in other words, on the date on which an asset is delivered to, or by, the company.
Derivatives form an exception. They are recognized on their trade date.
Standard market purchases and sales comprise purchases or sales of financial assets that
prescribe the delivery of the assets within a period determined by market regulations or
conventions.
An appraisal is conducted on each balance sheet date as to whether objective indications exist
for the impairment of a financial asset, or group of financial assets. In the case of a financial asset
or group of financial assets, an impairment exists only if, as a consequence of one or several
events that have occurred after the initial recognition of the asset (loss-entailing event), an
objective indication for impairment exists, and this loss-entailing event (or loss-entailing events)
exert(s) an effect that can be reliably estimated on the estimated future cash flows of the financial
asset or group of financial assets.
The following comprise potential objective indications of impairment: Indications of financial
difficulties on the part of a customer or group of customers, non-compliance or non-payment of
interest or capital amounts, the probability of declaring insolvency or of being subject to another
type of financial restructuring, and identifiable facts that indicate a measurable reduction in
estimated future capital flows, such as unfavorable changes to a borrower's solvency, or a
financial situation in accordance with default.
(9) Leases The Group companies have entered into leases, including for operating and business equipment,
and vehicles. These are classified as either financing leases or operating leases pursuant to IAS
17. Leases for property, plant and equipment where the Group assumes the significant risks and
opportunities connected with ownership of the leased asset are classified as finance leases. IAS
17 includes rules to determine economic ownership of an asset based on the risks and
opportunities connected with the lease transaction. In the case of a finance lease, the leased
items are allocated to the lessee, whereas in the case of an operating lease they are allocated to
the lessor.

38
In the case of a finance lease, the leased item is capitalized at the start of the lease at the lower
of the fair value of the lease asset or the present value of the minimum lease payments. The
related lease obligations are reported under other non-current liabilities after deducting financing
costs. The lease installments are split into interest and redemption components. The interest
portion of the lease installments is calculated with a periodically unchanging return on the net
investment value over the lease duration, and reported in the income statement in the respective
period. Property, plant, and equipment acquired on the basis of finance leases are depreciated
over the shorter of either the normal useful operating life of the asset or the lease period.
Leases where the lessor retains the significant proportion of risks and opportunities connected
with ownership are designated as operating leases. The equally distributed lease instalments,
less any payments received from the lessor, are carried through profit or loss in the income
statement over the contractual duration of the lease.
(10) Inventories Inventories are measured at the lower of cost or net realizable value. The purchase costs of raw
materials are calculated using the weighted average. The production costs for finished goods and
work in progress include direct material costs, direct labor, other individual costs and other
production-related overheads. Production overheads also include reduction-related depreciation,
amortization and impairment losses. Borrowing costs and sales costs are not capitalized.
Net realizable value is the estimated sales price as part of normal business transactions less
production costs and sales expenses.
Appropriate discounts are applied to the net realizable value, as well as for poorly marketable or
outdated inventory items on the basis of historical data. If the net realizable value of previously
devalued inventories has risen, the related value adjustment is reversed.
(11) Trade receivables Trade receivables are reported at the original invoicing amount less valuation allowances.
Valuation allowances are taken into account if receivables are uncollectible or doubtful, and the
valuation allowance can be estimated reliably. The valuation allowance amount is calculated as
the difference between the carrying amount and the present value of the assumed payment
receipt, which is discounted by applying the original effective interest rate of the financial asset.
If the reasons for valuation allowances or other impairment losses no longer apply, the valuation
allowances or impairment losses are reversed, and the asset is written up accordingly.
(12) Cash and cash equivalents Cash and cash equivalents comprise cash in hand, demand deposits and other short-term highly
liquid financial assets due within six months. These are recorded in the balance sheet at
acquisition cost.
(13) Taxes Income taxes comprise all effective taxes that are levied on the current taxable earnings of the
subsidiaries included in the consolidated financial statements on the basis of their respective
national tax laws, as well as deferred taxes.
Effective tax reimbursement claims and tax liabilities for current and previous periods are
recognized at the amount at which reimbursement is expected from the tax authorities, or a
payment is expected to be made to the tax authorities. The amounts are calculated on the basis
of the respective national tax rates and tax laws prevailing on the balance sheet date.

39
Pursuant to IAS 12 (Income Taxes), deferred taxes are formed for all temporary differences
between the values of assets and liabilities recognized pursuant to IFRS, and the tax values
recognized for assets and liabilities (liability method), as well as for consolidation transactions and
tax loss carryforwards. Deferred tax assets are formed where it is likely that the resulting tax
reduction claims from the anticipated use will be realized.
The carrying amount of deferred tax assets is reviewed on each balance sheet date and reduced
to the extent that it is no longer probable that sufficient taxable earnings will be available against
which the deferred tax asset can be at least partially utilized. Unrecognized deferred tax
reimbursement claims are reviewed on each balance sheet date and recognized to the extent that
it is probable that future taxable earnings will enable realization of the deferred tax asset.In
application of IAS 12.39, no deferred taxes are recognized for temporary differences connected
with interests in subsidiaries, associated companies or joint ventures as it is unlikely that the
temporary differences will reverse within the foreseeable future.
Deferred tax receivables arising from temporary differences in relation to interests in subsidiaries,
in associated companies and in joint agreements are applied, unless the date of reversal of the
temporary differences can be determined by the Group and it is likely that the temporary
differences will not be reversed in the foreseeable future because of this influence. Deferred tax
receivables may only be applied to the extent that sufficient taxable income will be available
against which the temporary differences can be used.
Deferred taxes are calculated based on the respective nationally specific tax rates expected on
the realization date of the asset, or on the settlement date of the liability, in line with the statutory
regulations prevailing on the balance sheet date. To the extent that deferred tax assets need to
be taken into consideration that relate to consolidation bookings that cannot be attributed to
individual Group companies, the parent company's tax rate is applied. In line with IFRS, deferred
tax assets and deferred tax liabilities are not discounted deferred tax assets and deferred tax
liabilities are offset if an enforceable right exists to offset effective tax reimbursement claims
against effective tax liabilities, and these relate to income taxes for the same tax subject that are
levied by the same tax authority.
The value added tax amount that is reimbursed by the tax authority, or levied by the tax authority,
is reported in the balance sheet under receivables or liabilities.
Other taxes, such as those depending on consumption or assets, are included in production
costs, sales costs, research and development costs, and general administrative costs.
(14) Employee benefit a. Performance-related pension schemes
The Group companies operate various pension schemes depending on their national conditions
and circumstances. A defined benefit pension scheme is a pension scheme where the amount of
pension payments is determined on the basis of one or several factors such as age, number of
years' service, and compensation. Pursuant to IAS 19, every year, external actuaries calculate
obligations arising from defined benefit pension schemes applying the projected unit credit
method.
The FTE Group applies the revised IAS 19 that was published in June 2011.
Actuarial gains and losses based on adjustments and changes made to past actuarial
assumptions are recorded as "Other comprehensive income" directly in equity in the period they
arise.

40
Unvested past service costs are recognized in profit and loss when they occur. The expected
interest on the plan assets is calculated on the basis of the discount rate of the pension
obligations. Replenishment and settlement amounts for partial retirement and lifetime working
accounts are added in instalments through profit or loss over the remaining duration of the
employment relationship.
Obligations from defined benefit pension schemes are derived from the present value of the
defined benefit obligations on the reporting date, and adjustments for actuarial gains or losses.
The present value of the total obligation is recognized at the estimated future outgoing payments,
whereby interest rates derived from high-quality corporate bonds are applied that have maturities
similar to the related obligations.
Pension expenses are calculated from the annual actuarial calculations of the obligations and
include current costs for service and interest.
b. Defined contribution pension schemes
In the case of defined contribution pension schemes, the Company pays contributions for pension
schemes based on statutory or contractual provisions. Once the amounts have been paid, the
Company no longer has any further payment obligations. Current contribution payments are
reported as pension expenses in the respective year.
c. Benefits paid upon termination of an employment relationship
Termination benefits are paid as soon as an employee's employment relationship is terminated
before a planned retirement date, or as soon as an employee accepts a voluntary settlement as
compensation for such benefits.
The Group reports termination benefits if a proven obligation exists to terminate the employment
relationship of a currently employed individual pursuant to a detailed formal plan without an option
to withdraw from the arrangement, or to render payments based on an offer to support voluntary
early termination of employment relationships.
d. Bonus plans
Obligations from bonus schemes are reported among other obligations if at least one of the
following conditions is satisfied:
a formal scheme exists, and the amounts to be paid are determined before the financial
accounts are prepared; or
prior years' practice has generated a justified expectation among employees of a bonus
payment, and the amount can be determined before the preparation of the annual financial
statements.
Obligations from bonus schemes that are settled within twelve months are to be measured at the
prospective amount to be paid.
(15) Provisions Provisions are formed if the Group has a current (legal or de facto) obligation arising from a past
event, such an obligation will probably result in an outflow of resources comprising economic
benefits, and the level of the obligation can be reliably estimated. The amount of the provision
corresponds to the best possible estimate of the amount required to settle the current obligation
on the balance sheet date, whereby expected third-party reimbursements are not offset, but are
instead recognized as a separate asset if realization is as good as certain.
Non-current provisions with a residual term of more than one year are recognized at the amount
required to settle them, discounted to the balance sheet date on the basis of risk-adequate
market interest rates, if the interest effect is significant.

41
Provisions for warranties are formed on the date when the respective goods are sold, or the
respective services are rendered. The level of the provision is based on the historical trend of
warranties, and an observation of all future possible warranty cases weighted according to their
event probabilities.
If the Group expects a refund of a provision that is carried as a liability, the refund is capitalized
as a separate asset pursuant to IAS 37.53. If the refund is in a close economic relationship with
the obligation, the expense from the refund obligation is netted against the earnings from the
corresponding refund claim in the income statement.
(16) Government grants Pursuant to IAS 20, government grants are not reported until sufficient certainty exists that the
grants will actually be provided to the Group, and the Group will satisfy all preconditions required
by the claim.
All government grants in the form of investment subsidies and premiums, to the extent that they
relate to acquisition or production costs, are generally deducted from the acquisition or production
costs of the respective asset. All other grants are carried through profit or loss in the period in
which the corresponding expenses are incurred.
(17) Management judgements and assessments Preparing the consolidated financial statements pursuant to IFRS requires that assumptions and
discretionary decisions are reached and judgements are made that impact the valuation of the
accounted assets and liabilities, as well as the expenses and income.
Goodwill impairment testing
The Group conducts annual goodwill impairment testing. The recoverable amount of the cash-
generating unit (CTU) was calculated based on value in use. Such calculations are based on
assumptions. Changes in assumptions can result in changes to the value in use, possibly
resulting in the reporting of impairment losses.
Recognition and measurement of pension provisions and similar obligations
The present value of the pension obligation depends on many factors based on actuarial
assumptions. The assumptions applied when calculating net expenses (income) for pensions
include the discounting rate. Any changes to these assumptions can effects the present value of
the pension obligation.
Recognition and measurement of other provisions
The Group is obligated to pay income taxes in various countries. This necessitates significant
assumptions to calculate the global income tax provision. If the final taxation of business
transactions differs from that assumed at the start, this will affect both effective and deferred
taxes in the period in which the taxation is conclusively determined.
The provision for warranties is based on historical values that can differ from actual warranty
amounts. Current negotiations about warranty provisions with important customers might result in
adjustments to provisions in future periods.
All the assumptions and estimates are based on the current status of knowledge and currently
available data. Actual outcomes can differ from the estimates. If the actual amounts differ from
the estimated amounts, the carrying amounts of the liabilities are adjusted accordingly.

42
8. Interim Consolidated Financial Statements
as of June 30, 2016 of FTE Holding GmbH The following statements represent the English translation of the unaudited interim consolidated
financial statements as of June 30, 2016 according to International Financial Reporting Standards
(IFRS).
The condensed interim consolidated financial statements of FTE Holding GmbH as of
June 30, 2016 are prepared in thousand Euro. For purposes of this reporting the disclosures are
presented in million Euro.
(Translation - the German text is authoritative)
Consolidated Income Statement
(€ million)
January 1 to
June 30, 2016
January 1 to
June 30, 2015
April 1 to
June 30, 2016
April 1 to
June 30, 2015
Revenues 286.7 260.2 147.9 134.4
Cost of sales -223.7 -209.2 -113.7 -107.2
Gross profit
63.1
51.0
34.2
27.2
Distribution expenses
-7.1
-7.9
-3.6
-4.1
Administration expenses -11.0 -12.1 -5.5 -5.5
Research and development expenses -14.5 -11.4 -7.5 -5.6
Profit from operations
30.4
19.6
17.6
12.0
Results from associated companies and joint ventures
0.4
0.6
0.3
0.4
Finance income 2.1 1.7 1.2 0.6
Finance expenses -14.4 -15.8 -7.2 -6.8
Finance result -11.9 -13.5 -5.7 -5.8
Profit before income taxes
18.6
6.1
11.9
6.1
Income taxes
-7.9
-3.8
-4.6
-2.8
Deferred taxes 1.7 0.6 0.8 0.9
Net profit
12.4
2.9
8.2
4.3

43
Consolidated Statement of Comprehensive Income
(€ million)
January 1 to
June 30, 2016
January 1 to
June 30, 2015
Net profit
12.4
2.9
Foreign currency translation -1.8 2.7
Reclassifying profit / loss -1.8 2.7
Actuarial gains or losses on defined benefit plans -12.1 5.2
Deferred taxes 3.4 -1.5
Non-reclassifying profit / loss -8.7 3.7
Income and expenses recognized directly in other comprehensive income
-10.4 6.4
Total comprehensive expenses and income 1.9 9.3
Consolidated Statement of Balance Sheet
(€ million)
June 30, 2016
December 31, 2015
Non-Current Assets
Property, plant and equipment
110.4 110.3
Shares in associated companies and joint ventures
3.8 4.3
Other assets
0.4 0.5
Goodwill
97.5 97.5
Other intangible assets
118.5 121.7
Deferred tax assets
2.3 1.9
Non-current assets
333.0
336.2
Current Assets
Inventories
73.5 73.7
Trade receivables
91.1 65.2
Receivables shareholder 0.2 0.2
Income tax receivables
1.7 3.9
Other current assets
26.7 26.3
Cash and cash equivalents
25.8 40.5
Current assets
219.1
209.8
Total assets
552.1
546.0

44
(€ million)
June 30, 2016
December 31, 2015
Equity
Share capital
0.0 0.0
Capital reserve
90.6 90.6
Retained earnings -21.1 -19.1
Currency translation reserve -3.2 -1.4
Net result for the period
12.4 6.7
Total equity
78.7
76.8
Liabilities
Non-Current Liabilities
Notes
255.9 255.1
Pension provisions 78.2 66.0
Provisions
1.9 2.3
Other liabilities
0.4 0.7
Deferred tax liabilities 22.6 27.5
Non-current liabilities
358.9
351.7
Current Liabilities
Other financial liabilities
3.4 8.1
Trade payables
36.9 45.4
Pension provisions 1.7 1.8
Provisions
18.9 19.4
Other current liabilities 49.3 41.0
Current income tax liabilities 4.3 1.8
Current liabilities
114.5
117.5
Total liabilities
473.4
469.2
Total equity and liabilities
552.1
546.0
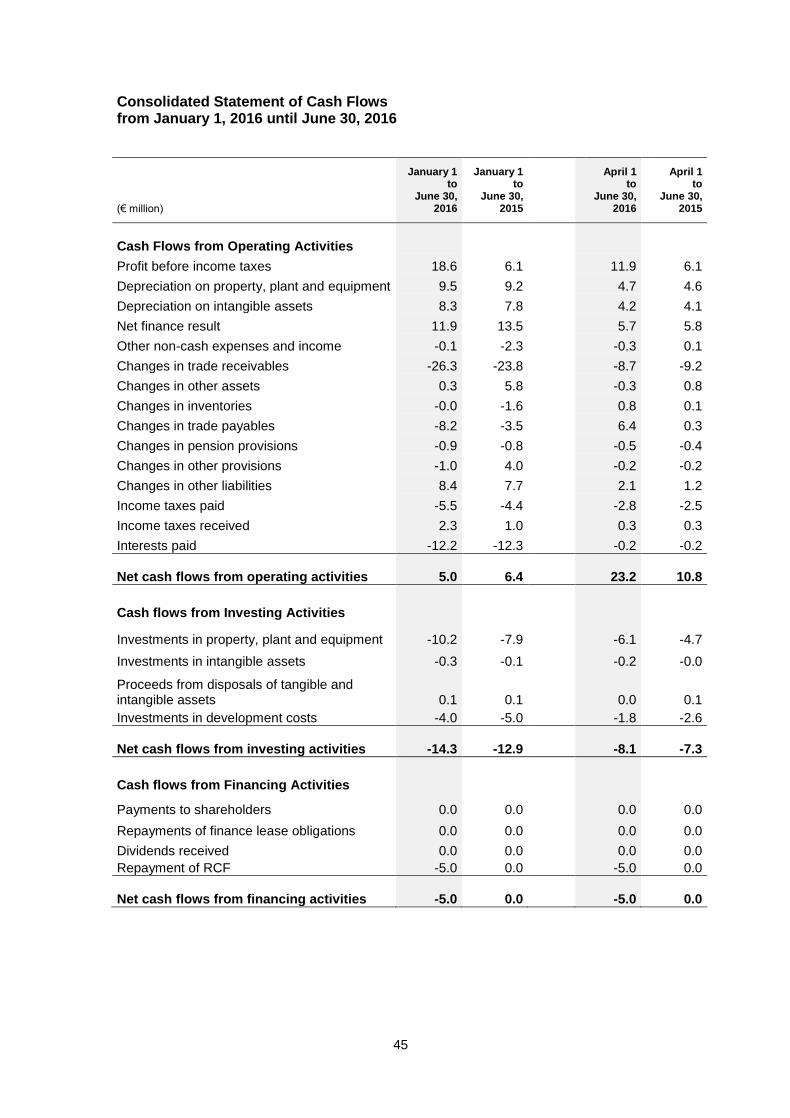
45
Consolidated Statement of Cash Flows from January 1, 2016 until June 30, 2016
(€ million)
January 1 to
June 30, 2016
January 1 to
June 30, 2015
April 1 to
June 30, 2016
April 1 to
June 30, 2015
Cash Flows from Operating Activities
Profit before income taxes 18.6 6.1 11.9 6.1
Depreciation on property, plant and equipment 9.5 9.2 4.7 4.6
Depreciation on intangible assets 8.3 7.8 4.2 4.1
Net finance result 11.9 13.5 5.7 5.8
Other non-cash expenses and income -0.1 -2.3 -0.3 0.1
Changes in trade receivables -26.3 -23.8 -8.7 -9.2
Changes in other assets 0.3 5.8 -0.3 0.8
Changes in inventories -0.0 -1.6 0.8 0.1
Changes in trade payables -8.2 -3.5 6.4 0.3
Changes in pension provisions -0.9 -0.8 -0.5 -0.4
Changes in other provisions -1.0 4.0 -0.2 -0.2
Changes in other liabilities 8.4 7.7 2.1 1.2
Income taxes paid -5.5 -4.4 -2.8 -2.5
Income taxes received 2.3 1.0 0.3 0.3
Interests paid -12.2 -12.3 -0.2 -0.2
Net cash flows from operating activities
5.0
6.4
23.2
10.8
Cash flows from Investing Activities
Investments in property, plant and equipment -10.2 -7.9 -6.1 -4.7
Investments in intangible assets -0.3 -0.1 -0.2 -0.0
Proceeds from disposals of tangible and intangible assets
0.1
0.1
0.0
0.1
Investments in development costs -4.0 -5.0 -1.8 -2.6
Net cash flows from investing activities
-14.3
-12.9
-8.1
-7.3
Cash flows from Financing Activities
Payments to shareholders 0.0 0.0 0.0 0.0
Repayments of finance lease obligations 0.0 0.0 0.0 0.0
Dividends received 0.0 0.0 0.0 0.0
Repayment of RCF -5.0 0.0 -5.0 0.0
Net cash flows from financing activities
-5.0
0.0
-5.0
0.0
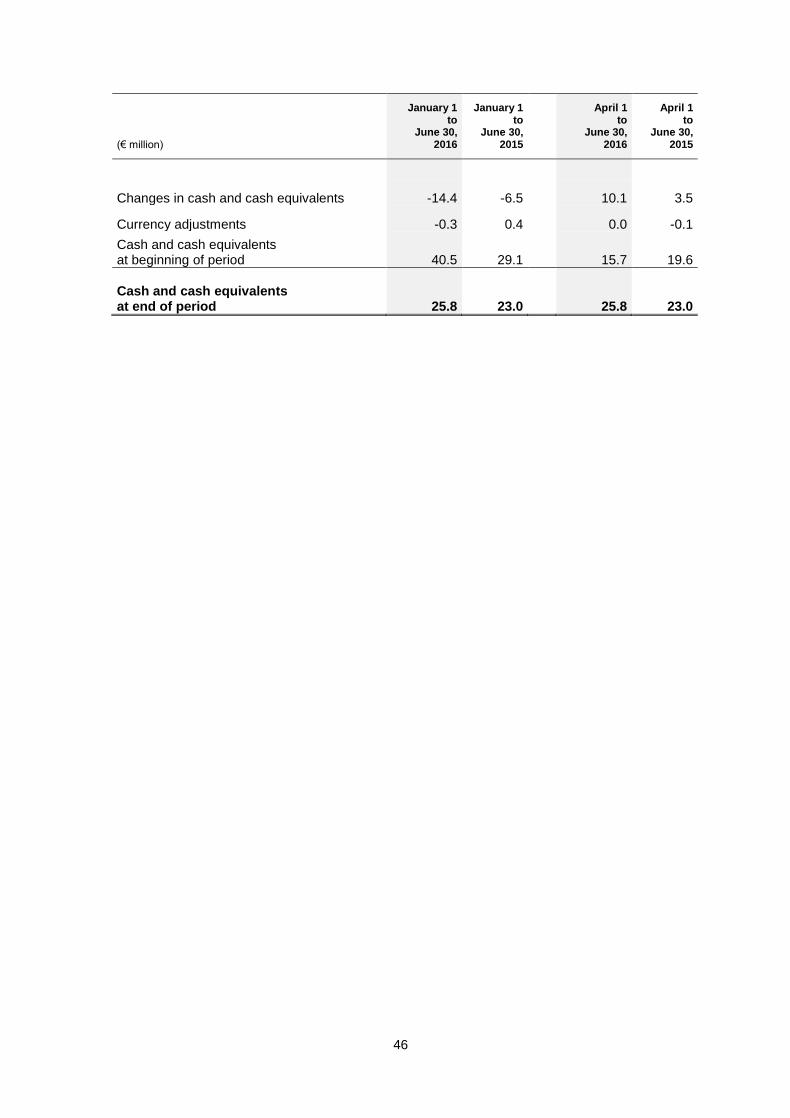
46
(€ million)
January 1 to
June 30, 2016
January 1 to
June 30, 2015
April 1 to
June 30, 2016
April 1 to
June 30, 2015
Changes in cash and cash equivalents -14.4 -6.5 10.1 3.5
Currency adjustments -0.3 0.4 0.0 -0.1
Cash and cash equivalents at beginning of period
40.5
29.1
15.7
19.6
Cash and cash equivalents at end of period
25.8
23.0
25.8
23.0

47
Consolidated Statement of Changes in Equity from January 1, 2016 until June 30, 2016
(€ million)
Share capital
Capital reserve
Retained earnings
Currency translation
reserve
Net profit
Total equity
January 1, 2016 0.0 90.6 -19.1 -1.4 6.7 76.8
Net profit 0.0 0.0 0.0 0.0 12.4 12.4 Not affecting net income realized in income and expenses
0.0
0.0
-8.7
0.0
0.0
-8.7
Foreign currency translation 0.0 0.0 0.0 -1.8 0.0 -1.8
Comprehensive income 0.0 0.0 -8.7 -1.8 12.4 1.9
Offset against retained earnings 0.0 0.0 6.7 0.0 -6.7 0.0
June 30, 2016 0.0 90.6 -21.1 -3.2 12.4 78.7
Consolidated Statement of Changes in Equity from January 1, 2015 until June 30, 2015
(€ million)
Share capital
Capital reserve
Retained earnings
Currency translation
reserve
Net profit
Total equity
January 1, 2015 0.0 90.6 -24.9 -2.5 1.5 64.7
Net profit 0.0 0.0 0.0 0.0 2.9 2.9
Not affecting net income realized in income and expenses 0.0 0.0 3.7 0.0 0.0 3.7
Foreign currency translation 0.0 0.0 0.0 2.7 0.0 2.7
Comprehensive income 0.0 0.0 3.7 2.7 2.9 9.3
Offset against retained earning 0.0 0.0 1.5 0.0 -1.5 0.0
June 30, 2015 0.0 90.6 -19.7 0.2 2.9 74.0

Notes
to the condensed interim consolidated
financial statements of FTE Holding GmbH
as of June 30, 2016

2
General Information
On June 2, 2016, FTE’s owner Bain Capital Private Equity signed an agreement to sell FTE to
Valeo Group. The transaction is subject to customary regulatory and anti-trust approvals and is
expected to be closed in the fourth quarter of 2016 or the first quarter of 2017.
Accounting principles and methods The consolidated interim financial statements of FTE Holding GmbH as of June 30, 2016 are, as
were the consolidated financial statements as of December 31, 2015, prepared in accordance
with International Financial Reporting Standards (IFRS). Particularly, the requirements of IAS 34
relating to interim financial reporting were applied.
All interim financial statements of companies incorporated in the consolidated interim financial
statements used the same uniform accounting and measurement methods as of
December 31, 2015.
Taking into consideration that an interim financial report is meant to build on the most recent
consolidated financial statements, we refer to the notes of the consolidated financial statements.
Therein, the applied accounting, measurement and consolidation principles as well as the applied
options under IFRS are extensively discussed.
In current period applicable standards and interpretations The accounting and valuation principles as well as the consolidation methods applied are
consistent with the preparation of the consolidated financial statements as of December 31, 2015.
A detailed explanation of these accounting policies is provided in the notes to the consolidated
financial statements as of December 31, 2015.
The following new standards and interpretations and amendments to existing standards became
effective on January 1, 2016 and have been applied in preparing the condensed consolidated
interim financial statements.
Since January 1, 2016 various regulations have come into force. These include amendments to
IAS 16 and IAS 41 (fructiferouse plants), IFRS 11 (joint arrangements) and IAS 16 as well as IAS
38 (acceptable method of depreciation).
The adoption of these standards had no material impact on the consolidated interim financial
statements of the Group.
For the condensed consolidated interim financial statements, the interest rate of 1.56 % for
pension provisions in Germany (December 31, 2015: 2.50 %) was used. The decrease of interest
rate resulted in an increase of pension provisions as well as related deferred taxes.
Consequently, actuarial losses for the pension provisions in retained earnings have been
realized.
Seasonal and cyclical factors
Seasonal and cyclical factors become noticeable during vacation and Christmas periods in terms
of decreasing revenues.
Consolidated companies
The consolidated interim financial statements as of June 30, 2016 include the financial
statements of FTE Holding GmbH and its subsidiaries as well as investments carried under the
equity method. On April 1, 2016 SFMC s.r.o. was merged into FTE automotive Slovakia s.r.o.
Employees
As of June 30, 2016 the Group employed 3,913 employees (June 30, 2015: 3,755 employees)
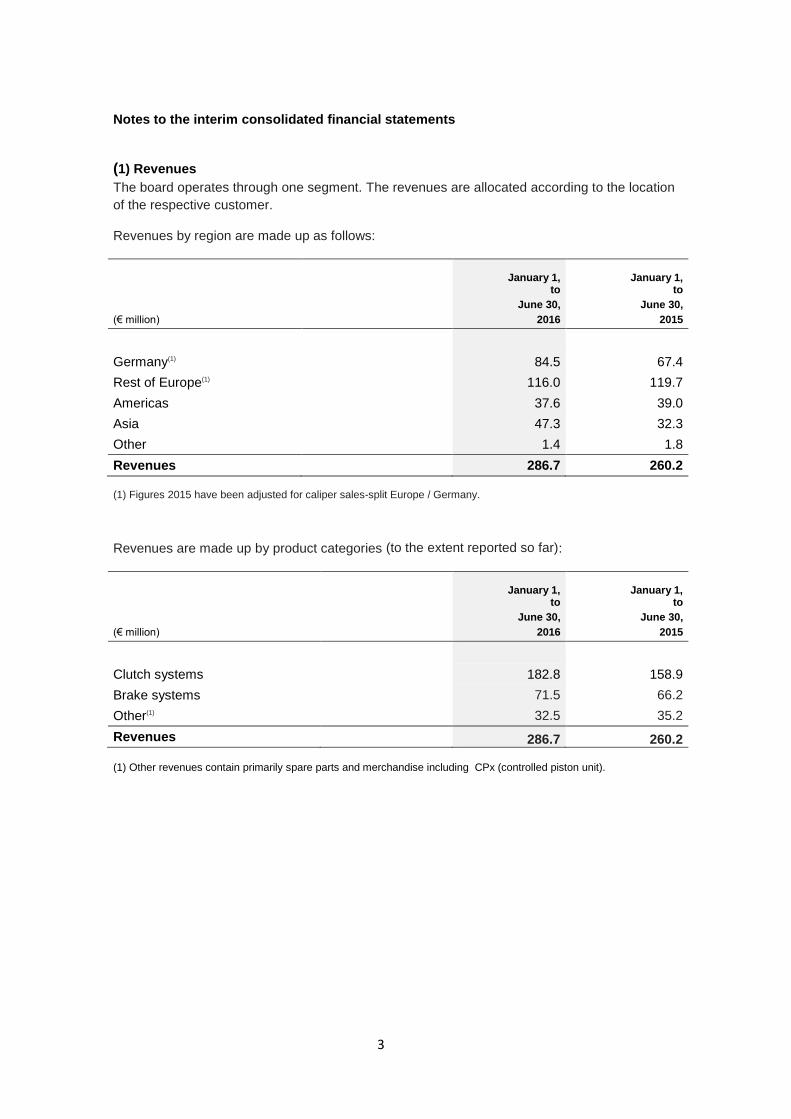
3
Notes to the interim consolidated financial statements
(1) Revenues
The board operates through one segment. The revenues are allocated according to the location
of the respective customer.
Revenues by region are made up as follows:
(€ million)
January 1,
to
June 30,
2016
January 1, to
June 30,
2015
Germany(1) 84.5 67.4
Rest of Europe(1) 116.0 119.7
Americas 37.6 39.0
Asia 47.3 32.3
Other 1.4 1.8
Revenues 286.7 260.2
(1) Figures 2015 have been adjusted for caliper sales-split Europe / Germany.
Revenues are made up by product categories (to the extent reported so far):
(€ million)
January 1,
to
June 30,
2016
January 1, to
June 30,
2015
Clutch systems 182.8 158.9
Brake systems 71.5 66.2
Other(1) 32.5 35.2
Revenues 286.7 260.2
(1) Other revenues contain primarily spare parts and merchandise including CPx (controlled piston unit).

4
Revenues are made up by product categories, reflecting our product portfolio changes:
January 1
to June 30,
January 1
to June 30,
(€ million) 2016 2015
BAT(1) 71.5 66.2
thereof brake calipers 25.3 25.9
MST(2) 149.9 149.4
EST(3) 43.7 26.6
EPT(4) 3.9 1.0
Other(5) 17.8 17.0
Revenues 286.7 260.2 (1) BAT is an acronym for Brake Actuation Technology including brake caliper business. (2) MST is an acronym for Manual Shift Transmission. (3) EST is an acronym for Electric Shift Transmission including CPx (controlled piston unit). (4) EPT is an acronym for Electric Pump Transmission. (5) Other revenues contain primarily spare parts and merchandise.
Revenues of € 97.2 million (previous year € 85.1 million) were generated with two customers in
the period from January 1, 2016 to June 30, 2016. Of this, € 76.2 million (previous year
€ 63.5 million) was attributable to one customer, and € 20.9 million (previous year € 21.6 million)
was attributable to the other customer. These revenues are mainly attributable to clutch and
brake systems.
(2) Research and development expenses
(€ million)
January 1,
to
June 30,
2016
January 1, to
June 30,
2015
Research and development expenses 19.3 16.4
Less capitalized development costs -4.8 -5.0
Research and development expenses 14.5 11.4
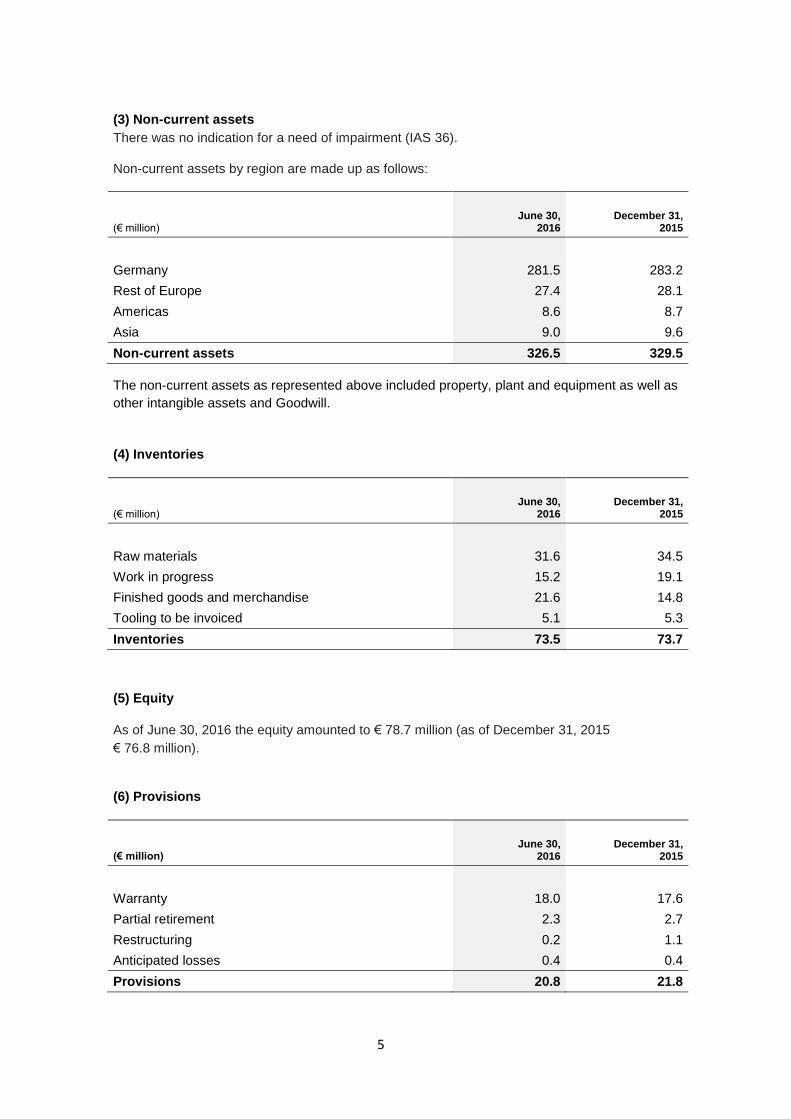
5
(3) Non-current assets
There was no indication for a need of impairment (IAS 36).
Non-current assets by region are made up as follows:
(€ million)
June 30, 2016
December 31, 2015
Germany 281.5 283.2
Rest of Europe 27.4 28.1
Americas 8.6 8.7
Asia 9.0 9.6
Non-current assets 326.5 329.5
The non-current assets as represented above included property, plant and equipment as well as
other intangible assets and Goodwill.
(4) Inventories
(€ million)
June 30, 2016
December 31, 2015
Raw materials 31.6 34.5
Work in progress 15.2 19.1
Finished goods and merchandise 21.6 14.8
Tooling to be invoiced 5.1 5.3
Inventories 73.5 73.7
(5) Equity
As of June 30, 2016 the equity amounted to € 78.7 million (as of December 31, 2015
€ 76.8 million).
(6) Provisions
(€ million)
June 30, 2016
December 31, 2015
Warranty 18.0 17.6
Partial retirement 2.3 2.7
Restructuring 0.2 1.1
Anticipated losses 0.4 0.4
Provisions 20.8 21.8

6
(7) Related parties disclosures according to IAS 24
The following services were provided to related parties or utilized by them.
Transactions with associated companies
The exchange of goods and services with APG-FTE automotive Co. Ltd. is presented below:
(€ million)
January 1,
to
June 30,
2016
January 1, to
June 30,
2015
Goods and services provided to APG-FTE automotive Co. Ltd.
1.0
1.4
(€ million)
June 30, 2016
December 31, 2015
Trade receivables to APG-FTE automotive Co. Ltd.
0.3
0.1
Transactions with shareholders
(€ million)
January 1,
to
June 30,
2016
January 1, to
June 30,
2015
Goods and services provided from shareholders (directly and indirectly)
0.5
0.4
(€ million)
June 30, 2016
December 31, 2015
Trade payables to shareholders (directly and indirectly)
0.2
0.3
Receivables to shareholders (directly and indirectly)
0.2
0.2

7
(8) Contingencies and other contingent liabilities
In the normal course of business the company and its subsidiaries are subject to various legal
proceedings and claims, including commercial or contractual disputes, product liability claims,
product warranties and other matters. It is the opinion of management that the outcome of such
matters will not have a material adverse impact on the consolidated financial position, results of
operations, or cash flow of the Group. With respect to warranty matters and connected claims,
although the Group can not ensure that the future costs of these claims by customers will not be
material, the Group believes its established reserves are adequate to cover potential settlements.
(9) Events after the balance sheet date
No material events occurred after the reporting date.
Ebern, 1st of August, 2016
FTE Holding GmbH
The Management Board