
HYPOTHYROIDISM Hypothyroidism Hypothyroidism is a clinical ...

FROM MUTATIONS TO DISEASE MECHANISM IN RETT SYNDROME,
BREAST CANCER, AND CONGENITAL HYPOTHYROIDISM
by
İbrahim Barış
B.S., Molecular Biology and Genetics, Boğaziçi Univesity, 2000
M.S., Molecular Biology and Genetics, Boğaziçi Univesity, 2002
Submitted to the Institute for Graduate Studies in
Science and Engineering in partial fulfillment of
the requirements for the degree of
Doctor of Philosophy
Graduate Program in Molecular Biology and Genetics
Boğaziçi University
2008

ii
FROM MUTATIONS TO DISEASE MECHANISM IN RETT SYNDROME,
BREAST CANCER, AND CONGENITAL HYPOTHYROIDISM
APPROVED BY:
Assoc. Prof. Esra Battaloğlu…………………………..….
(Thesis Supervisor)
Prof. A. Nazlı Başak………...…………………………….
Prof. Hande Çağlayan……………………………..………
Prof. Uğur Özbek………………………………………….
Assoc. Prof. Müge Türet Sayar …………………..……….
DATE OF APPROVAL: 10.06.2008

iii
to my family

iv
ACKNOWLEDGEMENTS
I would like to express my sincere gratitude to my thesis supervisor Assoc. Prof. Esra
Battaloğlu for her endless support and intimate encouragement throughout my thesis.
My appreciation is also extended to the members of my thesis committee Prof. A.
Nazlı Başak, Prof. Hande Çağlayan, Prof. Uğur Özbek, and Assoc. Prof. Müge Türet Sayar
for allocating their time to evaluate this work.
I would like to extend my gratitude to Boğaziçi University, Scientific Research
Projects Fund for funding the expenses of my thesis (Project No: 03S101 and 08B103D).
I am grateful to the CMT members Duygu, Çiğdem, İrem, Başak, and Dr. Rezan who
has provided a warm environment in the lab. I am also thankful to all Retina and plant
group members for creating best laboratory environment ever. I am grateful to my dear
friends Dr. Birdal Bilir and Dr. Yeşim Özmen for their valuable and wonderful friendship.
I would to extend my thanks to all my dear friends (Kader, İnanç, Sibel, and Murat) in the
department.
I wish to thank all of the academic staff, among whom I would like to mention Prof.
Kuyaş Buğra, Assoc. Prof. Muge Türet Sayar, and Assoc. Prof. Nesrin Özeren for their
kind support and encouragement.
I would like to express my great thanks to each of my family member, especially to
my parents for standing by my side at all time. I am grateful to my wife Tuğba who has
always supported, appreciated and encouraged me with his endless love and patience
throughout my life. Additionally, I would not complete my thesis work on time without her
help in DNA sequencing and quantitative analyses.
v
ABSTRACT
FROM MUTATIONS TO DISEASE MECHANISM IN RETT
SYNDROME, BREAST CANCER, AND CONGENITAL
HYPOTHYROIDISM
Epidemiological studies provide the correlative data to understand the etiology of
human inherited diseases and develop efficient genetic testing assays. Additionally, the
accumulated data of genetic and epigenetic findings, expression profiling, and proteomics
allows disease diagnosis, to understand the molecular mechanisms leading to the disease
pathogenesis, and to develop efficient therapeutic approaches. In the framework of this
thesis, we have investigated genetic and epigenetic changes and performed genotype-
phenotype correlations to unravel the molecular mechanisms that lead to three different
diseases, Rett Syndrome, breast cancer, and congenital hypothyroidism.
The genetic basis of Rett Syndrome (RTT) was investigated in a total of 71 RTT
patients. A heterogeneous spectrum of disease-causing MECP2 mutations was identified in
68.2 per cent of a clinically well defined group of cases whereas in only 12.5 per cent of
the patients referred for differential diagnosis suggesting that this gene does not represent a
major cause of the disease among patients with Rett-like features. For the first time, we
have identified gene duplications as causative mutations in female atypical RTT cases.
Consistent with the animal models, our results support the possibility that duplication of
MECP2 that leads to increased expression might underlie some cases of X-linked delayed-
onset neurobehavioral disorders including Rett Syndrome. Our results showed that exon
rearrangements that could not be detected by standard techniques contribute to 19.3 per
cent of these MECP2 mutations, and should be considered in especially RTT variants in
order to determine the actual significance of the gene in the etiology of RTT.
Genotype/phenotype correlation was performed based on comparison of severity score of
patients with the type and location of the mutation and the XCI pattern. The results did not
reveal a statistically significant correlation, but, the patients with exon deletions were
vi
found to be more severely affected than patients with all other types of mutations and
patients with exon duplications to present with severe eye contact problems. Additionally,
we have developed and validate a novel multiplexed amplification refractory mutation
system (ARMS) assay for identification of seven common mutations that accounts for
almost 65 per cent of all MECP2 gene mutations. The validation studies revealed that our
novel assay is an efficient, reliable, and cost-effective screen for molecular genetic testing
of patients with RTT. Furthermore, we tested the effect of DNA concentration on reliablity
and reproducibility of SYBR green dye-based Real Time PCR analysis to detect the
MECP2 exon rearrangments. The results suggested that Real Time PCR analysis is reliable
for determination of the exon copy number if the DNA amount is in the range of 1-50 ng.
To our knowledge, there are no known reports investigating the role of methylation
of hHR23A and hHR23B genes in the tumor tissues. We have characterized the 5' flanking
region of the hHR23A and hHR23B genes using web-based analysis and investigated the
involvement of methylation status of putative promoter region of hHR23A and hHR23B
genes in breast carcinogenesis. The observations of the hypermethylation of hHR23A gene
and the presence of methylated conserved motifs and transcription binding sites in
hHR23B gene among the analyzed tumor tissues suggested the involvement of methylation
of hHR23 genes in the breast carcinogenesis. Investigation of epigenetic changes in tumor
samples of breast cancer patients was a pioneering work since available literature
implicates its presence only in cell lines.
Since our CH patient was the first case with Bamforth Syndrome and suffered the
plasma cholinesterase deficiency, the genetic mechanisms leading to congenital
hypothyroidism and prolonged paralysis after mivacurium were investigated. In contrast to
other reported two patients with TTF2 gene mutation, the presence of thyroid tissue in our
patient suggested further phenotypic heterogeneity associated with human TTF-2
mutations. The functional study with a collaborative work also helped to understand the
genetic mechanisms and provided original evidence that implicated differential effects of
TTF-2 mutations on downstream target genes required for normal human thyroid
organogenesis.
vii
ÖZET
RETT SENDROMU, MEME KANSERİ, VE KONJENİTAL
HİPOTİROİDİZMDE MUTASYONLARDAN HASTALIK
MEKANİZMASINA
Epidemiyolojik çalışmalar, insan kalıtsal hastalıklarının etiyolojisinin anlaşılması ve
genetik testlerin geliştirilmesi için, karşılaştırmalı veriler sağlar. Bunun yanı sıra, genetik
ve epigenetik bulgular, anlatım profilleri ve proteomiksden elde edilen bilgi birikimi,
hastalık tanısına, hastalık patogenezine neden olan moleküler mekanizmaların
anlaşılmasına ve doğru töropatik yaklaşımların geliştirilmesine ışık tutar. Bu tez çalışması
kapsamında, üç farklı hastalığa, Rett Sendromu (RTT), meme kanseri ve Konjenital
Hipotiroidizme (CH), neden olabilecek mekanizmaları aydınlatmak amacıyla genetik ve
epigenetik değişimler incelendi ve genotip-fenotip karşılaştırması yapıldı.
RTT’nin genetik temeli toplam 71 hastada incelendi. Kesin klinik tanı alan hastaların
yüzde 68.2’sinde heterojen dağılım gösteren ve hastalığa neden olduğu bilinen MECP2 gen
mutasyonları tanımlanırken, ayırımcı tanı amacıyla yönlendirilen hastaların sadece yüzde
12.5’inde mutasyonların belirlenmesi, sözkonusu genin, RTT-benzeri özellikler gösteren
hastalar için majör neden olamayacağını düşündürdü. Atipik RTT olgularında, ilk defa, gen
duplikasyon mutasyonlarının hastalığa neden olabileceği gösterildi. Hayvan
modellerindeki bulgularla örtüşen sonuçlar, duplikasyonların, MECP2 anlatımının
artmasına ve Rett Sendromunu da içeren bazı X’e bağlı geç-başlangıçlı nörodavranışsal
hastalıklara neden olabileceği olasılığını destekledi. Sonuçlar, standart teknikler ile
tanımlanamayan ekson düzenlenme bozukluklarının, mutasyonların yüzde 19.3’ünü
kapsadığını ve sözkonusu genin RTT etiyolojisine gerçek katkısının belirlenmesi açısından
özellikle RTT varyantlarında araştırılması gerektiğini gösterdi. Hastalık şiddeti skorları ile
mutasyonların tipi ve konumlarının, ve XCI paterninin karşılaştırılması temeline dayanan
genotip/fenotip korelasyonu gerçekleştirildi. Bulgular istatiksel olarak anlamlı bir
korelasyonu desteklemese de ekson delesyonu taşıyan hastaların diğer tüm mutasyon
viii
tiplerini taşıyan hastalardan daha şiddetli etkilendikleri ve ekson duplikasyonu olan
hastalarda şiddetli göz kontağı problemi olduğu bulundu. Ayrıca bilinen tüm MECP2 gen
mutasyonlarının yüzde 65’ini oluşturan ve en sık görülen yedi mutasyonun tanımlanması
amacıyla yeni bir multipleks amplifikasyon refrakter mutasyon tanımlama sistemi (ARMS)
geliştirildi ve geçerliliği sınandı. Yeni metodun RTT hastalarının moleküler genetik
analizinde kullanılabilecek elverişli, güvenilir, ve düşük maliyetli bir test olduğu gösterildi.
Bunun yanı sıra, DNA konsantrasyonunun, MECP2 ekson düzenleme bozukluklarının
belirlenmesinde kullanılan SYBER yeşili boya-bazlı Gerçek Zamanlı PCR analizinin
güvenilirliği ve tekrarlanabilirliği üzerindeki etkisi irdelendi. Ayrıca, ekson kopya
sayısının belirlenmesi çalışmalarında, DNA miktarının 1-50 ng aralığında olduğu
durumlarda Gerçek Zamanlı PCR analizinin güvenilir sonuçlar verdiği gösterildi.
Bilgimiz dahilinde, tümör dokularında hHR23A and hHR23B gen metilasyonlarının
rolünü araştıran raporlar bulunmamaktadır. Bu konuda katkı sağlamak amacıyla
sözkonusu genlerin 5’ uçları web tabanlı analiz kullanılarak karakterize edildi ve olası
promotör bölgelerinin metilasyon durumunun meme karsinogenezindeki rolü incelendi.
Analiz edilen tümör dokularında hHR23A gen hipermetilasyonunun gözlenmesi ve
hHR23B geninde korunmuş metilasyon motifleri ve transkripsiyon bağlanma bölgelerinde
metilasyon bulunması hHR23 genlerinin metilasyonunun meme kanseri oluşumunda yer
alabileceğini düşündürdü. Literatürde epigenetik değişimlerin sadece hücre hatlarında
gösterilmiş olması nedeniyle meme kanseri hastalarının tümör dokularında bu değişimlerin
araştırılması öncü bir çalışma niteliğindedir.
Tez kapsamında incelenen konjenital hipotiroidizm (CH) hastası ilk Bamford
Sendromlu olgu olması ve plazma kolin esteraz yetersizliği göstermesi nedeniyle CH’e ve
mivacurim kullanımı sonrası uzun paralize neden olan mekanizmanın aydınlatılması
amacıyla incelendi. TTF2 gen mutasyonu olduğu bilinen diğer iki hastanın aksine
hastamızda tiroid bezinin varlığının belirlenmesi insanda TTF2 mutasyonları ile ilişkili
fenotipik heterojenliğin bilinenden fazla olduğunu ortaya çıkardı. Uluslararası ortak bir
çalışma ile gerçekleştirilen işlevsel analizler de genetik mekanizmanın anlaşılmasına
yardımcı oldu ve TTF2 mutasyonlarının normal insan tiroid organogenezinde rol alan
hedef genler üzerindeki farklı etkilerine işaret eden özgün kanıt sağladı.
ix
TABLE OF CONTENTS
ACKNOWLEDGEMENTS ....................................................................................... iv
ABSTRACT .............................................................................................................. v
ÖZET ........................................................................................................................ vii
LIST OF FIGURES ................................................................................................... xiv
LIST OF TABLES .................................................................................................... xix
LIST OF ABBREVIATIONS .................................................................................... xxi
1. INTRODUCTION ................................................................................................ 1
1.1. Epigenetics .................................................................................................... 1
1.1.1. Epigenetics ......................................................................................... 1
1.1.2. DNA Packaging .................................................................................. 1
1.1.3. Epigenetic Modifications .................................................................... 3
1.1.3.1. CpG and non-CpG Methylation ............................................. 3
1.1.3.2. Histone Modification ............................................................. 5
1.2. Rett Syndrome .............................................................................................. 6
1.2.1. Historical Background ........................................................................ 6
1.2.2. Clinical and Neuropathological Charecteristics ................................... 6
1.2.3. Phenotypic Variability in RTT ............................................................ 8
1.2.4. Genetic Basis of RTT ......................................................................... 8
1.2.5. MECP2 Gene ..................................................................................... 9
1.2.6. CDKL5 Gene ..................................................................................... 11
1.2.7. MECP2 Mutation Profile .................................................................... 11
1.2.8. MeCP2 Function ................................................................................. 13
1.2.8.1. Transcription Regulation and Chromatin Remodeling ........... 13
1.2.8.2. RNA Splicing ........................................................................ 15
1.2.9. Mouse Models of RTT ........................................................................ 17
1.2.10. MeCP2 Target Genes and Their Relevance with Disease .................. 18
1.3. Breast Cancer ................................................................................................ 20
1.3.1. Breast Tissue ...................................................................................... 20
1.3.2. Breast Cancer Risk ............................................................................. 21
1.3.3. Breast Carcinogenesis ......................................................................... 24
x
1.3.4. DNA Methylation and Genetic Instability ........................................... 27
1.3.5. DNA Repair System ........................................................................... 28
1.3.6. hHR23 (RAD23) Genes ...................................................................... 31
1.4. Congenital Hypothyroidism .......................................................................... 35
1.4.1. The Thyroid Gland ............................................................................. 35
1.4.2. Congenital Hypothyroidism ................................................................ 36
1.4.3. Forkhead Gene Family ....................................................................... 37
1.4.4. Human TTF-2 Gene ............................................................................ 39
1.4.5. Thyroid Development and TTF-2 ....................................................... 42
1.4.6. TTF-2 Gene Mutations ....................................................................... 43
1.4.7. Plasma Cholinesterase Deficiency ...................................................... 44
2. AIM ..................................................................................................................... 45
3. MATERIALS ....................................................................................................... 47
3.1. Subjects and Samples .................................................................................... 47
3.2. Chemicals ..................................................................................................... 47
3.3. Fine Chemicals ............................................................................................. 47
3.3.1. Enzymes ............................................................................................. 47
3.3.2. Oligonucleotide Primers ..................................................................... 48
3.3.3. DNA Size Marker ............................................................................... 51
3.4. Kits ............................................................................................................... 51
3.5. Buffers and Solutions .................................................................................... 51
3.5.1. DNA Extraction from Peripheral Blood .............................................. 51
3.5.2. Polymerase Chain Reaction (PCR) ..................................................... 52
3.5.3. Agarose Gel Electrophoresis ............................................................... 52
3.5.4. Polyacrylamide Gel Electrophoresis ................................................... 53
3.5.5. Silver Staining .................................................................................... 53
3.6. Equipments ................................................................................................... 54
4. METHODS .......................................................................................................... 56
4.1. Molecular Basis of Rett Syndrome (RTT) ..................................................... 56
4.1.1. DNA Extraction from Peripheral Blood .............................................. 56
4.1.2. Quantitative Analysis of the Extracted DNA ....................................... 56
4.1.3. Mutation Analysis of MECP2 Gene .................................................... 57
4.1.3.1. Restriction Endonuclease Analysis ........................................ 57
xi
4.1.3.2. Single Strand Conformation Polymorphism ........................... 57
4.1.3.3. Preparation of SSCP Gels ...................................................... 58
4.1.3.4. SSCP Electrophoresis ............................................................ 59
4.1.3.5. Silver-Staining ...................................................................... 59
4.1.4. DNA Sequence Analysis .................................................................... 59
4.1.5. Quantitative Real Time PCR ............................................................... 59
4.1.6. Quantitative Fluorescent Multiplex PCR Assay .................................. 60
4.1.7. X Chromosome Inactivation ............................................................... 61
4.1.7.1. Preparation of Denaturing Polyacrlamide Gels ...................... 61
4.1.7.2. Electrophoresis of PCR Products ........................................... 61
4.1.8. Clinical Severity Score Analysis ......................................................... 62
4.1.8.1. Clinical Severity Score .......................................................... 62
4.1.8.2. Huppke Scoring .................................................................... 62
4.1.8.3. Statistical Analyses ............................................................... 62
4.1.9. Multiplexed ARMS-PCR Approach for the Detection of Common
MECP2 Mutations .............................................................................. 62
4.1.9.1. Primer Design ....................................................................... 62
4.1.9.2. PCR Conditions .................................................................... 64
4.1.9.3. p.R106W Mutation Detection ................................................ 65
4.1.9.4. PCR-RFLP and DNA Sequencing ......................................... 65
4.1.10. The Effect of DNA Concentration on Reliability and Reproducibility
of SYBR Green Dye-based Real Time PCR Analysis to Detect the
exon Rearrangements Clinical Severity Score Analysis ....................... 65
4.1.10.1. Preparation of DNA Samples .............................................. 65
4.1.10.2. Quantitative Real Time PCR Conditions ............................. 65
4.1.10.3. Quantification ..................................................................... 66
4.1.10.4. Statistical Analysis .............................................................. 66
4.2. Methylation Analyses of the Putative Promoter Region of hHR23 Genes in
Breast Tumor Tissues .................................................................................... 67
4.2.1. Non-heating DNA Extraction Protocol ............................................... 67
4.2.2. Promoter Region Analyses and Primer Design .................................... 67
4.2.3. Bisulfite Modification ......................................................................... 68
4.2.4. Amplification and Sequencing of the Bisulfite Modified DNA ........... 68
xii
4.3. Molecular Basis of Congenital Hypothyroidism (CH) ................................... 69
4.3.1. Mutation Analysis of the TTF2 Gene .................................................. 69
4.3.1.1. Direct DNA Sequencing Analysis ......................................... 69
4.3.1.2. AlwNI Digestion .................................................................... 70
4.3.2. Functional Characterization of p.R102C Mutant TTF2 ....................... 70
4.3.3. Mutation Analysis of Butyrylcholinesterase (BChE) Gene .................. 70
5. RESULTS ............................................................................................................ 72
5.1. Molecular Basis of Rett Syndrome ................................................................ 72
5.1.1. Patients ............................................................................................... 72
5.1.2. Mutation Analysis of MECP2 Gene .................................................... 72
5.1.3. Quantitative PCR Analyses ................................................................. 74
5.1.4. X Chromosome Inactivation Status ..................................................... 84
5.1.5. Genotype–Phenotype Correlations ...................................................... 85
5.1.6. Prenatal Diagnosis .............................................................................. 85
5.1.7. Multiplexed ARMS-PCR Approach for the Detection of Common
MECP2 Mutations .............................................................................. 88
5.1.7.1. Assay Optimization ............................................................... 88
5.1.7.2. Validation of the Assay ......................................................... 88
5.1.8. The Effect of DNA Concentration on Reliability and Reproducibility
of SYBR Green Dye-based Real Time PCR Analysis to Detect the
Exon Rearrangements ......................................................................... 90
5.1.8.1. Comparison of Quantification Methods ................................. 91
5.1.8.2. Quantification ....................................................................... 91
5.2. Methylation Analyses of the Putative Promoter Region of Rad23 Genes in
Breast Tumor Tissues .................................................................................... 96
5.2.1. Characterization of the 5' flanking region of the hHR23 Genes ........... 96
5.2.1.1. hHR23A Gene ....................................................................... 96
5.2.1.2. hHR23B Gene ....................................................................... 96
5.2.2. Bisulfite Sequencing of hHR23A and hHR23B in paraffin-embedded
tissues ................................................................................................. 97
5.2.2.1. hHR23A ................................................................................ 98
5.2.2.2. hHR23B ................................................................................ 103
5.3. Molecular Basis of Congenital Hypothyroidism ............................................ 110
xiii
5.3.1. Clinical Features of the Patient ........................................................... 110
5.3.2. Mutation Analysis of the TTF2 Gene .................................................. 110
5.3.3. Functional Characterization ................................................................ 113
5.3.4. Mutation Analysis of Butyrylcholinesterase (BChE) Gene .................. 113
5.3.4.1. PCR-RFLP ............................................................................ 114
6. DISCUSSION ...................................................................................................... 115
6.1. Molecular Basis of Rett Syndrome ................................................................ 115
6.1.1. Multiplexed ARMS-PCR Approach for the Detection of Common
MECP2 Mutations .............................................................................. 120
6.1.2. The Effect of DNA Concentration on Reliability and Reproducibility
of SYBR Green Dye-based Real Time PCR Analysis to Detect the
Exon Rearrangements ......................................................................... 122
6.2. Methylation Analyses of the Putative Promoter Region of hHR23 Genes in
Breast Tumor Tissues .................................................................................... 124
6.3. Molecular Basis of Congenital Hypothyroidism ............................................ 130
6.3.1. Mutation Analysis of Butyrylcholinesterase (BChE) Gene .................. 132
7. CONCLUSION .................................................................................................... 133
REFERENCES .......................................................................................................... 134
LIST OF FIGURES
xiv
Figure 1.1. Schematics of epigenetic modifications (a) and reversible changes in
chromatin organization (b) that influence the gene expression................. 2
Figure 1.2. DNA methylation can silence genes by either direct (a) or indirect
mechanisms (b) ...................................................................................... 4
Figure 1.3. The MECP2 gene (a) and its protein product (MeCP2A) with conserved
domains (b) ............................................................................................ 11
Figure 1.4. Mechanisms of methylation dependent (a) and independent (b)
transcription regulation and chromatin remodeling ................................. 15
Figure 1.5. Regulation of imprinted regions through formation of a silent chromatin
loop (a) Transcriptionally inactive (b) active conformation .................... 16
Figure 1.6. Regulation of alternative splicing by MeCP2; (a) RNA splicing in the
presence of MeCP2 and (b) aberrant splicing in the absence of MeCP2 .. 16
Figure 1.7. MeCP2 target genes and their relevance with the disease ....................... 20
Figure 1.8. A schematic diagram of a normal female breast ..................................... 21
Figure 1.9. Simplified multi-step model of breast cancer progression based on
morphological features ........................................................................... 24
Figure 1.10. View of breast carcinogenesis from a DNA methylation standpoint ....... 25
Figure 1.11. Model for mechanism of global genome nucleotide-excision repair and
transcription-coupled repair ................................................................... 30
xv
Figure 1.12. Schematic representations of conserved domains in hHR23A (a) and
hHR23B (b) proteins .............................................................................. 31
Figure 1.13. Thyroid hormone cascade ...................................................................... 36
Figure 1.14. Alignment of the TTF2 forkhead DNA-binding domain with selected
human FOX representatives ................................................................... 38
Figure 1.15. Three-dimentional structure of the forkhead domain of FoxC2 (mouse) . 39
Figure 1.16. Nucleotide sequence of the human TTF2 gene and deduced amino acid
sequence ................................................................................................ 41
Figure 4.1. Schematic representation of primer positions on MECP2 gene nucleotide
sequence ................................................................................................ 63
Figure 4.2. Semi-nested PCR strategy showing the primers and PCR cycling
conditions used to investigate the methylation status of hHR23 genes .... 69
Figure 5.1. PCR-RFLP analysis for the detection of the common MECP2 mutations
in patients R17 (a), R24 (b), R6 (c), R29 (d), and R16 (e) ...................... 73
Figure 5.2. Schematic representation of the MeCP2 (a) and MECP2 gene (b) showing
the position of the mutations identified in this study ............................... 75
Figure 5.3. SSCP gels showing altered migration patterns for patients R3 (a), R2 (b),
R8 (c), R46 (d), and R47 (e) with novel MECP2 gene mutations ............ 76
Figure 5.4. Chromatograms showing sequencing profiles of sense (left panel) and
antisense (right panel) strands of MECP2 gene for the novel mutations
identified in the present study ................................................................ 77
xvi
Figure 5.5. A representative Real Time analysis for a healthy female (a), R5 with
exon 3 deletion (b), and R19 with exon 3 duplication (c), respectively ... 80
Figure 5.6. The plots of quantitative Real Time PCR and QF-PCR analyses results . 82
Figure 5.7. A representative QF-PCR analysis for a healthy female (a), R5 with
exon 3 deletion (b), and R19 with exon 3 duplication (c), respectively ... 83
Figure 5.8. QF-PCR analysis of patient R33 ............................................................ 84
Figure 5.9. X chromosome inactivation analysis of patients with skewed (a),
random (b), and non-informative (c) XCI pattern, respectively ............... 84
Figure 5.10. Agarose gel electrophoresis showing the prenatal diagnosis performed
in the families of the patient R29 with p.T158M (a), patient R42 with
p.L386Hdel12 (b), and patient R69 with p.R255X mutations (c) ............ 86
Figure 5.11. Agarose gel electrophoresis of multiplex ARMS PCR assay products .... 89
Figure 5.12. A representative multiplex ARMS-PCR assay analysis .......................... 89
Figure 5.13. Evaluation of the multiplexed ARMS-PCR assay using RTT patient
samples with known mutations .............................................................. 90
Figure 5.14. The summary of the Real Time PCR analysis of MECP2 exon 3
rearrangements using 0.1 – 200 ng DNA ................................................ 95
Figure 5.15. The profile of the amplification products of sample R5 with different
concentrations of template DNA ............................................................ 95
Figure 5.16. Melting curve analysis for PCR products of sample R5 using 0.1, 10, 50,
200 ng DNA .......................................................................................... 95
xvii
Figure 5.17. MethPrimer program output showing the CpG islands and the
investigated region at 5’ of the hHR23A gene ........................................ 97
Figure 5.18. MethPrimer program output showing the CpG island and the
investigated sequence in 5’ flanking region of hHR23B gene ................. 97
Figure 5.19. Agarose gel electrophoresis showing the quality of the genomic DNAs
isolated from paraffin embedded tissues ................................................. 98
Figure 5.20. Methylation analysis of 5’ flanking region of the hHR23A gene ............ 100
Figure 5.21. Bisulfite sequencing of 5’flanking region of hHR23A gene in tumor
adjacent tissue of patient Rad31 ............................................................. 101
Figure 5.22. Bisulfite sequencing of 5’flanking region of hHR23A gene in tumor
tissue of patient Rad31 ........................................................................... 102
Figure 5.23. Chromatogram showing the bisulfite sequencing of 5’flanking region
of hHR23B gene in the tumor tissue of patient Rad22 ............................ 104
Figure 5.24. Methylation analysis of 5’ flanking region of the hHR23B gene ............ 106
Figure 5.25. Axial postcontrast CT image of the patient reveals a slightly enlarged
thyroid gland (arrows) in the paratracheal region with absent contrast
enhancement (a). Comparative imaging of the thyroid gland (arrows) in
a healthy 9-yr-old child (b) .................................................................... 111
Figure 5.26. DNA sequencing profile of the TTF-2 gene showing mutation in
homozygous condition in the patient (a). Her unaffected mother is
heterozygous for the mutation (b) ........................................................... 111
Figure 5.27. Alignment of the TTF-2 forkhead DNA-binding domain with selected
FOX proteins between species (a) and within human proteins (b) ........... 112

xviii
Figure 5.28. Two per cent agarose gel showing AlwNl digestion results for the patient
and her family members ......................................................................... 113
Figure 5.29. Sau3AI (upper panel) and Alul (lower panel) digestion analyses for the
patient and her parents (C: normal individual) ........................................ 114
xix
LIST OF TABLES
Table 1.1. The list of methylated genes in breast cancer ........................................... 26
Table 3.1. Sequence of the primers used for exon amplification of the MECP2
gene sequence ........................................................................................ 48
Table 3.2. Primers used in X chromosome inactivation analysis ............................. 49
Table 3.3. Sequences and PCR conditions for the primers used in quantitative Real
Time PCR analysis ................................................................................. 49
Table 3.4. Sequence of the primers used in quantitative fluoresent multiplex PCR
analysis .................................................................................................. 49
Table 3.5. Sequence of the primers used in methylation analyses of the putative
promoter region of hHR23A and hHR23B genes ................................... 50
Table 3.6. Sequence of the primers used for exon amplification of the TTF2 gene .. 50
Table 3.7. Sequence of the primers used for exon amplification of the BChE gene . 51
Table 4.1. The list of the MECP2 gene mutations analyzed by PCR-RFLP method . 58
Table 4.2. Primer sequences and concentrations used in the two panels for
multiplexed ARMS-PCR assay .............................................................. 64
Table 5.1. The age, gender, and clinical and genetic features of the first group of
47 patients ............................................................................................. 78
Table 5.2. Quantitative Real Time PCR and QF-PCR analyses result........................ 81
xx
Table 5.3. Mean Phenotypic Severity Scores of the female patients of first group ... 87
Table 5.4. Ct values obtained from real time PCR analysis on different amounts
of DNA .................................................................................................. 92
Table 5.5. Methylation analysis results for the 5’ flanking region of hHR23A ......... 99
Table 5.6. Results of methylation analysis for 5’ flanking region of hHR23B .......... 105
Table 5.7. The histopathological and epigenetic findings of the tumor tissue
analyzed in this study ............................................................................. 107
xxi
LIST OF SYMBOLS / ABBREVIATIONS
R Arginine
T4 Thyroxine
W Tryptophan
X Stop
5meC 5- methyl cytosine
APS Ammoniumpersulfate
ARMS Amplification refractory mutation system
AS Angelman syndrome
BChE Butyrylcholinesterase
BDNF Brain-derived neurotrophic factor
BER Base excision repair
Bp Base pair
BSA Bovine serum albumine
C Cysteine
cAMP Cyclic adenosine 5’-monophosphate
CDKL5 cyclin-dependent kinase like 5
cDNA Complementary deoxyribonucleic acid
CH Congenital hypothyroidism
CNS Central nervous system
CT Computed tomography
CREB Cyclic AMP-responsive element binding
CRH Corticotropin-releasing hormone
DCIS Ductal carcinoma in situ
DLX5 Distal-less homeobox 5
DNA Deoxyribonucleic acid
DNMT DNA methyltransferase
dNTP Deoxynucleosidetriphosphate
ECG Electrocardiography
EEG Electroencephalogram
xxii
H Histone
FHD Forkhead domain
Fkbp5 FK506-binding protein 5
GG-NER Global genome nucleotide excision repair
GST Glutathione S-transferase
HATs Histone acetyltransferases
HDACs Histone deacetylases
IDC Invasive (infiltrating) ductal carcinoma
ILC Invasive lobular carcinomas
KD Knockdown
KO Knockout
LCIS Lobular carcinoma in situ
LTP Long-term potentiation
MBD Methyl binding domain
MDM2 Mouse double minute 2
MECP2 methyl-CpG-binding protein 2
Mecp2 mause methyl-CpG-binding protein 2
Mecp2_/_ Mecp2-null female
Mecp2_/y Mecp2-null male
MgCl2 Magnesium Chloride
mM Milimolar
mRNA Messenger ribonucleic acid
MRX X-linked mental retardation
NER Nucleotide excision repair
NIS Sodium iodide transporter
NLS Nuclear localization signals
Nm nanometer
OD260 Optical density at 260 nm
PAGE Poly acrylamide gel electrophoresis
PChE Pseudocholinesterase
PCR Polymerase chain reaction
PRNP Prion protein
PSV Preserved speech variant
xxiii
QF-PCR Quantitative fluorescent multiplex PCR
RBC Red blood cell
RNA Ribonucleic acid
ROS Reactive oxygen species
Rpm Revolution per minute
RTT Rett syndrome
SDS Sodium dodecyl sulfate
Sgk1 Serum glucocorticoid-inducible kinase 1
SSCP Single strand conformation polymorphism
STI1 Stress-induced phosphoprotein
STK9 Serine/threonine kinase 9
T3 Triiodothyronine
TBE Tris-base- boric Acid- Edta
TC-NER Transcription-coupled nucleotide excision repair
TE Tris-Edta
TEMED N,N,N',N'-Tetramethylethylenediamine
TFC Follicular cells
TFIIH Transcription factor IIH
TG Thyroglobulin
TPO Thyroid peroxidase
TRD Transcription repression domain
TSHR TSH receptor
TTF Thyroid transcription factors
UBA Ubiquitin-associated
UBE3A Ubiquitin ligase E3A
UBL Ubiquitin-like
UV Ultraviolet
XCI X-chromosome inactivation
XPC Xeroderma pigmentosum group C
YB1 Y box-binding protein 1
1
1. INTRODUCTION
1.1. Epigenetics
1.1.1. Epigenetics
Epigenetics refers to stable and heritable changes in gene expression that are not
directly attributable to DNA sequence alterations. These changes may affect the expression
of a gene or the properties of its product. Epigenetic mechanisms provide an “extra” level
of transcriptional control and include DNA methylation, histone modifications, chromatin
configuration changes, imprinting, and RNA-associated silencing (Rodenhiser and Mann,
2006). The human genome contains approximately 23 000 genes that should be expressed
in specific cell types at precise times and this is known to be achieved via two pathways.
The first pathway is the immediate control by transcriptional activators and repressors that
have various nuclear concentrations, covalent modifiers, and subunit associations. It is the
traditional model of genetics in which the regulation of transcription and messenger RNA
(mRNA) stability are directly influenced by the genomic DNA sequence and any sequence
changes present. The second pathway is the epigenetic regulation by altering chromatin
structure through covalent modification of DNA and histones. The epigenetic pattern can
be transmitted from parent cell to daughter cell maintaining a specific epigenotype within
cell lineages. Thus, the phenotype is a result of the genotype, the specific DNA sequence,
and the epigenotype.
1.1.2. DNA Packaging
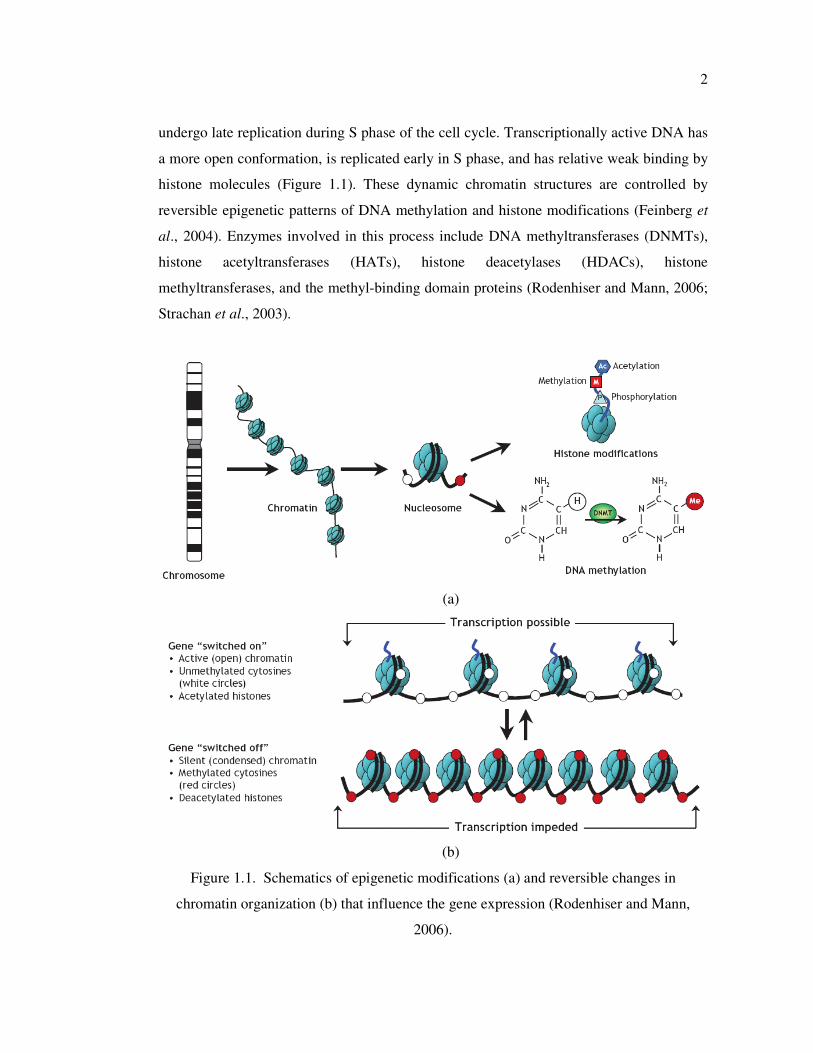
DNA is wrapped around clusters of globular histone proteins to form nucleosomes.
Nucleosomes consist of short segments of a 146-bp DNA wrapped tightly around a set of
conserved basic proteins known as histones (H2A, H2B, H3, and H4) (Margueron et al.,
2005). Each nucleosome consists of histone octamers (2 of each protein), and these basic
histone proteins allow interaction with acidic DNA. These repeating nucleosomes of DNA
and histones are organized into chromatin (Figure 1.1). The structure of chromatin is not
static, and influences the gene expression. Transcriptionally inactive DNA is characterized
by a highly condensed conformation and is associated with regions of the genome that
2
undergo late replication during S phase of the cell cycle. Transcriptionally active DNA has
a more open conformation, is replicated early in S phase, and has relative weak binding by
histone molecules (Figure 1.1). These dynamic chromatin structures are controlled by
reversible epigenetic patterns of DNA methylation and histone modifications (Feinberg et
al., 2004). Enzymes involved in this process include DNA methyltransferases (DNMTs),
histone acetyltransferases (HATs), histone deacetylases (HDACs), histone
methyltransferases, and the methyl-binding domain proteins (Rodenhiser and Mann, 2006;
Strachan et al., 2003).
(a)
(b)
Figure 1.1. Schematics of epigenetic modifications (a) and reversible changes in
chromatin organization (b) that influence the gene expression (Rodenhiser and Mann,
2006).
3
1.1.3. Epigenetic Modifications
1.1.3.1. CpG and non-CpG Methylation. DNA methylation refers to the covalent addition
of a methyl group derived from S-adenosyl-L-methionine to the fifth carbon of the
cytosine ring to form the 5- methyl cytosine (5meC) (Ehrlich et al., 1981). Across
eukaryotic species, methylation occurs predominantly in cytosines located 5′ of guanines,
known as CpG dinucleotides. In the mammalian genome, the distribution of CpG
dinucleotides is nonrandom (Antequera and Bird, 1993). They are greatly under-
represented in the genome because of evolutionary loss of 5meCs through deamination to
thymine. However, clusters of CpGs known as CpG islands are preserved in 1–2 per cent
of the genome. Briefly, CpG islands are defined as the region of DNA ranging from 200 bp
to 5 kb in size and with greater than 55 per cent GC content. More than 40 per cent of
mammalian genes have CpG islands (Bird et al., 2002). About 70 per cent of CpG islands
are located in the promoter, the first exon, and the first intron of the genes, suggesting that
they are important for gene regulation. Typically, unmethylated clusters of CpG
dinucleotides are located at the upstream of tissue specific genes and essential
“housekeeping” genes that are required for cell survival and are expressed in most tissues.
These unmethylated CpG islands are targets for proteins that initiate gene transcription.
However, methylated CpGs are associated with silent DNA and cause stable heritable
transcriptional silencing. The establishment and maintenance of DNA methylation patterns
is provided by DNA methyltransferases (DNMTs) and accessory proteins (Dnmt1,
Dnmt3a, Dnmt 3b, Dnmt2, and Dnmt 3L) (Egger et al., 2004). Two mechanisms have been
proposed to explain the inhibitory effect of CpG methylation on gene expression (Figure
1.2). First, it might inhibit the binding of transcription factors to their recognition sites.
Many factors are known to bind CpG-containing sequences, and some of these fail to bind
when the CpG is methylated (Bell and Felsenfeld, 2000). The second and more prevalent
mechanism involves proteins with high affinity for methylated CpGs, such as the methyl-
CpG-binding protein MeCP2, the methyl-CpG-binding-domain proteins MBD1, MBD2
and MBD4, and Kaiso. These proteins induce the recruitment of protein complexes (co-
repressor Sin3a and HDACs) that are involved in histone modification and chromatin
remodeling.
4
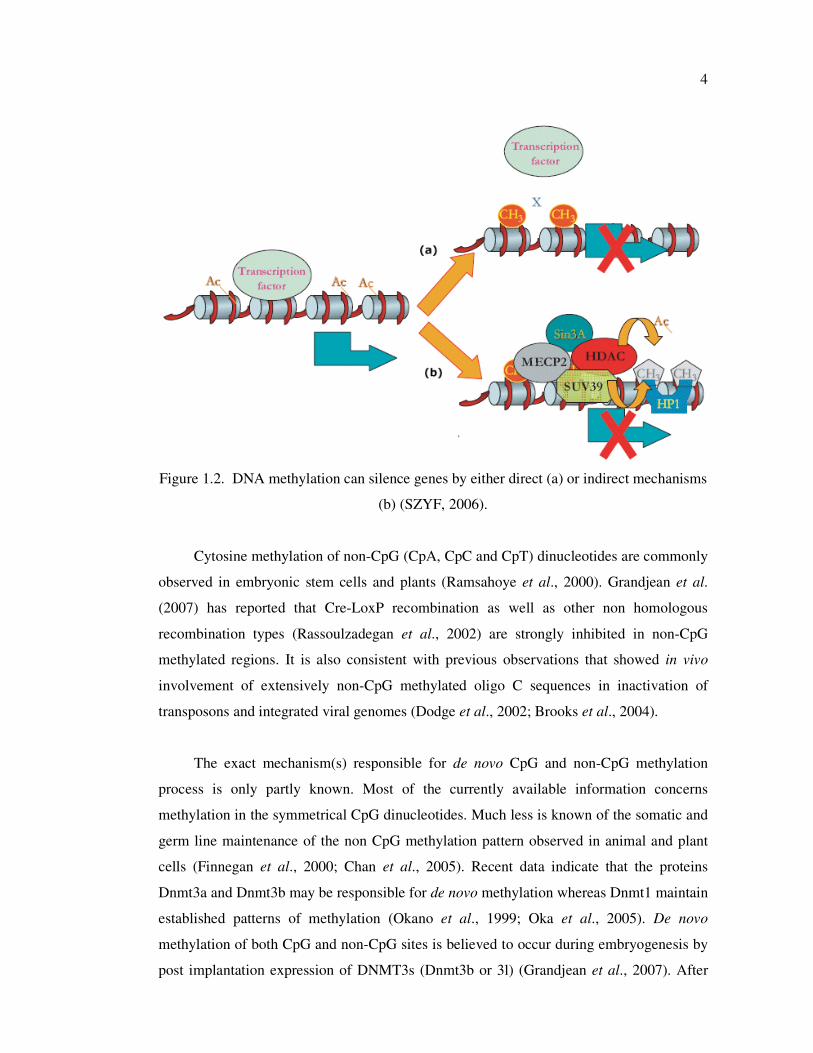
Figure 1.2. DNA methylation can silence genes by either direct (a) or indirect mechanisms
(b) (SZYF, 2006).
Cytosine methylation of non-CpG (CpA, CpC and CpT) dinucleotides are commonly
observed in embryonic stem cells and plants (Ramsahoye et al., 2000). Grandjean et al.
(2007) has reported that Cre-LoxP recombination as well as other non homologous
recombination types (Rassoulzadegan et al., 2002) are strongly inhibited in non-CpG
methylated regions. It is also consistent with previous observations that showed in vivo
involvement of extensively non-CpG methylated oligo C sequences in inactivation of
transposons and integrated viral genomes (Dodge et al., 2002; Brooks et al., 2004).
The exact mechanism(s) responsible for de novo CpG and non-CpG methylation
process is only partly known. Most of the currently available information concerns
methylation in the symmetrical CpG dinucleotides. Much less is known of the somatic and
germ line maintenance of the non CpG methylation pattern observed in animal and plant
cells (Finnegan et al., 2000; Chan et al., 2005). Recent data indicate that the proteins
Dnmt3a and Dnmt3b may be responsible for de novo methylation whereas Dnmt1 maintain
established patterns of methylation (Okano et al., 1999; Oka et al., 2005). De novo
methylation of both CpG and non-CpG sites is believed to occur during embryogenesis by
post implantation expression of DNMT3s (Dnmt3b or 3l) (Grandjean et al., 2007). After
5
the repression of DNMT3 expression, Dnmt1 maintains the methylation of CpGs but not
on other methylated C residues, resulting in the loss of non-CpG methylation (Ramsahoye
et al., 2000). In tumor cells, de novo CpG and non-CpG methylation is observed and most
likely the results of reactivation of DNMT3 expression (Oka et al., 2005; Kouidou et al.,
2005).
1.1.3.2. Histone Modification. In addition to DNA methylation, changes to histone
proteins affect the DNA structure and gene expression (Peterson et al., 2004). These
modifications, including acetylation, methylation, phosphorylation, ubiquitination, and
poly–adenosine diphosphate ribosylation, ensure that DNA is accessible for transcription
or targeted for silencing. Among them, acetylation and methylation of lysine residues in
the amino termini of histones H3 and H4 are highly correlated with transcriptional
activities. HATs add acetyl groups to lysine residues close to the N terminus of histone
proteins, neutralizing the positive charge. The acetylated N termini then form tails that
protrude from the nucleosome core. Because the acetylated histones are thought to have a
reduced affinity for DNA and possibly for each other, the chromatin may be able to adopt a
more open structure, make DNA more accessible to the transcriptional machinery, and
facilitate localized transcription. HDACs promote repression of gene expression,
presumably because the chromatin can become more condensed upon deacetylation.
Changes in chromatin structure mediated by equilibrium between HAT and HDACs affect
regulation of transcription (Strachan et al., 2003; Ausio et al., 2003) Histone methylation
can be a marker for both active and inactive regions of chromatin. Methylation of lysine 9
on the N terminus of histone H3 is a hallmark of silent DNA and is globally distributed
throughout heterochromatic regions such as centromeres, telomeres and silenced
promoters. In contrast, methylation of lysine 4 of histone H3 denotes activity and is found
predominantly at promoters of active genes. Combinations of acetylation, methylation, and
other posttranslational processing events lead to enormous variation of histone
modifications (Egger et al., 2004).
Epigenetic mechanisms are involved in control of gene expression, including tissue-
specific expression, imprinting, silencing of repetitive elements, correct organization of
chromatin and X-chromosome inactivation. Perturbations in the patterns of DNA
methylation and histone modifications can lead to congenital disorders, multisystem
6
pediatric syndromes, neurodevelopmental disorders (e.g. Rett Syndrome) or predispose
people to acquired disease such as sporadic cancers and neurodegenerative disorders.
1.2. Rett Syndrome
Rett syndrome (RTT; OMIM 312750) is an X-linked dominant postnatal progressive
neurodevelopmental disorder and the second most common cause of mental retardation
affecting females (Rett, 1966; Hagberg et al., 1983).
1.2.1. Historical Background
In 1965, Dr. Andreas Rett, an Austrian physician, investigated two disabled girls
having abnormal hand movements like winging, washing and clapping. One year later, he
reported 22 girls with these abnormal clinical features (Rett, 1966). However, the report
would not be recognized in the medical community for 17 years. In 1983, Dr. Bengt
Hagberg, a Swedish neurologist, and his colleagues reported the clinical description of 35
cases (Hagberg et al., 1983). He recognized that his patients showed overlapping
phenotype with Dr. Rett’s and called the disease as Rett Syndrome to honor the first
description by Dr. Rett.
1.2.2. Clinical and Neuropathological Charecteristics
After normal development up to the age of 6 to 18 months, RTT patients show a
regression of motor and mental abilities. The clinical manifestations in the classical form
of RTT are characterized by cognitive deterioration with autistic features, loss of acquired
skills such as language and hand usage, stereotypical hand wringing movements, and gait
ataxia (Weaving et al., 2005). Behavioral abnormalities include teeth grinding, night
laughing or crying, screaming fits, low mood, and anxiety episodes elicited by distressful
external events (Mount et al., 2001). Patients suffer generalized rigidity, dystonia, and
worsening of scoliosis. Autistic features include expressionless face, hypersensitivity to
sound, lack of eye-to-eye contact, indifference to the surrounding environment, and
unresponsiveness to social cues (Segawa and Nomura, 2005). Most girls with RTT suffer
7
breathing anomalies, including breath-holding, aerophagia, forced expulsion of air and
saliva, apnea, and hyperventilation.
Patients with RTT develop postnatal microcephaly. The major morphological
abnormalities detected in the central nervous system (CNS) are an overall decrease in the
size of the brain and of individual neurons. Autopsy studies revealed a 12–34 per cent
reduction in brain weight and volume in patients with RTT, the effect most pronounced in
the prefrontal, posterior frontal, and anterior temporal regions (Armstrong et al., 2005).
The RTT brain shows no obvious degeneration, atrophy, or inflammation, and there are no
signs of gliosis or neuronal migration defects (Jellinger et al., 1988; Reiss et al., 1993).
These observations indicate that RTT is a disorder of postnatal neurodevelopment rather
than a neurodegenerative process. In addition, dendritic spines of the RTT frontal cortex
are sparse and short, with no other apparent abnormalities (Belichenko et al., 1994).
Although neuronal size is reduced in the cortex, thalamus, basal ganglia, amygdala, and
hippocampus, there is an increase in neuronal cell packing in the hippocampus (Kaufmann
and Moser, 2000).
Neurophysiological studies of mouse models and patients with RTT revealed that
both the CNS and the autonomous nervous system contribute to the pathophysiology of the
disease. Altered somatosensory evoked potentials and abnormal electroencephalogram
(EEG) findings of focal, multifocal, and generalized epileptiform discharges and the
occurrence of rhythmic slow theta activity, all suggest altered cortical excitability in the
RTT brain. Electrocardiographic recordings (ECG) demonstrate long corrected QT
intervals and suggest perturbation of the autonomic nervous system (Glaze et al., 2005).
Mouse models reveal abnormalities in long-term potentiation (LTP) and impaired synaptic
plasticity. LTP is reduced in Mecp2_/Y
and Mecp2308/Y
cortical slices whereas LTP is
enhanced in hippocampal slices of mouse with MeCP2 overexpression (MECP2Tg
) (Asaka
et al., 2006; Moretti et al., 2006; Collins et al., 2004). In addition, reduced spontaneous
activity in cortical slices of null mice was observed due to a decrease in the total excitatory
synaptic drive and an increase in the total inhibitory drive (Dani et al., 2005). Synaptic
outputs in glutamatergic neurons showed 50 per cent reduction and 100 per cent
enhancement in Mecp2-/Y
and MECP2Tg
, respectively (Chao et al., 2007).
8
Altogether, these findings indicate that MeCP2 is essential in modulating synaptic
function and plasticity, and that MeCP2 function is critical in regulating the number of
excitatory synapses during early postnatal development (Chahrour and Zoghbi, 2007).
1.2.3. Phenotypic Variability in RTT
Atypical variants of RTT are also commonly observed, and five distinct categories
have been delineated on the bases of clinical criteria: Infantile (early) seizure onset,
congenital forth, ‘forme fruste’, preserved speech variant (PSV), and late childhood
regression form (Hagberg et al., 2002). These variants range from milder forms with a later
age of onset to more severe manifestations. ‘Forme fruste’ comprises the most common
group (with 80 per cent) of atypical variants. These patients have surprisingly well
preserved, yet somewhat dyspraxic, hand function, as well as absence of the classic hand
wringing stereotypies (Hagberg, 2002). The PSV variant is characterized by the ability of
patients to speak a few words, although not necessarily in context. PSV patients have a
normal head size and are usually overweight and kyphotic (Zappella et al., 2001). Early
seizure onset type and congenital forth are the more severe variants of RTT. Early seizure
onset type is characterized by a lack of early normal period due to presence of seizures
whereas congenital forth patients lack the early period of normal development (Chahrour
and Zoghbi, 2007). A definite loss of acquired hand skill is not found in congenital forth
cases, instead an improvement with age in their most primitive early bilateral hand use is
seen (Hagberg et al., 2002). Classical and atypical RTT phenotypes vary in severity and
onset between different patients and in the same patient over time.
1.2.4. Genetic Basis of RTT
RTT has an incidence of 1/10,000 to 1/22,000 female live births (Percy, 2002).
However, since more than 99 per cent of RTT cases are sporadic, it was very hard to map
the disease locus by traditional linkage analysis. Using information from rare familial
cases, exclusion mapping identified the Xq28 candidate region, and subsequent screening
of candidate gene, methyl-CpG-binding protein 2 (MECP2; MIM# 300005), revealed
mutations in RTT patients (Amir et al., 1999). Several recent studies identified mutations
in the CDKL5 gene (OMIM 300203) encoding cyclin-dependent kinase like 5 in patients
9
with an atypical, early onset seizure variant of RTT (Weaving et al., 2005; Evans et al.,
2005; Scala et al., 2005). The disruption of NTNG1 gene, encoding the axon guiding
molecule Netrin G1, by a balanced chromosome translocation was described in one female
patient with atypical RTT and early-onset seizures (Borg et al., 2005). However, this might
be an isolated case because NTNG1 screening in a cohort of MECP2 and CDKL5 mutation-
negative patients with RTT failed to identify any pathogenic mutations in this gene (Archer
et al., 2006).
RTT was initially thought to affect exclusively females and germline MECP2
mutations were considered to be lethal in males. Recently, several investigators have
reported MECP2 mutations in males with classic RTT, nonfatal nonprogressive
encephalopathy, nonspecific X-linked mental retardation (MRX), language disorder, or
schizophrenia (Orrico et al., 2000; Cohen et al., 2002; Kleeftra et al., 2004; Masuyama et
al., 2005). Males with MECP2 mutations fall into three main categories: boys with Rett
syndrome; boys with severe encephalopathy and infantile death; and boys with less severe
neurological and/or psychiatric manifestations. Boys in the first category have a 47,XXY
karyotype or are somatic mosaic and carry the same MECP2 mutations that cause classic
Rett syndrome in girls. Males in the second group carry MECP2 mutations identical to
those found in females; these mutations are generally thought to disrupt DNA binding or
nuclear localization of the MECP2 protein. In the third group are boys with mutations that
are not found in girls with Rett syndrome, presumably because their effects are mild in
heterozygosity. Recent data indicate that increased MECP2 gene-dosage can disrupt
normal brain function. Interestingly, submicroscopic duplications in Xq28 region
encompassing the MECP2 gene were identified in a boy with severe mental retardation and
clinical features of Rett syndrome, several patients with severe mental retardation and
progressive spasticity, and male with non-specific X-linked mental retardation (Meins et
al., 2005; van Esch et al., 2005; de Gaudio et al., 2006; Friez et al., 2006).
1.2.5. MECP2 Gene
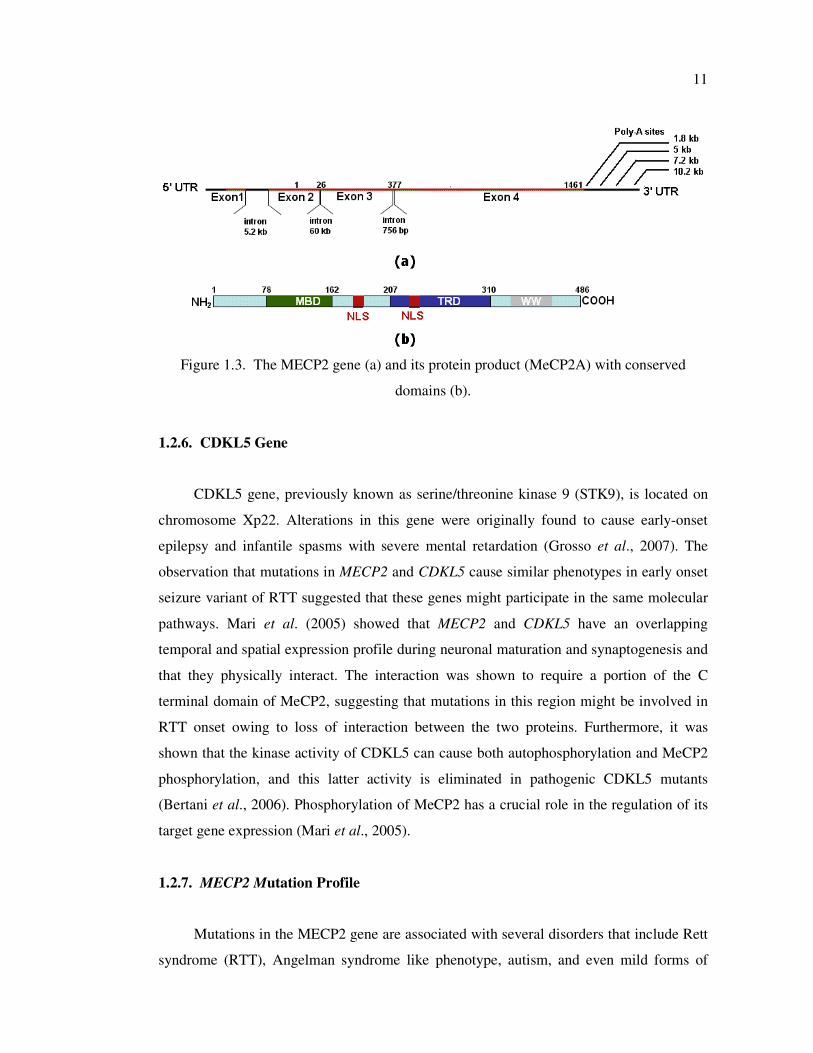
The MECP2 gene is located on chromosome Xq28 and consists of four exons that
code for two different isoforms of the protein, due to alternative splicing of exon 2. Two
MeCP2 isoforms differ only in their N-terminus. The first identified isoform, MeCP2-e2
10
(MeCP2A, 486 amino acids) uses a translational start site within exon 2, whereas the new
isoform, MeCP2-e1 (MeCP2B, 498 amino acids) is derived from an mRNA in which exon
2 is excluded and starts from ATG located within exon 1. MeCP2-e1 isoform is more
abundant and contains 24 amino acids encoded by exon 1 and lacks the 9 amino acids
encoded by exon 2 (Dragich et al., 2007; Kriaucionis and Bird, 2004; Mnatzakanian et al.,
2004). In addition, MECP2 has a large, highly conserved 3’-untranslated region that
contains multiple polyadenylation sites, which can be alternatively used to generate four
different transcripts. Expression studies in mice showed that the longest transcript is the
most abundant in brain, with higher expression during embryonic development, followed
by postnatal decline, and subsequent increase in expression levels later in adult life (Pelka
et al., 2005; Shahbazian et al., 2002b). Although the MeCP2 is almost ubiquitously
expressed, it is relatively more abundant in the brain, primarily in mature postmigratory
neurons (Jung et al., 2003). MeCP2 protein levels are low during embryogenesis and
increase progressively during the postnatal period of neuronal maturation (Balmer et al.,
2003; Cohen et al., 2003; Kishi and Macklis, 2004; Mullaney et al., 2004; Shahbazian et
al., 2002b). Both MeCP2 isoforms are nuclear and colocalize with methylated
heterochromatic foci in mouse cells. Since MeCP2 is expressed in mature neurons and its
levels increase during postnatal development, it may play a role in modulating the activity
or plasticity of mature neurons. Consistent with this, MECP2 mutations do not seem to
affect the proliferation or differentiation of neuronal precursors.
MeCP2 is a member of the family of related proteins that bind specifically to
symmetrically methylated CpG dinucleotides via a conserved methyl binding domain
(MBD) (Bird, 2002). Besides a methyl binding domain (MBD, residues 78–162), the
protein includes a transcription repression domain (TRD, residues 207–310) involved in
transcriptional repression through recruitment of co-repressors and chromatin remodeling
complexes, two nuclear localization signals (NLS, residues173-193 and 255–271), and a
63 residue group II WW binding domain in C-terminal (from 325 to 388) (Figure 1.3). The
C-terminus facilitates MeCP2 binding to naked DNA and to the nucleosomal core, and it
also contains evolutionarily conserved poly-proline runs that can bind to group II WW
domain splicing factors (Buschdorf and Stratling, 2004).
11
Figure 1.3. The MECP2 gene (a) and its protein product (MeCP2A) with conserved
domains (b).
1.2.6. CDKL5 Gene
CDKL5 gene, previously known as serine/threonine kinase 9 (STK9), is located on
chromosome Xp22. Alterations in this gene were originally found to cause early-onset
epilepsy and infantile spasms with severe mental retardation (Grosso et al., 2007). The
observation that mutations in MECP2 and CDKL5 cause similar phenotypes in early onset
seizure variant of RTT suggested that these genes might participate in the same molecular
pathways. Mari et al. (2005) showed that MECP2 and CDKL5 have an overlapping
temporal and spatial expression profile during neuronal maturation and synaptogenesis and
that they physically interact. The interaction was shown to require a portion of the C
terminal domain of MeCP2, suggesting that mutations in this region might be involved in
RTT onset owing to loss of interaction between the two proteins. Furthermore, it was
shown that the kinase activity of CDKL5 can cause both autophosphorylation and MeCP2
phosphorylation, and this latter activity is eliminated in pathogenic CDKL5 mutants
(Bertani et al., 2006). Phosphorylation of MeCP2 has a crucial role in the regulation of its
target gene expression (Mari et al., 2005).
1.2.7. MECP2 Mutation Profile
Mutations in the MECP2 gene are associated with several disorders that include Rett
syndrome (RTT), Angelman syndrome like phenotype, autism, and even mild forms of

12
mental retardation (Amir et al., 1999; Couvert et a., 2001; Watson et al., 2001). MECP2
mutations can be identified in 70–90 per cent of classical sporadic RTT cases, however, in
only 29-45 per cent of atypical RTT and familial cases (Webb and Latif, 2001; Schanen et
al., 2004, Fukuda et al., 2005).
Up to date more than 200 different mutations of MECP2 have been identified in
patients with classical and atypical RTT. Most mutations are de novo that arise in the
paternal germline and often involve a C to T transition at CpG dinucleotides (Trappe et al.,
2001; Wan et al., 1999). Among 200 different mutations of MECP2 eight missense and
nonsense mutations (p.R106W, p.R133C, p.T158M, p.R168X, p.R255X, p.R270X,
p.R294X, and p.R306C) are known to account for almost 70 per cent (RettBASE).
Among those mutations, the great majority (80 per cent) represent single nucleotide
changes, with the remainder small-scale deletions (17 per cent) or insertions (3 per cent).
Most missense mutations are tightly clustered at the methyl-CpG binding domain (MBD).
Deletion/insertion mutations leading to loss of the open reading frame occur throughout the
gene, but are clustered in the C-terminal coding region, which contains a poly-histidine
repeat (RettBASE).
With the use of quantitative experimental methods in recent years, MECP2 exon
deletions were identified in 2.9-14 per cent of cases with RTT (RettBASE). On the other
hand, duplication was reported in only one female patient with PSV variant of RTT who
was found to carry three copies of the MECP2 exon 4 (Ariani et al., 2004). Regardless of
the mechanism, mutations within the MECP2 lead to loss of function or a protein product
with diminished stability.
A wide spectrum of phenotypic variability is observed in patients with MECP2
mutations and considered with respect to the mutation type, location in the gene, and the
X-chromosome inactivation (XCI) pattern. Genotype–phenotype correlations in females
with Rett syndrome have yielded conflicting results. In general, female patients with
mutations in MECP2 that truncate the protein towards its C-terminal end (late-truncating
mutations) have a milder phenotype, and less typical of classical Rett syndrome when
compared to patients who have missense or N-terminal (early truncating) mutations
13
(Charman et al., 2005). Patients with mutations upstream of or within the TRD domain
show greater clinical severity (Jian et al., 2005). In addition, p.Arg133Cys mutation causes
an overall milder phenotype while the p.Arg270X mutation, which is predicted to result in
a truncated protein, is associated with increased mortality (Kerr et al., 2006; Jian et al.,
2005).
It has been suggested that genetic background and/or non-random X-chromosome
inactivation in the brain influences the biological consequences of mutations in MECP2. In
females, only one of the two X chromosomes is active in each cell and the choice of which
X chromosome is active is usually random, such that half of the cells have the maternal X
chromosome and the other half have the paternal X chromosome active. Therefore, a
female with a MECP2 mutation is typically mosaic, whereby half of her cells express the
wild-type MECP2 allele and the other half express the mutant MECP2 allele. Occasionally,
cells expressing the wild-type MECP2 allele divide faster or survive better than cells
expressing the mutant allele, which therefore results in a nonrandom pattern of XCI and
amelioration of the RTT neurological phenotypes. Depending on the extent of such
favorable skewing, some patients can be mildly affected or are even asymptomatic carriers
of MECP2 mutations (Weaving et al., 2005). The best examples for illustrating the
dramatic effects of XCI patterns in RTT are monozygotic twins who manifest very
different phenotypes (Dragich et al., 2000). In addition, skewed XCI patterns occur in
brain regions of female mice heterozygous for a mutant MECP2 allele, where phenotypic
severity correlates with the degree of skewing (Young and Zoghbi, 2004).
1.2.8. MeCP2 Function
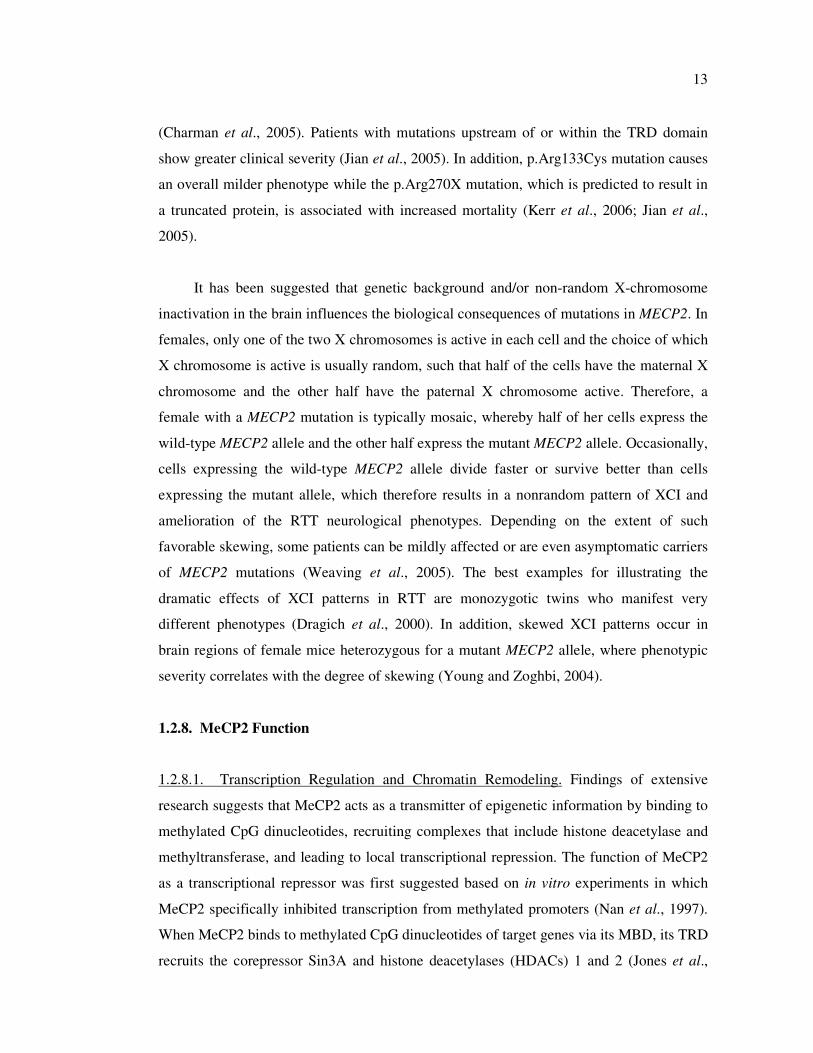
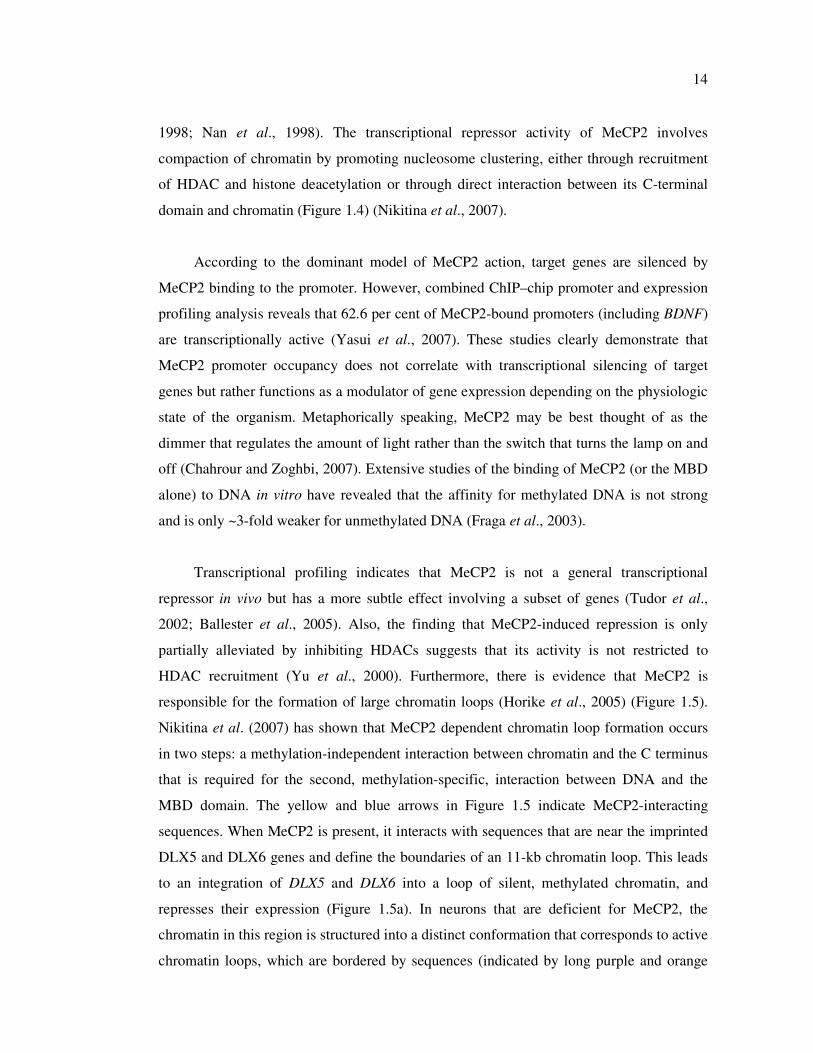
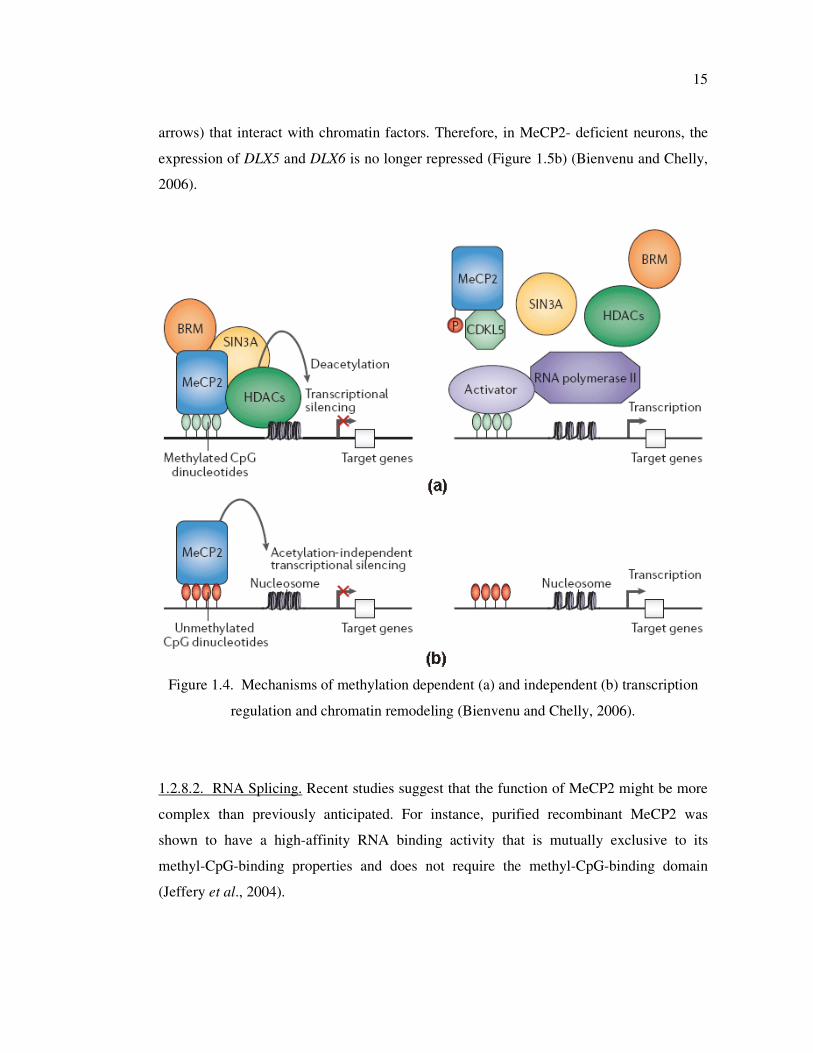
1.2.8.1. Transcription Regulation and Chromatin Remodeling. Findings of extensive
research suggests that MeCP2 acts as a transmitter of epigenetic information by binding to
methylated CpG dinucleotides, recruiting complexes that include histone deacetylase and
methyltransferase, and leading to local transcriptional repression. The function of MeCP2
as a transcriptional repressor was first suggested based on in vitro experiments in which
MeCP2 specifically inhibited transcription from methylated promoters (Nan et al., 1997).
When MeCP2 binds to methylated CpG dinucleotides of target genes via its MBD, its TRD
recruits the corepressor Sin3A and histone deacetylases (HDACs) 1 and 2 (Jones et al.,
14
1998; Nan et al., 1998). The transcriptional repressor activity of MeCP2 involves
compaction of chromatin by promoting nucleosome clustering, either through recruitment
of HDAC and histone deacetylation or through direct interaction between its C-terminal
domain and chromatin (Figure 1.4) (Nikitina et al., 2007).
According to the dominant model of MeCP2 action, target genes are silenced by
MeCP2 binding to the promoter. However, combined ChIP–chip promoter and expression
profiling analysis reveals that 62.6 per cent of MeCP2-bound promoters (including BDNF)
are transcriptionally active (Yasui et al., 2007). These studies clearly demonstrate that
MeCP2 promoter occupancy does not correlate with transcriptional silencing of target
genes but rather functions as a modulator of gene expression depending on the physiologic
state of the organism. Metaphorically speaking, MeCP2 may be best thought of as the
dimmer that regulates the amount of light rather than the switch that turns the lamp on and
off (Chahrour and Zoghbi, 2007). Extensive studies of the binding of MeCP2 (or the MBD
alone) to DNA in vitro have revealed that the affinity for methylated DNA is not strong
and is only ~3-fold weaker for unmethylated DNA (Fraga et al., 2003).
Transcriptional profiling indicates that MeCP2 is not a general transcriptional
repressor in vivo but has a more subtle effect involving a subset of genes (Tudor et al.,
2002; Ballester et al., 2005). Also, the finding that MeCP2-induced repression is only
partially alleviated by inhibiting HDACs suggests that its activity is not restricted to
HDAC recruitment (Yu et al., 2000). Furthermore, there is evidence that MeCP2 is
responsible for the formation of large chromatin loops (Horike et al., 2005) (Figure 1.5).
Nikitina et al. (2007) has shown that MeCP2 dependent chromatin loop formation occurs
in two steps: a methylation-independent interaction between chromatin and the C terminus
that is required for the second, methylation-specific, interaction between DNA and the
MBD domain. The yellow and blue arrows in Figure 1.5 indicate MeCP2-interacting
sequences. When MeCP2 is present, it interacts with sequences that are near the imprinted
DLX5 and DLX6 genes and define the boundaries of an 11-kb chromatin loop. This leads
to an integration of DLX5 and DLX6 into a loop of silent, methylated chromatin, and
represses their expression (Figure 1.5a). In neurons that are deficient for MeCP2, the
chromatin in this region is structured into a distinct conformation that corresponds to active
chromatin loops, which are bordered by sequences (indicated by long purple and orange
15
arrows) that interact with chromatin factors. Therefore, in MeCP2- deficient neurons, the
expression of DLX5 and DLX6 is no longer repressed (Figure 1.5b) (Bienvenu and Chelly,
2006).
Figure 1.4. Mechanisms of methylation dependent (a) and independent (b) transcription
regulation and chromatin remodeling (Bienvenu and Chelly, 2006).
1.2.8.2. RNA Splicing. Recent studies suggest that the function of MeCP2 might be more
complex than previously anticipated. For instance, purified recombinant MeCP2 was
shown to have a high-affinity RNA binding activity that is mutually exclusive to its
methyl-CpG-binding properties and does not require the methyl-CpG-binding domain
(Jeffery et al., 2004).
16
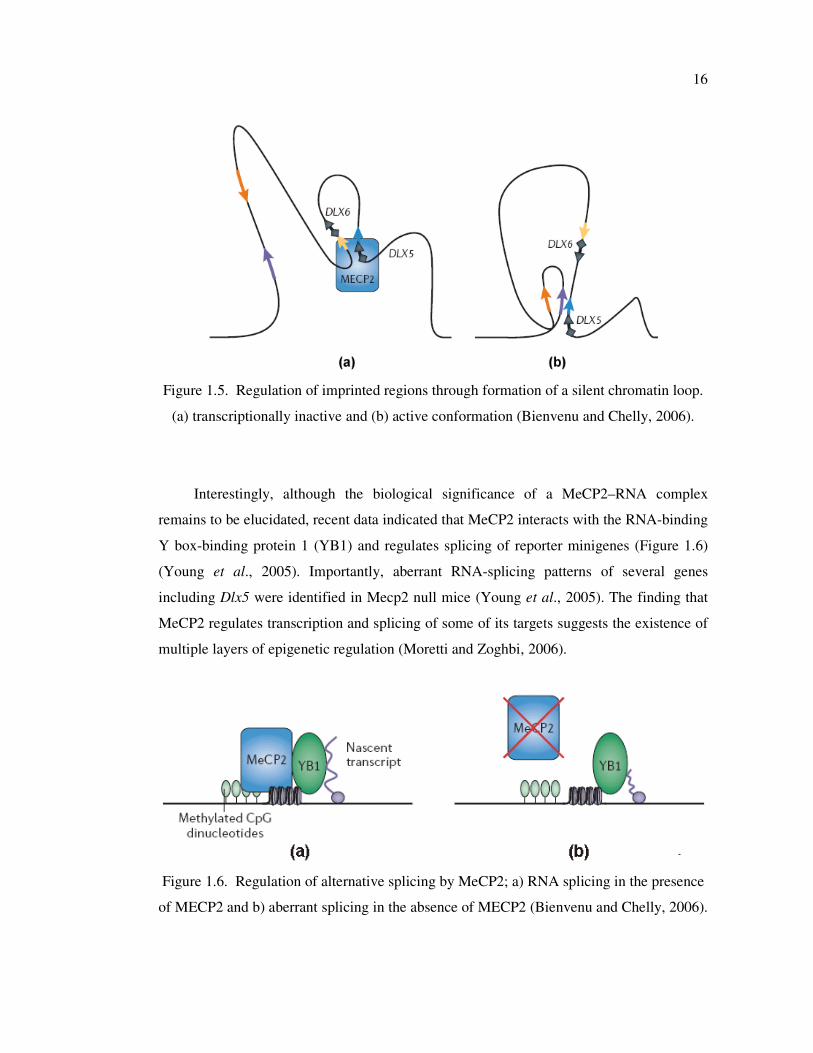
Figure 1.5. Regulation of imprinted regions through formation of a silent chromatin loop.
(a) transcriptionally inactive and (b) active conformation (Bienvenu and Chelly, 2006).
Interestingly, although the biological significance of a MeCP2–RNA complex
remains to be elucidated, recent data indicated that MeCP2 interacts with the RNA-binding
Y box-binding protein 1 (YB1) and regulates splicing of reporter minigenes (Figure 1.6)
(Young et al., 2005). Importantly, aberrant RNA-splicing patterns of several genes
including Dlx5 were identified in Mecp2 null mice (Young et al., 2005). The finding that
MeCP2 regulates transcription and splicing of some of its targets suggests the existence of
multiple layers of epigenetic regulation (Moretti and Zoghbi, 2006).
Figure 1.6. Regulation of alternative splicing by MeCP2; a) RNA splicing in the presence
of MECP2 and b) aberrant splicing in the absence of MECP2 (Bienvenu and Chelly, 2006).
17
1.2.9. Mouse Models of RTT
To unravel the molecular changes that underlie RTT, several mouse models with
different MECP2 mutations were generated. Mecp2-null male (Mecp2_/y
) and female
(Mecp2_/_
) mice generated via cre/lox recombination have no apparent phenotype until
around 6 weeks. There follows a period of rapid regression resulting in reduced
spontaneous movement, uncoordinated gait, irregular breathing, hind limb clasping and
tremors. Rapid progression of symptoms leads to death at 8 weeks of age (Guy et al., 2001;
Chen et al., 2001). Detailed brain examination revealed that the brains of Mecp2 null mice
are smaller in size and weight than brains of wild type littermates, but have no detectable
structural abnormalities, except for smaller, more densely packed neurons (Chen et al.,
2001). In addition, the olfactory neurons of Mecp2 null mice demonstrate a transient delay
in differentiation, and abnormalities of axonal targeting, suggesting that Mecp2 mediates a
crucial function in the final stages of neuronal development (Matarazzo et al., 2004).
Recently, Pelka et al. (2006) reported a null mice with XO background (Mecp2_/0
) showing
similar phenotypes with male Mecp2_/y
mice. This finding indicates that the Y-
chromosome has no effect on the phenotypic manifestation in Mecp2 null mice (Pelka et
al., 2006).
Shahbazian et al. (2002) reported another RTT mouse model generated with
insertion of a stop codon in the Mecp2 gene at nucleotide position corresponding to amino
acid 309. This mutation results in a truncated protein with the MBD, TRD, and NLS
domain and a lack of the C-terminal region, which is predicted to have similar effects of
p.Arg294X mutation observed in RTT patients. Mecp2308/Y
mice display no initial
phenotype until 6 weeks of age, and then they develop progressive neurological
phenotypes, including motor dysfunction, forepaw stereotypies, hypoactivity, tremor,
seizures, kyphosis, social behavior abnormalities, decreased diurnal activity, increased
anxiety-related behavior, and learning and memory deficits, reminiscent of the clinical
picture in human girls with RTT. Female mice heterozygous for the truncation display
milder and more variable features. In vivo, the truncated protein maintains normal
chromatin localization, but histone H3 is hyperacetylated in the brain, indicating abnormal
chromatin architecture (Shahbazian et al., 2002; Moretti et al., 2005).

18
Collins et al. (2004) has developed a mouse model that transgenically over-expressed
MECP2 under the endogenous human promoter. Initially, MECP2Tg
mice display
increased synaptic plasticity, with enhancement in motor and contextual learning abilities.
However, at 20 weeks of age, these mice developed seizures, hypoactivity and spasticity
with several other progressive neurological abnormalities.
The conditional inactivation of MeCP2 in only post-mitotic neurons of the forebrain
caused delayed onset of symptoms similar to those shown by Mecp2 knockout mice. This
finding indicates that Mecp2 plays an essential role in post-mitotic neurons (Chen et al.,
2001). Additionally, the expression of Mecp2 in only post-mitotic neurons of Mecp2-null
mice was shown to be sufficient to restore normal neurological function. This finding
indicates that Mecp2 deficiency in peripheral tissues does not significantly influence
disease manifestations and suggests that Mecp2 plays no essential role in the early stages
of brain development (Luikenhuis et al., 2004).
1.2.10. MeCP2 Target Genes and Their Relevance with Disease
Although biochemical evidence suggested that MeCP2 functions as a global
repressor of gene expression, transcriptional profiling failed to identify profound changes
of gene expression in the brain of Mecp2 knockout mice (Tudor et al., 2002). Using the
candidate gene approach or CGH analysis of samples from both human and mouse tissues,
only a few number of putative MeCP2 targets that might be relevant to the pathogenesis of
RTT was identified (Figure 1.7).
The first gene shown to be repressed by MeCP2 was brain-derived neurotrophic
factor (BDNF), encoding a protein that has essential functions for neuronal plasticity,
learning and memory (Chen et al., 2003). In basal conditions, BDNF expression is
repressed by MeCP2 bound to its promoter; upon membrane depolarization,
phosphorylated MeCP2 dissociates from the promoter and BDNF expression is induced by
binding of CREB (Moretti et al., 2005 and 2006). Conditional deletion of Bdnf in
postmitotic neurons of mice mimicked some of the phenotypes observed in Mecp2 null
mice, including hind limb clasping, reduced brain weight, and reduced olfactory and
hippocampal neuronal sizes. However, Chang and colleagues reported that BDNF protein
19
levels are decreased rather than increased in brains of symptomatic Mecp2-/Y
mice. Since
Bdnf is known to be upregulated in response to neuronal activity, the reduced cortical
activity in Mecp2 null mice is expected to negatively affect Bdnf expression, hence
masking the expected upregulation that would normally result from loss of repression in
resting cortical neurons that lack MeCP2 (Chang et al., 2006). Consistent with this data,
forebrain-specific deletion of Bdnf in Mecp2-/Y
mice resulted in earlier onset of locomotor
dysfunction and reduced lifespan, while forebrain- specific overexpression of Bdnf in these
mice improved locomotor function and extended their lifespan (Chang et al., 2006).
Horike et al. (2005) reported the loss of imprinting of a maternally expressed gene,
distal-less homeobox 5 (DLX5), in both Mecp2-null mice and in lymphoblastoid cell lines
obtained from RTT patients. MeCP2 was shown to be essential for the formation of a silent
chromatin structure at the Dlx5 locus by histone methylation and through the formation of
a chromatin loop. Dlx5 regulates GABA neurotransmission and osteogenesis; therefore,
alterations in Dlx5 expression can account for epilepsy, osteoporosis and somatic
hypoevolutism observed in RTT girls.
MeCP2 was shown to affect the expression pattern of UBE3A located in PWS/AS
imprinted region. UBE3A encodes the ubiquitin ligase E3A and imprinted only in the
brain. Mutations in the maternal copy of the gene account for about 10 per cent of
Angelman Syndrome (AS) cases. UBE3A mRNA and protein levels are slightly reduced in
human and mouse MeCP2-deficient brains due to the overexpression of anti sense UBE3A
(Makedonski et al., 2005). Since maternal mutations in UBE3A (or repression of the
maternal allele) give rise to AS, it is speculated that deregulation of UBE3A expression
that results from MeCP2 loss of function might contribute to the clinical manifestations of
Rett syndrome, such as mental retardation, seizures, muscular hypotonia and acquired
microcephaly, that are common to both conditions (Makedonski et al., 2005).
Chip analyses revealed that MeCP2 binds to promoter region of the corticotropin-
releasing hormone (CRH) gene, glucocorticoid-inducible genes, serum glucocorticoid-
inducible kinase 1 (Sgk1) and FK506-binding protein 5 (Fkbp5) in wild type brain. It was
shown that these genes are upregulated in Mecp2 null mice (Bale and Vale, 2004; Nuber et
al., 2005). Since the genes Sgk1, Fkbp5, and Crh are involved in regulation of behavioral
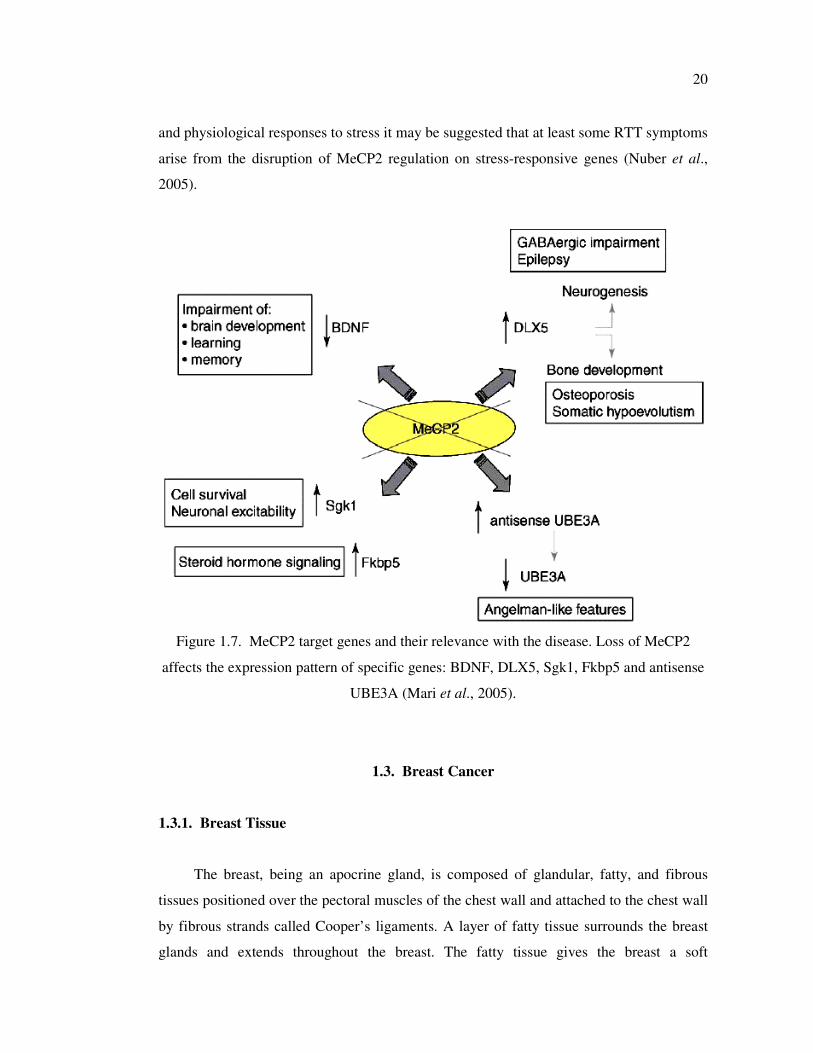
20
and physiological responses to stress it may be suggested that at least some RTT symptoms
arise from the disruption of MeCP2 regulation on stress-responsive genes (Nuber et al.,
2005).
Figure 1.7. MeCP2 target genes and their relevance with the disease. Loss of MeCP2
affects the expression pattern of specific genes: BDNF, DLX5, Sgk1, Fkbp5 and antisense
UBE3A (Mari et al., 2005).
1.3. Breast Cancer
1.3.1. Breast Tissue
The breast, being an apocrine gland, is composed of glandular, fatty, and fibrous
tissues positioned over the pectoral muscles of the chest wall and attached to the chest wall
by fibrous strands called Cooper’s ligaments. A layer of fatty tissue surrounds the breast
glands and extends throughout the breast. The fatty tissue gives the breast a soft

21
consistency. The glandular tissues of the breast house the lobules (milk producing glands at
the ends of the lobes) and the ducts (transporting milk from the milk glands to the nipple).
Toward the nipple, each duct widens to form a sac (ampulla) (Figure 1.8). During lactation,
the bulbs on the ends of the lobules produce milk. Once milk is produced, it is transferred
through the ducts to the nipple.
Figure 1.8. A schematic diagram of a normal female breast (www.cancer.org/docroot/
CRI/content/CRI_2_4_1X_what_is_breast_cancer_5.asp).
1.3.2. Breast Cancer Risk
Breast cancer is the most common malignancy among women in industrialized
countries and diagnosed in 1 x 10⁶ women in the world each year. The highest age-adjusted
incidence rate is reported for North America, being 86.3 per 100,000 women per year,
while the lowest rate, reported in China, is only 11.8. The average incidence is 63.2 for
more developed countries and 23.1 for the less developed regions.
Breast carcinomas originate from the epithelial cells lining the ducts or lobules,
therefore classified as ductal or lobular carcinomas. Ductal carcinoma is the most common
type of breast cancer, accounting for 85 to 90 per cent of the cases. Lobular carcinoma
occurs in 10 to 12 per cent of the cases (Feig SA, 2000). Ductal breast malignancies are
divided into two categories, pre-invasive and invasive. Pre-invasive ductal cancer is called
22
ductal carcinoma in situ (DCIS). It is a very early stage of breast cancer and is the result of
proliferation of the ductal luminal cells which fills the lumen but do not enter the basement
membrane and the surrounding stroma. It accounts for 5 per cent of all breast carcinomas.
Invasive (infiltrating) ductal carcinoma (IDC) is the most aggressive type with capability
of metastasis. Invasive lobular carcinomas (ILC) only account for about 10 per cent of all
breast cancers and they tend to be somewhat less aggressive than IDC. Unlike IDC, it is
now believed that lobular carcinoma in situ (LCIS) is not a precursor of invasive lobular
carcinoma. The confusion exists because LCIS, while it has the word carcinoma in its
name, does not behave like a cancerous condition. LCIS does not grow, form masses,
transform into invasive cancer, or metastasize. Therefore, it does not represent a true
malignancy.
The molecular mechanisms underlying the development of breast cancer are not
completely understood. However, it is generally believed that the initiation of breast cancer
is a consequence of cumulative genetic damages leading to genetic alterations that result in
activation of proto-oncogenes and inactivation of tumor suppressor genes. These in turn
are followed by uncontrolled cellular proliferation and/or aberrant programmed cell death,
or apoptosis. Also, the role of reactive oxygen species (ROS) has been related to the
etiology of cancer, as they are known to be mutagenic, and therefore capable of tumor
promotion.
The risk of developing breast cancer is increased if a family history of the disease is
present. The epidemiological studies have shown that 12 per cent of women with breast
cancer had one and one per cent had two or more affected relatives. Therefore the genesis
of most breast cancers can not be explained by heritage. Age and the duration of exposure
to endogenous or exogenous steroid hormone levels are suggested as the best defined risk
factors for breast cancer. Breast cancer is uncommon among women younger than 30 years
of age but the incidence increases sharply with age. The rate of increase in breast cancer
incidence continues throughout life but slows somewhat between ages 45 and 50 years.
This finding strongly suggests the involvement of reproductive hormones in breast cancer
etiology, because non-hormone-dependent cancers do not exhibit this change in slope of
the incidence curve around the time of menopause (Pike et al., 1993). Several reproductive
factors that alter estrogen status affect the risk of breast cancer: early age at menarche and
23
late age at menopause are associated with increased risk of breast cancer. After
menopause, adipose tissue is the major source of estrogen, and obese postmenopausal
women have both higher levels of endogenous estrogen and a higher risk of breast cancer
(Harris et al., 1992; Huang et al., 1997). Postmenopausal hormone use increases the breast
cancer risk depending on the duration of use and whether estrogen alone or estrogen in
combination with progestin is taken (Ross et al., 2000).
The age might be the driving force for the accumulation of mutational load due to the
reactive oxygen species, telomere dysfunction, and increased epigenetic gene silencing.
Exposure to growth factors like estrogen increases the likelihood of occurrence of these
changes in breast epithelial stem cells as well as the propagation of these changes by
enabling the cells to divide.
Hereditary (familial) form of the breast cancer represents 5-10 per cent of all cases.
BRCA1, BRCA2, p53, ATM, CHECK2, and PTEN are the major breast cancer
susceptibility genes (Marcus et al., 1996; Miki et al., 1994; Stratton and Wooster, 1995;
Hill et al., 1997, Bell et al 1999, Cantor et al 2001). BRCA1, BRCA2 and ATM genes
maintain genomic stability and involved in repair of double-strand breaks. BRCA1 and
BRCA2 play also role in transcription and cell cycle control acting as a tumor suppressor
gene (Venkitaraman, 2002). p53 is known to be involved in cell cycle regulation, DNA
damage repair, apoptosis and inhibition of angiogenesis. Therefore, loss of functional
protein eliminates the growth arrest in response to DNA damage and allows the replication
of mutated DNA. CHECK2, a G2 check point kinase, is involved in the repair of DNA
breaks. PTEN is a lipid phosphatase that was identified as a candidate tumor suppressor
gene. It is suggested to have an inhibitory role on PKB/Akt that is required for cell growth
and survival (Downward J, 1998). It is also found to inhibit integrin-mediated cell
migration thus preventing metastasis (Tamura et al., 1998).
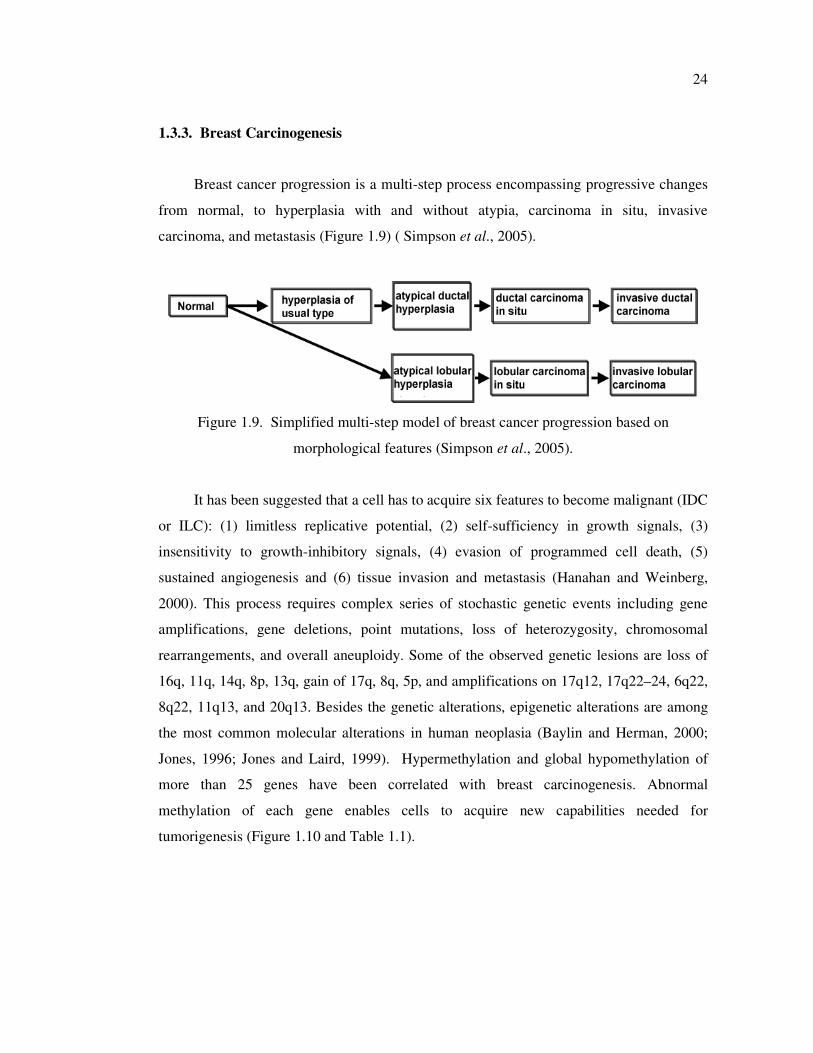
24
1.3.3. Breast Carcinogenesis
Breast cancer progression is a multi-step process encompassing progressive changes
from normal, to hyperplasia with and without atypia, carcinoma in situ, invasive
carcinoma, and metastasis (Figure 1.9) ( Simpson et al., 2005).
Figure 1.9. Simplified multi-step model of breast cancer progression based on
morphological features (Simpson et al., 2005).
It has been suggested that a cell has to acquire six features to become malignant (IDC
or ILC): (1) limitless replicative potential, (2) self-sufficiency in growth signals, (3)
insensitivity to growth-inhibitory signals, (4) evasion of programmed cell death, (5)
sustained angiogenesis and (6) tissue invasion and metastasis (Hanahan and Weinberg,
2000). This process requires complex series of stochastic genetic events including gene
amplifications, gene deletions, point mutations, loss of heterozygosity, chromosomal
rearrangements, and overall aneuploidy. Some of the observed genetic lesions are loss of
16q, 11q, 14q, 8p, 13q, gain of 17q, 8q, 5p, and amplifications on 17q12, 17q22–24, 6q22,
8q22, 11q13, and 20q13. Besides the genetic alterations, epigenetic alterations are among
the most common molecular alterations in human neoplasia (Baylin and Herman, 2000;
Jones, 1996; Jones and Laird, 1999). Hypermethylation and global hypomethylation of
more than 25 genes have been correlated with breast carcinogenesis. Abnormal
methylation of each gene enables cells to acquire new capabilities needed for
tumorigenesis (Figure 1.10 and Table 1.1).
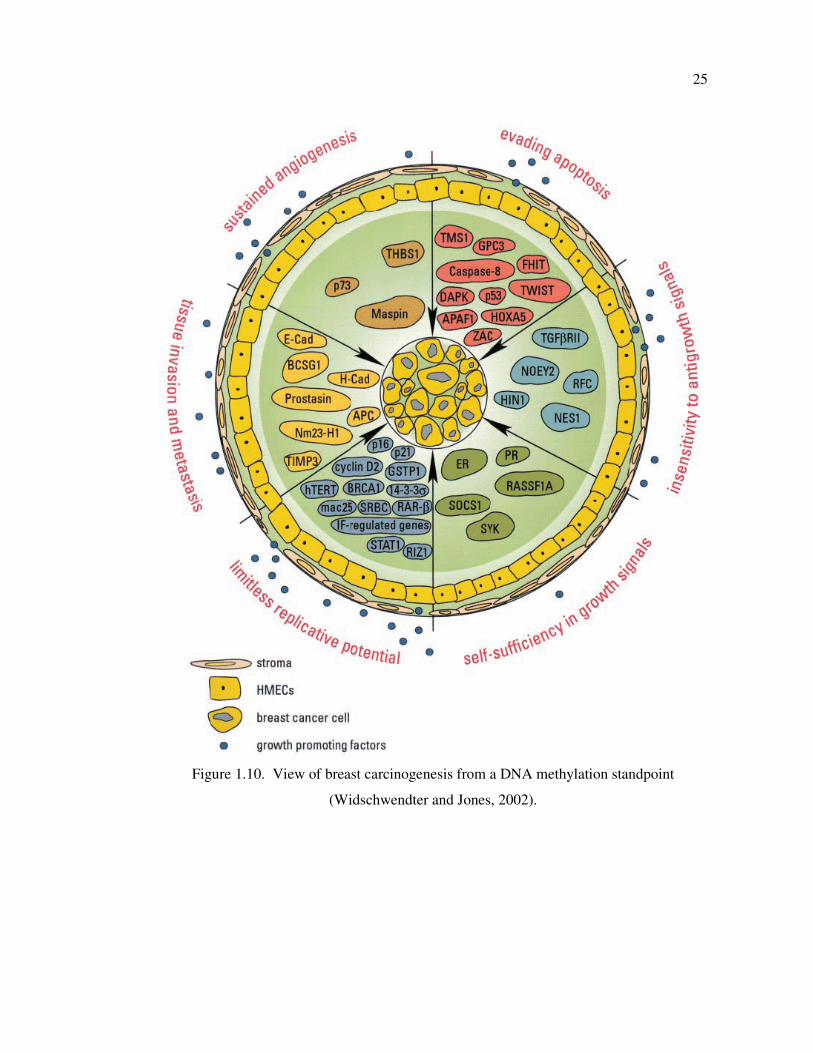
25
Figure 1.10. View of breast carcinogenesis from a DNA methylation standpoint
(Widschwendter and Jones, 2002).
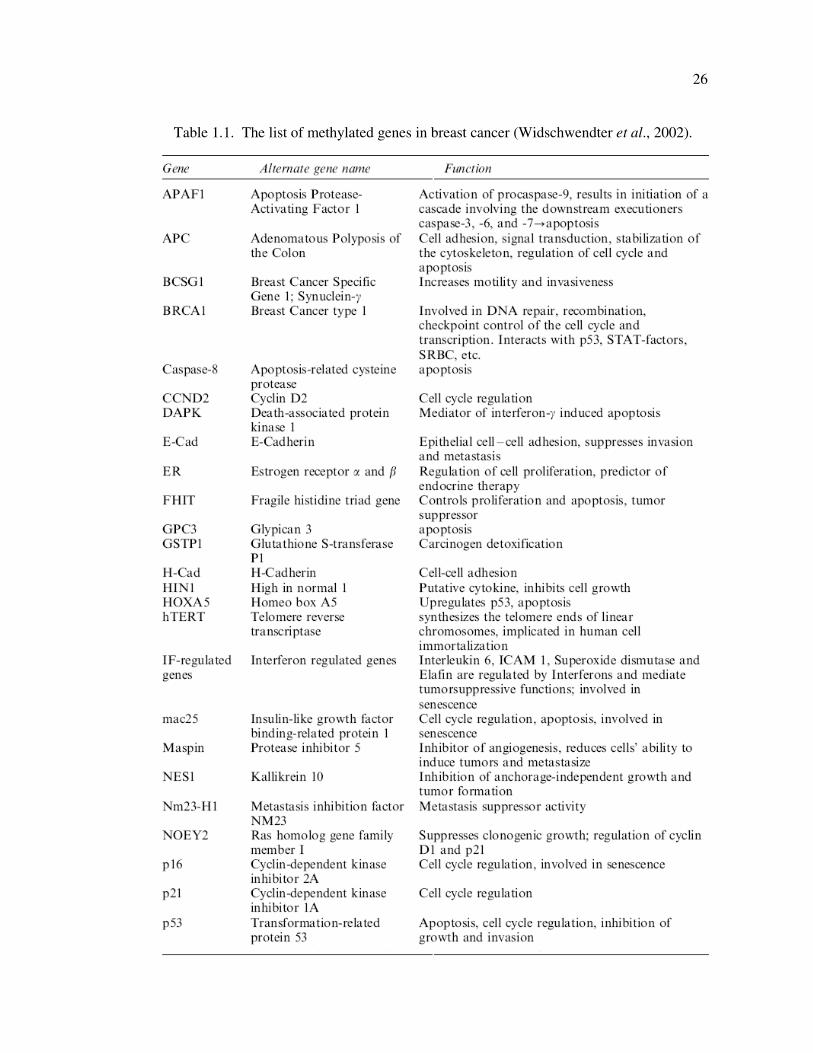
26
Table 1.1. The list of methylated genes in breast cancer (Widschwendter et al., 2002).
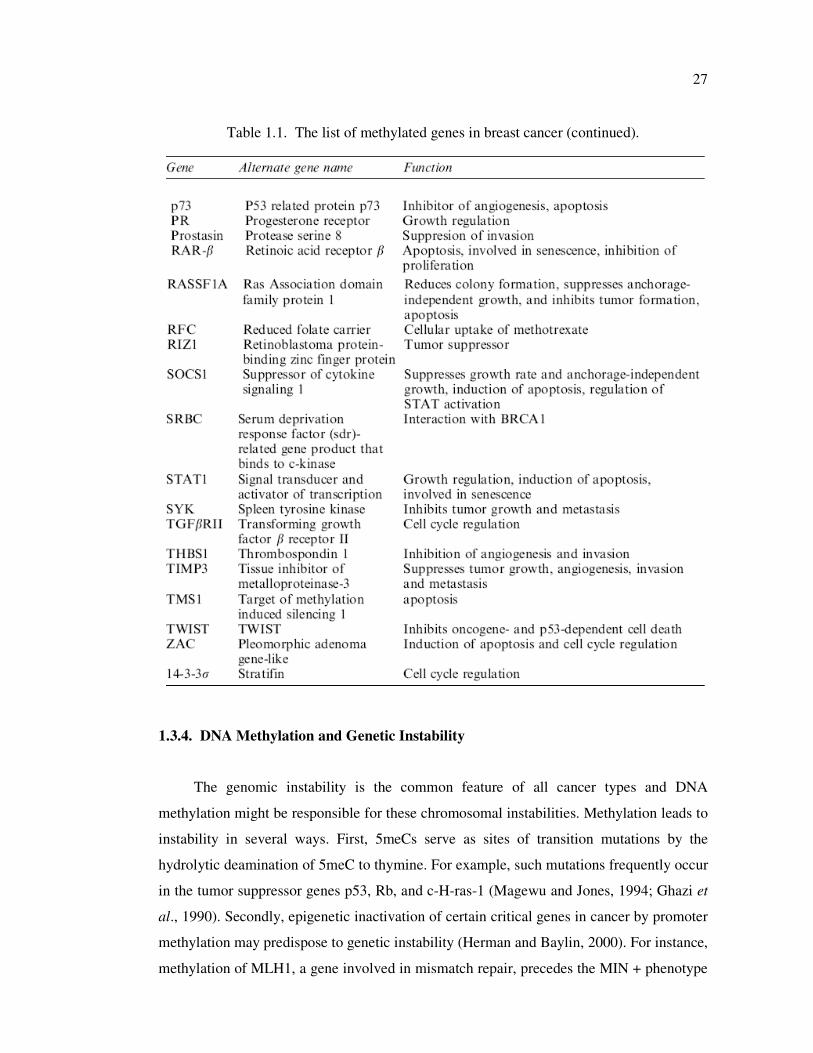
27
Table 1.1. The list of methylated genes in breast cancer (continued).
1.3.4. DNA Methylation and Genetic Instability
The genomic instability is the common feature of all cancer types and DNA
methylation might be responsible for these chromosomal instabilities. Methylation leads to
instability in several ways. First, 5meCs serve as sites of transition mutations by the
hydrolytic deamination of 5meC to thymine. For example, such mutations frequently occur
in the tumor suppressor genes p53, Rb, and c-H-ras-1 (Magewu and Jones, 1994; Ghazi et
al., 1990). Secondly, epigenetic inactivation of certain critical genes in cancer by promoter
methylation may predispose to genetic instability (Herman and Baylin, 2000). For instance,
methylation of MLH1, a gene involved in mismatch repair, precedes the MIN + phenotype
28
in sporadic colon, gastric and endometrial cancers (Esteller et al. 1999). Furthermore, there
is a striking correlation between mismatch repair, genetic instability and methylation
capacity in colon cancer cell models (Lengauer et al., 1997, 1998). In addition, promoter
CpG island methylation and resulting inactivation of the detoxifying π-class glutathione S-
transferase (GST) can lead to accumulation of oxygen radicals and subsequent DNA
damage (Lee et al., 1994, Henderson et al., 1998, Matsui et al., 2000). A p53-inducible
gene, 14–3–3σ, is methylated and inactivated in many breast cancers. Loss of its
expression may also facilitate the accumulation of genetic damages (Ferguson et al., 2000).
Apart from regional hypermethylation of some critical tumor suppressor genes, genome-
wide hypomethylation is an important feature in cancer and can also contribute to genetic
instability (Schmutte and Fishel, 1999).
Genomic integrity, senescence, and evasion of programmed cell death (apoptosis) are
thought to be important barriers to the development of malignant lesions. DNA repair
proteins have emerged as the key regulators among the multitude of players involved in
cell cycle control and apoptosis by inducing apoptosis in stressed or abnormal cells,
thereby protecting the organism from cancer development.
1.3.5. DNA Repair System
DNA repair enzymes maintain the integrity of the genetic code by removing
damaged DNA segments and minimizing replication errors. DNA damage may be a
consequence of normal cellular function (e.g. replication errors, oxidative metabolism,
reactive metabolites of hormone synthesis) or of environmental factors such as radiation
(UV) or xenobiotic chemicals (Mohrenweiser and Jones, 1998). Cells with damaged DNA
may be removed by apoptosis, or programmed cell death. If DNA adducts escape cellular
repair mechanisms and persist, they may lead to miscoding, resulting in permanent
mutations. If a permanent mutation occurs in a critical region of an oncogene or tumor
suppressor gene, it can lead to activation of the oncogene or deactivation of the tumor
suppressor gene. Multiple events of this type lead to aberrant cells with loss of normal
growth control and ultimately to cancer.
29
Multiple and complementary DNA repair systems have evolved to protect the
genome against the detrimental effects of DNA lesions. DNA repair may take place by one
of several pathways, depending on the type of damage, including nucleotide excision repair
(NER), base excision repair (BER), mismatch repair, or recombinatorial repair. Nucleotide
excision repair (NER) enzymes are responsible for removing ‘bulky’ DNA damage that
distorts the DNA helix such as UV photoproducts (thymine dimers), chemically induced
intra-strand crosslinks and bulky chemical adducts (polycyclic aromatic hydrocarbons and
aromatic amines). Two distinct sub-pathways are present in the mammalian NER system:
i.e., global genome NER (GG-NER) that operates genome wide, and transcription-coupled
NER (TC-NER) that is specialized to eliminate transcription-blocking lesions on the DNA
strand of active genes (Figure 1.11). The NER pathway includes several steps: (i) DNA
damage recognition; (ii) assembly of repair factors; (iii) incision of damaged DNA; (iv)
repair synthesis to fill gapped DNA; and (v) DNA ligation. DNA damage is recognized by
the Xeroderma Pigmentosum Group C (XPC)–hHR23B complex, followed by recruitment
of the transcription factor IIH (TFIIH) complex of proteins. The TFIIH complex is
composed of nine subunits, including XPD and XPB (de Boer and Hoeijmakers, 2000).
TFIIH unwinds the DNA duplex around the damaged site. Next, XPG binds to the TFIIH
complex and DNA, followed by recruitment of the XPF–ERCC1 complex. XPG and XPF–
ERCC1 produce dual incisions of 30 and 50 nucleotides at damaged site. After release of
the damaged DNA strand, the gap is filled by repair synthesis and ligation (Bradsher et al.,
2002).
The in vitro and in vivo experiments suggest that XPC-hHR23B complex is the initial
component for detecting DNA damage and plays at least four roles in DNA damage
recognition. First, XPC-hHR23B can discriminate between DNA distortions and the
Watson-Crick structure. Second, XPC-hHR23B may be the first NER factor to respond to
DNA damage in GGR. Third, XPC-hHR23B’s presence at sites of DNA damage can
induce a further bending of the DNA, which may enhance the binding of other downstream
NER proteins to the site of DNA lesions (Sugasawa et al., 1998). Finally, XPC-hHR23B
has a critical role in the recruitment of TFIIH, which is known to promote the opening of
the DNA helix in the vicinity of the lesion, presumably to assist in the assembly of
subsequent NER factors for further processing of the lesion (Schaeffer et al., 1993; Feaver
et al., 1993; Drapkin et al., 1994).
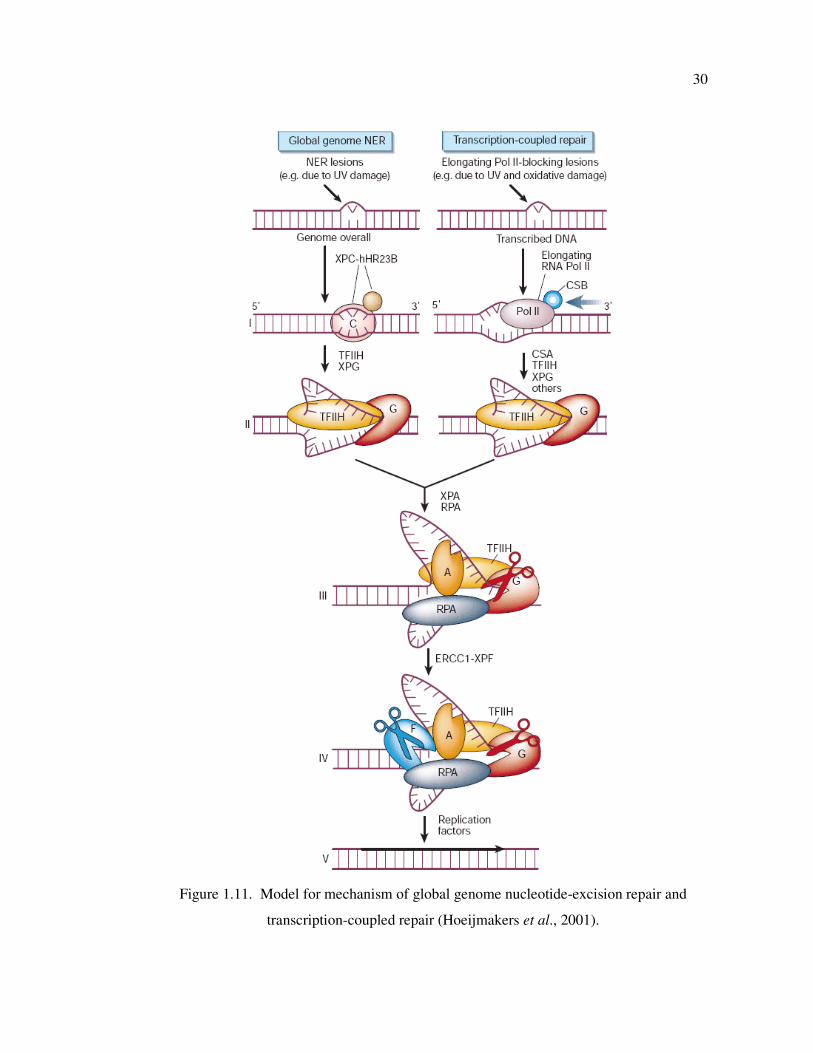
30
Figure 1.11. Model for mechanism of global genome nucleotide-excision repair and
transcription-coupled repair (Hoeijmakers et al., 2001).
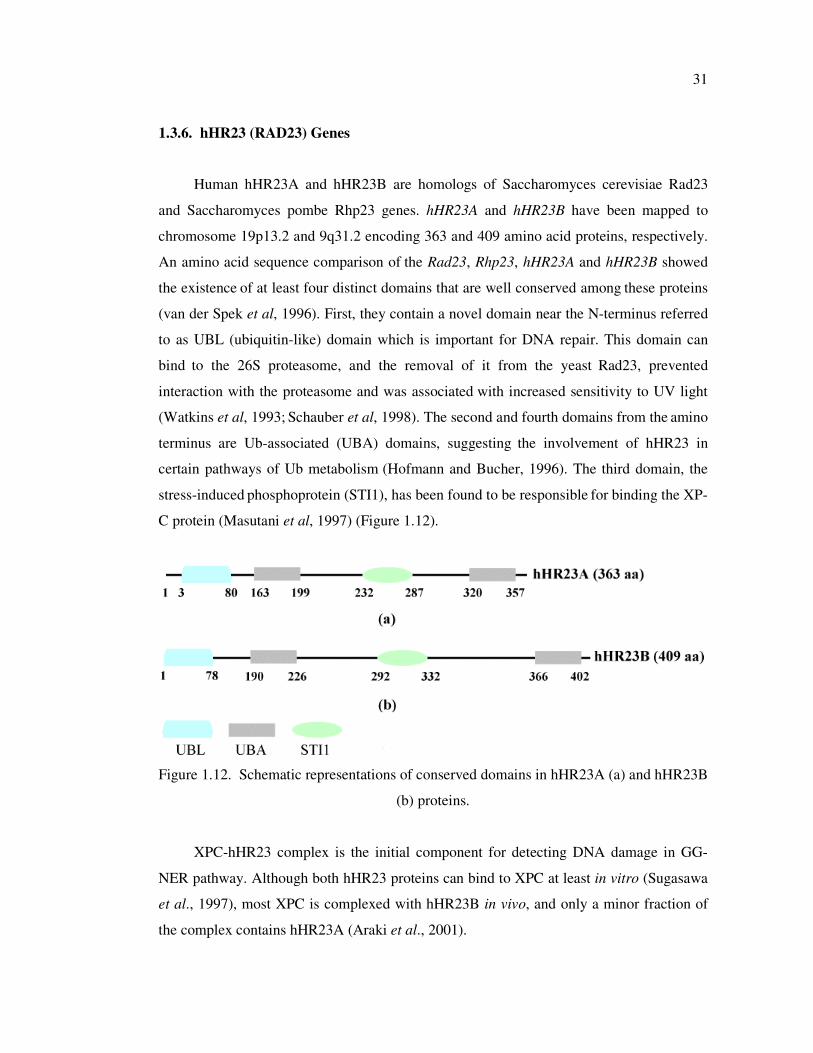
31
1.3.6. hHR23 (RAD23) Genes
Human hHR23A and hHR23B are homologs of Saccharomyces cerevisiae Rad23
and Saccharomyces pombe Rhp23 genes. hHR23A and hHR23B have been mapped to
chromosome 19p13.2 and 9q31.2 encoding 363 and 409 amino acid proteins, respectively.
An amino acid sequence comparison of the Rad23, Rhp23, hHR23A and hHR23B showed
the existence of at least four distinct domains that are well conserved among
these proteins
(van der Spek et al, 1996). First, they contain a novel domain near the N-terminus referred
to as UBL (ubiquitin-like) domain which is important for DNA repair. This domain can
bind to the 26S proteasome, and the removal of it from the yeast
Rad23, prevented
interaction with the proteasome and was associated with increased sensitivity to UV light
(Watkins et al, 1993; Schauber et al, 1998). The second and fourth domains from the
amino
terminus are Ub-associated (UBA) domains, suggesting the involvement of hHR23 in
certain pathways of Ub metabolism (Hofmann and Bucher, 1996). The third domain, the
stress-induced phosphoprotein (STI1), has been found to be responsible
for binding the XP-
C protein (Masutani et al, 1997) (Figure 1.12).
Figure 1.12. Schematic representations of conserved domains in hHR23A (a) and hHR23B
(b) proteins.
XPC-hHR23 complex is the initial component for detecting DNA damage in GG-
NER pathway. Although both hHR23 proteins can bind to XPC at least in vitro (Sugasawa
et al., 1997), most XPC is complexed with hHR23B in vivo, and only a minor fraction of
the complex contains hHR23A (Araki et al., 2001).
32
Studies on hHR23A/B knock-out (KO) mice have shown that hHR23A was likely
functionally redundant with hHR23B. hHR23B KO mice exhibit moderate UV sensitivity
and NER deficiency, whereas hHR23A KO mice do not exhibit any observable defects in
DNA repair activity. However, when both hHR23A and hHR23B were deleted, the mice
exhibited extremely severe phenotypes, impaired embryonic development and high rates of
intrauterine death. Surviving animals displayed retarded growth, male sterility, facial
dysmorphology and DNA repair defects (Ng et al., 2003). Since these phenotypes were not
observed in XPC KO mice, the hHR23A/B KO phenotype was not due to NER deficiency
suggesting that hHR23A/B proteins have additional cellular functions. These findings
indicate also that the hHR23A does not completely duplicate the function of hHR23B and
must have a function of its own. However, mHR23A and mHR23B appeared to have
redundant roles in NER. Over expression of hHR23A in the mHR23A/B double knock out
cells restored not only the steady-state level and stability of the XPC protein, but also
cellular NER activity to near wild-type levels (Okuda et al., 2004).
Studies on hHR23A/B knockdown (KD) cell lines have shown that while hHR23AKD
cells were not blocked in S phase after UVC irradiation, many hHR23BKD
cells were
hindered in getting out of S phase. This suggested the presence of unrepaired UVC-
induced DNA damage in hHR23BKD
cells. Therefore, hHR23BKD
cells seemed to behave
like XP cells. hHR23BKD
cells displayed a significant sensitivity to UVC, in contrast to
hHR23AKD
cells, which strongly tolerated UVC irradiation (Biard A, 2007). This also
suggested that hHR23A and hHR23B displayed diverse biological functions leading cells
to different outcomes.
Intriguingly, only a minority of hHR23B and hHR23A is bound to XPC, suggesting
that both proteins have additional functions (Sugasawa et al., 1996). hHR23 proteins are
players for multiple mechanisms including DNA repair and proteasome-mediated protein-
degradation and apoptosis (Kim et al., 2004; Glockzin et al., 2003).
hHR23 proteins connect the NER and ubiquitin/proteasome mediated protein
degradation pathways via UBA and UBL domains. The ubiquitin-proteasome pathway
plays a key regulatory role in a variety of cellular events, including the removal of
misfolded proteins, production of immunocompetent peptides, activation or repression of
33
transcription, and regulation of cell cycle progression (Schubert et al., 2000; Yamaguchi et
al., 2000). Proteins are ubiquitylated and consequently delivered to the 26S proteasome for
degradation. Ubiquitin receptor family can directly connect ubiquitylated proteins to the
proteasome via their UBA and UBL domains binding the ubiquitin and proteasome,
respectively. However, depending on the levels of UBL/UBA containing proteins they can
promote or inhibit the degradation of ubiquitylated substrates. The binding of UBL/UBA
containing proteins to the ubiquitylated substrates inhibits the polyubiquitination and
prevent proteolysis by proteasomes (Ortolan et al., 2000).
hHR23 proteins regulate the induction and stability of XPC via inhibiting the
proteolysis by proteasomes. In the absence of hHR23 proteins, XPC is highly unstable
since it is ubiquitylated and degraded by 26S proteasome. Under normal conditions, XPC-
hHR23 complex results in a significant reduction of XPC proteolysis and consequently in
increased steady-state levels of the protein complex. This correlates with proficient GG-
NER activity. The protecting role of hHR23 is performed via inhibition of
polyubiquitination (Schauber et al., 1998; Lommel et al., 2002; Ortolan et al., 2000). This
hypothesis was supported by the observation of presence of XPC-Ub conjugates and
increased XPC stability in proteasome inhibitor treated mHR23A/mHR23B KO cells (Ng
et al., 2003).
In addition to NER, XPC–hHR23B complex is associated with the base excision
repair (BER). The XPC protein interacts physically and functionally with the thymine
DNA glycosylase, the enzyme that recognizes cyclobutane pyrimidine dimers at the initial
step of BER (Shimizu et al., 2003). 3-Methyladenine-DNA glycosylase, an initiator of
BER also interacts with hHR23A proteins, suggesting that these proteins are involved in
BER (Miao et al., 2000). Hsieh et al. reported that hHR23AKD
, but not hHR23BKD
, cells,
were hypersensitive to the treatment of methylmethane sulfonate, a major substrate for
BER (Hsieh et al., 2005). This suggests that hHR23A might be a player for the two major
DNA repair pathways, BER and NER.
Moreover, multiple engagements between hHR23/Rad23 and cell cycle regulation
are present. (1) RAD23 has a partially redundant role with and binds to RPN10 in the
G2/M transition (Lambertson et al. 1999). (2) RAD23 is involved in spindle assembly and
34
S-phase checkpoints (Clarke et al., 2001). (3) RAD23, together with DSK2, has a role in
spindle pole duplication (Biggins et al., 1996). The link with spindle pole duplication was
recently strengthened by the discovery of the centrosome factor CEN2 as the third
component of the XPC/HR23 complex (Araki et al., 2001). (4) hHR23 proteins themselves
appear to be regulated in a cell-cycle-dependent manner with specific degradation during
S- phase (Kumar et al., 1999).
The damage-signaling tumor-suppressor protein p53 is partly regulated by hHR23A
and hHR23B. hHR23A and a minor amount of hHR23B form a complex with p53.
hHR23A and B proteins downregulated the transactivating activity of p53 via inhibition of
the CREB (cyclic AMP-responsive element binding) protein, which acts as a coactivator of
p53 transcription (Zhu et al., 2001). Overexpression of hHR23A and B proteins has led to
the accumulation of ubiquitinated p53 and blocked p53 proteasome degradation (Glockzin
et al., 2003). These paradoxical effects of hHR23 proteins on p53 degradation are
consistent with suggestions that the effects of hHR23 on degradation are highly sensitive to
stoichiometric variation (Raasi and Pickart, 2003; Verma et al., 2004). Additionally,
hHR23A and B interact with mouse double minute 2 (MDM2) protein. MDM2 contacts
with 20S core particle of the proteasome and functions to antagonize the stabilizing
function of hHR23 toward p53, directly promoting p53 recognition and degradation by the
proteasome (Brignone et al., 2004; Sdek et al., 2005).
Kaur et al. (2007) has shown that hHR23B was required for genotoxic-specific
activation of p53 and apoptosis. After exposure with UV or chemical agents leading to
DNA damage, p53–Ub conjugates accumulate in chromatin and hHR23B is required for
induction and maintenance of these p53–Ub species. The knockdown of hHR23B blocks
p53 stabilization and resulted in significant reduction in apoptosis and increase in viability
when compared to hHR23B expressing cells. Robust XPC depletion had no impact on
genotoxin-induced apoptosis suggesting that the inhibition of apoptosis due to hHR23B
depletion could not be explained by a reduction in DNA repair efficiency. The hHR23B-
dependent accumulation of p53–Ub conjugates after DNA damage correlated with p53
stabilization and apoptosis. p53–Ub conjugates could contribute to transcription-dependent
functions of p53, which are required for downstream p53 activities (induction of target
genes p21 and bax) (Slee et al., 2004; Schuler and Green, 2005).
35
1.4. Congenital Hypothyroidism (CH)
1.4.1. The Thyroid Gland
All vertebrates possess a pair of thyroid glands, located in the anterior neck region. It
consists of two lobes: one on either side of the trachea, and a connecting portion called the
isthmus, giving the entire gland an H-shaped appearance. The gland varies in size with
sexual development, diet and age. The thyroid gland consists of a large number of round or
oval follicles surrounded by connective tissue and blood vessels. Each follicle is lined by a
cuboidal epithelial cell layer of one-cell thickness. The cavities of the follicles are filled in
with viscous protein material called colloid in which the thyroid hormone, thyroxine, is
stored.
Normal thyroid function is essential for development, growth and metabolic
homeostasis. The primary function of the thyroid is the formation, storage, and secretion of
thyroid hormones (Robbins et al., 1980; Kohn et al., 1993). Thyroid hormone formation
involves a coordinated series of steps controlled by hypothalamic-pituitary-thyroid axis
(Figure 1.13). The TRH, released from hypothalamus, results in secretion of TSH from the
anterior pituitary gland. The TSH stimulates the follicular cells (TFC), via its receptor
(TSHr), to release thyroid hormones into the circulation. Thyroid hormone production
involves concentrative iodide uptake by the sodium iodide transporter (NIS), as well as
iodination of thyroglobulin (TG) by the thyroid peroxidase (TPO) (Robbins et al., 1980;
Kohn et al., 1993).
TG is synthesized as a 12S molecule (330 kDa), post-translationally glycosylated and
transported to follicular lumen. The protein contains 70 tyrosine residues that are subject to
iodination by TPO. The iodinated TG stored in follicles are degraded by lysosomes to form
triiodothyronine (T3) and thyroxine (T4). The major thyroid hormone secreted by the
thyroid gland is thyroxine. To exert its effects, T4 is converted to triiodothyronine (T3) by
the removal of an iodine atom. This occurs mainly in the liver and in certain tissues where
T3 acts, such as in the brain (Robbins et al., 1980; Weiss et al., 1984; Ekholm, 1990; Kohn
et al., 1993; Dai et al., 1996).
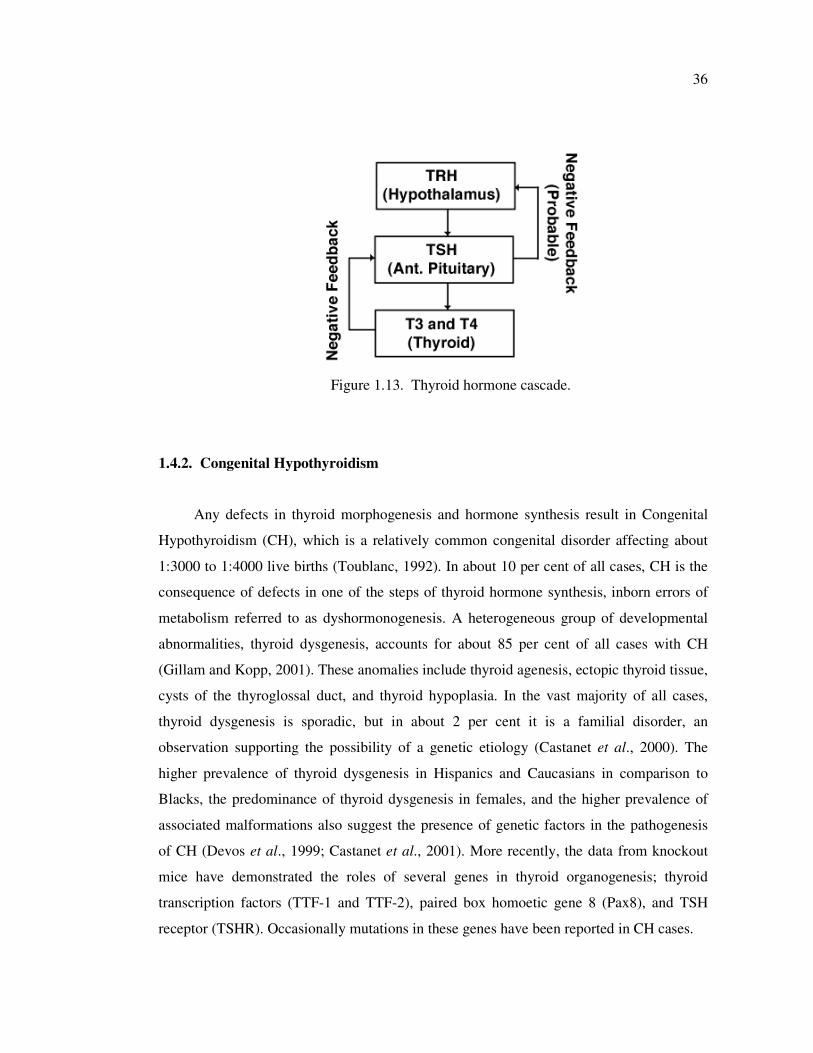
36
Figure 1.13. Thyroid hormone cascade.
1.4.2. Congenital Hypothyroidism
Any defects in thyroid morphogenesis and hormone synthesis result in Congenital
Hypothyroidism (CH), which is a relatively common congenital disorder affecting about
1:3000 to 1:4000 live births (Toublanc, 1992). In about 10 per cent of all cases, CH is the
consequence of defects in one of the steps of thyroid hormone synthesis, inborn errors of
metabolism referred to as dyshormonogenesis. A heterogeneous group of developmental
abnormalities, thyroid dysgenesis, accounts for about 85 per cent of all cases with CH
(Gillam and Kopp, 2001). These anomalies include thyroid agenesis, ectopic thyroid tissue,
cysts of the thyroglossal duct, and thyroid hypoplasia. In the vast majority of all cases,
thyroid dysgenesis is sporadic, but in about 2 per cent it is a familial disorder, an
observation supporting the possibility of a genetic etiology (Castanet et al., 2000). The
higher prevalence of thyroid dysgenesis in Hispanics and Caucasians in comparison to
Blacks, the predominance of thyroid dysgenesis in females, and the higher prevalence of
associated malformations also suggest the presence of genetic factors in the pathogenesis
of CH (Devos et al., 1999; Castanet et al., 2001). More recently, the data from knockout
mice have demonstrated the roles of several genes in thyroid organogenesis; thyroid
transcription factors (TTF-1 and TTF-2), paired box homoetic gene 8 (Pax8), and TSH
receptor (TSHR). Occasionally mutations in these genes have been reported in CH cases.
37
Thyroid transcription factor 2 (TTF-2, FKHL15, or Forkhead Box E1 FOXE1) is a
member of the forkhead/winged helix-domain protein family, many of which are key
regulators of embryonic development. TTF-2 regulates the transcription of target genes
such as TG and TPO by binding to specific regulatory DNA sequences in their promoters
via its forkhead DNA binding domain. Homozygous recessive mutations (p.S57N and
p.A65V) in TTF-2 result in a syndromic form of thyroid dysgenesis, Bamforth-Lazarus
syndrome. This phenotype includes thyroid agenesis, cleft palate, choanal atresia, bifid
epiglottis, and spiky hair (Bamforth et al., 1989; Clifton-Bligh et al., 1998; Castanet et al.,
2002). Mice homozygous for a disrupted TTF-2 gene die within 48 hours after birth and
are profoundly hypothyroid. They exhibit either small lingual thyroid or have complete
thyroid agenesis, and also have severe cleft palates. Hair defects could not be tested since
the mice die before hair formation (De Felice et al., 1998).
1.4.3. Forkhead Gene Family
Forkhead transcription factors are key regulators of embryogenesis and play
important roles in cell differentiation and development. The name derives from two
spiked-head structures in embryos of the Drosophila fork head mutant, which are defective
in formation of the anterior and posterior gut (Weigel et al., 1989). A 110-amino-acid
DNA binding domain was evolutionarily conserved between forkhead genes (Figure 1.14).
These genes have so far been found in animals, fungi and most of the metazoans. Among
the organisms for which the genome sequences are completed, or nearly so, there is indeed
a correlation between anatomical complexity and forkhead gene number: four in
Saccharomyces and Schizosaccharomyces, 15 in Caenorhabditis, 20 in Drosophila, and 39
in Homo sapiens (Carlsson and Mahlapuu, 2002). X-ray crystallography revealed that the
3D structure of a forkhead domain (FoxA3) resembled the shape of a butterfly and the term
“winged helix” was used to describe the structure, which has a helix–turn–helix core of
three α-helices, flanked by two loops, or “wings” (Figure 1.15) (Clark et al., 1993). The
term “Winged helix proteins” is often used synonymously with forkhead proteins. A large
proportion of the amino acids in the forkhead domain are invariant or highly conserved
(Figure 1.14). Forkhead proteins bind DNA as monomers in contrast to other helix–turn–
helix proteins. Hence, the binding sites, which typically span 15–17 bp, are asymmetrical
(Pierrou et al., 1994).
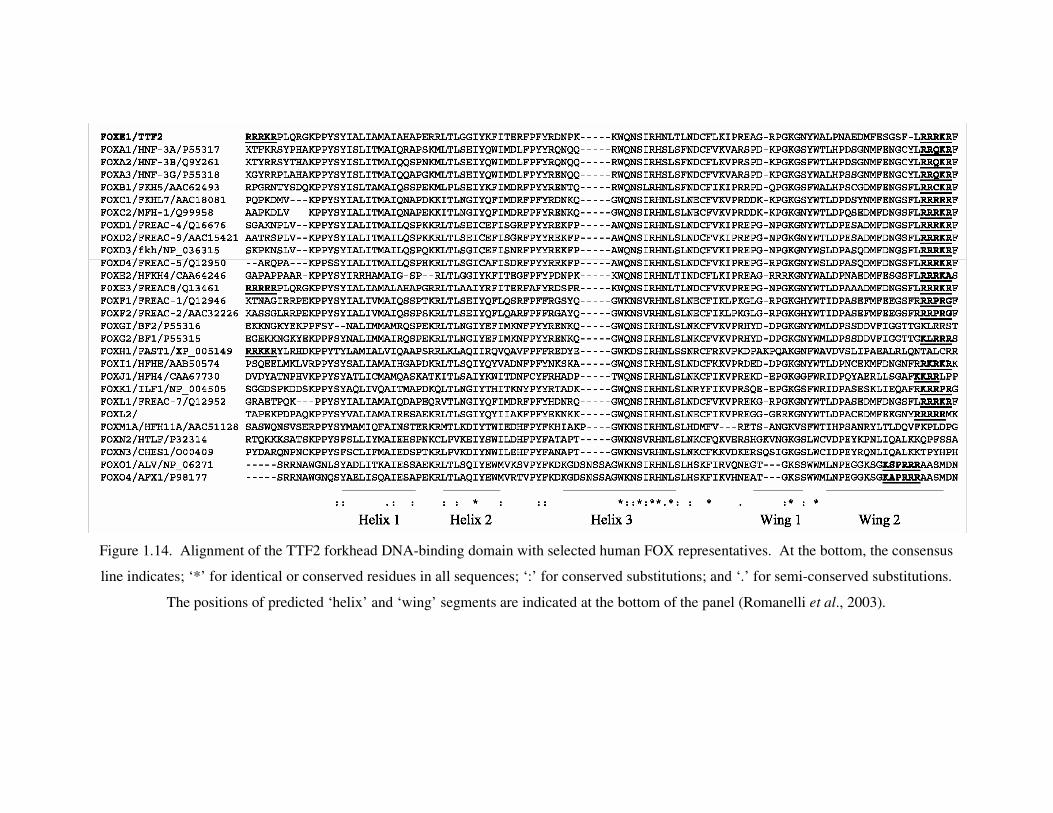
38
Figure 1.14. Alignment of the TTF2 forkhead DNA-binding domain with selected human FOX representatives. At the bottom, the consensus
line indicates; ‘*’ for identical or conserved residues in all sequences; ‘:’ for conserved substitutions; and ‘.’ for semi-conserved substitutions.
The positions of predicted ‘helix’ and ‘wing’ segments are indicated at the bottom of the panel (Romanelli et al., 2003).
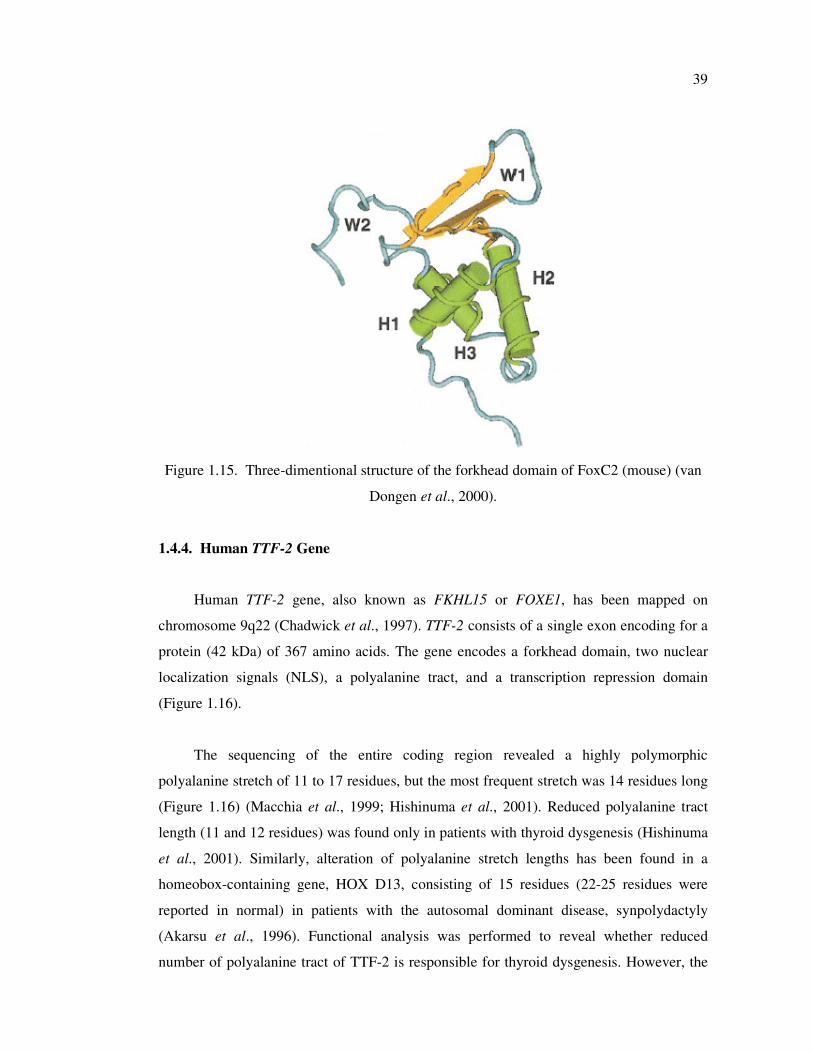
39
Figure 1.15. Three-dimentional structure of the forkhead domain of FoxC2 (mouse) (van
Dongen et al., 2000).
1.4.4. Human TTF-2 Gene
Human TTF-2 gene, also known as FKHL15 or FOXE1, has been mapped on
chromosome 9q22 (Chadwick et al., 1997). TTF-2 consists of a single exon encoding for a
protein (42 kDa) of 367 amino acids. The gene encodes a forkhead domain, two nuclear
localization signals (NLS), a polyalanine tract, and a transcription repression domain
(Figure 1.16).
The sequencing of the entire coding region revealed a highly polymorphic
polyalanine stretch of 11 to 17 residues, but the most frequent stretch was 14 residues long
(Figure 1.16) (Macchia et al., 1999; Hishinuma et al., 2001). Reduced polyalanine tract
length (11 and 12 residues) was found only in patients with thyroid dysgenesis (Hishinuma
et al., 2001). Similarly, alteration of polyalanine stretch lengths has been found in a
homeobox-containing gene, HOX D13, consisting of 15 residues (22-25 residues were
reported in normal) in patients with the autosomal dominant disease, synpolydactyly
(Akarsu et al., 1996). Functional analysis was performed to reveal whether reduced
number of polyalanine tract of TTF-2 is responsible for thyroid dysgenesis. However, the

40
expression study showed that the transcriptional activities of TTF-2 with reduced
polyalanine-tract lengths were equal to that of TTF-2 with an unreduced polyalanine tract.
These results suggested that the polymorphism of the polyalanine tract of TTF2 could not
be a cause of the developmental defects of the human thyroid gland (Hishinuma et al.,
2001).
TTF-2 protein contains two short stretches of basic amino acids (RRRKR) at both
ends of the forkhead domain (Figure 1.16). Sequence alignments of representative human
FOX protein segments show that a stretch of basic amino acids is present in most of the
proteins at the C-terminal of DNA-binding domain whereas a basic stretch at the N-
terminal of the DNA binding domain is less conserved (Figure 1.14). Previous studies have
demonstrated that the basic stretches at the C-terminal of the forkhead domain are bona
fide NLSs in four FOX proteins (Brownawell et al., 2001; Berry et al., 2002). Romanelli et
al. have shown that both stretches are bona fide NLSs and required for nuclear import via
importin α-dependent pathway (Romanelli et al., 2003).
Analysis of the TTF2 amino acid sequence identifies, in addition to the FHD, a
second domain rich in alanine and proline residues that has been found in other
developmental DNA binding proteins responsible for transcriptional repression activity.
The analysis of the activity of the deletion mutants of TTF-2 allowed mapping the
repression domain in the region between amino acids 197 and 218 at the carboxyl terminus
of the protein (Figure 1.16) (Perrone et al., 2000). Comparison of the amino acid sequence
of TTF-2 repression domain with the sequences present in the database demonstrates that
this region shows 41 per cent of identity with HNF3γ amino terminal. HNF3γ is another
member of the forkhead family that plays an important role in the tissue-specific gene
expression program both in early development and in the adult (Ang et al., 1993).
TTF2 is a promoter-specific transcriptional repressor that displays both promoter and
transcriptional activation domain specifity. TTF2 can repress Pax8 activity on TPO
promoter, but not on NIS promoter. Additionally, TTF2 is able to repress the C-terminal
activation domain of TTF1, while it has no effect on the N-terminal domain (Perrone et al.,
2000). These observations suggest that it is able to recognize specific promoter architecture
and represses only a subset of the genes activated by TTF1 and Pax8, since all these factors
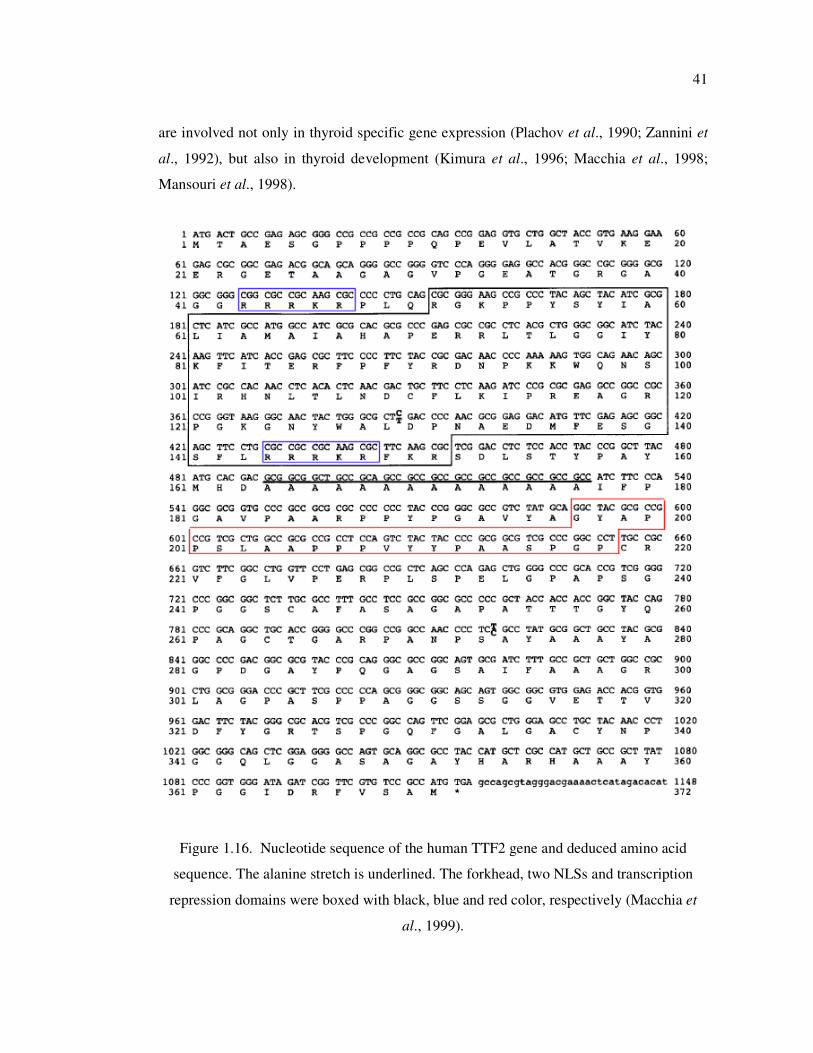
41
are involved not only in thyroid specific gene expression (Plachov et al., 1990; Zannini et
al., 1992), but also in thyroid development (Kimura et al., 1996; Macchia et al., 1998;
Mansouri et al., 1998).
Figure 1.16. Nucleotide sequence of the human TTF2 gene and deduced amino acid
sequence. The alanine stretch is underlined. The forkhead, two NLSs and transcription
repression domains were boxed with black, blue and red color, respectively (Macchia et
al., 1999).
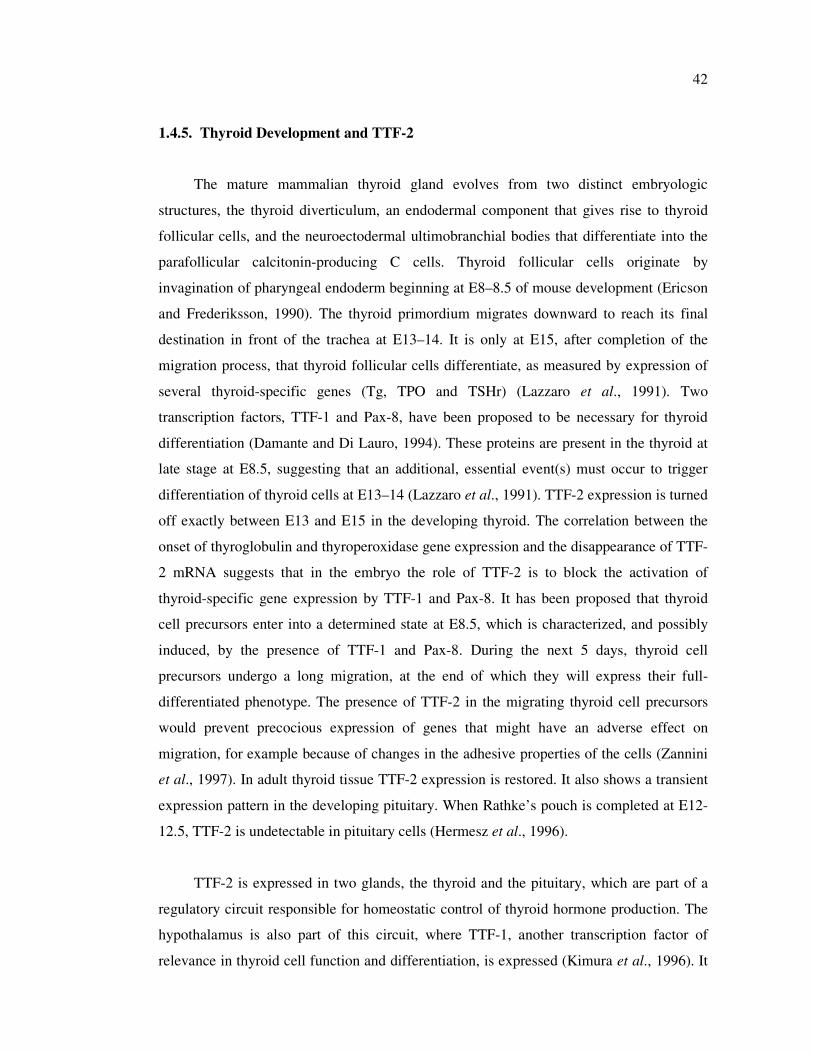
42
1.4.5. Thyroid Development and TTF-2
The mature mammalian thyroid gland evolves from two distinct embryologic
structures, the thyroid diverticulum, an endodermal component that gives rise to thyroid
follicular cells, and the neuroectodermal ultimobranchial bodies that differentiate into the
parafollicular calcitonin-producing C cells. Thyroid follicular cells originate by
invagination of pharyngeal endoderm beginning at E8–8.5 of mouse development (Ericson
and Frederiksson, 1990). The thyroid primordium migrates downward to reach its final
destination in front of the trachea at E13–14. It is only at E15, after completion of the
migration process, that thyroid follicular cells differentiate, as measured by expression of
several thyroid-specific genes (Tg, TPO and TSHr) (Lazzaro et al., 1991). Two
transcription factors, TTF-1 and Pax-8, have been proposed to be necessary for thyroid
differentiation (Damante and Di Lauro, 1994). These proteins are present in the thyroid at
late stage at E8.5, suggesting that an additional, essential event(s) must occur to trigger
differentiation of thyroid cells at E13–14 (Lazzaro et al., 1991). TTF-2 expression is turned
off exactly between E13 and E15 in the developing thyroid. The correlation between the
onset of thyroglobulin and thyroperoxidase gene expression and the disappearance of TTF-
2 mRNA suggests that in the embryo the role of TTF-2 is to block the activation of
thyroid-specific gene expression by TTF-1 and Pax-8. It has been proposed that thyroid
cell precursors enter into a determined state at E8.5, which is characterized, and possibly
induced, by the presence of TTF-1 and Pax-8. During the next 5 days, thyroid cell
precursors undergo a long migration, at the end of which they will express their full-
differentiated phenotype. The presence of TTF-2 in the migrating thyroid cell precursors
would prevent precocious expression of genes that might have an adverse effect on
migration, for example because of changes in the adhesive properties of the cells (Zannini
et al., 1997). In adult thyroid tissue TTF-2 expression is restored. It also shows a transient
expression pattern in the developing pituitary. When Rathke’s pouch is completed at E12-
12.5, TTF-2 is undetectable in pituitary cells (Hermesz et al., 1996).
TTF-2 is expressed in two glands, the thyroid and the pituitary, which are part of a
regulatory circuit responsible for homeostatic control of thyroid hormone production. The
hypothalamus is also part of this circuit, where TTF-1, another transcription factor of
relevance in thyroid cell function and differentiation, is expressed (Kimura et al., 1996). It
43
is inviting to think that recruitment of the same regulatory molecules in functionally related
organs in the thyroid–pituitary–hypothalamic axis is advantageous to coordinate
development and function.
TTF-2 has a dual function in the development of the thyroid gland (Zannini et al.,
1997). In the mouse, TTF-2 shows transient expression during the migration of thyroid
precursor cells from the invagination of the pharyngeal endoderm to the final destination in
front of the trachea. During this period, TTF-2 represses transcriptional activation of the
thyroglobulin and thyroperoxidase promoters by TTF-1 and PAX8, respectively.
Subsequently, TTF-2 expression is turned off; however, is restored in adult thyroid tissue.
In the adult thyroid, TTF-2 functions as a transcriptional activator of thyroglobulin
(Sinclair et al., 1990) and thyroperoxidase (Francis-Lang et al., 1992; Aza-Blanc et al.,
1993).
1.4.6. TTF-2 Gene Mutations
Two missense mutations (p.A65V and p.S57N) of human TTF-2 gene have been
reported in two families with CH. In a Welsh family, two male siblings with thyroid
agenesis, cleft palate, choanal atresia and bifid epiglottis together with spiky hair were
homozygous for a missense mutation (p.A65V) within the forkhead DNA binding domain.
Functional studies indicated that the p.A65V mutation is highly deleterious, with the
mutant protein exhibiting a complete lack of DNA binding and transcriptional activation.
In neither case thyroid tissue was detected by 123
I scanning and ultrasonography (Clifton-
Bligh et al., 1998). In the second family, a homozygous p.S57N missense mutation within
the forkhead domain was reported in two probands presented with CH. Both siblings
exhibited cleft palate, and the other cervical midline defects (choanal atresia, bifid
epiglottis) were absent. When compared directly in functional studies, the p.S57N mutation
is less deleterious than the p.A65V mutation, preserving some DNA binding and
transcriptional activity. Although p.S57N mutant protein retains 75 per cent of the maximal
transcriptional activity, thyroid tissue was absent in both siblings. Unlike the cases
described previously, these patients had an incomplete clinical phenotype, which may
indicate partial preservation of TTF-2 function in vivo (Castanet et al., 2002).
44
1.4.7. Plasma Cholinesterase Deficiency
Patients with CH are candidates for multiple operations due to midline defects (cleft
palate and choanal atresia) and their response to administration of muscle relaxants is
crucial. Several cases with different disease phenotype showing the prolonged
neuromuscular block (paralysis) have been reported following the administration of muscle
relaxants such as mivacurium (Kaiser et al., 1995; Chung et al., 2002). Mivacurium is a
short acting non-depolarising neuromuscular blocking agent (Kaiser et al., 1995).
Deficiency or abnormality of plasma cholinesterase (also called pseudocholinesterase–
PChE, butyrylcholinesterase–BChE) may cause prolonged duration of action of
mivacurium (Barta et al., 2001). Up to date, more than 20 genetic variants of BChE have
been described and p.Asp70Gly (A-variant) and Ala539Thr (K-variant) are the most
common ones responsible for reduced activity of Butyrylcholinesterase (La Du, 1993).
45
2. AIM OF THE STUDY
In the context of this study, the aim was to investigate the genetic mechanisms
responsible for Rett Syndrome (RTT), Breast Carcinogenesis, and Congenital
Hypothyroidism (CH).
To provide further delineation of MECP2 mutations in RTT patients, we have
investigated the mutation profile of the entire coding region of the MECP2 gene and XCI
pattern in a cohort of 71 patients with classical or atypical RTT. The analyses in RTT
patients were extended:
• to establish quantitative Real Time PCR and quantitative fluorescent multiplex PCR
assays to detect the MECP2 exon rearrangements in mutation negative patients,
• to evaluate the impact of the use of stringent clinical criteria on MECP2 mutation
detection rate,
• to establish XCI analysis using two different reference genes,
• to evaluate the contribution of XCI to RTT clinical phenotype,
• to perform genotype/phenotype correlation based on comparison of severity score of
patients with the type and location of the mutation and the XCI pattern.
• to develop a rapid and efficient MECP2 mutation screening strategy to be used as a
preliminary step for genetic diagnosis of RTT. We aimed to design a simpler
multiplex ARMS-PCR strategy that allows identification
of seven mutations
accounting for up to two thirds of pathogenic MECP2 mutations.
• to analyse the effect of DNA concentration on reliability and reproducibility of Real
Time PCR analysis for identification of MECP2 exon rearrangments.
Aberrant methylation of CpG-rich sites (CpG islands) was identified as an epigenetic
mechanism for the transcriptional silencing of repair genes in different types of cancer. In
this study, the methylation status of 5’ flanking regions (including the CpG islands and
putative promoter sequence) of hHR23A and hHR23B genes were investigated in primary
breast tumor, tumor adjacent tissues, and normal breast tissues. Since the methylation
status of these genes was not investigated before, we aimed;

46
• to characterize the CpG islands and the putative promoter region in the 5' flanking
region of the hHR23 genes using web-based analysis,
• to design primer sequences to investigate the methylation status of CpG di-
nucleotides,
• to determine the methylation status of the putative promoter region of hHR23 genes
in archival formalin-fixed, paraffin-embedded breast tumor and normal tissues.
The genetic mechanisms leading to congenital hypothyroidism and prolonged
paralysis after mivacurium in a patient with Bamforth Syndrome were investigated. For
this purpose;
• The patient was screened for the presence of mutations within the TTF2 gene
responsible of hypothyroidism. The effect of the identified mutation on DNA binding
ability of the TTF2 protein was tested based on a collaborative study.
• Since our CH patient was the first case with Bamforth Syndrome showing plasma
cholinesterase deficiency, the patient DNA sample was investigated for the presence
of BChE variants responsible for prolonged neuromuscular block (paralysis) after
administration of mivacurium as a muscle relaxant.
47
3. MATERIALS
3.1. Subjects and Samples
Peripheral blood samples of patients with Rett Syndrome were provided with an
informed consent by Istanbul University (Department of Neurology, Division of Child
Neurology), Marmara University Hospital (Department of Pediatrics, Division of Child
Neurology), Health Ministry Tepecik Education Hospital (Child Health and Diseases
Clinics), and other centers.
The patient with Congenital Hypothyroidism was referred from Kocaeli University,
Faculty of Medicine, Department of Pediatrics.
Archival formalin-fixed, paraffin-embedded tissues were kindly provided by
Marmara University Hospital (Department of Pathology) and Nişantaşı Pathology
Laboratories (Istanbul, Turkey).
3.2. Chemicals
All solid and liquid chemicals used in this study were purchased from Merck
(Germany), Sigma (USA), Riedel de-Häen (Germany), and Carlo Erba (Germany), unless
stated otherwise in the text.
3.3. Fine Chemicals
3.3.1. Enzymes
Taq DNA Polymerases were purchased from Fermentas (MBI Fermentas, Lithuania).
The restriction enzymes were purchased from Promega (USA), Fermentas (Lithuania), and
New England Biolabs (England).

48
3.3.2. Oligonucleotide Primers
The primers used in the framework of this thesis were synthesized by Integrated
DNA Technologies (USA), Alpha DNA (Canada), or Iontek (Istanbul). The sequence and
PCR conditions for the primers used throughout the thesis are given in Table 3.1 through
Table 3.7.
Table 3.1. Sequence of the primers used for exon amplification of the MECP2 gene.
Ekxon Primers (5’���� 3’)
PCR
Product
Length (bp)
Annealing
Temp.
(°°°°C)
Exon 1 Rettex1F: ggacaggaaatctcgccaat
Rettex1R: cacggcggtcccactc 340 57
Exon 2 Rett1F: tttctttgttttaggctcca
Rett1R: ggccaaaccaggacatatac 190 57
Rett2.3F: gtgatacttacatacttgtt
Rett2.3R: ggctcagcagagtggtgggc 172 56
Exon 3 Rett 2.1F: gagcccgtgcagccatcagc
Rett2.2R: ctgtagagataggagttgct 270 62
Rett 3AF: tgtgtctttctgtttgtccc
Rett 3AR: gatttgggcttcttaggtgg 182 57
Rett 3BF: cctcccggcgagagcagaaa
Rett 3BR: tgacctgggtggatgtggtg 240 57
Rett 3CF: tgccttttcaaacttcgcca
Rett 3CR: tgaggaggcgctgctgctgc 410 57
Rett 3CF: tgccttttcaaacttcgcca
Rett 3MR: tggcctgagggtcggcctcagctttgc 120 58
Rett 3DF: gcagcagcagcgcctcctca
Rett 3DR: tggcaaccgcgggctgaggca 244 60
Exon 4
Rett 3EF: tgccccaaggagccagctaa
Rett 3ER: gctttgcaatccgctccgtg 200 58
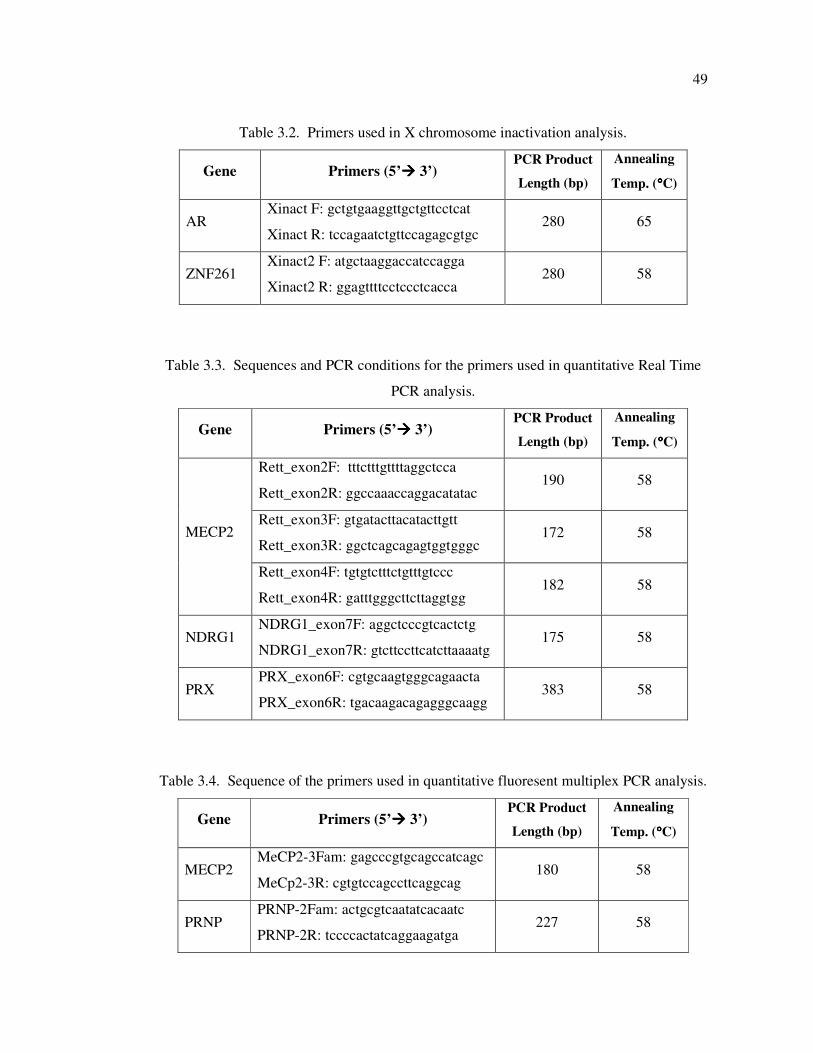
49
Table 3.2. Primers used in X chromosome inactivation analysis.
Gene Primers (5’���� 3’) PCR Product
Length (bp)
Annealing
Temp. (°°°°C)
AR Xinact F: gctgtgaaggttgctgttcctcat
Xinact R: tccagaatctgttccagagcgtgc 280 65
ZNF261 Xinact2 F: atgctaaggaccatccagga
Xinact2 R: ggagttttcctccctcacca 280 58
Table 3.3. Sequences and PCR conditions for the primers used in quantitative Real Time
PCR analysis.
Gene Primers (5’���� 3’) PCR Product
Length (bp)
Annealing
Temp. (°°°°C)
Rett_exon2F: tttctttgttttaggctcca
Rett_exon2R: ggccaaaccaggacatatac 190 58
Rett_exon3F: gtgatacttacatacttgtt
Rett_exon3R: ggctcagcagagtggtgggc 172 58 MECP2
Rett_exon4F: tgtgtctttctgtttgtccc
Rett_exon4R: gatttgggcttcttaggtgg 182 58
NDRG1 NDRG1_exon7F: aggctcccgtcactctg
NDRG1_exon7R: gtcttccttcatcttaaaatg 175 58
PRX PRX_exon6F: cgtgcaagtgggcagaacta
PRX_exon6R: tgacaagacagagggcaagg 383 58
Table 3.4. Sequence of the primers used in quantitative fluoresent multiplex PCR analysis.
Gene Primers (5’���� 3’) PCR Product
Length (bp)
Annealing
Temp. (°°°°C)
MECP2 MeCP2-3Fam: gagcccgtgcagccatcagc
MeCp2-3R: cgtgtccagccttcaggcag 180 58
PRNP PRNP-2Fam: actgcgtcaatatcacaatc
PRNP-2R: tccccactatcaggaagatga 227 58
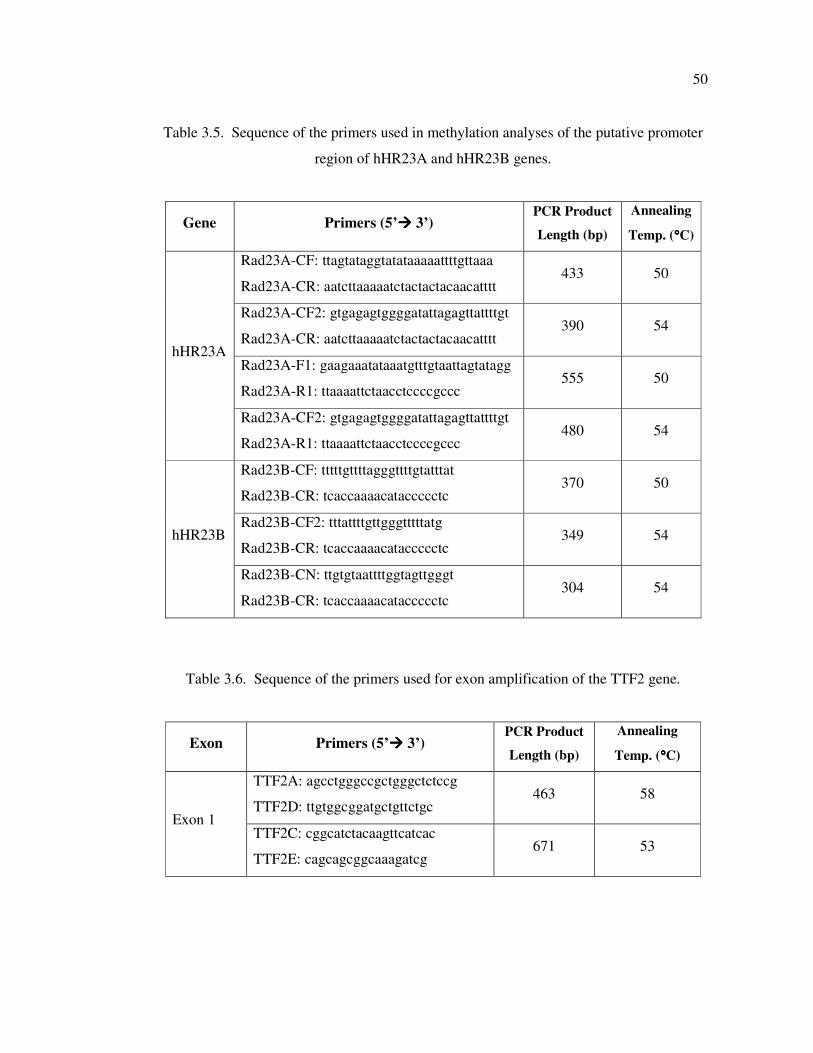
50
Table 3.5. Sequence of the primers used in methylation analyses of the putative promoter
region of hHR23A and hHR23B genes.
Gene Primers (5’���� 3’) PCR Product
Length (bp)
Annealing
Temp. (°°°°C)
Rad23A-CF: ttagtataggtatataaaaattttgttaaa
Rad23A-CR: aatcttaaaaatctactactacaacatttt 433 50
Rad23A-CF2: gtgagagtggggatattagagttattttgt
Rad23A-CR: aatcttaaaaatctactactacaacatttt 390 54
Rad23A-F1: gaagaaatataaatgtttgtaattagtatagg
Rad23A-R1: ttaaaattctaacctccccgccc 555 50
hHR23A
Rad23A-CF2: gtgagagtggggatattagagttattttgt
Rad23A-R1: ttaaaattctaacctccccgccc 480 54
Rad23B-CF: tttttgttttagggttttgtatttat
Rad23B-CR: tcaccaaaacataccccctc 370 50
Rad23B-CF2: tttattttgttgggtttttatg
Rad23B-CR: tcaccaaaacataccccctc 349 54 hHR23B
Rad23B-CN: ttgtgtaattttggtagttgggt
Rad23B-CR: tcaccaaaacataccccctc 304 54
Table 3.6. Sequence of the primers used for exon amplification of the TTF2 gene.
Exon Primers (5’���� 3’) PCR Product
Length (bp)
Annealing
Temp. (°°°°C)
TTF2A: agcctgggccgctgggctctccg
TTF2D: ttgtggcggatgctgttctgc 463 58
Exon 1 TTF2C: cggcatctacaagttcatcac
TTF2E: cagcagcggcaaagatcg 671 53
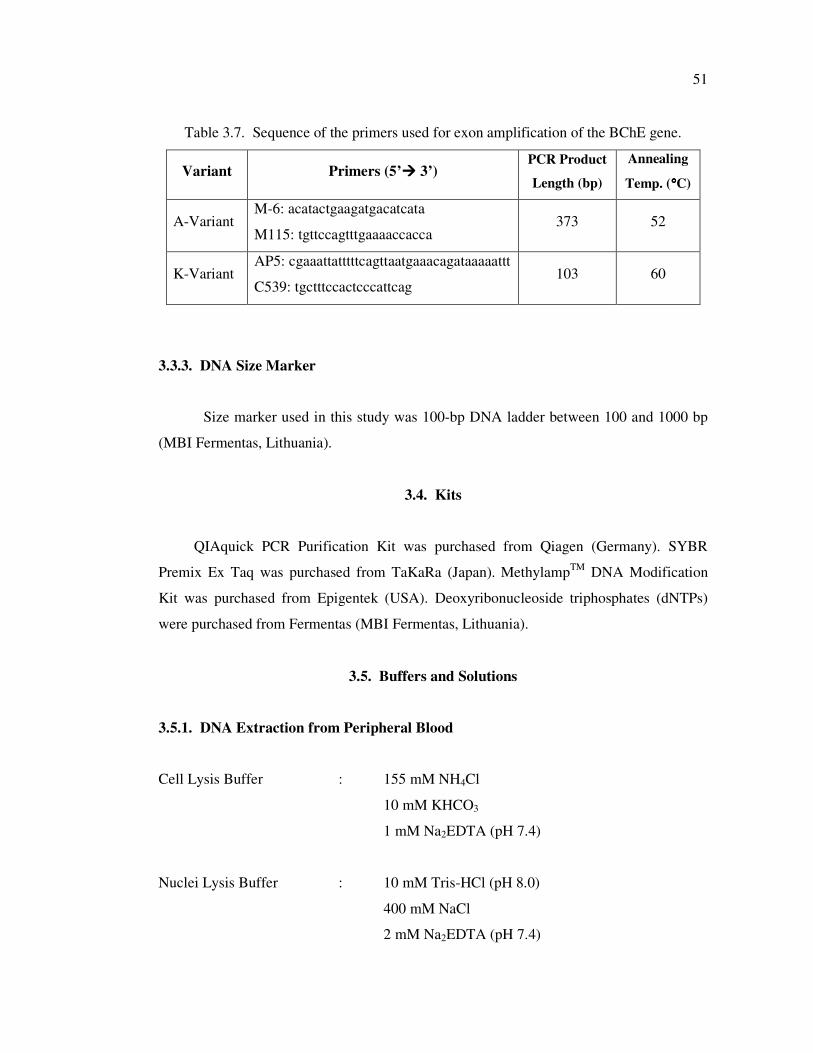
51
Table 3.7. Sequence of the primers used for exon amplification of the BChE gene.
Variant Primers (5’���� 3’) PCR Product
Length (bp)
Annealing
Temp. (°°°°C)
A-Variant M-6: acatactgaagatgacatcata
M115: tgttccagtttgaaaaccacca 373 52
K-Variant AP5: cgaaattatttttcagttaatgaaacagataaaaattt
C539: tgctttccactcccattcag 103 60
3.3.3. DNA Size Marker
Size marker used in this study was 100-bp DNA ladder between 100 and 1000 bp
(MBI Fermentas, Lithuania).
3.4. Kits
QIAquick PCR Purification Kit was purchased from Qiagen (Germany). SYBR
Premix Ex Taq was purchased from TaKaRa (Japan). MethylampTM
DNA Modification
Kit was purchased from Epigentek (USA). Deoxyribonucleoside triphosphates (dNTPs)
were purchased from Fermentas (MBI Fermentas, Lithuania).
3.5. Buffers and Solutions
3.5.1. DNA Extraction from Peripheral Blood
Cell Lysis Buffer : 155 mM NH4Cl
10 mM KHCO3
1 mM Na2EDTA (pH 7.4)
Nuclei Lysis Buffer : 10 mM Tris-HCl (pH 8.0)
400 mM NaCl
2 mM Na2EDTA (pH 7.4)
52
Sodiumdodecylsulphate : 10 per cent SDS (w/v) (pH 7.2)
Proteinase K : 20 mg/ml
TE Buffer : 20 mM Tris-HCl (pH 8.0)
0.1 mM Na2EDTA (pH 8.0)
5 M NaCl solution : 292.2 g NaCl in 1 l dH2O
3.5.2. Polymerase Chain Reaction (PCR)
10 X MgCl2 Free Buffer : 500 mM KCl
100 mM Tris-HCl (pH 9.0)
1 per cent Triton X-100 (Promega, USA)
10 X PCR Buffer : 100 mM Tris-HCl (pH 8.8 at 25 °C)
500 mM KCl
0.8 per cent Nonidet P40 (Fermentas,
Lithuania)
10 X PCR Buffer with (NH4)2SO4 : 750 mM Tris-HCl (pH 8.8 at 25 °C)
200 mM (NH4)2SO4
0.1 per cent Tween 20 (Fermentas, Lithuania)
MgCl2 : 25 mM MgCl2 (Fermentas, Lithuania and
Promega, USA)
3.5.3. Agarose Gel Electrophoresis
10 X Tris-Borate-EDTA Buffer : 0.89 M Tris-Base
0.89 M Boric Acid
20 mM Na2EDTA (pH 8.3)
1, 2 or 3 per cent Agarose Gel : 1, 2 or 3 per cent (w/v) Agarose in 0.5 X
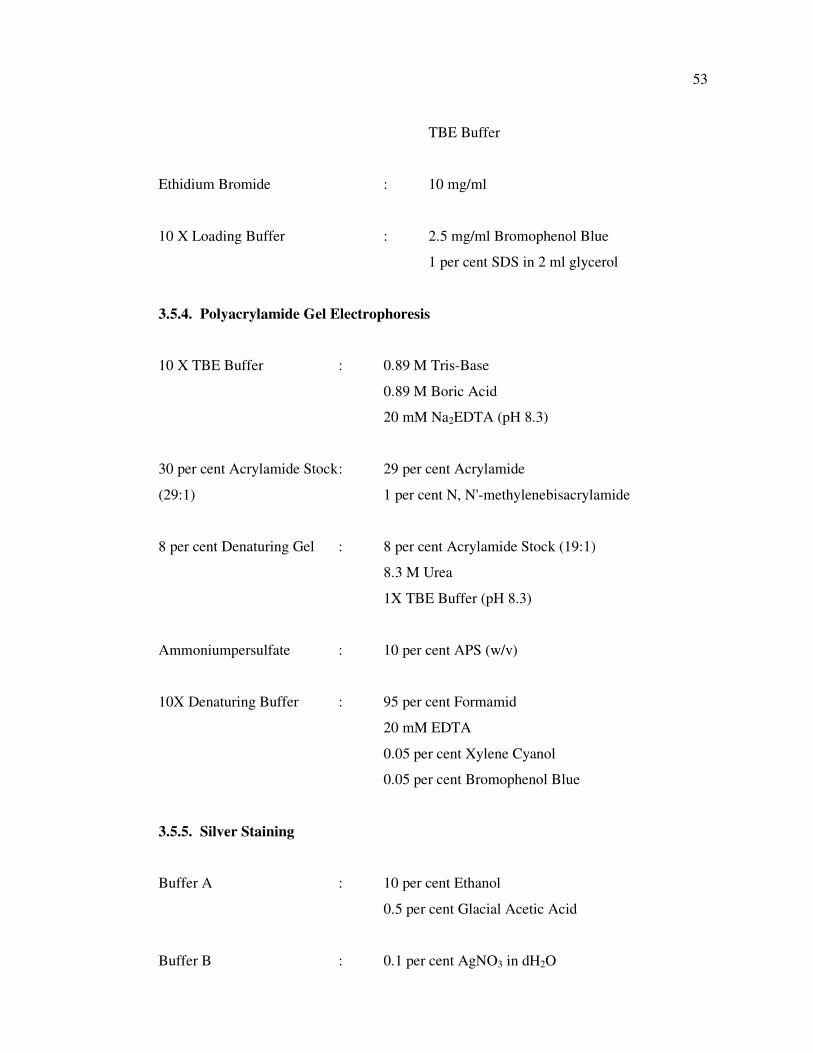
53
TBE Buffer
Ethidium Bromide : 10 mg/ml
10 X Loading Buffer : 2.5 mg/ml Bromophenol Blue
1 per cent SDS in 2 ml glycerol
3.5.4. Polyacrylamide Gel Electrophoresis
10 X TBE Buffer : 0.89 M Tris-Base
0.89 M Boric Acid
20 mM Na2EDTA (pH 8.3)
30 per cent Acrylamide Stock : 29 per cent Acrylamide
(29:1) 1 per cent N, N'-methylenebisacrylamide
8 per cent Denaturing Gel : 8 per cent Acrylamide Stock (19:1)
8.3 M Urea
1X TBE Buffer (pH 8.3)
Ammoniumpersulfate : 10 per cent APS (w/v)
10X Denaturing Buffer : 95 per cent Formamid
20 mM EDTA
0.05 per cent Xylene Cyanol
0.05 per cent Bromophenol Blue
3.5.5. Silver Staining
Buffer A : 10 per cent Ethanol
0.5 per cent Glacial Acetic Acid
Buffer B : 0.1 per cent AgNO3 in dH2O
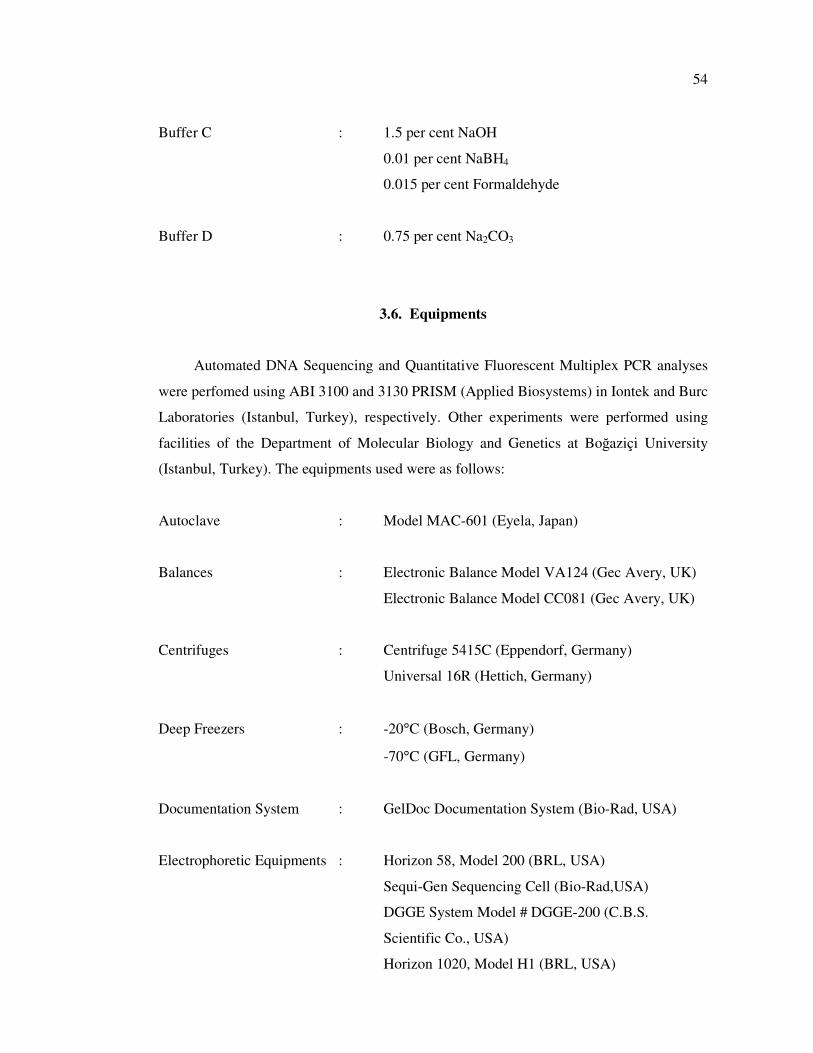
54
Buffer C : 1.5 per cent NaOH
0.01 per cent NaBH4
0.015 per cent Formaldehyde
Buffer D : 0.75 per cent Na2CO3
3.6. Equipments
Automated DNA Sequencing and Quantitative Fluorescent Multiplex PCR analyses
were perfomed using ABI 3100 and 3130 PRISM (Applied Biosystems) in Iontek and Burc
Laboratories (Istanbul, Turkey), respectively. Other experiments were performed using
facilities of the Department of Molecular Biology and Genetics at Boğaziçi University
(Istanbul, Turkey). The equipments used were as follows:
Autoclave : Model MAC-601 (Eyela, Japan)
Balances : Electronic Balance Model VA124 (Gec Avery, UK)
Electronic Balance Model CC081 (Gec Avery, UK)
Centrifuges : Centrifuge 5415C (Eppendorf, Germany)
Universal 16R (Hettich, Germany)
Deep Freezers : -20°C (Bosch, Germany)
-70°C (GFL, Germany)
Documentation System : GelDoc Documentation System (Bio-Rad, USA)
Electrophoretic Equipments : Horizon 58, Model 200 (BRL, USA)
Sequi-Gen Sequencing Cell (Bio-Rad,USA)
DGGE System Model # DGGE-200 (C.B.S.
Scientific Co., USA)
Horizon 1020, Model H1 (BRL, USA)

55
PROTEAN Vertical electrophoresis System (Bio-
Rad, USA)
Incubators : Shake'n'Stack (Hybaid, UK)
Oven EN400 (Nuve, Turkey)
Magnetic Stirrer : Chiltern Hotplate Magnetic Stirrer, HS31 (UK)
Ovens : Microwave Oven (Vestel, Turkey)
Power Supplies : Power Pac Model 3000 (Bio-Rad, USA)
PSU 400/200 (Scie-Plus, UK)
Refrigerator : +4°C (Arçelik, Turkey)
Spectrophotometers : NanoDrop ND-1000 (NanoDrop, USA)
CE 5502 Scanning Double Beam 5000 Series
(CECIL Elegant Technology, UK)
Thermal Cyclers : Icycler (Bio-Rad, USA)
Mycycler (Bio-Rad, USA)
Light-Cycler 1.5 (Roche, Germany)
Vortex : Nuvemix (Nuve, Turkey)
Water Purification System : WA-TECH Ultra Pure water Purification System
(WA-TECH, Germany)

56
4. METHODS
4.1. Molecular Basis of Rett Syndrome (RTT)
4.1.1. DNA Extraction from Peripheral Blood
Genomic DNA was extracted from peripheral blood by using a modified version of
salting-out method described by Miller et al. (1988). Peripheral blood samples were
collected from individuals into vacutainer tubes containing K3EDTA. Thirty ml ice-cold
red blood cell (RBC) lysis buffer is added to 10 ml blood sample and mixed thoroughly.
The samples are then left at +4 ˚C for 15 minutes (min) to allow lysis of erythrocyte
membranes. Leukocyte nuclei were collected after centrifugation of lysed solution at 5000
revolution per minute (rpm), +4 ˚C for 10 min. The supernatant was discarded and the
nuclei were resuspended in 10 ml RBC lysis buffer by vortexing. Resuspension was
centrifuged again at 5000 rpm, +4 ˚C for 10 min. After discarding the supernatant, the
nuclear pellet was resuspended in three ml nuclei lysis buffer by vortexing. Thirty µl of
Proteinase K and 40µl of 10 per cent SDS were added and the mixture was incubated at 37
˚C overnight or at 56 ˚C for three hours. Afterwards ten ml of 2.5 M NaCl were added to
mixture and centrifuged at 5000 rpm at room temperature for 20 min. The supernatant was
transferred into a new 50 ml falcon tube. The DNA was precipitated with addition of two
volumes of absolute ethanol. The DNA was transferred in to a 1.5 ml Eppendorf tube
containing 200-500 µl of Tris-EDTA (TE) buffer, and left overnight at room temperature
to dissolve completely.
4.1.2. Quantitative Analysis of the Extracted DNA
The concentration of the isolated DNA was calculated measuring the optical density
at 260 nm. The formula below was used, which is based on the fact that 50 µg of double
stranded DNA has an absorbance of 1.0 at 260 nm.
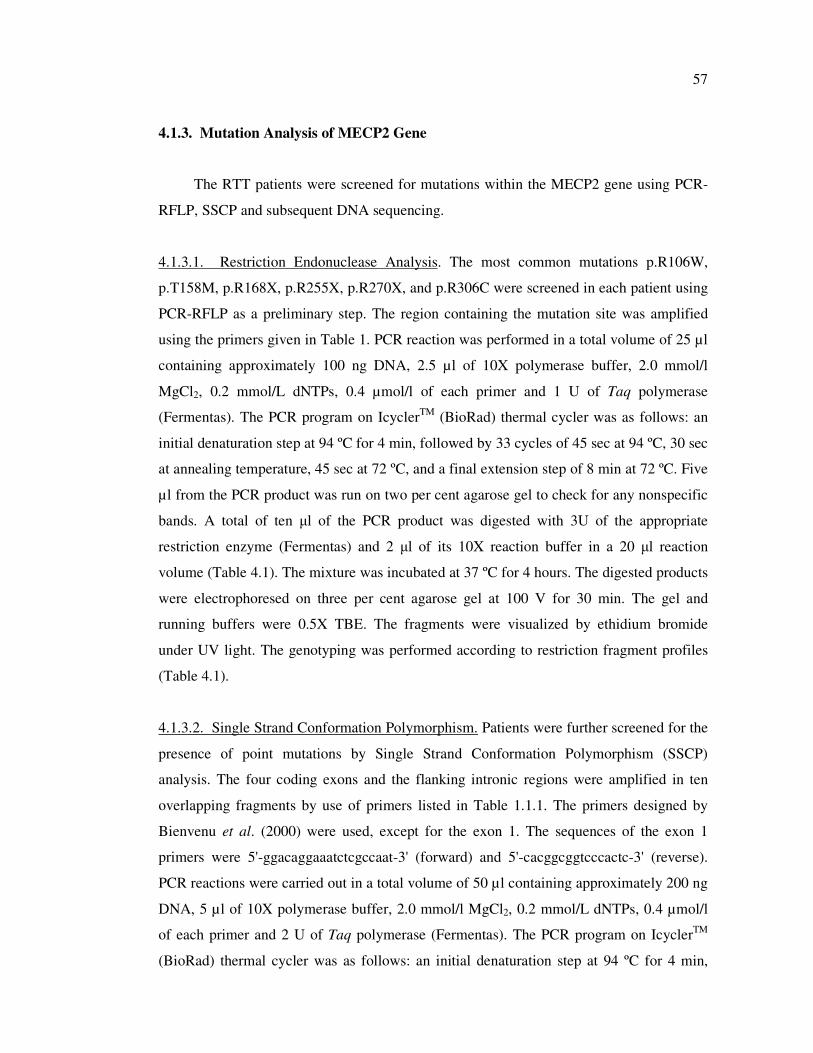
57
4.1.3. Mutation Analysis of MECP2 Gene
The RTT patients were screened for mutations within the MECP2 gene using PCR-
RFLP, SSCP and subsequent DNA sequencing.
4.1.3.1. Restriction Endonuclease Analysis. The most common mutations p.R106W,
p.T158M, p.R168X, p.R255X, p.R270X, and p.R306C were screened in each patient using
PCR-RFLP as a preliminary step. The region containing the mutation site was amplified
using the primers given in Table 1. PCR reaction was performed in a total volume of 25 µl
containing approximately 100 ng DNA, 2.5 µl of 10X polymerase buffer, 2.0 mmol/l
MgCl2, 0.2 mmol/L dNTPs, 0.4 µmol/l of each primer and 1 U of Taq polymerase
(Fermentas). The PCR program on IcyclerTM (BioRad) thermal cycler was as follows: an
initial denaturation step at 94 ºC for 4 min, followed by 33 cycles of 45 sec at 94 ºC, 30 sec
at annealing temperature, 45 sec at 72 ºC, and a final extension step of 8 min at 72 ºC. Five
µl from the PCR product was run on two per cent agarose gel to check for any nonspecific
bands. A total of ten µl of the PCR product was digested with 3U of the appropriate
restriction enzyme (Fermentas) and 2 µl of its 10X reaction buffer in a 20 µl reaction
volume (Table 4.1). The mixture was incubated at 37 ºC for 4 hours. The digested products
were electrophoresed on three per cent agarose gel at 100 V for 30 min. The gel and
running buffers were 0.5X TBE. The fragments were visualized by ethidium bromide
under UV light. The genotyping was performed according to restriction fragment profiles
(Table 4.1).
4.1.3.2. Single Strand Conformation Polymorphism. Patients were further screened for the
presence of point mutations by Single Strand Conformation Polymorphism (SSCP)
analysis. The four coding exons and the flanking intronic regions were amplified in ten
overlapping fragments by use of primers listed in Table 1.1.1. The primers designed by
Bienvenu et al. (2000) were used, except for the exon 1. The sequences of the exon 1
primers were 5'-ggacaggaaatctcgccaat-3' (forward) and 5'-cacggcggtcccactc-3' (reverse).
PCR reactions were carried out in a total volume of 50 µl containing approximately 200 ng
DNA, 5 µl of 10X polymerase buffer, 2.0 mmol/l MgCl2, 0.2 mmol/L dNTPs, 0.4 µmol/l
of each primer and 2 U of Taq polymerase (Fermentas). The PCR program on IcyclerTM
(BioRad) thermal cycler was as follows: an initial denaturation step at 94 ºC for 4 min,
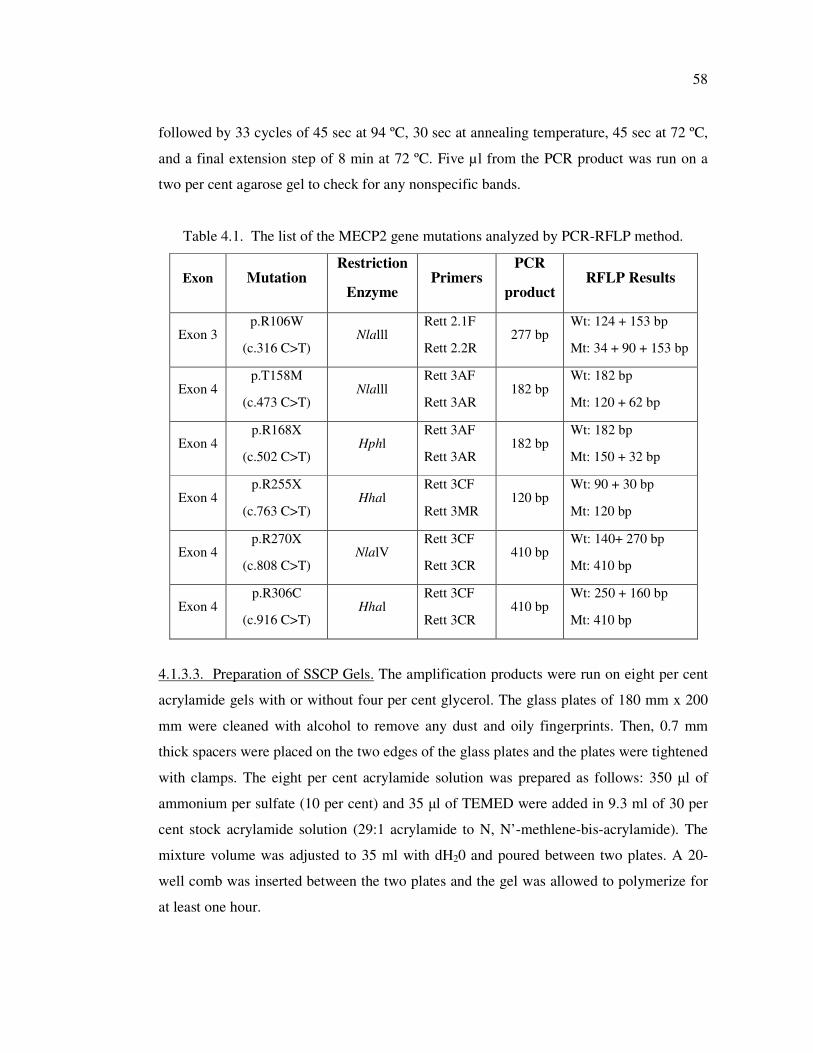
58
followed by 33 cycles of 45 sec at 94 ºC, 30 sec at annealing temperature, 45 sec at 72 ºC,
and a final extension step of 8 min at 72 ºC. Five µl from the PCR product was run on a
two per cent agarose gel to check for any nonspecific bands.
Table 4.1. The list of the MECP2 gene mutations analyzed by PCR-RFLP method.
Exon Mutation Restriction
Enzyme Primers
PCR
product RFLP Results
Exon 3 p.R106W
(c.316 C>T) Nlalll
Rett 2.1F
Rett 2.2R 277 bp
Wt: 124 + 153 bp
Mt: 34 + 90 + 153 bp
Exon 4 p.T158M
(c.473 C>T) Nlalll
Rett 3AF
Rett 3AR 182 bp
Wt: 182 bp
Mt: 120 + 62 bp
Exon 4 p.R168X
(c.502 C>T) Hphl
Rett 3AF
Rett 3AR 182 bp
Wt: 182 bp
Mt: 150 + 32 bp
Exon 4 p.R255X
(c.763 C>T) Hhal
Rett 3CF
Rett 3MR 120 bp
Wt: 90 + 30 bp
Mt: 120 bp
Exon 4 p.R270X
(c.808 C>T) NlalV
Rett 3CF
Rett 3CR 410 bp
Wt: 140+ 270 bp
Mt: 410 bp
Exon 4 p.R306C
(c.916 C>T) Hhal
Rett 3CF
Rett 3CR 410 bp
Wt: 250 + 160 bp
Mt: 410 bp
4.1.3.3. Preparation of SSCP Gels. The amplification products were run on eight per cent
acrylamide gels with or without four per cent glycerol. The glass plates of 180 mm x 200
mm were cleaned with alcohol to remove any dust and oily fingerprints. Then, 0.7 mm
thick spacers were placed on the two edges of the glass plates and the plates were tightened
with clamps. The eight per cent acrylamide solution was prepared as follows: 350 µl of
ammonium per sulfate (10 per cent) and 35 µl of TEMED were added in 9.3 ml of 30 per
cent stock acrylamide solution (29:1 acrylamide to N, N’-methlene-bis-acrylamide). The
mixture volume was adjusted to 35 ml with dH20 and poured between two plates. A 20-
well comb was inserted between the two plates and the gel was allowed to polymerize for
at least one hour.
59
4.1.3.4. SSCP Electrophoresis. An aliquot of 15 µl of the PCR product was mixed with 15
µl of denaturing loading dye (95 per cent form amid, 0.05 per cent bromophenol blue, 0.05
per cent xylene cyanol). Just before loading, they were denatured at 94°C for five min, and
chilled on ice for five min. Thirteen µl of the denatured sample was loaded on the gel.
Electrophoresis of the samples was carried out in 0.6 X TBE buffer at 150-250 V for 16
hours.
4.1.3.5. Silver-Staining. The alleles, separated on gels, were visualized by silver-staining.
The gel was incubated with buffer A for five min to fix the DNA fragment. Buffer A was
replaced with buffer B, which is a silver nitrate solution, and the gel was left for 10-15
min. After a short wash with dH2O, the gel was immersed in freshly prepared buffer C
until the bands appeared (approximately 10 min). After color development, Buffer D is
used to terminate the color reaction for five min. The gel was then transferred to a
transparent folder, and was sealed on all four sides for preservation.
4.1.4. DNA Sequence Analysis
When a single strand conformation polymorphism was observed, genomic DNA was
amplified using the same primer pairs used for SSCP and both forward and reverse strands
were sequenced. Patient and control PCR products were purified using Qiagen PCR
purification kit (Qiagen) and sequenced with automated sequencer ABI 3700 PRISM
(Applied Biosystems) in Iontek (Istanbul, Turkey). The resulting sequences were aligned
with the CLUSTAL W program.
4.1.5. Quantitative Real Time PCR
The real time PCR was performed in a total volume of 20 µl, containing 10 µl 2X
SYBR Green PCR Master Mix (TaKaRa, Japan), 5 pmol of each primer per reaction, 4 µl
of the genomic DNA (5 ng/µl) and distilled water. The PCR protocol on Light Cycler (LC)
(Roche Diagnostics, Mannheim, Germany) was as follows: an initial denaturation step
(95°C for 2 min) followed by amplification and quantification steps repeated for 30 cycles
(95°C for 5 sec, 58°C for 10 sec, 72°C for 20 sec, with a single fluorescence measurement
60
at the end of the elongation step at 72°C), a melting curve program (65–98°C with a
heating rate of 0.2°C per second and a continuous fluorescence measurement) and
terminated by cooling to 40°C. Each sample was amplified with the MECP2 and reference
gene primer pairs. The coding exons of the MECP2 was amplified using the following
primers designed by Bienvenu et al. (2000); Rett_exon2F: tttctttgttttaggctcca;
Rett_exon2R: ggccaaaccaggacatatac; Rett_exon3F: gtgatacttacatacttgtt; Rett_exon3R:
ggctcagcagagtggtgggc; Rett_exon4F: tgtgtctttctgtttgtccc; and Rett_exon4R:
gatttgggcttcttaggtgg. The reference NDRG1 gene was amplified using NDRG1_exon7F:
aggctcccgtcactctg and NDRG1_exon7R: gtcttccttcatcttaaaatg primers. Within each PCR
batch three aliquots of wild type control DNA in decreasing concentrations (20, 10, and 5
ng) from a healthy female were included to construct a standard curve. Melting point
analysis was conducted on all PCR products to check for any nonspecific amplicons. Using
the Fit Points Method, the DNA was quantified relative to the standard curve for each
exon. Subsequently, the ratios between target (MECP2) and reference (NDRG1) exon were
calculated for each individual. The ratio was 1.0 for normal individuals, a ratio of 0.5 was
accepted as a heterozygous deletion, and 1.5 as a heterozygous duplication.
4.1.6. Quantitative Fluorescent Multiplex PCR Assay
Quantitative fluorescent multiplex PCR (QF-PCR) assay was used to detect the
MeCP2 exon 3 rearrangments. Multiplex QF-PCR assay was set up to amplify exon 3 of
MeCP2 gene and exon 2 of Prion Protein (PRNP) gene simultaneously. The following
primers were used: 6-FAM labeled MeCP2-3F: gagcccgtgcagccatcagc, MeCp2-3R:
cgtgtccagccttcaggcag, 6-FAM labeled PRNP-2F: actgcgtcaatatcacaatc, and PRNP-2R:
tccccactatcaggaagatga (Bienvenu et al., 2000). Primers were at first tested in equimolar
amounts and their concentrations were then changed to obtain equal fluorescent peak area
for both MeCP2 and PRNP gene. PCR was performed in a total volume of 20 µl
containing 30 ng genomic DNA, 10 µl 2X SYBR Green PCR Master Mix (TaKaRa,
Japan), 5 pmol (for MeCP2) and 7.5 pmol (for PRNP) of each primer. The PCR protocol
on Light Cycler (LC) (Roche Diagnostics, Mannheim, Germany) was as follows: an initial
denaturation step (95°C for 2 min) followed by amplification steps repeated for 25 cycles
of 95°C for 5 sec, 58°C for 10 sec, 72°C for 20 sec and a melting curve program (65–98°C
with a heating rate of 0.2°C per second). Melting point analysis and agarose gel
61
electrophoresis were performed to check for any nonspecific amplicons. Fragments were
then electrophoresed on ABI prism 3100 Genetic analyzer and areas under the curve were
calculated by GeneMapper software package (Applied Biosystem, Foster City, CA) in
Burç laboratory, Istanbul.
4.1.7. X Chromosome Inactivation
X Chromosome Inactivation (XCI) was assessed by the method described by Allen et
al. (1992) and Beever et al. (2003). Initially, two µg genomic DNA of the each patient and
mother was digested with 10U of HhaI restriction enzyme (MBI Fermentas) in a volume of
20 µl. The mixture was incubated at 37 ºC for overnight.
The HhaI digested and undigested genomic DNAs from the patients were amplified
by primers flanking the CAG repeat region in the Androgen Receptor (AR) or ZNF261
genes (Table 3.2). PCR reaction was performed in a total volume of 25 µl containing
approximately 100 ng DNA, 2.5 µl of 10X polymerase buffer, 1.0 mM MgCl2, 10 per cent
dimethyl sulfoxide (DMSO), 200 µM dNTPs, 0.4 µlM of each primer, and 1 U of Taq
polymerase (Fermentas). The following PCR program was used: 94ºC for 4 min, followed
by 35 cycles of 45 sec at 94 ºC, 30 sec at annealing temperature (65ºC for AR-F/R, 58ºC
for ZNF261-F/R), 1 min at 72ºC, and a final extension step of 8 min at 72ºC.
4.1.7.1. Preparation of Denaturing Polyacrlamide Gels. The PCR products were analyzed
on eight per cent denaturing acrylamide gel. The gel was cast in a 40 cm long sequencing
apparatus that was assembled using 0.35 mm spacers. Four hundred µl of APS (10 per
cent) and 40 µl of TEMED were added in 40 ml of denaturing stock acrylamide solution
and poured between the glass plates. A 24-well shark’s tooth comb was inserted in an
inverted orientation and the gel was allowed to polymerize for at least one hour.
4.1.7.2. Electrophoresis of PCR Products on Denaturing Polyacrlamide Gels. The gel was
initially pre-run with hot 1X TBE buffer at constant power of 40 Watts for 15-20 min to
allow the temperature to rise to 45 ºC. Then, ten µl of the PCR product was mixed with ten
µl of denaturing loading dye, denatured at 94°C for five min, and chilled on ice for five
min. After the comb was re-oriented, three µl of the denatured sample was loaded. The
62
gels were run at 30W constant power for three hours, then silver-stained and sealed for
documentation.
4.1.8. Clinical Severity Score Analysis
4.1.8.1. Clinical Severity Score. Patients were evaluated by a scoring system with respect
to: hand function, eye contact and gait function. The scoring was performed as follow:
Hand function: (1) can hold a glass, can use a spoon or fork; (2) can sometimes grasp an
object; (3) does never use her hands purposefully. Eye contact: (1) intense, use eye
pointing; (2) direct eye contact possible to obtain; (3) eye contact very difficult to obtain.
Gait function: (1) walks independently; (2) has lost gait function; (3) has never walked
(Cheadle et al., 2000).
4.1.8.2. Huppke Scoring. Patients were scored with respect to the following criteria:
Normal prenatal and perinatal period (1); Normal psychomotor development during the
first 6 months (1); Normal head circumference at birth (1); Deceleration of head growth
(1); Never good hand skills (1); Loss of hand skills (2); Stereotypic hand movements (1);
Communication dysfunction and social withdraw (1); Never acquired language (1); Loss of
acquired language (2); Severe psychomotor retardation (1); Impaired or absent locomotion
(1) (Huppke et al., 2003).
4.1.8.3. Statistical Analyses. The non-parametric Wilcoxon Mann–Whitney test with a
significance level of 95 per cent was used for comparing total severity score values of
samples with respect to the presence, type and location of the mutation in the MECP2
gene, and the XCI status. Severity score for specific clinical features of patients were
compared by Fisher exact test. All statistical analyses were performed by using SPSS v
15.0 software (SPSS Inc., Chicago, IL, USA).
4.1.9. Multiplexed ARMS-PCR Approach for the Detection of Common MECP2
Mutations
4.1.9.1. Primer Design. The multiplex amplification refractory mutation system (ARMS) -
PCR procedure was established to identify seven of the most common MECP2 gene
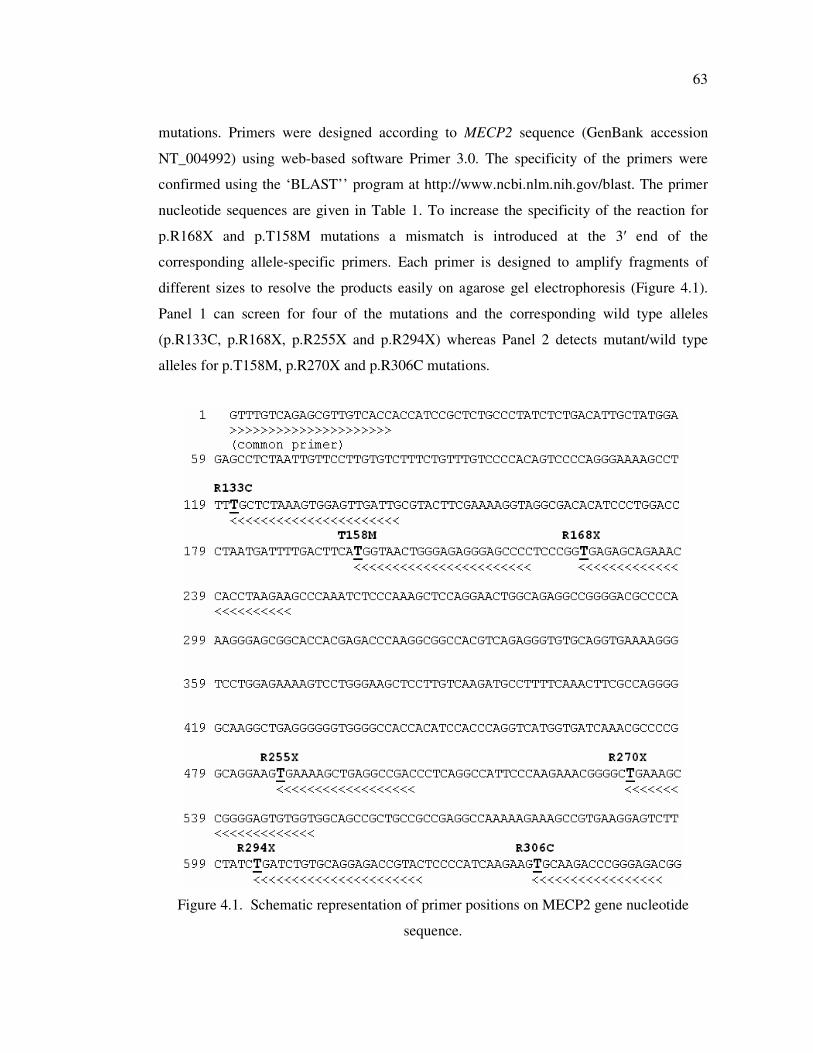
63
mutations. Primers were designed according to MECP2 sequence (GenBank accession
NT_004992) using web-based software Primer 3.0. The specificity of the primers were
confirmed using the ‘BLAST’’ program at http://www.ncbi.nlm.nih.gov/blast. The primer
nucleotide sequences are given in Table 1. To increase the specificity of the reaction for
p.R168X and p.T158M mutations a mismatch is introduced at the 3′ end of the
corresponding allele-specific primers. Each primer is designed to amplify fragments of
different sizes to resolve the products easily on agarose gel electrophoresis (Figure 4.1).
Panel 1 can screen for four of the mutations and the corresponding wild type alleles
(p.R133C, p.R168X, p.R255X and p.R294X) whereas Panel 2 detects mutant/wild type
alleles for p.T158M, p.R270X and p.R306C mutations.
Figure 4.1. Schematic representation of primer positions on MECP2 gene nucleotide
sequence.

64
4.1.9.2. PCR conditions. PCR was performed in a total volume of 25µl containing
approximately 60 ng genomic DNA, 2.5 µl of 10X buffer, 2.5 mM MgCl2, 0.2 mM dNTPs,
and 1.5U of Taq polymerase (MBI Fermentas, Hanover, MD). The concentrations of
primers used are given in Table 4.2. The PCR program on the thermal cycler (icyclerTM,
BioRad) was as follows: an initial denaturation step at 94 ºC for 5 min, a 10 cycles of
touchdown PCR consists of 30 sec at 94 ºC, 45 sec at 63 ºC with 0.4 ºC decrement in each
cycle and 1 min at 72 ºC followed by 35 cycles of 25 sec at 94 ºC, 45 sec at 59 ºC, 1 min at
72 ºC, and a final extension step of 10 min at 72 ºC.
A total of 15 µl from the PCR product were run on two per cent standard agarose
gels at 100 V for 15 min. The fragments were visualized by ethidium bromide on a UV
transilluminator.
Table 4.2. Primer sequences and concentrations used in the two panels for
multiplexed ARMS-PCR assay.
Mutation [conc.] wildtype Primer mutant primer [conc.] PCR
product size
Panel 1-wt Panel 1-mut
R133C 5 pmol caatcaactccactttagagcG caatcaactccactttagagcA 20 pmol 141bp
R168X 3 pmol atcttaggtggtttctgctctcG atcttaggtggtttctgctcacA 10 pmol 247bp
R255X 15 pmol gtcggcctcagcttttcG gtcggcctcagcttttcA 5 pmol 504bp
R294X 20 pmol gtacggtctcctgcacagatcG gtacggtctcctgcacagatcA 10 pmol 625bp
Forward 10 pmol GTTTGTCAGAGCGTTGTCACC 10 pmol
Panel 2-wt Panel 2-mut
T158M 10 pmol ggggctccctctcccagttaccG ggggctccctctcccagttaacA 5 pmol 220bp
R270X 10 pmol accacactccccggctttcG accacactccccggctttcA 10 pmol 551bp
R306C 10 pmol gtctcccgggtcttgcG gtctcccgggtcttgcA 10 pmol 656bp
Forward 10 pmol GTTTGTCAGAGCGTTGTCACC 10 pmol
65
4.1.9.3. p.R106W mutation detection. The c.316 C>T (p.R106W) mutation was also
investigated by ARMS-PCR using the following primers: wild-type R106W-R: 5’-
ctgcctgaaggctggacac -3’, mutant R106W-W: 5’- ctgcctgaaggctggacat -3’and common
R106W-C: 5’- gccctgtagagataggagttgc -3’. Using the above cycling conditions with 10
pmol primers, a 112 bp long product was produced.
4.1.9.4. PCR-RFLP and DNA Sequencing. The mutations p.R106W (+NlaIII), p.T158M
(+NlaIII), p.R168X (+HphI), p.R270X (-NlaIV), and p.R306C (-HhaI) were screened
using PCR-RFLP whereas mutations p.R133C, p.R255X and p.R294X were investigated
by DNA sequencing as described in sections 4.1.3.1 and 4.1.4.
4.1.10. The Effect of DNA Concentration on Reliability and Reproducibility of SYBR
Green Dye-based Real Time PCR Analysis to Detect the Exon Rearrangements
4.1.10.1. Preparation of DNA Samples. Photometric measurement of the stock DNA and
the dilutions of 200 ng/µl were performed on an ND-1000 spectrophotometer (NanoDrop
Technologies). DNA was diluted first to 200 ng/µl, stored at 37 °C overnight, and then
diluted to final concentration of 0.025 ng/µl. Six dilutions at concentrations of 0.025, 0.25,
1.25, 12.5, 25, and 50 ng/µl were prepared from the patient R23 with MECP2 exon 3
deletion, patient R19 with MECP2 exon 3 duplication, and two healthy females and one
male. Standards (1.25, 2.5, and 5 ng/µl) were prepared by dilution of a healthy female
genomic DNA. All dilutions were prepared in a volume of 200 µl.
4.1.10.2. Quantitative Real Time PCR Conditions. The real time PCR was performed in a
total volume of 20 µl, containing 10 µl 2X SYBR Green PCR Master Mix (TaKaRa,
Japan), 1 µl of each primer per reaction, 4 µl of the genomic DNA dilution and distilled
water. The PCR protocol on Light Cycler (LC) (Roche Diagnostics, Mannheim, Germany)
was as follows: an initial denaturation step (95°C for 2 min) followed by amplification and
quantification steps repeated for 40-50 cycles (95°C for 5 sec, 59°C for 10 sec, 72°C for
20 sec, with a single fluorescence measurement at the end of the elongation step at 72°C), a
melting curve program (65–98°C with a heating rate of 0.2°C per second and a continuous
fluorescence measurement) and terminated by cooling to 40°C. Each sample was amplified
with the MeCP2 and reference gene primer pairs. The coding exon 3 of the MeCP2 was
66
amplified using the following primers designed by Bienvenu et al. (2000); Rett_exon3F:
gtgatacttacatacttgtt; Rett_exon3R: ggctcagcagagtggtgggc. The reference NDRG1 gene was
amplified using primers NDRG1_exon7F: aggctcccgtcactctg; NDRG1_exon7R:
gtcttccttcatcttaaaatg (Kalaydjieva et al., 2000).
Each target and reference gene assay included: 1) a standard curve of three dilution
points of healthy female DNA (20, 10, and 5 ng), 2) 20 ng of calibrator healthy female
DNA, and 3) test sample DNAs. Melting point analysis was conducted on all PCR
products to check for any nonspecific amplicons.
4.1.10.3. Quantification. Quantification was performed using both the standard curve
method and the comparative Ct method. Within each PCR batch three aliquots of wild type
control DNA in decreasing concentrations (20, 10, and 5 ng) from a healthy female were
included to construct a standard curve and the copy numbers of the exons in each sample
were interpolated. Since two different standard curves were constructed for the target and
reference genes, the copy numbers of MECP2 exon 3 were normalized against a calibrator
DNA sample. After normalization to the calibrator, the copy number of MECP2 exon was
calculated by dividing these normalized values by the copy number of the reference gene.
Instead of interpolating unknown samples from a standard curve, it is also possible to
calculate the copy number based on the observed Ct values as follows:
2 -∆∆CT
= (1+E) - ∆C
Ttargetgene + ∆C
Treferencegene (4.1)
Where E is the efficiency of the PCR reaction (set at default value 0.95), ∆CTtargetgene is the
difference in threshold cycle value between test sample and calibrator sample for the gene
under investigation (test gene), and ∆CTreferencegene is the difference in threshold cycle value
between test sample and calibrator sample for reference gene.
4.1.10.4. Statistical Analysis. The results were evaluated by a paired sample t-test and
Pearson correlation coefficient using SPSS v 15.0 software (SPSS Inc., Chicago, IL, USA).
67
4.2. Methylation Analyses of the Putative Promoter Region of hHR23 Genes in
Breast Tumor Tissues
4.2.1. Non-heating DNA Extraction Protocol
Genomic DNA was extracted from archival formalin-fixed, paraffin-embedded
human primary breast tumors and normal breast tissues by using a modified version of
non-heating DNA extraction protocol described by Shi et al. (2002). Two sections (10 µm
thick) were obtained from each archival tissue. Sections were deparaffinized by adding 1
ml of xylene to the eppendorf tube for 30 min for two changes, followed by 100 per cent
and 75 per cent ethanol for 15 min with three changes. After a washing step with PBS for
15 min in two changes, 500 µl of tissue lysis buffer was added and incubated at 50 ºC for
48-72 hours until the whole tissue were dissolved completely. The mixture was centrifuged
at 13,000 rpm for 5 min and the supernatant fluid was transferred to a clean eppendorf
tube. Five hundred µl of phenol:chloroform:isopropanol solution (25:24:1) was added,
vortexed and centrifuged at 13,000 rpm for 10 min. The upper aqueous layer was carefully
transferred to a clean tube, 0.1 volume of 3M sodium acetate and 1 volume of isopropanol
were added, mixed by vortexing, and incubated at – 20 ºC for 10 min. The DNA was
precipitated by centrifugation at 13,000 rpm at 4 ºC. The supernatant fluid was discarded
and the precipitate washed once with 75 per cent ethanol. The DNA pellet was dissolved in
50 µl of distilled H2O. The concentration of the isolated DNA was calculated after
measuring the optical density at 260 nm on ND-1000 spectrophotometer (NanoDrop
Technologies).
4.2.2. Promoter Region Analyses and Primer Design
The web-based PROSCAN program (Prestridge, 1995) was used to predict the
putative eukaryotic Pol II promoter sequences in primary sequence data of hHR23A and
hHR 23B genes. MATCH and PROSCAN programs were used to identify high scoring
transcription factor (TF) binding sites. MethPrimer program (Li and Dahiya, 2002) was
used to identify the CpG islands and design the primers using the standard criteria, i.e.,
sequence was considered as a CpG island if there was a minimum G+C content of 50 per

68
cent with a minimum CpG (obs)/CpG (exp) of 0.6 in a 200-bp window length, and the
sequence length was at least 500-bp.
4.2.3. Bisulfite Modification
Genomic DNA was modified by MethylampTM DNA Modification Kit (Epigentek,
NY, USA) according to the manufacturer's protocol. Briefly, 0.25-1 µg of DNA in a
volume of 24 µl was denatured by adding 1 µl of denaturing buffer for 10 min at 37°C.
Bisulfite-Conversion buffer (125 µl) was added and mixed, and samples were incubated at
65 °C for 2 h. Modified DNA samples were applied to columns, washed, and then eluted
with 20 µl of elution buffer.
4.2.4. Amplification and Sequencing of the Bisulfite Modified DNA
Semi-nested PCR strategy was used to investigate the methylation status of the
putative promoter region of hHR23 genes (Figure 4.2). Several primer combinations were
used to get successful amplification product. The primer combinations were shown in
Figure 4.2. In general, 2.5 µl of the modified DNA was used in subsequent PCR reactions.
First-round PCR reactions were performed in a total volume of 25 µl containing 2.5 µl of
modified DNA, 2.5 µl of 10X polymerase buffer, 2.5 mM MgCl2, 2.5 µl of dimethyl
sulfoxide (DMSO), 200 µM dNTPs, 0.4 µM of each primer, and 2 U of Taq polymerase
(Fermentas). The following PCR program was used: 94ºC for 4 min, followed by 40 cycles
of 45 sec at 94 ºC, 45 sec at annealing temperature, 1 min at 72ºC, and a final extension
step of 8 min at 72ºC. One micro liter of the first-round PCR product was then used as a
template in the second round of PCR with a mixture that contains 2.5 µl of 10X
polymerase buffer, 2.0 mM MgCl2, 200 µM dNTPs, 0.4 µM of each primer, and 1 U of
Taq polymerase (Fermentas). The cycling condition was as follow: denaturation at 94°C
for 5 min was followed by 35 cycles of amplification: 94°C for 30 sec, 30 sec at annealing
temperature, and extension at 72°C for 30 sec. After the last cycle, an 8-min extension at
72°C was performed.
Five µl from the PCR product was run on two per cent agarose gel to check for the
quality of amplification. PCR products were purified using QIAQuick PCR purification kit
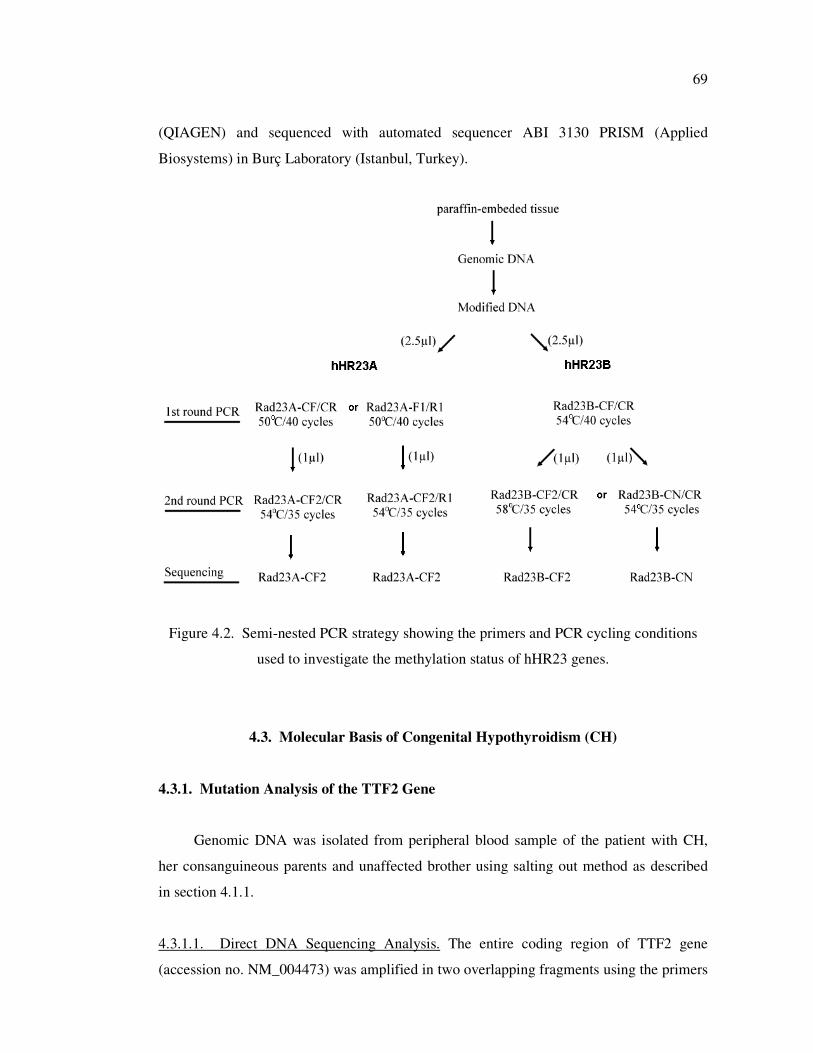
69
(QIAGEN) and sequenced with automated sequencer ABI 3130 PRISM (Applied
Biosystems) in Burç Laboratory (Istanbul, Turkey).
Figure 4.2. Semi-nested PCR strategy showing the primers and PCR cycling conditions
used to investigate the methylation status of hHR23 genes.
4.3. Molecular Basis of Congenital Hypothyroidism (CH)
4.3.1. Mutation Analysis of the TTF2 Gene
Genomic DNA was isolated from peripheral blood sample of the patient with CH,
her consanguineous parents and unaffected brother using salting out method as described
in section 4.1.1.
4.3.1.1. Direct DNA Sequencing Analysis. The entire coding region of TTF2 gene
(accession no. NM_004473) was amplified in two overlapping fragments using the primers
70
designed by Castanet et al (2002). PCR reaction was performed in a total volume of 25 µl
containing approximately 100 ng DNA, 2.5 µl of 10X polymerase buffer, 2.0 mM MgCl2,
10 per cent dimethyl sulfoxide (DMSO), 200 µM dNTPs, 0.4 µM of each primer, and 1 U
of Taq polymerase (Fermentas,). The following PCR program was used: 94ºC for 4 min,
followed by 35 cycles of 45 sec at 94 ºC, 30 sec at annealing temperature (58ºC for
TTF2A-D, 53ºC for TTF2C-E), 1 min at 72ºC, and a final extension step of 8 min at 72ºC
(Table 1.1.1). The PCR products were purified and bi-directionally sequenced using the
primers TTF2A and TTF2C as described in section 4.1.4.
4.3.1.2. AlwNI Digestion. The PCR products from the patient, her parents, unaffected
brother and 100 control chromosomes were subjected to AlwNI digestion. Genomic DNA
was amplified using the primers TTF2C/TTF2E as described in section 4.2.1.1. A total of
ten µl of the PCR product was digested with 3U of AlwNI restriction enzyme (Fermentas)
and 2 µl of 10X reaction buffer in a 20 µl reaction volume. The mixture was incubated at
37 ºC for 4 hours. The digested products were electrophoresed on two per cent agarose gel
at 100 V for 30 min. The c. 304 C>T (p.R102C) mutation creates a new restriction site
resulting in 72 bp and 599 bp fragments whereas wild type allele remains undigested.
4.3.2. Functional Characterization of p.R102C Mutant TTF2
Functional analyses were performed by Dr. Chatterjee’s laboratory in University of
Cambridge, UK. The DNA binding and transcriptional properties of the mutant and wild
type TTF2 have been investigated as described by Clifton-Bligh et al. (1998). Detailed
information was given in Appendix A.
4.3.3. Mutation Analysis of Butyrylcholinesterase (BChE) Gene
The DNA samples of the patient with CH and her family members were analyzed for
the presence of two most common BChE variants; p.Asp70Gly (A-variant) and
p.Ala539Thr (K-variant) according to Asanuma et al. (1999) and Maekawa et al. (1995),
respectively. PCR reaction was performed in a total volume of 25 µl containing
approximately 100 ng DNA, 2.5 µl of 10X polymerase buffer, 2.0 mmol/l MgCl2, 0.2
mmol/L dNTPs, 0.4 µmol/l of each primer, and 1 U of Taq polymerase (MBI Fermentas).
71
The PCR program on IcyclerTM thermal cycler was as follows: an initial denaturation step
at 94 ºC for 4 min, followed by 33 cycles of 30 sec at 94 ºC, 30 sec at annealing
temperature (52 ºC for M6/M115, 60 ºC for AP5/C539), 30 sec at 72 ºC, and a final
extension step of 8 min at 72 ºC.
The 373 bp region containing the p.Asp70Gly mutation site was amplified using the
primers M6/M115 and digested with the 3U of the Sau3AI restriction enzyme (MBI
Fermentas). The PCR product was digested to 214 and 135 bp fragments from the wild
type allele and remained undigested from the mutant allele. Similarly, 103 bp product
harboring the p.Ala539Thr mutation site was amplified using primers AP5/C539. The
mutation abolishes AluI restriction recognition site resulting in an undigested 103 bp
product for mutant allele whereas wild type allele digested into two fragments of 83 and 20
bp. The digested products were electrophoresed on three per cent agarose gels at 100 V for
30 min. The fragments were visualized by ethidium bromide staining under UV light.
72
5. RESULTS
5.1. Molecular Basis of Rett Syndrome
5.1.1. Patients
The molecular basis of Rett Syndrome (RTT) in our population was investigated in a
total of 71 isolated RTT cases (68 female and 3 male). A detailed clinical data were
available for 47 patients (44 females and 3 males). Huppke clinical scoring (Huppke et al.,
2003) was also available for 33 of these cases. The clinical features of these patients
analyzed in this study are summarized in Table 5.1. Twenty-four female patients had been
referred to our laboratory for differential diagnosis but the clinical data were not available.
All patients were screened for MECP2 gene mutations but quantitative PCR and XCI
analyses were performed only for the first group of 47 patients.
5.1.2. Mutation Analysis of MECP2 Gene
All patients were initially screened for the six recurrent MECP2 mutations
(p.R106W, p.T158M, p.R168X, p.R255X, p.R270X, and p.R306C) since these mutations
are known to account for up to two thirds of pathogenic mutations in RTT cases
(RettBASE). The PCR-RFLP based analyses detected mutation in 15 patients: four patients
(R6, R18, R22, and R28) with p.R106W, three patients (R25, R29, and R47) with
p.T158M, two patients (R15 and R17) with p.R168X, four patients (R9, R13, R24, and
R39) with p.R255X, patient R34 with p.R270X, and patient R16 with p.R306C mutation
(Figure 5.1). Patients tested negative for the recurrent mutations were further analyzed for
the four coding exons of the MECP2 gene using SSCP analysis. Subsequent DNA
sequencing of patients showing altered SSCP pattern revealed ten different pathogenic
mutations: c.1156-1192del36 (p.Leu386Hisdel12), c.856delA (p.Leu286fsX288),
c.397C>T (p.Arg133Cys), c.1034_1042insGCGGATTGC (p.Lys345fs), c.455C>G
(p.Pro152Arg), c.964C>G (p.Pro322Ala), c.880C>T (p.Arg294X), c.744delG
(p.Ser194fsX208), and c.826-829delGTGG (p.Val276fsX288) mutations in R2 and R42,
R3, R4, R8, R18, R31, R36, R46, and R49, respectively.
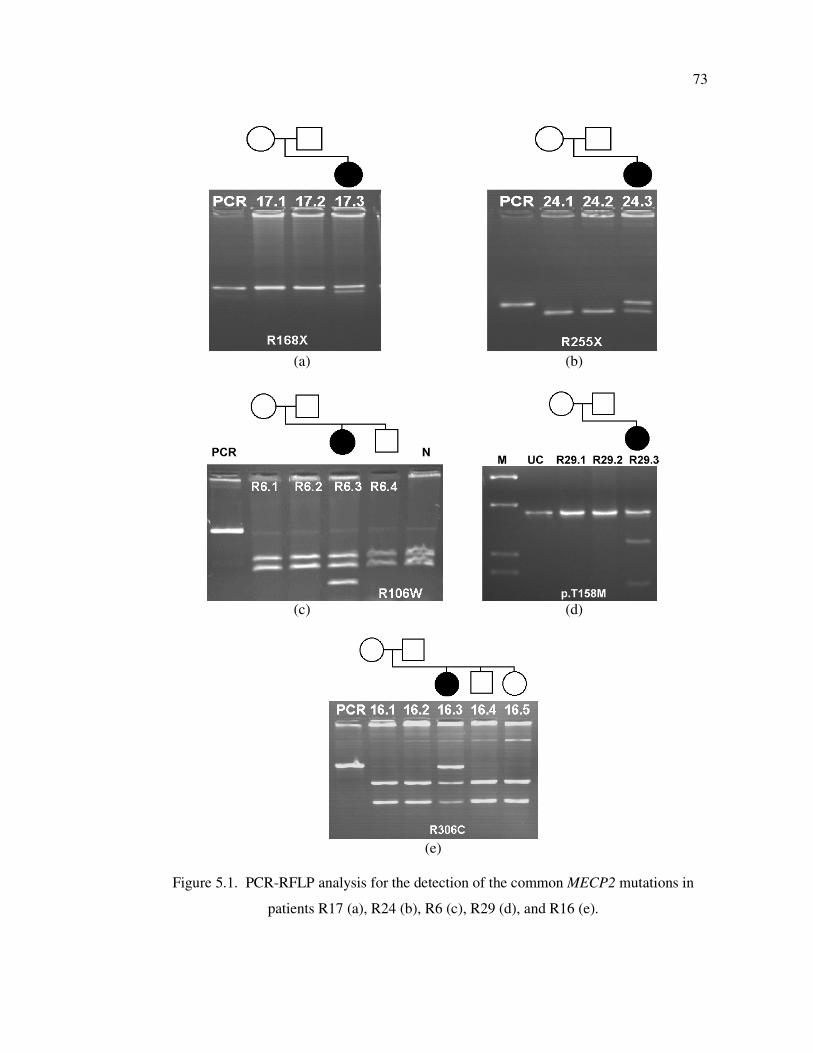
73
(a) (b)
(c) (d)
(e)
Figure 5.1. PCR-RFLP analysis for the detection of the common MECP2 mutations in
patients R17 (a), R24 (b), R6 (c), R29 (d), and R16 (e).
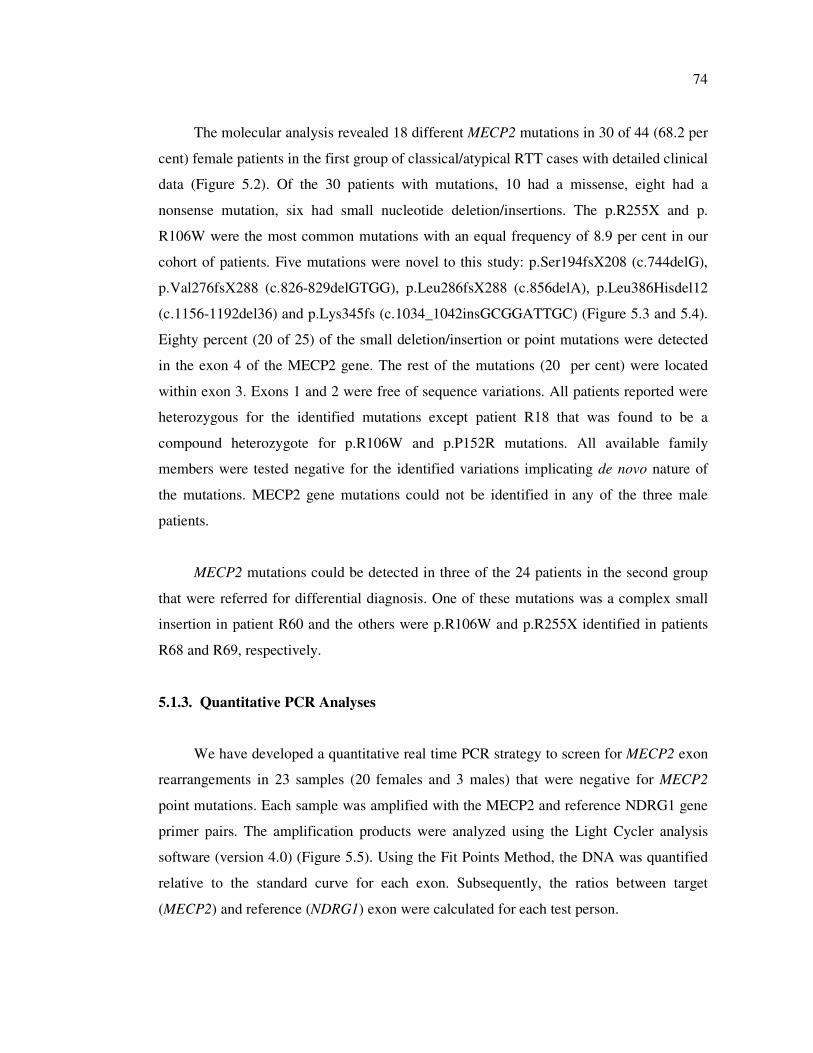
74
The molecular analysis revealed 18 different MECP2 mutations in 30 of 44 (68.2 per
cent) female patients in the first group of classical/atypical RTT cases with detailed clinical
data (Figure 5.2). Of the 30 patients with mutations, 10 had a missense, eight had a
nonsense mutation, six had small nucleotide deletion/insertions. The p.R255X and p.
R106W were the most common mutations with an equal frequency of 8.9 per cent in our
cohort of patients. Five mutations were novel to this study: p.Ser194fsX208 (c.744delG),
p.Val276fsX288 (c.826-829delGTGG), p.Leu286fsX288 (c.856delA), p.Leu386Hisdel12
(c.1156-1192del36) and p.Lys345fs (c.1034_1042insGCGGATTGC) (Figure 5.3 and 5.4).
Eighty percent (20 of 25) of the small deletion/insertion or point mutations were detected
in the exon 4 of the MECP2 gene. The rest of the mutations (20 per cent) were located
within exon 3. Exons 1 and 2 were free of sequence variations. All patients reported were
heterozygous for the identified mutations except patient R18 that was found to be a
compound heterozygote for p.R106W and p.P152R mutations. All available family
members were tested negative for the identified variations implicating de novo nature of
the mutations. MECP2 gene mutations could not be identified in any of the three male
patients.
MECP2 mutations could be detected in three of the 24 patients in the second group
that were referred for differential diagnosis. One of these mutations was a complex small
insertion in patient R60 and the others were p.R106W and p.R255X identified in patients
R68 and R69, respectively.
5.1.3. Quantitative PCR Analyses
We have developed a quantitative real time PCR strategy to screen for MECP2 exon
rearrangements in 23 samples (20 females and 3 males) that were negative for MECP2
point mutations. Each sample was amplified with the MECP2 and reference NDRG1 gene
primer pairs. The amplification products were analyzed using the Light Cycler analysis
software (version 4.0) (Figure 5.5). Using the Fit Points Method, the DNA was quantified
relative to the standard curve for each exon. Subsequently, the ratios between target
(MECP2) and reference (NDRG1) exon were calculated for each test person.
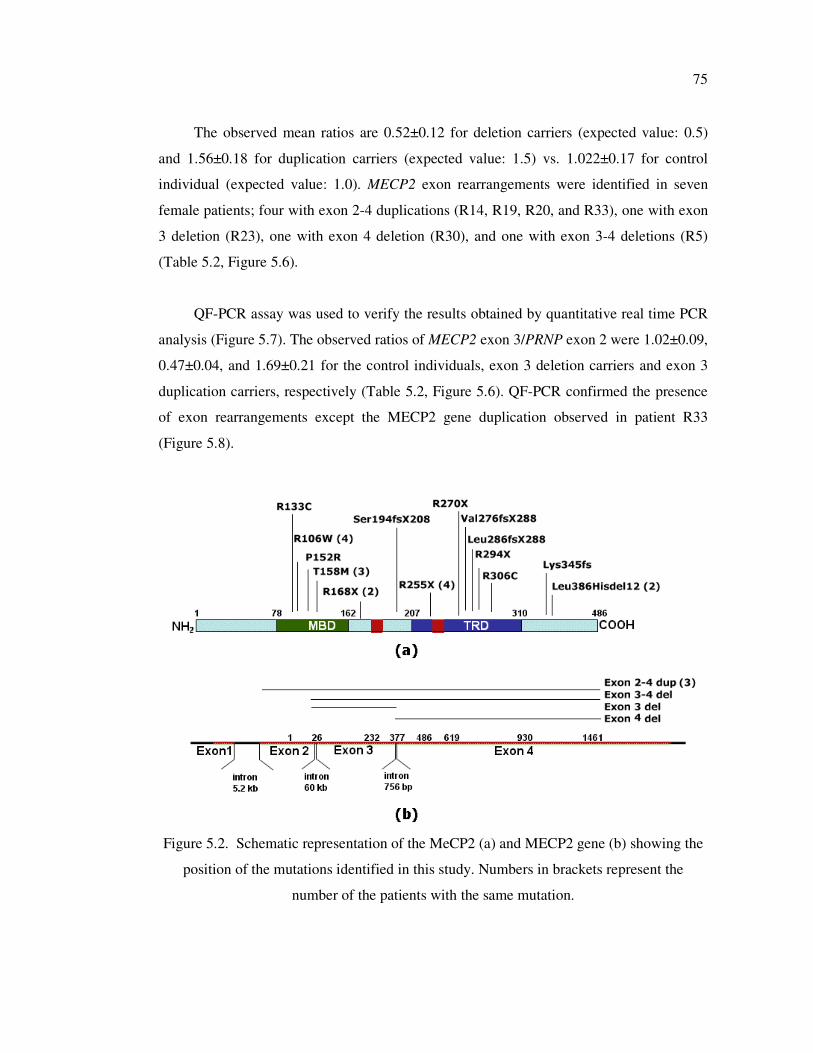
75
The observed mean ratios are 0.52±0.12 for deletion carriers (expected value: 0.5)
and 1.56±0.18 for duplication carriers (expected value: 1.5) vs. 1.022±0.17 for control
individual (expected value: 1.0). MECP2 exon rearrangements were identified in seven
female patients; four with exon 2-4 duplications (R14, R19, R20, and R33), one with exon
3 deletion (R23), one with exon 4 deletion (R30), and one with exon 3-4 deletions (R5)
(Table 5.2, Figure 5.6).
QF-PCR assay was used to verify the results obtained by quantitative real time PCR
analysis (Figure 5.7). The observed ratios of MECP2 exon 3/PRNP exon 2 were 1.02±0.09,
0.47±0.04, and 1.69±0.21 for the control individuals, exon 3 deletion carriers and exon 3
duplication carriers, respectively (Table 5.2, Figure 5.6). QF-PCR confirmed the presence
of exon rearrangements except the MECP2 gene duplication observed in patient R33
(Figure 5.8).
Figure 5.2. Schematic representation of the MeCP2 (a) and MECP2 gene (b) showing the
position of the mutations identified in this study. Numbers in brackets represent the
number of the patients with the same mutation.
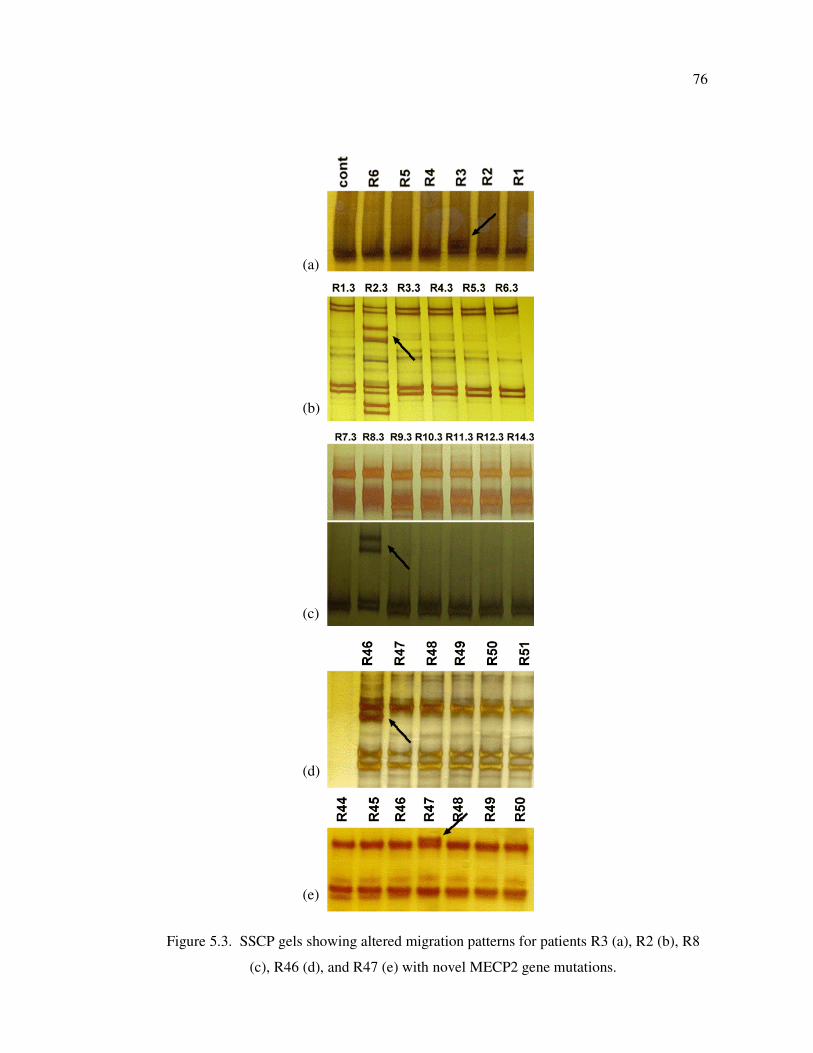
76
Figure 5.3. SSCP gels showing altered migration patterns for patients R3 (a), R2 (b), R8
(c), R46 (d), and R47 (e) with novel MECP2 gene mutations.
(a)
(b)
(c)
(d)
(e)
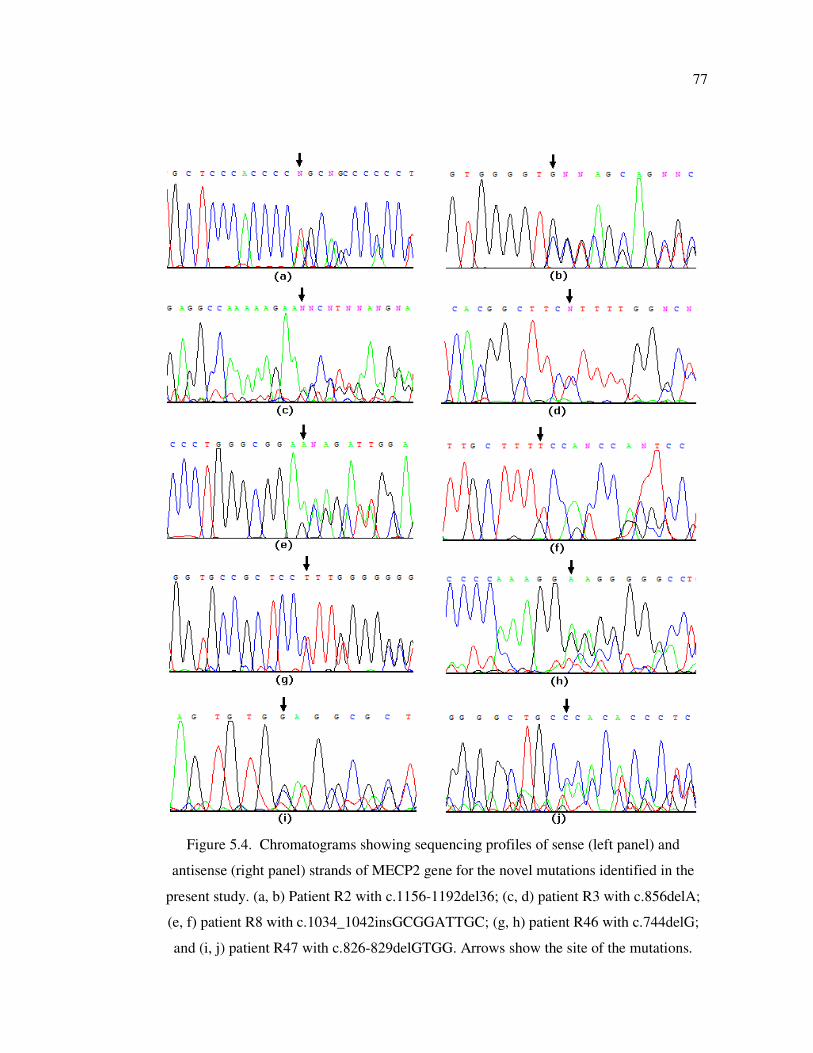
77
Figure 5.4. Chromatograms showing sequencing profiles of sense (left panel) and
antisense (right panel) strands of MECP2 gene for the novel mutations identified in the
present study. (a, b) Patient R2 with c.1156-1192del36; (c, d) patient R3 with c.856delA;
(e, f) patient R8 with c.1034_1042insGCGGATTGC; (g, h) patient R46 with c.744delG;
and (i, j) patient R47 with c.826-829delGTGG. Arrows show the site of the mutations.
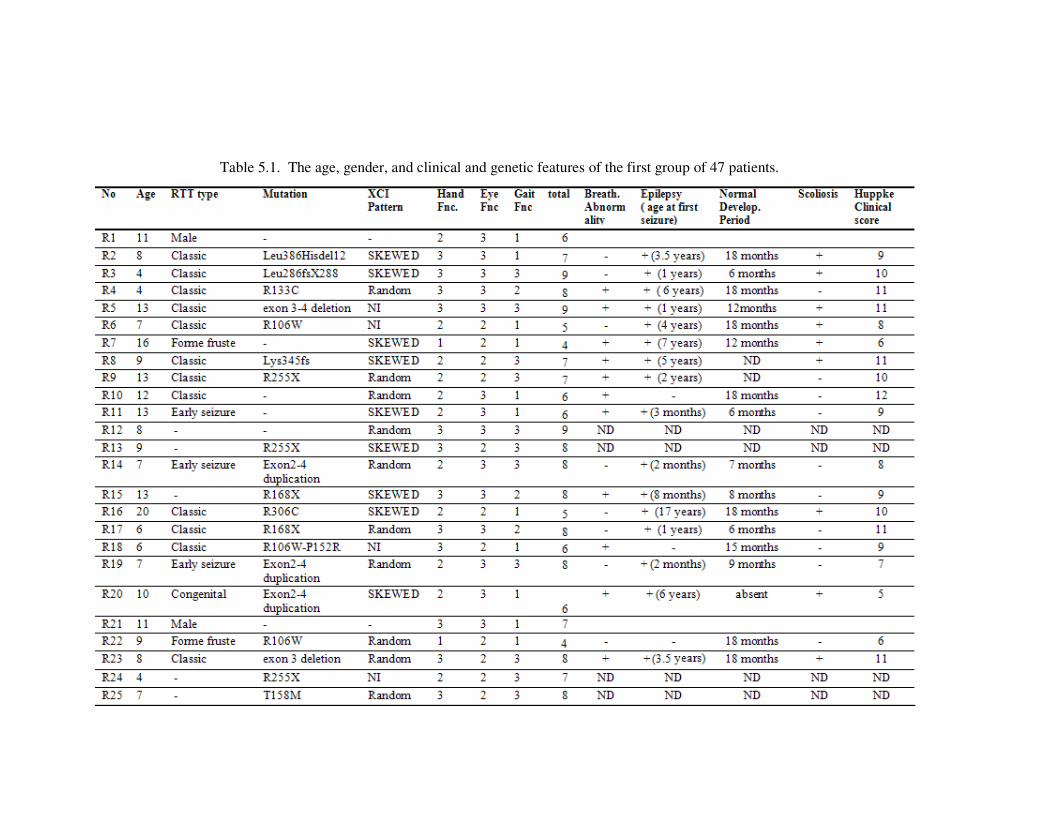
78
Table 5.1. The age, gender, and clinical and genetic features of the first group of 47 patients.
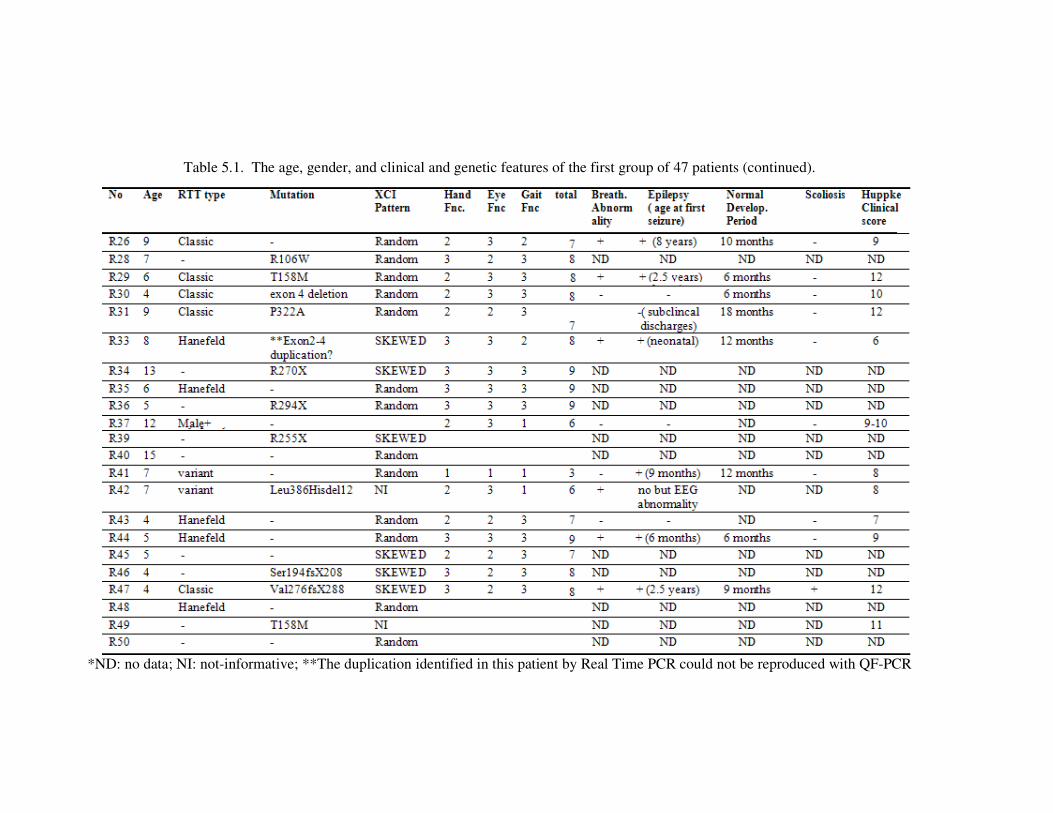
79
Table 5.1. The age, gender, and clinical and genetic features of the first group of 47 patients (continued).
*ND: no data; NI: not-informative; **The duplication identified in this patient by Real Time PCR could not be reproduced with QF-PCR
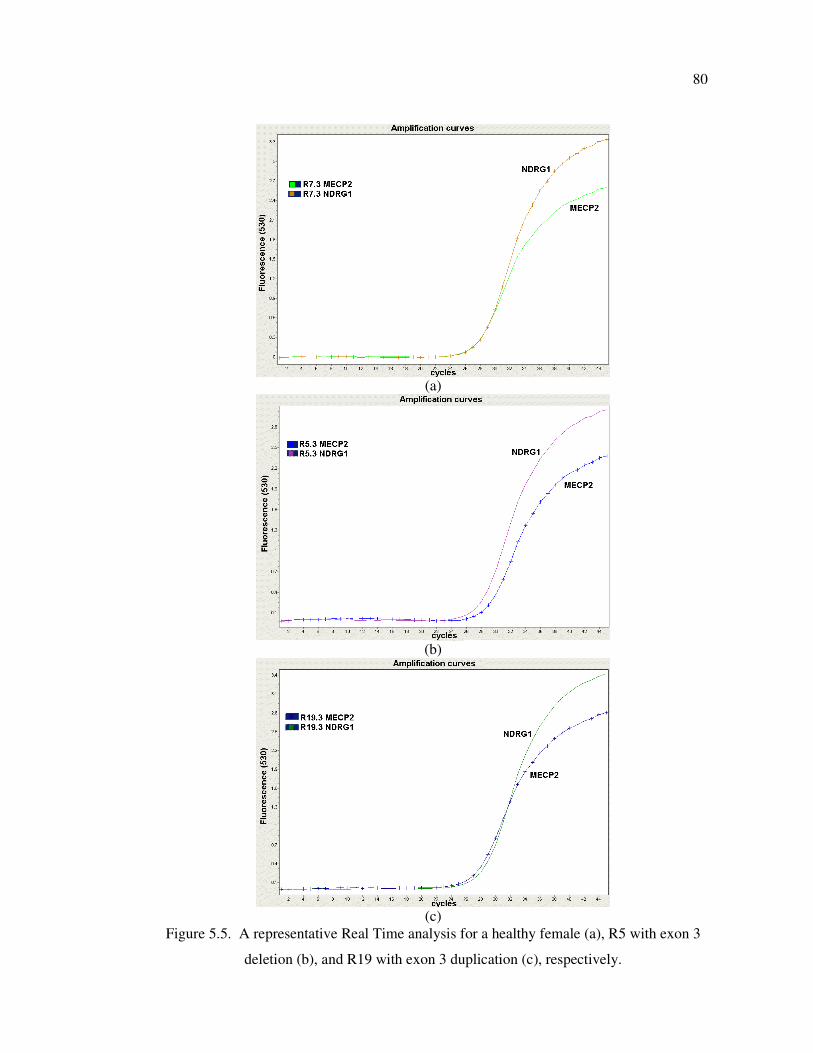
80
(a)
(b)
(c)
Figure 5.5. A representative Real Time analysis for a healthy female (a), R5 with exon 3
deletion (b), and R19 with exon 3 duplication (c), respectively.
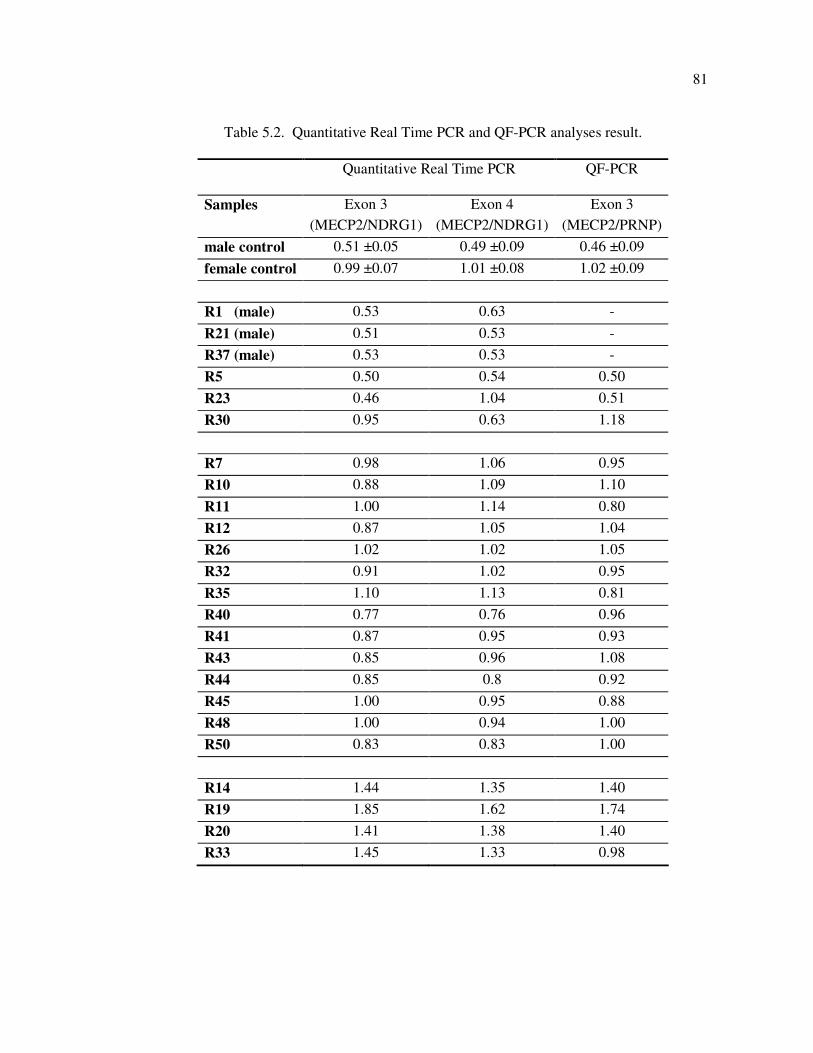
81
Table 5.2. Quantitative Real Time PCR and QF-PCR analyses result.
Quantitative Real Time PCR QF-PCR
Samples Exon 3
(MECP2/NDRG1)
Exon 4
(MECP2/NDRG1)
Exon 3
(MECP2/PRNP)
male control 0.51 ±0.05 0.49 ±0.09 0.46 ±0.09
female control 0.99 ±0.07 1.01 ±0.08 1.02 ±0.09
R1 (male) 0.53 0.63 -
R21 (male) 0.51 0.53 -
R37 (male) 0.53 0.53 -
R5 0.50 0.54 0.50
R23 0.46 1.04 0.51
R30 0.95 0.63 1.18
R7 0.98 1.06 0.95
R10 0.88 1.09 1.10
R11 1.00 1.14 0.80
R12 0.87 1.05 1.04
R26 1.02 1.02 1.05
R32 0.91 1.02 0.95
R35 1.10 1.13 0.81
R40 0.77 0.76 0.96
R41 0.87 0.95 0.93
R43 0.85 0.96 1.08
R44 0.85 0.8 0.92
R45 1.00 0.95 0.88
R48 1.00 0.94 1.00
R50 0.83 0.83 1.00
R14 1.44 1.35 1.40
R19 1.85 1.62 1.74
R20 1.41 1.38 1.40
R33 1.45 1.33 0.98
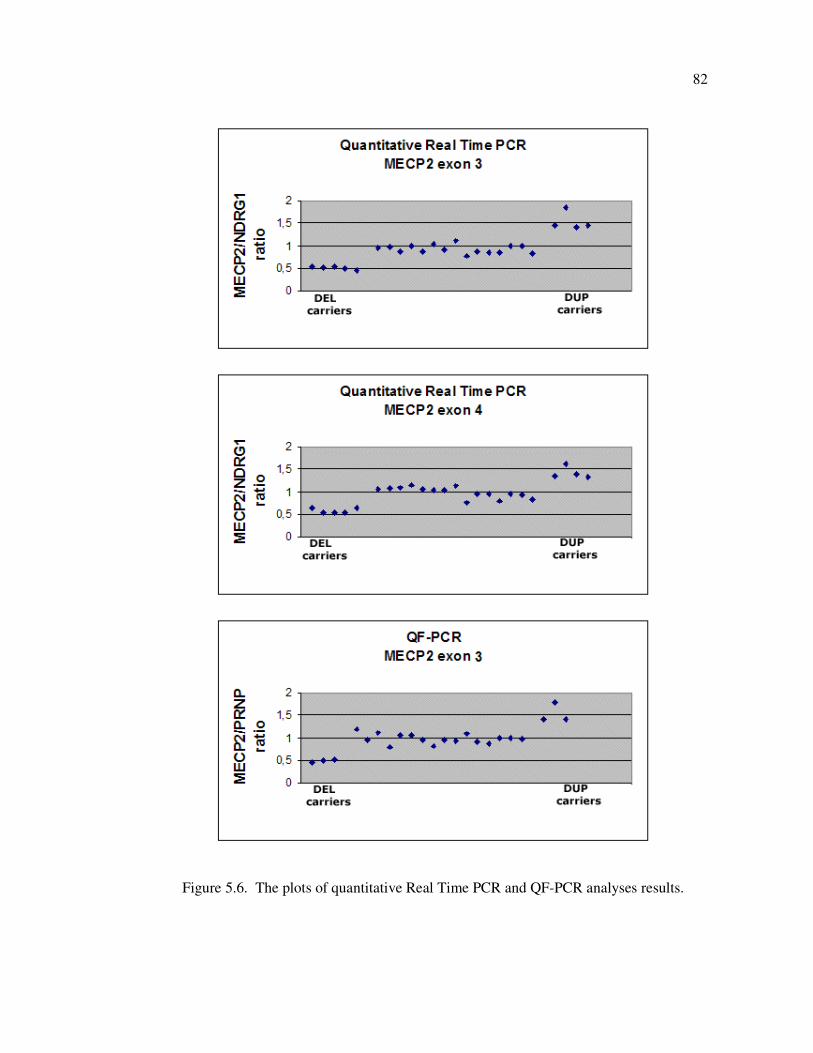
82
Figure 5.6. The plots of quantitative Real Time PCR and QF-PCR analyses results.
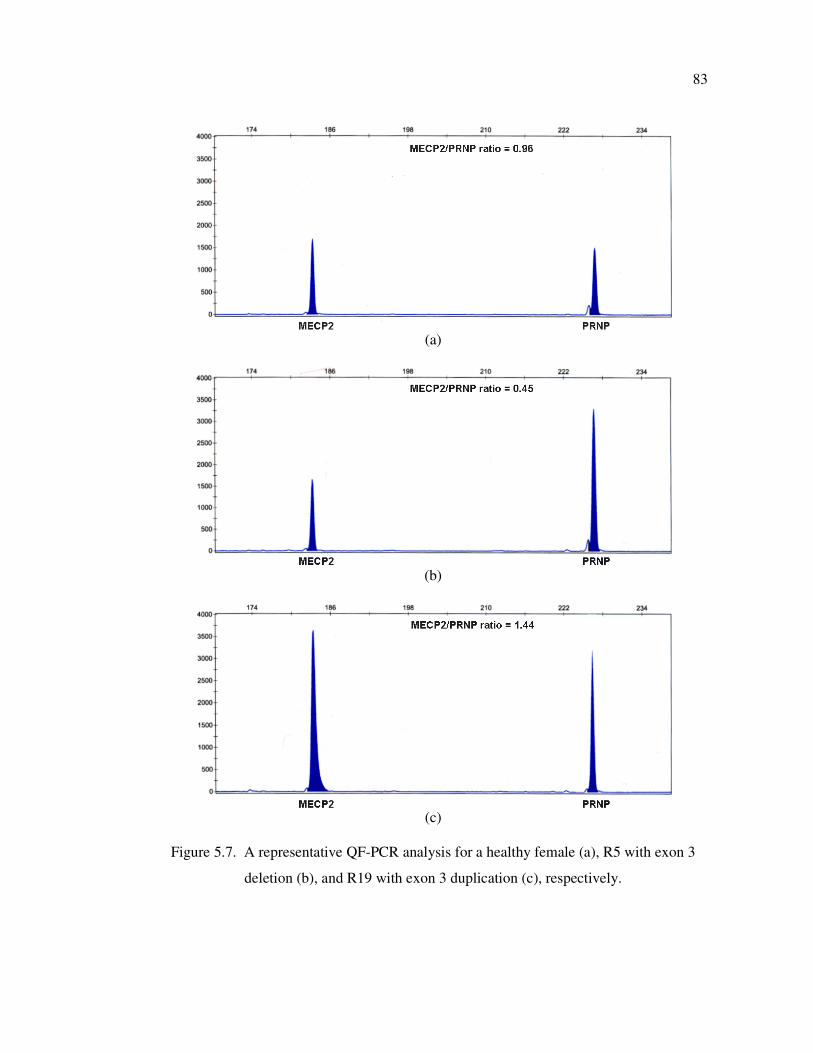
83
(a)
(b)
(c)
Figure 5.7. A representative QF-PCR analysis for a healthy female (a), R5 with exon 3
deletion (b), and R19 with exon 3 duplication (c), respectively.
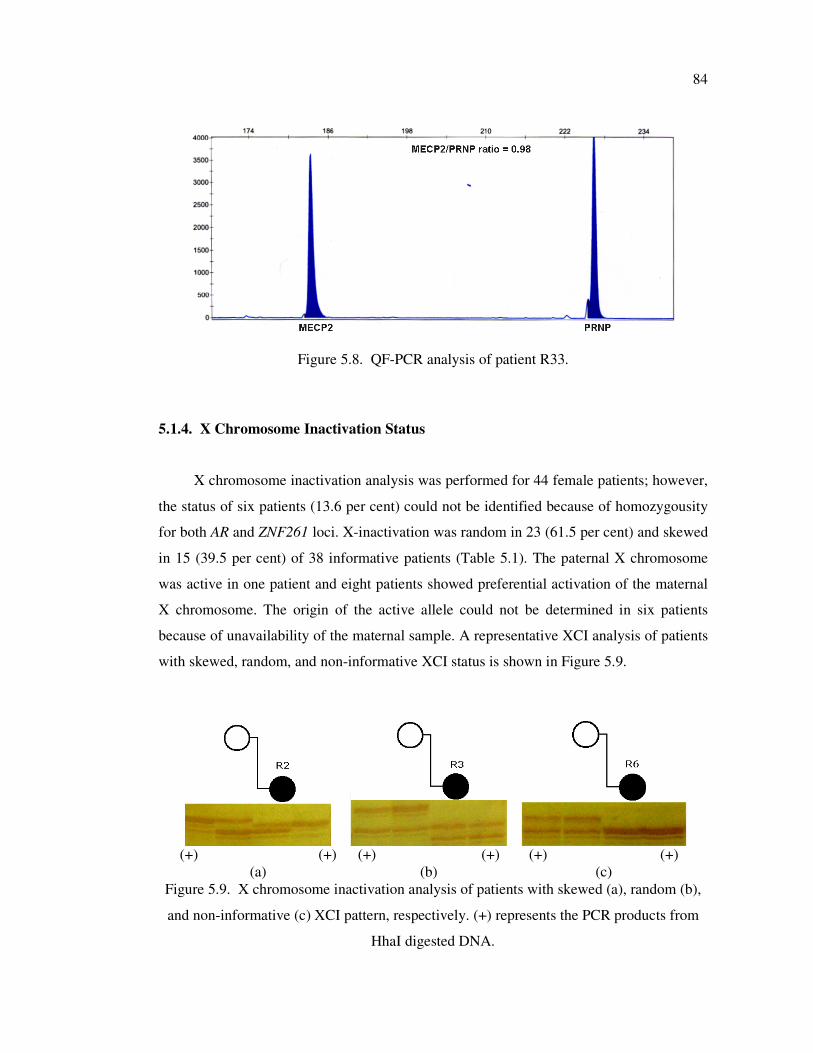
84
Figure 5.8. QF-PCR analysis of patient R33.
5.1.4. X Chromosome Inactivation Status
X chromosome inactivation analysis was performed for 44 female patients; however,
the status of six patients (13.6 per cent) could not be identified because of homozygousity
for both AR and ZNF261 loci. X-inactivation was random in 23 (61.5 per cent) and skewed
in 15 (39.5 per cent) of 38 informative patients (Table 5.1). The paternal X chromosome
was active in one patient and eight patients showed preferential activation of the maternal
X chromosome. The origin of the active allele could not be determined in six patients
because of unavailability of the maternal sample. A representative XCI analysis of patients
with skewed, random, and non-informative XCI status is shown in Figure 5.9.
(+) (+)
(a)
(+) (+)
(b)
(+) (+)
(c)
Figure 5.9. X chromosome inactivation analysis of patients with skewed (a), random (b),
and non-informative (c) XCI pattern, respectively. (+) represents the PCR products from
HhaI digested DNA.
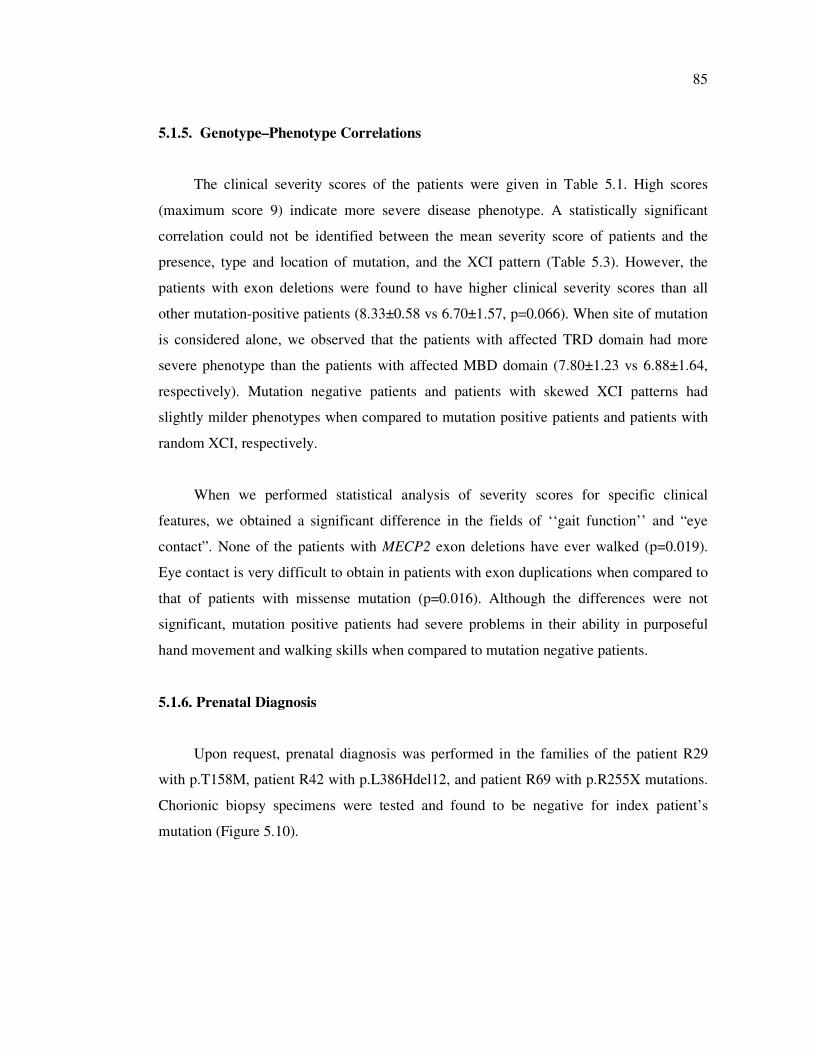
85
5.1.5. Genotype–Phenotype Correlations
The clinical severity scores of the patients were given in Table 5.1. High scores
(maximum score 9) indicate more severe disease phenotype. A statistically significant
correlation could not be identified between the mean severity score of patients and the
presence, type and location of mutation, and the XCI pattern (Table 5.3). However, the
patients with exon deletions were found to have higher clinical severity scores than all
other mutation-positive patients (8.33±0.58 vs 6.70±1.57, p=0.066). When site of mutation
is considered alone, we observed that the patients with affected TRD domain had more
severe phenotype than the patients with affected MBD domain (7.80±1.23 vs 6.88±1.64,
respectively). Mutation negative patients and patients with skewed XCI patterns had
slightly milder phenotypes when compared to mutation positive patients and patients with
random XCI, respectively.
When we performed statistical analysis of severity scores for specific clinical
features, we obtained a significant difference in the fields of ‘‘gait function’’ and “eye
contact”. None of the patients with MECP2 exon deletions have ever walked (p=0.019).
Eye contact is very difficult to obtain in patients with exon duplications when compared to
that of patients with missense mutation (p=0.016). Although the differences were not
significant, mutation positive patients had severe problems in their ability in purposeful
hand movement and walking skills when compared to mutation negative patients.
5.1.6. Prenatal Diagnosis
Upon request, prenatal diagnosis was performed in the families of the patient R29
with p.T158M, patient R42 with p.L386Hdel12, and patient R69 with p.R255X mutations.
Chorionic biopsy specimens were tested and found to be negative for index patient’s
mutation (Figure 5.10).
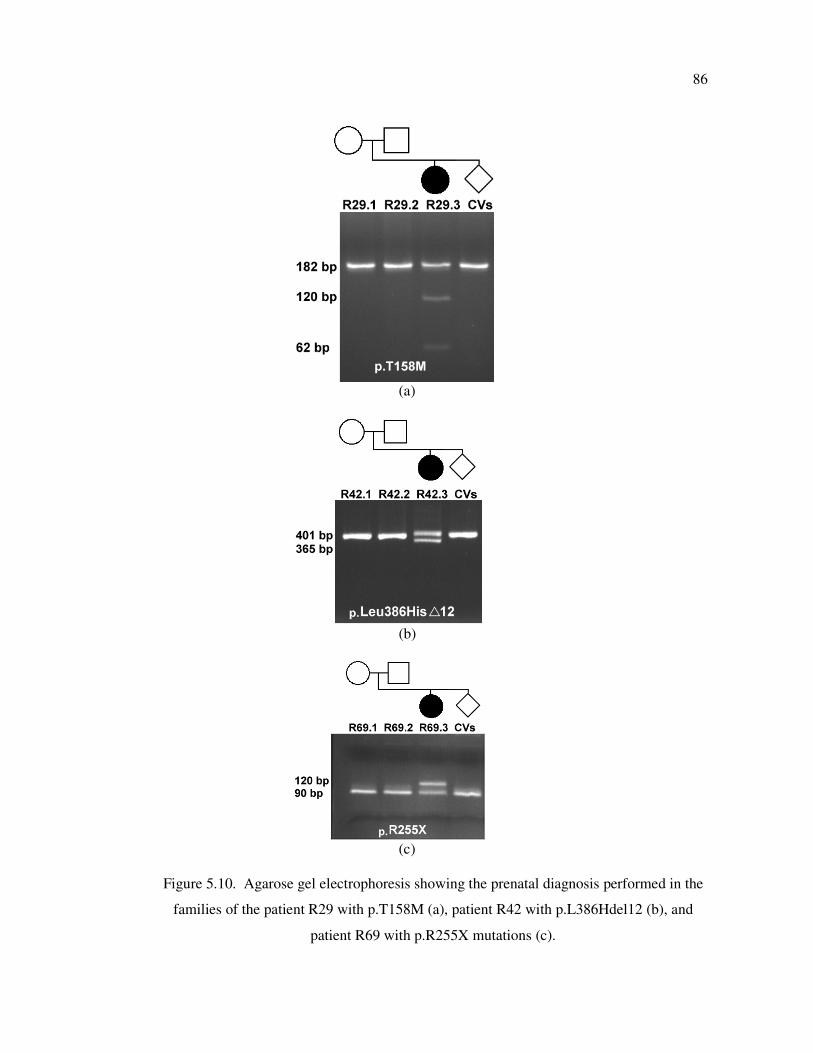
86
(a)
(b)
(c)
Figure 5.10. Agarose gel electrophoresis showing the prenatal diagnosis performed in the
families of the patient R29 with p.T158M (a), patient R42 with p.L386Hdel12 (b), and
patient R69 with p.R255X mutations (c).
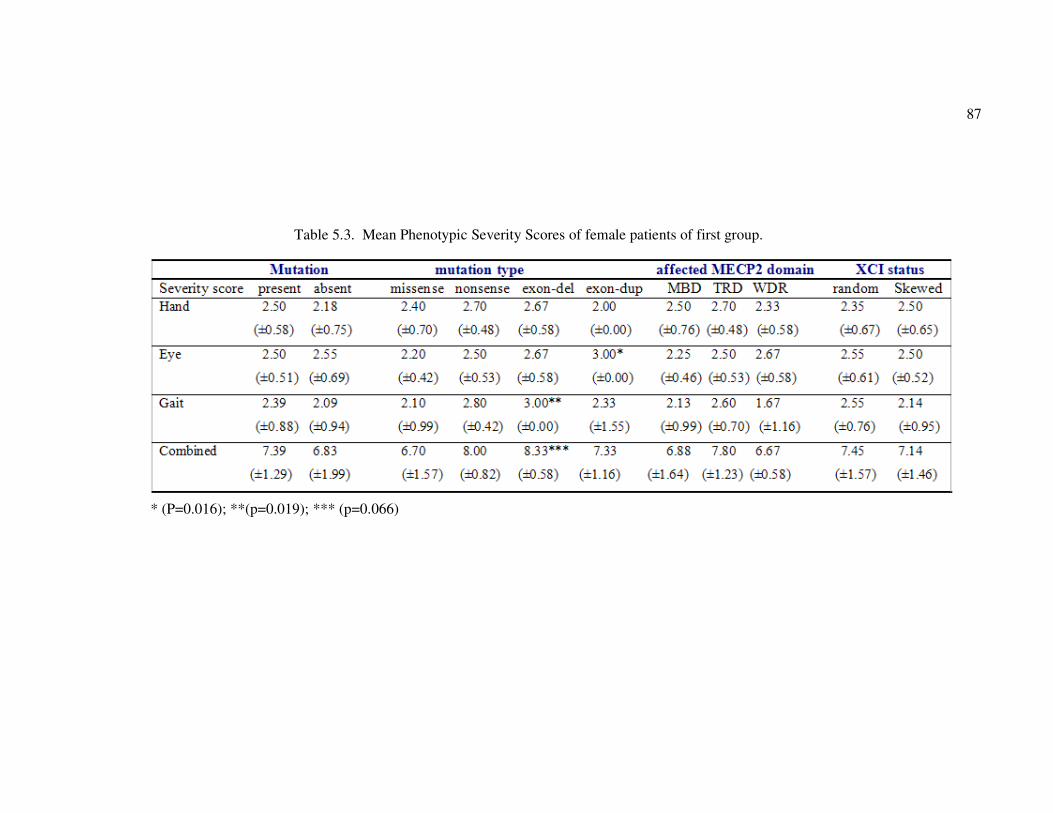
87
Table 5.3. Mean Phenotypic Severity Scores of female patients of first group.
* (P=0.016); **(p=0.019); *** (p=0.066)
88
5.1.7. Multiplexed ARMS-PCR Approach for the Detection of Common MECP2
Mutations
In the present study, we have established a multiplex multiplex amplification
refractory mutation system (ARMS) - PCR assay to detect the seven common MECP2
mutations p.R106W, p.R133C, p.T158M, p.R168X, p.R255X, p.R270X, p.R294X, and
p.R306C. Each primer set was tested and optimized using mutation positive DNA samples,
and then multiplexed (Figure 5.11). A representative multiplex ARMS-PCR assay analysis
is shown in Figure 5.12.
5.1.7.1. Assay optimization. Several factors, including the concentration of primers,
MgCl2 and Taq polymerase, and PCR cycling conditions that can affect PCR specificity
and efficiency were optimized. The concentration of Taq polymerase and MgCl2 both had
pronounced effects on the specificity and relative yield of the PCR products. Although
high MgCl2 concentration increased the intensity of our desired bands, it resulted in non-
specific backgrounds. The optimum amount of MgCl2 was found to be 2.5 mM to ensure
specificity of the multiplex PCR assay. A range of Taq polymerase concentration was also
tested and PCR specificity was found to be highest with 1.5 U of Taq Polymerase. To
improve the specificity and the sensitivity of the amplification, we have used a touchdown
PCR strategy with stepwise decrease of the annealing temperature from 63 to 59 C.
Different concentrations for each set of primers were tested until maximum sensitivity and
specificity were obtained (Table 4.3).
5.1.7.2. Validation of the assay. To evaluate the assay, we tested 14 patients with RTT for
whom we had previously determined the genotypes by PCR followed by restriction
enzyme digestion or DNA sequencing. We observed complete concordance between the
traditional and Multiplex-ARMS methods (Figure 5.13).
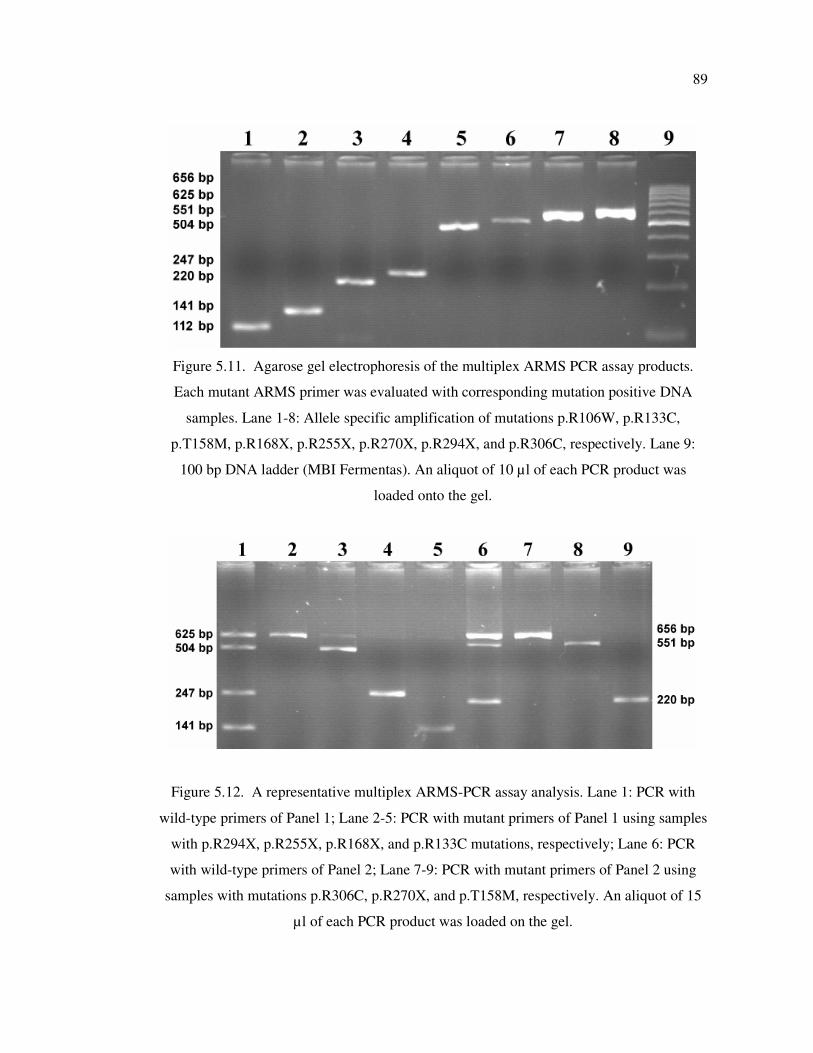
89
Figure 5.11. Agarose gel electrophoresis of the multiplex ARMS PCR assay products.
Each mutant ARMS primer was evaluated with corresponding mutation positive DNA
samples. Lane 1-8: Allele specific amplification of mutations p.R106W, p.R133C,
p.T158M, p.R168X, p.R255X, p.R270X, p.R294X, and p.R306C, respectively. Lane 9:
100 bp DNA ladder (MBI Fermentas). An aliquot of 10 µl of each PCR product was
loaded onto the gel.
Figure 5.12. A representative multiplex ARMS-PCR assay analysis. Lane 1: PCR with
wild-type primers of Panel 1; Lane 2-5: PCR with mutant primers of Panel 1 using samples
with p.R294X, p.R255X, p.R168X, and p.R133C mutations, respectively; Lane 6: PCR
with wild-type primers of Panel 2; Lane 7-9: PCR with mutant primers of Panel 2 using
samples with mutations p.R306C, p.R270X, and p.T158M, respectively. An aliquot of 15
µl of each PCR product was loaded on the gel.
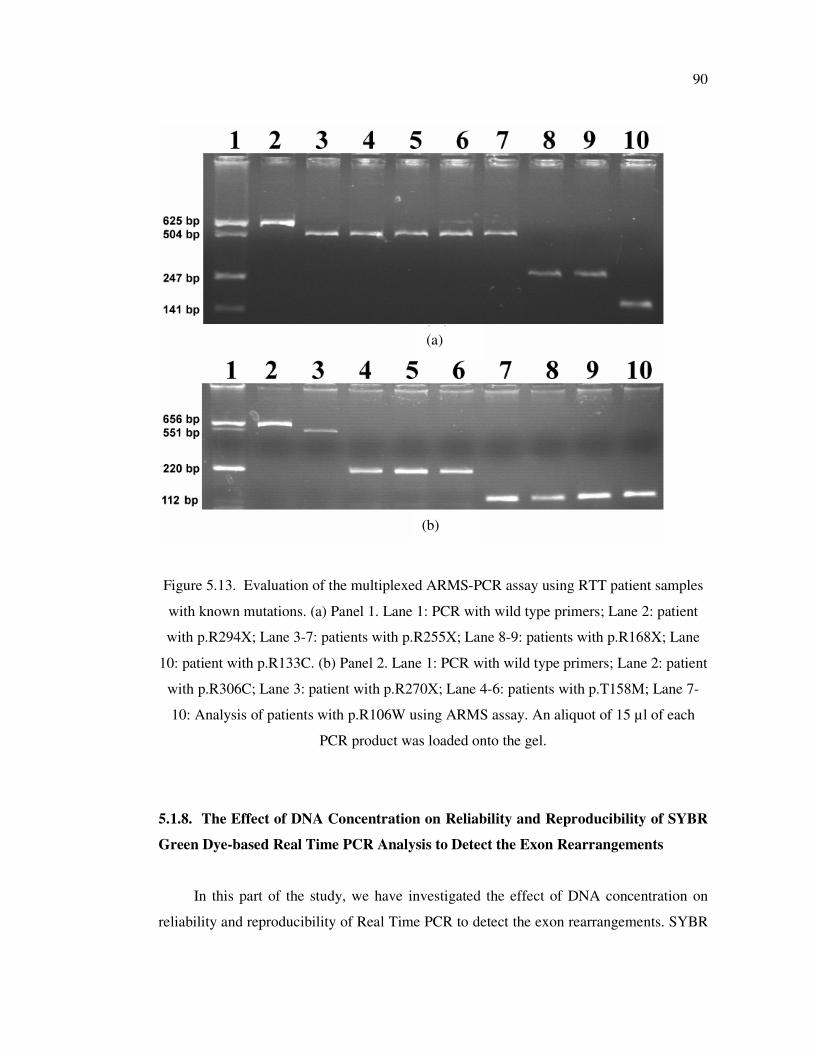
90
Figure 5.13. Evaluation of the multiplexed ARMS-PCR assay using RTT patient samples
with known mutations. (a) Panel 1. Lane 1: PCR with wild type primers; Lane 2: patient
with p.R294X; Lane 3-7: patients with p.R255X; Lane 8-9: patients with p.R168X; Lane
10: patient with p.R133C. (b) Panel 2. Lane 1: PCR with wild type primers; Lane 2: patient
with p.R306C; Lane 3: patient with p.R270X; Lane 4-6: patients with p.T158M; Lane 7-
10: Analysis of patients with p.R106W using ARMS assay. An aliquot of 15 µl of each
PCR product was loaded onto the gel.
5.1.8. The Effect of DNA Concentration on Reliability and Reproducibility of SYBR
Green Dye-based Real Time PCR Analysis to Detect the Exon Rearrangements
In this part of the study, we have investigated the effect of DNA concentration on
reliability and reproducibility of Real Time PCR to detect the exon rearrangements. SYBR
(a)
(b)
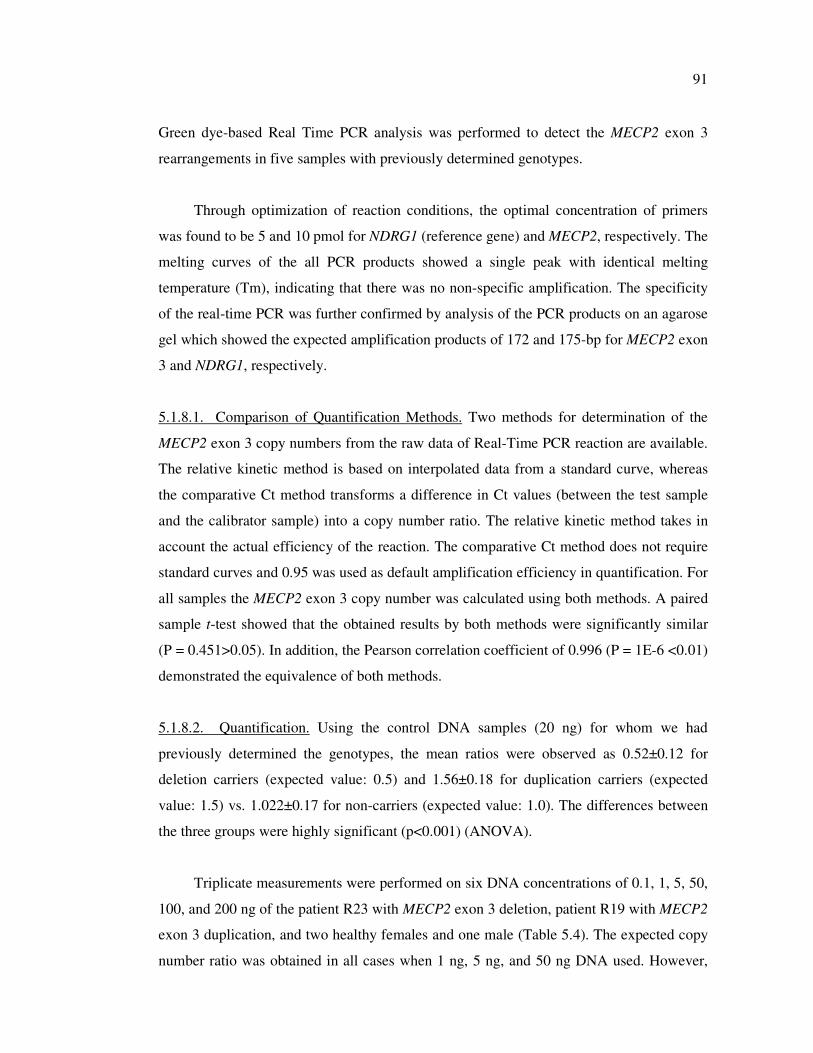
91
Green dye-based Real Time PCR analysis was performed to detect the MECP2 exon 3
rearrangements in five samples with previously determined genotypes.
Through optimization of reaction conditions, the optimal concentration of primers
was found to be 5 and 10 pmol for NDRG1 (reference gene) and MECP2, respectively. The
melting curves of the all PCR products showed a single peak with identical melting
temperature (Tm), indicating that there was no non-specific amplification. The specificity
of the real-time PCR was further confirmed by analysis of the PCR products on an agarose
gel which showed the expected amplification products of 172 and 175-bp for MECP2 exon
3 and NDRG1, respectively.
5.1.8.1. Comparison of Quantification Methods. Two methods for determination of the
MECP2 exon 3 copy numbers from the raw data of Real-Time PCR reaction are available.
The relative kinetic method is based on interpolated data from a standard curve, whereas
the comparative Ct method transforms a difference in Ct values (between the test sample
and the calibrator sample) into a copy number ratio. The relative kinetic method takes in
account the actual efficiency of the reaction. The comparative Ct method does not require
standard curves and 0.95 was used as default amplification efficiency in quantification. For
all samples the MECP2 exon 3 copy number was calculated using both methods. A paired
sample t-test showed that the obtained results by both methods were significantly similar
(P = 0.451>0.05). In addition, the Pearson correlation coefficient of 0.996 (P = 1E-6 <0.01)
demonstrated the equivalence of both methods.
5.1.8.2. Quantification. Using the control DNA samples (20 ng) for whom we had
previously determined the genotypes, the mean ratios were observed as 0.52±0.12 for
deletion carriers (expected value: 0.5) and 1.56±0.18 for duplication carriers (expected
value: 1.5) vs. 1.022±0.17 for non-carriers (expected value: 1.0). The differences between
the three groups were highly significant (p<0.001) (ANOVA).
Triplicate measurements were performed on six DNA concentrations of 0.1, 1, 5, 50,
100, and 200 ng of the patient R23 with MECP2 exon 3 deletion, patient R19 with MECP2
exon 3 duplication, and two healthy females and one male (Table 5.4). The expected copy
number ratio was obtained in all cases when 1 ng, 5 ng, and 50 ng DNA used. However,
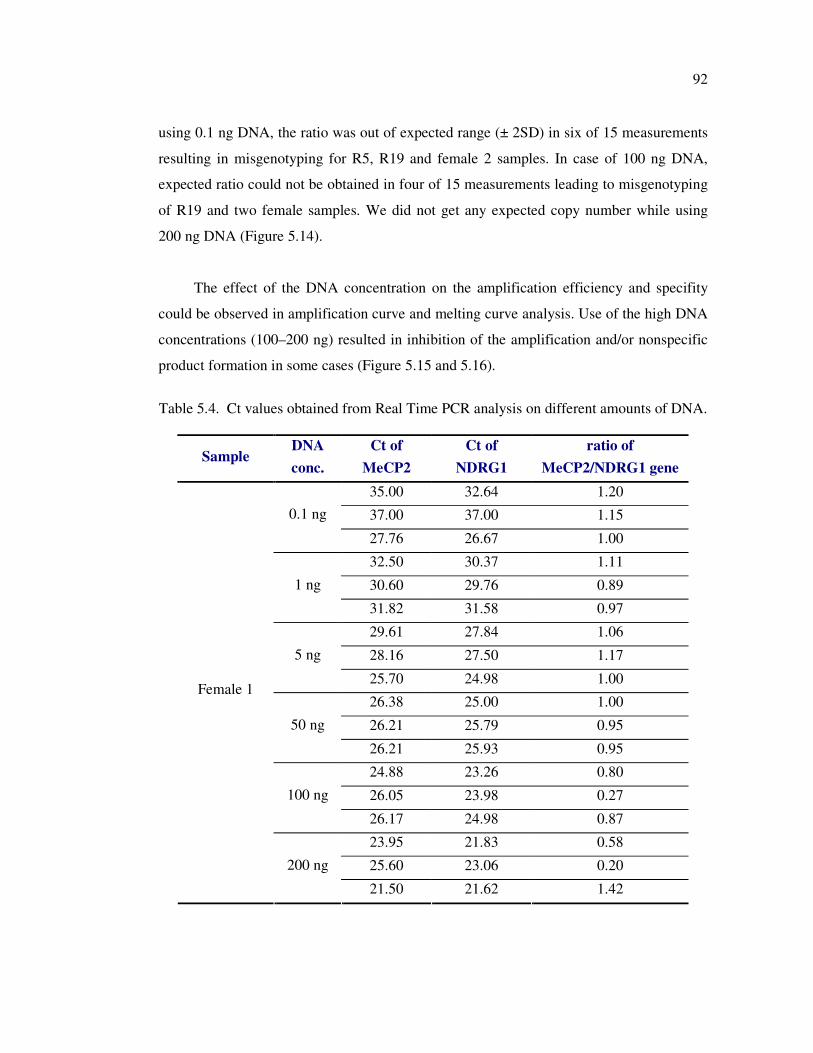
92
using 0.1 ng DNA, the ratio was out of expected range (± 2SD) in six of 15 measurements
resulting in misgenotyping for R5, R19 and female 2 samples. In case of 100 ng DNA,
expected ratio could not be obtained in four of 15 measurements leading to misgenotyping
of R19 and two female samples. We did not get any expected copy number while using
200 ng DNA (Figure 5.14).
The effect of the DNA concentration on the amplification efficiency and specifity
could be observed in amplification curve and melting curve analysis. Use of the high DNA
concentrations (100–200 ng) resulted in inhibition of the amplification and/or nonspecific
product formation in some cases (Figure 5.15 and 5.16).
Table 5.4. Ct values obtained from Real Time PCR analysis on different amounts of DNA.
Sample DNA
conc.
Ct of
MeCP2
Ct of
NDRG1
ratio of
MeCP2/NDRG1 gene
35.00 32.64 1.20
37.00 37.00 1.15 0.1 ng
27.76 26.67 1.00
32.50 30.37 1.11
30.60 29.76 0.89 1 ng
31.82 31.58 0.97
29.61 27.84 1.06
28.16 27.50 1.17 5 ng
25.70 24.98 1.00
26.38 25.00 1.00
26.21 25.79 0.95 50 ng
26.21 25.93 0.95
24.88 23.26 0.80
26.05 23.98 0.27 100 ng
26.17 24.98 0.87
23.95 21.83 0.58
25.60 23.06 0.20
Female 1
200 ng
21.50 21.62 1.42
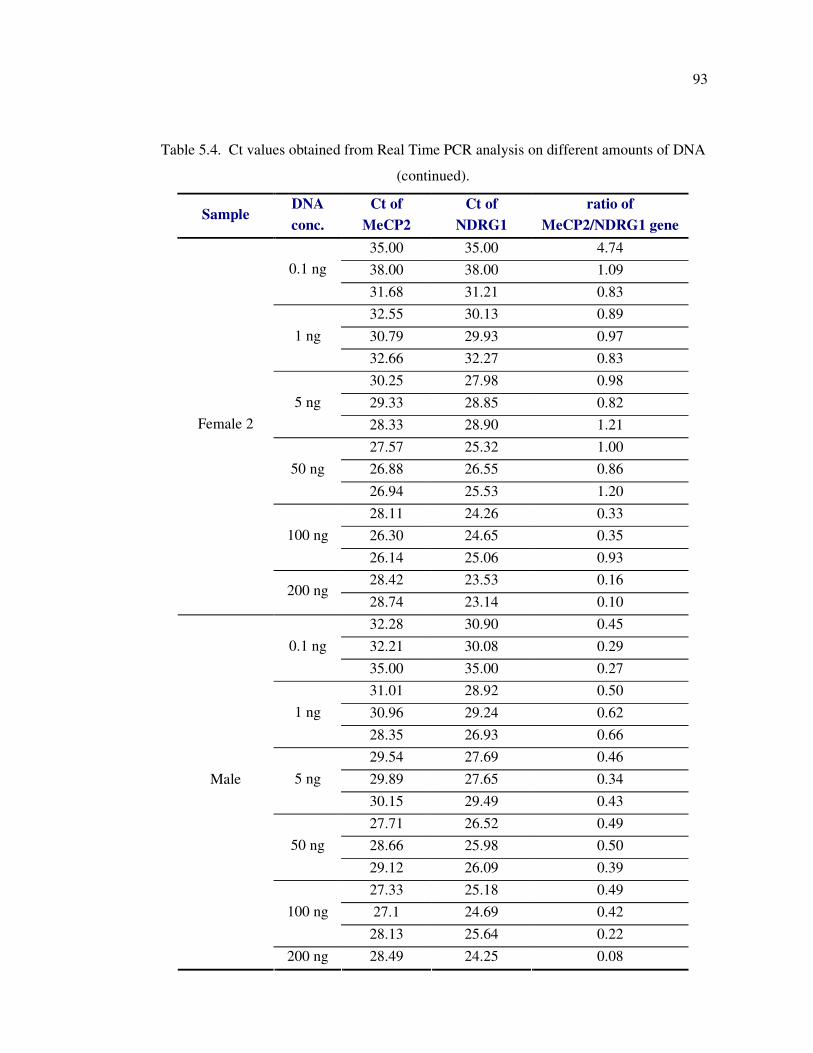
93
Table 5.4. Ct values obtained from Real Time PCR analysis on different amounts of DNA
(continued).
Sample DNA
conc.
Ct of
MeCP2
Ct of
NDRG1
ratio of
MeCP2/NDRG1 gene
35.00 35.00 4.74
38.00 38.00 1.09 0.1 ng
31.68 31.21 0.83
32.55 30.13 0.89
30.79 29.93 0.97 1 ng
32.66 32.27 0.83
30.25 27.98 0.98
29.33 28.85 0.82 5 ng
28.33 28.90 1.21
27.57 25.32 1.00
26.88 26.55 0.86 50 ng
26.94 25.53 1.20
28.11 24.26 0.33
26.30 24.65 0.35 100 ng
26.14 25.06 0.93
28.42 23.53 0.16
Female 2
200 ng 28.74 23.14 0.10
32.28 30.90 0.45
32.21 30.08 0.29 0.1 ng
35.00 35.00 0.27
31.01 28.92 0.50
30.96 29.24 0.62 1 ng
28.35 26.93 0.66
29.54 27.69 0.46
29.89 27.65 0.34 5 ng
30.15 29.49 0.43
27.71 26.52 0.49
28.66 25.98 0.50 50 ng
29.12 26.09 0.39
27.33 25.18 0.49
27.1 24.69 0.42 100 ng
28.13 25.64 0.22
Male
200 ng 28.49 24.25 0.08
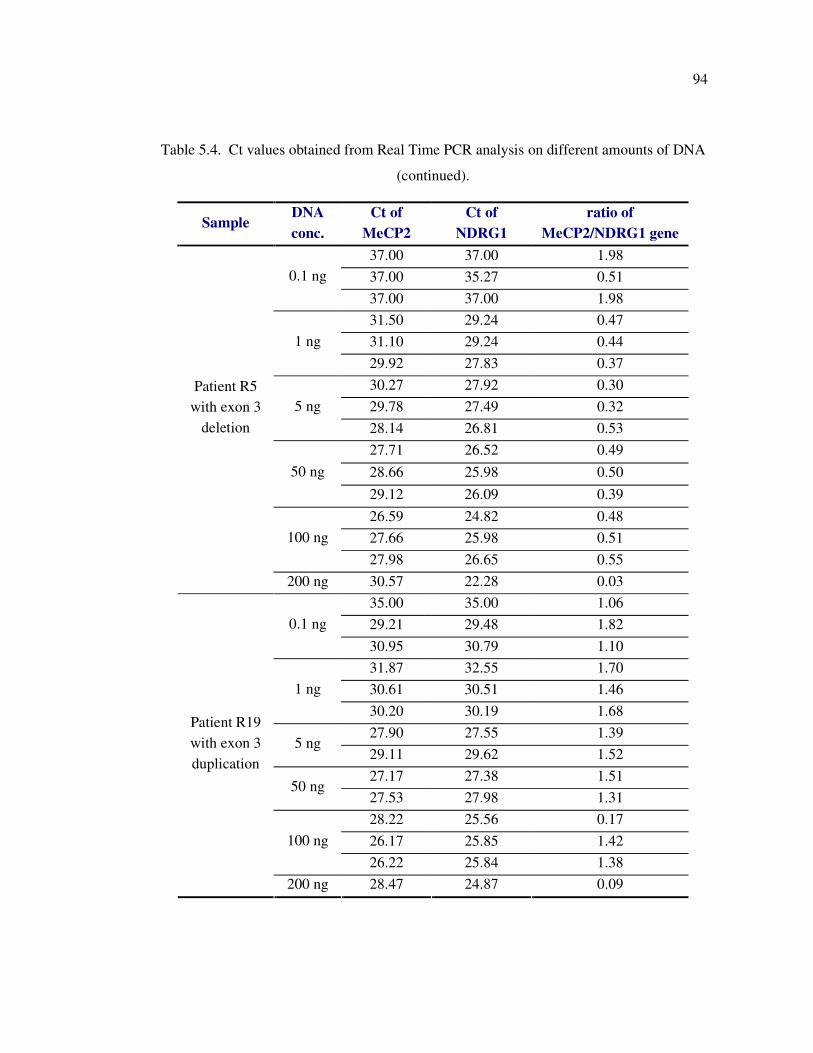
94
Table 5.4. Ct values obtained from Real Time PCR analysis on different amounts of DNA
(continued).
Sample DNA
conc.
Ct of
MeCP2
Ct of
NDRG1
ratio of
MeCP2/NDRG1 gene
37.00 37.00 1.98
37.00 35.27 0.51 0.1 ng
37.00 37.00 1.98
31.50 29.24 0.47
31.10 29.24 0.44 1 ng
29.92 27.83 0.37
30.27 27.92 0.30
29.78 27.49 0.32 5 ng
28.14 26.81 0.53
27.71 26.52 0.49
28.66 25.98 0.50 50 ng
29.12 26.09 0.39
26.59 24.82 0.48
27.66 25.98 0.51 100 ng
27.98 26.65 0.55
Patient R5
with exon 3
deletion
200 ng 30.57 22.28 0.03
35.00 35.00 1.06
29.21 29.48 1.82 0.1 ng
30.95 30.79 1.10
31.87 32.55 1.70
30.61 30.51 1.46 1 ng
30.20 30.19 1.68
27.90 27.55 1.39 5 ng
29.11 29.62 1.52
27.17 27.38 1.51 50 ng
27.53 27.98 1.31
28.22 25.56 0.17
26.17 25.85 1.42 100 ng
26.22 25.84 1.38
Patient R19
with exon 3
duplication
200 ng 28.47 24.87 0.09
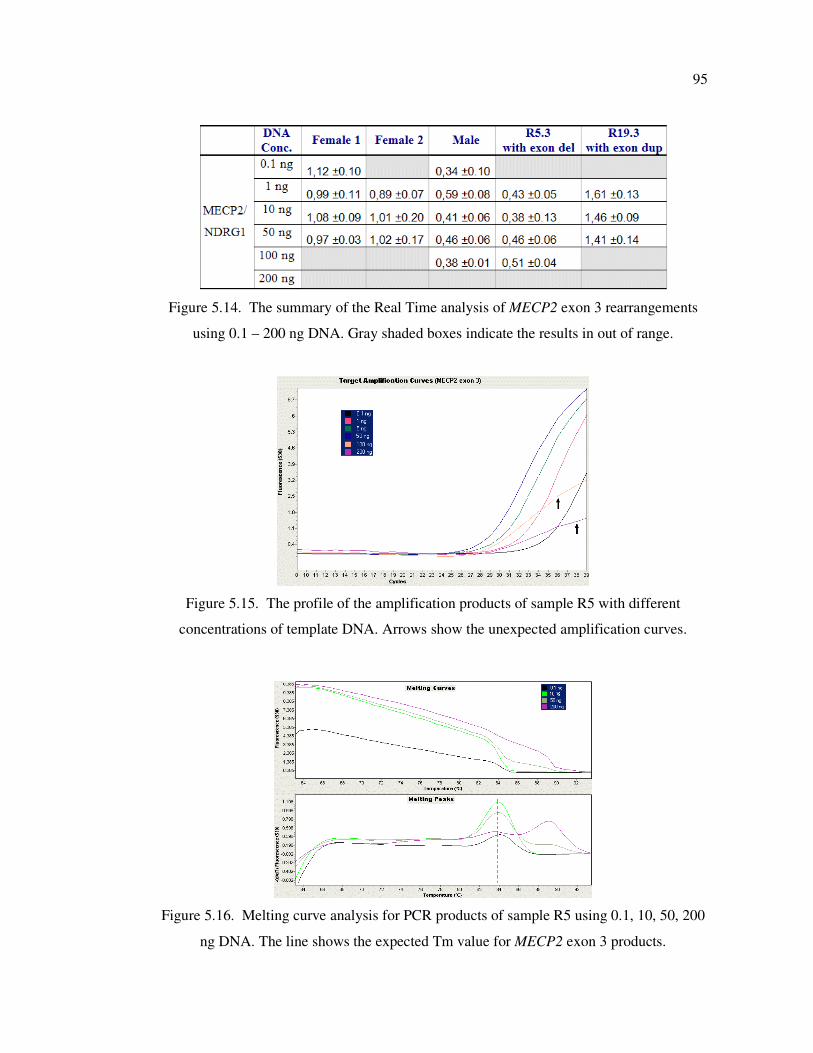
95
Figure 5.14. The summary of the Real Time analysis of MECP2 exon 3 rearrangements
using 0.1 – 200 ng DNA. Gray shaded boxes indicate the results in out of range.
Figure 5.15. The profile of the amplification products of sample R5 with different
concentrations of template DNA. Arrows show the unexpected amplification curves.
Figure 5.16. Melting curve analysis for PCR products of sample R5 using 0.1, 10, 50, 200
ng DNA. The line shows the expected Tm value for MECP2 exon 3 products.
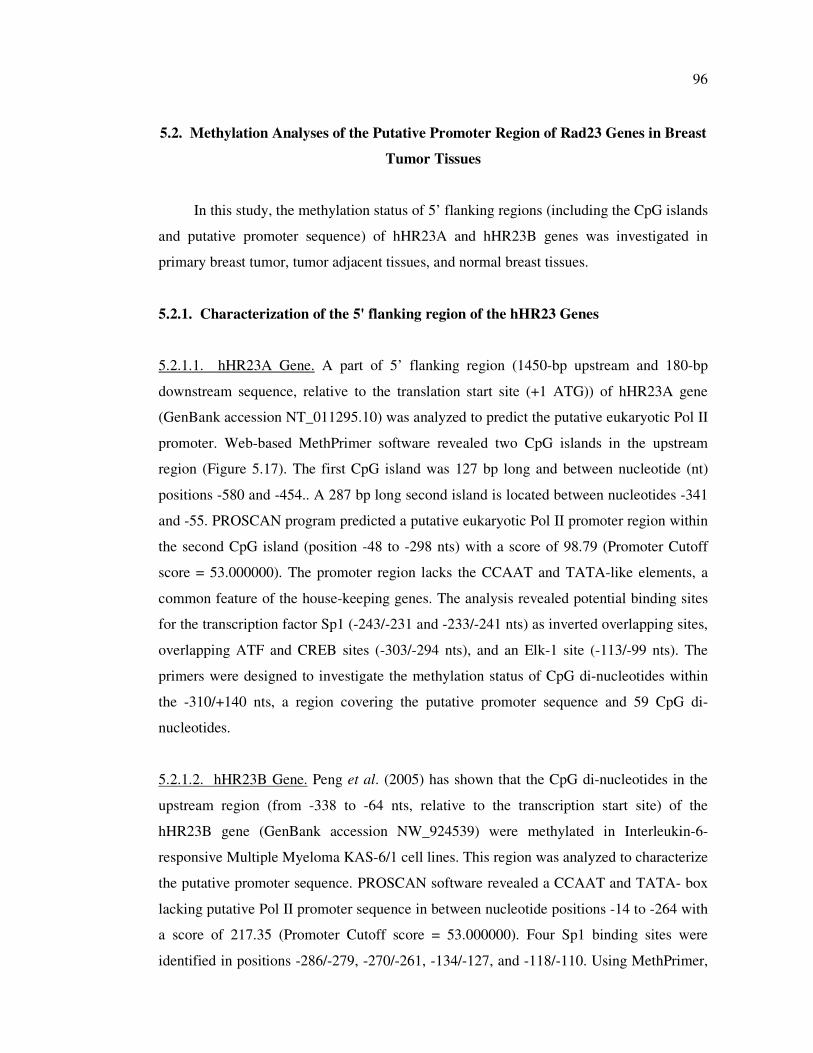
96
5.2. Methylation Analyses of the Putative Promoter Region of Rad23 Genes in Breast
Tumor Tissues
In this study, the methylation status of 5’ flanking regions (including the CpG islands
and putative promoter sequence) of hHR23A and hHR23B genes was investigated in
primary breast tumor, tumor adjacent tissues, and normal breast tissues.
5.2.1. Characterization of the 5' flanking region of the hHR23 Genes
5.2.1.1. hHR23A Gene. A part of 5’ flanking region (1450-bp upstream and 180-bp
downstream sequence, relative to the translation start site (+1 ATG)) of hHR23A gene
(GenBank accession NT_011295.10) was analyzed to predict the putative eukaryotic Pol II
promoter. Web-based MethPrimer software revealed two CpG islands in the upstream
region (Figure 5.17). The first CpG island was 127 bp long and between nucleotide (nt)
positions -580 and -454.. A 287 bp long second island is located between nucleotides -341
and -55. PROSCAN program predicted a putative eukaryotic Pol II promoter region within
the second CpG island (position -48 to -298 nts) with a score of 98.79 (Promoter Cutoff
score = 53.000000). The promoter region lacks the CCAAT and TATA-like elements, a
common feature of the house-keeping genes. The analysis revealed potential binding sites
for the transcription factor Sp1 (-243/-231 and -233/-241 nts) as inverted overlapping sites,
overlapping ATF and CREB sites (-303/-294 nts), and an Elk-1 site (-113/-99 nts). The
primers were designed to investigate the methylation status of CpG di-nucleotides within
the -310/+140 nts, a region covering the putative promoter sequence and 59 CpG di-
nucleotides.
5.2.1.2. hHR23B Gene. Peng et al. (2005) has shown that the CpG di-nucleotides in the
upstream region (from -338 to -64 nts, relative to the transcription start site) of the
hHR23B gene (GenBank accession NW_924539) were methylated in Interleukin-6-
responsive Multiple Myeloma KAS-6/1 cell lines. This region was analyzed to characterize
the putative promoter sequence. PROSCAN software revealed a CCAAT and TATA- box
lacking putative Pol II promoter sequence in between nucleotide positions -14 to -264 with
a score of 217.35 (Promoter Cutoff score = 53.000000). Four Sp1 binding sites were
identified in positions -286/-279, -270/-261, -134/-127, and -118/-110. Using MethPrimer,
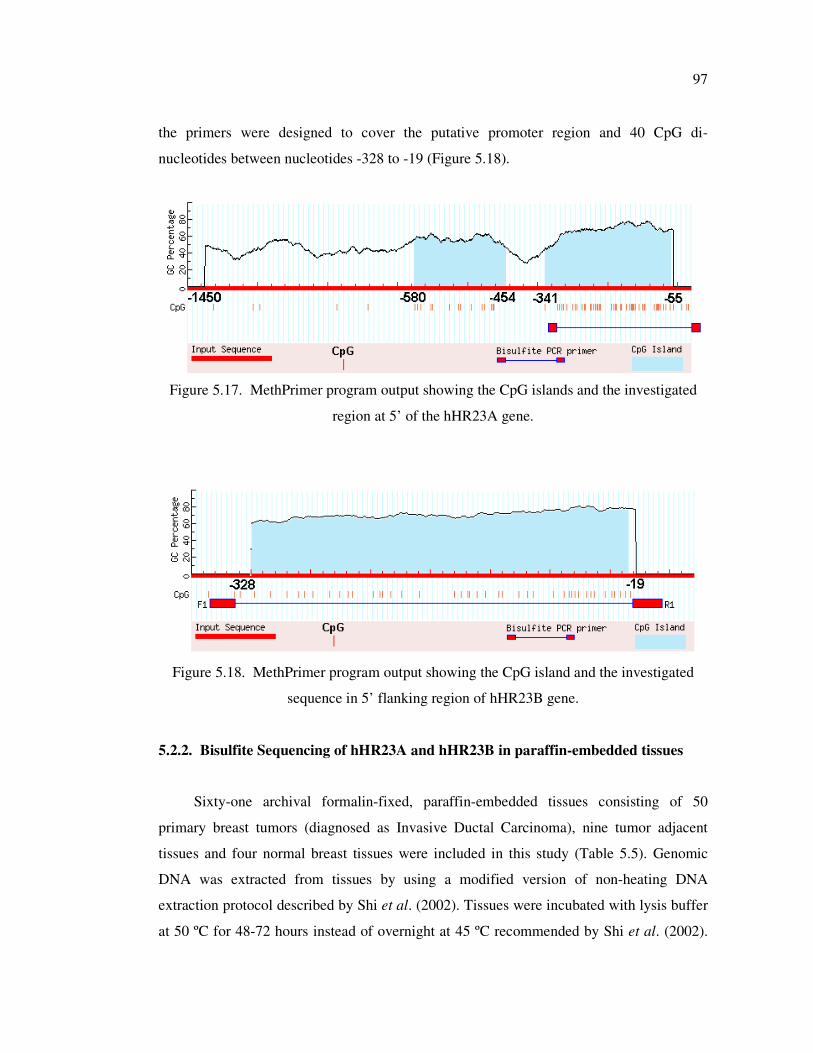
97
the primers were designed to cover the putative promoter region and 40 CpG di-
nucleotides between nucleotides -328 to -19 (Figure 5.18).
Figure 5.17. MethPrimer program output showing the CpG islands and the investigated
region at 5’ of the hHR23A gene.
Figure 5.18. MethPrimer program output showing the CpG island and the investigated
sequence in 5’ flanking region of hHR23B gene.
5.2.2. Bisulfite Sequencing of hHR23A and hHR23B in paraffin-embedded tissues
Sixty-one archival formalin-fixed, paraffin-embedded tissues consisting of 50
primary breast tumors (diagnosed as Invasive Ductal Carcinoma), nine tumor adjacent
tissues and four normal breast tissues were included in this study (Table 5.5). Genomic
DNA was extracted from tissues by using a modified version of non-heating DNA
extraction protocol described by Shi et al. (2002). Tissues were incubated with lysis buffer
at 50 ºC for 48-72 hours instead of overnight at 45 ºC recommended by Shi et al. (2002).
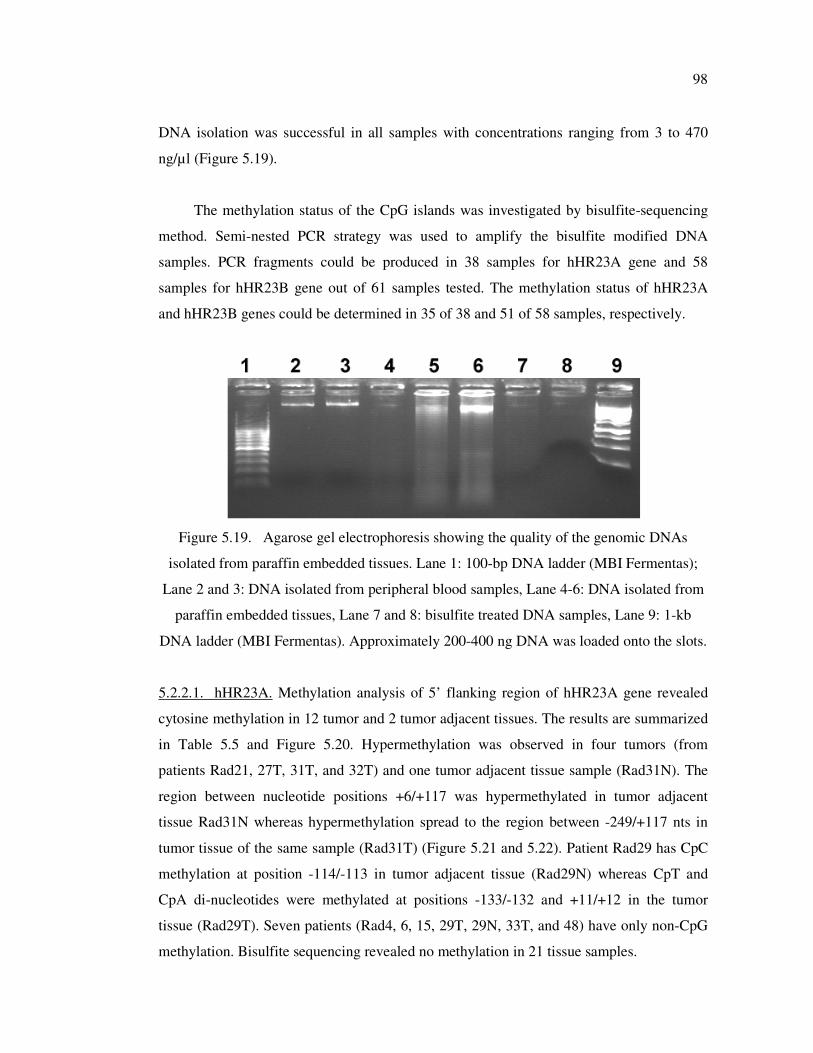
98
DNA isolation was successful in all samples with concentrations ranging from 3 to 470
ng/µl (Figure 5.19).
The methylation status of the CpG islands was investigated by bisulfite-sequencing
method. Semi-nested PCR strategy was used to amplify the bisulfite modified DNA
samples. PCR fragments could be produced in 38 samples for hHR23A gene and 58
samples for hHR23B gene out of 61 samples tested. The methylation status of hHR23A
and hHR23B genes could be determined in 35 of 38 and 51 of 58 samples, respectively.
Figure 5.19. Agarose gel electrophoresis showing the quality of the genomic DNAs
isolated from paraffin embedded tissues. Lane 1: 100-bp DNA ladder (MBI Fermentas);
Lane 2 and 3: DNA isolated from peripheral blood samples, Lane 4-6: DNA isolated from
paraffin embedded tissues, Lane 7 and 8: bisulfite treated DNA samples, Lane 9: 1-kb
DNA ladder (MBI Fermentas). Approximately 200-400 ng DNA was loaded onto the slots.
5.2.2.1. hHR23A. Methylation analysis of 5’ flanking region of hHR23A gene revealed
cytosine methylation in 12 tumor and 2 tumor adjacent tissues. The results are summarized
in Table 5.5 and Figure 5.20. Hypermethylation was observed in four tumors (from
patients Rad21, 27T, 31T, and 32T) and one tumor adjacent tissue sample (Rad31N). The
region between nucleotide positions +6/+117 was hypermethylated in tumor adjacent
tissue Rad31N whereas hypermethylation spread to the region between -249/+117 nts in
tumor tissue of the same sample (Rad31T) (Figure 5.21 and 5.22). Patient Rad29 has CpC
methylation at position -114/-113 in tumor adjacent tissue (Rad29N) whereas CpT and
CpA di-nucleotides were methylated at positions -133/-132 and +11/+12 in the tumor
tissue (Rad29T). Seven patients (Rad4, 6, 15, 29T, 29N, 33T, and 48) have only non-CpG
methylation. Bisulfite sequencing revealed no methylation in 21 tissue samples.
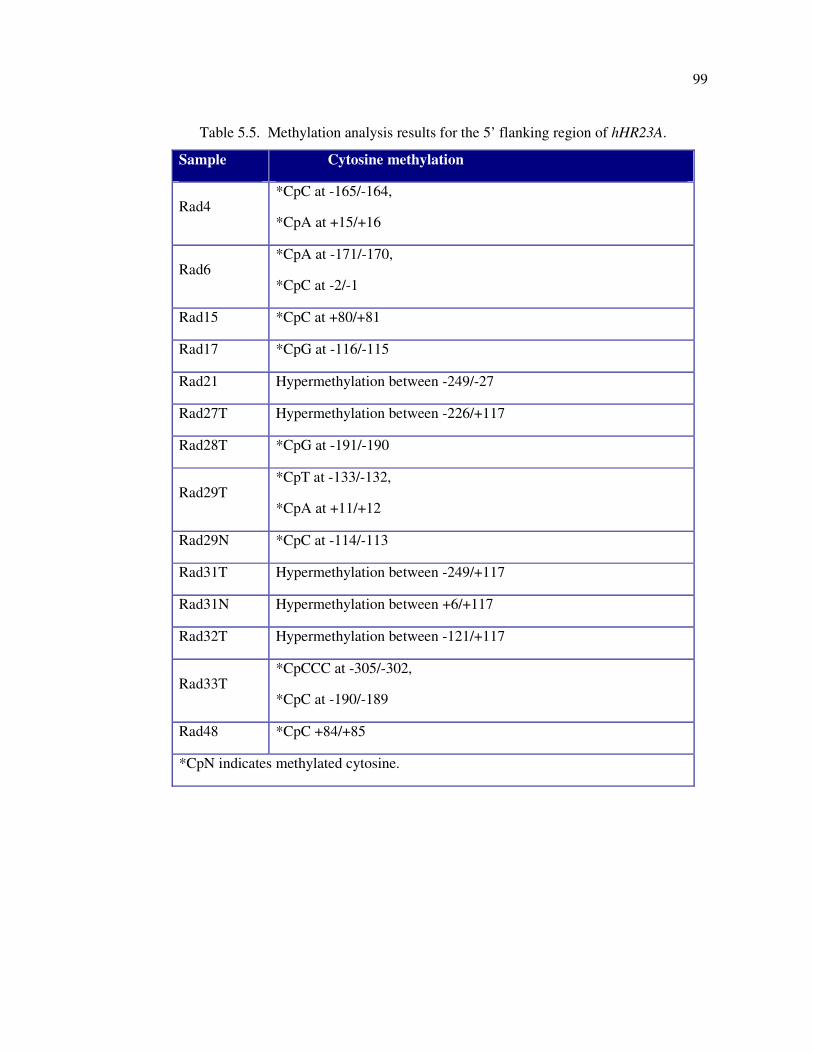
99
Table 5.5. Methylation analysis results for the 5’ flanking region of hHR23A.
Sample Cytosine methylation
Rad4 *CpC at -165/-164,
*CpA at +15/+16
Rad6 *CpA at -171/-170,
*CpC at -2/-1
Rad15 *CpC at +80/+81
Rad17 *CpG at -116/-115
Rad21 Hypermethylation between -249/-27
Rad27T Hypermethylation between -226/+117
Rad28T *CpG at -191/-190
Rad29T *CpT at -133/-132,
*CpA at +11/+12
Rad29N *CpC at -114/-113
Rad31T Hypermethylation between -249/+117
Rad31N Hypermethylation between +6/+117
Rad32T Hypermethylation between -121/+117
Rad33T *CpCCC at -305/-302,
*CpC at -190/-189
Rad48 *CpC +84/+85
*CpN indicates methylated cytosine.
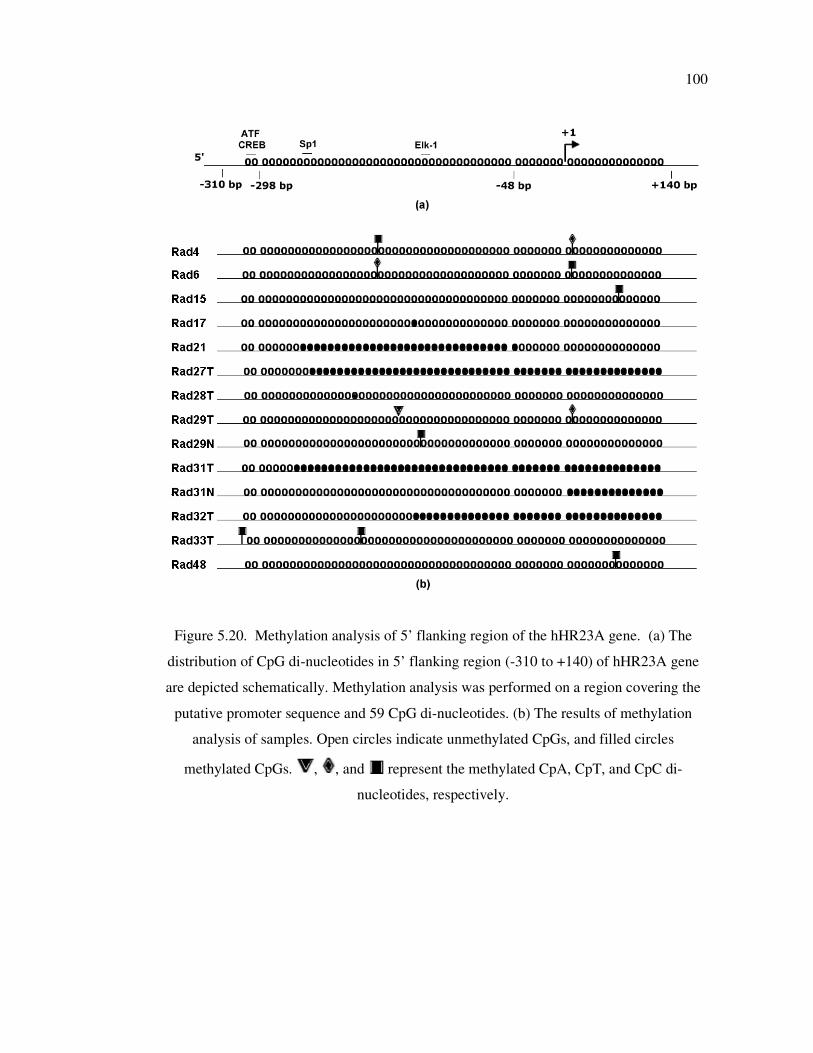
100
Figure 5.20. Methylation analysis of 5’ flanking region of the hHR23A gene. (a) The
distribution of CpG di-nucleotides in 5’ flanking region (-310 to +140) of hHR23A gene
are depicted schematically. Methylation analysis was performed on a region covering the
putative promoter sequence and 59 CpG di-nucleotides. (b) The results of methylation
analysis of samples. Open circles indicate unmethylated CpGs, and filled circles
methylated CpGs. , , and represent the methylated CpA, CpT, and CpC di-
nucleotides, respectively.
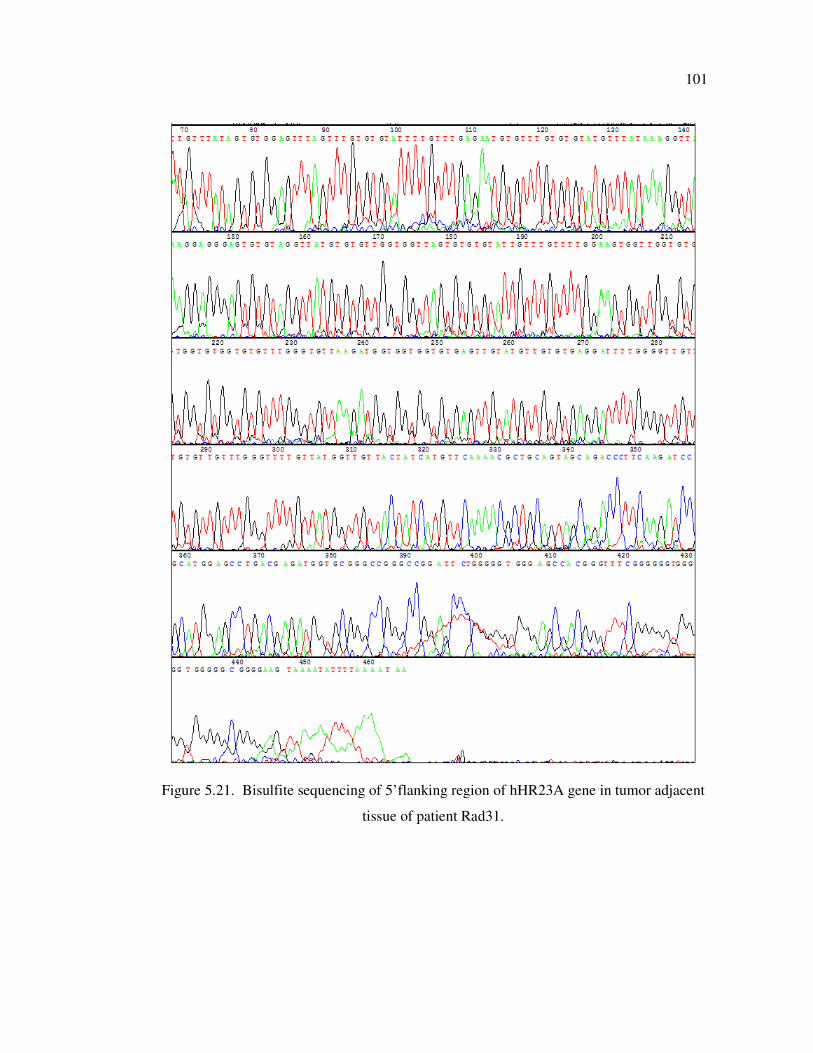
101
Figure 5.21. Bisulfite sequencing of 5’flanking region of hHR23A gene in tumor adjacent
tissue of patient Rad31.
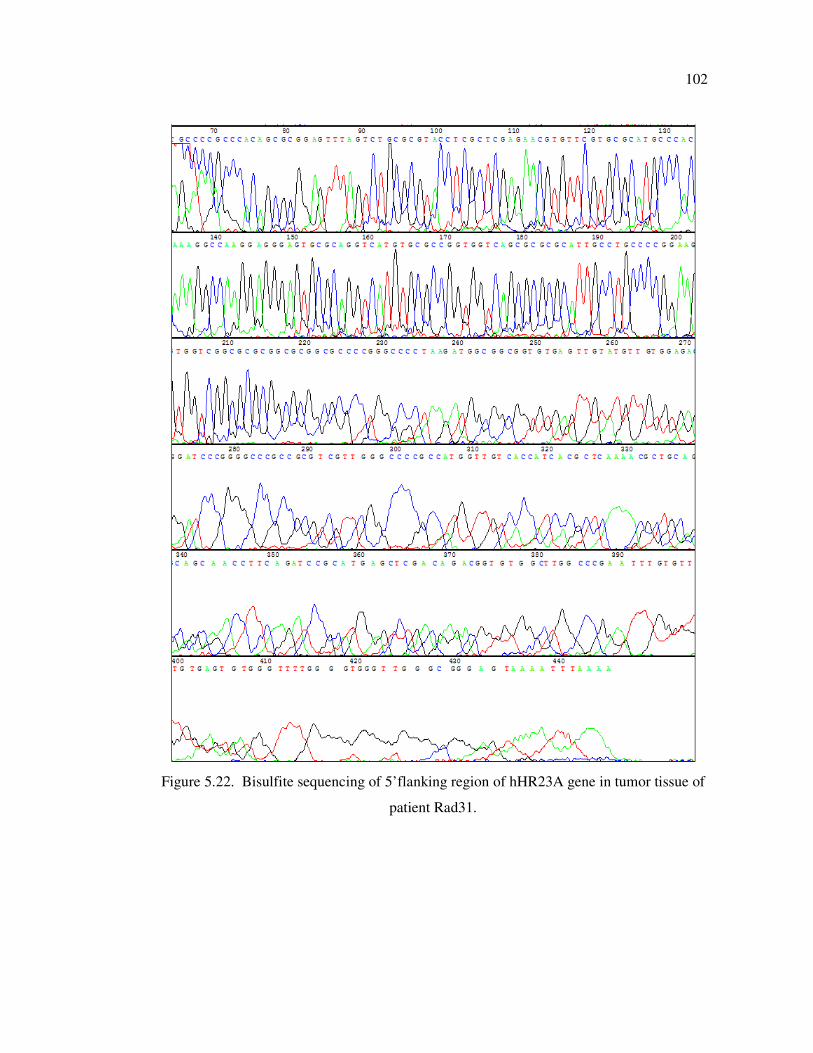
102
Figure 5.22. Bisulfite sequencing of 5’flanking region of hHR23A gene in tumor tissue of
patient Rad31.
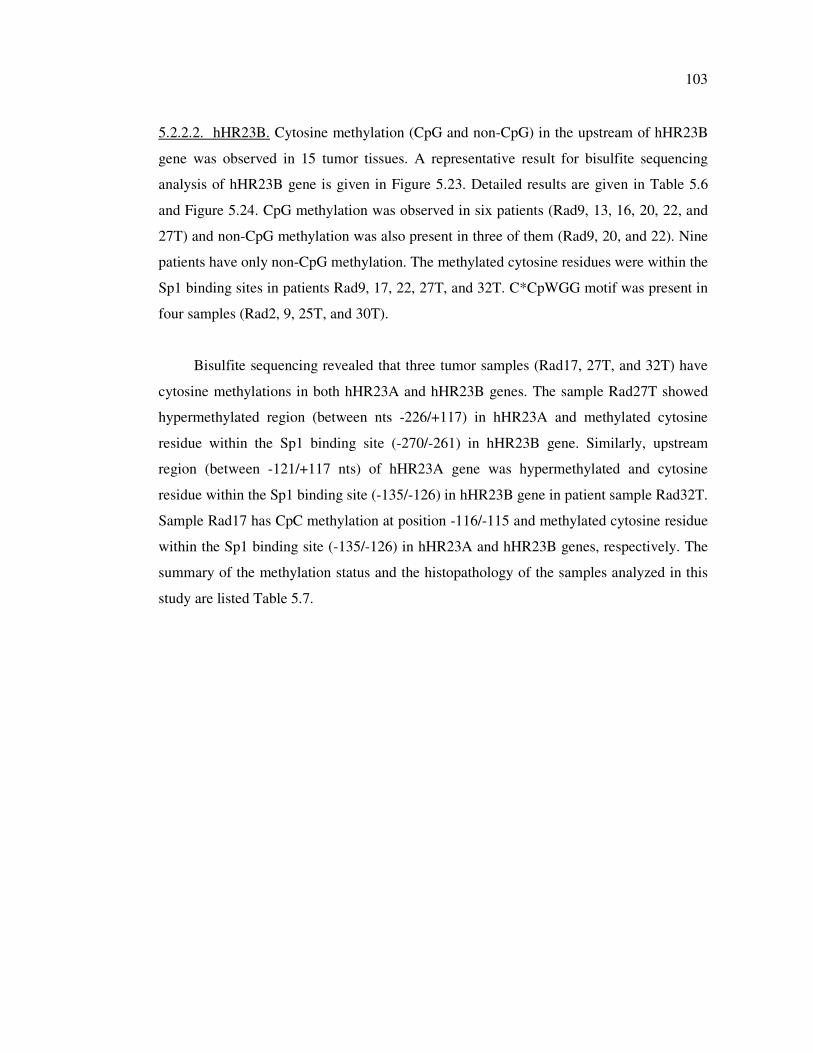
103
5.2.2.2. hHR23B. Cytosine methylation (CpG and non-CpG) in the upstream of hHR23B
gene was observed in 15 tumor tissues. A representative result for bisulfite sequencing
analysis of hHR23B gene is given in Figure 5.23. Detailed results are given in Table 5.6
and Figure 5.24. CpG methylation was observed in six patients (Rad9, 13, 16, 20, 22, and
27T) and non-CpG methylation was also present in three of them (Rad9, 20, and 22). Nine
patients have only non-CpG methylation. The methylated cytosine residues were within the
Sp1 binding sites in patients Rad9, 17, 22, 27T, and 32T. C*CpWGG motif was present in
four samples (Rad2, 9, 25T, and 30T).
Bisulfite sequencing revealed that three tumor samples (Rad17, 27T, and 32T) have
cytosine methylations in both hHR23A and hHR23B genes. The sample Rad27T showed
hypermethylated region (between nts -226/+117) in hHR23A and methylated cytosine
residue within the Sp1 binding site (-270/-261) in hHR23B gene. Similarly, upstream
region (between -121/+117 nts) of hHR23A gene was hypermethylated and cytosine
residue within the Sp1 binding site (-135/-126) in hHR23B gene in patient sample Rad32T.
Sample Rad17 has CpC methylation at position -116/-115 and methylated cytosine residue
within the Sp1 binding site (-135/-126) in hHR23A and hHR23B genes, respectively. The
summary of the methylation status and the histopathology of the samples analyzed in this
study are listed Table 5.7.
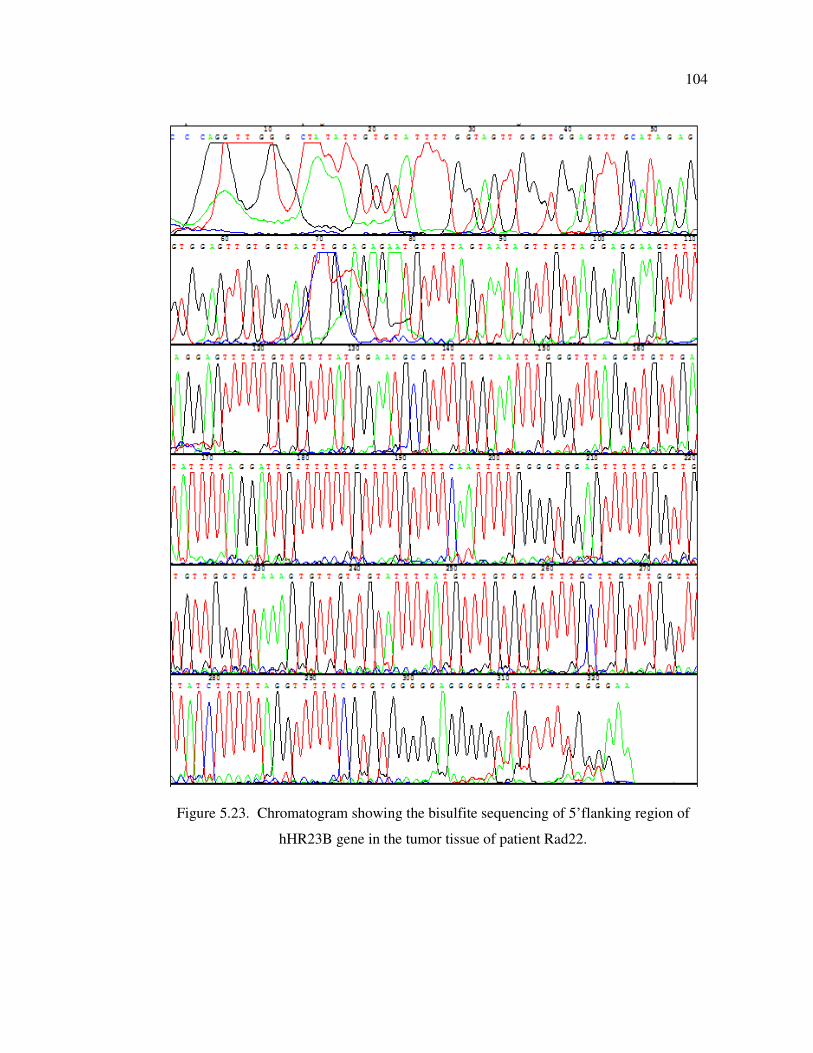
104
Figure 5.23. Chromatogram showing the bisulfite sequencing of 5’flanking region of
hHR23B gene in the tumor tissue of patient Rad22.
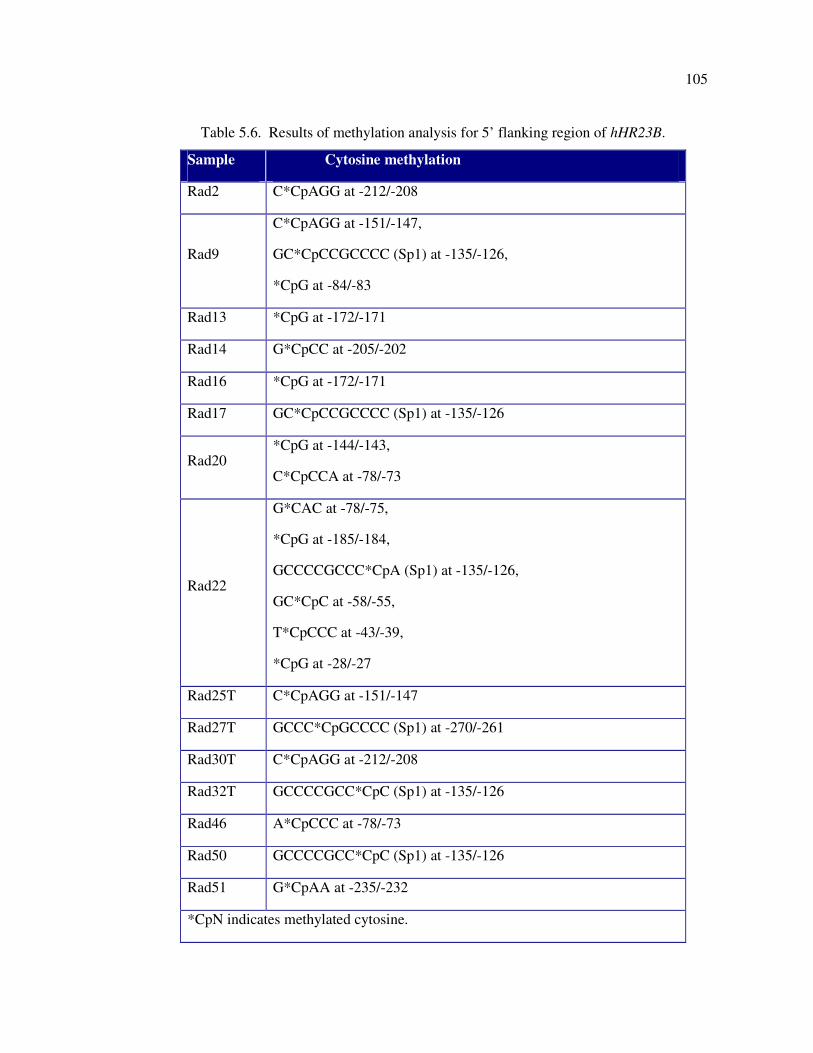
105
Table 5.6. Results of methylation analysis for 5’ flanking region of hHR23B.
Sample Cytosine methylation
Rad2 C*CpAGG at -212/-208
Rad9
C*CpAGG at -151/-147,
GC*CpCCGCCCC (Sp1) at -135/-126,
*CpG at -84/-83
Rad13 *CpG at -172/-171
Rad14 G*CpCC at -205/-202
Rad16 *CpG at -172/-171
Rad17 GC*CpCCGCCCC (Sp1) at -135/-126
Rad20 *CpG at -144/-143,
C*CpCCA at -78/-73
Rad22
G*CAC at -78/-75,
*CpG at -185/-184,
GCCCCGCCC*CpA (Sp1) at -135/-126,
GC*CpC at -58/-55,
T*CpCCC at -43/-39,
*CpG at -28/-27
Rad25T C*CpAGG at -151/-147
Rad27T GCCC*CpGCCCC (Sp1) at -270/-261
Rad30T C*CpAGG at -212/-208
Rad32T GCCCCGCC*CpC (Sp1) at -135/-126
Rad46 A*CpCCC at -78/-73
Rad50 GCCCCGCC*CpC (Sp1) at -135/-126
Rad51 G*CpAA at -235/-232
*CpN indicates methylated cytosine.
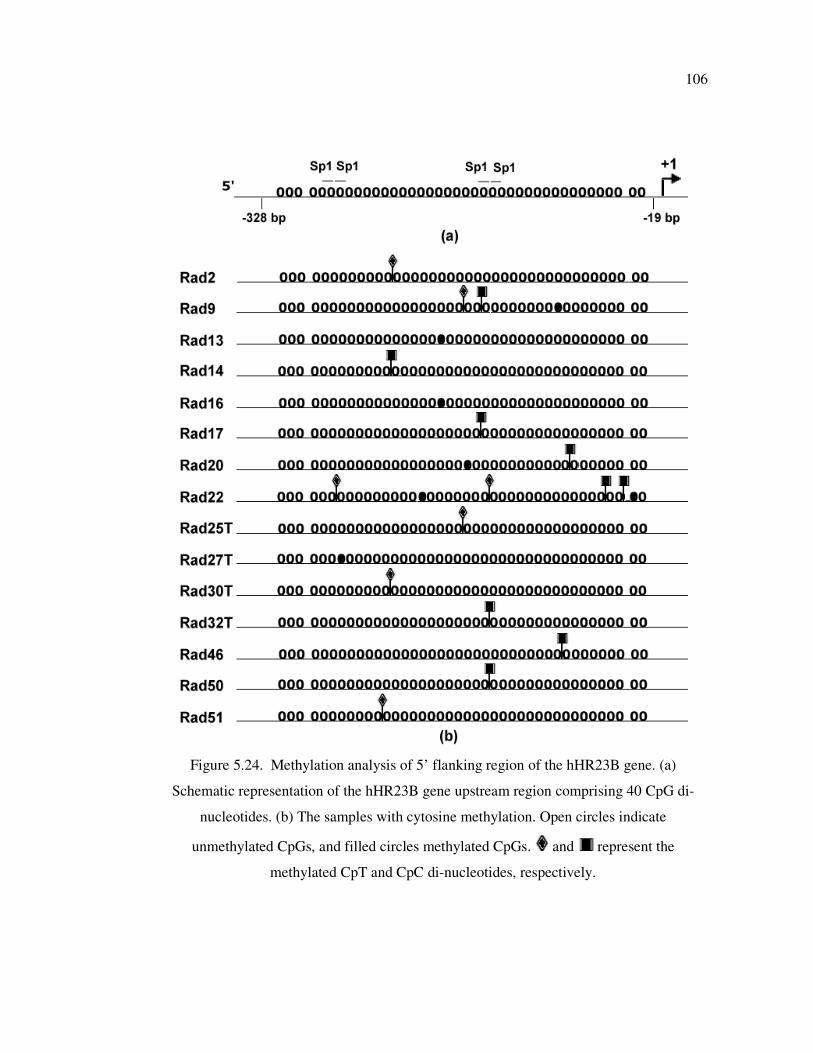
106
Figure 5.24. Methylation analysis of 5’ flanking region of the hHR23B gene. (a)
Schematic representation of the hHR23B gene upstream region comprising 40 CpG di-
nucleotides. (b) The samples with cytosine methylation. Open circles indicate
unmethylated CpGs, and filled circles methylated CpGs. and represent the
methylated CpT and CpC di-nucleotides, respectively.
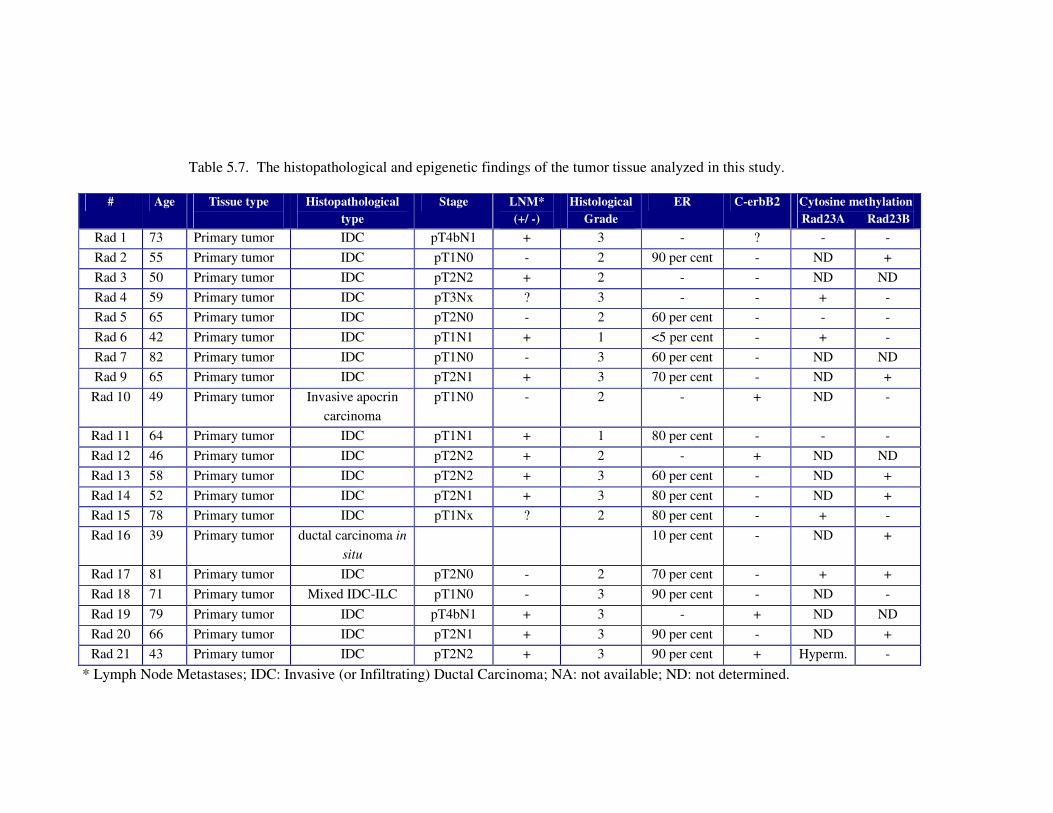
107
Table 5.7. The histopathological and epigenetic findings of the tumor tissue analyzed in this study.
# Age Tissue type
Histopathological
type
Stage LNM*
(+/ -)
Histological
Grade
ER C-erbB2 Cytosine methylation
Rad23A Rad23B
Rad 1 73 Primary tumor IDC pT4bN1 + 3 - ? - -
Rad 2 55 Primary tumor IDC pT1N0 - 2 90 per cent - ND +
Rad 3 50 Primary tumor IDC pT2N2 + 2 - - ND ND
Rad 4 59 Primary tumor IDC pT3Nx ? 3 - - + -
Rad 5 65 Primary tumor IDC pT2N0 - 2 60 per cent - - -
Rad 6 42 Primary tumor IDC pT1N1 + 1 <5 per cent - + -
Rad 7 82 Primary tumor IDC pT1N0 - 3 60 per cent - ND ND
Rad 9 65 Primary tumor IDC pT2N1 + 3 70 per cent - ND +
Rad 10 49 Primary tumor Invasive apocrin
carcinoma
pT1N0 - 2 - + ND -
Rad 11 64 Primary tumor IDC pT1N1 + 1 80 per cent - - -
Rad 12 46 Primary tumor IDC pT2N2 + 2 - + ND ND
Rad 13 58 Primary tumor IDC pT2N2 + 3 60 per cent - ND +
Rad 14 52 Primary tumor IDC pT2N1 + 3 80 per cent - ND +
Rad 15 78 Primary tumor IDC pT1Nx ? 2 80 per cent - + -
Rad 16 39 Primary tumor ductal carcinoma in
situ
10 per cent - ND +
Rad 17 81 Primary tumor IDC pT2N0 - 2 70 per cent - + +
Rad 18 71 Primary tumor Mixed IDC-ILC pT1N0 - 3 90 per cent - ND -
Rad 19 79 Primary tumor IDC pT4bN1 + 3 - + ND ND
Rad 20 66 Primary tumor IDC pT2N1 + 3 90 per cent - ND +
Rad 21 43 Primary tumor IDC pT2N2 + 3 90 per cent + Hyperm. -
* Lymph Node Metastases; IDC: Invasive (or Infiltrating) Ductal Carcinoma; NA: not available; ND: not determined.
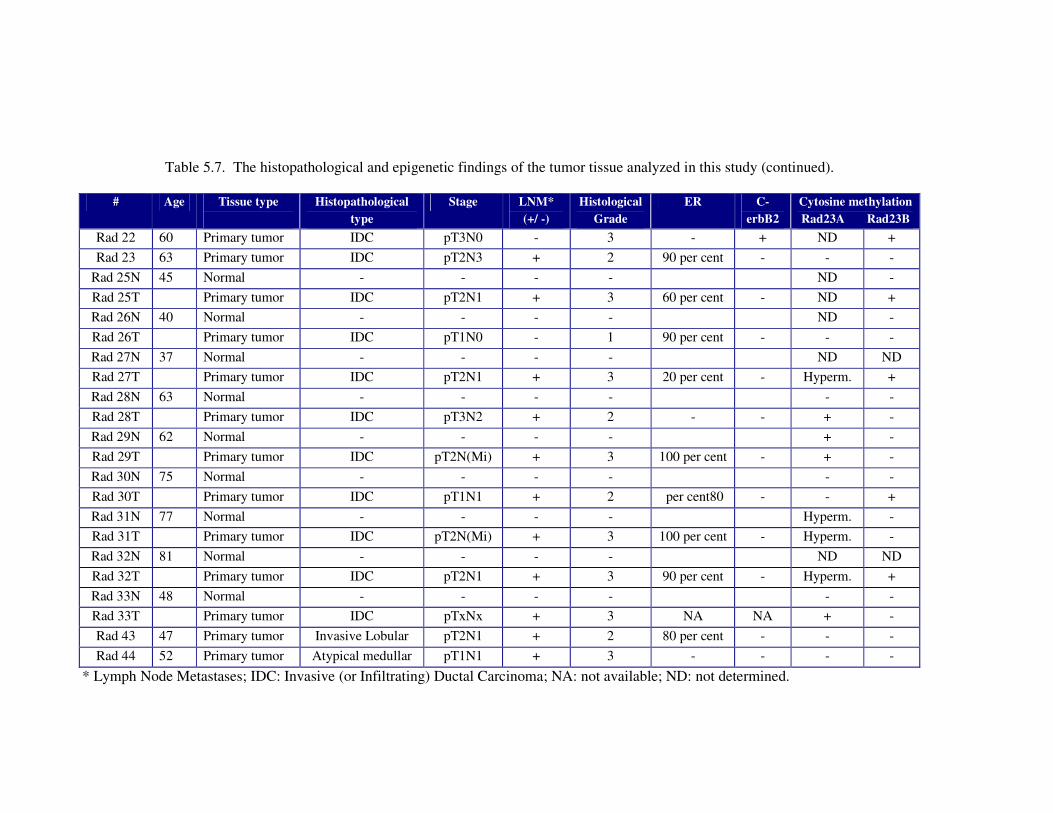
108
Table 5.7. The histopathological and epigenetic findings of the tumor tissue analyzed in this study (continued).
# Age Tissue type
Histopathological
type
Stage LNM*
(+/ -)
Histological
Grade
ER C-
erbB2
Cytosine methylation
Rad23A Rad23B
Rad 22 60 Primary tumor IDC pT3N0 - 3 - + ND +
Rad 23 63 Primary tumor IDC pT2N3 + 2 90 per cent - - -
Rad 25N 45 Normal - - - - ND -
Rad 25T Primary tumor IDC pT2N1 + 3 60 per cent - ND +
Rad 26N 40 Normal - - - - ND -
Rad 26T Primary tumor IDC pT1N0 - 1 90 per cent - - -
Rad 27N 37 Normal - - - - ND ND
Rad 27T Primary tumor IDC pT2N1 + 3 20 per cent - Hyperm. +
Rad 28N 63 Normal - - - - - -
Rad 28T Primary tumor IDC pT3N2 + 2 - - + -
Rad 29N 62 Normal - - - - + -
Rad 29T Primary tumor IDC pT2N(Mi) + 3 100 per cent - + -
Rad 30N 75 Normal - - - - - -
Rad 30T Primary tumor IDC pT1N1 + 2 per cent80 - - +
Rad 31N 77 Normal - - - - Hyperm. -
Rad 31T Primary tumor IDC pT2N(Mi) + 3 100 per cent - Hyperm. -
Rad 32N 81 Normal - - - - ND ND
Rad 32T Primary tumor IDC pT2N1 + 3 90 per cent - Hyperm. +
Rad 33N 48 Normal - - - - - -
Rad 33T Primary tumor IDC pTxNx + 3 NA NA + -
Rad 43 47 Primary tumor Invasive Lobular pT2N1 + 2 80 per cent - - -
Rad 44 52 Primary tumor Atypical medullar pT1N1 + 3 - - - -
* Lymph Node Metastases; IDC: Invasive (or Infiltrating) Ductal Carcinoma; NA: not available; ND: not determined.
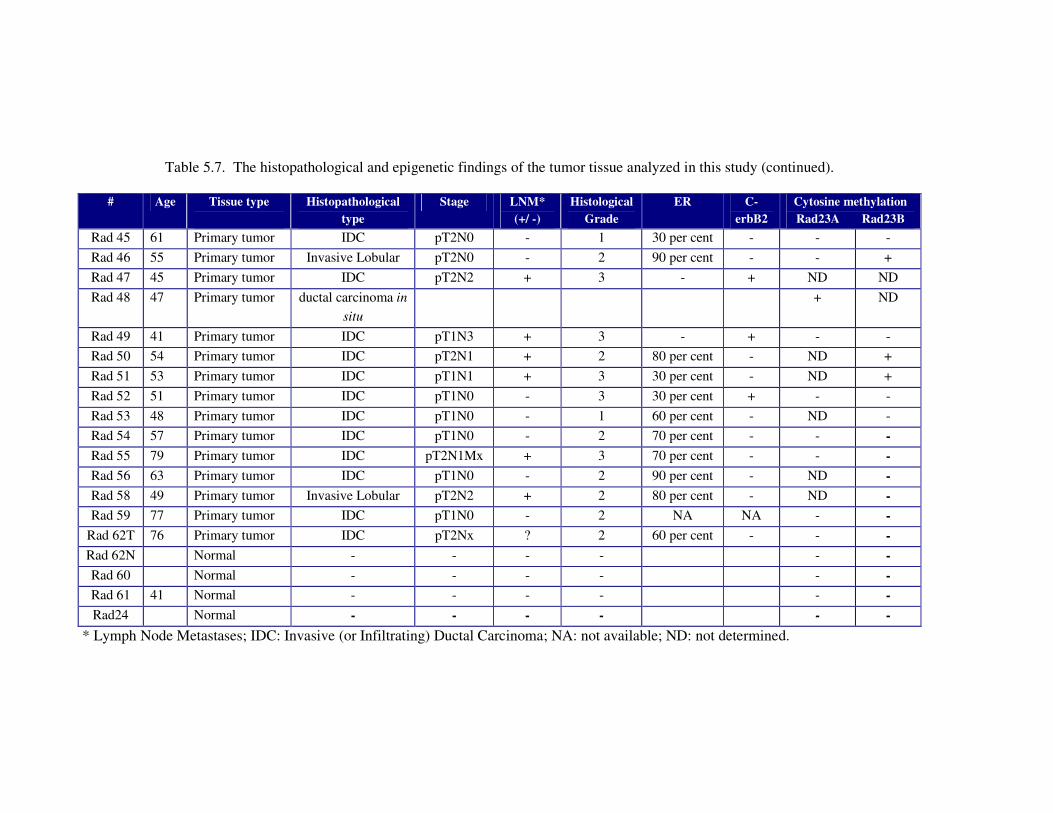
109
Table 5.7. The histopathological and epigenetic findings of the tumor tissue analyzed in this study (continued).
# Age Tissue type
Histopathological
type
Stage LNM*
(+/ -)
Histological
Grade
ER C-
erbB2
Cytosine methylation
Rad23A Rad23B
Rad 45 61 Primary tumor IDC pT2N0 - 1 30 per cent - - -
Rad 46 55 Primary tumor Invasive Lobular pT2N0 - 2 90 per cent - - +
Rad 47 45 Primary tumor IDC pT2N2 + 3 - + ND ND
Rad 48 47 Primary tumor ductal carcinoma in
situ
+ ND
Rad 49 41 Primary tumor IDC pT1N3 + 3 - + - -
Rad 50 54 Primary tumor IDC pT2N1 + 2 80 per cent - ND +
Rad 51 53 Primary tumor IDC pT1N1 + 3 30 per cent - ND +
Rad 52 51 Primary tumor IDC pT1N0 - 3 30 per cent + - -
Rad 53 48 Primary tumor IDC pT1N0 - 1 60 per cent - ND -
Rad 54 57 Primary tumor IDC pT1N0 - 2 70 per cent - - -
Rad 55 79 Primary tumor IDC pT2N1Mx + 3 70 per cent - - -
Rad 56 63 Primary tumor IDC pT1N0 - 2 90 per cent - ND -
Rad 58 49 Primary tumor Invasive Lobular pT2N2 + 2 80 per cent - ND -
Rad 59 77 Primary tumor IDC pT1N0 - 2 NA NA - -
Rad 62T 76 Primary tumor IDC pT2Nx ? 2 60 per cent - - -
Rad 62N Normal - - - - - -
Rad 60 Normal - - - - - -
Rad 61 41 Normal - - - - - -
Rad24 Normal - - - - - -
* Lymph Node Metastases; IDC: Invasive (or Infiltrating) Ductal Carcinoma; NA: not available; ND: not determined.
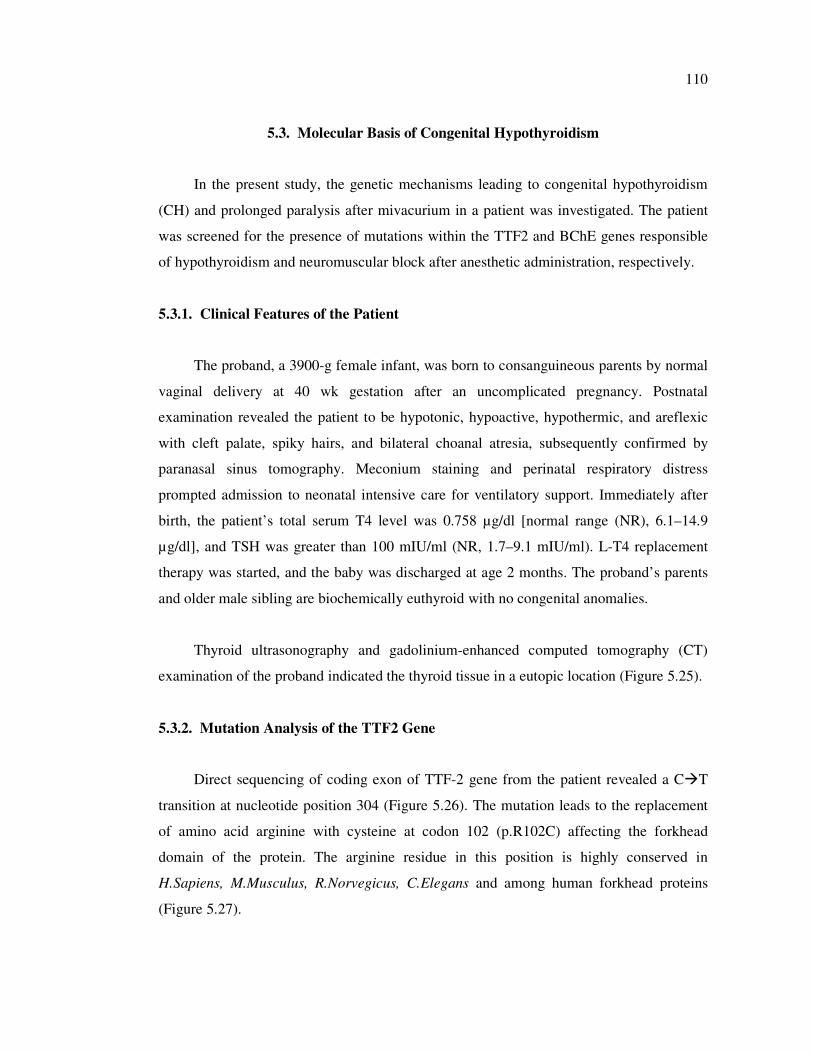
110
5.3. Molecular Basis of Congenital Hypothyroidism
In the present study, the genetic mechanisms leading to congenital hypothyroidism
(CH) and prolonged paralysis after mivacurium in a patient was investigated. The patient
was screened for the presence of mutations within the TTF2 and BChE genes responsible
of hypothyroidism and neuromuscular block after anesthetic administration, respectively.
5.3.1. Clinical Features of the Patient
The proband, a 3900-g female infant, was born to consanguineous parents by normal
vaginal delivery at 40 wk gestation after an uncomplicated pregnancy. Postnatal
examination revealed the patient to be hypotonic, hypoactive, hypothermic, and areflexic
with cleft palate, spiky hairs, and bilateral choanal atresia, subsequently confirmed by
paranasal sinus tomography. Meconium staining and perinatal respiratory distress
prompted admission to neonatal intensive care for ventilatory support. Immediately after
birth, the patient’s total serum T4 level was 0.758 µg/dl [normal range (NR), 6.1–14.9
µg/dl], and TSH was greater than 100 mIU/ml (NR, 1.7–9.1 mIU/ml). L-T4 replacement
therapy was started, and the baby was discharged at age 2 months. The proband’s parents
and older male sibling are biochemically euthyroid with no congenital anomalies.
Thyroid ultrasonography and gadolinium-enhanced computed tomography (CT)
examination of the proband indicated the thyroid tissue in a eutopic location (Figure 5.25).
5.3.2. Mutation Analysis of the TTF2 Gene
Direct sequencing of coding exon of TTF-2 gene from the patient revealed a C�T
transition at nucleotide position 304 (Figure 5.26). The mutation leads to the replacement
of amino acid arginine with cysteine at codon 102 (p.R102C) affecting the forkhead
domain of the protein. The arginine residue in this position is highly conserved in
H.Sapiens, M.Musculus, R.Norvegicus, C.Elegans and among human forkhead proteins
(Figure 5.27).
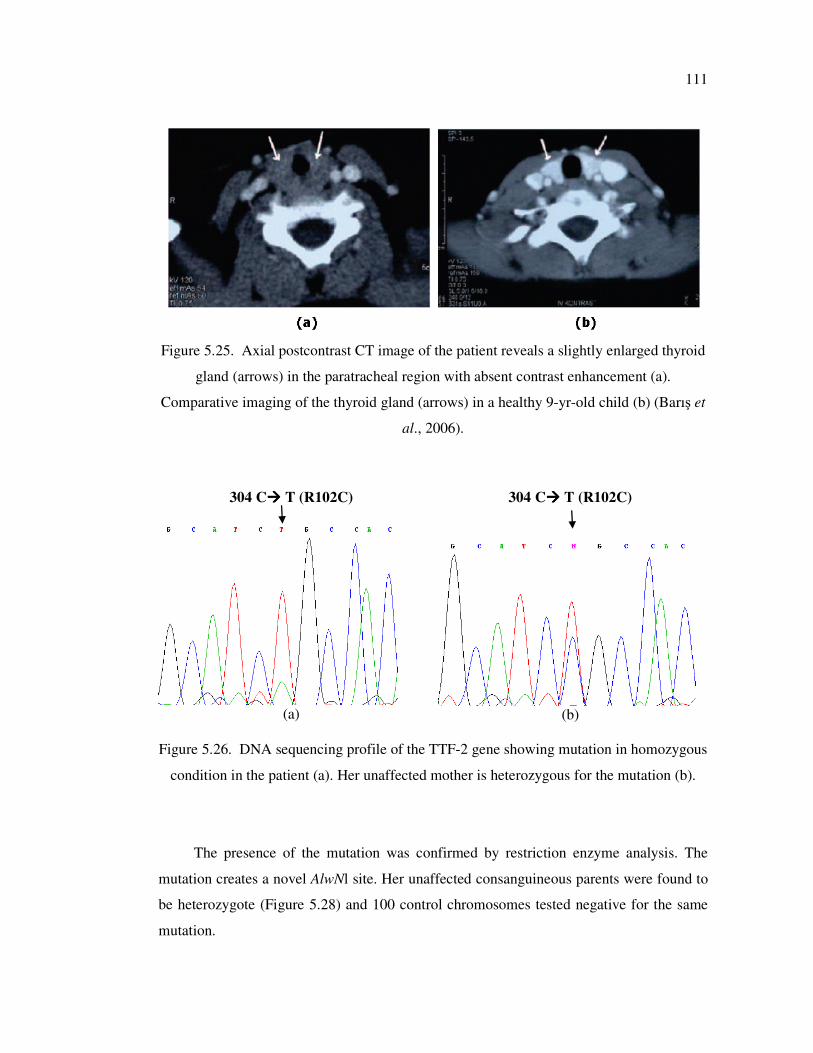
111
Figure 5.25. Axial postcontrast CT image of the patient reveals a slightly enlarged thyroid
gland (arrows) in the paratracheal region with absent contrast enhancement (a).
Comparative imaging of the thyroid gland (arrows) in a healthy 9-yr-old child (b) (Barış et
al., 2006).
304 C���� T (R102C)
(a)
304 C���� T (R102C)
(b)
Figure 5.26. DNA sequencing profile of the TTF-2 gene showing mutation in homozygous
condition in the patient (a). Her unaffected mother is heterozygous for the mutation (b).
The presence of the mutation was confirmed by restriction enzyme analysis. The
mutation creates a novel AlwNl site. Her unaffected consanguineous parents were found to
be heterozygote (Figure 5.28) and 100 control chromosomes tested negative for the same
mutation.
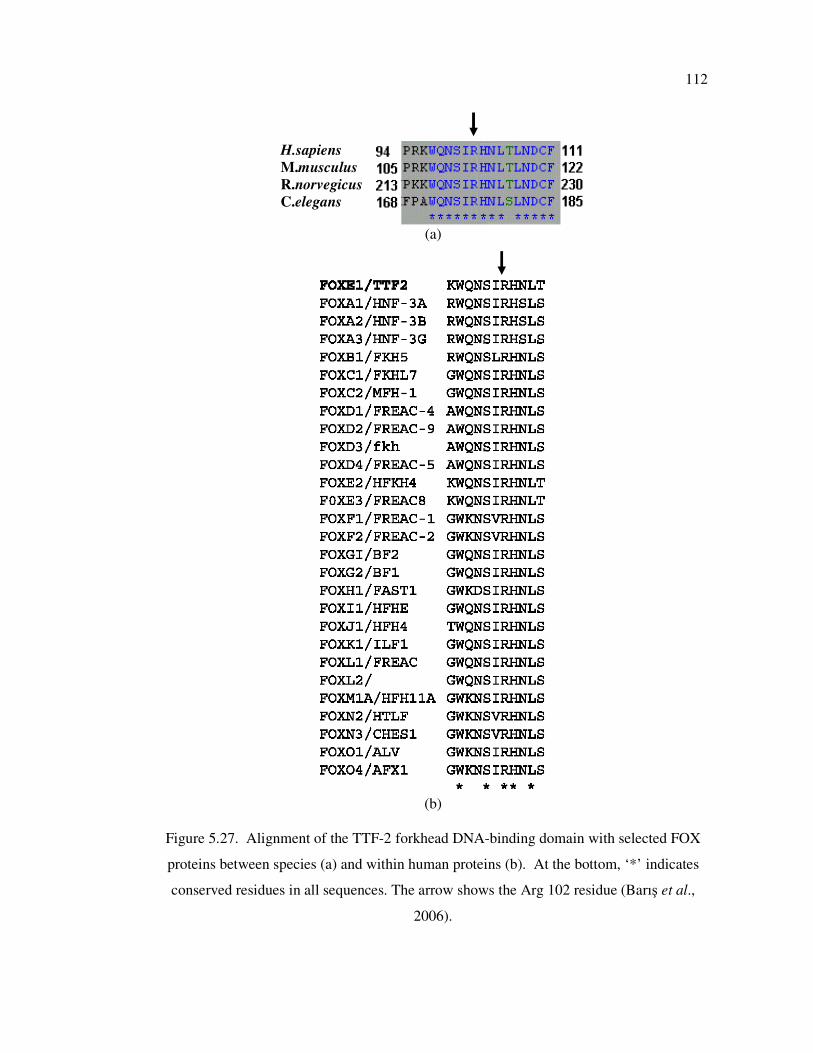
112
H.sapiens
M.musculus
R.norvegicus
C.elegans
(a)
(b)
Figure 5.27. Alignment of the TTF-2 forkhead DNA-binding domain with selected FOX
proteins between species (a) and within human proteins (b). At the bottom, ‘*’ indicates
conserved residues in all sequences. The arrow shows the Arg 102 residue (Barış et al.,
2006).

113
Figure 5.28. Two per cent agarose gel showing AlwNl digestion results for the patient and
her family members.
5.3.3. Functional Characterization
Functional analyses performed in University of Cambridge revealed that the
mutation is highly deleterious, with the p.R102C mutant protein exhibiting negligible DNA
binding and transcriptional activity (Barış et al., 2006).
5.3.4. Mutation Analysis of Butyrylcholinesterase (BChE) Gene
Patients with CH are candidates for multiple operations due to midline defects (cleft
palate and choanal atresia). When our CH patient was a 3-month-old baby, a gastrostomy
was required because of a severe nutritional problem secondary to cleft palate. After
operations, the patient showed prolonged neuromuscular block (paralysis) for four hours
after a single dose of mivacurium as a muscle relaxant. BChE activity was measured and
the proband was found to have a marked decrease in BChE activity compared with her
parents and brother. The enzyme activities were 408 IU/1 for patient, 4953 IU/l for mother,
671 bp
599 bp
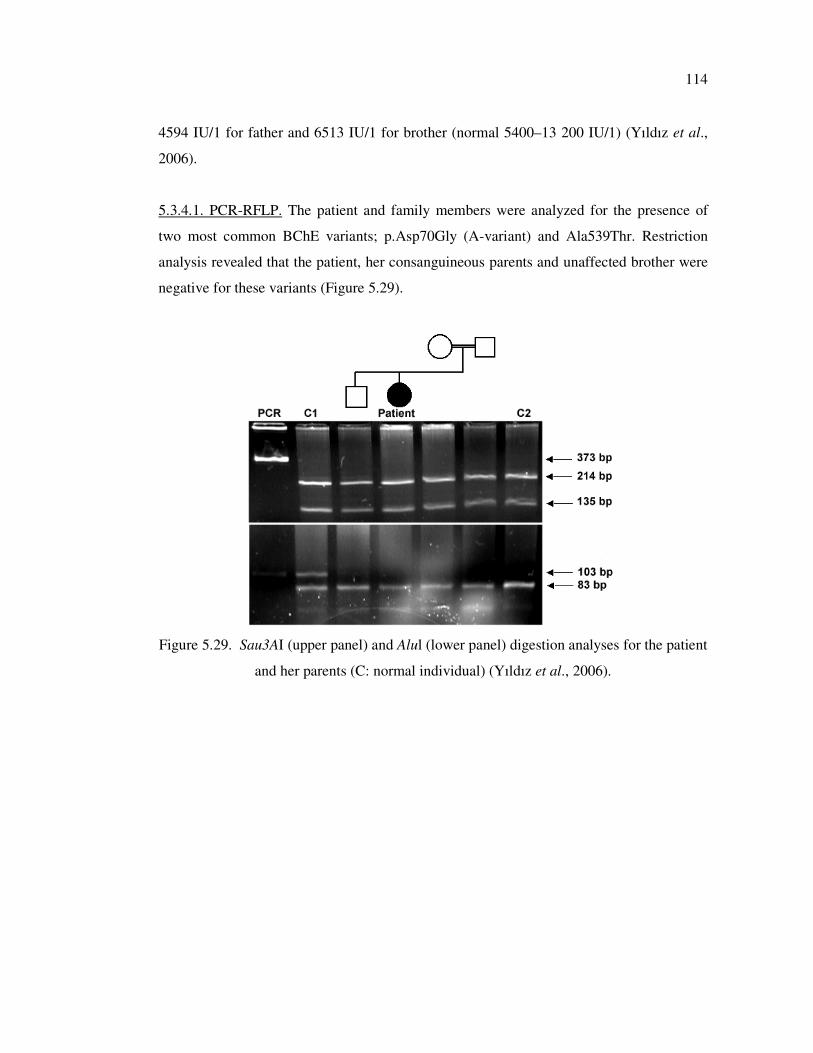
114
4594 IU/1 for father and 6513 IU/1 for brother (normal 5400–13 200 IU/1) (Yıldız et al.,
2006).
5.3.4.1. PCR-RFLP. The patient and family members were analyzed for the presence of
two most common BChE variants; p.Asp70Gly (A-variant) and Ala539Thr. Restriction
analysis revealed that the patient, her consanguineous parents and unaffected brother were
negative for these variants (Figure 5.29).
Figure 5.29. Sau3AI (upper panel) and Alul (lower panel) digestion analyses for the patient
and her parents (C: normal individual) (Yıldız et al., 2006).
115
6. DISCUSSION
Epidemiological studies promise to provide correlative data to permit researchers
understand the etiology of human diseases and develop efficient genetic testing assays.
Additionally, the accumulated data of genotyping, expression profiling and proteomics
allows disease diagnosis, to understand the molecular mechanisms leading to the disease
pathogenesis, and to develop efficient therapeutic approaches. In the framework of this
thesis, we have investigated genetic and epigenetic changes and provided genotype-
phenotype correlations to unravel the molecular mechanisms that lead to three different
diseases, Rett Syndrome, breast cancer, and congenital hypothyroidism. To our knowledge,
it is the first study on genetic basis of Rett Syndrome in our population. The results of this
analysis revealed that gene dosage can be a mechanism that leads to this devastating
genetic/epigenetic disease. Investigation of epigenetic changes in two human repair genes
has shown CpG and non CpG methylation in tumor samples of breast cancer patients that
was important with respect to the available literature. Identification of the causative
mutation in the CH patient and its functional study with a collaborative work also helped to
understand the genetic mechanisms and provided original evidence that implicated
differential effects of TTF-2 mutations on downstream target genes required for normal
human thyroid organogenesis. These and other findings are discussed below in respective
sections for each disease.
6.1. Molecular Basis of Rett Syndrome
In the framework of this study, the genetic basis of Rett Syndrome (RTT) was
investigated in a total of 71 patients. A heterogeneous spectrum of disease-causing
mutations was identified in 68.2 per cent of a clinically well defined group of cases. Our
results showed that exon duplication/deletions that could not be detected by standard
techniques contribute to 19.3 per cent of these MECP2 mutations. Only 12.5 per cent of the
patients, referred for differential diagnosis, were positive for MECP2 gene mutations
suggesting that this gene does not represent a major cause of the disease among patients
with Rett-like features. Comparison of the clinical severity scores of patients with respect
116
to the presence, type and location of mutation in the gene MECP2, in addition to the
pattern of XCI did not reveal a statistically significant correlation.
The molecular analysis revealed 18 different mutations in 30 of 44 (68.2 per cent)
female patients in the first group of classical/atypical RTT cases with detailed clinical data.
Of the 30 patients with mutations, 10 had a missense, eight had a nonsense mutation, six
had small nucleotide deletion/insertions. MECP2 exon rearrangements were identified in
six female patients; three patients with exon 2-4 duplications (R14, R19, R20) and three
patients with exon 3 and/or exon 4 deletions (R5, R23, R30). In patient R33, exon
duplication identified by Real Time analysis could not be verified by QF-PCR.
The deletions, we have identified in three classical RTT female patients, affect the
MBD and TRD domains of the MECP2 protein. For these patients, it is highly unlikely that
the protein produced from the mutant allele (if any) would have residual function thus they
can be expected to be associated with severe phenotypes. Although Archer et al. (2006)
noted that their deletion group was clinically indistinguishable from other mutation-
positive RTT patients, the patients in our study presented higher clinical severity scores
than all other mutation-positive patients. The differences in severity were not significant
(8.33±0.58 vs 6.70±1.57, p=0.066), but the findings were in accordance with the data of
Hardwick et al. (2007) and Scala et al. (2007). When we performed statistical analysis of
severity scores for specific clinical features, we obtained a significant difference in the
field of ‘‘gait function’’ (p=0.016), since none of patients with MECP2 exon deletions
have ever walked.
The c.856delA and c.826-829delGTGG deletions identified in patients R3 and R49,
respectively, present novel small deletions in exon 4. They cause a frame-shift introducing
a premature stop codon at position 288 in TRD domain of the protein and probably alter
the ability of the protein to recruit co-repressor complexes and affect its function in the
process of transcription repression. The third novel frame-shift mutation due to one-bp
deletion (c.744delG), in patient R46, creates a stop codon at the beginning of TRD domain
(p.Ser194fsX208) and causes lack of both TRD and NLS domains. It is known that MBD-
containing mutant proteins without TRD might accomplish some degree of silencing,
either by recruiting the silencing complex by a TRD-independent mechanism or by directly
117
interfering with binding of transcription factors (Ballestar et al., 2000). However, loss of
NLS and TRD domains in the case of p.Ser194fsX208 mutation might interfere with
proper localization to nucleus and its functioning. The novel deletions in the other patients
(R2, R8, and R42) hypothetically affect the C-terminal domain of the protein and may give
rise to nonfunctional proteins. The c. 1156-1192del36 (p.Leu386Hisdel12) mutation in
patients R2 and R42 are small deletions, however, the mutation in patient R8 causes in a
frame-shifted protein starting from Lys345 residue (p.K345fs). Patient R8 is more severely
affected in all respects compared to patient R2 and R42, with shorter period of normal
development, earlier appearance of epileptic seizures, abnormal gait function with a
severity score of 9 versus 7 and 5, in accordance with previous findings for C-terminal
deletion mutations (Smeets et al., 2005).
In this study, exon duplications were identified in two patients with early seizure and
in one with congenital variant of RTT. Although the extent of the duplications and whether
they are tandem repeats could not be investigated, we have shown the duplication of exons
that are known to be the expressed. Thus, it is the first report implicating gene duplications
as causative mutations in female atypical RTT cases. Previously, one female patient with
PSV variant of RTT.has been reported to carry three copies of exon four of the MECP2
gene (Ariani et al., 2004). In addition to this finding, Meins et al. (2005) has shown that
duplication in Xq28 causes increased expression of the MECP2 gene in a boy with features
of Rett Syndrome. Collins et al. (2004) has developed a mouse model that transgenically
over-expressed MECP2 under the endogenous human promoter. These mice developed
seizures, hypoactivity and spasticity with several other progressive neurological
abnormalities. These results support the possibility that duplication of MECP2 may lead to
increased expression and underlie some cases of X-linked delayed-onset neurobehavioral
disorders including Rett Syndrome. It can be suggested that gene duplications might cause
a gain of function rather than a loss of function via (i) repressing its target genes strongly,
(ii) preventing their derepression, and/or (iii) repress novel genes that are not the targets in
normal cellular conditions. The latter mechanism may be more likely considering the fact
that all of our patients with exon duplications present additional neurodevelopmental
symptoms leading to atypical phenotypes. Interestingly, eye contact is very difficult to
obtain in these patients when compared to that of patients with missense mutation
118
(p=0.016). Further analysis should be performed to unravel the pathogenic mechanism
caused by these duplications.
Previous studies suggest that patients with missense mutations tend to have
significantly milder disease than patients with truncating mutations (Cheadle et al., 2000;
Colvin et al., 2004). On the basis of statistical analysis, no significant correlation could be
inferred between the overall disease severity and the type of the mutation in our cohort of
patients. However, the patients with exon deletions or nonsense mutations affecting the
TRD domain of the protein had higher clinical severity scores. Mutation negative patients
and patients with skewed XCI patterns had slightly milder phenotypes whereas mutation
positive patients had severe problems in their ability in purposeful hand movement and
walking skills.
It has been shown that there is a tendency for skewing of XCI in lymphocytes in
RTT patients when compared with age-matched controls. Our data is also suggestive for
skewed XCI pattern to confer a protective effect on the phenotype especially for severe
mutations that lead to production of truncated MECP2 protein. Among our 12 patients
presenting skewed XCI pattern along with MECP2 mutations, 10 of them had
nonsense/deletion/insertions, and only two of them had missense (p.R306C and p.T158M)
mutations. Although we could not show that there is a statistically significant relationship
between severity and XCI pattern by mutation, patients with the same mutation and
different XCI status had clinical variability. In this situation, each individual might be
expected to have differences in inter-tissue and intra-tissue XCI status, as is sometimes
observed in mouse models (Young et al., 2004; Gibson et al., 2005).
The MECP2 mutation detection rate was higher in the first group subjects (68.2 vs.
12.5 per cent). Furthermore, 26 patients of this group were diagnosed using a stringent
criteria and the mutations were identified in 79 per cent. Our results show that a strict
adherence to the RTT criteria and careful evaluation of the patients improve the rate of
MECP2 mutation detection. The diagnosis of RTT is mainly based on clinical criteria and
this is a critical step to decide or not to offer genetic testing. From a socio-economic point
of view, the use of efficient and well defined clinical criteria is very important since the
119
cost of MECP2 testing is high. Currently, the cost varies from $300 to $600 and is higher
than the official minimum wage in Turkey.
Mutation analyses revealed a total of 31 pathogenic variations of which 15 of 31 (48
.4 per cent) detected by PCR-RFLP, 10 of 31 (32.3 per cent) by SSCP-DNA sequencing
and 6 of 31 (19.3 per cent) by quantitative PCR assay. Thus, the PCR-RFLP method can be
used as a preliminary step to detect the most common mutations observed in MECP2 gene
in Turkish RTT patients. Our results showed that exon duplication/deletions contribute to
19.3 per cent of MECP2 mutations, and these rearrangements escape the PCR-based
screening strategy. Quantitative analysis of this gene should also be considered in RTT
patients, in order to determine the actual significance of the MECP2 gene in the etiology of
RTT.
With excluding 6 exon duplication/deletions, nearly 80 per cent (20 of 25) of the
point or small deletion/insertion mutations were detected in the exon 4 of the MECP2
gene. The rest of the mutations (20 per cent) were located within exon 3. This finding
suggests that the mutation in MECP2 exon 1 and 2 appears to be rare in Turkish RTT
patients and an initial analysis of exon 4 would provide the most efficient approach in a
mutation detection protocol.
Huppke et al. (2003) recommend using a cutoff point of 8 for genetic testing to
exclude girls with MECP2-negative results from the test. However, the two patients with
exon duplications (patients R19 and R20) and the patient R22 with p.R106W mutation had
Huppke scores of 5-7, implicating that genetic diagnosis should be performed even when
the scores are lower than 8.
In three prenatal diagnostic tests performed, both chorionic biopsy specimens and
parents were tested and found to be negative for the index patient’s mutation. Germ line
mosaicism of MECP2 mutations is an important problem in genetic counseling for both
familial and sporadic RTT cases (Yaron et al, 2002). In the recent literature, Caselli et al.
(2004) reported nine cases that were evaluated for prenatal diagnosis. Only one fetus
carried the same mutation with affected sister (1/9, 11 per cent) and the pregnancy was
terminated. Although the majority of the patients have de novo mutations, the prenatal
120
diagnosis might be offered for the family with RTT daughter and the parents should be
informed about the possibility of germ line mosaicism.
Pathogenic sequence variations could not be identified in 14 of 44 (31.8 per cent)
sporadic female patients in the first group. These patients may have MECP2 mutations in
the promoter region or introns introducing novel splice sites that could not be detected by
PCR-SSCP analysis. RTT can be a genetically heterogeneous disorder, and other causative
genes might exist. Several recent studies identified mutations in the CDKL5 gene (OMIM
300203) encoding cyclin-dependent kinase like 5 in patients with an atypical, early seizure
variant of RTT (Weaving et al., 2005; Evans et al., 2005; Scala et al., 2005). Thus,
mutation screening of CDKL5 should be performed in MECP2 gene mutation-negative
patients with early-seizure variant of RTT. Finally, we suggest that quantitative analysis of
MECP2 has to be considered in especially RTT variants in order to determine the actual
significance of the gene in the etiology of RTT.
6.1.1. Multiplexed ARMS-PCR Approach for the Detection of Common MECP2
Mutations
In the present study, we have described the development and validation of a
multiplexed multiplex amplification refractory mutation system (ARMS) - PCR assay for
identification of seven common mutations that accounts for almost 65 per cent of all
MECP2 gene mutations (RettBASE). So far, these mutations could be investigated using
PCR-RFLP or DNA sequencing techniques. Although appropriate, DNA sequencing is not
well suited for routine use in a clinical laboratory; it is cumbersome, time-consuming, and
technically demanding. Carvalho et al. (2006) have described a multiplex minisequencing
technique for the detection of most common 10 mutations. This assay allows detection of
p.R106W, p.A140V and p.G269fs mutations in addition to our assay. However, reagent
and equipment costs of minisequencing PCR limit the implementation of this assay into
research laboratories. Our multiplex ARMS-PCR assay offers a straightforward,
inexpensive, and accurate alternative method. Each mutation-specific primer pair was
designed to produce a different-sized fragment, so that the mutation in the sample can be
identified unambiguously after agarose gel electrophoresis.
121
The seven MECP2 mutations included in this assay were selected based on their
frequencies in RettBASE database. It is possible that the prevalence of the included
mutations may vary among RTT patients from different populations. However, the assay
could be improved by the inclusion of primer sets for detection of additional pathogenic
mutations. For example, Kim et al. (2006) and Yamada et al. (2001) did not identify the
mutation p.R106W in Korean and Japanese patients, respectively, but the same mutation
accounted for 5-6 per cent of the mutations in French and German RTT patients,
respectively (Bienvenu et al., 2002; Laccone et al., 2001). An ARMS assay was also
designed and tested the for the p.R106W mutation, however, it could not be implemented
to the panels. This mutation can be tested independently from the multiplex assay.
A well-designed ARMS multiplex requires compatible primer sequences in
appropriate concentrations. Optimization of the PCR reaction, started with equimolar
primer concentrations (10 pmol), revealed uneven amplification of the products, with some
of the alleles barely visible. This problem was overcome by increasing the concentration of
primers for the ‘weak’ loci and decreasing for the ‘strong’ loci. The specificity of the
primer sets used was also found to be highly critical to ensure clear discrimination between
target and non-target genomic sequence to avoid any ambiguity of detection. Primer
dimers and nonspecific allelic noise was observed with primers for p.T158M and p.R168X
mutations. These nonspecific bands could be eliminated by introducing a mismatch at the
3′ end of the allele-specific primers. As for any multiplex PCR, we recommend that users
optimize the conditions, especially the primer concentrations for each set, in their
laboratory.
In conclusion, the multiplex ARMS test is an efficient and cost-effective screen for
molecular genetic testing of patients with RTT. It is a simple and reliable test that does not
require any specialized equipment and can be completed in 1–2 days upon receiving the
sample.
122
6.1.2. The Effect of DNA Concentration on Reliability and Reproducibility of SYBR
Green Dye-based Real Time PCR Analysis to Detect the Exon Rearrangements
Up to date more than 200 different mutations of MECP2 have been reported in
patients with classical and atypical RTT (RettBASE). MECP2 exon rearrangements are
very frequently observed and identified in 2.9- 14 per cent of patients with RTT.
Previously, the identification of MECP2 gene rearrangements was carried out by
traditional methods including Southern blotting, fluorescent in situ hybridization (FISH),
and Long-Range PCR and subsequent DNA sequencing analysis. So far, no
rearrangements of the MECP2 gene have been identified by FISH and these approaches are
time-consuming and may suffer from a limited sensitivity (e.g., the size of
rearrangements). To overcome these problems, rapid and sensitive PCR based assays
including quantitative fluorescent PCR (QF-PCR), robust dosage PCR (RD-PCR), and
multiple ligation-dependent probe amplification (MLPA) have been developed. In these
methods, end-point PCRs are accomplished in 20–25 cycles, when amplification is
supposed to be in its exponential phase such that a linear relationship between quantities of
template DNA and PCR products is maintained. These assays should be considered semi-
quantitative since the actual amplification profile of the reaction is based on a theoretical
assumption. Real-time PCR was specifically developed to quantify specific DNA targets
through the monitoring of product formation. This technology has been successfully
applied for the detection of hemizygous deletions or duplications in different genetic
disorders. Recently, quantitative real-time PCR assays based on SYBR Green I dye and
TaqMan probe has been developed for the detection of deletions/duplications of the
MECP2 gene (Ariani et al., 2004; Laccone et al., 2004).
Several studies have shown that DNA extraction methods, presence of inhibitors and
inefficient homogenization of the sample may lead to false negative results. This may lead
to reduced efficiency of real time PCR reaction and underestimation of the quantity of the
target DNA upon reaction. The purpose of our study was to analyse the effect of DNA
concentration on reliablity and reproducibility of SYBR green dye-based real time PCR
analysis to detect the exon rearrangments.
123
We have tested normal DNA samples along with duplication and deletions using six
different DNA concetrations (ranging from 0.1 to 200 ng) in triplicate measurements. The
expected copy number ratio (± 2SD) was obtained in all cases when DNA concentration is
between 1 to 50 ng. The ratio was out of expected range in six and four of 15
measurements with 0.1 and 100 ng DNA, respectively, and led to misgenotyping of the
samples. Expected copy number could never be obtained with 200 ng DNA. These results
suggested that Real Time PCR analysis might not be reliable for determination of the exon
copy number with DNA in the range of 1-50 ng.
The effect of the DNA concentration on the amplification efficiency and specifity
could be observed in amplification curve and melting curve analysis. Using high DNA
concentrations (100–200 ng) resulted in inhibition of the amplification and/or nonspecific
product formation in some cases. For dilute DNA samples several hypotheses have been
proposed to explain misgenotyping. The first issue is the apparent labiality (instability) of
the DNA upon prolonged storage periods at low concentrations. Ellison et al. (2006) has
shown that plastic tube had a strong effect on measured DNA concentration at
concentrations below 100 genome equivalents. Teo et al. (2002) has observed fluctuations
in the concentration of standard solutions even after short time storage in eppendorf tubes
due to binding of DNA to the tube walls. Secondly, due to the stochastic distribution of
molecules at very low copy number, a sampling error can be introduced when pipetting
aliquots of DNA. Measurement variability at low DNA concentration has been
demonstrated by the observation that the confidence intervals (representing the
measurement uncertainty) associated with amplification from low initial copy numbers of
template are much greater than those with high initial copy numbers (Peccoud and Jacob,
1996).
Additionally, we have compared the results obtained using comperative Ct and
standard curve methods. A paired sample t-test showed that the results by both methods
were significantly similar (P = 0.451>0.05). In addition, the Pearson correlation coefficient
of 0.996 (P = 1E-6 <0.01) demonstrated the equivalence of both methods.
Our study shows that data obtained by the standard curve method and by the
comperative Ct method are equally reliable and correlate extremely well. However, the
124
comperative Ct method appers to be more convenient and efficient to analyze the exon
rearrangments in real time PCR experiments. First, it improves the productivity by
eliminating the time and effort required to prepare the standards and set up the standard
curves. Second, the Ct method reduces the overall cost of assays by reducing the number
of reactions run each time and thereby sparing expensive reagents. The only disadvantage
of comperative Ct method is use of a single calibrator (reference) DNA sample and the
contamination of target DNA with salt, phenol, chloroform and/or ethanol that may cause a
low PCR efficiency and miscalculations. In case of standard curve method, serial dilution
of the reference sample will also dilute these inhibitors and decrease its effect on the PCR
reaction, thereby increasing the PCR efficiency with each dilution step.
6.2. Methylation Analyses of the Putative Promoter Region of hHR23 Genes in
Breast Tumor Tissues
Carcinogenesis is a multistep process composed of genetic and epigenetic alterations
involving proto-oncogenes, tumor suppressor genes, cell-cycle regulator genes, tissue-
invasion-related genes, or mismatch repair genes. Aberrant cytosine methylation of CpG-
rich sites was regarded as an epigenetic mechanism for the transcriptional silencing of
several repair genes (BRCA1, hMLH1, O6-MGMT, TDG, and WRN) in different types of
cancer including breast carcinoma. Recently, Peng et al. (2005) has shown that hHR23B
gene, a key component in nucleotide excision repair pathway, was epigenetically silenced
in Interleukin-6-responsive Multiple Myeloma KAS-6/1 cells lines. This latter finding
prompted us to investigate the methylation status of hHR23B and its homolog hHR23A
gene in tumor tissues. Additionally, the following cellular functions of both hHR23A and
hHR23B make them candidate tumor susceptibility genes: (1) hHR23A/B were also shown
to participate not only in NER but also in base excision repair (BER) pathway; (2) The
hHR23BKD cell lines and hHR23A/B KO mice exhibit severe UV sensitivity and NER
deficiency; (3) hHR23A/B are involved in induction and stability of the damage-signaling
tumor-suppressor protein p53; and (4) hHR23B was shown to be required for genotoxic-
specific activation of p53 and apoptosis.
In this study, we have analyzed the methylation status of 5’ flanking regions
(including the CpG islands and putative promoter sequence) of hHR23A and hHR23B
125
genes in primary breast tumor, tumor adjacent tissues, and normal breast tissues in order to
investigate their possible involvement in breast carcinogenesis.
First of all, we have characterized the CpG islands and the putative promoter region
in the 5' flanking region of the hHR23A and hHR23B genes using web-based analysis.
MethPrimer and PROSCAN softwares revealed two CpG islands (at positions -580/-454
and -341/-55 nts) and a putative eukaryotic Pol II promoter region within the second CpG
island (position -48 to -298 nts) with a score of 98.79. The promoter region lacks the
CCAAT and TATA-like elements, a common feature of the house-keeping genes. The
analysis revealed potential binding sites for the transcription factor Sp1 (two sites),
ATF/CREB, Elk-1 and two M22 motifs (5’-TGCGCANK-3’). The analysis of 5’ flanking
region of hHR23B gene revealed a CCAAT and TATA- box lacking putative Pol II
promoter sequence (from position -14 to -264 nts with a score of 217.35) containing four
Sp1 binding sites.
The lack of TATA and CAAT boxes, the presence of high C+G content and Sp1
binding sites in the hHR23A and hHR23B promoters are typical features of house-keeping
genes. Yang et al. (2007) has shown that three transcription factor binding motifs, Sp1,
Elk-1, and M22 are preferentially found in promoters that lack TATA elements. TATA-
less promoters are generally enriched in the Sp1 motif that can direct weak transcription
initiation from Transcription Start Site in vitro from core promoters.(Smale and Kadonaga,
2003). Elk-1, an ETS domain transcription factor of the TCF (ternary complex factor)
subfamily, is known to be involved in the regulation of immediate-early genes such as c-
fos upon mitogen activation, and thus commonly implicated in cell proliferation. The M22
motif (5’-TGCGCANK-3’) is the most intriguing one because its potential role in
regulation of TATA-independent transcription is not known. The ATF family of
transcription factors can form either homodimers or heterodimers with c-Jun and
subsequently bind to the cyclic AMP response element (CRE) (5’-TGACGTCA-3’) (van
Dam et al., 1993). The transcription factor ATF-2 is a nuclear target of stress-activated
protein kinases (such as p38), that are activated by various extra-cellular stresses, including
UV light, osmotic stress, hypoxia, and inflammatory cytokines (Morrison et al., 2003).
ATF-2 plays a critical role in hypoxia- and high-cell-density-induced apoptosis, growth
control, and the development of mammary tumors. The ATF-2 mRNA levels in human
126
breast cancers were lower than those in normal breast tissue (Maekawa et al., 2007). Since
hHR23A was shown to interact with stress-related factors (eEF1A, Hsp70, and Hsp71)
(Chen and Madura, 2006), it might be a novel target of stress-activated protein kinases via
the transcription factor ATF.
The methylation status of the CpG islands was investigated by bisulfite-sequencing
method. Semi-nested PCR strategy was used to amplify the bisulfite modified DNA
samples. PCR fragments could be produced in 38 samples for hHR23A gene and 58
samples for hHR23B gene out of 61 samples tested. The failure in amplification might be
due to poor-quality of DNA samples. It is known that the extraction of high-quality nucleic
acid from formalin-fixed tissues might not be possible because of cross-linking between
proteins and DNA. The fixation and paraffin embedding processes might also damage the
DNA. Additionally, formalin-fixed tissues undergo degradation possibly because of an
inadequate neutralization of the formalin, eventually resulting in acid depurination. The
acid is known to depurinate the DNA and destroy its structure, thus preventing
amplification (Goelz et al., 1985). In retrospective studies using fixed tissues, the primers
must be carefully chosen to generate smaller amplification products, because larger DNA
fragments are more difficult to amplify (Rivero et al., 2006). This is in accordance with our
results that amplification of hHR23B gene was more successful than hHR23A gene (95%
vs 62%) since the hHR23B primers generated smaller PCR products. The agarose gel
electrophoresis showed that paraffin embedded tissue DNAs are more fragmented when
compared to DNAs isolated from peripheral blood supporting the findings of poor
preservation and high degradation of DNA extracted from fixed tissues.
The methylation status of hHR23A and hHR23B genes could be determined in 35 of
38 and 51 of 58 samples, respectively. Briefly, methylation analysis of 5’ flanking region
of hHR23A gene revealed cytosine methylation in 12 tumor and 2 tumor adjacent tissues.
Hypermethylation was observed in four tumors (from patients Rad21, 27T, 31T, and 32T)
and one tumor adjacent tissue sample (Rad31N). Two patients (Rad17 and 28T) have
single CpG methylation and seven patients (Rad4, 6, 15, 29T, 29N, 33T, and 48) have non-
CpG methylation. Cytosine methylation (CpG and non-CpG) in the upstream of hHR23B
gene was observed in 15 tumor tissues. CpG methylation was observed in six patients
(Rad9, 13, 16, 20, 22, and 27T) and non-CpG methylation was also present in three of
127
them (Rad9, 20, and 22). Nine patients have only non-CpG methylation. The methylated
cytosine residues were within the Sp1 binding sites in patients Rad9, 17, 22, 27T, 32T, and
50. The methylated C*CpWGG motif was present in four samples (Rad2, 9, 25T, and
30T).
The methylation analysis revealed either hypermethylation or cytosine methylation
of single CpG and non-CpG methylation in the putative promoter region of hHR23 genes.
It is known that hypermethylation of CpG island in the promoter region is generally
associated with transcription silencing. Intriguingly, Pogribny et al. (2000) and Veerla et
al. (2008) have shown that single CpG methylation could down regulate the expression of
the p53 and IRF7 genes, respectively. It was also reported that methylation of single non-
CpG dinucleotides (CpA or CpC) within the transcription binding site could affect the
expression pattern of the genes (Veerla et al. 2008).
Until recently, a few studies reported cytosine methylation of non-CpG dinucleotides
in genomic DNAs from human carcinomas and its involvement in the carcinogenesis. Two
recent studies have reported non-CpG methylation pattern in B cell-specific B29 gene in
Primary Effusion Lymphoma, and p53 gene in non-small cell lung carcinoma (Malone et
al., 2001; Kouidou et al., 2005 and 2006). Analysis of the p53 exon 5 mutation spectrum in
mutation databases for lung cancer revealed frequent G:C > A:T transitions, several of
which occur at non-CpG methylated sequences. Additionally, non-CpG methylation was
observed in the tissues adjacent to the tumor in the lung, which indicates that non-CpG
methylation may appear in the early stage of carcinogenesis and serve as a useful tool for
early cancer detection (Kouidou et al., 2005). Thus, the findings of present study might be
the additional support for the involvement of non-CpG methylation in carcinogenesis.
A specific pattern of non-CpG methylation in the C*CpWGG motif was reported in
plants and few human genes including p53 and B29 genes. The cytosine methylation of
C*CpWGG motif in the promoter region of p53 and B29 genes resulted in transcriptional
silencing (Malone et al., 2001; Agirre et al., 2003). We have identified methylated
C*CpWGG motif in hHR23B in four tumor samples (Rad2, 9, 25T, and 30T). The
methylated C*CpWGG motif was at positition -212/-208 in Rad2 and 30T whereas
C*CpWGG motif at positition -151/-147 was methylated in samples Rad9 and 25T. Based
128
on the above observations, we could speculate that the presence of methylated C*CpWGG
motif in the promoter region might affect the transcription of the hHR23B gene in the
tumor tissues.
We have observed that the methylated cytosine residues were within the Sp1 binding
sites in hHR23B gene in patients Rad9, 17, 22, 27T, 32T, and 50. The affected Sp1 binding
site (at position -135/-126) is the same in five of them whereas the Sp1 site at position -
270/-261 was methylated in tumor sample Rad27T. Butta et al. (2006) has shown that the
in vitro transcription of the human podocalyxin (Podxl) promoter is dependent on the
presence of Sp1 sites. The progressive rise in the promoter activity directly correlates with
the number of recognition sites for Sp1. The methylation or deletion of Sp1 element
resulted in repression of Podxl gene (Butta et al., 2006). The findings of Butta et al. (2006)
and Veerla et al. (2008) prompted us to speculate that the cytosine methylation in Sp1
binding site might interfere the binding of Sp1 and down regulate the transcription of
hHR23B in tumor tissues Rad9, 17, 22, 27T, and 32T.
In five samples, hHR23A gene was partially hypermethylated. However, the extent
and the position of the methylation site were different in each sample. The down-stream
region (positions +6/+117) of TSS site was hypermethylated in tumor adjacent tissue
Rad31N whereas hypermethylation spread to the upstream region (between -249/+117 nts)
of TSS site in tumor tissue of the same sample (Rad31T). The upstream region was
hypermethylated in sample Rad21 whereas both upstream and downstream regions were
hypermethylated in samples Rad27T, 31T, and 32T. The observed non-uniformity in
hypermethylation pattern suggest that the methylation initiation site is probably similar in
four samples and within downstream of TSS (position +1/+117) whereas it is different in
sample Rad21 probably being between -249/-27 nts. It is known that the spreading of
methylation from the foci of methylated CpG sites is a common event in tumor tissues.
Two samples have cytosine methylation within upstream region of hHR23A in both
tumor and adjacent tissues. Patient Rad29 has CpC methylation at position -114/-113 in
tumor adjacent tissue (Rad29N) whereas CpT and CpA di-nucleotides were methylated at
positions -133/-132 and +11/+12 in the tumor tissue (Rad29T). The region between
nucleotide positions +6/+117 was hypermethylated in tumor adjacent tissue Rad31N
129
whereas hypermethylation spread to the region between -249/+117 nts in tumor tissue of
the same sample (Rad31T). The observation of cytosine methylation in tissues adjacent to
tumor is consistent with previously reported findings (Kouidou et al., 2005). The cytosine
methylation pattern in samples Rad25T, 27T, 28T, 30T, 32T, and 33T was not present in
corresponding tumor adjacent tissues suggesting that the observed de novo methylation is
specific to tumor formation. Additionally, cytosine methylation was not observed in five
DNA samples isolated from peripheral blood tissue.
We could not obtain statistical differences among patients when compared with
respect to the presence, type, and position of methylation in hHR23A or hHR23B. On the
other hand, correlations based on histopathological features of the samples implicate some
preliminary features. For example, in all patients (Rad21, 27T, 31T, and 32T) showing
hypermethylation of hHR23A gene, lymph node metastasis (LNM) was positive and
showed high grade (III) and stage (pT2Nx) tumor progression. The Estrogen Receptor
(ER) expression was positive in all samples. c-erbB-2 expression was negative in tumor
samples Rad27T, 31T, and 32T, however,it was expressed in tumor tissue Rad21 showing
different methylation initiation site in the upstream region of TSS. Among the patients
(Rad9, 17, 22, 27T, 32T, and 50) presenting methylated cytosine residues within the Sp1
binding sites in hHR23B gene, there is no uniformity in histopathological features of tumor
tissues. However, the bisulfite sequencing revealed that three of them (samples Rad17,
27T, and 32T) have cytosine methylation in both hHR23A and hHR23B genes. The sample
Rad27T showed hypermethylated region (between nts -226/+117) in hHR23A and
methylated cytosine residue within the Sp1 binding site (-270/-261) in hHR23B gene.
Similarly, upstream region (between -121/+117 nts) of hHR23A gene was
hypermethylated along with the cytosine residue within the Sp1 binding site (-135/-126) in
hHR23B gene in patient Rad32T. Sample Rad17 has CpC methylation at position -116/-
115 and methylated cytosine residue within the Sp1 binding site (-135/-126) in hHR23A
and hHR23B genes, respectively. Among the patients (Rad2, 9, 25T, and 30T) having the
methylated C*CpWGG motif in the hHR23B promoter region, the histological grade of
tumor showed differences according to the position of methylated C*CpWGG motif. The
tumor grade was II in samples Rad2 and Rad30T whereas the grade is higher in samples
Rad9 and Rad25T.

130
The methylated cytosine residues were not seem to be within the conserved motifs or
transcription binding sites in samples Rad4, 6, 15, 17, 28T, 29T, 29N, 33T, and 48 for
hHR23A and Rad13, 14, 16, 20, 46, and 51 for hHR23B genes. Bisulfite sequencing of
HHR23A and hHR23B revealed no methylation in 21 and 36 tissue samples, respectively.
There was no significant histopathological difference among these samples.
In conclusion, there are no known reports investigating the role of methylation of
hHR23A and hHR23B genes in the tumor tissues (breast cancer). The observations of the
hypermethylation of hHR23A gene and the presence of methylated conserved motifs and
transcription binding sites in hHR23B gene among tumor tissues suggested the
involvement of methylation of hHR23 genes in the breast carcinogenesis. However, the
expression pattern of methylated hHR23 genes should be investigated in fresh or frozen
tumor tissues. If the promoter methylation correlates with loss of protein expression,
methylation status of hHR23 genes could be a marker in breast carcinomas. It is known
that the genetic and epigenetic alterations that initiate and drive cancer can be used as
targets for detection of neoplasia in bodily fluids. Several studies showed that tumor cell-
specific aberrant promoter hypermethylation can be detected in nipple aspirate and ductal
lavage from breast cancer patients and the results were concordant between tumor and
circulating DNA methylation (Dulaimi et al., 2004; Mirza et al., 2007). Hypermethylation-
based screening of serum, a readily accessible bodily fluid and pre-invasive method, may
enhance early detection of breast cancer.
6.3. Molecular Basis of Congenital Hypothyroidism
We have investigated the genetic mechanisms leading to hypothyroidism in a child
with CH associated with bilateral choanal atresia, cleft palate, and spiky hair. Direct
sequencing of coding exon of TTF-2 gene from the patient revealed a novel homozygous
missense mutation (c.304C>T; p.R102C) affecting the forkhead DNA binding domain of
TTF-2. Both parents were heterozygous for the mutation but euthyroid with no congenital
anomalies, and the mutation was absent in 100 control chromosomes. The arginine residue
at codon 102 is a highly conserved residue in the forkhead domain family of proteins, and
mutations of the equivalent amino acid in other forkhead proteins [e.g. FOXC1 (R127H),
FOXC2 (R121H), and FOXP2 (R553H)] have been described. Consonant with this, in
131
vitro studies (performed in University of Cambridge, UK) indicated that the mutation was
highly deleterious, with the p.R102C mutant protein exhibiting negligible DNA binding
and transcriptional activity (Appendix 1). Interestingly, thyroid ultrasonography and CT
examination of the proband indicated thyroid tissue in a eutopic location, although
biochemical measurements and radioisotope scanning show that it is nonfunctional.
Our case represents the third recorded example of a loss-of-function mutation in the
human TTF-2 gene, with the two previously described mutations (A65V and S57N) also
being located within its forkhead, DNA-binding domain (Clifton-Bligh et al., 1998;
Castanet et al., 2002). The A65V mutation was identified in a nonconsanguineous Welsh
family with two male siblings exhibiting CH, cleft palate, choanal atresia, and bifid
epiglottis together with spiky hair, whereas the S57N mutation was reported in two male
siblings of a consanguineous Tunisian kindred exhibiting CH and cleft palate alone. With
both of these TTF-2 mutation cases, 123I scanning and ultrasonography showed complete
athyreosis (Clifton-Bligh et al., 1998; Castanet et al., 2002). In contrast, although the third
case we report here shares some of these features, including severe CH and extrathyroidal
anomalies, imaging indicates the presence of thyroid tissue in a eutopic location. However,
severe biochemical hypothyroidism at birth and also following T4 withdrawal, together
with absent 131I uptake and very low serum thyroglobulin levels, indicates that the function
of such glandular tissue is markedly compromised.
Mouse models support a critical role for TTF-2 in thyroid and palate organogenesis.
Expression of TTF-2, together with the transcription factors TTF-1 and PAX-8, has been
demonstrated from the onset of formation of the thyroid primordium (embryonic d 8–8.5),
continuing throughout the migration of the thyroid diverticulum (Kimura et al., 1996;
Zannini et a., 1997; Mansouri et al., 1998). TTF-2 is also expressed in craniopharyngeal
ectoderm involved in palate formation and Rathke’s pouch in mouse embryos (Zannini et
a., 1997) and in the outer follicular hair sheath in humans (Sequeira et al., 2003). Targeted
disruption of the murine Titf2 locus results in homozygous null mice with cleft palate and
either complete thyroid agenesis or ectopic sublingual gland development (De Felice et al.,
1998). The two murine phenotypes were seen with equal frequency and may reflect
different developmental manifestations of the disorder. Thus, similar to the murine context,
132
our human proband illustrates that thyroid morphogenesis can occur in the absence of
TTF-2, albeit with migration of thyroid gland tissue to a eutopic location.
Mutations in TTF-2 and a TTF-1/NKX2.1 mutation (Krude et al., 2002) are the only
known genetic causes of thyroid agenesis. However, involvement of TTF-2 accounts for
only a small minority of CH cases, being a strong consideration only in those with cleft
palate, which is an infrequent association of CH (Olivieri et al., 2002). This case illustrates
further phenotypic heterogeneity associated with human TTF-2 mutations and suggests that
defects in this gene should also be considered in cases of syndromic CH with cleft palate,
but not necessarily complete thyroid agenesis. This variable phenotype may reflect
differential effects of TTF-2 mutations on downstream target genes required for normal
human thyroid organogenesis, migration, and differentiation, and the further identification
of such genes may elucidate these mechanisms and provide novel genetic candidates for
CH and cleft palate.
6.3.1. Mutation Analysis of Butyrylcholinesterase (BChE) Gene
The same CH patient with the TTF2 mutation was referred to our lab a year later
since she experienced prolonged neuromuscular block after an operation and had a marked
decrease in BChE activity compared with her parents and brother. Because BChE is known
to hydrolyze the anesthetic reagents we analyzed its two common variants in the patient
that can be responsible for reduced plasma cholinesterase and prolonged paralysis.
Restriction analysis revealed that the patient, her consanguineous parents and unaffected
brother were negative for these variants. However, the whole BChE gene should be
screened for variants that might be responsible for the plasma cholinesterase deficiency.
To our knowledge this patient was the first case with CH showing the prolonged
neuromuscular block. Patients with CH are candidates for multiple operations due to
midline defects (e.g. cleft palate and choanal atresia) and their responses to muscle
relaxants are not known. Therefore, careful preoperative evaluation and molecular genetic
testing should be performed.
133
7. CONCLUSION AND FUTURE PROSPECTS
To our knowledge, this is the first study on genetic basis of Rett Syndrome in our
population. Our findings suggest that gene dosage can be a mechanism that leads to this
devastating genetic/epigenetic disease. We have shown the duplication of exons that are
known to be the expressed. As a future prospect, the breakpoints of the duplications,
whether they are tandem repeats, and their effect on MECP2 expression can be
investigated in these patients.
The findings of methylation analyses of hHR23A and hHR23B prompted us to
speculate that the cytosine methylation of putative promoter region may down regulate
transcription of hHR23A and hHR23B genes in tumor tissues. Additional studies can be
performed to investigate the expression pattern of methylated hHR23 genes in fresh or
frozen tumor tissues. Methylation status of hHR23 genes may be tested as a candidate
marker in breast carcinomas upon correlation of promoter methylation with the loss of
expression. Additionally, the body fluids could be investigated for the presence of aberrant
promoter hypermethylation. If the results were concordant between tumor and circulating
DNA methylation, the screening of hHR23 methylation may enhance early detection of
breast cancer.
The identification of TTF2 mutation in a CH patient with thyroid tissue suggested
that further phenotypic heterogeneity is associated with human TTF-2 mutations and the
CH patients with thyroid tissue should also be screened for the mutations within the TTF2
gene. Further mutations should be identified and investigated to unravel the functions of
TTF2 in thyroid organogenesis.
134
REFERENCES
Abramowicz, M. J., L. Duprez, J. Parma, G. Vassart and C. Heinrichs, 1997, “Familial
congenital hypotyroidism due to inactivating mutation of the thyrotropin receptor
causing profound hypoplasia of the thyroid gland”, The Journal of Clinical
Investigation, Vol. 99, No. 12, pp. 3018-3024, June.
Agirre, X., J. L. Vizmanos, M. J. Calasanz, M. Garcia-Delgado, M. J. Larrayoz and F. J.
Novo, 2003, “Methylation of CpG dinucleotides and/or CCWGG motifs at the
promoter of TP53 correlates with decreased gene expression in a subset of acute
lymphoblastic leukemia patients”, Oncogene, Vol. 22, No. 7, pp. 1070-1072,
February.
Akarsu, A. N., I. Stoilov, E. Yilmaz, B. S. Sayli and M. Sarfarazi, 1996, “Genomic
structure of HOXD13 gene: a nine polyalanine duplication causes synpolydactyly in
two unrelated families”, Human Molecular Genetics, Vol. 5, No. 7, pp. 945-952,
July.
Allen, R. C., H. Y. Zoghbi, A. B. Moseley and H. M. Rosenblatt, 1992, “Methylation of
HpaII and HhaI sites near the polymorphic CAG repeat in the human androgen-
receptor gene correlates with X chromosome inactivation”, American Journal of
Human Genetics, Vol. 51, pp. 1229-1239.
Amir, R. E., I. B. Van den Veyver and M. Wan, 1999, “Rett syndrome is caused by
mutations in X-linked MECP2, encoding methyl-CpG-binding protein 2”, Nature
Genetics, Vol. 23, No. 2, pp. 185-188, October.
Ang, S., A. Wierda, D. Wong, D. Stevens, S. Cascio, J. Rossant and K. S. Zaret, 1993,
“The formation and maintenance of the definitive endoderm lineage in the mouse:
involvement of HNF3/forkhead proteins”, Development, Vol. 119, No. 4, pp. 1301-
1315, December.
135
Antequera, F. and A. Bird, 1993, “Number of CpG islands and genes in human and
mouse”, Proceedings of the National Academy of Sciences of the United States of
America, Vol. 90, No. 24, pp. 11995-11999, December.
Araki, M., C. Masutani, M. Takemura, A. Uchida, K. Sugasawa, J. Kondoh, Y. Ohkuma
and F. Hanaoka, 2001, “Centrosome protein centrin 2/caltractin 1 is part of the
xeroderma pigmentosum group C complex that initiates global genome nucleotide
excision repair”, Journal of Biological Chemistry, Vol. 276, No. 22, pp. 18665-
18672, June.
Archer, H. L., J. C. Evans, D. S. Millar, P. W. Thompson, A. M. Kerr, H. Leonard, J.
Christodoulou, D. Ravine, L. Lazarou, L. Grove, C. Verity, S. D. Whatley, D. T.
Pilz, J. R. Sampson and A. J. Clarke, 2006, “NTNG1 mutations are a rare cause of
Rett syndrome”, American Journal of Medical Genetics, Vol. 140, No. 7, pp. 691-
694, April.
Archer, H. L., S. D. Whatley, J. C. Evans and D. Ravine, 2006, “Gross rearrangements of
the MECP2 gene are found in both classical and atypical Rett syndrome patients”,
Journal of Medical Genetics, Vol. 43, pp. 451-456.
Ariani, F., F. Mari, C. Pescucci and I. Longo, 2004, “Real-time quantitative PCR as a
routine method for screening large rearrangements in Rett syndrome: Report of one
case of MECP2 deletion and one case of MECP2 duplication”, Human Mutation,
Vol. 24, pp. 172-177, August.
Armstrong, D. D., 2005, “Neuropathology of Rett syndrome”, Journal of Child Neurology,
Vol. 20, No. 9, pp. 747-753, September.
Asaka, Y., D. G. Jugloff, L. Zhang, J. H. Eubanks and R. M. Fitzsimonds, 2006,
“Hippocampal synaptic plasticity is impaired in the Mecp2-null mouse model of Rett
syndrome”, Neurobiological Disorders, Vol. 21, No. 1, pp. 217-227.
136
Ausio, J., D. B. Levin, G. V. de Amorim, S. Bakker and P. M. Macleod, 2003, “Syndromes
of disordered chromatin remodeling”, Clinical Genetics, Vol. 64, pp. 83-95.
Aza-Blanc, P., R. Di Lauro and P. Santisteban, 1993, “Identification of a cisregulatory
element and a thyroid-specific nuclear factor mediating the hormonal regulation of
rat thyroid peroxidase promoter activity”, Molecular Endocrinology, Vol. 7, pp.
1297-1306.
Bale, T. L. and W.W. Vale, 2004, “CRF and CRF receptors: role in stress responsivity and
other behaviors”, Annual Review of Pharmacology and Toxicology, Vol. 44, pp. 525-
557.
Ballestar, E., T. M. Yusufzai and A. P. Wolffe, 2000, “Effects of Rett syndrome mutations
of the methyl-CpG binding domain of the transcriptional repressor MeCP2 on
selectivity for association with methylated DNA”, Biochemistry, Vol. 39, pp. 7100-
7106.
Ballestar, E., S. Ropero, M. Alaminos, J. Armstrong, F. Setien, R. Agrelo, M. F. Fraga, M.
Herranz, S. Avila, M. Pineda, E. Monros and M. Etseller, 2005, “The impact of
MECP2 mutations in the expression patterns of Rett syndrome patients”, Human
Genetics, Vol. 116, No. 1-2, pp. 91-104.
Balmer, D., J. Goldstine, Y. M. Rao and J. M. LaSalle, 2003, “Elevated methyl-CpG-
binding protein 2 expression is acquired during postnatal human brain development
and is correlated with alternative polyadenylation”, Journal Molecular Medicine,
Vol. 81, No. 1, pp. 61-68, January.
Bamforth, J. S., I. A. Hughes, J. H. Lazarus, C. M. Weaver and P. S. Harper, 1989,
“Congenital hypothyroidism, spiky hair, and cleft palate”, Journal of Medical
Genetics, Vol. 26, pp. 49-51.
Barış, I., A. E. Arisoy, A. Smith, M. Agostini, C.S. Mitchell, S.M. Park, A.M. Halefoglu,
E. Zengin, V.K. Chatterjee and E. Battaloglu, 2006, “A novel missense mutation in
human TTF-2 (FKHL15) gene associated with congenital hypothyroidism but not
137
athyreosis”, Journal of Clinical Endocrinology and Metabolism, Vol. 91, pp. 4183-
4187, October.
Beever, C., B. P. Lai, S. E. Baldry and M. S. Penaherrera, 2003, “Methylation of ZNF261
as an assay for determining X chromosome inactivation patterns”, American Journal
of Medical Genetics Part A, Vol. 120, pp. 439-441.
Belichenko, P. V., A. Oldfors, B. Hagberg and A. Dahlström, 1994, “Rett syndrome: 3-D
confocal microscopy of cortical pyramidal dendrites and afferents”, Neuroreports,
Vol. 5, No. 12, pp. 1509-1513.
Bell, A. C. and G. Felsenfeld, 2000, “Methylation of a CTCF-dependent boundary controls
imprinted expression of the Igf2 gene”, Nature, Vol. 405, pp. 482-485.
Berry, F. B., R. A. Saleem and M. A. Walter, 2002, “FOXC1 transcriptional regulation is
mediated by N- and C-terminal activation domains and contains a phosphorylated
transcriptional inhibitory domain”, The Journal of Biological Chemistry, Vol. 277,
pp. 10292-10297.
Bertani, I., L. Rusconi, F. Bolognese, G. Forlani, B. Conca, L. De Monte, G. Badaracco, N.
Landsberger and C. Kilstrup-Nielsen, 2006, “Functional consequences of mutations
in CDKL5, an X-linked gene involved in infantile spasms and mental retardation”,
Journal of Biological Chemistry, Vol. 281, No. 42, pp. 32048-32056, October.
Biard, D.S., 2007, “Untangling the relationships between DNA repair pathways by
silencing more than 20 DNA repair genes in human stable clones”, Nucleic Acids
Research, Vol. 35, No. 11, pp. 3535-3550.
Bienvenu, T., A. Carrie, N. de Roux and M. C. Vinet, 2000, “MECP2 mutations account
for most cases of typical forms of Rett syndrome”, Human Molecular Genetics, Vol.
9, pp. 1377-1384.
138
Bienvenu, T. and J. Chelly, 2006, “Molecular genetics of Rett syndrome: when DNA
methylation goes unrecognized”, Nature Reviews. Genetics, Vol. 7, No. 6, pp. 415-
426.
Biggins, S., I. Ivanovska and M. D. Rose, 1996, “Yeast ubiquitin-like genes are involved in
duplication of the microtubule organizing center”, The Journal of Cell Biology, Vol.
133, No. 6, pp. 1331-46.
Bird, A., 2002, “DNA methylation patterns and epigenetic memory”, Genes and
Development, Vol. 16, pp. 6-21.
Borg, I., K. Freude, S. Kübart, K. Hoffmann, C. Menzel, F. Laccone, H. Firth, M. A.
Ferguson-Smith, N. Tommerup, H. H. Ropers, D. Sargan and V. M. Kalscheuer,
2005, “Disruption of Netrin G1 by a balanced chromosome translocation in a girl
with Rett syndrome”, European Journal of Human Genetics, Vol. 13, No. 8, pp. 921-
927.
Bradsher, J., J. Auriol, L. Proietti de Santis, S. Iben, J. L. Vonesch, I. Grummt and J. M.
Egly, 2002, “CSB is a component of RNA pol I transcription”, Molecular Cell, Vol.
10, pp. 819-829.
BreastCancer.org, 2008, what is breast cancer, www.cancer.org/docroot/CRI/content/
CRI_2_4_1X_what_is_breast_cancer_5.asp.
Brignone, C., K. E. Bradley, A. F. Kisselev and S.R. Grossman, 2004, “A post-
ubiquitination role for MDM2 and hHR23A in the p53 degradation pathway”,
Oncogene, Vol. 20, No. 23, pp. 4121-4129.
Brooks, A. R., R. N. Harkins, P. Wang,H. S. Qian, P. Liu and G. M. Rubanyi, 2004,
“Transcriptional silencing is associated with extensive methylation of the CMV
promoter following adenoviral gene delivery to muscle”, Journal of Gene Medicine,
Vol. 6, pp. 395-404.
139
Brownawell, A.M., G. J. Kops, I. G. Macara and B. M. Burgering, 2001, “Inhibition of
nuclear import by protein kinase B (Akt) regulates the subcellular distribution and
activity of the forkhead transcription factor AFX”, Molecular and Cellular Biology,
Vol. 21, No. 3534- 3546.
Buschdorf, J. P. and W. H. Strätling, 2004, “A WW domain binding region in methyl-
CpG-binding protein MeCP2: impact on Rett syndrome”, Journal Molecular
Medicine, Vol. 82, No. 2, pp. 135-143, February.
Butta, N., S. Larrucea, S. Alonso, R. B. Rodriguez, E. G. Arias-Salgado, M. S. Ayuso, C.
González-Manchón and R. Parrilla, 2006, “Role of transcription factor Sp1 and CpG
methylation on the regulation of the human podocalyxin gene promoter”, BMC
Molecular Biology, Vol. 9, pp. 7-17.
Carlsson, P. and M. Mahlapuu, 2002, “Forkhead transcription factors: Key players in
development and metabolism”, Developmental Biology, Vol. 250, pp. 1-23.
Castanet, M., S. Lyonnet, C. Bonaı¨ti-Pellie´, M. Polak, P. Czernichow, P. and J. Le´ger,
2000, “Familial forms of thyroid dysgenesis among infants with congenital
hypothyroidism”, The New England Journal of Medicine, Vol. 343, pp. 441-442.
Castanet, M., M. Polak, C. Bonaiti-Pellie, S. Lyonnet, P. Czernichow and J. Leger, 2001,
“Nineteen years of national screening for congenital hypothyroidism: familial cases
with thyroid dysgenesis suggest the involvement of genetic factors”, The Journal of
Clinical Endocrinology and Metabolism, Vol. 86, pp. 2009-2014.
Castanet, M., S. M. Park, A. Smith, M. Bost, J. Leger, S. Lyonnet, A. Pelet, P.
Czernichow, V. K. Chatterjee and M. Polak, 2002, “A novel loss-of-function
mutation in TTF-2 is associated with congenital hypothyroidism thyroid agenesis and
cleft palate”, Human Molecular Genetics, Vol. 11, pp. 2051-2059.
140
Chadwick, B. P., F. Obermayr and A. M. Frischauf, 1997, “FKHL15, a new human
member of the forkhead gene family located on chromosome 9q22”, Genomics, Vol.
41, pp. 90-396.
Chahrour, M. and H. Y. Zoghbi, 2007, “The Story of Rett Syndrome: From Clinic to
Neurobiology”, Neuron, Vol. 56, pp. 422-437.
Chan, S. W. -L., I. R. Henderson and S. E. Jacobsen, 2005, “Gardening the genome: DNA
methylation in Arabidopsis thaliana”, Nature Reviews. Genetics, Vol. 6, pp. 351-360.
Chan, H. W., J. S. Miller, M. B. Moore and C. T. Lutz, 2005, “Epigenetic control of highly
homologous killer Ig-like receptor gene alleles” The Journal of Immunology, Vol
175, No. 9, pp. 5966-5974.
Chang, Q., G. Khare, V. Dani, S. Nelson and R. Jaenisch, 2006, “The disease progression
of Mecp2 mutant mice is affected by the level of BDNF expression” Neuron, Vol.
49, No. 3, pp. 341-348, February.
Chao, H. T., H. Y. Zoghbi and C. Rosenmund, 2007, “MeCP2 controls excitatory synaptic
strength by regulating glutamatergic synapse number”, Neuron, Vol. 56, No. 1, pp.
58-65.
Cheadle, J.P., H. Gill, N. Fleming and J. Maynard, 2000, “Long-read sequence analysis of
the MECP2 gene in Rett syndrome patients: correlation of disease severity with
mutation type and location”, Human Molecular Genetics, Vol. 9, pp. 1119-1129.
Chen, L., U. Shinde, T. G. Ortolan and K. Madura, 2001, „Ubiquitin-associated (UBA)
domains in Rad23 bind ubiquitin and promote inhibition of multi-ubiquitin chain
assembly“, EMBO Reports, Vol. 2, No. 10, pp. 933-938.
Chen, L. and K. Madura, 2002, “Rad23 promotes the targeting of proteolytic substrates to
the proteasome” Molecular and Cellular Biology, Vol. 22, No. 13, pp. 4902-4913.
141
Chen, L. and K. Madura, 2006, “Evidence for distinct functions for human DNA repair
factors hHR23A and hHR23B”, FEBS Letters, Vol. 580, No. 14, pp. 3401-3408.
Chen, R. Z., S. Akbarian, M. Tudor and R. Jaenisch, 2001, “Deficiency of methyl-CpG
binding protein-2 in CNS neurons results in a Rett-like phenotype in mice”, Nature
Genetics, Vol. 27, No. 3, pp. 327-331, March.
Chen, W.G., Q. Chang, Y. Lin, A. Meissner, A. E. West, E. C. Griffith, R. Jaenisch and M.
E. Greenberg, 2003, “Derepression of BDNF transcription involves calcium-
dependent phosphorylation of MeCP2”, Science, Vol. 302, No. 5646, pp. 885-889,
October.
Clark, K. L., E. D. Halay, E. Lai and S. K. Burley, 1993, “Co-crystal structure of the HNF-
3/fork head DNA-recognition motif resembles histone H5”, Nature, Vol. 364, pp.
412-420.
Clarke, D. J., G. Mondesert, M. Segal, B. L. Bertolaet, S. Jensen, M. Wolff, M. Henze and
S. I. Reed, 2001, “Dosage suppressors of pds1 implicate ubiquitin-associated
domains in checkpoint control”, Molecular and Cellular Biology, Vol. 21, No. 6,
pp. 1997-2007.
Clifton-Bligh, R. J., J. M. Wentworth, P. Heinz, M. S. Crisp, R. John, J. H. Lazarus, M.
Ludgate and K. Chatterjee, 1998, “Mutation of the gene encoding human TTF-2
associated with thyroid agenesis cleft palate and choanal atresia”, Nature Genetics,
Vol. 19, pp. 399-401.
Cohen, D., G. Lazar, P. Couvert, V. Desportes, D. Lippe, P. Mazet and D. Héron, 2002,
“MECP2 mutation in a boy with language disorder and schizophrenia”, American
Journal of Psychiatry, Vol. 159, No. 1, pp. 148-149, January.
Collins, A. L., J. M. Levenson, A. P. Vilaythong, R. Richman, D. L. Armstrong, J. L.
Noebels, J. David Sweatt and H. Y. Zoghbi, 2004, “Mild overexpression of MeCP2
142
causes a progressive neurological disorder in mice”, Human Molecular Genetics,
Vol. 13, No. 21, pp. 2679-2689.
Colvin, L., H. Leonard, N. de Klerk and M. Davis M, 2004, “Refining the phenotype of
common mutations in Rett syndrome”, Journal of Medical Genetics, Vol. 41, pp. 25-
30.
Congdon, T., L. Q. Nguyen, C. R. Nogueira, R. L. Habiby, G. Medeiros-Neto and P. Kopp,
2001, “A novel mutation (Q40P) in PAX8 associated with congenital
hypothyroidism and thyroid hypoplasia: evidence for phenotypic variability in
mother and child”, The Journal of Clinical Endocrinology and Metabolism, Vol. 86,
pp. 3962-3967.
Couvert, P., T. Bienvenu, C. Aquaviva and K. Poirier, 2001, “MECP2 is highly mutated in
X-linked mental retardation”, Human Molecular Genetics, Vol. 10, pp. 941-946.
Dai, G., O. Levy and N. Carrasco, 1996, “Cloning and characterization of the thyroid
iodide transporter”, Nature, Vol. 379, pp. 458-460.
Dani, V. S., Q. Chang, A. Maffei, G. G. Turrigiano, R. Jaenisch and S. B. Nelson, 2005,
“Reduced cortical activity due to a shift in the balance between excitation and
inhibition in a mouse model of Rett syndrome”, Proceedings of the National
Academy of Sciences of the United States of America, Vol. 102, No. 35, pp. 12560-
12565.
Damante, G., R. DiLauro, 1994, “Thyroid-specific gene expression”, Biochimica et
Biophysica Acta, Vol. 1218, pp. 255-266.
De Boer, J. and J. H. Hoeijmakers, 2000, “Nucleotide excision repair and human
syndromes”, Carcinogenesis, Vol. 21, pp. 453-460.
De Felice, M., C. Ovitt, E. Biffali, A. Rodriguez-Mallon, C. Arra, K. Anastassiadis, P. E.
Macchia, M. G. Mattei, A. Mariano, H. Scholer, V. Macchia and R. Di Lauro, 1998,
143
“A mouse model for hereditary thyroid dysgenesis and cleft palate”, Nature
Genetics, Vol. 19, pp. 395-398.
Del Gaudio, D., P. Fang, F. Scaglia and P. A. Ward, 2006, “Increased MECP2 gene copy
number as the result of genomic duplication in neurodevelopmentally delayed
males”, Genetics in Medicine, Vol. 8, pp. 784-792.
Devos, H., C. Rodd, N. Gagne, R. Laframboise and G. Van Vliet, 1999, “A search for the
possible molecular mechanisms of thyroid dysgenesis: sex ratios and associated
malformations”, The Journal of Clinical Endocrinology and Metabolism, Vol. 84,
pp. 2502-2506.
Devriendt, K., C. Vanhole, G. Matthis and F. De Zegher, 1998, “Deletion of thyroid
transcription factor-1 gene in an infant with neonatal thyroid dysfunction and
respiratory failure”, The New England Journal of Medicine, Vol. 338, pp. 1317-1318.
Dodge, J. E., B. H. Ramsahoye, Z. G. Wo, M. Okano and E. Li, 2001, “De novo
methylation of MMLV provirus in embryonic stem cells: CpG versus non-CpG
methylation”, Gene, Vol. 289, No. 1-2, pp. 41-48.
Dragich, J. M., Y. H. Kim, A. P. Arnold and N. C. Schanen, 2007, “Differential
distribution of the MeCP2 splice variants in the postnatal mouse brain”, Journal of
Comparative Neurology, Vol. 501, No. 4, pp. 526-542, April.
Drapkin, R., J. T. Reardon and A. Ansari, 1994, “Dual role of TFIIH in DNA excision
repair and in transcription by RNA polymerase II”, Nature, Vol. 368, pp. 769-772.
Dulaimi, E., J. Hillinck, I. Ibanez de Caceres, T. Al-Saleem and P. Cairns, 2004, “Tumor
suppressor gene promoter hypermethylation in serum of breast cancer patients”,
Clinical Cancer Research, Vol. 10, No. 18, pp. 6189-6193.
Egger, G., G. Liang, A. Aparicio and P. A. Jones, 2004, “Epigenetics in human disease and
prospects for epigenetic therapy”, Nature, Vol. 429, pp. 457-463.
144
Ehrlich, M. and R. Y. Wang, 1981, “5-Methylcytosine in eukaryotic DNA”, Science, Vol.
212, pp. 1350-1357.
Ekholm, R., 1990, “Biosynthesis of thyroid hormones”, International Review of Cytology,
Vol. 120, pp. 243-288.
Ericson, L. E., and G. Frederiksson, “Phylogeny and ontogeny of the thyroid gland”, in M.
A. Greer (ed.), The Thyroid Gland, Comprehensive Endocrinology, pp. 1-35, Raven
Press, New York, 1990.
Evans, J. C., H. L. Archer, J. P. Colley and K. Ravn, 2005, “Early onset seizures and
Rettlike features associated with mutations in CDKL5”, European Journal of Human
Genetics, Vol. 13, pp. 1113-1120.
Feaver, W.J., J. Q. Svejstrup and L. Bardwell, 1993, “Dual roles of a multiprotein complex
from S. cerevisiae in transcription and DNA repair”, Cell, Vol. 75, pp. 1379-1387.
Feig, S. A., 2000, “Ductal carcinoma in situ. Implications for screening mammography”,
Radiologic Clinics of North America, Vol. 38, No. 4, pp. 653-68.
Feinberg, A. P. and B. Tycko, 2004, “The history of cancer epigenetics”, Nature reviews.
Cancer, Vol. 4, pp. 143-153.
Finnegan, E. J. and K. A. Kovac, 2000, “Plant DNA methyltransferases”, Plant Molecular
Biology, Vol. 43, pp. 189-201.
Finnegan, E. J., W. J. Peacock and E. S. Dennis, 2000, ”DNA methylation, a key regulator
of plant development and other processes”, Current Opinion in Genetics and
Development, Vol. 10, No. 2, pp. 217-223.
Fraga, M. F., E. Ballestar, G. Montoya, P. Taysavang, P. A. Wade and M. Esteller, 2003,
“The affinity of different MBD proteins for a specific methylated locus depends on
145
their intrinsic binding properties”, Nucleic Acids Research, Vol. 31, No. 6, pp.
1765-1774, March.
Francis-Lang, H., M. Price, M. Polycarpou-Schwarz and R. Di Lauro, 1992, “Cell-type-
specific expression of the rat thyroperoxidase promoter indicates common
mechanisms for thyroid-specific gene expression”, Molecular and Cellular Biology,
Vol. 12, pp. 576-588.
Friez, M. J., J. R. Jones, K. Clarkson and H. Lubs, 2006, “Recurrent infections, hypotonia,
and mental retardation caused by duplication of MECP2 and adjacent region in
Xq28”, Pediatrics, Vol. 118, pp. 1687-1695.
Fukuda, T., Y. Yamashita, S. Nagamitsu and K. Miyamoto, 2005, “Methyl-CpG binding
protein 2 gene (MECP2) variations in Japanese patients with Rett syndrome:
pathological mutations and polymorphisms”, Brain Development, Vol. 27, pp. 211-
217.
Garcia-Closas, M., N. Malats, F. X. Real, R. Welch, M. Kogevinas, N. Chatterjee, R.
Pfeiffer, D. Silverman, M. Dosemeci, A. Tardo´n, C. Serra, A. Carrato, R. Garcı´a-
Closas, G. Castan˜o-Vinyals, S. Chanock, M. Yeager, and N. Rothman, 2006,
“Genetic Variation in the Nucleotide Excision Repair Pathway and Bladder Cancer
Risk”, Cancer Epidemiology and Biomarkers Preview, Vol. 15, No. 3, pp. 536-542.
Gillam, M. P. and P. Kopp, 2001a, “Genetic regulation of thyroid development”, Current
Opinion in Pediatrics, Vol. 13, pp. 358-363.
Gillam, M. P. and P. Kopp, 2001b, “Genetic defects in thyroid hormone synthesis”,
Current Opinion in Pediatrics, Vol. 13, pp. 364-372.
Glaze, D. G., 2005, “Neurophysiology of Rett syndrome”, Journal of Child Neurology,
Vol. 20, pp. 740-746, September.
146
Glockzin, S., F. X. Ogi, A. Hengstermann, M. Scheffner and C. Blattner, 2003,
“Involvement of the DNA repair protein hHR23 in p53 degradation”, Molecular and
Cellular Biology, Vol. 23, No. 24, pp. 8960-8969.
Goelz, S.E., S. R. Hamilton and B. Vogelstein, 1985, “Purification of DNA from
formaldehyde fixed and paraffin embedded human tissue”, Biochemical and
Biophysical Research Communications, Vol. 130, No. 1, pp. 118-126.
Grandjean, V., R. Yaman, F. Cuzin and M. Rassoulzadegan, 2007, “Inheritance of an
epigenetic mark: The CpG DNA Methyltransferase 1 is required for de novo
establishment of a complex pattern of non-CpG methylation”, PLoS ONE, Vol. 2,
No. 11, pp. e1136.
Grosso, S., A. Brogna, S. Bazzotti, A. Renieri, G. Morgese and P. Balestri, 2007, “Seizures
and electroencephalographic findings in CDKL5 mutations: case report and review”,
Brain and Development, Vol. 29, No. 4, pp. 239-242, May.
Guazzi, S., M. Price, M. De Felice, G. Damante, M. G. Mattei and R. Di Lauro, 1990,
“Thyroid nuclear factor 1 (TTF-1) contains a homeodomain and displays a novel
DNA binding specificity”, EMBO Journal, Vol. 9, pp. 3631-3639.
Guy, J., B. Hendrich, M. Holmes, J. E. Martin and A. Bird, 2001, “A mouse Mecp2-null
mutation causes neurological symptoms that mimic Rett syndrome”, Nature
Genetics, Vol. 27, No. 3, pp. 322-326, March.
Hagberg, B., J. Aicardi, K. Dias and O. Ramos, 1983, “A progressive syndrome of autism,
dementia, ataxia and loss of purposeful hand use in girls: Rett’s syndrome: report of
35 cases”, Annals of Neurology, Vol. 14, pp. 471-479.
Hagberg, B., F. Hanefeld, A. Percy and O. Skjeldal, 2002, “An update on clinically
applicable diagnostic criteria in Rett syndrome. Comments to Rett Syndrome Clinical
Criteria Consensus Panel Satellite to European Paediatric Neurology Society

147
Meeting, Baden, Germany, 11 September 2001”, European Journal of Paediatric
Neurology, Vol. 6, pp. 293-297.
Hagberg, B., A. Erlandsson, M. Kyllerman and G. Larsson, 2003, “Odd MECP2-mutated
Rett variant-long-term follow-up profile to age 25”, European Journal of Paediatric
Neurology, Vol. 7, No. 6, pp. 417-421.
Hardwick, S. A., K. Reuter, S. L. Williamson and V. Vasudevan, 2007, “Delineation of
large deletions of the MECP2 gene in Rett syndrome patients, including a familial
case with a male proband”, European Journal of Human Genetics, Vol. 15, pp. 1218-
1229.
Helzlsouer, K. J., E. L. Harris, R. Parshad, S. Fogel, W. L. Bigbee and K. K. Sanford,
1995, “Familial clustering of breast cancer: possible interaction between DNA repair
proficiency and radiation exposure in the development of breast cancer”,
International Journal of Cancer, Vol. 64, pp. 14 -17.
Helzlsouer, K. J., E. L. Harris, R. Parshad, H. R. Perry, F. M. Price and K. K. Sanford KK,
1996, “DNA repair proficiency: potential susceptibility factor for breast cancer”,
Journal of National Cancer Institute, Vol. 88, pp. 754-755.
Hermesz, E., S. Mackem and K. A. Mahon, 1996, “Rpx: a novel anteriorrestricted
homeobox gene progressively activated in the prechordal plate, anterior neural plate
and Rathke’s pouch of the mouse embryo”, Development, Vol. 122, pp. 41-52.
Hoeijmakers, J. H., 2001, “Genome maintenance mechanisms for preventing cancer”,
Nature, Vol. 411, No. 6835, pp. 366-374.
Hofmann, K. and P. Bucher, 1996, “The UBA domain: a sequence motif present in
multiple enzyme classes of the ubiquitination pathway”, Trends in Biochemical
Sciences, Vol. 21, pp. 172-173.

148
Horike, S., S. Cai, M. Miyano, J. F. Cheng and T. Kohwi-Shigematsu, 2005, “Loss of
silent-chromatin looping and impaired imprinting of DLX5 in Rett syndrome”,
Nature Genetics, Vol. 37, No. 1, pp. 31-40.
Hsieh, H. C., Y. H. Hsieh, Y. H. Huang, F. C. Shen, H. N. Tsai, J. H. Tsai, Y. T. Lai, Y. T.
Wang, W. J. Chuang and W. Huang, 2005, “HHR23A, a human homolog of
Saccharomyces cerevisiae Rad23, regulates xeroderma pigmentosum C protein and
is required for nucleotide excision repair”, Biochemical and Biophysical Research
Communications, Vol. 335, No. 1, pp. 181-187.
Huang, W. Y., S. I. Berndt, D. Kang, N. Chatterjee, S. J. Chanock, M. Yeager, R. Welch,
R. S. Bresalier, J. L. Weissfel and R. B. Hayes, 2006, “Nucleotide excision repair
gene polymorphisms and risk of advanced colorectal adenoma: XPC polymorphisms
modify smoking-related risk”, Cancer Epidemiology and Biomarkers Preview, Vol.
15, No. 2, pp. 306-311.
Huppke, P., K. Köhler, F. Laccone and N. Kramer, 2003, “Indication for genetic testing: a
checklist for rett syndrome”, Journal of Pediatrics, Vol. 3, pp. 332-335.
Jeffery, L. and S. Nakielny, 2004, “Components of the DNA methylation system of
chromatin control are RNA-binding proteins”, Journal of Biological Chemistry, Vol.
279, No. 47, pp. 49479-49487, November.
Jellinger, K., D. Armstrong, H. Y. Zoghbi and A. K. Percy, 1988, “Neuropathology of Rett
syndrome”, Acta Neuropathologica, Vol. 76, No. 2, pp. 142-158.
Jian, L., H. L. Archer, D. Ravine, A. Kerr, N. de Klerk, J. Christodoulou, M. E. Bailey, C.
Laurvick and H. Leonard, 2005, “p.R270X MECP2 mutation and mortality in Rett
syndrome”, European Journal of Human Genetics, Vol. 13, No. 11, pp. 1235-1238.
Jiang, Y., J. Bressler and A. L. Beaudet, 2004, “Epigenetics and human disease”, Annual
Review of Genomics and Human Genetics, Vol. 5, pp. 479-510.
149
Jin, C., I. Marsden, X. Chen and X. Liao, 1999, “Dynamic DNA contacts observed in the
NMR structure of winged helix protein - DNA complex”, Journal of Molecular
Biology, Vol. 289, pp. 683-690.
Kaufmann, W. E. And H. W. Moser, 2000, “Dendritic anomalies in disorders associated
with mental retardation”, Cerebral Cortex, Vol. 10, No. 10, pp. 981-991.
Kaur, M., M. Pop, D. Shi, C. Brignone and S. R. Grossman, 2007, “hHR23B is required
for genotoxic-specific activation of p53 and apoptosis”, Oncogene, Vol. 26, No. 8,
pp. 1231-1237.
Kerr, A. M., H. L. Archer, J. C. Evans, R. J. Prescott and F.Gibbon, 2006, “People with
MECP2 mutation-positive Rett disorder who converse”, Journal of Intellectual
Disability Research, Vol. 50, Pt. 5, pp. 386-394.
Kim, I., K. Mi and H. Rao, 2004, “Multiple interactions of rad23 suggest a mechanism for
ubiquitylated substrate delivery important in proteolysis”, Molecular and Biological
Cell, Vol. 15, No. 7, pp. 3357-3365.
Kimura, S., Y. Hara, T. Pineau, P. Fernandez-Salguero, C. H. Fox, J. M. Ward and F. J.
Gonzalez, 1996, “The T/ebp null mouse: thyroid-specific enhancer-binding protein is
essential for the organogenesis of the thyroid lung ventral forebrain”, Genes and
Development, Vol. 10, pp. 60-69.
Kohn, L. D., M. Saji, M. Kosugi, T. Ban, C. Giuliani, A. Hidaka, Y. Shimura and F.
Okajima, 1993, “Thyroid Disease: Basic Science, Pathology, Clinical and Laboratory
Diagnosis”, CRC press, Boca Raton, pp. 59-118.
Kopp, P., 2001, “The TSH receptor and its role in thyroid disease”, Cellular and
Molecular Life Sciences, Vol. 58, No. 1301-1322.
Kouidou, S., T. Agidou, A. Kyrkou, A. Andreou, T. Katopodi, E. Georgiou, D. Krikelis, A.
Dimitriadou, P. Spanos, C. Tsilikas, H. Destouni and G. Tzimagiorgis, 2005, “Non-
150
CpG cytosine methylation of p53 exon 5 in non-small cell lung carcinoma”, Lung
Cancer, Vol. 50, No. 3, pp. 299-307.
Kouidou, S., A. Malousi and N. Maglaveras, 2006, “Methylation and repeats in silent and
nonsense mutations of p53”, Mutation Research, Vol. 599, No. 1-2, pp. 167-177.
Krude, H., B. Schutz, H. Biebermann, A. von Moers, D. Schnable, H. Neitzel, H. Tonnies,
D. Weise, A. Lafferty, S. Schwarz, M. DeFelice, A. con Deimling, F. van
Landeghem, R. Li Lauro and A. Gruters, 2002, “Choreoathetosis, hypothyroidism,
and pulmonary alterations due to human NKX2–1 haploinsufficiency”, The Journal
of Clinical Investigation, Vol. 109, pp. 475-480.
Kumar, S., A. L. Talis and P. M. Howley, 1999, “Identification of HHR23A as a substrate
for E6-associated protein-mediated ubiquitination”, The Journal of Biological
Chemistry, Vol. 274, No. 26, pp. 18785-18792.
Lazzaro, D., M. Price, M. De Felice and R. Di Lauro, 1991, “The transcription factor TTF-
1 is expressed at the onset of thyroid and lung morphogenesis and in restricted
regions of the fetal brain”, Development, Vol. 113, No. 1093-1104.
Lambertson, D., L. Chen and K. Madura, 1999, “Pleiotropic defects caused by loss of the
proteasome-interacting factors Rad23 and Rpn10 of Saccharomyces cerevisiae”,
Genetics. Vol. 153, No. 1, pp. 69-79.
Li, L. C. and R. Dahiya, 2002, “MethPrimer: designing primers for methylation PCRs”,
Bioinformatics, Vol. 18, No. 11, pp. 1427-1431.
Lommel, L., T. Ortolan, L. Chen, K. Madura and K. S. Sweder, 2002, „Proteolysis of a
nucleotide excision repair protein by the 26 S proteasome”, Current Genetics, Vol.
42, No. 1, pp. 9-20.
Luikenhuis, S., E. Giacometti, C. F. Beard and R. Jaenisch, 2004, “Expression of MeCP2
in postmitotic neurons rescues Rett syndrome in mice”, Proceedings of the National
151
Academy of Sciences of the United States of America, Vol. 101, No. 16, pp. 6033-
6038, April.
Macchia, P.E., P. Lapi, H. Krude, M. T. Pirro, C. Missero, L. Chiovato, A. Souabni, M.
Baserga, V. Tassi, A. Pinchera, G. Fenzi, A. Gruters, M. Busslinger and R. DiLauro,
1998, “PAX8 mutations associated with congenital hypothyroidism caused by
thyroid agenesis”, Nature Genetics, Vol. 19, No. 83-86.
Macchia, P.E., M. G. Mattei, P. Lapi, G. Fenzi and R. Di Lauro, 1999, “Cloning,
chromosomal localization and identiÆcation of polymorphisms in the human thyroid
transcription factor 2 gene (TTF-2)”, Biochimie, Vol. 81, No. 433-440.
Maekawa, T., T. Shinagawa, Y. Sano, T. Sakuma, S. Nomura, K. Nagasaki, Y. Miki, F.
Saito-Ohara, J. Inazawa, T. Kohno, J. Yokota and S. Ishii, 2007, “Reduced levels of
ATF-2 predispose mice to mammary tumors”, Molecular and Cellular Biology, Vol.
27, No. 5, pp. 1730-1744.
Magewu, A. N. and P. A. Jones, 1994, “Ubiquitous and tenacious methylation of the CpG
site in codon 248 of the p53 gene may explain its frequent appearance as a
mutational hot spot in human cancer”, Molecular and Cellular Biology, Vol. 14, No.
6, pp. 4225-4232, June.
Makedonski, K., L. Abuhatzira, Y. Kaufman, A. Razin and R. Shemer, 2005, “MeCP2
deficiency in Rett syndrome causes epigenetic aberrations at the PWS/AS imprinting
center that affects UBE3A expression”, Human Molecular Genetics, Vol. 14, No. 8,
pp. 1049-1058, April.
Malone, C. S., M. D. Miner, J. R. Doerr, J. P. Jackson, S. E. Jacobsen, R. Wall and M.
Teitell, 2001, “CmC(A/T)GG DNA methylation in mature B cell lymphoma gene
silencing”, Proceedings of the National Academy of Sciences of the USA, Vol. 98,
No. 18, pp. 10404-10409.
152
Mansouri, A., K. Chowdhury and P. Gruss, 1998, “Follicular cells of the thyroid gland
require Pax8 gene function”, Nature Genetics, Vol. 19, pp. 87-90.
Margueron, R., P. Trojer and D. Reinberg D., 2005, “The key to development: Interpreting
the histone code?”, Current Opinion in Genetics and Development, Vol. 15, pp.163-
176.
Mari, F., S. Azimonti, I. Bertani, F. Bolognese, E. Colombo, R. Caselli, E. Scala, I. Longo,
S. Grosso, C. Pescucci, F. Ariani, G. Hayek, P. Balestri, A. Bergo, G. Badaracco, M.
Zappella, V. Broccoli, A. Renieri, C. Kilstrup-Nielsen and N. Landsberger, 2005,
“CDKL5 belongs to the same molecular pathway of MeCP2 and it is responsible for
the early-onset seizure variant of Rett syndrome”, Human Molecular Genetics, Vol.
14, No. 14, pp. 1935-1946, July.
Marsden, I., C. Jin and X. Liao, 1998, “Structural changes in the region directly adjacent to
the DNA-binding helix highlight a possible mechanism to explain the observed
changes in the sequence-specific binding of winged helix proteins”, Journal of
Molecular Biology, Vol. 278, No. 293-299.
Masutani, C., M. Araki and K. Sugasawa, 1997, “Identification and characterization of
XPC-binding domain of hHR23B”, Molecular and Cellular Biology, Vol. 17, pp.
6915-6923.
Masuyama, T., M. Matsuo, J. J. Jing, Y. Tabara, K. Kitsuki, H. Yamagata, Y. Kan, T.
Miki, K. Ishii and I. Kondo, 2005, “Classic Rett syndrome in a boy with R133C
mutation of MECP2”, Brain and Development, Vol. 27, No. 6, pp. 439-442,
September.
Matarazzo, V., D. Cohen, A. M. Palmer, P. J. Simpson, B. Khokhar, S. J. Pan and G. V.
Ronnett, 2004, ”The transcriptional repressor Mecp2 regulates terminal neuronal
differentiation”, Molecular and Cellular Neurosciences, Vol. 27, No. 1, pp. 44-58,
September.
153
Mechanic, L. E., R. C. Millikan, J. Player, A. R. de Cotret, S. Winkel, K. Worley, K.
Heard, C. K. Tse and T. Keku, 2006, “Polymorphisms in nucleotide excision repair
genes, smoking and breast cancer in African Americans and whites: a population-
based case-control study”, Carcinogenesis, Vol. 27, No. 7, pp. 1377-1385.
Meins, M., J. Lehmann, F. Gerresheim and J. Herchenbach, 2005, “Submicroscopic
duplication in Xq28 causes increased expression of the MECP2 gene in a boy with
severe mental retardation and features of Rett syndrome”, Journal of Medical
Genetics, Vol. 42, pp. 12.
Miao, F., M. Bouziane, R. Dammann, C. Masutani, F. Hanaoka, G. Pfeifer and T. R.
O'Connor, 2000, “3-Methyladenine-DNA glycosylase (MPG protein) interacts with
human RAD23 proteins”, The Journal of Biological Chemistry, Vol. 275, No. 37,
pp. 28433-28438.
Mirza, S., G. Sharma, C.P. Prasad, R. Parshad, A. Srivastava, S.D. Gupta and R.Ralhan,
2007, “Promoter hypermethylation of TMS1, BRCA1, ERalpha and PRB in serum
and tumor DNA of invasive ductal breast carcinoma patients”, Life sciences, Vol. 81,
No. 4, pp. 280-287.
Moretti, P., J. M. Levenson, F. Battaglia, R. Atkinson, R. Teague, B. Antalffy, D.
Armstrong, O. Arancio, J. D. Sweatt and H. Y. Zoghbi, 2006, “Learning and memory
and synaptic plasticity are impaired in a mouse model of Rett syndrome”, Journal of
Neurosciences, Vol. 26, No. 1, pp. 319-327.
Moretti, P. and H. Y. Zoghbi, 2006, “MeCP2 dysfunction in Rett syndrome and related
disorders”, Current Opinion in Genetics and Development, Vol. 16, No. 3, pp. 276-
281.
Morrison, D. K., and R. J. Davis, 2003, “Regulation of MAP kinase signaling modules by
scaffold proteins in mammals”, Annual Review of Cell and Developmental Biology,
Vol. 19, pp. 91-118.
154
Mount, R. H., R. P. Hastings, S. Reilly, H. Cass and T. Charman, 2001, “Behavioural and
emotional features in Rett syndrome”, Disability and Rehabilitation, Vol. 23, No. 3-
4, pp. 129-138.
Nan, X., F. J. Campoy and A.Bird, 1997, “MeCP2 is a transcriptional repressor with
abundant binding sites in genomic chromatin”, Cell, Vol. 88, No. 4, pp. 471-481.
Nikitina, T., R. P. Ghosh, R. A. Horowitz-Scherer, J. C. Hansen, S. A. Grigoryev, and C.
L. Woodcock, 2007, “MeCP2-chromatin interactions include the formation of
chromatosome-like structures and are altered in mutations causing Rett syndrome”,
The Journal of Biological Chemistry, Vol. 282, No. 38, pp. 28237-28245.
Ng, J. M., W. Vermeulen, G. T. van der Horst, S. Bergink, K. Sugasawa, H. Vrieling and J.
H. Hoeijmakers, 2003, “A novel regulation mechanism of DNA repair by damage-
induced and RAD23-dependent stabilization of xeroderma pigmentosum group C
protein”, Genes and Development, Vol. 13, pp. 1630-1645.
Nuber, U. A., S. Kriaucionis, T. C. Roloff, J. Guy, J. Selfridge, C. Steinhoff, R. Schulz, B.
Lipkowitz, H. H. Ropers, M. C. Holmes and A. Bird, 2005, “Up-regulation of
glucocorticoid-regulated genes in a mouse model of Rett syndrome”, Human
Molecular Genetics, Vol. 14, No. 15, pp. 2247-2256, August.
Oka, M., A. M. Meacham, T. Hamazaki, N. Rodić, L. J. Chang and N. Terada, 2005, “De
novo DNA methyltransferases Dnmt3a and Dnmt3b primarily mediate the
cytotoxic effect of 5-aza-2'-deoxycytidine”, Oncogene, Vol. 24, No. 19, pp. 3091-
3099.
Okano, M., D. W. Bell, D. A. Haber and E. Li, 1999, “DNA methyltransferases Dnmt3a
and Dnmt3b are essential for de novo methylation and mammalian development”,
Cell, Vol. 99, No. 3, pp. 247-257.
Okuda, Y., R. Nishi, J.M. Ng, W. Vermeulen, G.T. van der Horst, T. Mori, J.H.
Hoeijmakers, F. Hanaoka and K. Sugasawa, 2004, “Relative levels of the two

155
mammalian Rad23 homologs determine composition and stability of the xeroderma
pigmentosum group C protein complex”, DNA Repair, Vol. 3, No. 10, pp. 1285-
1295.
Olivieri, A., M. A. Stazi, P. Mastroiacovo, C. Fazzini, E. Medda, A. Spagnolo, S. De S.
Angelis, M. E. Grandolfo, D. Taruscio, V. Cordeddu and M. Sorcini, 2002, “A
population-based study on the frequency of additional congenital malformations in
infants with congenital hypothyroidism: data from the Italian Registry for Congenital
Hypothyroidism (1991-1998)”, The Journal of Clinical Endocrinology and
Metabolism, Vol. 87, pp. 557-562.
Orrico, A., C. Lam, L. Galli, M. T. Dotti, G. Hayek, S. F. Tong, P. M. Poon, M. Zappella,
A. Federico and V. Sorrentino, 2000, “MECP2 mutation in male patients with non-
specific X-linked mental retardation”, FEBS Letters, Vol. 481, No. 3, pp. 285-288.
Ortolan, T. G., P. Tongaonkar, D. Lambertson, L. Chen, C. Schauber and K. Madura,
2000, “The DNA repair protein Rad23 is a negative regulator of multi-ubiquitin
chain assembly”, Nature Cell Biology, Vol. 2, pp. 601-608.
Pelka, G. J., C. M. Watson, T. Radziewic, M. Hayward, H. Lahooti, J. Christodoulou and
P. P. Tam, 2006, “Mecp2 deficiency is associated with learning and cognitive
deficits and altered gene activity in the hippocampal region of mice”, Brain, Vol.
129, No. 4, pp. 887-898, April
Peng, B., D. R. Hodge, S. B. Thomas, J. M. Cherry, D. J. Munroe, C. Pompeia, W. Xiao
and W. L. Farrar, 2005, “Epigenetic silencing of the human nucleotide excision
repair gene, hHR23B, in interleukin-6-responsive multiple myeloma KAS-6/1 cells”,
Journal of Biological Chemistry, Vol. 280, No. 6, pp. 4182-4187.
Peterson, C. L. and M. A. Laniel, 2004, “Histones and histone modifications”, Current
Biology, Vol. 14, pp. 546-551.
156
Pierrou, S., M. Hellqvist, L. Samuelsson, S. Enerback and P. Carlsson, 1994, “Cloning and
characterization of seven human forkhead proteins: Binding site specificity and DNA
bending”, EMBO Journal, Vol. 13, No. 5002-5012.
Plachov, D., K. Chowdhury, C. Walther, D. Simon, J-L. Guenet and P. Gruss, 1990, “Pax8,
a murine paired box gene expressed in the developing excretory system and thyroid
gland”, Development, Vol. 116, No. 643-651.
Prestridge, D. S., 1995, “Predicting Pol II promoter sequences using transcription factor
binding sites”, The Journal of Molecular Bology, Vol. 249, No. 5, pp. 923-932.
Raasi, S. and C. M. Pickart, 2003, “Rad23 ubiquitin-associated domains (UBA) inhibit 26
S proteasome-catalyzed proteolysis by sequestering lysine 48-linked polyubiquitin
chains”, The Journal of Molecular Biology, Vol. 278, No. 11, pp. 8951-8959.
Ramsahoye, B. H., D. Biniszkiewicz, F. Lyko, V. Clark, A. P. Bird and R. Jaenisch, 2000,
“Non-CpG methylation is prevalent in embryonic stem cells and may be mediated by
DNA methyltransferase 3a”, Proceedings of the National Academy of Sciences of the
USA, Vol.97, pp. 5237-5242.
Rassoulzadegan, M., M. Magliano and F. Cuzin, 2002, “Transvection effects involving
DNA methylation during meiosis in the mouse”, The EMBO Journal, Vol. 21, No.
3, pp. 440-450.
Refetoff, S., T. Sunthornthepvarakul, M. Gottschalk and Y. Hayashi, 1996, “Resistance to
thyrotropin and other abnormabilities of the thyrotropin receptor”, Recent progress in
Hormone Research, Vol. 51, No. 97-122.
RettBASE, 2008, IRSA MECP2 Variation Database, http://mecp2.chw.edu.au.html.
157
Reiss, A. L., F. Faruque, S. Naidu, M. Abrams, T. Beaty, R. N. Bryan and H. Moser, 1993,
“Neuroanatomy of Rett syndrome: a volumetric imaging study”, Annals of
Neurology, Vol. 34, No. 2, pp. 227-234.
Rett, A., 1966, “Ueber ein eigenartiges hirnatrophisches syndrom bei hyperammoniamie in
kindesalter”, Wien Med Wschr, Vol. 116, pp. 723-738.
Rivero, E. R., A. C. Neves, M. G. Silva-Valenzuela, S. O. Sousa and F. D. Nunes, 2006,
“Simple salting-out method for DNA extraction from formalin-fixed, paraffin-
embedded tissues”, Pathology, Research and Practice, Vol. 202, No. 7, pp. 523-529.
Robbins, J., J. E. Rall and P. Gordon, 1980, “Metabolic Control and Disease”, Sounders,
Philadelphia, pp. 1325-1426.
Rodenhiser, D. and M. Mann, 2006, “Epigenetics and human disease: Translating basic
biology into clinical applications”, Canadian Medical Association Journal, Vol. 174,
No. 3, pp. 341-348.
Scala, E., F. Ariani, F. Mari and R. Caselli, 2005, “CDKL5/STK9 is mutated in Rett
syndrome variant with infantile spasms”, Journal of Medical Genetics, Vol. 42, pp.
103-107.
Scala, E., I. Longo, F. Ottimo and C. Speciale, 2007, “MECP2 deletions and genotype-
phenotype correlation in Rett syndrome”, American Journal of Medical Genetics
Part A, Vol. 143, pp. 2775-2784.
Schaeffer, L., R. Roy, S. Humbert, V. Moncollin, W. Vermeulen, J. H. Hoeijmakers, P.
Chambon and J. M. Egly, 1993, “DNA repair helicase: A component of BTF2
(TFIIH) basic transcription factor”, Science, Vol. 260, pp. 58–63.
Schanen, C., E. J. Houwink, N. Dorrani and J. Lane, 2004, “Phenotypic manifestations of
MECP2 mutations in classical and atypical Rett syndrome”, American Journal of
Medical Genetics, Vol. 126, pp. 129-140.
158
Schauber, C., L. Chen, P. Tongaonkar, I. Vega, D. Lambertson, W. Potts and K. Madura,
1998, “Rad23 links DNA repair to the ubiquitin/ proteasome pathway”, Nature, Vol.
391, pp. 715–718.
Schubert, U, L. C. Anton, J. Gibbs, C. C. Norbury, J. W. Yewdell and J. R. Bennink, 2000,
“Rapid degradation of a large fraction of newly synthesized proteins by
proteasomes”, Nature, Vol. 404, pp. 770-774.
Schuler, M. and D. R. Green, 2005, “Transcription, apoptosis and p53: catch-22”, Trends
in Genetics, Vol. 21, No. 3, pp. 182-187.
Sdek, P., H. Ying, D. L. Chang, W. Qiu, H. Zheng, R. Touitou, M. J. Allday and Z. X.
Xiao, 2005, “MDM2 promotes proteasome-dependent ubiquitin-independent
degradation of retinoblastoma protein”, Molecular Cell, Vol. 20, No. 5, pp. 699-
708.
Segawa, M. and Y. Nomura, 2005, “Rett syndrome”, Current Opinion in Neurology, Vol.
18, No. 2, pp. 97-104.
Sequeira, M., F. Al-Khafaji, S. M. Park, M. D. Lewis, M. H. Wheeler, V. K. K. Chatterjee,
B. Jasani and M. Ludgate, 2003, “Production and application of polyclonal antibody
to human thyroid transcription factor 2 reveals thyroid transcription factor 2 protein
expression in adult thyroid and hair follicles and prepubertal testis”, Thyroid, Vol.
13, pp. 927-932.
Shahbazian, M. D., B. Antalffy, D. L. Armstrong and H. Y. Zoghbi, 2002a, “Insight into
Rett syndrome: MeCP2 levels display tissue- and cell-specific differences and
correlate with neuronal maturation”, Human Molecular Genetics, Vol. 11, No. 2, pp.
115-124, January.
Shahbazian, M. D., J. Young, L. Yuva-Paylor, C. Spencer, B. Antalffy, J. Noebels, D.
Armstrong, R. Paylor and H. Zoghbi, 2002b, “Mice with truncated MeCP2
159
recapitulate many Rett syndrome features and display hyperacetylation of histone
H3”, Nature, Vol. 35, No. 2, pp. 243-254, July.
Shen, M., S. I. Berndt, N. Rothman, D. M. DeMarini, J. L. Mumford, X. He, M. R. Bonner,
L. Tian, M. Yeager, R. Welch, S. Chanock, T. Zheng, N. Caporaso and Q. Lan, 2005,
“Polymorphisms in the DNA nucleotide excision repair genes and lung cancer risk in
Xuan Wei, China”. International Journey of Cancer, Vol. 116, pp. 768–773.
Shi, S. R., R. J. Cote, L. Wu, C. Liu, R. Datar, Y. Shi, D. Liu, H. Lim and C. R. Taylor,
2002, “DNA extraction from archival formalin-fixed, paraffin-embedded tissue
sections based on the antigen retrieval principle: heating under the influence of pH”,
The Journal of Histochemistry and Cytochemistry, Vol. 50, No. 8, pp. 1005-1011.
Shimizu, Y., S. Iwai, F. Hanaoka and K. Sugasawa, 2003, “ Xeroderma pigmentosum
group C protein interacts physically and functionally with thymine DNA
glycosylase”, EMBO Journal, Vol. 22, No. 1, pp. 164-173.
Simpson, P. T., J. S. Reis-Filho, T. Gale and S. R. Lakhani, 2005, “Molecular evolution of
breast cancer”, Journal of Pathology, Vol. 205, No. 2, pp. 248-254, January.
Sinclair, A., R. Lonigro, D. Civitareale, L. Ghibelli and R. Di Lauro, 1990, “The tissue-
specific expression of the thyroglobulin gene requires interaction between thyroid-
specific and ubiquitous factors”, European Journal of Biochemistry, Vol. 193, No.
311-318.
Slee, E. A., D. J. O'Connor and X. Lu, 2004, “To die or not to die: how does p53 decide?”,
Oncogene, Vol. 23, No. 16, pp. 2809-2818.
Smale, S. T. and J. T. Kadonaga, 2003, “The RNA polymerase II core promoter”, Annual
Review of Biochemistry, Vol. 72, pp. 449-479.
160
Smeets, E., P. Terhal, P. Casaer and A. Peters, 2005, “Rett syndrome in females with CTS
hot spot deletions: a disorder profile”, American Journal of Medical Genetics Part A,
Vol. 132, pp. 117-120.
Stein, S.A., E. L. Oates, C. R. Hall, R. M. Grumbles, L. M. Fernandez, N. A. Taylor, D.
Puett and S. Jin, 1994, “Identification of a point mutation in the thyrotropin receptor
of the hyt/hyt hypothyroid mouse”, Molecular Endocrinology, Vol. 8, No. 129-138.
Strachan, T. and A. P. Read, Human Molecular Genetics, Wiley-Liss, New York, 2003.
Sugasawa, K., J. M. Y. Ng, C. Masutani, T. Maekawa, A. Uchida, P. J. van der Spek, A. P.
M. Eker, S. Rademakers, C. Visser, A. Aboussekhra, R. D. Wood, F. Hanaoka, D.
Bootsma and J. H. J. Hoeijmakers, 1997, “Two human homologs of Rad23 are
functionally interchangeable in complex formation and stimulation of XPC repair
activity”, Molecular Cell Biology, Vol. 17, pp. 6924–6931.
Sugasawa, K., J. M. Ng, C. Masutani, S. Iwai, P. J. van der Spek, A. P. Eker, F. Hanaoka,
D. Bootsma and J. H. Hoeijmakers, 1998, “Xeroderma pigmentosum group C protein
complex is the initiator of global genome nucleotide excision repair”, Molecular
Cell, Vol. 2, pp. 223–232.
Szyf, M., “Targeting DNA methylation in cancer”, 2006, Bulletin du Cancer, Vol. 93, No.
9, pp. 961-972.
Thoma, B. S. and K. M. Vasquez, 2003, “Critical DNA damage recognition functions of
XPC-hHR23B and XPA-RPA in nucleotide excision repair”, Molecular
Carcinogenesis, Vol. 38, No. 1, pp. 1-13.
Toublanc, J.E., 1992, “Comparaison of epidemiological data on congenital hypothyroidism
in Europe with those of other parts in the world”, Hormone Research, Vol. 38, No.
230-235.
161
Trappe, R., F. Laccone, J. Cobilanschi, M. Meins, P. Huppke, F. Hanefeld and W. Engel,
2001, “MECP2 mutations in sporadic cases of Rett syndrome are almost exclusively
of paternal origin”, American Journal of Human Genetics, Vol. 68, No. 5, pp. 1093-
1091, May.
Tudor, M., S. Akbarian, R. Z. Chen and R. Jaenisch, 2002, “Transcriptional profiling of a
mouse model for Rett syndrome reveals subtle transcriptional changes in the brain”,
Proceedings of the National Academy of Sciences of the United States of America,
Vol. 99, No. 24, pp. 15536-15541, November.
Van Dam, H., M. Duyndam, R. Rottier, A. Bosch, L. de Vries-Smits, P. Herrlich, A.
Zantema, P. Angel, and A. J. van der Eb, 1993, “Heterodimer formation of cJun and
ATF-2 is responsible for induction of c-jun by the 243 amino acid adenovirus E1A
protein”, EMBO Journal, Vol. 12, pp. 479-487.
Van der Spek, P. J., C. E. Visser, F. Hanaoka, B. Smit, A. Hagemeijer, D. Bootsma and J.
H. Hoeijmakers, 1996, “Cloning, comparative mapping, and RNA expression of the
mouse homologous of the Saccharomyces cerevisiae nucleotide excision repair gene
RAD23”, Genomics, Vol. 31, pp. 20–27.
Van Dongen, M. J., A. Cederberg, P. Carlsson, S. Enerback and M. Wikstrom, 2000,
“Solution structure and dynamics of the DNA-binding domain of the adipocyte-
transcription factor FREAC-11”, Journal Molecular Biology, Vol. 296, No. 351-359.
Van Esch, H., M. Bauters, J. Ignatius and M. Jansen, 2005, “Duplication of the MECP2
region is a frequent cause of severe mental retardation and progressive neurological
symptoms in males”, American Journal of Human Genetics, Vol. 77, pp. 442-453.
Veerla, S., I. Panagopoulos, Y. Jin, D. Lindgren and M. Höglund, 2008, “Promoter
analysis of epigenetically controlled genes in bladder cancer”, Genes Chromosomes
Cancer, Vol. 47, No. 5, pp. 368-378.
162
Vilain, C., C. Rydlewski, L. Duprez, C. Heinrichs, M. Abramowicz, P. Malvaux, B.
Renneborg, J. Parma, S. Costagliola and G. Vassart, 2001, “Autosomal dominant
transmission of congenital thyroid hypoplasia due to loss-of-function mutation of
PAX8”, The Journal of Clinical Endocrinology and Metabolism, Vol. 86, No. 234-
238.
Wan, M., S. S. Lee, X. Zhang, I. Houwink-Manville, H. R. Song, R. E. Amir, S. Budden,
S. Naidu, J. L. Pereira, I. F. Lo, H. Y. Zoghbi, N. C. Schanen and U. Francke, 1999,
“Rett syndrome and beyond: recurrent spontaneous and familial MECP2 mutations at
CpG hotspots”, American Journal of Human Genetics, Vol. 65, No. 6, pp. 1520-
1529, December.
Watkins, J.F., P. Sung, L. Prakash and S. Prakash, 1993, “The Saccharomyces cerevisiae
DNA repair gene RAD23 encodes a nuclear protein containing a ubiquitin-like
domain required for biological function”, Molecular and cellular biology, Vol. 13,
pp. 7757–7765.
Watson, P., G. Black, S. Ramsden and M. Barrow, 2001, “Angelman syndrome phenotype
associated with mutations in MECP2, a gene encoding a methyl CpG binding
protein”, Journal of Medical Genetics, Vol. 38, pp. 224-228.
Weaving, L. S., J. Christodoulou, S. L. Williamson and K. L. Friend, 2004, “Mutations of
CDKL5 cause a severe n.eurodevelopmental disorder with infantile spasms and
mental retardation”, American Journal of Human Genetics, Vol. 75, pp. 1079-1093.
Weaving, L. S., C. J. Ellaway, J. Gecz and J. Christodoulou, 2005, “Rett syndrome:
clinical review and genetic update”, Journal of Medical Genetics, Vol. 42, pp. 1-7.
Webb, T. and F. Latif, 2001, “Rett syndrome and the MECP2 gene”, Journal of Medical
Genetics, Vol. 38, pp. 217-223.
163
Weigel, D., G. Jurgens, F. Kuttner, E. Seifert and H. Jackle, 1989, “The homeotic gene
fork head encodes a nuclear protein and is expressed in the terminal regions of the
Drosophila embryo”, Cell, Vol. 57, No. 645-658.
Weigelt, J., I. Climent, K. Dahlman-Wright and M. Wikstrom, 2001, “Solution structure of
the dna binding domain of the human forkhead transcription factor afx (foxo4)”,
Biochemistry, Vol. 40, No. 5861-5869.
Weiss, S.J., N. J. Philp and E. F. Grollman, 1984, “Iodide transport in a continuous line of
cultured cells from rat thyroid”, Endocrinology, Vol. 114, No. 1090-1098.
Widschwendter, M. and P.A. Jones, 2002, “DNA methylation and breast carcinogenesis”,
Oncogene, Vol. 21, No. 35, pp. 5462-82, August.
Yamaguchi, R. And A. Dutta, 2000, “Proteasome inhibitors alter the orderly progression of
DNA synthesis during S-phase in HeLa cells and lead to replication of DNA”,
Experimental Cell Research, Vol. 261, pp. 271-283.
Yang, C., E. Bolotin, T. Jiang, F. M. Sladek and E. Martinez, 2007, “Prevalence of the
initiator over the TATA box in human and yeast genes and identification of DNA
motifs enriched in human TATA-less core promoters”, Gene, Vol. 389, No. 1, pp.
52-65.
Yasui, D. H., S. Peddada, M. C. Bieda, R. O. Vallero, A. Hogart, R. P. Nagarajan, K. N.
Thatcher, P. J. Farnham and J. M. Lasalle, 2007, “Integrated epigenomic analyses of
neuronal MeCP2 reveal a role for long-range interaction with active genes”,
Proceedings of the National Academy of Sciences of the United States of America,
Vol. 104, No. 49, pp. 19416-19421, December.
Yıldız, T. S., M. Solak, I. Baris and K. Toker, 2006, “Unexpected prolonged paralysis after
mivacurium in a patient with Bamforth syndrome”, Paediatric Anaesthesia, Vol. 16,
pp. 892-894, August.
164
Young, J. I., E. P. Hong, J. C. Castle, J. Crespo-Barreto, A. B. Bowman, M. F. Rose, D.
Kang, R. Richman, J. M. Johnson, S. Berget and H.Y.Zoghbi, 2005, “Regulation of
RNA splicing by the methylation-dependent transcriptional repressor methyl-CpG
binding protein 2”, Proceedings of the National Academy of Sciences of the United
States of America, Vol. 102, No. 49, pp. 17551-17558, December.
Zannini, M., H. Francis-Lang, D. Plachov and R. Di Lauro, 1992, “Pax-8, a paired domain-
containing protein, binds to a sequence overlapping the recognition site of a
homeodomain and activates transcription from two thyroid-specific promoters”,
Molecular and Cellular Biology, Vol. 12, No. 9, pp. 4230-4241, September.
Zannini, M., V. Avantaggiato, E. Biffali, M. I. Arnone, K. Sato, M. Pischetola, B. A.
Taylor, S. J. Phillips, A. Simeone and R. Di Lauro, 1997, “TTF-2, a new forkhead
protein, shows a temporal expression in the developing thyroid which is consistent
with a role in controlling the onset of the differentiation”, EMBO Journal, Vol. 16,
pp. 3185-3197.
Zappella, M., I. Meloni, I. Longo and G. Hayek, 2001, “Preserved speech variants of the
Rett syndrome: molecular and clinical analysis”, American Journal of Medical
Genetics, Vol. 104, No. 1, pp. 14-22, November.
Zhu, Q., G. Wani, M. A. Wani and A. A. Wani, 2001, “Human homologue of yeast Rad23
protein A interacts with p300/cyclic AMP-responsive element binding (CREB)-
binding protein to down-regulate transcriptional activity of p53”, Cancer Research,
Vol. 61, No. 1, pp. 64-70, January.