formentalhealth: workforceshortagesin low-andmiddle-income...
56
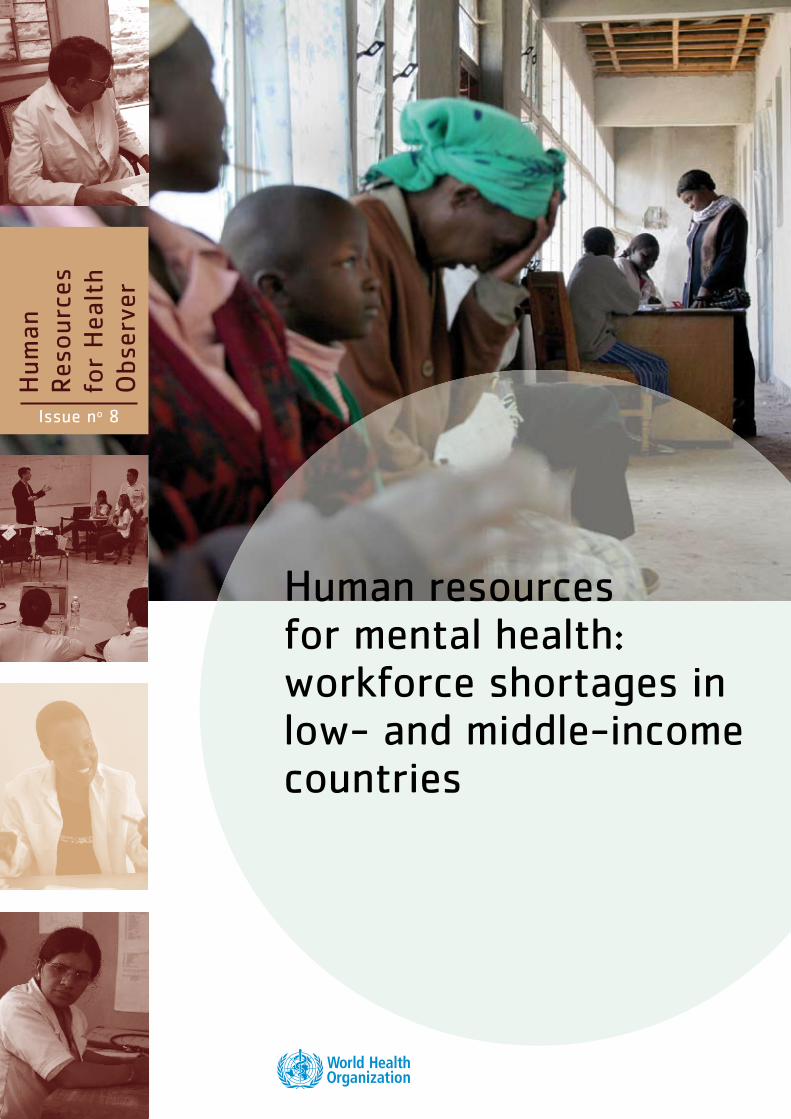
Human Resources for Health Observer Issue n o 8 Human resources for mental health: workforce shortages in low- and middle-income countries
-
Upload
phamkhuong -
Category
Documents
-
view
215 -
download
1
Transcript of formentalhealth: workforceshortagesin low-andmiddle-income...
Hum
anResou
rces
forHea
lth
Obs
erve
r
Issue no 8
Human resourcesfor mental health:workforce shortages inlow- and middle-incomecountries
HRH_issue8_Proposals:Mise en page 1 11.2.2011 15:45 Page 1
WHO Library Cataloguing-in-Publication Data
Human resources for mental health: workforce shortages in low- and middle-income countries / Richard M. Scheffler [… et al].
(Human Resources for Health Observer, 8)
1.Health personnel - organization and administration. 2.Health personnel - statistics. 3.Health manpower - utilization. 4.Mental disorders - epidemiology. 5.Mental health services - trends. 6.Developing countries. I.Scheffler, Richard M. II. World Health Organization. III.Series.
ISBN 978 92 4 150101 9 (NLM classification: W 76)
© World Health Organization 2011All rights reserved. Publications of the World Health Organization can be obtained from WHO Press, World Health Organization, 20 Avenue Appia, 1211 Geneva 27, Switzerland (tel.: +41 22 791 3264; fax: +41 22 791 4857; e-mail: [email protected]). Requests for permission to reproduce or translate WHO publications – whether for sale or for noncommercial distribution – should be addressed to WHO Press, at the above address (fax: +41 22 791 4806; e-mail: [email protected]).
The designations employed and the presentation of the material in this publication do not imply the expression of any opinion whatsoever on the part of the World Health Organization concerning the legal status of any country, territory, city or area or of its authorities, or concerning the delimitation of its frontiers or boundaries. Dotted lines on maps represent approximate border lines for which there may not yet be full agreement.
The mention of specific companies or of certain manufacturers’ products does not imply that they are endorsed or recommended by the World Health Organization in preference to others of a similar nature that are not mentioned. Errors and omissions excepted, the names of proprietary products are distinguished by initial capital letters.
All reasonable precautions have been taken by the World Health Organization to verify the information contained in this publication. However, the published material is being distributed without warranty of any kind, either expressed or implied. The responsibility for the interpretation and use of the material lies with the reader. In no event shall the World Health Organization be liable for damages arising from its use.
The named authors alone are responsible for the views expressed in this publication.
Design: Atelier-Rasmussen / GenevaPrinted in France / February 2011
Human resources for mental health:workforce shortages in low- and middle-income countries

iii
Acknowledgements
This paper was written by Richard M. Scheffler1, Tim A. Bruckner2, Brent D. Fulton1, Jangho Yoon3, Gordon Shen4, Dan Chisholm5, Jodi Morris6, Mario R. Dal Poz7, Shekhar Saxena6.
The analytical work and the report were coordinated in close collaboration with the WHO/PAHO Collaborating Center on Health Workforce Economics Research (Global Center for Health Economics and Policy Research, University of Berkeley) and the World Health Organization (Departments of Mental Health and Substance Abuse, Health Systems Financing, and Human Resources for Health).
Tim A. Bruckner and Gordon Shen were supported by the Agency for Health Research and Quality, Health Services Research Training Program, T32 HS000086, while at the University of California, Berkeley. Jangho Yoon was supported by the National Institute of Mental Health, Mental Health Economics Training Program, T32 MH070335, while at the University of California, Berkeley.
Funding support of United States Agency for International Development (USAID) is acknowledged as part of their contribution to WHO’s work on strengthening Human Resources for Health metrics.
1 Global Center for Health Economics and Policy Research, School of Public Health, University of California, Berkeley, USA
2 Public Health & Planning, Policy and Design, University of California, Irvine, USA
3 Jiann-Ping Hsu College of Public Health, Georgia Southern University, Statesboro, USA
4 Health Services and Policy Analysis Ph.D. Program, University of California, Berkeley, USA
5 Department of Health Systems Financing, World Health Organization, Geneva, Switzerland
6 Department of Mental Health and Substance Abuse, World Health Organization, Geneva, Switzerland
7 Department of Human Resources for Health, World Health Organization, Geneva, Switzerland

iv
v
Table of contents
Abbreviations and acronyms vi
Executive summary vii
Introduction 1
Methodology 2
Estimate of needed mental health workers based on treatment needs 6
Mental health workforce shortages and wage bill to remove shortages 8
Summary and results for all low- and middle-income countries 11
Policy discussion and conclusions 13
References 14
Appendix 1. Country-level supplemental tables 17
Table 1. LMIC included in analysis (n=58), by geographic region 3
Table 2. Prevalence (%) of mental, neurological and substance use disorders identified in mhGAP report, LMIC (n=58) 17
Table 3. Target coverage rates for mhGAP conditions, LMIC 5
Table 4. Target population in 58 LMIC that requires treatment for MNS disorders 20
Table 5. Percentage of target cases within 58 LMIC attributable to specific MNS disorders 23
Table 6. Total expected annual outpatient visits and inpatient days for target cases with MNS disorders in 58 LMIC 26
Table 7. Staffing proportions by health-care setting and country income classification 7
Table 8. Estimated full-time equivalent staff needed to treat mental disorders in 58 LMIC, 2005 28
Table 9. Shortage of mental health workers in 58 LMIC, 2005 31
Table 10. Shortage calculations by surplus offset method for 58 LMIC, 2005 9
Table 11. Scaling-up cost (wage bill) estimates to remove current shortage of mental health workers in 58 LMIC in 2005 34
Table 12. Expected full-time equivalent staff needed to treat mental disorders for 58 LMIC, 2015 36
Table 13. Shortage of mental health workers in 58 LMIC, 2015 38
Table 14. Scaling-up cost (wage bill) estimates to remove shortage of mental health workers in 58 LMIC in 2015 41
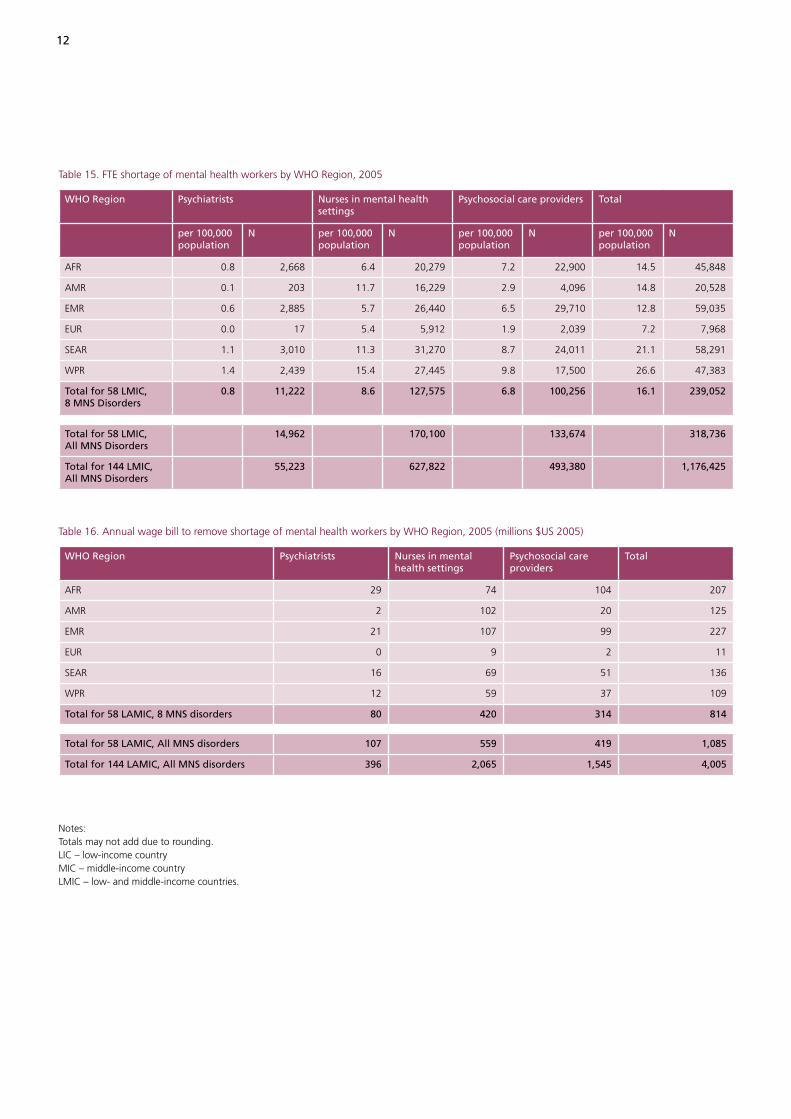
Table 15. FTE shortage of mental health workers by WHO region, 2005 12
Table 16. Annual wage bill to remove shortage of mental health workers by WHO region, 2005 12
Table 17. Other medical doctors in mental health settings by country 43
Table 18. Predicted proportion of other medical doctors 45
Appendix 2. Other medical doctors in mental health settings 43
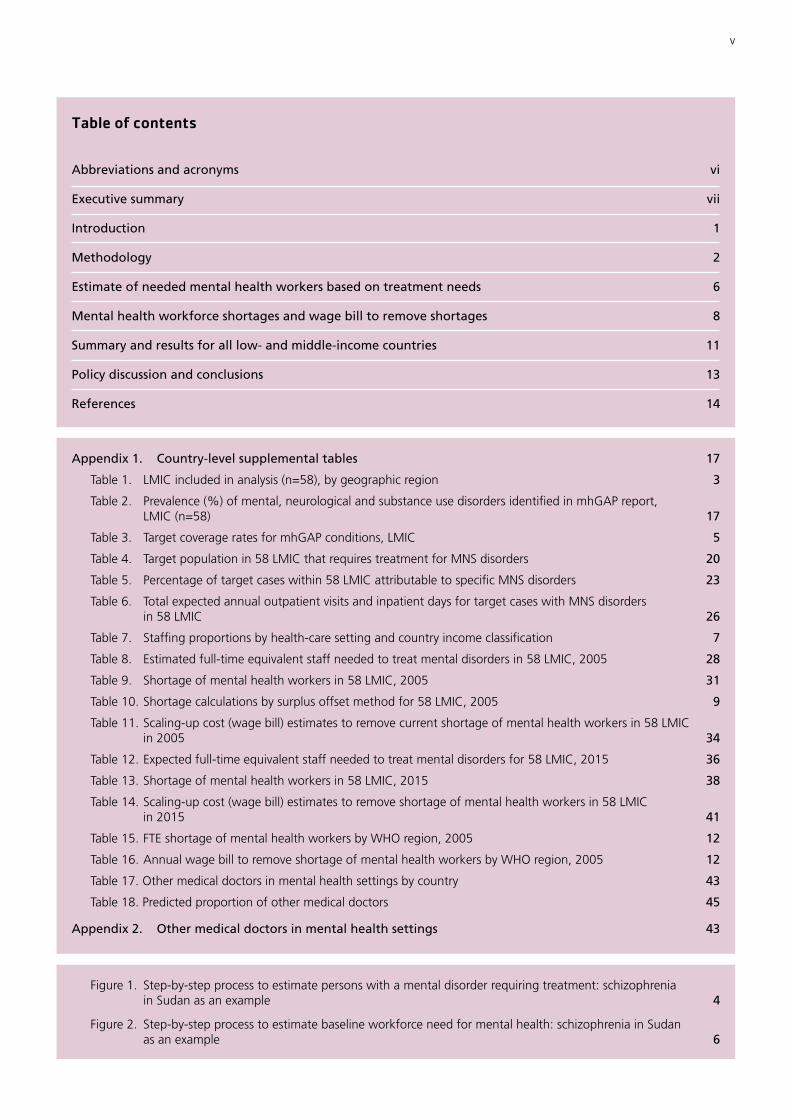
Figure 1. Step-by-step process to estimate persons with a mental disorder requiring treatment: schizophrenia in Sudan as an example 4
Figure 2. Step-by-step process to estimate baseline workforce need for mental health: schizophrenia in Sudan as an example 6
vi
Abbreviations and acronyms
AFR WHO African Region
AMR WHO Region of the Americas
AIC Akaike’s Information Criterion
CHOICE CHOosing Interventions that are Cost Effective
EMR WHO Eastern Mediterranean Region
EUR WHO European Region
FTE Full-Time Equivalent (staff)
ICD-10 International Classification of Disease
LIC Low-Income Countries
LMIC Low- and Middle-Income Countries
mhGAP mental health Gap Action Programme
MIC Middle-Income Countries
MNS Mental, Neurological and Substance use
SEAR WHO South-East Asia Region
WHO AIMS WHO Assessment Instrument for Mental Health Systems
WPR WHO Western Pacific Region
vii
Executive summary
Mental, neurological and substance use (MNS) disorders account for an estimated 14% of the global burden of disease, yet mental health routinely receives a low funding priority from governments. While evidence indicates there are insufficient numbers of mental health workers in low- and middle-income countries (LMIC) to meet the population needs, there are no rigorous estimates of the size of the mental health workforce shortage and the wage bill that would be required to remove the shortage.
This report aims to fill that gap by estimating the number of mental health workers required to treat MNS conditions. The workforce shortage is estimated based on comparing this needed number of mental health workers with the supply. The wage bill required to remove the shortage is based on mental health worker wages.
The principal datasets include the 2005 WHO Assessment Instrument for Mental Health Systems (WHO-AIMS) and the 2004 WHO Global Burden of Disease Report. The data were available for 58 LMIC and we extrapolate our results from these countries to all 144 LMIC. The results are for 2005, the latest year with reliable data, as well as for 2015, the target year of the United Nations Millennium Development Goals.
For each of the 58 LMIC, we estimated the number of mental health workers needed by applying service delivery models to the prevalence in each country of the following eight priority MNS conditions identified by the WHO Mental Health Gap Action Programme (mhGAP) report: depression; schizophrenia and other psychotic disorders; suicide; epilepsy; dementia; disorders due to the use of alcohol; disorders due to the use of illicit drugs; and mental disorders in children. Second, we subtracted the number of workers needed from the 2005 supply of mental health workers to estimate a shortage (or surplus). We repeated these steps for 2015. Third, we multi-plied the shortages by annual wages to estimate the wage bill required to remove the shortages in 2005 and 2015.
1 Dollars are stated in 2009 dollars and are based on the average
inflation rate between the year of the data and 2009.
In 2005, for the 144 LMIC, we found a shortage of 1.18 million workers, including 55,000 psychiatrists, 628,000 nurses in mental health settings and 493,000 psychosocial care providers. The annual wage bill to remove this shortage would be about US$ 4.4 billion (2009 dollars).1
In 2015, if the supply of mental health workers were to remain unchanged from 2005, and using population projections to update the number of workers that would be needed, the mental health worker shortage would increase from an estimated 1.18 million workers in 2005 to an estimated 1.71 million workers in 2015, representing a 45% increase. The annual wage bill to remove this shortage would be about US$ 6.4 billion (2009 dollars).
To meet the treatment needs for MNS disorders, our analysis provides benchmarks for human resources for mental health well into the future. The workforce represents one key component of the mental health system. However, to address the three main shortcomings of mental health care in most LMIC – scarcity, inequity and inefficiency – governments will need to take a comprehensive approach. Such a strategy will require, at the minimum, the allocation of health budgets towards MNS disorders. This is more likely if MNS disorders are destigmatized, there is a well-trained mental health workforce, and concerted efforts are made to increase the productivity of mental health workers.

viii
ment or supplies; there can be no scale up in resources unless the workforce is bolstered.
Since approximately 2000, several reports have listed the labour force as a key component in developing mental health systems. The World Health Report 2001 – Mental Health: New Understanding, New Hope proposed staffing be segmented: primary care for initial care; and specialty care for a wider range of services (9). Specialty care teams include health and allied health professionals, such as psychiatrists, psychologists, nurses, social workers, physical therapists, occupational therapists, law enforcement officers, clergy and traditional healers. In addition, the World Health Report 2006 – Working Together for Health, noted that the shift from institution- to community-based care requires innovative and multidisciplinary methods (13). Moreover, the 2007 Lancet series on global mental health said that resources allocated for mental health systems remained insufficient, inequitably distributed and inefficiently used (14). A survey of international mental health experts and leaders concluded that a shortage of trained mental health workers was one of five key barriers to improving mental health services in LMIC (15). The WHO mental health Gap Action Programme (mhGAP), endorsed by the 55th World Health Assembly in 2002, called for the distribution of health professionals to be more closely aligned with the global burden of MNS disorder (16). The mhGAP report is an important step in assessing the global landscape of mental health resources.
Increasing the mental health workforce of LMIC has been recommended for more than 30 years (17,9), but progress has been slow. The lack of progress may arise, in part, from the absence of clear, quantitative benchmarks to guide the prudent allocation of human resources in mental health.
This report aims to provide government officials, educators, health care planners and policy-makers with quantitative esti-mates of the human resources required to adequately treat populations in LMIC. Specifically, this report estimates the gap between the supply and the number of mental health workers needed for 58 LMIC as of 2005, the latest year with the most reliable data. Second, for each LMIC, we estimate what this gap might be in 2015, the target year for the achievement of the United Nations’ Millennium Development Goals (18). Third, we estimate the annual wage bill required to fill these resource gaps by country. Fourth, we extrapolate the results from these 58 LMIC to all 144 LMIC. For further information on this approach, refer to the study, The Mental Health Workforce Gap in Low and Middle Income Countries: A Needs-Based Approach (19).
Introduction
Mental, neurological and substance use (MNS) disorders account for an estimated 14% of the global burden of disease (1). Up to 30% of the population has some form of MNS disorder each year (2). These disorders result in direct economic costs of mental healthcare and indirect economic costs of lost productivity, impaired functioning and premature death (3).
Several reports suggest cost-effective strategies to reduce the disability associated with MNS disorders (4). Despite the availability of these strategies, the number of people with mental disorders who receive adequate treatment remains disturbingly low (5). This gap between need and availability of treatment is especially wide in low-income countries (LIC) and middle-income countries (MIC), collectively referred to as LMIC (low- and middle-income countries). In these countries, treat-ment rates for mental disorders range from 35–50% (5,6,7).
Mental health routinely receives a low funding priority from governments. Based on a 2001 survey conducted by WHO as part of Project Atlas, 32% of 191 countries did not have a specific mental health budget (8). Of the 89 countries that reported budget information within the survey, 36% spent less than 1% of their health budget on mental health.
The evidence indicates a considerable gap between the global burden of MNS disorders and the financial and human resources being made available for their treatment and prevention. The magnitude of this public health problem poses a crucial question: do health systems meet the needs of those with MNS disorders? To strengthen the global mental health workforce – as part of mental health system development agenda – it is essential to know whether the current mental health workforce is able to meet the needs of those with MNS disorders. This report is designed to help us make that assessment.
Given the inadequacy of mental health resources, researchers, policy-makers and international agencies have asked governments to “scale up” their health services and systems devoted to mental health (9,10,11,12). Psychia-trists, nurses in mental health settings and psychosocial health workers2 provide the foundation for an effective mental health system. Without sufficient health workers, it will remain difficult for LMIC to adequately treat their populations. Mental health services depend primarily on trained human resources rather than sophisticated equip-
2 Nursing care providers include general nurses working in mental health
settings and psychiatric nurses. Psychosocial care providers include
psychologists, medical officers, social/rehabilitation workers, occupational
therapists, community mental health workers, primary care workers
and counsellors. We did not include neurologists in this classification.
Although mental health disorders are sometimes diagnosed and treated
in primary care settings, we did not include primary care workers because
our focus was on mental health specialists.
2
Our report focuses on the eight priority conditions identified in mhGAP, which account for an estimated 75% of the total global burden of MNS disorders.5 Many of these conditions have cost-effective interventions (20,21). To calculate theoverall burden of mental disorders in LMIC, we used informa-tion from the most reliable sources available (discussed below). In the following pages, we outline each step of this process.
We focused our analysis on those LMIC with sufficient data to permit estimates of the need and supply of mental health workforces. To meet this standard, the country required the following characteristics:
• World Bank designation as a low- or middle- income country
• Up-to-date population estimates from a census
• Prevalence estimates of eight mhGAP priority MNS conditions
• Participation in 2005–2008 WHO-AIMS assessment instrument, which contains several indicators on the existing mental health workforce
In 2005, 58 countries met these criteria. Table 1 (page 3) lists the participating countries. These countries cover all six desig-nated WHO geographic regions and 11 of the 14 subregions.
5 This estimate is based on DALY (disability-adjusted life year) estimates
from the 2004 WHO Global Burden of Disease Report, which found
that in LMIC, the eight mhGAP priority conditions account for about
75% of the global burden of neuropsychiatric disorders.
Structure of the reportIn the second section, (methodology), we use the prevalence of MNS disorders, along with demographic variables, to estimate the proportion of the population in low- and middle-income countries requiring mental health treatment. The third section (estimate of needed mental health workers based on treatment needs) applies service delivery estimates to the treated population to arrive at the number of mental health workers needed to provide the care. The fourth section (mental health workforce shortages and wage bill to remove them) compares the number of needed workers with the supply of workers to estimate the mental health work-force shortage (or surplus); this section includes estimates of the annual wage bill required to remove the shortage. This section also provides forecasts of the need, shortage and wage bill estimates for 2015. The fifth section (summary and results for all low- and middle income countries), integrates and discusses the quantitative findings, and presents them by WHO region. It extrapolates the results from the 58 LMIC to all 144 LMIC. The sixth section provides a policy discussion and conclusions.
Methodology
In 2008, WHO published the Mental Health Gap Action Programme (mhGAP) (16). This report was a planning guide for LMIC to scale up care for MNS disorders. The mhGAP specifies eight disorders that treatment planners should prioritize. To meet the priority definition, the condition must impose substantial disability, morbidity or mortality, lead to high economic costs or be associated with violations of human rights.3 Based on these criteria, WHO identified the following eight priority conditions: depression; schizophrenia and other psychotic disorders; suicide; epilepsy; dementia; disorders due to the use of alcohol; disorders due to the use of illicit drugs; and mental disorders in children.4
3 Disability represents the largest proportion of the burden of MNS
disorders, although premature mortality is also substantial. The
economic burden associated with MNS disorders includes, but is not
limited to: loss of employment; loss of income; and the cost of
medications and social services.
4 For a description of the burden, costs, and human rights violations
associated with these conditions, we refer the reader to Annex 1
(page 28) of (16)
3
Table 1. LMIC included in analysis (n=58), by geographic region
Country Income classification Population (2005)
African
Benin LIC 7,869,000
Burundi LIC 7,377,000
Eritrea LIC 4,475,000
Ethiopia LIC 75,662,000
Nigeria LIC 140,881,000
Uganda LIC 28,701,000
Congo MIC 3,416,000
South Africa MIC 48,073,000
Americas
Argentina MIC 38,732,000
Belize MIC 283,000
Bolivia MIC 9,183,000
Chile MIC 16,298,000
Costa Rica MIC 4,330,000
Dominican Republic MIC 9,536,000
Ecuador MIC 13,065,000
El Salvador MIC 6,060,000
Guatemala MIC 12,710,000
Guyana MIC 761,000
Honduras MIC 6,891,000
Jamaica MIC 2,666,000
Nicaragua MIC 5,454,000
Panama MIC 3,229,000
Paraguay MIC 5,906,000
Suriname MIC 497,000
Uruguay MIC 3,327,000
Eastern Mediterranean
Afghanistan LIC 24,507,000
Pakistan LIC 165,816,000
Somaliland LIC 8,353,000
Djibouti MIC 804,000
Egypt MIC 77,155,000
Iran MIC 70,768,000
Iraq MIC 28,240,000
Jordan MIC 5,565,000
Morocco MIC 30,493,000
Sudan MIC 38,699,000
Tunisia MIC 9,878,000
Country Income classification Population (2005)
European
Tajikistan LIC 6,538,000
Uzbekistan LIC 26,320,000
Albania MIC 3,112,000
Armenia MIC 3,065,000
Azerbaijan MIC 8,444,000
Georgia MIC 4,464,000
Kyrgyzstan MIC 5,224,000
Latvia MIC 2,292,000
Republic of Moldova MIC 3,756,000
Ukraine MIC 46,935,000
South-East Asia
Bangladesh LIC 153,121,000
Nepal LIC 27,221,000
Bhutan MIC 649,000
India-Uttarakhand MIC 9,073,000
Maldives MIC 293,000
Sri Lanka MIC 19,532,000
Thailand MIC 65,945,000
Timor-Leste MIC 991,000
Western Pacific
Viet Nam LIC 84,074,000
China-Hunan MIC 6,325,999
Mongolia MIC 2,549,000
Philippines MIC 85,495,000
Total 1,481,078,999
LIC – low-income country. MIC – middle-income country. LMIC – low- and middle-income countries.
4
Figure 1 describes the analytic process to estimate the number of individuals, by MNS disorder and country, who need treatment. We used schizophrenia in Sudan as an example. The first step to quantify workforce needs was to identify in each LMIC the population with MNS disorders. Ideally, this
process would use population-based surveys for each LMIC to estimate the prevalence of MNS disorders. Prevalence for each disorder would then be multiplied by the population at risk of the disorder to yield the estimated number of cases. This step would be repeated for the eight mhGAP priority conditions.
In many LMIC, however, population-level prevalence data are not available. In the absence of such, we estimated prevalence from two reliable sources. First, the 2004 WHO Global Burden of Disease Project has developed prevalence estimates for each WHO subregion, based on comprehensive reviews and syntheses of the available epidemiological evidence.6, 7 We applied those subregional estimates to the 58 countries. As a second source, for MNS disorders not included in the 2004 Global Burden of Disease Project (i.e., illicit substance-use
6 We used the 2004 GBD estimates for six disorders: schizophrenia,
bipolar disorder, depression, alcohol use disorder, dementia, epilepsy,
and suicide. The 2004 GBD estimates are a reasonable substitute for
the 2005 estimates, because the prevalences are stable over this
short time period. Regarding suicide estimates, we incorporated
suicidal ideation by multiplying suicide death rates by a factor of 20
(the estimated number of ideations per suicide), consistent with the
literature (22,23,24).
7 We refer the reader to the WHO technical appendix for a detailed
description of the prevalence estimation for each cause: Available
under “Cause-Specific Documentation” at: http://www.who.int/
healthinfo/global_burden_disease/data_sources_methods/en/
index.html.
disorders (25), childhood mental disorders8), we based our estimates on the best available prevalence data from the peer-reviewed epidemiologic literature.9
Table 2 (page 17) displays the prevalence estimates of the eight mhGAP priority conditions for each LMIC.10 As reflected in the table, we further classified illicit substance-use disor-ders and childhood mental disorders by subcategory, as each subcategory requires distinct treatments and human resource levels. The prevalence estimates indicate the number of cases per population per year that meet the International Classifi-cation of Disease (ICD-10) case definition for that disorder.11
8 The prevalence of childhood mental disorders reflects WHO expert
panel opinion, based on an extensive review of the literature.
9 As a sensitivity analysis to estimate the needed number of mental
health workers, we increased and decreased the prevalence of each
of the eight mhGAP priority conditions by 20% (see Table 8
Confidence interval, page 28).
10 Disease and injury regional estimates for 2004. prev 6_2004.XLS table
downloaded at: http://www.who.int/healthinfo/global_burden_
disease/estimates_regional/en/index.html
11 Please refer to Table 2 Footnotes (page 17) for a list of the case
definitions used.
Figure 1. Step-by-step process to estimate persons with a mental disorder requiring treatment: schizophrenia in Sudan as an example
Step 1 Estimate prevalence of schizophrenia in Sudan.
3.6 cases per 1,000 persons
Step 2 Multiply prevalence by the population of adults in Sudan to yield the number of persons with schizophrenia
3.6 cases per 1,000 persons X 22,946,000 = 81,897
Step 3 Multiply number of persons with schizophrenia by a target coverage rate accepted by the peer-reviewed literature
81,897 X 80% coverage = 65,517
Target number of persons with schizophrenia in Sudan needing treatment: 65,517
Sources Step 1: WHO Global Burden of Disease, 2004.Step 2: United Nations Population Reference Bureau, 2008 Revision. Step 3: Chisholm et al., Br J Psych 2007;191: 528-35.
5
least one of the eight mhGAP priority conditions. Table 5 (page 23) shows the share of the total cases requiring treatment for each of the eight mhGAP priority conditions. This table allows countries to compare their burden of mental disorders with other LMIC. Childhood disorders account for the largest proportion of cases in LIC (32%) and the second largest in MIC (22%, second to depression). In MIC, dementia accounts for 3.6% of all cases, whereas in LIC it accounts for only 1.9% of cases. The reason for this almost two-fold difference in the proportionate burden of dementia is that dementia is more prevalent in older people and MIC have more older people.16 Notably, the European Region has the largest proportion of MNS cases requiring treatment for alcohol-use disorders (23%).
16 6.2% of the population in MIC report >65 years of age, compared
with only 3.7% in LIC.
Population and target coverage ratesThe next step to identify the population needing mental health treatment was to apply each country’s population size to the prevalence of MNS disorders. With the exception of China (Hunan province) and India (Uttarakhand state),12 2005 population census estimates for LMIC were taken from the population database of the United Nations Population Division (see Table 1, page 3).13 We then multiplied the prevalence by population size, taking into account the age groups affected by each disorder. For example, with child MNS disorders, we multiplied only the child population size (age, less than 15 years) by the prevalence of child disorders to yield the total number of child cases.
In LMIC with limited health resources, it is unreasonable to expect that all MNS disorders in the population will receive treatment. Some individuals may not seek treatment, while screening the entire population to identify disorder is not feasible. Given these circumstances, the target rates of coverage for each disorder were determined from the literature and by consultation with international mental health experts.14 Table 3 (page 5) reports target coverage rates for the mhGAP priority conditions and their sources. These normative rates reflect both disability severity and the ability of public health systems to identify and treat cases. Target coverage ranges from 80% (severely disabling condi-tions such as schizophrenia and bipolar disorder) to 20% of cases (e.g., childhood intellectual disability).15
Target population needing treatmentTable 4 (page 20) shows the target population in each LMIC that requires treatment for mental disorders. An estimated 38 million people in the 58 countries require treatment for at
12 China-Hunan population estimates were derived from age proportions
in the government-sponsored, province-specific 2005 China 1%
Population Survey, extrapolated to the total province population.
India-Uttarakhand population estimates were derived from projected
population (based on the India 2001 Census) and age proportions in
the WHO country report Health Sector Reforms in India: Initiatives
from Nine States (2004).
13 United Nations, Department of Economic and Social Affairs (DESA)
Population Division, Population Estimates and Projections Section.
World Population Prospects: The 2008 Revision Population Database.
Data available at: http://esa.un.org/unpp/. Accessed on July 15, 2009.
14 As a sensitivity analysis to estimate the needed number of mental
health workers, the target coverage rates were increased and
decreased by 20% (see Table 8 Confidence interval, page 28).
15 The 20% target coverage for childhood disorders reflects the highest
coverage rate that is currently attained in developed countries (26).
Moreover, the 20% target is low because coverage is focused on
children with severe cases.
Table 3. Target coverage rates for mhGAP conditions, LMIC
Conditions %
Schizophrenia 1 80
Depression1 33
Suicide 80
Epilepsy2 80
Dementia3 80
Alcohol use1 25
Drug use 50
Opioid use 50
Other drug use 50
Childhood disabilities4 20
1 Chisholm D et al, 2007 (21).2 Ding D et al, 2008 (51).3 Ferri C et al, 2004 (52).4 Taken from level attainable in developed countries. See Kataoka SH et al, 2002 (26); Belfer ML, 2008 (53).

6
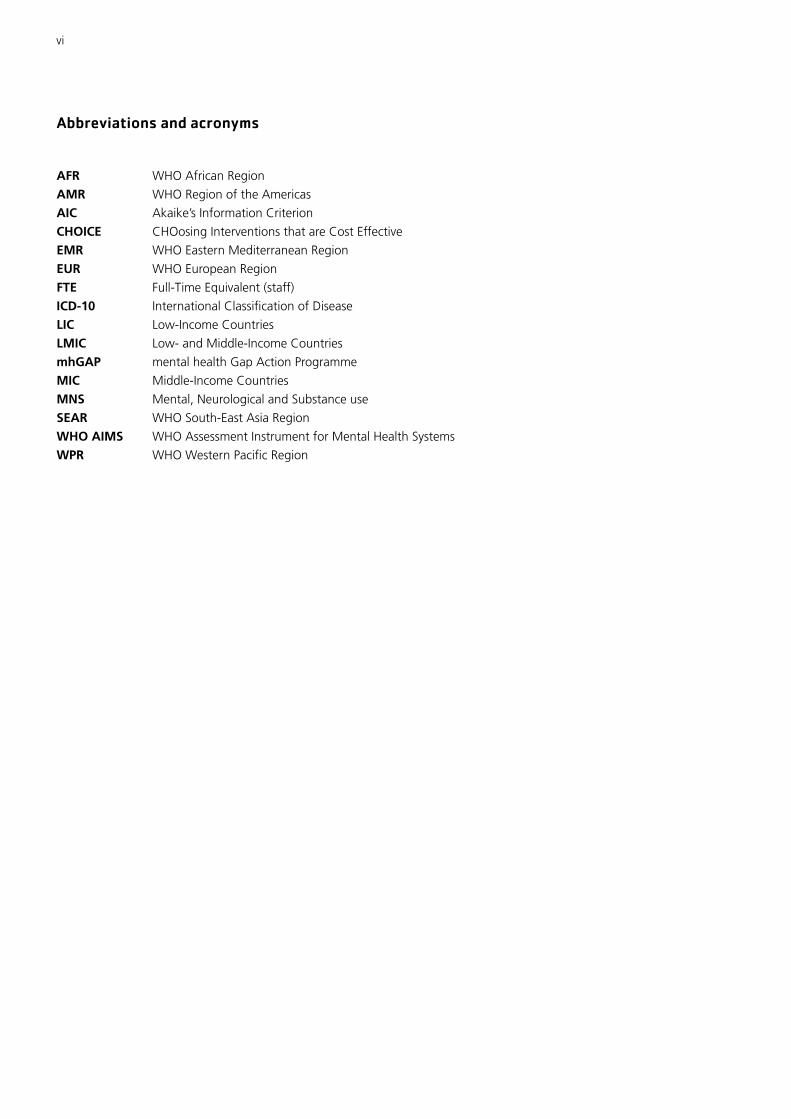
of use and facility type. For instance, the treatment model for most people with alcohol-use disorder includes eight ses-sions of outpatient psychosocial care per year. In contrast, a subset of those with schizophrenia should receive long-term inpatient residential care, with stays lasting for more than 90 days. These diverse service models by MNS disorder empha-size the different human resource requirements (20,21).
Estimate of needed mental health workers based on treatment needs
The health care service delivery models for the mhGAP conditions outline the level of human resources required to deliver mental health interventions in LMIC. Each service intervention consists of essential care and treatment for the target populations identified in section 2. The intervention packages vary by condition. Each of the eight mhGAP priority conditions calls for a specific mix of health care workers, rate
Outpatient need Inpatient need
Psychiatrists 9.6 93.1
Nurses 201.2 872.7
Psychosocial care providers 257.7 357.9
Psychiatrists 103
Nurses 1074
Psychosocial care providers 616
Figure 2. Step-by-step process to estimate baseline workforce need for mental health: schizophrenia in Sudan as an example
Step 1 Begin with total number of persons with schizophrenia in Sudan needing treatment (from Figure 1).
65,517 persons
Step 2 Assign treatment models to persons with schizophrenia, taking into account the health care setting (inpatient or
outpatient) and the quantity of use per year (bed days or visits).
65,517
• 50% use hospital outpatient services @ 12 visits per year
• 30% use primary health center outpatient services @ 5 visits per year
• 15% use community residential inpatient services @ 28 bed-days per year
• several other inpatient and outpatient treatment settings
= 1,159,658 outpatient visits per year
and 687,933 bed-days per year
Step 3 Calculate number of Full-Time-Equivalent (FTE) Staff needed per treatment setting.
1,159,658 outpatient visits per year
(11 consultations per day x 225 working days per year) = 468.55 FTEs
687,933 bed-days per year
(365 days in year x 1.15 rotation factor, given 85% bed capacity) = 1,638.91 beds
Step 4 Assign staffing ratios based on unique treatment setting needs.
Step 5 By specialty, sum FTE across treatment setting, for schizophrenia in Sudan.
Sources Steps 1 & 2: Chisholm D (unpublished). Target norms for service coverage and resource utilisation - Six disorders.Step 3: Rispel L, Price M and Cabral J, 1996. Confronting need and affordability: Guidelines for primary health care services in South Africa. Johannesburg: Centre for Health Policy. Step 4: Chisholm D, Lund C, Saxena S. Br J Psychiatry. 2007 Dec;191:528-35.

7
We applied treatment models for each of the eight mhGAP priority conditions. Figure 2 (page 6) continues to describe the step-by-step process that began in Figure 1, using schizo-phrenia in Sudan as an example, by which we estimated the human resources needs for mental health. These treatment models are based on rigorous cost-effectiveness studies and input from WHO experts who developed the service delivery packages.17 The key components of the treatment packages include the percentage of cases needing care in each setting, the average number of visits per person per year and whether the visit requires a bed (i.e., inpatient or outpatient). In addi-tion, for the mhGAP conditions that comprise several distinct disorders with unique service delivery models, we calculated health service need separately for each disorder and then added these values to yield an aggregate estimate.18 Table 6 (page 26) summarizes the total annual outpatient visits and inpatient bed days expected for the target popula-tion needing mental health treatment. Table 6 (page 26) indicates that, relative to MIC, outpatient visits in LIC account for a greater percentage of overall visits. Also, the rate of per capita inpatient bed days in MIC is greater than that in LIC.
Previous analyses of LMIC have identified the number of staff required per patient for each inpatient bed and outpatient visit (28,29,21). We applied results from these staffing patterns, shown in Table 7 (page 7), to the case population in need. This calculation assumes 225 working days per year
17 Depression, bipolar disorder, schizophrenia and alcohol-use disorder
(19); and epilepsy (20). Suicide: Used the same model for depression,
excluding any pharmacological treatment provisions. Illicit drug use
disorders: Separate models were developed for opioid use and other
drug-use disorders. Childhood mental disorders – Intellectual
disabilities: three models were developed based on severity (mild,
moderate and severe), service type (initial assessment and follow-up
care) and outpatient setting (hospital outpatient setting and primary
health care setting). A weighted average of resource use per case was
derived from the three intellectual disabilities models. Conduct
disorders: The Lund et al (27) report was based on the South African
children and adolescent mental health service sector. The resource use
per case is a weighted average of three disorders from the Lund data:
ADHD, Conduct Disorder and ODD. Emotional disorders: Used the
same service models developed for adults for children also. Thus,
given adequate prevalence data, the disorders accounted for in this
sub-category are depression, bipolar disorder, schizophrenia and
epilepsy. As a sensitivity analysis to estimate the number of mental
health workers needed, we increased and decreased the inpatient and
outpatient treatment services by 20% (see Table 8 confidence interval,
page 28).
18 Based on the epidemiology and cost-effectiveness literature, we
calculated separate intervention service models based on the distinct
conditions that fall into the following categories: disorders due to use
of illicit drugs (opioid use, other drug use disorders); mental disorders
in children (intellectual disabilities, conduct disorders, emotional disorders).
and 11 consultations per day for the staff schedule (30). Con-sistent with earlier methodology, we classified mental health workers into one of three categories: psychiatrists; nurses in mental health settings; and psychosocial care providers.19
Table 8 (page 28) displays the country-level estimates of mental health care providers needed to treat persons with one or more of the eight mhGAP priority conditions. The confidence intervals for each worker category reflect the range of expected need based on varying the case load and the intensity of treatment services. The estimated total number of workers needed across the LMIC is 362,000, which represents 22.3 workers per 100,000 population in low-income countries and 26.7 workers per 100,000 population in middle-income countries. Nurses in mental health settings account for the majority (54%) of all workers needed, whereas psychiatrists represent only 6% of total need. The remaining 41% represents psychosocial care providers.20
19 We classified psychologists, social workers and occupational
therapists under one worker category, psychosocial care providers,
because in LMIC, these workers often perform the same tasks (e.g.,
delivering psychosocial interventions). We note that high-income
countries have a more distinct division of tasks across these
professions.
20 The percentages do not total 100% because of rounding.
Table 7. Staffing proportions by health-care setting and country income classification*
Occupation Outpatient Inpatient
Day care Acute and primary care
Acute care
Long stay/ residen-tial care
Low-income countries
Psychiatrists/specialists 0.00% 1.67% 6.25% 7.69%
Nursing care provider 66.67% 20.83% 62.50% 61.54%
Psychosocial care provider
33.33% 77.50% 31.25% 30.77%
TOTAL 100.00% 100.00% 100.00% 100.00%
Middle-income countries
Psychiatrists/specialists 0.00% 3.57% 10.00% 6.67%
Nursing care provider 62.50% 28.57% 60.00% 66.67%
Psychosocial care provider
37.50% 67.86% 30.00% 26.67%
TOTAL 100.00% 100.00% 100.00% 100.00%
* Staffing proportions derived from Table 2 (page 17) in: Chisholm D, Lund C, Saxena S. Cost of scaling up mental healthcare in low- and middle-income countries. Br J Psychiatry. 2007 191:528-35.
8
With this table, LMIC can compare the number of needed mental health workers relative to countries within the same region and income classification. For example, we find that Sri Lanka and Thailand, two MIC in the WHO South-East Asia Region, share almost identical needs for psychiatrists (1.46 and 1.47 per 100,000 population respectively).
Mental health workforce shortages and the wage bill to remove them
In this section, we estimate the 2005 and 2015 shortages (or surpluses) of mental health workers in the 58 LMIC, based on the needed number of workers estimated in the previous sec-tion. We also estimate the annual wage bill for the required additional mental health workers.
The shortage (or surplus) of mental health workers is calculated for each LMIC in 2005 as the difference between the number of needed mental health workers reported in Table 8 (page 28) (prevalence-based need estimates) and the supply of mental health workers. Workforce supply data were retrieved from 58 countries that completed a WHO-AIMS assessment. WHO-AIMS records information on mental health professionals by specialty from 2005 or the most recent year available. Consistent with previous sections, we consider three specialties of mental health workers: psychiatrists; nurses that work in mental health settings; and psychosocial care providers.21
Table 9 (page 31) shows the needs-based shortage of mental health workers, by specialty for each of the 58 LMIC, to treat the eight mhGAP priority conditions. Except for Latvia,22 all of the LMIC experience a shortage of mental health workers in at least one of the three types of workers analysed, including 39 countries for psychiatrists, 55 for nurses in mental health settings and 46 for psychosocial care providers. The shortage amounts to about 239,000 workers, including 11,000 psychiatrists, 128,000 nurses in mental health settings and 100,000 psychosocial care providers. All LIC, except for Uzbekistan, have a shortage of psychiatrists, ranging from just 0.26 psychiatrists per 100,000 population in Tajikistan to 1.70 per 100,000 population in Viet Nam. In 44 MIC, 26 have a psychiatrist shortage, ranging from 0.09 psychiatrists per 100,000 population in Iran to 1.33 in Mongolia.
21 We were able to estimate the number of nurses that work in mental
health settings because WHO-AIMS Version 2.2 includes estimates
of the number of nurses that work in or for mental health facilities or
private practice (31).
22 Latvia does not have an estimated shortage in any of the three worker
categories, primarily because of its supply of mental health workers is
higher than average.
Nurse shortages in mental health settings in LMIC are more critical. Except in three countries (Pakistan, Latvia and Timor-Leste), all LMIC have a shortage. In Ukraine there are just 0.82 nurses per 100,000 population, and in Uruguay, 22.2 per 100,000 population. Similarly, for psychosocial care providers, all LIC have shortages, ranging from 4.12 per 100,000 population in Tajikistan to 11.52 per 100,000 population in Viet Nam. About 73% of MIC (32 countries) do not have an adequate level of psychosocial care providers.
WHO-AIMS reports the number of medical doctors who do not specialize in psychiatry but work in mental health settings (hereafter, referred to as “other medical doctors”). We did not include other medical doctors in the mental health workforce estimates because we focused on mental health professionals. Including these doctors in our calculations could potentially inflate the supply counts, thereby underestimating the true shortage of psychiatrists and other mental health professionals. Nevertheless, we note that in several countries, these doctors represent a large proportion of the physicians (i.e., psychiatrists and other medical doctors) working in mental health settings. Table A1 (page 43) in the appendix shows, by country, the number of other medical doctors per 100,000 population in mental health settings, the number of psychiatrists per 100,000 population and the estimated shortage of psychiatrists per 100,000 population. Countries with higher shortages of psychiatrists per 100,000 population have a higher proportion of other medical doctors, suggesting these doctors are practising in roles normally filled by psychiatrists. In Viet Nam, for example, there are 0.90 other medical doctors per 100,000 population in mental health settings, while there are only 0.35 psychiatrists per 100,000 population. In Mongolia, the contrast is greater: 4.74 other medical doctors per 100,000 population in mental health settings, and only 0.51 psychiatrists per 100,000 population.
For our shortages estimates, we assumed worker surpluses in one country do not offset worker shortages in other countries, and assumed worker surpluses within a specialty within a country do not offset shortages within other specialties for that country. Table 10 (page 9) relaxes this assumption and calculates shortages using two alternative methods. The method above is presented first (labelled the No-Offset Method). Alternative Method I allows for surpluses in one specialty to offset short-ages in another specialty within a country, using a one-for-one substitution, but does not allow for surpluses in one country to offset shortages in another country. The resulting shortage is about 215,000 workers across 51 countries.23
23 This method is similar to the method used by WHO in its report World
Health Report 2006 - Working Together for Health (13). Health profes-
sional workforce surpluses in one country did not offset shortages in
other countries. However, that report did not include a separate estimate
for each workforce cadre – doctors, nurses and midwives – so each cadre
implicitly could be substituted for the others.
9
Alternative Method II allows for surpluses in one specialty to offset shortages in another specialty within a country or across countries, using a one-for-one substitution. The resulting shortage is about 172,000 workers. We chose the No-Offset Method; that is, to assume worker surpluses do not offset
worker shortages, because of the different training require-ments among worker specialties and because cross-country migration will not likely occur at the level required, and evidence of this movement is lacking.
Table 11 (page 34) provides the annual estimated wage costs of scaling-up mental health workers to eliminate shortages in treatment for the eight mhGAP priority conditions in 2005. The wage costs were estimated for each country by multi-plying the shortage of workers by specialty and the annual wage by specialty. The wage data are from WHO’s CHOICE project (CHOosing Interventions that are Cost Effective), an initiative designed to provide evidence of the health interven-tions that are most cost-effective.24 As part of the initiative, health-care wage datasets were collected in 2000-2001 across 14 epidemiological subregions of the world. Using these data, wages for five education levels were estimated within each country using a multivariate regression model.25 The education levels ranged from lower secondary education (level 1),
24 The WHO CHOICE Project can be found at http://www.who.int/choice/en/.
25 WHO unpublished report, Determinants of Variation in Health Sector
Wages Across Countries. For a copy of the report, contact
Dan Chisholm at [email protected].
to post-secondary, non-tertiary education or, alternatively, the first stage of tertiary education (level 3), to the second stage of tertiary education with specialized training (level 5). The final model specification was based on Akaike’s Information Criterion (AIC) or a pseudo R-squared. The independent variables included: a country’s gross domestic product per worker; government health spending as a percentage of total spending; region of the world; whether the country was English-speaking; and interaction terms. We assigned the following education levels for each provider type within our study: psychiatrists (level 5); nurses in mental health settings (level 3); and psychosocial care providers (level 3). Level 3 was chosen for the category of psychosocial care providers (which includes psychologists, social workers and occupational therapists) as most psychosocial care and support is commonly expected in LMIC to be provided by health workers without an advanced degree. All wages were converted to 2005 United States dollars using buying power parity conversion rates.
Table 10. Shortage calculations by surplus offset method for 58 LMIC, 2005
Surplus offset method Psychiatrists Nurses in mental health settings
Psychosocial care providers
Total
No-offset method: Surpluses do not offset shortages
Need 19,996 194,502 147,436 361,935
Supply 8,775 66,928 47,180 122,883
Shortage 11,222 127,575 100,256 239,052
Countries with shortages 39 55 46 57
Alternative method I: Allow surpluses to offset shortages within a country (a)
Need 19,996 194,502 147,436 361,935
Supply 14,270 80,003 52,756 147,028
Shortage 5,726 114,500 94,680 214,906
Countries with shortages 51
Alternative method II: Allow surpluses to offset shortages within and across countries (b)
Need 19,996 194,502 147,436 361,935
Supply 17,443 80,237 92,615 190,296
Shortage 2,553 114,265 54,821 171,639
(a) Compared with the No-offset method, the supply of mental health workers increased, because surpluses in one specialty were allowed to offset shortages in another specialty within a country using a one-for-one substitution. This decreased the number of countries with shortages from 57 to 51. (b) Compared with Alternative method I, the supply of mental health workers increased, because surpluses in one specialty were allowed to offset shortages in another specialty within a country or across countries using a one-for-one substitution. The number of countries with remaining shortages would depend on which countries the workers migrated to.
10
Table 11 (page 34) shows that the annual wage costs to remove the mental health workforce shortages in the 58 LMIC would have been in 2005 about US$ 814 mil-lion (US$ 894 million in 2009 dollars). This US$ 814 mil-lion includes US$ 80 million for psychiatrists, US$ 420 million for nurses in mental health settings and US$ 314 million for psychosocial care providers. These costs vary considerably by country and specialty. For example, annual wages required to remove the shortages range from US$ 30,000 for Timor-Leste to US$ 118 million for Nigeria.
Forecasts of shortages and scaling-up costsof mental health workers in 2015We forecast future shortages of mental health workers, by specialty, in LMIC in 2015, the target year of the United Nations Millennium Development Goals. We also estimate the annual wage costs to remove the shortages in that year. We calculate shortages by subtracting the 2005 supply level of mental health workers from the prevalence-based need estimates for the eight mhGAP priority conditions in 2015. Table 12 (page 36) updates the need estimates, based on how each country’s age distribution is expected to change between 2005 and 2015. The table shows the total need across the 58 LMIC increases from 362,000 workers to 440,000 workers, a 21% increase. Most of this increase is because of projected population growth from 1.5 billion to 1.7 billion. The number of needed workers per 100,000 population increases by 3%, from 24.4 workers per 100,000 population in 2005, to 25.3 workers per 100,000 population in 2015.
To estimate shortages (or surpluses) in 2015, we assumed the supply of workers in 2015 would be the same as the supply in 2005. This assumption provides a starting point that shows
what the ramifications would be in 2015 if a country’s mental health workforce supply were to remain unchanged. We used the same methodology to estimate shortages for 2005; that is, we assumed that worker surpluses in one country do not offset worker shortages in other countries, and that worker surpluses within a specialty within a country do not offset shortages within other specialties in that country. Based on this method, we project that from 2005 to 2015, shortages will increase from 239,000 workers to 347,000 workers, a 45% increase (see Table 13, page 38). Based on 2005 levels, all countries, except Latvia, are estimated to experience a shortage in one or more mental health specialties. All LIC, except Uzbekistan, and about a half of MIC are projected to have continued shortages of per-capita psychiatrists in 2015. LMIC, except Pakistan, Latvia and Timor-Leste, are expected to have nurse shortages in mental health settings ranging from 1.8 to 23.6 per 100,000 population. All LIC and most MIC are expected to have shortages in psychosocial care providers.
The annual wage bill to remove the projected mental health workforce shortages for the eight mhGAP priority conditions in 2015 in the 57 LMIC with shortages is estimated in 2005 dollars to be US$ 1.2 billion, equivalent to US$ 1.3 billion in 2009 dollars (see Table 14, page 41). The US$ 1.2 billion is 45% higher than the annual wage bill required in 2005 to remove the shortages for the eight mhGAP priority conditions in the 57 LMIC. By specialty, the annual wage bill to remove shortages is US$ 113 million for psychiatrists, US$ 583 million for nurses in mental health settings and US$ 489 million for psychosocial care providers (all stated in 2005 dollars). As with 2005 estimates, the cost of increasing worker levels varies considerably by country and specialty. For example, annual wages required to remove the projected shortages range from US$ 89,000 in Timor-Leste to US$ 186 million in Nigeria.
11
in all 144 LMIC.27 If we view the mental health burden in our study of the eight mhGAP priority conditions in the 58 LMIC as representative of all MNS disorders in all 144 LMIC28,we estimate a workforce gap of 1.18 million mental health professionals in 2005 (see Table 15, page 12).29 This shortage comprises 55,000 psychiatrists, 628,000 nurses in mental health settings and 493,000 psychosocial care providers. The parallel estimate for all MNS disorders in all 144 LMIC in 2015 is a shortage of 1.71 million workers, including 78,000 psychiatrists, 866,000 nurses in mental health settings and 764,000 psychosocial care providers.
Table 16 (page 12) shows the annual wage bill required to remove the mental health workforce shortages by WHO region. The annual cost to remove the shortage based on the eight mhGAP priority conditions in the 58 LMIC is US$ 814 million (in 2005 dollars), and is highest in the Eastern
Mediterranean Region (US$ 227 million) and African Region (US$ 207 million). Applying the same methodology to include all MNS disorders in all 144 LMIC, the annual cost would be US$ 4 billion in 2005 dollars or US$ 4.4 billion in 2009 dollars. The parallel estimate for all MNS disorders in all 144 LMIC in 2015 is an annual cost of US$ 5.8 billion (in 2005 dollars) or $6.4 billion (in 2009 dollars). These costs represent only a fraction of the total costs required to scale up the mental health workforce. They do not include the cost of training, support staff and new workers’ facilities, equipment, supplies and medication. Nor do they include the costs to scale up cadres, who work in primary-care settings where mental health disorders are sometimes diagnosed and treated, or where patients are assessed and referred to specialists in mental health settings.
27 Note that we only used a province of China (Hunan) and a state of
India (Uttarakhand) in our need and supply estimates; therefore, most
of these countries’ populations were excluded from the analysis.
28 In this projection, we assume that all characteristics of the 58 LMIC
(overall prevalence of disorder, service delivery model, target coverage
rate, etc) are representative of the 144 LMIC.
29 United Nations, Department of Economic and Social Affairs (DESA)
Population Division, Population Estimates and Projections Section.
World Population Prospects: The 2008 Revision Population Database.
Data available at: http://esa.un.org/unpp/ Accessed on 1 May, 2010.
144 LIC, Lower MIC, and Upper MIC included.
Summary and results for all low- and middle-income countries
Analysis of human resources for mental health in 58 low- and middle-income countries reveals substantial shortages in the mental health workforce and that the situation will worsen by 2015 if the additional workers are not trained and hired. Based on other studies, a similar situation exists for health professionals in general, including doctors, nurses and midwives (13,32,33,34). About 93% of LIC and 59% of MIC experience a needs-based shortage of psychiatrists. All but three of the 58 countries have insufficient numbers of nurses in mental health settings devoted to mental health care. In addition, 79% of LMIC show a workforce gap in psychosocial care providers. Although the shortage varies substantially by country, the widest gaps occur in LIC.
This section presents the 2005 results in two summary tables by WHO region and also includes adjustments to account for all MNS disorders across all 144 LMIC. For the 58 LMIC we analysed for the eight mhGAP priority conditions, we estimate a shortage of 11,000 psychiatrists, 128,000 nurses in mental health settings and 100,000 psychosocial care providers, totaling 239,000 mental health workers in 2005 (Table 15, page 12). By specialty, the supply met 44% of the psychiatrist need, 34 % of the nurse need in mental health settings and 32 % of the psychosocial care -provider need. Overall, the supply met 34 % of the mental health worker need. On a per capita basis, the shortage is highest in the WHO Western Pacific Region, with a 26.6 mental health worker shortage per 100,000 population, followed by the South-East Asia Region, with a shortage of 21.1 mental health workers per 100,000 population. The results show that the 2005 levels of mental health workers do not meet the treatment needs of persons with priority MNS disorders. Failure to adequately treat these disorders implies: a large number of overall disability-adjusted life years lost; reductions in employment and productivity; and an increased strain on related social services.
The eight mhGAP priority conditions we studied comprise about 75% of all MNS disorders in LMIC,26 while the LMIC we examined represent 27% of the total population living
26 This estimate is based on DALY estimates from the 2004 WHO Global
Burden of Disease Report, which found that in LMIC, the eight
mhGAP priority conditions account for about 75% of the global
burden of neuropsychiatric disorders. To account for this percentage,
we increased the worker shortage estimates by 1.33 (or 1/0.75).
This was a conservative approach, because we could have increased
the worker-need estimates by 1.33, which would have resulted in the
worker shortage estimates increasing by more than a factor of 1.33,
if the worker supply were unchanged. However, because the nature
of the remaining neuropsychiatric disorders is not well specified, there
may be additional supply of mental health workers available to treat
these disorders.
12
Table 15. FTE shortage of mental health workers by WHO Region, 2005
WHO Region Psychiatrists Nurses in mental health settings
Psychosocial care providers Total
per 100,000 population
N per 100,000 population
N per 100,000 population
N per 100,000 population
N
AFR 0.8 2,668 6.4 20,279 7.2 22,900 14.5 45,848
AMR 0.1 203 11.7 16,229 2.9 4,096 14.8 20,528
EMR 0.6 2,885 5.7 26,440 6.5 29,710 12.8 59,035
EUR 0.0 17 5.4 5,912 1.9 2,039 7.2 7,968
SEAR 1.1 3,010 11.3 31,270 8.7 24,011 21.1 58,291
WPR 1.4 2,439 15.4 27,445 9.8 17,500 26.6 47,383
Total for 58 LMIC, 8 MNS Disorders
0.8 11,222 8.6 127,575 6.8 100,256 16.1 239,052
Total for 58 LMIC, All MNS Disorders
14,962 170,100 133,674 318,736
Total for 144 LMIC, All MNS Disorders
55,223 627,822 493,380 1,176,425
Table 16. Annual wage bill to remove shortage of mental health workers by WHO Region, 2005 (millions $US 2005)
WHO Region Psychiatrists Nurses in mental health settings
Psychosocial care providers
Total
AFR 29 74 104 207
AMR 2 102 20 125
EMR 21 107 99 227
EUR 0 9 2 11
SEAR 16 69 51 136
WPR 12 59 37 109
Total for 58 LAMIC, 8 MNS disorders 80 420 314 814
Total for 58 LAMIC, All MNS disorders 107 559 419 1,085
Total for 144 LAMIC, All MNS disorders 396 2,065 1,545 4,005
Notes: Totals may not add due to rounding.LIC – low-income countryMIC – middle-income countryLMIC – low- and middle-income countries.
13
tions, which play a key role in the care and rehabilitation of people with mental disorders. Increasing worker incentives can also improve productivity. The primary financial incentive is the payment system in the form of fees for services, capitation or salary (38). Health-care payment systems are increasingly being augmented with pay-for-performance programmes, which use financial and non-financial incentives to better align provider and payer objectives, where the payer could be the government, a private insurer or a patient (39,40,41). For example, Rwanda’s pay-for-performance programme included a fee-for-service payment for specific maternal and child-health services, and the payment was adjusted based on quality-of-care indicators (42) . Facilities with the programme had a higher probability of institutional deliveries and of children aged 0–23 months receiving a preventative care visit, and better prenatal care quality when compared with health care facilities without the programme. Pay-for-performance programmes are less common in mental health, but the United Kingdom’s Quality and Outcomes Framework pay-for-performance programme, for example, includes mental health quality-of-care measures, including whether a practice can produce a registry of people with schizophrenia, bipolar disorder and other psychoses, and whether these patients have had a review in the preceding 15 months (43).
The workforce represents one key component of the mental health system. However, to address the three main shortcomings of mental health care in most LMIC – scarcity, inequity and inefficiency – governments will need to take a comprehensive approach. Such a strategy will require, at the minimum, the allocation of health budgets towards MNS disorders. This is more likely if MNS disorders are destigma-tized, there is a well-trained mental health workforce, and concerted efforts are made to increase the productivity of mental health workers.
Policy discussion and conclusions
According to Saxena et al (14), resources for mental health in LMIC remain grossly inadequate. In this report, we provide benchmarks for LMIC to redress this problem by increasing their mental health workforce. The rapid scaling up of a well-trained workforce requires a sizeable investment immediately. Popula-tion forecasts show that doing nothing will worsen the mental health treatment gap for decades to come. This treatment gap will not only increase disability, but hinder economic productivity and drain resources from other government programmes.
Government budgets and private spending in most LMIC, particularly LIC, are insufficient to scale up the mental health workforce to required levels. Mental health care providers and policy-makers should consider how task shifting and worker incentives might improve productivity (35). Task shifting involves delegating tasks to existing or new cadres with either less training or narrowly focused training to increase access to lower-cost services. Task shifting can include delegating tasks to professionals with less training and even to non-professionals, or a combina-tion of these (36). In a mental health setting, task shifting might include transferring tasks from a psychiatrist to a non-specialist medical doctor, which seems to be occurring in some countries where there are psychiatrist shortages (see appendix). Task shifting might also include developing a new cadre. For example, female community health workers who were trained in cognitive behaviour techniques in the Lady Health Worker Programme in Pakistan demonstrated their ability to significantly lower depression prevalence among new mothers (37). Successful task shifting requires good management and supervision. Higher-skilled mental health workers and/or professionals outside of mental health will need to acquire these management and supervision skills. Governments will also need to do more to help develop informal resources, such as family and consumer associa-
14
12. Altevogt et al. Mental, neurological, and substance use disorders in sub-Saharan Africa: Reducing the treatment gap, improving quality of care: Workshop summary. Washington, National Academies Press, 2010 (http:// www.nap.edu/catalog.php?record_id=12828#description, accessed 13 December 2010).
13. The World Health Report 2006: Working Together for Health. Geneva, World Health Organization, 2006 (http://www.who.int/whr/2006/whr06_en.pdf, accessed 13 December 2010).
14. Saxena S et al. Resources for mental health: scarcity, inequity, and inefficiency. The Lancet, 2007, 370(9590):878-89.
15. Saraceno B et al. Global mental health 5: Barriers to improvement of mental health services in low-income and middle-income countries. The Lancet, 2007, 370: 1164-1174.
16. mhGAP: Mental Health Gap Action Programme: Scaling up care for mental, neurological, and substance use disorders. Geneva, World Health Organization, 2008 (http://www.who.int/mental_health/mhgap_final_english. pdf, accessed 13 December 2010).
17. Chaudhry MR. Staffing requirements. In: Baasher TA, Carstairs GM et al., eds. Mental health services in developing countries. Geneva, World Health Organization, 1975 (http://whqlibdoc.who.int/offset/ WHO_OFFSET_22_%28pt1-pt3%29.pdf, accessed 13 December 2010).
18. The Millenium Development Goals Report 2010. New York, United Nations, 2010 (http://www.un.org/millenni umgoals/pdf/MDG%20Report%202010%20En%20 r15%20-low%20res%2020100615%20-.pdf).
19. Bruckner TA, Scheffler RM, Shen S, et al. The Mental Health Workforce Gap in Low and Middle Income Countries: A Needs-Based Approach. Bulletin of the World Health Organization, published online 22 November 2010 (http://www.who.int/bulletin/online_ first/10-082784.pdf)..
20. Chisholm D and WHO-CHOICE. Cost-effectiveness of first-line antiepileptic drug treatments in the developing world: a population-level analysis. Epilepsia, 2005, 46(5):751-759.
21. Chisholm D et al. Cost of scaling up mental healthcare in low-and middle-income countries. The British Journal of Psychiatry, 2007, 191(6): 528-535.
References
1. Murray CJL and Lopez AD. Global mortality, disability, and the contribution of risk factors: Global Burden of Disease Study. The Lancet, 1997, 349(9063): 1436-1442.
2. World Health Organization International Consortium in Psychiatric Epidemiology. Cross-national comparisons of the prevalences and correlates of mental disorders. Bulletin of the World Health Organization, 2000, 78:413-25.
3. Mental Health Policy and Service Guidance Package: The Mental Health Context. Geneva, World Health Organization, 2003, (http://www.who.int/mental_health/resources/en/ context.PDF, accessed 13 December 2010).
4. Chatterjee S et al. Evaluation of a community-based rehabilitation model for chronic schizophrenia in rural India. The British Journal of Psychiatry, 2003, 182(1): 57-62.
5. Wang PS et al. Use of mental health services for anxiety, mood, and substance disorders in 17 countries in the WHO world mental health surveys. The Lancet, 2007, 370(9590): 841-850.
6. Kohn R et al. The treatment gap in mental health care. Bulletin of the World Health Organization, 2004, 82: 858-866.
7. Demyttenaere K et al. Prevalence, severity, and unmet need for treatment of mental disorders in the World Health Organization World Mental Health Surveys. JAMA, 2004, 291(21): 2581-2590.
8. Saxena S, Sharan P, Saraceno B. Budget and financing of mental health services: Baseline information on 89 countries from WHO’s Project Atlas. The Journal of Mental Health Policy and Economics, 2003, 6: 135-143.
9. The World Health Report 2001: Mental health: new understanding, new hope. Geneva, World Health Organization, 2001 (http://www.who.int/whr/2001/en/ whr01_en.pdf, accessed 13 December 2010).
10. Lancet Global Mental Health Group et al. Scale up services for mental disorders: a call for action. The Lancet, 2007, 370(9594): 1241-1252.
11. Mental Health Gap Action Programme: Scaling up care for mental, neurological, and substance use disoders. Geneva, World Health Organization, 2008 (http://www.who.int/mental_health/mhgap_final_english. pdf, accessed 13 December 2010).
15
32. Scheffler RM et al. Forecasting the Global Shortage of Physicians: An Economic- and Needs-Based Approach, Bulletin of the World Health Organization 86, 2008, no. 7: 516-523.
33. Scheffler RM et al. Estimates of Health Care Professional Shortages in Sub-Saharan Africa by 2015. Health Affairs, 2009, 28(5):w849-862.
34. Soucat AS, Scheffler RM, eds. Human Resources in Health in Africa: A New Look at the Crisis, Washington, DC, The World Bank, 2010 (forthcoming).
35. Fulton BD, Scheffler RM, Sparkes SP, Auh EY, Vujicic M, Soucat A. Health workforce skill mix and task shifting in low-income countries: a review of recent evidence. Human Resources in Health 9(1); 2011.
36. Dovlo D. Using mid-level cadres as substitutes for internationally mobile health professionals in Africa. A desk review. Human Resources for Health, 2004, 2(7).
37. Rahman et al. Cognitive behaviour therapy-based intervention by community health workers for mothers with depression and their infants in rural Pakistan: A cluster-randomised controlled trial. Lancet, 2008, 372(9642): 902-909.
38. Scheffler RM. Is There a Doctor in the House? Market Signals and Tomorrow’s Supply of Doctors. Palo Alto, CA, Stanford University Press, 2008.
39. Borowitz M, Scheffler R, Fulton B. Improving value for money in health by paying for performance. Organisation for Economic Co-operation and Development. Value for Money in Health Spending. Paris, Organisation for Economic Co-operation and Development, 2010.
40. Eichler R, Levine R and the Performance-Based Incentives Working Group. Performance Incentives for Global Health: Potential and Pitfalls. Washington DC, Center for Global Development, 2009.
41. Oxman AD, Fretheim A. An Overview of Research on the Effects of Results-Based Financing. Oslo, Norway, Nasjonalt Kunnskapssenter for Helsetjenesten, 2008.
42. Basinga P et al. Paying Primary Health Care Centers for Performance in Rwanda, Washington, DC, World Bank, 2010 (policy research working paper No. 5190).
22. Schmidtke A et al. Attempted suicide in Europe: rates, trends and sociodemographic characteristics of suicide attempters during the period 1989-1992. Results of the WHO/EURO Multicentre Study on Parasuicide. Acta Psychiatrica Scandinavica, 1996, 93(5): 327-338.
23. Hawton K et al. Relation between attempted suicide and suicide rates among young people in Europe. Journal of Epidemiology and Community Health, 1998, 52(3): 191-194.
24. Kerkhof A. Attempted suicide: patterns and trends. The International Handbook of Suicide and Attempted Suicide. Wiley, London, 2000, 49-64.
25. Degenhardt L et al. Ch. 13 Illicit drug use. Comparative quantification of health risks: global and regional burden of disease attributable to selected major risk factors. Geneva, WHO, 2004 (https://www.who.int/publications/ cra/chapters/volume1/1109-1176.pdf, accessed 13 December 2010).
26. Kataoka SH et al. Unmet need for mental health care among US children: variation by ethnicity and insurance status. American Journal of Psychiatry, 2002, 159(9): 1548-1555.
27. Lund C et al. Scaling up child and adolescent mental health services in South Africa: human resource requirements and costs. Journal of Child Psychology Psychiatry, and Allied Disciplines, 2009, 50(9):1121-30.
28. Lund C et al. A model for estimating mental health service needs in South Africa. South African Medical Journal, 2000, 90(10): 1019-1024.
29. Lund C and Flisher AJ. Norms for mental health services in South Africa. Social Psychiatry and Psychiatric Epidemiology, 2006, 41(7): 587-594.
30. Mental health policy and service guidance package: Planning and budgeting to deliver services for mental health. Geneva, World Health Organization, 2003, p. 51 (http://www.who.int/mental_health/resources/en/ Planning_budgeting.pdf, accessed 13 December 2010).
31. WHO-AIMS Version 2.2: World Health Organization Assessment Instrument for Mental Health Systems. Geneva, World Health Organization, 2005, p.43. (http:// www.who.int/mental_health/evidence/AIMS_WHO_2_2. pdf, accessed 13 December 2010).
16
43. The NHS Information Centre, Prescribing and Primary Care Services. Quality and Outcomes Framework Achievement Data 2009/10. London, The Health and Social Care Information Centre, 2010.
44. Scott I, Mazhindu D. Statistics for Health Care Professionals: An Introduction. Thousand Oaks, CA, SAGE Publications Inc, 2005.
45. Llibre Rodriguez JJL et al. Prevalence of dementia in Latin America, India, and China: a population-based cross- sectional survey. The Lancet, 2008, 372(9637): 464-474.
46. Durkin MS et al. Prevalence and correlates of mental retardation among children in Karachi, Pakistan. American Journal of Epidemiology, 1998, 147(3): 281.
47. Tekle-Haimanot R et al. Community-based study of neurological disorders in rural central Ethiopia. Neuroepidemiology, 1990, 9(5): 263-277.
48. Xie ZH et al. Sampling survey on intellectual disability in 0–6-year-old children in China. Journal of Intellectual Disability Research, 2008, 52(12): 1029-1038.
49. Gureje O et al. Psychiatric disorders in a paediatric primary care clinic. The British Journal of Psychiatry, 1994, 165(4): 527.
50. Adewuya et al. Prevalence of major depressive disorders and a validation of the Beck Depression Inventory among Nigerian adolescents. European child & adolescent psychiatry, 2007, 16(5): 287-292.
51. Ding D et al. Primary care treatment of epilepsy with phenobarbital in rural China: cost-outcome analysis from the WHO/ILAE/IBE global campaign against epilepsy demonstration project. Epilepsia, 2008, 49(3):535-5399.
52. Ferri C et al. Resource utilisation for neuropsychiatric disorders in developing countries: a multinational Delphi consensus study. Social Psychiatry and Psychiatric Epidemiology, 2004, 39:218–227.
53. Belfer ML. Child and adolescent mental disorders: the magnitude of the problem across the globe. Journal of Child Psychology and Psychiatry, 2008, 49(3): 226-236.
17
Appendix 1. Country-level supplemental tables
The following supplemental tables include the country-level statistics that were used to create the tables in the main report.
Tabl
e 2.
Pre
vale
nce
(%) o
f m
enta
l, ne
urol
ogic
al a
nd s
ubst
ance
use
dis
orde
rs id
entifi
ed in
mhG
AP
repo
rt, L
MIC
(n=
58)
Co
un
try
WH
O
Reg
ion
Sch
izo
ph
ren
ia a
nd
oth
er
no
n-a
ffec
tive
psy
cho
ses
Dep
ress
ion
1 Su
icid
al
idea
tio
n1
Epile
psy
1D
emen
tia1
Alc
oh
ol
use
1
Illic
it s
ub
stan
ce
use
Prev
alen
ce o
f C
hild
ho
od
Dis
ord
ers
(per
100
,000
ch
ild p
op
ula
tio
n)
Sch
izo
ph
ren
ia1
Bip
ola
r1O
pio
id
use
2
Oth
er
dru
g
use
2
Inte
llect
ual
d
isab
iliti
es3
Co
nd
uct
/b
ehav
iora
l3
Emo
tio
nal
3
Low
inco
me
cou
ntr
ies
Beni
nA
FR0.
280.
372.
180.
081.
040.
090.
520.
090.
461.
504.
254.
25
Buru
ndi
AFR
0.28
0.37
2.18
0.18
1.04
0.09
0.52
0.01
0.14
1.50
4.25
4.25
Eritr
eaA
FR0.
280.
372.
180.
101.
040.
090.
520.
010.
141.
504.
254.
25
Ethi
opia
AFR
0.28
0.37
2.18
0.12
1.04
0.09
0.52
0.01
0.14
1.50
4.25
4.25
Nig
eria
AFR
0.28
0.37
2.18
0.10
1.04
0.09
0.52
0.09
0.46
1.50
4.25
4.25
Uga
nda
AFR
0.28
0.37
2.18
0.14
1.04
0.09
0.52
0.01
0.14
1.50
4.25
4.25
Afg
hani
stan
EMR
0.36
0.41
2.79
0.13
0.55
0.12
0.21
0.41
0.14
1.50
4.25
4.25
Paki
stan
EMR
0.36
0.41
2.79
0.21
0.55
0.12
0.21
0.41
0.14
1.50
4.25
4.25
Som
alila
ndEM
R0.
360.
412.
790.
500.
550.
120.
210.
410.
141.
504.
254.
25
Tajik
ista
nEU
R0.
500.
492.
830.
040.
420.
514.
010.
090.
091.
504.
254.
25
Uzb
ekis
tan
EUR
0.50
0.49
2.83
0.12
0.42
0.51
4.01
0.09
0.09
1.50
4.25
4.25
Bang
lade
shSE
AR
0.37
0.43
2.88
0.25
0.58
0.17
1.28
0.15
0.10
1.50
4.25
4.25
Nep
alSE
AR
0.37
0.43
2.88
0.20
0.58
0.17
1.28
0.15
0.10
1.50
4.25
4.25
Vie
t N
amW
PR0.
440.
512.
840.
200.
390.
332.
770.
020.
341.
504.
254.
25
Mid
dle
inco
me
cou
ntr
ies
(lo
wer
mid
dle
an
d u
pp
er m
idd
le)
Con
goA
FR0.
280.
372.
180.
121.
040.
090.
520.
010.
141.
504.
254.
25
Sout
h A
fric
aA
FR0.
280.
372.
180.
281.
040.
090.
520.
010.
141.
504.
254.
25
Arg
entin
aA
MR
0.42
0.45
2.80
0.19
1.26
0.34
2.68
0.03
0.35
1.50
4.25
4.25
Beliz
eA
MR
0.42
0.45
2.80
0.17
1.26
0.34
2.68
0.03
0.35
1.50
4.25
4.25
Boliv
iaA
MR
0.42
0.45
2.80
0.04
1.26
0.34
2.68
0.07
0.43
1.50
4.25
4.25
Chi
leA
MR
0.42
0.45
2.80
0.22
1.26
0.34
2.68
0.03
0.35
1.50
4.25
4.25
Cos
ta R
ica
AM
R0.
420.
452.
800.
171.
260.
342.
680.
030.
351.
504.
254.
25
Dom
inic
an R
epub
licA
MR
0.42
0.45
2.80
0.11
1.26
0.34
2.68
0.03
0.35
1.50
4.25
4.25
Ecua
dor
AM
R0.
420.
452.
800.
161.
260.
342.
680.
070.
431.
504.
254.
25
El S
alva
dor
AM
R0.
420.
452.
800.
151.
260.
342.
680.
030.
351.
504.
254.
25
Gua
tem
ala
AM
R0.
420.
452.
800.
061.
260.
342.
680.
070.
431.
504.
254.
25
Guy
ana
AM
R0.
420.
452.
800.
671.
260.
342.
680.
030.
351.
504.
254.
25

18
Tabl
e 2
(con
tinue
d)
Co
un
try
WH
O
Reg
ion
Sch
izo
ph
ren
ia a
nd
oth
er
no
n-a
ffec
tive
psy
cho
ses
Dep
ress
ion
1 Su
icid
al
idea
tio
n1
Epile
psy
1D
emen
tia1
Alc
oh
ol
use
1
Illic
it s
ub
stan
ce
use
Prev
alen
ce o
f C
hild
ho
od
Dis
ord
ers
(per
100
,000
ch
ild p
op
ula
tio
n)
Sch
izo
ph
ren
ia1
Bip
ola
r1O
pio
id
use
2
Oth
er
dru
g
use
2
Inte
llect
ual
d
isab
iliti
es3
Co
nd
uct
/b
ehav
iora
l3
Emo
tio
nal
3
Mid
dle
inco
me
cou
ntr
ies
(lo
wer
mid
dle
an
d u
pp
er m
idd
le)
Hon
dura
sA
MR
0.42
0.45
2.80
0.13
1.26
0.34
2.68
0.03
0.35
1.50
4.25
4.25
Jam
aica
AM
R0.
420.
452.
800.
081.
260.
342.
680.
030.
351.
504.
254.
25
Nic
arag
uaA
MR
0.42
0.45
2.80
0.22
1.26
0.34
2.68
0.07
0.35
1.50
4.25
4.25
Pana
ma
AM
R0.
420.
452.
800.
131.
260.
342.
680.
030.
351.
504.
254.
25
Para
guay
AM
R0.
420.
512.
800.
101.
260.
342.
680.
030.
341.
504.
254.
25
Surin
ame
AM
R0.
420.
452.
800.
391.
260.
342.
680.
030.
351.
504.
254.
25
Uru
guay
AM
R0.
420.
452.
800.
331.
260.
342.
680.
030.
351.
504.
254.
25
Djib
outi
EMR
0.36
0.41
2.79
0.09
0.55
0.12
0.21
0.41
0.14
1.50
4.25
4.25
Egyp
tEM
R0.
360.
412.
790.
030.
550.
120.
210.
410.
141.
504.
254.
25
Iran
EMR
0.36
0.41
2.79
0.12
0.55
0.12
0.21
0.55
0.02
1.50
4.25
4.25
Iraq
EMR
0.36
0.41
2.79
0.31
0.55
0.12
0.21
0.41
0.14
1.50
4.25
4.25
Jord
anEM
R0.
360.
412.
790.
000.
550.
120.
210.
550.
021.
504.
254.
25
Mor
occo
EMR
0.36
0.45
2.79
0.04
0.55
0.12
0.21
0.41
0.43
1.50
4.25
4.25
Suda
nEM
R0.
360.
412.
790.
150.
550.
120.
210.
410.
141.
504.
254.
25
Tuni
sia
EMR
0.36
0.41
2.79
0.06
0.55
0.12
0.21
0.55
0.02
1.50
4.25
4.25
Alb
ania
EUR
0.50
0.49
2.83
0.15
0.42
0.51
4.01
0.09
0.09
1.50
4.25
4.25
Arm
enia
EUR
0.50
0.49
2.83
0.08
0.42
0.51
4.01
0.09
0.09
1.50
4.25
4.25
Aze
rbai
jan
EUR
0.50
0.49
2.83
0.03
0.42
0.51
4.01
0.09
0.09
1.50
4.25
4.25
Geo
rgia
EUR
0.50
0.49
2.83
0.04
0.42
0.51
4.01
0.09
0.09
1.50
4.25
4.25
Kyr
gyzs
tan
EUR
0.50
0.49
2.83
0.23
0.42
0.51
4.01
0.09
0.09
1.50
4.25
4.25
Latv
iaEU
R0.
500.
492.
830.
520.
420.
514.
010.
190.
041.
504.
254.
25
Repu
blic
of
Mol
dova
EUR
0.50
0.51
2.83
0.35
0.42
0.51
4.01
0.19
0.34
1.50
4.25
4.25
Ukr
aine
EUR
0.50
0.49
2.83
0.54
0.42
0.51
4.01
0.19
0.04
1.50
4.25
4.25
Bhut
anSE
AR
0.37
0.43
2.88
0.27
0.58
0.17
1.28
0.15
0.10
1.50
4.25
4.25
Indi
a-U
ttar
akha
ndSE
AR
0.37
0.43
2.88
0.34
0.58
0.17
1.28
0.15
0.10
1.50
4.25
4.25
Mal
dive
sSE
AR
0.37
0.43
2.88
0.27
0.58
0.17
1.28
0.15
0.10
1.50
4.25
4.25
Sri L
anka
SEA
R0.
370.
432.
880.
560.
580.
171.
280.
040.
101.
504.
254.
25
19
Tabl
e 2
(con
tinue
d)
Co
un
try
WH
O
Reg
ion
Sch
izo
ph
ren
ia a
nd
oth
er
no
n-a
ffec
tive
psy
cho
ses
Dep
ress
ion
1 Su
icid
al
idea
tio
n1
Epile
psy
1D
emen
tia1
Alc
oh
ol
use
1
Illic
it s
ub
stan
ce
use
Prev
alen
ce o
f C
hild
ho
od
Dis
ord
ers
(per
100
,000
ch
ild p
op
ula
tio
n)
Sch
izo
ph
ren
ia1
Bip
ola
r1O
pio
id
use
2
Oth
er
dru
g
use
2
Inte
llect
ual
d
isab
iliti
es3
Co
nd
uct
/b
ehav
iora
l3
Emo
tio
nal
3
Mid
dle
inco
me
cou
ntr
ies
(lo
wer
mid
dle
an
d u
pp
er m
idd
le)
Thai
land
SEA
R0.
370.
432.
880.
200.
580.
171.
280.
040.
101.
504.
254.
25
Tim
or-L
este
SEA
R0.
370.
432.
880.
140.
580.
171.
280.
150.
101.
504.
254.
25
Chi
na-H
unan
WPR
0.44
0.51
2.84
0.34
0.39
0.33
2.77
0.02
0.34
1.50
4.25
4.25
Mon
golia
WPR
0.44
0.41
2.84
0.23
0.39
0.33
2.77
0.02
0.14
1.50
4.25
4.25
Phili
ppin
esW
PR0.
440.
492.
840.
030.
390.
332.
770.
020.
041.
504.
254.
25
1 W
HO
Glo
bal B
urde
n of
Dis
ease
Est
imat
es f
or 2
004.
2 C
ompa
rativ
e Ri
sk A
sses
smen
t ht
tp://
ww
w.w
ho.in
t/pu
blic
atio
ns/c
ra/c
hapt
ers/
volu
me1
/110
9-11
76.p
df.
3 W
HO
Exp
ert
Pane
l on
Chi
ld D
isor
ders
.
Cas
e d
efin
itio
ns
use
d:
Sch
izo
ph
ren
ia: c
ases
tha
t m
eet
ICD
-10
crite
ria f
or s
chiz
ophr
enia
onl
y.B
ipo
lar:
cas
es t
hat
mee
t IC
D-1
0 cr
iteria
for
bip
olar
onl
y.D
epre
ssio
n (u
nipo
lar
depr
essi
ve d
isor
ders
and
bip
olar
aff
ectiv
e di
sord
er):
Maj
or d
epre
ssiv
e ep
isod
e or
bip
olar
dis
orde
r m
eetin
g IC
D-1
0 cr
iteria
.Su
icid
e (s
uici
de a
ttem
pt):
Glo
bal B
urde
n of
Dis
ease
sel
f-in
flict
ed in
jury
dea
th r
ate
mul
tiplie
d by
a f
acto
r of
20
(22,
23,2
4).
Epile
psy
: cas
es m
eetin
g In
tern
atio
nal L
eagu
e A
gain
st E
pile
psy
defin
ition
(exc
ludi
ng e
pile
psy
seco
ndar
y to
oth
er d
isea
ses
or in
jury
).D
emen
tia:
Glo
bal B
urde
n of
Dis
ease
Est
imat
e of
Alz
heim
er d
isea
se a
nd d
emen
tia m
ultip
lied
by a
cor
rect
ion
fact
or o
f 0.
5 to
rem
ove
Alz
heim
er d
isea
se a
nd m
ild d
emen
tia c
ases
(45)
. Giv
en t
he s
tron
g
age-
depe
nden
ce o
f de
men
tia, w
e th
en a
pply
a c
orre
ctio
n fa
ctor
tha
t w
eigh
ts p
reva
lenc
e by
the
age
str
uctu
re o
f th
e po
pula
tion
(old
er p
opul
atio
ns r
ecei
ve a
gre
ater
wei
ght)
.A
lco
ho
l-u
se d
iso
rder
: cas
es m
eetin
g IC
D-1
0 cr
iteria
for
alc
ohol
dep
ende
nce
and
harm
ful u
se (F
10.1
and
F 1
0.2)
, exc
ludi
ng c
ases
with
com
orbi
d de
pres
sive
epi
sode
.O
pio
id-u
se d
iso
rder
: cas
es m
eetin
g IC
D-1
0 cr
iteria
for
opi
oid
depe
nden
ce a
nd h
arm
ful u
se (F
11.
1 F
11. 2
), ex
clud
ing
case
s w
ith c
omor
bid
depr
essi
ve e
piso
de.
Oth
er d
rug
-use
dis
ord
ers:
cas
es m
eetin
g IC
D-1
0 cr
iteria
for
coc
aine
dep
ende
nce
and
harm
ful u
se (F
14.
1 an
d F
14.2
) or
amph
etam
ine
use.
Ch
ildh
oo
d in
telle
ctu
al d
isab
iliti
es: m
oder
ate
and
seve
re f
orm
s of
men
tal r
etar
datio
n, b
ased
on
inte
rnat
iona
l est
imat
es o
f pr
eval
ence
(46,
47,4
8).
Co
nd
uct
/beh
avio
ral d
iso
rder
s: p
reva
lenc
e of
sev
ere
aggr
essi
on, d
isob
edie
nce
and
irrita
bilit
y ba
sed
on W
HO
exp
ert
pane
l est
imat
es.
Ch
ildh
oo
d e
mo
tio
nal
dis
ord
ers:
WH
O-b
ased
est
imat
e of
chi
ldre
n th
at m
eet
crite
ria f
or m
ajor
dep
ress
ion
or a
nxie
ty-r
elat
ed d
isor
ders
(49,
50).
20
Tabl
e 4.
Tar
get
popu
latio
n in
58
LMIC
tha
t re
quire
s tr
eatm
ent
for
MN
S di
sord
ers*
Co
un
try
WH
O
Reg
ion
Sch
izo
ph
ren
ia a
nd
o
ther
no
n-a
ffec
tive
p
sych
ose
s
Dep
ress
ion
Suic
idal
id
eati
on
Epile
psy
Dem
enti
aA
lco
ho
l u
se
Illic
it s
ub
stan
ce U
seC
hild
ho
od
Dis
ord
ers
Tota
l Ta
rget
C
ases
Tota
l ca
ses
per
10
0,00
0 to
tal
po
pu
la-
tio
n
Sch
izo
-p
hre
nia
Bip
ola
r O
pio
id
use
O
ther
D
rug
U
se
Inte
llect
ual
D
isab
iliti
es
Co
nd
uct
/ B
ehav
iora
l Em
oti
on
al
Low
-in
com
e co
un
trie
s
Beni
nA
FR9,
964
12,9
6031
,872
2,72
436
,768
1,94
65,
746
1,99
310
,096
10,3
2329
,249
29,2
4918
2,88
92,
324
Buru
ndi
AFR
9,72
112
,644
31,0
946,
380
35,8
711,
691
5,60
621
62,
938
9,17
125
,985
25,9
8516
7,30
12,
268
Eritr
eaA
FR5,
855
7,61
618
,728
2,05
921
,606
860
3,37
713
01,
769
5,61
915
,921
15,9
2199
,460
2,22
3
Ethi
opia
AFR
94,9
6612
3,51
930
3,75
839
,906
350,
426
17,8
2154
,766
2,11
028
,697
100,
380
284,
410
284,
410
1,68
5,17
12,
227
Nig
eria
AFR
180,
432
234,
681
577,
128
64,5
9566
5,79
534
,139
104,
053
36,0
8218
2,81
518
2,09
751
5,94
251
5,94
23,
293,
699
2,33
8
Uga
nda
AFR
32,7
2642
,565
104,
676
15,9
6212
0,75
85,
300
18,8
7372
79,
889
42,4
7412
0,34
312
0,34
363
4,63
72,
211
Afg
hani
stan
EMR
37,2
2442
,274
119,
978
13,0
4757
,403
4,30
96,
987
26,7
269,
126
34,4
1097
,495
97,4
9554
6,47
42,
230
Paki
stan
EMR
290,
937
330,
399
937,
716
167,
840
448,
651
57,7
1454
,609
208,
883
71,3
2619
1,76
654
3,33
754
3,33
73,
846,
514
2,32
0
Som
alila
ndEM
R13
,206
14,9
9742
,563
18,5
1120
,364
1,88
42,
479
9,48
13,
238
11,1
8431
,688
31,6
8820
1,28
32,
410
Tajik
ista
nEU
R15
,754
15,6
6837
,003
1,36
213
,376
3,56
739
,665
1,78
21,
742
7,73
421
,913
21,9
1318
1,48
12,
776
Uzb
ekis
tan
EUR
70,3
5769
,973
165,
253
16,8
3659
,737
19,5
3417
7,14
17,
958
7,78
125
,905
73,3
9873
,398
767,
271
2,91
5
Bang
lade
shSE
AR
298,
937
350,
258
962,
542
204,
239
473,
157
65,4
7532
5,24
675
,982
50,6
5515
5,43
644
0,40
244
0,40
23,
842,
729
2,51
0
Nep
alSE
AR
49,0
0657
,419
157,
793
26,2
4177
,567
11,1
2653
,319
12,4
568,
304
31,8
3990
,211
90,2
1166
5,49
12,
445
Vie
t N
amW
PR21
1,23
024
5,20
155
7,33
495
,016
185,
984
118,
769
412,
696
5,95
310
1,20
873
,620
208,
590
208,
590
2,42
4,19
22,
883
Tota
l fo
r lo
w-i
nco
me
cou
ntr
ies
1,32
0,31
41,
560,
175
4,04
7,44
067
4,71
82,
567,
464
344,
135
1,26
4,56
139
0,47
948
9,58
488
1,95
82,
498,
881
2,49
8,88
118
,538
,590
2,43
6
Mid
dle
inco
me
cou
ntr
ies
(lo
wer
-mid
dle
an
d u
pp
er-m
idd
le)
Con
goA
FR4,
519
5,87
714
,453
1,93
416
,674
1,06
62,
606
100
1,36
54,
224
11,9
6811
,968
76,7
542,
247
Sout
h A
fric
aA
FR73
,910
96,1
3323
6,40
973
,047
272,
730
18,5
6242
,623
1,64
222
,335
45,6
8412
9,43
812
9,43
81,
141,
951
2,37
5
Arg
entin
aA
MR
96,5
9810
2,67
926
4,22
142
,730
288,
417
70,7
7119
1,61
04,
287
50,2
9730
,462
86,3
0986
,309
1,31
4,69
03,
394
Beliz
eA
MR
595
632
1,62
724
01,
776
164
1,18
026
310
321
910
910
8,69
13,
071
Boliv
iaA
MR
19,2
1620
,426
52,5
611,
642
57,3
756,
155
38,1
171,
990
12,2
8010
,494
29,7
3329
,733
279,
720
3,04
6
Chi
leA
MR
41,3
9043
,996
113,
212
21,2
2812
3,58
023
,775
82,1
001,
837
21,5
5112
,159
34,4
5134
,451
553,
730
3,39
8
Cos
ta R
ica
AM
R10
,485
11,1
4528
,680
4,10
731
,306
4,32
520
,798
465
5,46
03,
684
10,4
3810
,438
141,
332
3,26
4
Dom
inic
an R
epub
licA
MR
21,5
9622
,955
59,0
705,
648
64,4
808,
538
42,8
3795
811
,245
9,44
126
,750
26,7
5030
0,26
73,
149
Ecua
dor
AM
R29
,762
31,6
3681
,407
11,5
1788
,863
12,4
4759
,036
3,08
219
,019
12,7
8036
,210
36,2
1042
1,96
93,
230
21
Tabl
e 4
(con
tinue
d)
Co
un
try
WH
O
Reg
ion
Sch
izo
ph
ren
ia a
nd
o
ther
no
n-a
ffec
tive
p
sych
ose
s
Dep
ress
ion
Suic
idal
id
eati
on
Epile
psy
Dem
enti
aA
lco
ho
l u
se
Illic
it s
ub
stan
ce U
seC
hild
ho
od
Dis
ord
ers
Tota
l Ta
rget
C
ases
Tota
l ca
ses
per
10
0,00
0 to
tal
po
pu
la-
tio
n
Sch
izo
-p
hre
nia
Bip
ola
r O
pio
id
use
O
ther
D
rug
U
se
Inte
llect
ual
D
isab
iliti
es
Co
nd
uct
/ B
ehav
iora
l Em
oti
on
al
Mid
dle
inco
me
cou
ntr
ies
(lo
wer
-mid
dle
an
d u
pp
er-m
idd
le)
El S
alva
dor
AM
R13
,298
14,1
3536
,372
4,78
439
,703
6,20
526
,377
590
6,92
46,
378
18,0
7118
,071
190,
907
3,15
0
Gua
tem
ala
AM
R24
,422
25,9
5966
,799
3,67
072
,917
7,43
548
,442
2,52
915
,606
16,4
5546
,623
46,6
2337
7,47
92,
970
Guy
ana
AM
R1,
775
1,88
64,
854
2,83
45,
298
711
3,52
079
924
708
2,00
62,
006
26,6
003,
495
Hon
dura
sA
MR
14,0
1814
,900
38,3
414,
306
41,8
534,
109
27,8
0562
27,
299
8,23
223
,324
23,3
2420
8,13
23,
020
Jam
aica
AM
R6,
179
6,56
816
,901
1,16
118
,449
3,35
112
,256
274
3,21
72,
514
7,12
37,
123
85,1
163,
193
Nic
arag
uaA
MR
9,68
812
,191
31,2
251,
105
14,9
401,
189
1,81
86,
956
7,32
96,
183
17,5
1917
,519
127,
661
2,34
1
Pana
ma
AM
R7,
602
8,08
120
,793
3,91
122
,698
3,20
315
,079
787
3,95
82,
940
8,33
08,
330
105,
713
3,27
4
Para
guay
AM
R12
,818
13,6
2435
,059
3,95
338
,270
4,35
325
,425
569
6,67
46,
342
17,9
6917
,969
183,
024
3,09
9
Surin
ame
AM
R1,
176
1,25
03,
217
1,08
33,
512
486
2,33
352
612
447
1,26
71,
267
16,7
043,
361
Uru
guay
AM
R8,
575
9,11
523
,456
6,76
325
,604
8,25
717
,010
381
4,46
52,
370
6,71
56,
715
119,
426
3,59
0
Djib
outi
EMR
1,41
31,
605
4,55
537
22,
180
220
265
1,01
534
792
72,
627
2,62
718
,152
2,25
8
Egyp
tEM
R14
6,84
716
6,76
647
3,30
313
,043
226,
452
34,2
2527
,563
105,
432
36,0
0177
,175
218,
663
218,
663
1,74
4,13
22,
261
Iran
EMR
148,
709
168,
880
479,
303
50,8
3222
9,32
338
,892
27,9
1314
3,22
65,
208
56,0
5815
8,83
115
8,83
11,
666,
005
2,35
4
Iraq
EMR
46,9
1553
,279
151,
212
40,2
1072
,348
8,34
48,
806
33,6
8411
,502
35,4
2710
0,37
710
0,37
766
2,47
92,
346
Jord
anEM
R9,
979
11,3
3332
,164
106
15,3
891,
801
1,87
39,
611
350
6,21
017
,595
17,5
9512
4,00
62,
228
Mor
occo
EMR
75,4
2868
,934
199,
019
39,0
3266
,413
45,2
9914
7,37
02,
126
14,8
8127
,702
78,4
8978
,489
843,
181
2,76
5
Suda
nEM
R65
,517
74,4
0421
1,16
928
,398
101,
034
11,7
2812
,298
47,0
3916
,062
47,2
5913
3,90
113
3,90
188
2,70
92,
281
Tuni
sia
EMR
20,9
6923
,814
67,5
863,
696
32,3
367,
270
3,93
620
,196
734
7,60
221
,539
21,5
3923
1,21
72,
341
Alb
ania
EUR
9,10
69,
057
21,3
892,
783
7,73
24,
674
22,9
281,
030
1,00
72,
469
6,99
66,
996
96,1
663,
090
Arm
enia
EUR
9,52
09,
468
22,3
611,
528
8,08
36,
688
23,9
691,
077
1,05
32,
016
5,71
25,
712
97,1
873,
171
Aze
rbai
jan
EUR
24,6
5424
,519
57,9
061,
274
20,9
329,
788
62,0
722,
789
2,72
76,
741
19,1
0019
,100
251,
601
2,98
0
Geo
rgia
EUR
14,4
8514
,406
34,0
221,
127
12,2
9912
,245
36,4
701,
638
1,60
22,
469
6,99
66,
996
144,
755
3,24
3
Kyr
gyzs
tan
EUR
14,2
8614
,208
33,5
556,
694
12,1
304,
896
35,9
691,
616
1,58
04,
899
13,8
8113
,881
157,
594
3,01
7
Latv
iaEU
R7,
798
7,75
518
,315
8,22
36,
621
7,54
419
,632
1,86
239
299
62,
822
2,82
284
,780
3,69
9
Repu
blic
of
Mol
dova
EUR
10,7
9712
,040
28,4
8782
09,
506
5,14
421
,094
304
609
2,13
96,
061
6,06
110
3,06
22,
744
Ukr
aine
EUR
159,
336
158,
468
374,
247
172,
315
135,
286
149,
819
401,
168
38,0
488,
010
20,6
5258
,514
58,5
141,
734,
378
3,69
5
22
Tabl
e 4
(con
tinue
d)
Co
un
try
WH
O
Reg
ion
Sch
izo
ph
ren
ia a
nd
o
ther
no
n-a
ffec
tive
p
sych
ose
s
Dep
ress
ion
Suic
idal
id
eati
on
Epile
psy
Dem
enti
aA
lco
ho
l u
se
Illic
it s
ub
stan
ce U
seC
hild
ho
od
Dis
ord
ers
Tota
l Ta
rget
C
ases
Tota
l ca
ses
per
10
0,00
0 to
tal
po
pu
la-
tio
n
Sch
izo
-p
hre
nia
Bip
ola
r O
pio
id
use
O
ther
D
rug
U
se
Inte
llect
ual
D
isab
iliti
es
Co
nd
uct
/ B
ehav
iora
l Em
oti
on
al
Mid
dle
inco
me
cou
ntr
ies
(lo
wer
-mid
dle
an
d u
pp
er-m
idd
le)
Bhut
anSE
AR
1,26
01,
476
4,05
792
51,
994
340
1,37
132
021
466
61,
887
1,88
716
,398
2,52
7
Indi
a-U
ttar
akha
ndSE
AR
17,1
3420
,076
55,1
7015
,683
27,1
205,
181
18,6
424,
355
2,90
39,
799
27,7
6327
,763
231,
589
2,55
3
Mal
dive
sSE
AR
581
681
1,87
243
092
012
063
214
899
288
816
816
7,40
32,
526
Sri L
anka
SEA
R43
,444
50,9
0213
9,88
466
,442
68,7
6317
,862
47,2
672,
945
7,36
214
,427
40,8
7740
,877
541,
050
2,77
0
Thai
land
SEA
R14
9,95
117
5,69
448
2,82
483
,179
237,
342
64,4
0716
3,14
810
,164
25,4
0945
,381
128,
580
128,
580
1,69
4,65
82,
570
Tim
or-L
este
SEA
R1,
573
1,84
35,
064
603
2,48
925
91,
711
400
267
1,37
43,
893
3,89
323
,369
2,35
8
Chi
na-
Hun
anW
PR18
,245
21,1
7948
,140
13,9
2916
,064
16,8
6135
,646
514
8,74
23,
551
10,0
6210
,062
202,
996
3,20
9
Mon
golia
WPR
7,21
77,
471
16,9
515,
137
6,12
73,
322
18,1
701,
723
3,08
42,
205
6,24
86,
248
83,9
033,
292
Phili
ppin
esW
PR18
6,19
622
6,87
750
9,29
446
,227
555,
933
70,6
5136
9,33
48,
263
93,6
4591
,230
258,
485
258,
485
2,67
4,62
03,
128
Tota
l fo
r m
idd
le-i
nco
me
cou
ntr
ies
1,58
8,98
21,
768,
325
4,60
0,51
079
8,67
13,
103,
260
712,
681
2,17
0,22
046
6,75
044
4,65
665
1,48
01,
845,
860
1,84
5,86
019
,997
,256
2,77
7
Tota
l fo
r lo
w a
nd
mid
dle
-in
com
e co
un
trie
s2,
909,
297
3,32
8,50
18,
647,
950
1,47
3,38
95,
670,
724
1,05
6,81
53,
434,
781
857,
229
934,
240
1,53
3,43
84,
344,
741
4,34
4,74
138
,535
,846
2,60
2
* A
ll ca
lcul
atio
ns t
ake
into
acc
ount
the
age
str
uctu
re o
f th
e co
untr
y’s
popu
latio
n.
23
Tabl
e 5.
Per
cent
age
of t
arge
t ca
ses
with
in 5
8 LM
IC a
ttrib
utab
le t
o sp
ecifi
c M
NS
diso
rder
s*
Co
un
try
WH
O
Reg
ion
Sch
izo
ph
ren
ia a
nd
oth
er
no
n-a
ffec
tive
psy
cho
ses
Dep
ress
ion
Suic
idal
id
eati
on
Epile
psy
Dem
enti
aA
lco
ho
l U
se
Illic
it S
ub
stan
ce U
seC
hild
ho
od
Dis
ord
ers
Sch
izo
ph
ren
iaB
ipo
lar
Op
ioid
U
se
Oth
er
Dru
g U
seIn
telle
ctu
al
Dis
abili
ties
C
on
du
ct/
Beh
avio
ral
Emo
tio
nal
Low
-in
com
e co
un
trie
s
Beni
nA
FR5.
47.
117
.41.
520
.11.
13.
11.
15.
55.
616
.016
.0
Buru
ndi
AFR
5.8
7.6
18.6
3.8
21.4
1.0
3.4
0.1
1.8
5.5
15.5
15.5
Eritr
eaA
FR5.
97.
718
.82.
121
.70.
93.
40.
11.
85.
616
.016
.0
Ethi
opia
AFR
5.6
7.3
18.0
2.4
20.8
1.1
3.2
0.1
1.7
6.0
16.9
16.9
Nig
eria
AFR
5.5
7.1
17.5
2.0
20.2
1.0
3.2
1.1
5.6
5.5
15.7
15.7
Uga
nda
AFR
5.2
6.7
16.5
2.5
19.0
0.8
3.0
0.1
1.6
6.7
19.0
19.0
Afg
hani
stan
EMR
6.8
7.7
22.0
2.4
10.5
0.8
1.3
4.9
1.7
6.3
17.8
17.8
Paki
stan
EMR
7.6
8.6
24.4
4.4
11.7
1.5
1.4
5.4
1.9
5.0
14.1
14.1
Som
alila
ndEM
R6.
67.
521
.19.
210
.10.
91.
24.
71.
65.
615
.715
.7
Tajik
ista
nEU
R8.
78.
620
.40.
87.
42.
021
.91.
01.
04.
312
.112
.1
Uzb
ekis
tan
EUR
9.2
9.1
21.5
2.2
7.8
2.5
23.1
1.0
1.0
3.4
9.6
9.6
Bang
lade
shSE
AR
7.8
9.1
25.0
5.3
12.3
1.7
8.5
2.0
1.3
4.0
11.5
11.5
Nep
alSE
AR
7.4
8.6
23.7
3.9
11.7
1.7
8.0
1.9
1.2
4.8
13.6
13.6
Vie
t N
amW
PR8.
710
.123
.03.
97.
74.
917
.00.
24.
23.
08.
68.
6
Ave
rag
e fo
r lo
w-i
nco
me
cou
ntr
ies
7.1
8.4
21.8
3.6
13.8
1.9
6.8
2.1
2.6
4.8
13.5
13.5
Mid
dle
-in
com
e co
un
trie
s (l
ow
er-m
idd
le a
nd
up
per
-mid
dle
)
Con
goA
FR5.
97.
718
.82.
521
.71.
43.
40.
11.
85.
515
.615
.6
Sout
h A
fric
aA
FR6.
58.
420
.76.
423
.91.
63.
70.
12.
04.
011
.311
.3
Arg
entin
aA
MR
7.3
7.8
20.1
3.3
21.9
5.4
14.6
0.3
3.8
2.3
6.6
6.6
Beliz
eA
MR
6.8
7.3
18.7
2.8
20.4
1.9
13.6
0.3
3.6
3.7
10.5
10.5
Boliv
iaA
MR
6.9
7.3
18.8
0.6
20.5
2.2
13.6
0.7
4.4
3.8
10.6
10.6
Chi
leA
MR
7.5
7.9
20.4
3.8
22.3
4.3
14.8
0.3
3.9
2.2
6.2
6.2
Cos
ta R
ica
AM
R7.
47.
920
.32.
922
.23.
114
.70.
33.
92.
67.
47.
4
Dom
inic
an R
epub
licA
MR
7.2
7.6
19.7
1.9
21.5
2.8
14.3
0.3
3.7
3.1
8.9
8.9
Ecua
dor
AM
R7.
17.
519
.32.
721
.12.
914
.00.
74.
53.
08.
68.
6
El S
alva
dor
AM
R7.
07.
419
.12.
520
.83.
313
.80.
33.
63.
39.
59.
5
24
Tabl
e 5
(con
tinue
d)
Co
un
try
WH
O
Reg
ion
Sch
izo
ph
ren
ia a
nd
oth
er
no
n-a
ffec
tive
psy
cho
ses
Dep
ress
ion
Suic
idal
id
eati
on
Epile
psy
Dem
enti
aA
lco
ho
l U
se
Illic
it S
ub
stan
ce U
seC
hild
ho
od
Dis
ord
ers
Sch
izo
ph
ren
iaB
ipo
lar
Op
ioid
U
se
Oth
er
Dru
g U
seIn
telle
ctu
al
Dis
abili
ties
C
on
du
ct/
Beh
avio
ral
Emo
tio
nal
Mid
dle
-in
com
e co
un
trie
s (l
ow
er-m
idd
le a
nd
up
per
-mid
dle
)
Gua
tem
ala
AM
R6.
56.
917
.71.
019
.32.
012
.80.
74.
14.
412
.412
.4
Guy
ana
AM
R6.
77.
118
.210
.719
.92.
713
.20.
33.
52.
77.
57.
5
Hon
dura
sA
MR
6.7
7.2
18.4
2.1
20.1
2.0
13.4
0.3
3.5
4.0
11.2
11.2
Jam
aica
AM
R7.
37.
719
.91.
421
.73.
914
.40.
33.
83.
08.
48.
4
Nic
arag
uaA
MR
7.6
9.5
24.5
0.9
11.7
0.9
1.4
5.4
5.7
4.8
13.7
13.7
Pana
ma
AM
R7.
27.
619
.73.
721
.53.
014
.30.
73.
72.
87.
97.
9
Para
guay
AM
R7.
07.
419
.22.
220
.92.
413
.90.
33.
63.
59.
89.
8
Surin
ame
AM
R7.
07.
519
.36.
521
.02.
914
.00.
33.
72.
77.
67.
6
Uru
guay
AM
R7.
27.
619
.65.
721
.46.
914
.20.
33.
72.
05.
65.
6
Djib
outi
EMR
7.8
8.8
25.1
2.1
12.0
1.2
1.5
5.6
1.9
5.1
14.5
14.5
Egyp
tEM
R8.
49.
627
.10.
713
.02.
01.
66.
02.
14.
412
.512
.5
Iran
EMR
8.9
10.1
28.8
3.1
13.8
2.3
1.7
8.6
0.3
3.4
9.5
9.5
Iraq
EMR
7.1
8.0
22.8
6.1
10.9
1.3
1.3
5.1
1.7
5.3
15.2
15.2
Jord
anEM
R8.
09.
125
.90.
112
.41.
51.
57.
80.
35.
014
.214
.2
Mor
occo
EMR
8.9
8.2
23.6
4.6
7.9
5.4
17.5
0.3
1.8
3.3
9.3
9.3
Suda
nEM
R7.
48.
423
.93.
211
.41.
31.
45.
31.
85.
415
.215
.2
Tuni
sia
EMR
9.1
10.3
29.2
1.6
14.0
3.1
1.7
8.7
0.3
3.3
9.3
9.3
Alb
ania
EUR
9.5
9.4
22.2
2.9
8.0
4.9
23.8
1.1
1.0
2.6
7.3
7.3
Arm
enia
EUR
9.8
9.7
23.0
1.6
8.3
6.9
24.7
1.1
1.1
2.1
5.9
5.9
Aze
rbai
jan
EUR
9.8
9.7
23.0
0.5
8.3
3.9
24.7
1.1
1.1
2.7
7.6
7.6
Geo
rgia
EUR
10.0
10.0
23.5
0.8
8.5
8.5
25.2
1.1
1.1
1.7
4.8
4.8
Kyr
gyzs
tan
EUR
9.1
9.0
21.3
4.2
7.7
3.1
22.8
1.0
1.0
3.1
8.8
8.8
Latv
iaEU
R9.
29.
121
.69.
77.
88.
923
.22.
20.
51.
23.
33.
3
Repu
blic
of
Mol
dova
EUR
10.5
11.7
27.6
0.8
9.2
5.0
20.5
0.3
0.6
2.1
5.9
5.9
Ukr
aine
EUR
9.2
9.1
21.6
9.9
7.8
8.6
23.1
2.2
0.5
1.2
3.4
3.4
Bhut
anSE
AR
7.7
9.0
24.7
5.6
12.2
2.1
8.4
2.0
1.3
4.1
11.5
11.5
Indi
a-U
ttar
akha
ndSE
AR
7.4
8.7
23.8
6.8
11.7
2.2
8.0
1.9
1.3
4.2
12.0
12.0
Mal
dive
sSE
AR
7.9
9.2
25.3
5.8
12.4
1.6
8.5
2.0
1.3
3.9
11.0
11.0
25
Tabl
e 5
(con
tinue
d)
Co
un
try
WH
O
Reg
ion
Sch
izo
ph
ren
ia a
nd
oth
er
no
n-a
ffec
tive
psy
cho
ses
Dep
ress
ion
Suic
idal
id
eati
on
Epile
psy
Dem
enti
aA
lco
ho
l U
se
Illic
it S
ub
stan
ce U
seC
hild
ho
od
Dis
ord
ers
Sch
izo
ph
ren
iaB
ipo
lar
Op
ioid
U
se
Oth
er
Dru
g U
seIn
telle
ctu
al
Dis
abili
ties
C
on
du
ct/
Beh
avio
ral
Emo
tio
nal
Mid
dle
-in
com
e co
un
trie
s (l
ow
er-m
idd
le a
nd
up
per
-mid
dle
)
Sri L
anka
SEA
R8.
09.
425
.912
.312
.73.
38.
70.
51.
42.
77.
67.
6
Thai
land
SEA
R8.
810
.428
.54.
914
.03.
89.
60.
61.
52.
77.
67.
6
Tim
or-L
este
SEA
R6.
77.
921
.72.
610
.71.
17.
31.
71.
15.
916
.716
.7
Chi
na-H
unan
WPR
9.0
10.4
23.7
6.9
7.9
8.3
17.6
0.3
4.3
1.7
5.0
5.0
Mon
golia
WPR
8.6
8.9
20.2
6.1
7.3
4.0
21.7
2.1
3.7
2.6
7.4
7.4
Phili
ppin
esW
PR7.
08.
519
.01.
720
.82.
613
.80.
33.
53.
49.
79.
7
Ave
rag
e fo
r m
idd
le-i
nco
me
cou
ntr
ies
7.9
8.8
23.0
4.0
15.5
3.6
10.9
2.3
2.2
3.3
9.2
9.2
Ave
rag
e fo
r lo
w-
and
mid
dle
-in
com
e co
un
trie
s7.
5%8.
6%22
.4%
3.8%
14.7
%2.
7%8.
9%2.
2%2.
4%4.
0%11
.3%
11.3
%
* D
eriv
ed f
rom
dat
a in
Tab
le 3
. The
pro
port
ions
are
cal
cula
ted
with
in e
ach
LMIC
(by
row
). Ea
ch r
ow t
otal
s 10
0%.
26
Table 6. Total expected annual outpatient visits and inpatient days for target cases with MNS disorders in 58 LMIC
Country WHO Region
Outpatient Inpatient
Day care visits Regular visits Acute days Community/res days
Visits Visits per 100,000 total population
Visits Visits per 100,000 total population
Days Days per 100,000 total population
Days Days per 100,000 total population
Low-income countries
Benin AFR 227,533 2,892 1,127,406 14,327 41,264 524 385,825 4,903
Burundi AFR 210,684 2,856 1,021,948 13,853 40,257 546 321,345 4,356
Eritrea AFR 125,776 2,811 609,921 13,630 24,248 542 187,373 4,187
Ethiopia AFR 2,069,173 2,735 10,278,987 13,585 393,273 520 3,171,996 4,192
Nigeria AFR 4,116,548 2,922 20,304,877 14,413 747,203 530 6,963,992 4,943
Uganda AFR 725,895 2,529 3,837,450 13,370 135,524 472 1,090,488 3,799
Afghanistan EMR 787,677 3,214 3,714,954 15,159 143,096 584 1,119,760 4,569
Pakistan EMR 6,113,756 3,687 26,626,798 16,058 1,118,405 674 9,307,137 5,613
Somaliland EMR 285,469 3,418 1,347,291 16,129 50,765 608 420,960 5,040
Tajikistan EUR 282,297 4,318 977,914 14,957 56,561 865 438,550 6,708
Uzbekistan EUR 1,259,933 4,787 4,117,843 15,645 252,594 960 2,049,365 7,786
Bangladesh SEAR 6,071,443 3,965 23,536,423 15,371 1,168,551 763 9,362,100 6,114
Nepal SEAR 1,003,846 3,688 4,058,976 14,911 191,565 704 1,550,946 5,698
Viet Nam WPR 4,306,633 5,122 13,197,901 15,698 821,576 977 8,668,348 10,310
Average for LIC 1,970,476 8,197,049 370,349 3,217,013
Population-weighted average for LIC
3,625 15,082 681 5,919
Middle-income countries (lower-middle and upper-middle)
Congo AFR 98,045 2,870 470,008 13,759 18,712 548 155,621 4,556
South Africa AFR 1,586,135 3,299 7,030,452 14,625 306,077 637 2,572,867 5,352
Argentina AMR 1,945,711 5,024 7,410,565 19,133 358,699 926 4,407,424 11,379
Belize AMR 11,526 4,073 49,190 17,382 2,209 781 20,069 7,092
Bolivia AMR 376,157 4,096 1,600,571 17,430 71,356 777 682,768 7,435
Chile AMR 817,211 5,014 3,126,794 19,185 153,694 943 1,713,131 10,511
Costa Rica AMR 203,202 4,693 800,601 18,490 38,935 899 387,972 8,960
Dominican Republic AMR 419,451 4,399 1,701,944 17,848 80,192 841 789,923 8,284
Ecuador AMR 588,271 4,503 2,407,091 18,424 110,517 846 1,139,062 8,718
El Salvador AMR 262,289 4,328 1,079,048 17,806 49,378 815 514,767 8,495
Guatemala AMR 483,357 3,803 2,154,043 16,948 90,685 713 866,079 6,814
Guyana AMR 35,556 4,672 148,548 19,520 6,590 866 67,799 8,909
Honduras AMR 272,691 3,957 1,178,312 17,099 52,051 755 479,451 6,958
Jamaica AMR 121,725 4,566 482,046 18,081 22,944 861 249,568 9,361
Nicaragua AMR 214,014 3,924 885,710 16,240 39,382 722 329,413 6,040
Panama AMR 149,154 4,619 604,217 18,712 28,229 874 285,722 8,849
Paraguay AMR 248,763 4,212 1,036,790 17,555 47,596 806 451,880 7,651
Suriname AMR 23,170 4,662 93,982 18,910 4,368 879 44,368 8,927
Uruguay AMR 178,562 5,367 668,468 20,092 31,843 957 447,327 13,445
Djibouti EMR 29,319 3,647 126,828 15,775 5,433 676 43,040 5,353

27
Table 6 (continued)
Country WHO Region
Outpatient Inpatient
Day care visits Regular visits Acute days Community/res days
Visits Visits per 100,000 total population
Visits Visits per 100,000 total population
Days Days per 100,000 total population
Days Days per 100,000 total population
Middle-income countries (lower-middle and upper-middle)
Egypt EMR 3,028,297 3,925 12,407,303 16,081 564,504 732 4,707,084 6,101
Iran EMR 3,078,101 4,350 12,580,598 17,777 571,660 808 4,730,526 6,685
Iraq EMR 997,955 3,534 4,516,096 15,992 180,349 639 1,500,348 5,313
Jordan EMR 207,185 3,723 914,711 16,437 38,362 689 297,153 5,340
Morocco EMR 1,384,912 4,542 4,531,227 14,860 259,852 852 2,871,661 9,417
Sudan EMR 1,376,072 3,556 6,095,534 15,751 251,859 651 2,059,621 5,322
Tunisia EMR 436,235 4,416 1,754,604 17,763 80,609 816 710,495 7,193
Albania EUR 167,189 5,372 513,105 16,488 32,694 1,051 321,932 10,345
Armenia EUR 177,604 5,795 517,331 16,879 34,179 1,115 382,309 12,473
Azerbaijan EUR 442,434 5,240 1,348,880 15,974 88,512 1,048 786,935 9,319
Georgia EUR 273,753 6,132 768,905 17,225 52,004 1,165 634,835 14,221
Kyrgyzstan EUR 259,161 4,961 842,494 16,127 51,290 982 444,291 8,505
Latvia EUR 153,971 6,718 460,104 20,074 27,995 1,221 374,359 16,333
Republic of Moldova EUR 203,764 5,425 569,698 15,168 41,106 1,094 373,432 9,942
Ukraine EUR 3,138,127 6,686 9,413,510 20,056 572,047 1,219 7,538,515 16,062
Bhutan SEAR 25,803 3,976 100,192 15,438 4,925 759 41,301 6,364
India-Uttarakhand SEAR 355,117 3,914 1,406,731 15,505 66,978 738 581,826 6,413
Maldives SEAR 11,779 4,020 45,366 15,483 2,272 776 18,014 6,148
Sri Lanka SEAR 894,301 4,579 3,165,927 16,209 169,823 869 1,594,982 8,166
Thailand SEAR 3,012,829 4,569 10,091,324 15,303 586,161 889 5,397,358 8,185
Timor-Leste SEAR 32,471 3,277 141,599 14,288 6,148 620 47,630 4,806
China-Hunan WPR 386,420 6,108 1,093,757 17,290 70,963 1,122 927,511 14,662
Mongolia WPR 139,841 5,486 458,015 17,968 26,438 1,037 269,208 10,561
Philippines WPR 3,838,292 4,489 15,291,869 17,886 743,532 870 6,978,264 8,162
Average for MIC 729,225 2,774,638 137,344 1,346,315
Population-weighted average for MIC
4,455 16,952 839 8,226
Average for LMIC 1,028,838 4,083,496 193,587 1,797,863
Population-weighted average for LMIC
4,029 15,991 758 7,041
LIC – low-income countryMIC – middle-income countryLMIC – low- and middle-income countries

28
Tabl
e 8.
Est
imat
ed f
ull-t
ime
equi
vale
nt s
taff
nee
ded
to t
reat
men
tal d
isor
ders
in 5
8 LM
IC, 2
005
Co
un
try
WH
O
Reg
ion
Psyc
hia
tris
tsN
urs
es in
men
tal h
ealt
h s
etti
ng
sPs
ych
oso
cial
Car
e Pr
ovi
der
sTo
tal F
TE S
taff
Nee
ded
FTE
staf
f n
eed
ed
Co
nfi
den
ce
inte
rval
*p
er
100,
000
po
pu
la-
tio
n
per
10
0,00
0 tr
eate
d
case
s
FTE
staf
f n
eed
ed
Co
nfi
den
ce
inte
rval
*p
er
100,
000
po
pu
la-
tio
n
per
10
0,00
0 tr
eate
d
case
s
FTE
Staf
f N
eed
ed
Co
nfi
den
ce
Inte
rval
*p
er
100,
000
po
pu
la-
tio
n
per
10
0,00
0 tr
eate
d
case
s
Tota
l FT
E St
aff
Nee
ded
Tota
l p
er
100,
000
po
pu
la-
tio
n
Tota
l p
er
100,
000
trea
ted
ca
ses
Low
-in
com
e co
un
trie
s
Beni
nA
FR81
(6
5-97
)1.
044
.174
6(5
97-8
96)
9.5
408.
167
9(5
43-8
15)
8.6
371.
11,
506
1982
3
Buru
ndi
AFR
68
(5
5-82
)0.
940
.763
8(5
11-7
66)
8.7
381.
659
6(4
77-7
15)
8.1
356.
41,
303
1877
9
Eritr
eaA
FR
40
(32-
48)
0.9
40.1
375
(300
-450
)8.
437
6.8
353
(282
-423
)7.
935
4.6
767
1777
2
Ethi
opia
AFR
674
(5
39-8
08)
0.9
40.0
6,31
2(5
,050
-7,5
75)
8.3
374.
65,
942
(4,7
54-7
,131
)7.
935
2.6
12,9
2817
767
Nig
eria
AFR
1,4
56
(1,1
65-1
,747
)1.
044
.213
,473
(10,
779-
16,1
68)
9.6
409.
112
,240
(9,7
92-1
4,68
8)8.
737
1.6
27,1
6919
825
Uga
nda
AFR
2
34
(187
-280
)0.
836
.82,
200
(1,7
60-2
,640
)7.
734
6.6
2,14
0(1
,712
-2,5
68)
7.5
337.
24,
574
1672
1
Afg
hani
stan
EMR
239
(191
-286
)1.
043
.722
54(1
,803
-2,7
05)
9.2
412.
521
34(1
,707
-2,5
61)
8.7
390.
54,
627
1984
7
Paki
stan
EMR
1,95
0 (1
,560
-2,3
40)
1.2
50.7
18,2
11(1
4,56
9-21
,853
)11
.047
3.4
16,3
23(1
3,05
8-19
,587
)9.
842
4.3
36,4
8422
948
Som
alila
ndEM
R
89
(71-
107)
1.1
44.3
838
(671
-1,0
06)
10.0
416.
578
4(6
27-9
41)
9.4
389.
71,
712
2085
0
Tajik
ista
nEU
R 9
0 (7
2-10
8)1.
449
.883
6(6
69-1
,003
)12
.846
0.6
683
(546
-820
)10
.437
6.4
1,60
925
887
Uzb
ekis
tan
EUR
418
(335
-502
)1.
654
.53,
844
(3,0
75-4
,613
)14
.650
1.0
3,03
8(2
,431
-3,6
46)
11.5
396.
07,
301
2895
1
Bang
lade
shSE
AR
1,9
43
(1,5
54-2
,332
)1.
350
.618
,054
(14,
443-
21,6
65)
11.8
469.
815
,407
(12,
325-
18,4
88)
10.1
400.
935
,404
2392
1
Nep
alSE
AR
323
(258
-387
)1.
248
.53,
002
(2,4
02-3
,603
)11
.045
1.2
2,60
1(2
,081
-3,1
22)
9.6
390.
95,
927
2289
1
Vie
t N
amW
PR 1
,723
(1
,379
-2,0
68)
2.0
71.1
15,4
59(1
2,36
7-18
,551
)18
.463
7.7
11,3
07(9
,045
-13,
568)
13.4
466.
428
,489
341,
175
Pop
ula
tio
n-w
eig
hte
d
aver
age
or
tota
l fo
r LI
C 9
,328
1.
249
.786
,244
11.3
459.
774
,227
9.8
398.
416
9,79
822
908
Mid
dle
-in
com
e co
un
trie
s (l
ow
er-m
idd
le a
nd
up
per
-mid
dle
)
Con
goA
FR31
(24-
37)
0.9
39.8
307
(246
-369
)9.
040
0.3
236
(189
-284
)6.
930
8.0
574
1774
8
Sout
h A
fric
aA
FR49
4(3
95-5
92)
1.0
43.2
4,98
3(3
,986
-5,9
79)
10.4
436.
33,
699
(2,9
59-4
,439
)7.
732
3.9
9,17
519
803
Arg
entin
aA
MR
758
(607
-910
)2.
057
.77,
682
(6,1
46-9
,219
)19
.858
4.3
4,88
7(3
,910
-5,8
65)
12.6
371.
813
,328
341,
014
Beliz
eA
MR
4(3
-4)
1.3
43.1
38(3
0-45
)13
.443
5.7
27(2
2-33
)9.
631
1.9
6924
791
Boliv
iaA
MR
126
(101
-151
)1.
445
.01,
273
(1,0
18-1
,528
)13
.945
5.1
898
(719
-1,0
78)
9.8
321.
22,
297
2582
1
Chi
leA
MR
300
(240
-360
)1.
854
.23,
040
(2,4
32-3
,649
)18
.754
9.1
1,98
2(1
,585
-2,3
78)
12.2
357.
95,
322
3396
1
Cos
ta R
ica
AM
R70
(56-
84)
1.6
49.4
707
(566
-848
)16
.350
0.2
478
(383
-574
)11
.133
8.5
1,25
529
888
Dom
inic
an R
epub
licA
MR
143
(115
-172
)1.
547
.71,
450
(1,1
60-1
,740
)15
.248
2.8
995
(796
-1,1
94)
10.4
331.
42,
588
2786
2
Ecua
dor
AM
R20
5(1
64-2
46)
1.6
48.7
2,07
7(1
,662
-2,4
92)
15.9
492.
21,
418
(1,1
34-1
,701
)10
.933
5.9
3,70
028
877
29
Tabl
e 8
(con
tinue
d)
Co
un
try
WH
O
Reg
ion
Psyc
hia
tris
tsN
urs
es in
men
tal h
ealt
h s
etti
ng
sPs
ych
oso
cial
Car
e Pr
ovi
der
sTo
tal F
TE S
taff
Nee
ded
FTE
staf
f n
eed
ed
Co
nfi
den
ce
inte
rval
*p
er
100,
000
po
pu
la-
tio
n
per
10
0,00
0 tr
eate
d
case
s
FTE
staf
f n
eed
ed
Co
nfi
den
ce
inte
rval
*p
er
100,
000
po
pu
la-
tio
n
per
10
0,00
0 tr
eate
d
case
s
FTE
Staf
f N
eed
ed
Co
nfi
den
ce
Inte
rval
*p
er
100,
000
po
pu
la-
tio
n
per
10
0,00
0 tr
eate
d
case
s
Tota
l FT
E St
aff
Nee
ded
Tota
l p
er
100,
000
po
pu
la-
tio
n
Tota
l p
er
100,
000
trea
ted
ca
ses
Mid
dle
-in
com
e co
un
trie
s (l
ow
er-m
idd
le a
nd
up
per
-mid
dle
)
El S
alva
dor
AM
R93
(74-
111)
1.5
48.5
936
(749
-1,1
24)
15.5
490.
563
7(5
10-7
65)
10.5
333.
91,
666
2787
3
Gua
tem
ala
AM
R16
2(1
29-1
94)
1.3
42.8
1,63
1(1
,305
-1,9
57)
12.8
432.
01,
175
(940
-1,4
09)
9.2
311.
22,
967
2378
6
Guy
ana
AM
R12
(10-
15)
1.6
46.2
124
(100
-149
)16
.346
7.6
86(6
9-10
3)11
.332
3.0
223
2983
7
Hon
dura
sA
MR
89(7
2-10
7)1.
343
.090
4(7
23-1
,085
)13
.143
4.2
648
(518
-777
)9.
431
1.3
1,64
124
788
Jam
aica
AM
R44
(35-
53)
1.7
51.9
447
(358
-537
)16
.852
5.3
297
(237
-356
)11
.134
8.5
788
3092
6
Nic
arag
uaA
MR
63(5
0-76
)1.
249
.463
9(5
11-7
67)
11.7
500.
747
1(3
77-5
66)
8.6
369.
21,
174
2291
9
Pana
ma
AM
R52
(41-
62)
1.6
48.8
522
(417
-626
)16
.249
3.6
356
(285
-427
)11
.033
6.9
930
2987
9
Para
guay
AM
R83
(66-
100)
1.4
45.4
840
(672
-1,0
08)
14.2
459.
058
9(4
71-7
06)
10.0
321.
61,
512
2682
6
Surin
ame
AM
R8
(6-1
0)1.
647
.981
(65-
97)
16.3
485.
255
(44-
66)
11.1
331.
314
429
864
Uru
guay
AM
R75
(60-
90)
2.3
63.0
762
(609
-914
)22
.963
7.9
469
(375
-562
)14
.139
2.3
1,30
639
1,09
3
Djib
outi
EMR
8(7
-10)
1.0
46.4
85(6
8-10
2)10
.647
0.2
65(5
2-78
)8.
135
7.8
159
2087
4
Egyp
tEM
R89
7(7
18-1
,077
)1.
251
.49,
099
(7,2
79-1
0,91
8)11
.852
1.7
6,66
3(5
,331
-7,9
96)
8.6
382.
016
,659
2295
5
Iran
EMR
904
(723
-1,0
85)
1.3
54.3
9,16
9(7
,335
-11,
002)
13.0
550.
36,
734
(5,3
87-8
,081
)9.
540
4.2
16,8
0724
1,00
9
Iraq
EMR
294
(235
-353
)1.
044
.42,
973
(2,3
79-3
,568
)10
.544
8.8
2,28
3(1
,826
-2,7
39)
8.1
344.
65,
551
2083
8
Jord
anEM
R59
(47-
71)
1.1
47.5
596
(477
-715
)10
.748
0.3
460
(368
-552
)8.
337
1.1
1,11
520
899
Mor
occo
EMR
493
(394
-592
)1.
658
.55,
020
(4,0
16-6
,024
)16
.559
5.4
3,13
0(2
,504
-3,7
57)
10.3
371.
38,
644
281,
025
Suda
nEM
R40
3(3
22-4
83)
1.0
45.6
4,07
5(3
,260
-4,8
90)
10.5
461.
63,
108
(2,4
86-3
,729
)8.
035
2.1
7,58
520
859
Tuni
sia
EMR
133
(107
-160
)1.
357
.61,
351
(1,0
81-1
,621
)13
.758
4.3
968
(775
-1,1
62)
9.8
418.
92,
453
251,
061
Alb
ania
EUR
56(4
5-67
)1.
858
.056
9(4
55-6
83)
18.3
591.
735
5(2
84-4
27)
11.4
369.
798
032
1,01
9
Arm
enia
EUR
64(5
1-77
)2.
166
.265
6(5
25-7
88)
21.4
675.
439
2(3
14-4
70)
12.8
403.
41,
113
361,
145
Aze
rbai
jan
EUR
139
(111
-167
)1.
655
.21,
417
(1,1
33-1
,700
)16
.856
3.1
903
(723
-1,0
84)
10.7
359.
02,
459
2997
7
Geo
rgia
EUR
105
(84-
126)
2.4
72.5
1,07
1(8
57-1
,285
)24
.073
9.6
621
(497
-746
)13
.942
9.2
1,79
740
1,24
1
Kyr
gyzs
tan
EUR
80(6
4-96
)1.
550
.681
3(6
50-9
75)
15.6
515.
653
4(4
27-6
41)
10.2
338.
91,
426
2790
5
Latv
iaEU
R62
(49-
74)
2.7
72.7
628
(503
-754
)27
.474
1.1
366
(293
-439
)16
.043
1.8
1,05
646
1,24
6
Repu
blic
of
Mol
dova
EUR
65(5
2-78
)1.
762
.866
2(5
30-7
94)
17.6
642.
340
8(3
26-4
90)
10.9
395.
91,
135
301,
101
Ukr
aine
EUR
1,24
5(9
96-1
,494
)2.
771
.812
,684
(10,
147-
15,2
21)
27.0
731.
37,
421
(5,9
37-8
,905
)15
.842
7.9
21,3
5045
1,23
1
Bhut
anSE
AR
8(6
-9)
1.2
47.2
79(6
3-94
)12
.147
9.4
56(4
5-67
)8.
634
1.3
142
2286
8
30
Tabl
e 8
(con
tinue
d)
Co
un
try
WH
O
Reg
ion
Psyc
hia
tris
tsN
urs
es in
men
tal h
ealt
h s
etti
ng
sPs
ych
oso
cial
Car
e Pr
ovi
der
sTo
tal F
TE S
taff
Nee
ded
FTE
staf
f n
eed
ed
Co
nfi
den
ce
inte
rval
*p
er
100,
000
po
pu
la-
tio
n
per
10
0,00
0 tr
eate
d
case
s
FTE
staf
f n
eed
ed
Co
nfi
den
ce
inte
rval
*p
er
100,
000
po
pu
la-
tio
n
per
10
0,00
0 tr
eate
d
case
s
FTE
Staf
f N
eed
ed
Co
nfi
den
ce
Inte
rval
*p
er
100,
000
po
pu
la-
tio
n
per
10
0,00
0 tr
eate
d
case
s
Tota
l FT
E St
aff
Nee
ded
Tota
l p
er
100,
000
po
pu
la-
tio
n
Tota
l p
er
100,
000
trea
ted
ca
ses
Mid
dle
-in
com
e co
un
trie
s (l
ow
er-m
idd
le a
nd
up
per
-mid
dle
)
Indi
a-U
ttar
akha
ndSE
AR
109
(87-
130)
1.2
46.9
1,10
3(8
82-1
,324
)12
.247
6.3
785
(628
-942
)8.
733
8.9
1,99
722
862
Mal
dive
sSE
AR
3(3
-4)
1.2
46.2
35(2
8-42
)11
.846
8.8
25(2
0-30
)8.
533
7.6
6322
853
Sri L
anka
SEA
R28
6(2
29-3
44)
1.5
52.9
2,91
4(2
,331
-3,4
97)
14.9
538.
61,
945
(1,5
56-2
,334
)10
.035
9.5
5,14
526
951
Thai
land
SEA
R96
2(7
69-1
,154
)1.
556
.79,
794
(7,8
35-1
1,75
2)14
.957
7.9
6,41
4(5
,131
-7,6
97)
9.7
378.
517
,169
261,
013
Tim
or-L
este
SEA
R9
(7-1
1)0.
940
.195
(76-
114)
9.6
405.
372
(58-
87)
7.3
309.
217
618
755
Chi
na-H
unan
WPR
152
(122
-183
)2.
475
.01,
554
(1,2
43-1
,864
)24
.676
5.4
896
(717
-1,0
75)
14.2
441.
22,
602
411,
282
Mon
golia
WPR
47(3
8-56
)1.
856
.047
9(3
83-5
74)
18.8
570.
330
5(2
44-3
66)
12.0
363.
483
033
990
Phili
ppin
esW
PR1,
274
(1,0
19-1
,529
)1.
547
.612
,896
(10,
317-
15,4
76)
15.1
482.
28,
894
(7,1
15-1
0,67
3)10
.433
2.5
23,0
6527
862
Pop
ula
tio
n-w
eig
hte
d
aver
age
or
tota
l fo
r M
IC10
,669
1.5
52.7
108,
258
15.0
534.
873
,209
10.2
365.
819
2,13
627
953
Pop
ula
tio
n-w
eig
hte
d
aver
age
or
tota
l fo
r LM
IC19
,996
1.
451
.119
4,50
2
13.1
496.
214
7,43
6
10.0
382.
536
1,93
524
930
* C
onfid
ence
inte
rval
was
cal
cula
ted
by in
crea
sing
and
dec
reas
ing
the
inpa
tient
and
out
patie
nt t
reat
men
t se
rvic
es b
y 20
%. T
he s
ame
confi
denc
e in
terv
al is
pro
duce
d if
the
MN
S di
sord
er p
reva
lenc
es w
ere
incr
ease
d an
d de
crea
sed
by 2
0%,
or
if t
arge
t co
vera
ge r
ates
wer
e in
crea
sed
and
decr
ease
d by
20%
.
LIC
- lo
w in
com
e co
untr
y
MIC
- m
iddl
e in
com
e co
untr
y
LMIC
- lo
w a
nd m
iddl
e in
com
e co
untr
ies.
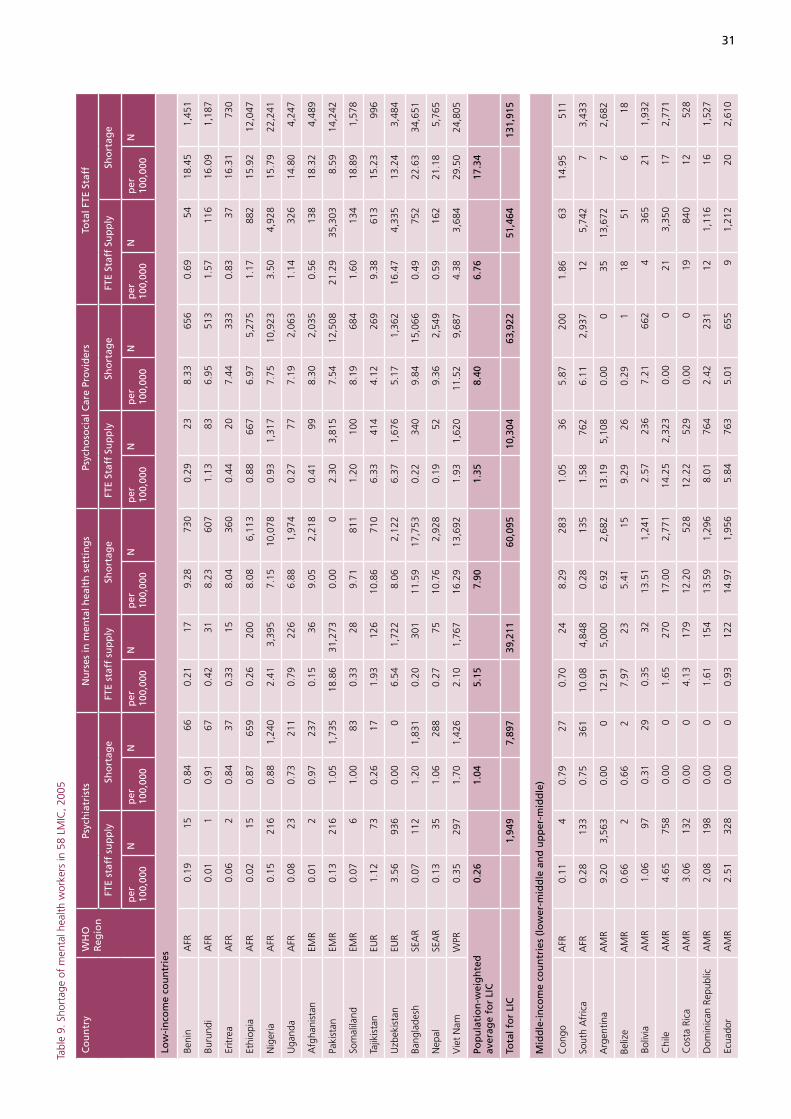
31
Tabl
e 9.
Sho
rtag
e of
men
tal h
ealth
wor
kers
in 5
8 LM
IC, 2
005
Co
un
try
WH
O
Reg
ion
Psyc
hia
tris
tsN
urs
es in
men
tal h
ealt
h s
etti
ng
sPs
ych
oso
cial
Car
e Pr
ovi
der
sTo
tal F
TE S
taff
FTE
staf
f su
pp
lySh
ort
age
FTE
staf
f su
pp
lySh
ort
age
FTE
Staf
f Su
pp
lySh
ort
age
FTE
Staf
f Su
pp
lySh
ort
age
per
10
0,00
0N
per
10
0,00
0N
per
10
0,00
0N
per
10
0,00
0N
per
10
0,00
0N
per
10
0,00
0N
per
10
0,00
0N
per
10
0,00
0N
Low
-in
com
e co
un
trie
s
Beni
nA
FR0.
1915
0.84
660.
2117
9.28
730
0.29
238.
3365
60.
6954
18.4
51,
451
Buru
ndi
AFR
0.01
10.
9167
0.42
318.
2360
71.
1383
6.95
513
1.57
116
16.0
91,
187
Eritr
eaA
FR0.
062
0.84
370.
3315
8.04
360
0.44
207.
4433
30.
8337
16.3
173
0
Ethi
opia
AFR
0.02
150.
8765
90.
2620
08.
086,
113
0.88
667
6.97
5,27
51.
1788
215
.92
12,0
47
Nig
eria
AFR
0.15
216
0.88
1,24
02.
413,
395
7.15
10,0
780.
931,
317
7.75
10,9
233.
504,
928
15.7
922
,241
Uga
nda
AFR
0.08
230.
7321
10.
7922
66.
881,
974
0.27
777.
192,
063
1.14
326
14.8
04,
247
Afg
hani
stan
EMR
0.01
20.
9723
70.
1536
9.05
2,21
80.
4199
8.30
2,03
50.
5613
818
.32
4,48
9
Paki
stan
EMR
0.13
216
1.05
1,73
518
.86
31,2
730.
000
2.30
3,81
57.
5412
,508
21.2
935
,303
8.59
14,2
42
Som
alila
ndEM
R0.
076
1.00
830.
3328
9.71
811
1.20
100
8.19
684
1.60
134
18.8
91,
578
Tajik
ista
nEU
R1.
1273
0.26
171.
9312
610
.86
710
6.33
414
4.12
269
9.38
613
15.2
399
6
Uzb
ekis
tan
EUR
3.56
936
0.00
06.
541,
722
8.06
2,12
26.
371,
676
5.17
1,36
216
.47
4,33
513
.24
3,48
4
Bang
lade
shSE
AR
0.07
112
1.20
1,83
10.
2030
111
.59
17,7
530.
2234
09.
8415
,066
0.49
752
22.6
334
,651
Nep
alSE
AR
0.13
351.
0628
80.
2775
10.7
62,
928
0.19
529.
362,
549
0.59
162
21.1
85,
765
Vie
t N
amW
PR0.
3529
71.
701,
426
2.10
1,76
716
.29
13,6
921.
931,
620
11.5
29,
687
4.38
3,68
429
.50
24,8
05
Pop
ula
tio
n-w
eig
hte
d
aver
age
for
LIC
0.26
1.
04
5.15
7.
90
1.35
8.
40
6.76
17
.34
Tota
l fo
r LI
C
1,94
9
7,89
7
39,2
11
60,0
95
10,3
04
63,9
22
51,4
64
131,
915
Mid
dle
-in
com
e co
un
trie
s (l
ow
er-m
idd
le a
nd
up
per
-mid
dle
)
Con
goA
FR0.
114
0.79
270.
7024
8.29
283
1.05
365.
8720
01.
8663
14.9
551
1
Sout
h A
fric
aA
FR0.
2813
30.
7536
110
.08
4,84
80.
2813
51.
5876
26.
112,
937
125,
742
73,
433
Arg
entin
aA
MR
9.20
3,56
30.
000
12.9
15,
000
6.92
2,68
213
.19
5,10
80.
000
3513
,672
72,
682
Beliz
eA
MR
0.66
20.
662
7.97
235.
4115
9.29
260.
291
1851
618
Boliv
iaA
MR
1.06
970.
3129
0.35
3213
.51
1,24
12.
5723
67.
2166
24
365
211,
932
Chi
leA
MR
4.65
758
0.00
01.
6527
017
.00
2,77
114
.25
2,32
30.
000
213,
350
172,
771
Cos
ta R
ica
AM
R3.
0613
20.
000
4.13
179
12.2
052
812
.22
529
0.00
019
840
1252
8
Dom
inic
an R
epub
licA
MR
2.08
198
0.00
01.
6115
413
.59
1,29
68.
0176
42.
4223
112
1,11
616
1,52
7
Ecua
dor
AM
R2.
5132
80.
000
0.93
122
14.9
71,
956
5.84
763
5.01
655
91,
212
202,
610
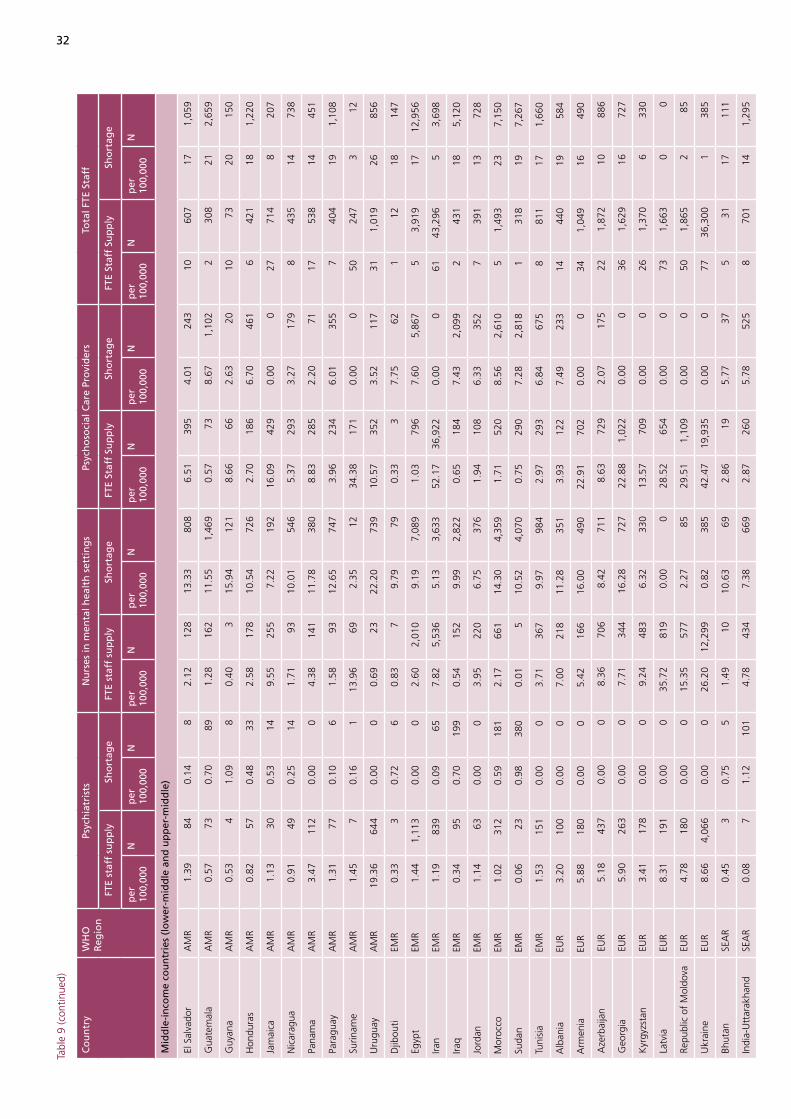
32
Tabl
e 9
(con
tinue
d)
Co
un
try
WH
O
Reg
ion
Psyc
hia
tris
tsN
urs
es in
men
tal h
ealt
h s
etti
ng
sPs
ych
oso
cial
Car
e Pr
ovi
der
sTo
tal F
TE S
taff
FTE
staf
f su
pp
lySh
ort
age
FTE
staf
f su
pp
lySh
ort
age
FTE
Staf
f Su
pp
lySh
ort
age
FTE
Staf
f Su
pp
lySh
ort
age
per
10
0,00
0N
per
10
0,00
0N
per
10
0,00
0N
per
10
0,00
0N
per
10
0,00
0N
per
10
0,00
0N
per
10
0,00
0N
per
10
0,00
0N
Mid
dle
-in
com
e co
un
trie
s (l
ow
er-m
idd
le a
nd
up
per
-mid
dle
)
El S
alva
dor
AM
R1.
3984
0.14
82.
1212
813
.33
808
6.51
395
4.01
243
1060
717
1,05
9
Gua
tem
ala
AM
R0.
5773
0.70
891.
2816
211
.55
1,46
90.
5773
8.67
1,10
22
308
212,
659
Guy
ana
AM
R0.
534
1.09
80.
403
15.9
412
18.
6666
2.63
2010
7320
150
Hon
dura
sA
MR
0.82
570.
4833
2.58
178
10.5
472
62.
7018
66.
7046
16
421
181,
220
Jam
aica
AM
R1.
1330
0.53
149.
5525
57.
2219
216
.09
429
0.00
027
714
820
7
Nic
arag
uaA
MR
0.91
490.
2514
1.71
9310
.01
546
5.37
293
3.27
179
843
514
738
Pana
ma
AM
R3.
4711
20.
000
4.38
141
11.7
838
08.
8328
52.
2071
1753
814
451
Para
guay
AM
R1.
3177
0.10
61.
5893
12.6
574
73.
9623
46.
0135
57
404
191,
108
Surin
ame
AM
R1.
457
0.16
113
.96
692.
3512
34.3
817
10.
000
5024
73
12
Uru
guay
AM
R19
.36
644
0.00
00.
6923
22.2
073
910
.57
352
3.52
117
311,
019
2685
6
Djib
outi
EMR
0.33
30.
726
0.83
79.
7979
0.33
37.
7562
112
1814
7
Egyp
tEM
R1.
441,
113
0.00
02.
602,
010
9.19
7,08
91.
0379
67.
605,
867
53,
919
1712
,956
Iran
EMR
1.19
839
0.09
657.
825,
536
5.13
3,63
352
.17
36,9
220.
000
6143
,296
53,
698
Iraq
EMR
0.34
950.
7019
90.
5415
29.
992,
822
0.65
184
7.43
2,09
92
431
185,
120
Jord
anEM
R1.
1463
0.00
03.
9522
06.
7537
61.
9410
86.
3335
27
391
1372
8
Mor
occo
EMR
1.02
312
0.59
181
2.17
661
14.3
04,
359
1.71
520
8.56
2,61
05
1,49
323
7,15
0
Suda
nEM
R0.
0623
0.98
380
0.01
510
.52
4,07
00.
7529
07.
282,
818
131
819
7,26
7
Tuni
sia
EMR
1.53
151
0.00
03.
7136
79.
9798
42.
9729
36.
8467
58
811
171,
660
Alb
ania
EUR
3.20
100
0.00
07.
0021
811
.28
351
3.93
122
7.49
233
1444
019
584
Arm
enia
EUR
5.88
180
0.00
05.
4216
616
.00
490
22.9
170
20.
000
341,
049
1649
0
Aze
rbai
jan
EUR
5.18
437
0.00
08.
3670
68.
4271
18.
6372
92.
0717
522
1,87
210
886
Geo
rgia
EUR
5.90
263
0.00
07.
7134
416
.28
727
22.8
81,
022
0.00
036
1,62
916
727
Kyr
gyzs
tan
EUR
3.41
178
0.00
09.
2448
36.
3233
013
.57
709
0.00
026
1,37
06
330
Latv
iaEU
R8.
3119
10.
000
35.7
281
90.
000
28.5
265
40.
000
731,
663
00
Repu
blic
of
Mol
dova
EUR
4.78
180
0.00
015
.35
577
2.27
8529
.51
1,10
90.
000
501,
865
285
Ukr
aine
EUR
8.66
4,06
60.
000
26.2
012
,299
0.82
385
42.4
719
,935
0.00
077
36,3
001
385
Bhut
anSE
AR
0.45
30.
755
1.49
1010
.63
692.
8619
5.77
375
3117
111
Indi
a-U
ttar
akha
ndSE
AR
0.08
71.
1210
14.
7843
47.
3866
92.
8726
05.
7852
58
701
141,
295
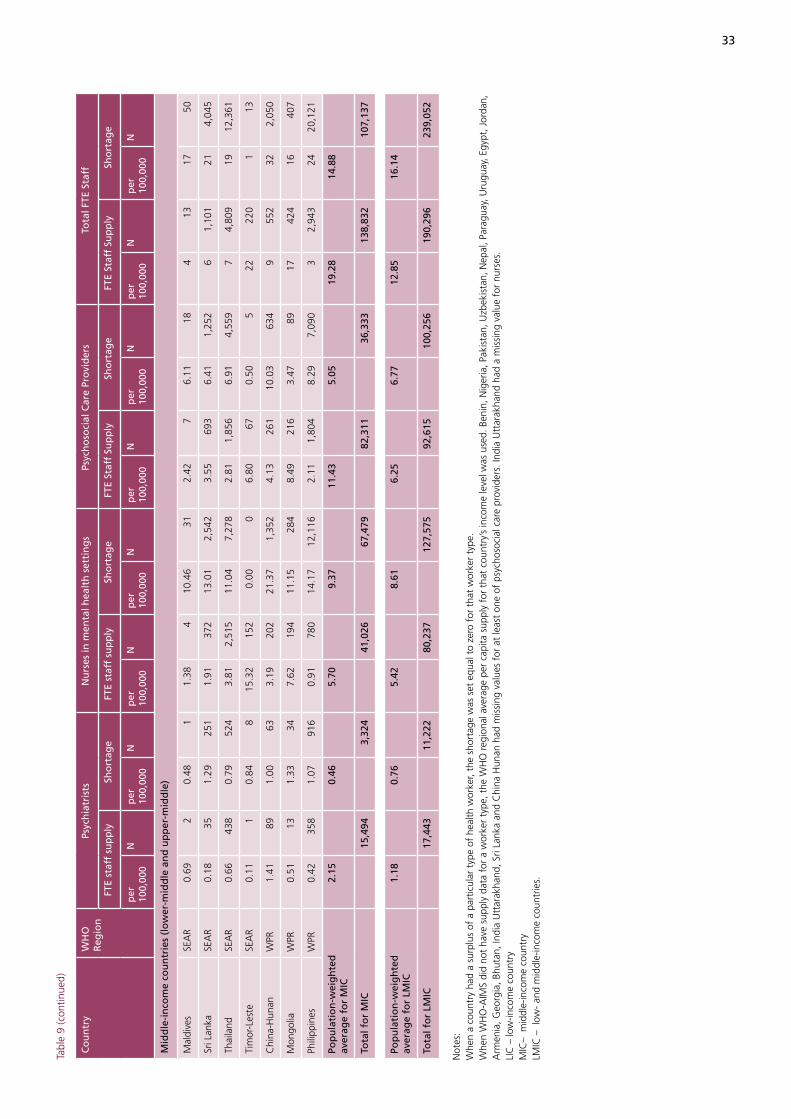
33
Tabl
e 9
(con
tinue
d)
Co
un
try
WH
O
Reg
ion
Psyc
hia
tris
tsN
urs
es in
men
tal h
ealt
h s
etti
ng
sPs
ych
oso
cial
Car
e Pr
ovi
der
sTo
tal F
TE S
taff
FTE
staf
f su
pp
lySh
ort
age
FTE
staf
f su
pp
lySh
ort
age
FTE
Staf
f Su
pp
lySh
ort
age
FTE
Staf
f Su
pp
lySh
ort
age
per
10
0,00
0N
per
10
0,00
0N
per
10
0,00
0N
per
10
0,00
0N
per
10
0,00
0N
per
10
0,00
0N
per
10
0,00
0N
per
10
0,00
0N
Mid
dle
-in
com
e co
un
trie
s (l
ow
er-m
idd
le a
nd
up
per
-mid
dle
)
Mal
dive
sSE
AR
0.69
20.
481
1.38
410
.46
312.
427
6.11
184
1317
50
Sri L
anka
SEA
R0.
1835
1.29
251
1.91
372
13.0
12,
542
3.55
693
6.41
1,25
26
1,10
121
4,04
5
Thai
land
SEA
R0.
6643
80.
7952
43.
812,
515
11.0
47,
278
2.81
1,85
66.
914,
559
74,
809
1912
,361
Tim
or-L
este
SEA
R0.
111
0.84
815
.32
152
0.00
06.
8067
0.50
522
220
113
Chi
na-H
unan
WPR
1.41
891.
0063
3.19
202
21.3
71,
352
4.13
261
10.0
363
49
552
322,
050
Mon
golia
WPR
0.51
131.
3334
7.62
194
11.1
528
48.
4921
63.
4789
1742
416
407
Phili
ppin
esW
PR0.
4235
81.
0791
60.
9178
014
.17
12,1
162.
111,
804
8.29
7,09
03
2,94
324
20,1
21
Pop
ula
tio
n-w
eig
hte
d
aver
age
for
MIC
2.15
0.
46
5.70
9.
37
11.4
3
5.05
19
.28
14
.88
Tota
l fo
r M
IC
15,4
94
3,32
4
41,0
26
67,4
79
82,3
11
36,3
33
138,
832
10
7,13
7
Pop
ula
tio
n-w
eig
hte
d
aver
age
for
LMIC
1.18
0.
76
5.42
8.
61
6.25
6.
77
12.8
5
16.1
4
Tota
l fo
r LM
IC
17,4
43
11,2
22
80,2
37
127,
575
92
,615
10
0,25
6
190,
296
23
9,05
2
Not
es:
Whe
n a
coun
try
had
a su
rplu
s of
a p
artic
ular
typ
e of
hea
lth w
orke
r, th
e sh
orta
ge w
as s
et e
qual
to
zero
for
tha
t w
orke
r ty
pe.
Whe
n W
HO
-AIM
S di
d no
t ha
ve s
uppl
y da
ta f
or a
wor
ker
type
, the
WH
O r
egio
nal a
vera
ge p
er c
apita
sup
ply
for
that
cou
ntry
’s in
com
e le
vel w
as u
sed.
Ben
in, N
iger
ia, P
akis
tan,
Uzb
ekis
tan,
Nep
al, P
arag
uay,
Uru
guay
, Egy
pt, J
orda
n,
Arm
enia
, Geo
rgia
, Bhu
tan,
Indi
a U
ttar
akha
nd, S
ri La
nka
and
Chi
na H
unan
had
mis
sing
val
ues
for
at le
ast
one
of p
sych
osoc
ial c
are
prov
ider
s. In
dia
Utt
arak
hand
had
a m
issi
ng v
alue
for
nur
ses.
LIC
– lo
w-in
com
e co
untr
yM
IC–
mid
dle-
inco
me
coun
try
LMIC
– l
ow-
and
mid
dle-
inco
me
coun
trie
s.
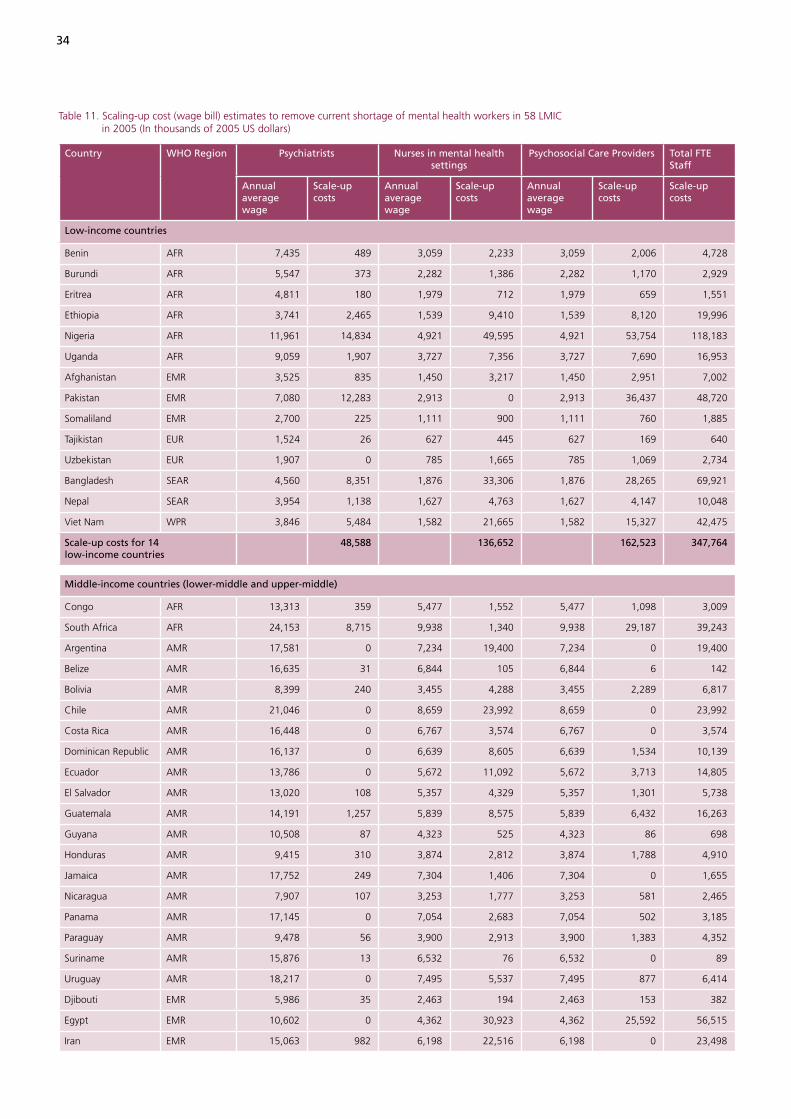
34
Table 11. Scaling-up cost (wage bill) estimates to remove current shortage of mental health workers in 58 LMIC in 2005 (In thousands of 2005 US dollars)
Country WHO Region Psychiatrists Nurses in mental health settings
Psychosocial Care Providers Total FTE Staff
Annual average wage
Scale-up costs
Annual average wage
Scale-up costs
Annual average wage
Scale-up costs
Scale-up costs
Low-income countries
Benin AFR 7,435 489 3,059 2,233 3,059 2,006 4,728
Burundi AFR 5,547 373 2,282 1,386 2,282 1,170 2,929
Eritrea AFR 4,811 180 1,979 712 1,979 659 1,551
Ethiopia AFR 3,741 2,465 1,539 9,410 1,539 8,120 19,996
Nigeria AFR 11,961 14,834 4,921 49,595 4,921 53,754 118,183
Uganda AFR 9,059 1,907 3,727 7,356 3,727 7,690 16,953
Afghanistan EMR 3,525 835 1,450 3,217 1,450 2,951 7,002
Pakistan EMR 7,080 12,283 2,913 0 2,913 36,437 48,720
Somaliland EMR 2,700 225 1,111 900 1,111 760 1,885
Tajikistan EUR 1,524 26 627 445 627 169 640
Uzbekistan EUR 1,907 0 785 1,665 785 1,069 2,734
Bangladesh SEAR 4,560 8,351 1,876 33,306 1,876 28,265 69,921
Nepal SEAR 3,954 1,138 1,627 4,763 1,627 4,147 10,048
Viet Nam WPR 3,846 5,484 1,582 21,665 1,582 15,327 42,475
Scale-up costs for 14 low-income countries
48,588 136,652 162,523 347,764
Middle-income countries (lower-middle and upper-middle)
Congo AFR 13,313 359 5,477 1,552 5,477 1,098 3,009
South Africa AFR 24,153 8,715 9,938 1,340 9,938 29,187 39,243
Argentina AMR 17,581 0 7,234 19,400 7,234 0 19,400
Belize AMR 16,635 31 6,844 105 6,844 6 142
Bolivia AMR 8,399 240 3,455 4,288 3,455 2,289 6,817
Chile AMR 21,046 0 8,659 23,992 8,659 0 23,992
Costa Rica AMR 16,448 0 6,767 3,574 6,767 0 3,574
Dominican Republic AMR 16,137 0 6,639 8,605 6,639 1,534 10,139
Ecuador AMR 13,786 0 5,672 11,092 5,672 3,713 14,805
El Salvador AMR 13,020 108 5,357 4,329 5,357 1,301 5,738
Guatemala AMR 14,191 1,257 5,839 8,575 5,839 6,432 16,263
Guyana AMR 10,508 87 4,323 525 4,323 86 698
Honduras AMR 9,415 310 3,874 2,812 3,874 1,788 4,910
Jamaica AMR 17,752 249 7,304 1,406 7,304 0 1,655
Nicaragua AMR 7,907 107 3,253 1,777 3,253 581 2,465
Panama AMR 17,145 0 7,054 2,683 7,054 502 3,185
Paraguay AMR 9,478 56 3,900 2,913 3,900 1,383 4,352
Suriname AMR 15,876 13 6,532 76 6,532 0 89
Uruguay AMR 18,217 0 7,495 5,537 7,495 877 6,414
Djibouti EMR 5,986 35 2,463 194 2,463 153 382
Egypt EMR 10,602 0 4,362 30,923 4,362 25,592 56,515
Iran EMR 15,063 982 6,198 22,516 6,198 0 23,498
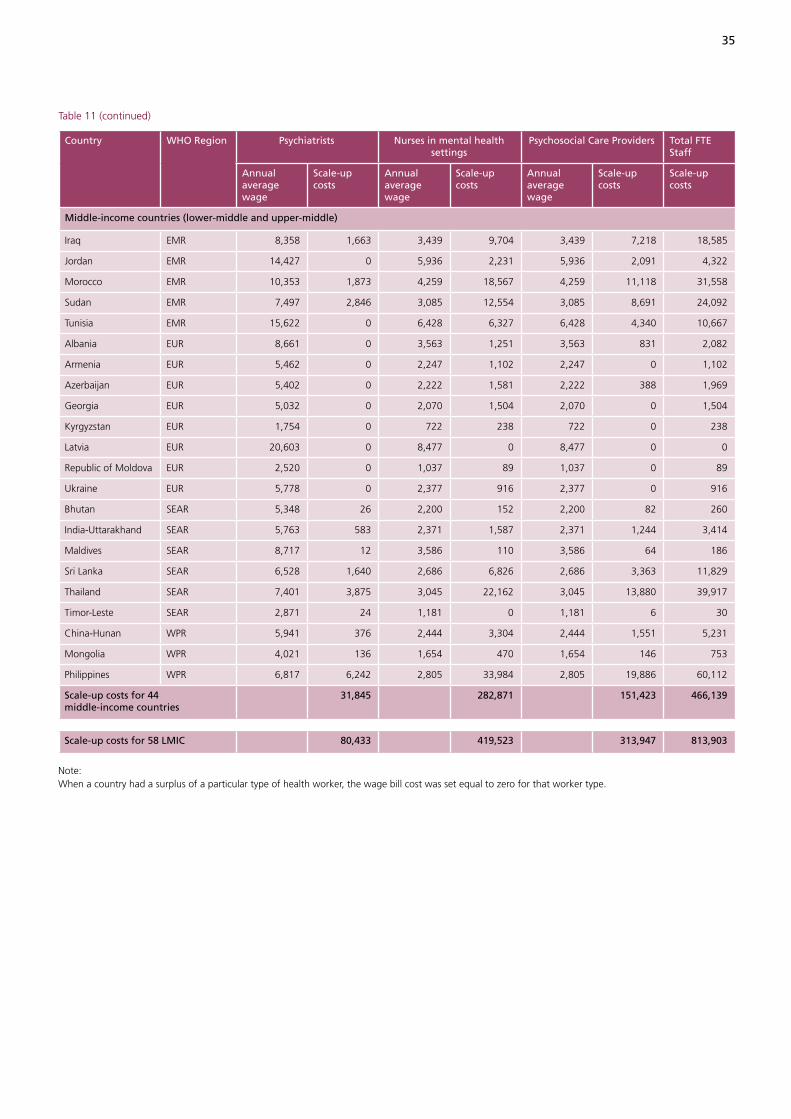
35
Table 11 (continued)
Country WHO Region Psychiatrists Nurses in mental health settings
Psychosocial Care Providers Total FTE Staff
Annual average wage
Scale-up costs
Annual average wage
Scale-up costs
Annual average wage
Scale-up costs
Scale-up costs
Middle-income countries (lower-middle and upper-middle)
Iraq EMR 8,358 1,663 3,439 9,704 3,439 7,218 18,585
Jordan EMR 14,427 0 5,936 2,231 5,936 2,091 4,322
Morocco EMR 10,353 1,873 4,259 18,567 4,259 11,118 31,558
Sudan EMR 7,497 2,846 3,085 12,554 3,085 8,691 24,092
Tunisia EMR 15,622 0 6,428 6,327 6,428 4,340 10,667
Albania EUR 8,661 0 3,563 1,251 3,563 831 2,082
Armenia EUR 5,462 0 2,247 1,102 2,247 0 1,102
Azerbaijan EUR 5,402 0 2,222 1,581 2,222 388 1,969
Georgia EUR 5,032 0 2,070 1,504 2,070 0 1,504
Kyrgyzstan EUR 1,754 0 722 238 722 0 238
Latvia EUR 20,603 0 8,477 0 8,477 0 0
Republic of Moldova EUR 2,520 0 1,037 89 1,037 0 89
Ukraine EUR 5,778 0 2,377 916 2,377 0 916
Bhutan SEAR 5,348 26 2,200 152 2,200 82 260
India-Uttarakhand SEAR 5,763 583 2,371 1,587 2,371 1,244 3,414
Maldives SEAR 8,717 12 3,586 110 3,586 64 186
Sri Lanka SEAR 6,528 1,640 2,686 6,826 2,686 3,363 11,829
Thailand SEAR 7,401 3,875 3,045 22,162 3,045 13,880 39,917
Timor-Leste SEAR 2,871 24 1,181 0 1,181 6 30
China-Hunan WPR 5,941 376 2,444 3,304 2,444 1,551 5,231
Mongolia WPR 4,021 136 1,654 470 1,654 146 753
Philippines WPR 6,817 6,242 2,805 33,984 2,805 19,886 60,112
Scale-up costs for 44 middle-income countries
31,845 282,871 151,423 466,139
Scale-up costs for 58 LMIC 80,433 419,523 313,947 813,903
Note: When a country had a surplus of a particular type of health worker, the wage bill cost was set equal to zero for that worker type.
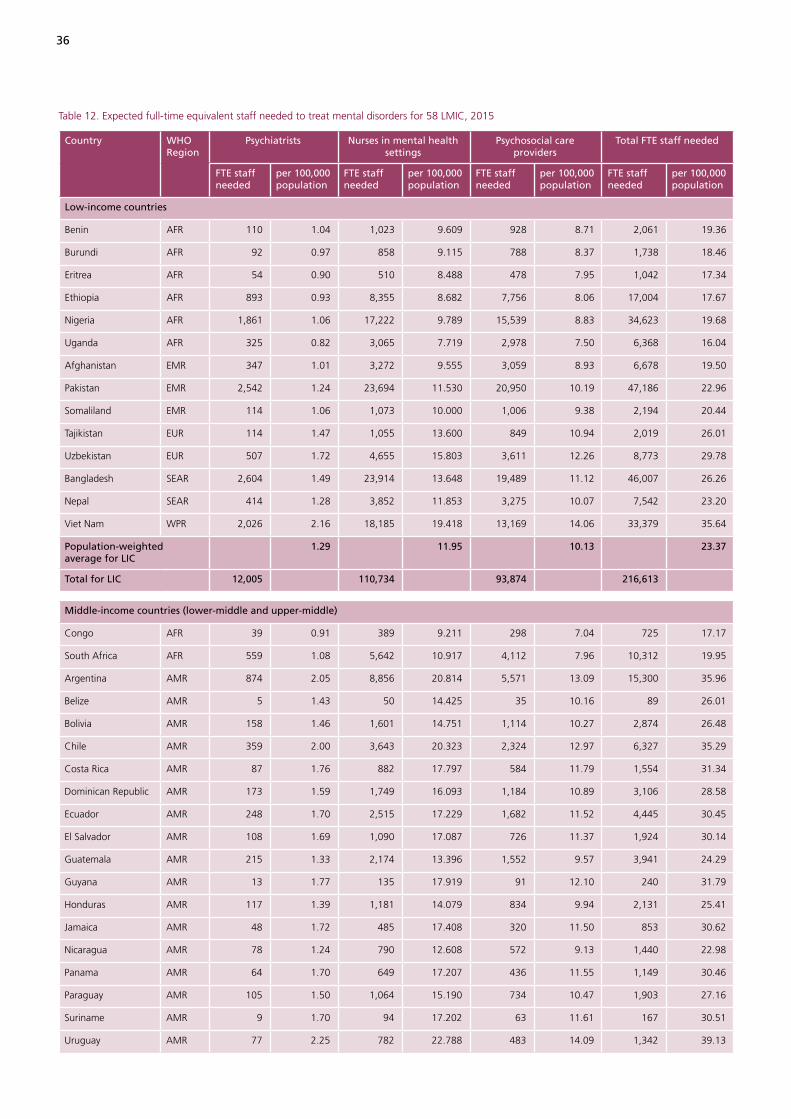
36
Table 12. Expected full-time equivalent staff needed to treat mental disorders for 58 LMIC, 2015
Country WHO Region
Psychiatrists Nurses in mental health settings
Psychosocial care providers
Total FTE staff needed
FTE staff needed
per 100,000 population
FTE staff needed
per 100,000 population
FTE staff needed
per 100,000 population
FTE staff needed
per 100,000 population
Low-income countries
Benin AFR 110 1.04 1,023 9.609 928 8.71 2,061 19.36
Burundi AFR 92 0.97 858 9.115 788 8.37 1,738 18.46
Eritrea AFR 54 0.90 510 8.488 478 7.95 1,042 17.34
Ethiopia AFR 893 0.93 8,355 8.682 7,756 8.06 17,004 17.67
Nigeria AFR 1,861 1.06 17,222 9.789 15,539 8.83 34,623 19.68
Uganda AFR 325 0.82 3,065 7.719 2,978 7.50 6,368 16.04
Afghanistan EMR 347 1.01 3,272 9.555 3,059 8.93 6,678 19.50
Pakistan EMR 2,542 1.24 23,694 11.530 20,950 10.19 47,186 22.96
Somaliland EMR 114 1.06 1,073 10.000 1,006 9.38 2,194 20.44
Tajikistan EUR 114 1.47 1,055 13.600 849 10.94 2,019 26.01
Uzbekistan EUR 507 1.72 4,655 15.803 3,611 12.26 8,773 29.78
Bangladesh SEAR 2,604 1.49 23,914 13.648 19,489 11.12 46,007 26.26
Nepal SEAR 414 1.28 3,852 11.853 3,275 10.07 7,542 23.20
Viet Nam WPR 2,026 2.16 18,185 19.418 13,169 14.06 33,379 35.64
Population-weighted average for LIC
1.29 11.95 10.13 23.37
Total for LIC 12,005 110,734 93,874 216,613
Middle-income countries (lower-middle and upper-middle)
Congo AFR 39 0.91 389 9.211 298 7.04 725 17.17
South Africa AFR 559 1.08 5,642 10.917 4,112 7.96 10,312 19.95
Argentina AMR 874 2.05 8,856 20.814 5,571 13.09 15,300 35.96
Belize AMR 5 1.43 50 14.425 35 10.16 89 26.01
Bolivia AMR 158 1.46 1,601 14.751 1,114 10.27 2,874 26.48
Chile AMR 359 2.00 3,643 20.323 2,324 12.97 6,327 35.29
Costa Rica AMR 87 1.76 882 17.797 584 11.79 1,554 31.34
Dominican Republic AMR 173 1.59 1,749 16.093 1,184 10.89 3,106 28.58
Ecuador AMR 248 1.70 2,515 17.229 1,682 11.52 4,445 30.45
El Salvador AMR 108 1.69 1,090 17.087 726 11.37 1,924 30.14
Guatemala AMR 215 1.33 2,174 13.396 1,552 9.57 3,941 24.29
Guyana AMR 13 1.77 135 17.919 91 12.10 240 31.79
Honduras AMR 117 1.39 1,181 14.079 834 9.94 2,131 25.41
Jamaica AMR 48 1.72 485 17.408 320 11.50 853 30.62
Nicaragua AMR 78 1.24 790 12.608 572 9.13 1,440 22.98
Panama AMR 64 1.70 649 17.207 436 11.55 1,149 30.46
Paraguay AMR 105 1.50 1,064 15.190 734 10.47 1,903 27.16
Suriname AMR 9 1.70 94 17.202 63 11.61 167 30.51
Uruguay AMR 77 2.25 782 22.788 483 14.09 1,342 39.13
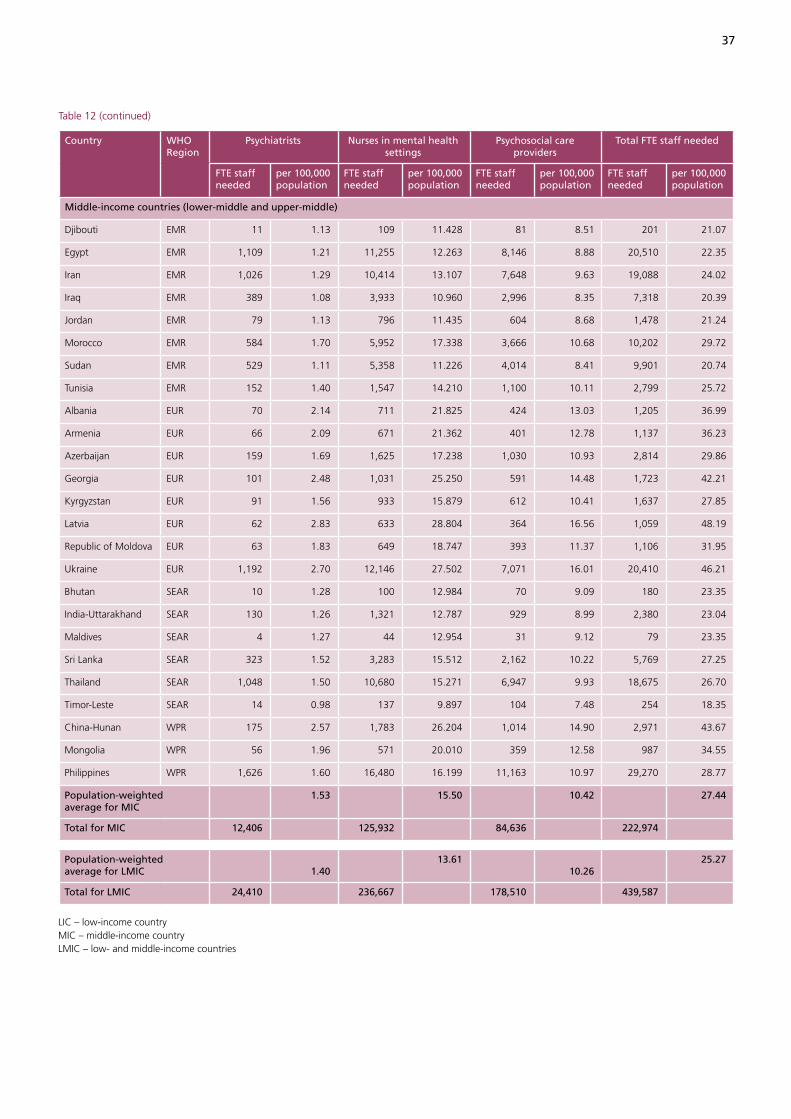
37
Table 12 (continued)
Country WHO Region
Psychiatrists Nurses in mental health settings
Psychosocial care providers
Total FTE staff needed
FTE staff needed
per 100,000 population
FTE staff needed
per 100,000 population
FTE staff needed
per 100,000 population
FTE staff needed
per 100,000 population
Middle-income countries (lower-middle and upper-middle)
Djibouti EMR 11 1.13 109 11.428 81 8.51 201 21.07
Egypt EMR 1,109 1.21 11,255 12.263 8,146 8.88 20,510 22.35
Iran EMR 1,026 1.29 10,414 13.107 7,648 9.63 19,088 24.02
Iraq EMR 389 1.08 3,933 10.960 2,996 8.35 7,318 20.39
Jordan EMR 79 1.13 796 11.435 604 8.68 1,478 21.24
Morocco EMR 584 1.70 5,952 17.338 3,666 10.68 10,202 29.72
Sudan EMR 529 1.11 5,358 11.226 4,014 8.41 9,901 20.74
Tunisia EMR 152 1.40 1,547 14.210 1,100 10.11 2,799 25.72
Albania EUR 70 2.14 711 21.825 424 13.03 1,205 36.99
Armenia EUR 66 2.09 671 21.362 401 12.78 1,137 36.23
Azerbaijan EUR 159 1.69 1,625 17.238 1,030 10.93 2,814 29.86
Georgia EUR 101 2.48 1,031 25.250 591 14.48 1,723 42.21
Kyrgyzstan EUR 91 1.56 933 15.879 612 10.41 1,637 27.85
Latvia EUR 62 2.83 633 28.804 364 16.56 1,059 48.19
Republic of Moldova EUR 63 1.83 649 18.747 393 11.37 1,106 31.95
Ukraine EUR 1,192 2.70 12,146 27.502 7,071 16.01 20,410 46.21
Bhutan SEAR 10 1.28 100 12.984 70 9.09 180 23.35
India-Uttarakhand SEAR 130 1.26 1,321 12.787 929 8.99 2,380 23.04
Maldives SEAR 4 1.27 44 12.954 31 9.12 79 23.35
Sri Lanka SEAR 323 1.52 3,283 15.512 2,162 10.22 5,769 27.25
Thailand SEAR 1,048 1.50 10,680 15.271 6,947 9.93 18,675 26.70
Timor-Leste SEAR 14 0.98 137 9.897 104 7.48 254 18.35
China-Hunan WPR 175 2.57 1,783 26.204 1,014 14.90 2,971 43.67
Mongolia WPR 56 1.96 571 20.010 359 12.58 987 34.55
Philippines WPR 1,626 1.60 16,480 16.199 11,163 10.97 29,270 28.77
Population-weighted average for MIC
1.53 15.50 10.42 27.44
Total for MIC 12,406 125,932 84,636 222,974
Population-weighted average for LMIC
1.40
13.61 10.26
25.27
Total for LMIC 24,410 236,667 178,510 439,587
LIC – low-income countryMIC – middle-income countryLMIC – low- and middle-income countries
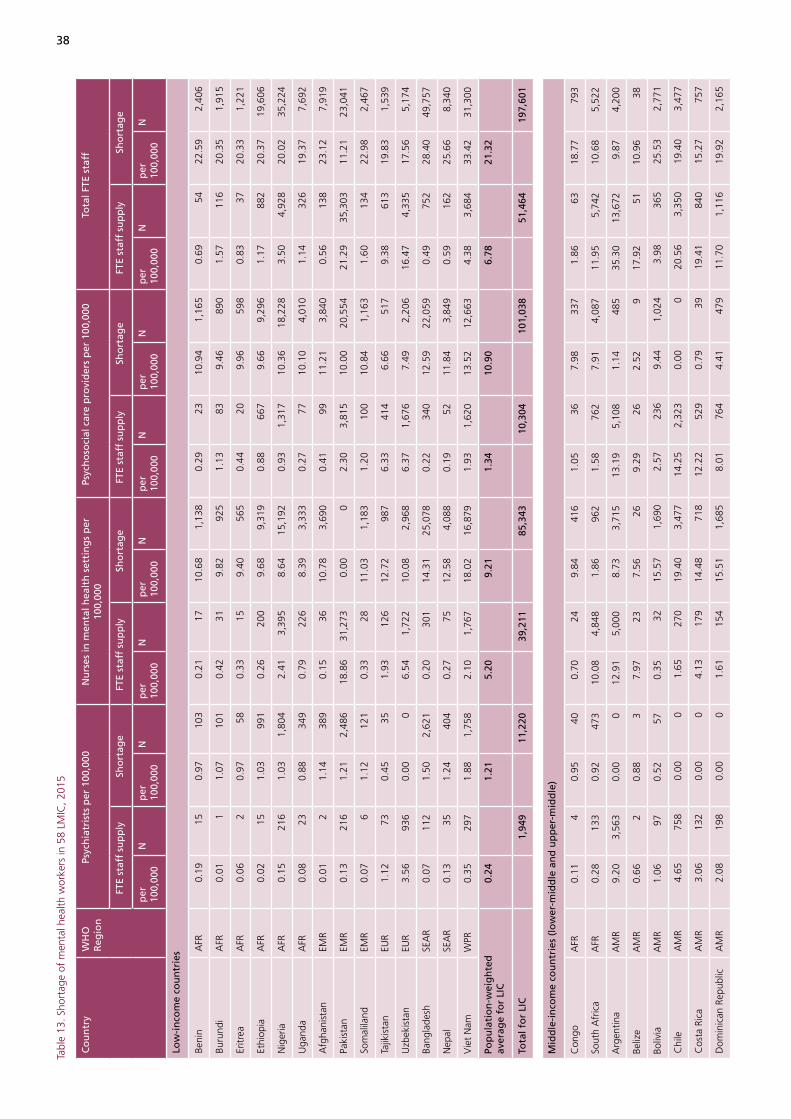
38
Tabl
e 13
. Sho
rtag
e of
men
tal h
ealth
wor
kers
in 5
8 LM
IC, 2
015
Co
un
try
WH
O
Reg
ion
Psyc
hia
tris
ts p
er 1
00,0
00N
urs
es in
men
tal h
ealt
h s
etti
ng
s p
er
100,
000
Psyc
ho
soci
al c
are
pro
vid
ers
per
100
,000
Tota
l FTE
sta
ff
FTE
staf
f su
pp
lySh
ort
age
FTE
staf
f su
pp
lySh
ort
age
FTE
staf
f su
pp
lySh
ort
age
FTE
staf
f su
pp
lySh
ort
age
per
10
0,00
0N
per
10
0,00
0N
per
10
0,00
0N
per
10
0,00
0N
per
10
0,00
0N
per
10
0,00
0N
per
10
0,00
0N
per
10
0,00
0N
Low
-in
com
e co
un
trie
s
Beni
nA
FR0.
1915
0.97
103
0.21
1710
.68
1,13
80.
2923
10.9
41,
165
0.69
5422
.59
2,40
6
Buru
ndi
AFR
0.01
11.
0710
10.
4231
9.82
925
1.13
839.
4689
01.
5711
620
.35
1,91
5
Eritr
eaA
FR0.
062
0.97
580.
3315
9.40
565
0.44
209.
9659
80.
8337
20.3
31,
221
Ethi
opia
AFR
0.02
151.
0399
10.
2620
09.
689,
319
0.88
667
9.66
9,29
61.
1788
220
.37
19,6
06
Nig
eria
AFR
0.15
216
1.03
1,80
42.
413,
395
8.64
15,1
920.
931,
317
10.3
618
,228
3.50
4,92
820
.02
35,2
24
Uga
nda
AFR
0.08
230.
8834
90.
7922
68.
393,
333
0.27
7710
.10
4,01
01.
1432
619
.37
7,69
2
Afg
hani
stan
EMR
0.01
21.
1438
90.
1536
10.7
83,
690
0.41
9911
.21
3,84
00.
5613
823
.12
7,91
9
Paki
stan
EMR
0.13
216
1.21
2,48
618
.86
31,2
730.
000
2.30
3,81
510
.00
20,5
5421
.29
35,3
0311
.21
23,0
41
Som
alila
ndEM
R0.
076
1.12
121
0.33
2811
.03
1,18
31.
2010
010
.84
1,16
31.
6013
422
.98
2,46
7
Tajik
ista
nEU
R1.
1273
0.45
351.
9312
612
.72
987
6.33
414
6.66
517
9.38
613
19.8
31,
539
Uzb
ekis
tan
EUR
3.56
936
0.00
06.
541,
722
10.0
82,
968
6.37
1,67
67.
492,
206
16.4
74,
335
17.5
65,
174
Bang
lade
shSE
AR
0.07
112
1.50
2,62
10.
2030
114
.31
25,0
780.
2234
012
.59
22,0
590.
4975
228
.40
49,7
57
Nep
alSE
AR
0.13
351.
2440
40.
2775
12.5
84,
088
0.19
5211
.84
3,84
90.
5916
225
.66
8,34
0
Vie
t N
amW
PR0.
3529
71.
881,
758
2.10
1,76
718
.02
16,8
791.
931,
620
13.5
212
,663
4.38
3,68
433
.42
31,3
00
Pop
ula
tio
n-w
eig
hte
d
aver
age
for
LIC
0.24
1.
21
5.20
9.
21
1.34
10
.90
6.
78
21.3
2
Tota
l fo
r LI
C1,
949
11,2
2039
,211
85,3
4310
,304
101,
038
51,4
6419
7,60
1
Mid
dle
-in
com
e co
un
trie
s (l
ow
er-m
idd
le a
nd
up
per
-mid
dle
)
Con
goA
FR0.
114
0.95
400.
7024
9.84
416
1.05
367.
9833
71.
8663
18.7
779
3
Sout
h A
fric
aA
FR0.
2813
30.
9247
310
.08
4,84
81.
8696
21.
5876
27.
914,
087
11.9
55,
742
10.6
85,
522
Arg
entin
aA
MR
9.20
3,56
30.
000
12.9
15,
000
8.73
3,71
513
.19
5,10
81.
1448
535
.30
13,6
729.
874,
200
Beliz
eA
MR
0.66
20.
883
7.97
237.
5626
9.29
262.
529
17.9
251
10.9
638
Boliv
iaA
MR
1.06
970.
5257
0.35
3215
.57
1,69
02.
5723
69.
441,
024
3.98
365
25.5
32,
771
Chi
leA
MR
4.65
758
0.00
01.
6527
019
.40
3,47
714
.25
2,32
30.
000
20.5
63,
350
19.4
03,
477
Cos
ta R
ica
AM
R3.
0613
20.
000
4.13
179
14.4
871
812
.22
529
0.79
3919
.41
840
15.2
775
7
Dom
inic
an R
epub
licA
MR
2.08
198
0.00
01.
6115
415
.51
1,68
58.
0176
44.
4147
911
.70
1,11
619
.92
2,16
5

39
Tabl
e 13
(con
tinue
d)
Co
un
try
WH
O
Reg
ion
Psyc
hia
tris
ts p
er 1
00,0
00N
urs
es in
men
tal h
ealt
h s
etti
ng
s p
er
100,
000
Psyc
ho
soci
al c
are
pro
vid
ers
per
100
,000
Tota
l FTE
sta
ff
FTE
staf
f su
pp
lySh
ort
age
FTE
staf
f su
pp
lySh
ort
age
FTE
staf
f su
pp
lySh
ort
age
FTE
staf
f su
pp
lySh
ort
age
per
10
0,00
0N
per
10
0,00
0N
per
10
0,00
0N
per
10
0,00
0N
per
10
0,00
0N
per
10
0,00
0N
per
10
0,00
0N
per
10
0,00
0N
Mid
dle
-in
com
e co
un
trie
s (l
ow
er-m
idd
le a
nd
up
per
-mid
dle
)
Ecua
dor
AM
R2.
5132
80.
000
0.93
122
17.2
82,
522
5.84
763
7.15
1,04
39.
281,
212
24.4
23,
565
El S
alva
dor
AM
R1.
3984
0.40
02.
1212
815
.96
1,01
86.
5139
56.
3340
410
.02
607
22.6
91,
422
Gua
tem
ala
AM
R0.
5773
0.90
146
1.28
162
13.4
92,
189
0.57
7311
.04
1,79
12.
4330
825
.43
4,12
7
Guy
ana
AM
R0.
534
1.34
100.
403
18.4
113
98.
6666
4.78
369.
5973
24.5
318
5
Hon
dura
sA
MR
0.82
570.
7059
2.58
178
12.6
81,
064
2.70
186
9.00
755
6.10
421
22.3
91,
878
Jam
aica
AM
R1.
1330
0.69
199.
5525
58.
7924
516
.09
429
0.00
026
.77
714
9.48
264
Nic
arag
uaA
MR
0.91
490.
4529
1.71
9312
.01
753
5.37
293
5.42
340
7.98
435
17.8
91,
121
Pana
ma
AM
R3.
4711
20.
000
4.38
141
13.7
752
08.
8328
54.
1415
616
.68
538
17.9
167
6
Para
guay
AM
R1.
3177
0.31
221.
5893
14.7
11,
031
3.96
234
8.15
571
6.84
404
23.1
71,
623
Surin
ame
AM
R1.
457
0.35
213
.96
694.
1623
34.3
817
10.
000
49.7
924
74.
5125
Uru
guay
AM
R19
.36
644
0.00
00.
6923
22.8
478
310
.57
352
4.63
159
30.6
21,
019
27.4
794
2
Djib
outi
EMR
0.33
30.
929
0.83
711
.76
112
0.33
39.
9294
1.49
1222
.61
215
Egyp
tEM
R1.
441,
113
0.00
02.
602,
010
10.7
49,
856
1.03
796
9.46
8,67
95.
083,
919
20.1
918
,535
Iran
EMR
1.19
839
0.20
07.
825,
536
6.13
4,86
752
.17
36,9
220.
000
61.1
843
,296
6.32
4,86
7
Iraq
EMR
0.34
950.
8931
80.
5415
211
.73
4,20
80.
6518
49.
643,
461
1.53
431
22.2
67,
987
Jord
anEM
R1.
1463
0.11
03.
9522
08.
6159
91.
9410
88.
4258
67.
0339
117
.14
1,18
5
Mor
occo
EMR
1.02
312
0.78
267
2.17
661
16.1
05,
528
1.71
520
10.3
63,
558
4.90
1,49
327
.24
9,35
3
Suda
nEM
R0.
0623
1.18
565
0.01
512
.47
5,95
40.
7529
09.
544,
553
0.82
318
23.2
011
,073
Tuni
sia
EMR
1.53
151
0.00
03.
7136
711
.26
1,22
62.
9729
38.
2890
18.
2181
119
.54
2,12
7
Alb
ania
EUR
3.20
100
0.00
07.
0021
815
.55
506
3.93
122
10.1
833
114
.13
440
25.7
283
8
Arm
enia
EUR
5.88
180
0.00
05.
4216
616
.68
523
22.9
170
20.
000
34.2
11,
049
16.6
852
3
Aze
rbai
jan
EUR
5.18
437
0.00
08.
3670
69.
7291
68.
6372
93.
5533
422
.17
1,87
213
.26
1,25
0
Geo
rgia
EUR
5.90
263
0.00
07.
7134
418
.14
741
22.8
81,
022
0.00
036
.49
1,62
918
.14
741
Kyr
gyzs
tan
EUR
3.41
178
0.00
09.
2448
37.
6244
813
.57
709
0.00
026
.22
1,37
07.
6244
8
Latv
iaEU
R8.
3119
10.
000
35.7
281
90.
000
28.5
265
40.
000
72.5
61,
663
0.00
0
Repu
blic
of
Mol
dova
EUR
4.78
180
0.00
015
.35
577
3.99
138
29.5
11,
109
0.00
049
.65
1,86
53.
9913
8
Ukr
aine
EUR
8.66
4,06
60.
000
26.2
012
,299
1.82
802
42.4
719
,935
0.00
077
.34
36,3
001.
8280
2
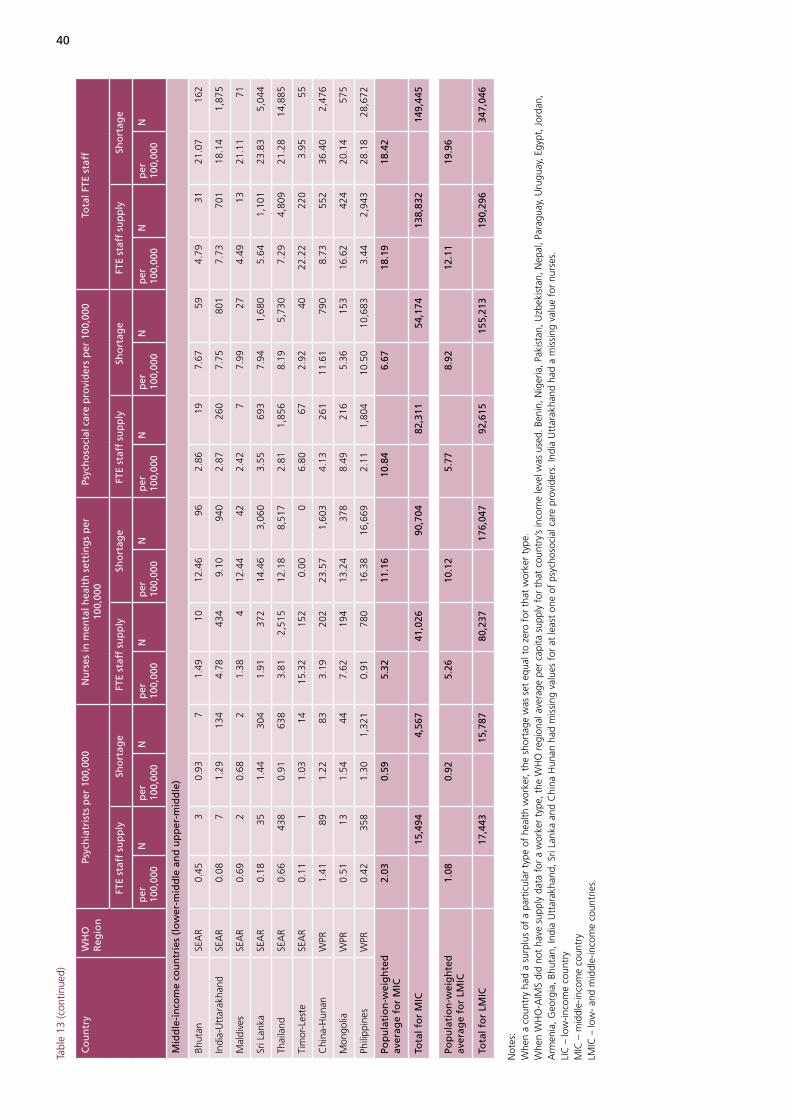
40
Tabl
e 13
(con
tinue
d)
Co
un
try
WH
O
Reg
ion
Psyc
hia
tris
ts p
er 1
00,0
00N
urs
es in
men
tal h
ealt
h s
etti
ng
s p
er
100,
000
Psyc
ho
soci
al c
are
pro
vid
ers
per
100
,000
Tota
l FTE
sta
ff
FTE
staf
f su
pp
lySh
ort
age
FTE
staf
f su
pp
lySh
ort
age
FTE
staf
f su
pp
lySh
ort
age
FTE
staf
f su
pp
lySh
ort
age
per
10
0,00
0N
per
10
0,00
0N
per
10
0,00
0N
per
10
0,00
0N
per
10
0,00
0N
per
10
0,00
0N
per
10
0,00
0N
per
10
0,00
0N
Mid
dle
-in
com
e co
un
trie
s (l
ow
er-m
idd
le a
nd
up
per
-mid
dle
)
Bhut
anSE
AR
0.45
30.
937
1.49
1012
.46
962.
8619
7.67
594.
7931
21.0
716
2
Indi
a-U
ttar
akha
ndSE
AR
0.08
71.
2913
44.
7843
49.
1094
02.
8726
07.
7580
17.
7370
118
.14
1,87
5
Mal
dive
sSE
AR
0.69
20.
682
1.38
412
.44
422.
427
7.99
274.
4913
21.1
171
Sri L
anka
SEA
R0.
1835
1.44
304
1.91
372
14.4
63,
060
3.55
693
7.94
1,68
05.
641,
101
23.8
35,
044
Thai
land
SEA
R0.
6643
80.
9163
83.
812,
515
12.1
88,
517
2.81
1,85
68.
195,
730
7.29
4,80
921
.28
14,8
85
Tim
or-L
este
SEA
R0.
111
1.03
1415
.32
152
0.00
06.
8067
2.92
4022
.22
220
3.95
55
Chi
na-H
unan
WPR
1.41
891.
2283
3.19
202
23.5
71,
603
4.13
261
11.6
179
08.
7355
236
.40
2,47
6
Mon
golia
WPR
0.51
131.
5444
7.62
194
13.2
437
88.
4921
65.
3615
316
.62
424
20.1
457
5
Phili
ppin
esW
PR0.
4235
81.
301,
321
0.91
780
16.3
816
,669
2.11
1,80
410
.50
10,6
833.
442,
943
28.1
828
,672
Pop
ula
tio
n-w
eig
hte
d
aver
age
for
MIC
2.03
0.
59
5.32
11
.16
10
.84
6.
67
18.1
9
18.4
2
Tota
l fo
r M
IC15
,494
4,56
741
,026
90,7
0482
,311
54,1
7413
8,83
214
9,44
5
Pop
ula
tio
n-w
eig
hte
d
aver
age
for
LMIC
1.08
0.
92
5.26
10
.12
5.
77
8.92
12
.11
19
.96
Tota
l fo
r LM
IC
17,4
43
15,7
87
80,2
37
176,
047
92
,615
15
5,21
3
190,
296
34
7,04
6
Not
es:
Whe
n a
coun
try
had
a su
rplu
s of
a p
artic
ular
typ
e of
hea
lth w
orke
r, th
e sh
orta
ge w
as s
et e
qual
to
zero
for
tha
t w
orke
r ty
pe.
Whe
n W
HO
-AIM
S di
d no
t ha
ve s
uppl
y da
ta f
or a
wor
ker
type
, the
WH
O r
egio
nal a
vera
ge p
er c
apita
sup
ply
for
that
cou
ntry
’s in
com
e le
vel w
as u
sed.
Ben
in, N
iger
ia, P
akis
tan,
Uzb
ekis
tan,
Nep
al, P
arag
uay,
Uru
guay
, Egy
pt, J
orda
n,
Arm
enia
, Geo
rgia
, Bhu
tan,
Indi
a U
ttar
akha
nd, S
ri La
nka
and
Chi
na H
unan
had
mis
sing
val
ues
for
at le
ast
one
of p
sych
osoc
ial c
are
prov
ider
s. In
dia
Utt
arak
hand
had
a m
issi
ng v
alue
for
nur
ses.
LIC
– lo
w-in
com
e co
untr
yM
IC –
mid
dle-
inco
me
coun
try
LMIC
– lo
w-
and
mid
dle-
inco
me
coun
trie
s.

41
Table 14. Scaling-up cost (wage bill) estimates to remove shortage of mental health workers in 58 LMIC in 2015 (in thousands of 2005 US dollars)
Country WHO Region Psychiatrists Nurses in mental health settings
Psychosocial care providers Total FTE staff
Low-income countries
Benin AFR 769 3,480 3,564 7,812
Burundi AFR 558 2,110 2,031 4,700
Eritrea AFR 280 1,118 1,184 2,582
Ethiopia AFR 3,708 14,345 14,310 32,363
Nigeria AFR 21,577 74,759 89,703 186,040
Uganda AFR 3,159 12,422 14,948 30,529
Afghanistan EMR 1,373 5,352 5,569 12,295
Pakistan EMR 17,605 0 59,878 77,483
Somaliland EMR 325 1,314 1,292 2,931
Tajikistan EUR 53 619 324 996
Uzbekistan EUR 0 2,328 1,731 4,059
Bangladesh SEAR 11,950 47,046 41,383 100,379
Nepal SEAR 1,596 6,650 6,261 14,507
Viet Nam WPR 6,762 26,707 20,036 53,505
Total for 14 LIC 69,715 198,252 262,214 530,180
Middle-income countries (lower-middle and upper-middle)
Congo AFR 536 2,277 1,846 4,659
South Africa AFR 11,431 9,565 40,610 61,606
Argentina AMR 0 26,873 3,507 30,380
Belize AMR 51 178 59 288
Bolivia AMR 478 5,839 3,539 9,855
Chile AMR 0 30,105 0 30,105
Costa Rica AMR 0 4,858 263 5,121
Dominican Republic AMR 0 11,189 3,183 14,373
Ecuador AMR 0 14,304 5,916 20,220
El Salvador AMR 0 5,455 2,164 $7,619
Guatemala AMR 2,071 12,784 10,459 25,314
Guyana AMR 106 600 156 862
Honduras AMR 553 4,121 2,925 7,599
Jamaica AMR 341 1,789 0 1,789
Nicaragua AMR 225 2,449 1,105 3,780
Panama AMR 0 3,666 1,101 4,767
Paraguay AMR 207 4,019 2,226 6,452
Suriname AMR 30 149 0 149
Uruguay AMR 0 5,871 1,191 7,062
Djibouti EMR 53 276 233 561
Egypt EMR 0 42,994 37,858 80,852
Iran EMR 0 30,165 0 30,165
Iraq EMR 2,659 14,471 11,901 29,031
Jordan EMR 0 3,556 3,476 7,032
Morocco EMR 2,768 23,546 15,154 41,468

42
Table 14 (continued)
Country WHO Region Psychiatrists Nurses in mental health settings
Psychosocial care providers Total FTE staff
Middle-income countries (lower-middle and upper-middle)
Sudan EMR 4,238 18,367 14,045 36,650
Tunisia EMR 0 7,880 5,791 13,671
Albania EUR 0 1,804 1,181 2,985
Armenia EUR 0 1,176 0 1,176
Azerbaijan EUR 0 2,036 743 2,779
Georgia EUR 0 1,533 0 1,533
Kyrgyzstan EUR 0 323 0 323
Latvia EUR 0 0 0 0
Republic of Moldova EUR 0 143 0 143
Ukraine EUR 0 1,907 0 1,907
Bhutan SEAR 38 211 130 379
India-Uttarakhand SEAR 771 2,229 1,899 4,899
Maldives SEAR 20 150 97 267
Sri Lanka SEAR 1,985 8,219 4,512 14,716
Thailand SEAR 4,722 25,932 17,447 48,101
Timor-Leste SEAR 41 0 48 89
China-Hunan WPR 494 3,919 1,930 6,343
Mongolia WPR 177 625 253 1,055
Philippines WPR 9,004 46,754 29,964 85,721
Total for 44 MIC 42,997 384,307 226,912 653,846
Total for 58 LMIC 112,713 582,559 489,126 1,184,026
Notes: When a country had a surplus of a particular type of health worker, the wage bill cost was set equal to zero for that worker type. LIC – low-income countryMIC – middle-income countryLMIC – low- and middle-income countries.
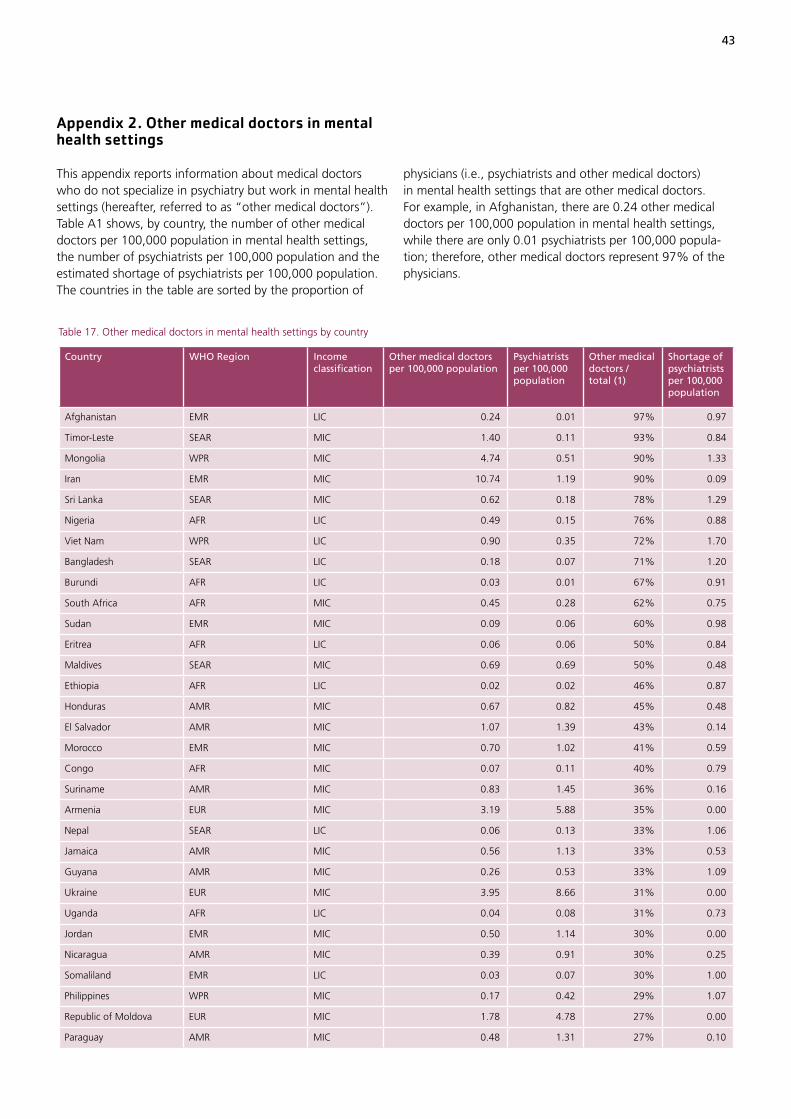
43
physicians (i.e., psychiatrists and other medical doctors) in mental health settings that are other medical doctors. For example, in Afghanistan, there are 0.24 other medical doctors per 100,000 population in mental health settings, while there are only 0.01 psychiatrists per 100,000 popula-tion; therefore, other medical doctors represent 97% of the physicians.
Appendix 2. Other medical doctors in mental health settings
This appendix reports information about medical doctors who do not specialize in psychiatry but work in mental health settings (hereafter, referred to as “other medical doctors”). Table A1 shows, by country, the number of other medical doctors per 100,000 population in mental health settings, the number of psychiatrists per 100,000 population and the estimated shortage of psychiatrists per 100,000 population. The countries in the table are sorted by the proportion of
Table 17. Other medical doctors in mental health settings by country
Country WHO Region Income classification
Other medical doctors per 100,000 population
Psychiatrists per 100,000 population
Other medical doctors / total (1)
Shortage of psychiatrists per 100,000 population
Afghanistan EMR LIC 0.24 0.01 97% 0.97
Timor-Leste SEAR MIC 1.40 0.11 93% 0.84
Mongolia WPR MIC 4.74 0.51 90% 1.33
Iran EMR MIC 10.74 1.19 90% 0.09
Sri Lanka SEAR MIC 0.62 0.18 78% 1.29
Nigeria AFR LIC 0.49 0.15 76% 0.88
Viet Nam WPR LIC 0.90 0.35 72% 1.70
Bangladesh SEAR LIC 0.18 0.07 71% 1.20
Burundi AFR LIC 0.03 0.01 67% 0.91
South Africa AFR MIC 0.45 0.28 62% 0.75
Sudan EMR MIC 0.09 0.06 60% 0.98
Eritrea AFR LIC 0.06 0.06 50% 0.84
Maldives SEAR MIC 0.69 0.69 50% 0.48
Ethiopia AFR LIC 0.02 0.02 46% 0.87
Honduras AMR MIC 0.67 0.82 45% 0.48
El Salvador AMR MIC 1.07 1.39 43% 0.14
Morocco EMR MIC 0.70 1.02 41% 0.59
Congo AFR MIC 0.07 0.11 40% 0.79
Suriname AMR MIC 0.83 1.45 36% 0.16
Armenia EUR MIC 3.19 5.88 35% 0.00
Nepal SEAR LIC 0.06 0.13 33% 1.06
Jamaica AMR MIC 0.56 1.13 33% 0.53
Guyana AMR MIC 0.26 0.53 33% 1.09
Ukraine EUR MIC 3.95 8.66 31% 0.00
Uganda AFR LIC 0.04 0.08 31% 0.73
Jordan EMR MIC 0.50 1.14 30% 0.00
Nicaragua AMR MIC 0.39 0.91 30% 0.25
Somaliland EMR LIC 0.03 0.07 30% 1.00
Philippines WPR MIC 0.17 0.42 29% 1.07
Republic of Moldova EUR MIC 1.78 4.78 27% 0.00
Paraguay AMR MIC 0.48 1.31 27% 0.10
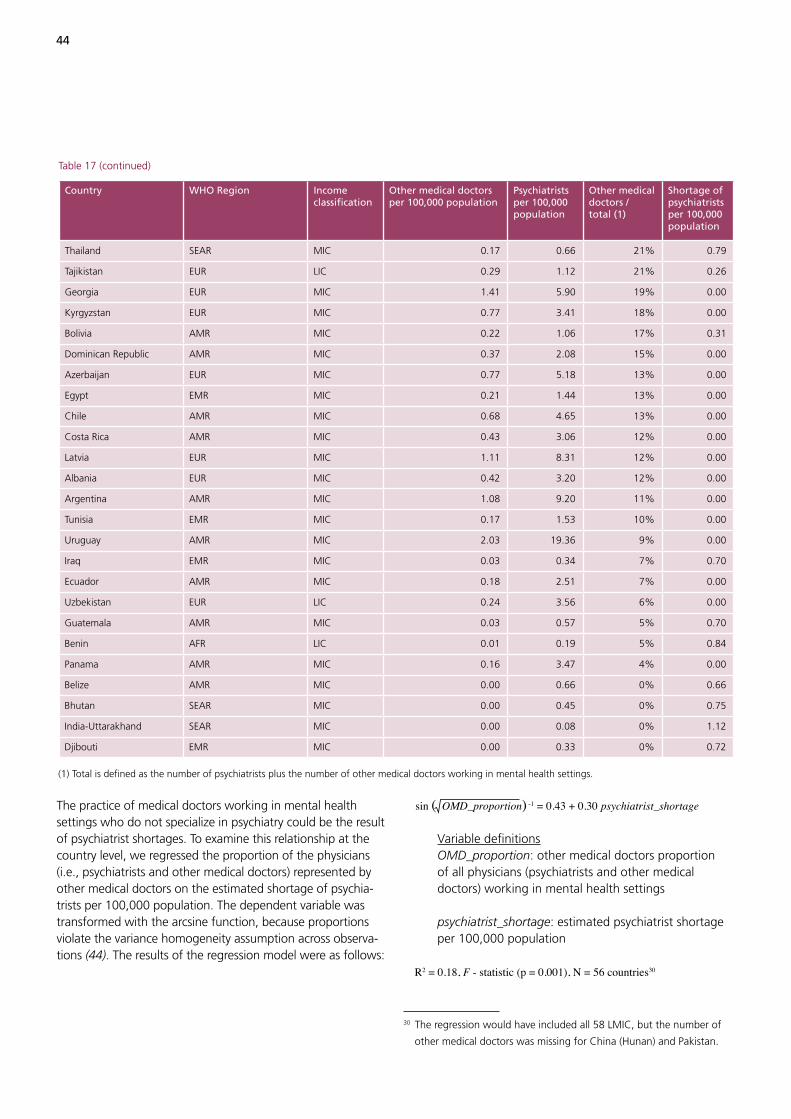
44
The practice of medical doctors working in mental health settings who do not specialize in psychiatry could be the result of psychiatrist shortages. To examine this relationship at the country level, we regressed the proportion of the physicians (i.e., psychiatrists and other medical doctors) represented by other medical doctors on the estimated shortage of psychia-trists per 100,000 population. The dependent variable was transformed with the arcsine function, because proportions violate the variance homogeneity assumption across observa-tions (44). The results of the regression model were as follows:
sin ( OMD_proportion) -1 = 0.43 + 0.30 psychiatrist_shortage
Variable definitions OMD_proportion: other medical doctors proportion of all physicians (psychiatrists and other medical doctors) working in mental health settings
psychiatrist_shortage: estimated psychiatrist shortage per 100,000 population
R2 = 0.18, F - statistic (p = 0.001), N = 56 countries30
30 The regression would have included all 58 LMIC, but the number of
other medical doctors was missing for China (Hunan) and Pakistan.
Table 17 (continued)
Country WHO Region Income classification
Other medical doctors per 100,000 population
Psychiatrists per 100,000 population
Other medical doctors / total (1)
Shortage of psychiatrists per 100,000 population
Thailand SEAR MIC 0.17 0.66 21% 0.79
Tajikistan EUR LIC 0.29 1.12 21% 0.26
Georgia EUR MIC 1.41 5.90 19% 0.00
Kyrgyzstan EUR MIC 0.77 3.41 18% 0.00
Bolivia AMR MIC 0.22 1.06 17% 0.31
Dominican Republic AMR MIC 0.37 2.08 15% 0.00
Azerbaijan EUR MIC 0.77 5.18 13% 0.00
Egypt EMR MIC 0.21 1.44 13% 0.00
Chile AMR MIC 0.68 4.65 13% 0.00
Costa Rica AMR MIC 0.43 3.06 12% 0.00
Latvia EUR MIC 1.11 8.31 12% 0.00
Albania EUR MIC 0.42 3.20 12% 0.00
Argentina AMR MIC 1.08 9.20 11% 0.00
Tunisia EMR MIC 0.17 1.53 10% 0.00
Uruguay AMR MIC 2.03 19.36 9% 0.00
Iraq EMR MIC 0.03 0.34 7% 0.70
Ecuador AMR MIC 0.18 2.51 7% 0.00
Uzbekistan EUR LIC 0.24 3.56 6% 0.00
Guatemala AMR MIC 0.03 0.57 5% 0.70
Benin AFR LIC 0.01 0.19 5% 0.84
Panama AMR MIC 0.16 3.47 4% 0.00
Belize AMR MIC 0.00 0.66 0% 0.66
Bhutan SEAR MIC 0.00 0.45 0% 0.75
India-Uttarakhand SEAR MIC 0.00 0.08 0% 1.12
Djibouti EMR MIC 0.00 0.33 0% 0.72
(1) Total is defined as the number of psychiatrists plus the number of other medical doctors working in mental health settings.

45
The parameter estimate for psychiatrist shortage per 100,000 population had a standard error of 0.09 and its p-value was less than 0.001. The results are consistent with a higher proportion of other medical doctors working in mental health settings as psychiatrist shortages increase. Because the pro-portion of other medical doctors was transformed, for ease of interpretation, Table A2 shows the predicted proportion of other medical doctors for different psychiatrist shortage levels, ranging from 0.0 per 100,000 population to 1.7 per 100,000 population, which is the psychiatrist shortage range among the countries reported in Table 9 (page 31). For example, countries without a shortage of psychiatrists are predicted to have 17% of the physicians (i.e., psychiatrists and other medical doctors) working in mental health settings being other medical doctors. At the other extreme, countries with a shortage of 1.7 psychiatrists per 100,000 population are predicted to have 65% of the physicians working in mental health settings being other medical doctors.
Table 18. Predicted proportion of other medical doctors
Shortage of psychiatrists per 100,000 population
Predicted proportion: other medical doctors / total (1) %
0.0 17
0.1 19
0.2 22
0.3 24
0.4 27
0.5 30
0.6 32
0.7 35
0.8 38
0.9 41
1.0 44
1.1 47
1.2 50
1.3 53
1.4 56
1.5 59
1.6 62
1.7 65
(1) Total is defined as the number of psychiatrists plus the number of other medical doctors working in mental health settings.
Mental, neurological and substance use (MNS) disorders account for an estimated
14% of the global burden of disease, yet mental health routinely receives a low
funding priority from governments. While evidence indicates there are insufficient
numbers of mental health workers in low- and middle-income countries (LMIC)
to meet the population needs, there are no rigorous estimates of the size of the
mental health workforce shortage and the wage bill that would be required to
remove the shortage. This report aims to fill that gap by estimating the number
of mental health workers required to treat MNS conditions. In 2005, for the 144
LMIC, there was an estimated shortage of 1.18 million workers, including 55,000
psychiatrists, 628,000 nurses in mental health settings and 493,000 psychosocial
care providers. The annual wage bill to remove this shortage would be about US$
4.4 billion (2009 dollars). In 2015, if the supply of mental health workers were
to remain unchanged from 2005, the shortage of mental health workers would
increase by an estimated 45%. To meet the treatment needs for MNS disorders,
our analysis provides benchmarks for human resources for mental health well into
the future.
About Human Resources for Health Observer
The WHO-supported regional health workforce observatories are cooperative mechanisms, through which health workforce stakeholders share experiences, information and evidence to inform and strengthen policy decision-making. The Human Resources for Health Observer series makes available the latest findings and research from different observatories to the widest possible audience.
The series covers a wide range of technical issues, in a variety of formats, including case studies,reports of consultations, surveys, and analysis. In cases where information has been produced inlocal languages, an English translation - or digest - will be made available.
This publication is available on the Internet at :http://www.who.int/hrh/resources/observer/en/
Copies may be requested from: World Health OrganizationDepartment of Human Resources for HealthCH-1211 Geneva 27, Switzerland
ISBN 978 92 4 150101 9