FOR IMMEDIATE RELEASE ORIENT-EXPRESS HOTELS...
15
1 Contact: Martin O‟Grady Vicky Legg Vice President, Chief Financial Officer Director, Corporate Communications Tel: +44 20 7921 4038 Tel: +44 20 7921 4067 E: [email protected] E: [email protected] FOR IMMEDIATE RELEASE August 2, 2011 ORIENT-EXPRESS HOTELS REPORTS SECOND QUARTER 2011 RESULTS Second Quarter Earnings Summary Second quarter total revenue, excluding Real Estate, up 23% to $177.4 million Revenue from Owned Hotels up 25% to $145.2 million Same store RevPAR up 20% in US dollars, up 14% in local currency Adjusted EBITDA before Real Estate up 28% to $41.1 million Adjusted net earnings from continuing operations for the quarter of $7.5 million, compared to $3.3 million in the second quarter of 2010 Key Events Announced the planned opening in summer 2012 of Palacio Nazarenas, a 55 key all suite hotel in a former palace and convent in Cuzco, Peru Reopened Napasai, Koh Samui, following a one month closure to create a new seven acre lagoon and nature reserve Hotel Caruso, Ravello, ranked Top Resort in Europe in Travel + Leisure (US) World‟s Best Awards 2011 readers‟ survey Maroma‟s Kinan Spa voted best spa in Mexico & Central America by readers of Condé Nast Traveler (US) Completed the €18.0 million ($26.1 million) refinancing of loans secured on La Residencia, Mallorca, with maturity of three years Completed sale of Hôtel de la Cité, Carcassonne, on August 1 for €9.0 million ($12.9 million)
Transcript of FOR IMMEDIATE RELEASE ORIENT-EXPRESS HOTELS...

1
Contact:
Martin O‟Grady Vicky Legg
Vice President, Chief Financial Officer Director, Corporate Communications
Tel: +44 20 7921 4038 Tel: +44 20 7921 4067
E: [email protected] E: [email protected]
FOR IMMEDIATE RELEASE
August 2, 2011
ORIENT-EXPRESS HOTELS REPORTS SECOND QUARTER 2011 RESULTS
Second Quarter Earnings Summary
Second quarter total revenue, excluding Real Estate, up 23% to $177.4 million
Revenue from Owned Hotels up 25% to $145.2 million
Same store RevPAR up 20% in US dollars, up 14% in local currency
Adjusted EBITDA before Real Estate up 28% to $41.1 million
Adjusted net earnings from continuing operations for the quarter of $7.5 million,
compared to $3.3 million in the second quarter of 2010
Key Events
Announced the planned opening in summer 2012 of Palacio Nazarenas, a 55 key all
suite hotel in a former palace and convent in Cuzco, Peru
Reopened Napasai, Koh Samui, following a one month closure to create a new seven
acre lagoon and nature reserve
Hotel Caruso, Ravello, ranked Top Resort in Europe in Travel + Leisure (US) World‟s
Best Awards 2011 readers‟ survey
Maroma‟s Kinan Spa voted best spa in Mexico & Central America by readers of Condé
Nast Traveler (US)
Completed the €18.0 million ($26.1 million) refinancing of loans secured on La
Residencia, Mallorca, with maturity of three years
Completed sale of Hôtel de la Cité, Carcassonne, on August 1 for €9.0 million ($12.9
million)

2
Hamilton, Bermuda, August 2, 2011. Orient-Express Hotels Ltd. (NYSE: OEH,
www.orient-express.com), owners or part-owners and managers of 49 luxury hotel,
restaurant, tourist train and river cruise properties operating in 24 countries, today
announced its results for the second quarter ended June 30, 2011.
“Orient-Express performed well in the second quarter, reflecting continued positive
momentum in the luxury leisure travel market and the solid performance of our iconic
properties as well as our train, cruise and other assets,” said Bob Lovejoy, Chairman and
Interim Chief Executive Officer. “Revenue excluding Real Estate grew by 23% compared
to the prior year period, driven by strong performance in Europe, particularly our Italian
properties. Adjusted EBITDA before Real Estate increased by 28%, compared with the
second quarter of last year, and we delivered our sixth consecutive quarter of RevPAR
growth.”
“Looking forward, we are encouraged by signs of continued recovery in our market –
including favorable booking trends. In addition, we see substantial potential to grow
revenue through disciplined capital expenditure programs and our marketing and brand-
building initiatives, as well as opportunities to enhance profitability through continued
operational improvement. Orient-Express has a deep team of seasoned operating
professionals implementing the Company‟s long-term strategy, and we are keenly
focused on profitable growth and building long-term shareholder value.”
Business Highlights
Revenue, excluding Real Estate, was $177.4 million in the second quarter of 2011, up
$33.3 million or 23% from the second quarter of 2010.
Revenue from Owned Hotels for the second quarter was $145.2 million, up $29.0 million
or 25% from the second quarter of 2010. On a same store basis, Owned Hotels RevPAR
was up 20% in US dollars and up 14% in local currency.
Trains and Cruises revenue in the second quarter was $25.3 million compared to $21.9
million in the second quarter of 2010, an increase of 16%.
Adjusted EBITDA before Real Estate was $41.1 million, up 28% compared to $32.1
million in the prior year. The principal variance was in the Italian hotels, where EBITDA
was up $9.0 million from the same period in the prior year, led by Hotel Cipriani, Venice
(up $4.0 million), Grand Hotel Timeo, Sicily (up $1.9 million) and Hotel Splendido,
Portofino (up $1.1 million). Other variances include the Copacabana Palace Hotel, Rio de
Janeiro (up $1.5 million), Reid‟s Palace, Madeira (up $1.0 million), Grand Hotel Europe,
St Petersburg (up $0.8 million), The Royal Scotsman (up $0.8 million) and share of
earnings from Peru hotels (up $0.6 million), offset by The Westcliff, Johannesburg (down
3
$2.4 million), Mount Nelson Hotel, Cape Town (down $1.3 million) and share of earnings
from PeruRail (down $2.6 million).
Adjusted net earnings from continuing operations for the second quarter were $7.5
million (adjusted net earnings of $0.07 per common share), compared with $3.3 million
($0.04 adjusted net earnings per common share) in the second quarter of 2010. Net
earnings for the second quarter were $5.2 million (reported earnings of $0.05 per
common share), compared with a net loss of $0.8 million (reported loss of $0.01 per
common share) in the second quarter of 2010.
Property Portfolio Highlights
During the quarter the Company announced that Palacio Nazarenas, its sixth hotel in
Peru, is planned to open in early summer 2012. The three year restoration of this 55 key
all suite hotel in a former palace and convent, next door to the Company‟s Hotel
Monasterio in Cuzco, has been carried out under the guidance of eight full time
archaeologists and the supervision of Peru‟s National Institute of Culture, with over
318,000ft³ of earth excavated by hand and each stone numbered and recorded. The total
cost of renovation for the hotel, which is owned through the Company‟s Peruvian joint
venture, is expected to be $14.1 million.
Features of this high altitude urban retreat will include oxygenated suites crafted by local
artisans, a full service spa offering an indigenous product range, iPads in every room pre-
loaded with insider city guides, a mobile phone for each room with reception in Cuzco
and the surrounding area, Cuzco‟s first outdoor heated swimming pool, insightful tours to
Machu Picchu and surrounding cultural sites, and an all day dining experience showcasing
contemporary Andean cuisine.
In addition, Napasai, Koh Samui, reopened at the end of the quarter following a month
long closure, during which a crystal clear lagoon and nature reserve accessible directly
from the resort‟s beach was created under the supervision of the local marine authority.
Dead coral and underwater rocks were removed, producing a seven acre natural haven
for tropical fish and a diversity of corals which will attract divers and snorkelers to the
resort.
On August 1, the Company concluded the sale of Hôtel de la Cité, Carcassonne. The
property was free of debt and the disposal of this non-core asset delivers €9.0 million
($12.9 million) cash proceeds to the Company, less any associated fees.
Two of the Company's hotels recently received significant awards. In June, Condé Nast
Traveler (US) voted Maroma‟s Kinan Spa the #1 Spa in Mexico and Central America, with
an overall score of 96.6 out of a possible 100, in its widely-followed annual list of the 250

4
Best Spas in the United States, Mexico, Caribbean and Canada. In July, Hotel Caruso
took home the coveted Top Resort in Europe award in Travel + Leisure's (US) World‟s
Best Awards 2011 readers‟ survey.
In June, UNESCO designated as a World Heritage Site the Tramuntana mountain range
around Deià in Mallorca, home to La Residencia. Each World Heritage site has a cultural
or natural significance that, according to UNESCO, “is so exceptional as to transcend
national boundaries and of importance for present and future generations of humanity.”
Regional Performance
Europe:
In the second quarter, revenue from Owned Hotels was $76.7 million, up $22.1 million or
40% from $54.6 million in the second quarter of 2010. Second quarter revenue at the
Italian hotels increased by $15.7 million or 54%, led by strong demand from the UK and
US markets. Same store RevPAR was up 36% from the prior year in US dollars (up 28%
in local currency). EBITDA for the quarter was $28.8 million compared to $17.0 million in
the second quarter of 2010, which represents an $11.8 million increase. This
improvement arose largely from the Italian hotels where the impact of refurbishments at
Hotel Cipriani and the effect of the Biennale art exhibits in Venice generated EBITDA
growth of $4.0 million. Compared with the second quarter of 2010, the Company‟s two
hotels in Sicily achieved year on year EBITDA growth of $2.6 million based on a full
quarter of operations in 2011.
North America:
Revenue from Owned Hotels for the quarter was $31.2 million, up 7% from $29.2 million
in the second quarter of 2010, due to rate driven increases in revenue at La Samanna,
Saint Martin and a combination of occupancy and rate driven growth at Charleston Place,
Charleston, offset by a decline at Maroma Resort & Spa in Mexico, where security
concerns continue to impact market demand generally to the country. Same store
RevPAR in the region increased by 8% in US dollars (up 7% in local currency). EBITDA
was $5.8 million compared to $5.4 million in the second quarter of 2010.
Rest of World:
Southern Africa:
Second quarter revenue was $6.2 million, compared to $9.2 million in the second quarter
of 2010. Same store RevPAR was down 43% in US dollars (down 48% in local currency).
EBITDA was a loss of $1.0 million, compared to a gain of $2.5 million in the second
quarter of 2010. The decrease was largely the result of the football World Cup played in
South Africa in 2010, although EBITDA has also been negatively impacted by new
competition in both Cape Town and Johannesburg and a stronger Rand, resulting in
pressure on rates and margins.

5
South America:
Revenue increased by 38% to $21.7 million in the second quarter of 2011, from $15.7
million in the second quarter of 2010. Year on year revenue increased at Hotel das
Cataratas, Iguassu Falls, by $1.5 million or 70% following the major refurbishment that
was completed in November 2010. Year on year revenue increased at Copacabana Palace
by $4.3 million or 37%, driven by strong ADR and US guest growth. Same store RevPAR
in the region increased by 27% in both US dollars and local currency. EBITDA was $4.6
million, compared to $3.0 million last year, an increase of 53%. Local inflationary
pressures and a stronger Real impacted margins in the quarter.
Asia Pacific:
Revenue for the second quarter of 2011 was $9.4 million, an increase of $1.9 million or
25% year over year, reflecting growth at all properties except Napasai, Koh Samui,
where there was a temporary closure for beach works. Same store RevPAR increased by
26% in US dollars (increase of 29% in local currency). EBITDA was $1.4 million
compared to $0.8 million in the second quarter of 2010.
Additional Information
Hotel management and part-ownership interests:
EBITDA for the second quarter of 2011 was $2.5 million compared to $2.2 million in the
second quarter of 2010. The improvement was largely attributable to the Company‟s
share of results from Peru hotels, as the second quarter of 2010 was negatively impacted
by flooding and landslides in the country. The quarterly result also included $0.3 million
of costs relating to the Company‟s initiative to enter the Management Contract business.
Restaurants:
Revenue from „21‟ Club, New York, in the second quarter of 2011 was $4.1 million
compared to $3.8 million in the same quarter of 2010. EBITDA was a loss of $0.4 million
compared to a gain of $0.5 million in the same quarter of 2010 due to a $1.0 million
accrual against a contingent liability.
Trains and Cruises:
Revenue increased by $3.4 million to $25.3 million in the second quarter of 2011 from
$21.9 million in the prior year, an increase of 16% year over year. EBITDA was $6.1
million compared to $6.8 million in the same quarter of 2010 due to a decrease in share
of results from PeruRail of $2.6 million. Both revenue and EBITDA from PeruRail in the
second quarter of 2010 included insurance income of $2.8 million.
6
Central costs:
In the second quarter of 2011, central costs were $8.7 million compared with $5.7
million in the prior year period. The increase was largely due to litigation settlement
gains recognized in the prior year ($1.1 million) and non-cash stock option costs ($0.6
million) and legal and other professional service fee increases ($0.4 million) in the
current quarter.
Real Estate:
In the second quarter of 2011, there was an EBITDA loss of $2.0 million from Real Estate
activities, primarily related to Porto Cupecoy, Sint Maarten, compared with a loss of $1.4
million in the second quarter of 2010. During the quarter, the Company recognized $1.7
million of revenue from three units transferred to customers. Cumulatively, at the end of
the quarter, 114 units or 62% of the total had been sold and the legal title of 104 units
had been transferred.
Depreciation and amortization:
The depreciation and amortization charge for the second quarter of 2011 was $11.7
million compared with $11.4 million in the second quarter of 2010.
Interest:
The interest charge for the second quarter of 2011 was $11.3 million, up from $7.4
million in the second quarter of 2010 principally due to a $1.7 million one-time write-off
of deferred financing costs on debt repayment, higher rates on refinanced debt and
interest capitalized in the second quarter of 2010 of $1.9 million.
Tax:
The tax charge for the second quarter of 2011 was $10.0 million, compared to a charge
of $7.4 million in the same quarter in the prior year. The second quarter of 2011 included
a deferred tax charge of $1.0 million arising in respect of fixed asset timing differences
following the appreciation of local currencies against the US dollar, compared to a
deferred tax benefit of $0.3 million in the same quarter in the prior year.
Investment:
The Company invested $14.9 million during the quarter, including $1.1 million at Hotel
Cipriani, $1.5 million at El Encanto, Santa Barbara, $1.4 million at the two Sicilian
properties, $1.1 million at Hotel Splendido, $1.0 million at La Residencia, Mallorca, and
routine capital expenditure at other properties.

7
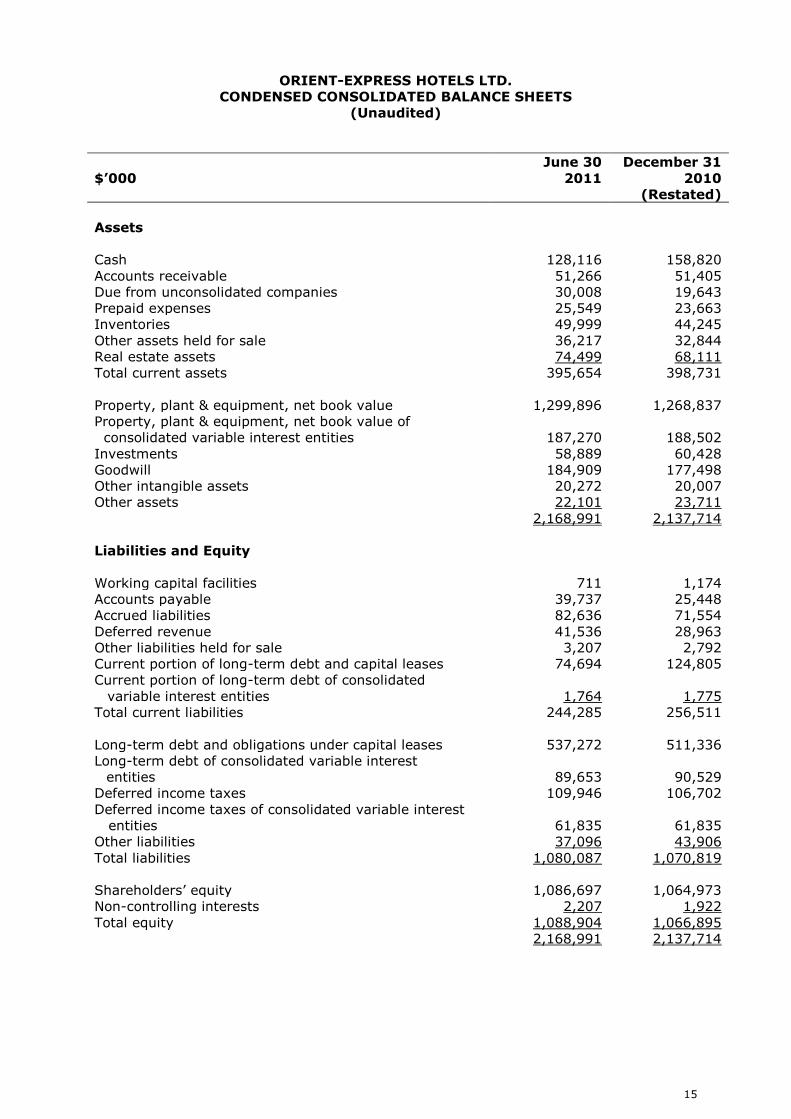
Balance Sheet
At June 30, 2011, the Company had long-term debt (including the current portion and
debt of consolidated variable interest entities) of $703.4 million, working capital loans of
$0.7 million, and cash balances of $128.1 million (including $15.1 million of restricted
cash), giving a total net debt of $576.0 million compared with total net debt of $610.2
million at the end of the first quarter of 2011. The decrease in net debt reflects the $25.5
million proceeds received in April 2011 following the assignment of the New York hotel
project.
Undrawn amounts available to the Company at June 30, 2011 under short-term lines of
credit were $4.6 million and undrawn amounts available to the Company under secured
revolving credit facilities were $12.0 million, bringing total cash availability (excluding
restricted cash) at June 30, 2011, to $129.6 million.
At June 30, 2011, approximately 58% of the Company‟s debt was at fixed interest rates
and 42% was at floating interest rates. The weighted average maturity of the debt was
approximately 3.4 years and the weighted average interest rate (including margin and
swaps) was approximately 4.5%.
At June 30, 2011, excluding revolving credit facilities of $28.0 million which are available
for redrawing, the Company had $48.5 million of debt repayments due within 12 months.
These are expected to be met through a combination of operational cash flow,
refinancing the facilities and utilizing available cash.
During the quarter, €30.0 million ($43.5 million) of debt secured on La Residencia,
maturing in September 2011, was refinanced with an €18.0 million ($26.1 million) facility
maturing in 2014.
The Company‟s balance sheet as at December 31, 2010 has been restated to correct an
understatement of non-current deferred income tax liabilities. The prior period increase
to non-current deferred tax liabilities of $6.0 million (and a corresponding decrease to
retained earnings) does not affect the Company‟s net losses or losses per share for the
year ended December 31, 2010.
* * * * * * * *

8
Reconciliation and Adjustments
Three months ended
Six months ended
$‟000 – except per share amounts June 30 June 30
2011 2010 2011 2010
EBITDA 37,068 31,074 37,788 28,320
Real Estate 1,990 1,439 3,108 2,779
EBITDA before Real Estate 39,058 32,513 40,896 31,099 Adjusted items: Gain on disposal (1) 86 - (520) -
Legal costs (2) - (279) - (170) Grand Hotel Timeo & Villa Sant‟Andrea (3) - 497 - 1,640 Cipriani litigation (4) - (788) - (788) „21‟ Club reserve (5) 1,000 - 1,000 - Management restructuring (6) 975 173 1,516 1,122
Adjusted EBITDA before Real Estate 41,119 32,116 42,892 32,903
Reported net earnings/(loss) attributable to Orient-
Express Hotels Ltd.
5,154 (820) (9,753) (13,828) Net earnings attributable to non-controlling interests (67) (38) (294) (207)
Reported net earnings/(loss) 5,221 (782) (9,459) (13,621) Discontinued operations net of tax (24) 1,608 689 (2,737)
Net earnings/(loss) from continuing operations 5,197 826 (8,770) (16,358) Adjusted items net of tax:
Gain on disposal (1) 56 - (338) - Legal costs (2) - (279) - (170) Grand Hotel Timeo & Villa Sant‟Andrea (3) - 359 - 1,225 Cipriani litigation (4) - (788) - (788) „21‟ Club reserve (5) 650 - 650 - Management restructuring (6) 780 173 1,255 933 Loan financing costs (7) 1,148 - 1,148 -
Interest rate swaps (8) 497 (22) 516 (5) Foreign exchange (9) (856) 3,001 (1,517) 230
Adjusted net earnings/(loss) from continuing
operations
7,472 3,270 (7,056) (14,933)
Reported earnings/(loss) per share 0.05 (0.01) (0.09) (0.15) Reported earnings/(loss) per share from continuing operations 0.05 0.01 (0.08) (0.18) Adjusted earnings/(loss) per share from continuing operations 0.07 0.04 (0.07) (0.17) Number of shares (millions) 102.47 90.80 102.45 89.32
1. Gain on disposal of New York hotel project. 2. Legal costs incurred in defending the Company‟s class B common share structure, net of awards or claims for
reimbursement. 3. Non-recurring costs and purchase transaction costs incurred in relation to Grand Hotel Timeo and Villa Sant‟Andrea. 4. Cash received in excess of costs incurred following settlement of “Cipriani” trademark litigation. 5. Non-recurring contingent liability. 6. Restructuring and redundancy costs. 7. Amortization of deferred financing costs on repayment of debt. 8. Charges on swaps that did not qualify for hedge accounting. 9. Foreign exchange is a non-cash item arising on the translation of certain assets and liabilities denominated in currencies
other than the reporting currency of the entity concerned.

9
Management evaluates the operating performance of the Company’s segments on the basis of
segment net earnings before interest, foreign exchange, tax (including tax on unconsolidated
companies), depreciation and amortization (EBITDA), and believes that EBITDA is a useful
measure of operating performance, for example to help determine the ability to incur capital
expenditure or service indebtedness, because it is not affected by non-operating factors such as
leverage and the historical cost of assets. EBITDA is also a financial performance measure
commonly used in the hotel and leisure industry, although the Company’s EBITDA may not be
comparable in all instances to that disclosed by other companies. EBITDA does not represent
net cash provided by operating, investing and financing activities under US generally accepted
accounting principles (US GAAP), is not necessarily indicative of cash available to fund all cash
flow needs, and should not be considered as an alternative to earnings from operations or net
earnings under US GAAP for purposes of evaluating operating performance.
Adjusted EBITDA and adjusted net earnings of the Company are non-GAAP financial
measures and do not have any standardized meanings prescribed by US GAAP. They
are, therefore, unlikely to be comparable to similar measures presented by other
companies, which may be calculated differently, and should not be considered as an
alternative to net earnings, cash flow from operating activities or any other measure of
performance prescribed by US GAAP. Management considers adjusted EBITDA and
adjusted net earnings to be meaningful indicators of operations and uses them as
measures to assess operating performance because, when comparing current period
performance with prior periods and with budgets, management does so after having
adjusted for non-recurring items, foreign exchange (a non-cash item), disposals of assets
or investments, and certain other items (some of which may be recurring) which
management does not consider indicative of ongoing operations or which could otherwise
have a material effect on the comparability of the Company’s operations. Adjusted
EBITDA and adjusted net earnings are also used by investors, analysts and lenders as
measures of financial performance because, as adjusted in the foregoing manner, the
measures provide a consistent basis on which the performance of the Company can be
assessed.
This news release and related oral presentations by management contain, in addition to
historical information, forward-looking statements that involve risks and uncertainties.
These include statements regarding earnings outlook, investment plans, debt reduction
and debt refinancings, asset sales and similar matters that are not historical facts. These
statements are based on management’s current expectations and are subject to a
number of uncertainties and risks that could cause actual results to differ materially from
those described in the forward-looking statements. Factors that may cause a difference
include, but are not limited to, those mentioned in the news release and oral
presentations, unknown effects on the travel and leisure markets of terrorist activity and
any police or military response, varying customer demand and competitive
considerations, failure to realize hotel bookings and reservations and planned property
development sales as actual revenue, inability to sustain price increases or to reduce
costs, rising fuel costs adversely impacting customer travel and the Company’s operating
costs, fluctuations in interest rates and currency values, uncertainty of negotiating and
completing proposed asset sales, debt refinancings, capital expenditures and
acquisitions, inability to reduce funded debt as planned or to agree bank loan agreement
waivers or amendments, adequate sources of capital and acceptability of finance terms,
possible loss or amendment of planning permits and delays in construction schedules for
expansion or development projects, delays in reopening properties closed for repair or
refurbishment and possible cost overruns, shifting patterns of tourism and business
travel and seasonality of demand, adverse local weather conditions, changing global and
regional economic conditions in many parts of the world and weakness in financial
markets, legislative, regulatory and political developments, and possible new challenges
to the Company’s corporate governance structure. Further information regarding these
and other factors is included in the filings by the Company with the U.S. Securities and
Exchange Commission.
******

10
Orient-Express Hotels will conduct a conference call on Wednesday, August 3, 2011 at
10.00 hrs EDT (15.00 BST) which is accessible at +1 888 935 4575 (US toll free) or +44
(0)20 7136 6283 (Standard International). The conference ID is 9270647. A re-play of
the conference call will be available until 7pm (EDT) Wednesday, August 10, 2011 and
can be accessed by calling +1 866 932 5017 (US toll free) or +44 (0)20 7111 1244
(Standard International) and entering replay access number 9270647#. A re-play will
also be available on the company‟s website: www.orient-expresshotelsltd.com.

11
ORIENT-EXPRESS HOTELS LTD.
Three Months ended June 30, 2011
SUMMARY OF OPERATING RESULTS
(Unaudited)
Three months ended
June 30
$’000 – except per share amounts 2011 2010
Revenue and earnings from unconsolidated
companies
Owned hotels
- Europe 76,684 54,607
- North America 31,197 29,215
- Rest of World 37,324 32,382
Hotel management & part ownership interests 2,853 2,182 Restaurants 4,097 3,794
Trains & Cruises 25,273 21,942
Revenue and earnings from unconsolidated
companies before Real Estate
177,428
144,122
Real Estate 1,660 27,414
Total (1) 179,088 171,536
Analysis of earnings
Owned hotels
- Europe 28,817 16,989
- North America 5,836 5,367
- Rest of World 4,909 6,313
Hotel management & part ownership interests 2,530 2,182
Restaurants (409) 493
Trains & Cruises 6,122 6,834
Central overheads (8,661) (5,665)
EBITDA before Real Estate and Gain on disposal 39,144 32,513
Real Estate (1,990) (1,439)
EBITDA before Gain on disposal 37,154 31,074
Loss on disposal (86) -
EBITDA 37,068 31,074
Depreciation & amortization (11,714) (11,426)
Interest (11,310) (7,353)
Foreign exchange 1,176 (4,040)
Earnings before tax 15,220 8,255
Tax (10,023) (7,429)
Net earnings from continuing operations 5,197 826
Discontinued operations 24 (1,608)
Net earnings/(losses) 5,221 (782)
Net earnings attributable to non-controlling
interests
(67)
(38)
Net earnings/(losses) attributable to Orient-
Express Hotels Ltd.
5,154
(820)
Net earnings/(losses) per common share 0.05 (0.01)
Number of shares – millions 102.47 90.80
(1) Comprises earnings from unconsolidated companies of $2,198,000 (2010 -
$4,725,000) and revenue of $176,890,000 (2010 - $166,811,000).

12
ORIENT-EXPRESS HOTELS LTD.
Three Months Ended June 30, 2011
SUMMARY OF OPERATING INFORMATION FOR OWNED HOTELS
Three months ended
June 30
2011 2010
Average Daily Rate
(in US dollars)
Europe 798 720
North America 335 325
Rest of World 331 327
Worldwide 489 441
Rooms Available (000’s)
Europe 86 80
North America 68 68
Rest of World 117 113
Worldwide 271 261
Rooms Sold (000’s)
Europe 54 41
North America 48 46
Rest of World 60 55
Worldwide 162 142
RevPAR (in US dollars)
Europe 506 375
North America 238 221
Rest of World 170 158
Worldwide 294 241
Change %
Same Store RevPAR
(in US dollars)
Dollar Local
currency
Europe 525 385 36% 28%
North America 238 221 8% 7%
Rest of World 172 163 6% 1%
Worldwide 293 245 20% 14%

13
ORIENT-EXPRESS HOTELS LTD.
Six Months ended June 30, 2011
SUMMARY OF OPERATING RESULTS
(Unaudited)
Six months ended
June 30
$’000 – except per share amounts 2011 2010
Revenue and earnings from unconsolidated
companies
Owned hotels
- Europe 91,364 67,627
- North America 60,445 56,554
- Rest of World 82,267 70,792
Hotel management & part ownership interests 2,777 874 Restaurants 7,438 6,908
Trains & Cruises 32,831 26,914
Revenue and earnings from unconsolidated
companies before Real Estate
277,122
229,669
Real Estate 5,191 31,108
Total (1) 282,313 260,777
Analysis of earnings
Owned hotels
- Europe 21,959 9,511
- North America 10,996 10,811
- Rest of World 16,464 17,397
Hotel management & part ownership interests 2,310 874
Restaurants (261) 636
Trains & Cruises 5,286 5,119
Central overheads (16,378) (13,249)
EBITDA before Real Estate and Gain on disposal 40,376 31,099
Real Estate (3,108) (2,779)
EBITDA before Gain on disposal 37,268 28,320
Gain on disposal 520 -
EBITDA 37,788 28,320
Depreciation & amortization (23,021) (22,583)
Interest (20,625) (14,110)
Foreign exchange 2,139 (218)
Losses before tax (3,719) (8,591)
Tax (5,051) (7,767)
Net losses from continuing operations (8,770) (16,358)
Discontinued operations (689) 2,737
Net losses (9,459) (13,621)
Net earnings attributable to non-controlling
interests
(294)
(207)
Net losses attributable to Orient-Express
Hotels Ltd.
(9,753)
(13,828)
Net losses per common share (0.09) (0.15)
Number of shares – millions 102.45 89.32
(1) Comprises earnings from unconsolidated companies of $1,433,000 (2010 -
$1,868,000) and revenue of $280,880,000 (2010 - $258,909,000).

14
ORIENT-EXPRESS HOTELS LTD.
Six Months Ended June 30, 2011
SUMMARY OF OPERATING INFORMATION FOR OWNED HOTELS
Six months ended
June 30
2011 2010
Average Daily Rate
(in US dollars)
Europe 720 637
North America 351 349
Rest of World 340 327
Worldwide 432 397
Rooms Available (000’s)
Europe 134 127
North America 135 136
Rest of World 234 229
Worldwide 503 492
Rooms Sold (000’s)
Europe 68 55
North America 91 87
Rest of World 136 126
Worldwide 295 268
RevPAR (in US dollars)
Europe 369 275
North America 236 224
Rest of World 197 180
Worldwide 253 216
Change %
Same Store RevPAR
(in US dollars)
Dollar Local
currency
Europe 371 279 33% 25%
North America 236 224 5% 5%
Rest of World 198 182 9% 5%
Worldwide 251 218 15% 11%
15
ORIENT-EXPRESS HOTELS LTD.
CONDENSED CONSOLIDATED BALANCE SHEETS
(Unaudited)
$’000
June 30
2011
December 31
2010
(Restated)
Assets
Cash 128,116 158,820
Accounts receivable 51,266 51,405
Due from unconsolidated companies 30,008 19,643
Prepaid expenses 25,549 23,663
Inventories 49,999 44,245
Other assets held for sale 36,217 32,844
Real estate assets 74,499 68,111
Total current assets 395,654 398,731
Property, plant & equipment, net book value 1,299,896 1,268,837
Property, plant & equipment, net book value of
consolidated variable interest entities 187,270
188,502
Investments 58,889 60,428
Goodwill 184,909 177,498
Other intangible assets 20,272 20,007
Other assets 22,101 23,711
2,168,991 2,137,714
Liabilities and Equity
Working capital facilities 711 1,174
Accounts payable 39,737 25,448
Accrued liabilities 82,636 71,554
Deferred revenue 41,536 28,963
Other liabilities held for sale 3,207 2,792
Current portion of long-term debt and capital leases 74,694 124,805
Current portion of long-term debt of consolidated
variable interest entities 1,764 1,775
Total current liabilities 244,285 256,511
Long-term debt and obligations under capital leases 537,272 511,336
Long-term debt of consolidated variable interest
entities 89,653
90,529
Deferred income taxes 109,946 106,702
Deferred income taxes of consolidated variable interest
entities
61,835
61,835
Other liabilities 37,096 43,906
Total liabilities 1,080,087 1,070,819
Shareholders‟ equity 1,086,697 1,064,973
Non-controlling interests 2,207 1,922
Total equity 1,088,904 1,066,895
2,168,991 2,137,714