FOOD SECURITY, LIVING CONDITIONS AND … · In Iraq, there are three traditional sources to acquire...
5
NOVEMBER 2012 The prevalence of food deprivation in Iraq fell from 7.1 percent in 2007 to 5.7 percent in 2011. Accordingly, there are 1.9 million Iraqi individuals suffering from food deprivation, which is approximately 294,000 less food deprived individuals than in 2007. As for the geographic distribution of food deprived individuals, over 500,000 of them live in Basra Governorate (26.6 percent); 350,000 in Baghdad Governorate (17.7 percent); 312,000 in Thi Qar Governorate (16.6 percent) and the remainder distributed within the remaining Governorates. According the the Iraq Knowledge Network (IKN) survey data, Iraqi households currently spend around 34.9 percent of consumption expenditure on food, which is nearly equivalent to the ratio recorded in 2007 (i.e. 35.6 percent) according to the Iraq Household Socio-Economic survey (IHSES) of 2007. The average Dietary Energy Consumption reached 2,810 kilocalories per person per day daily in 2011, up by 9 percent compared to the average in 2007 (2,580 kcal/person/day). Despite this improvement, inequality in consumption has widened as consumption of the highest income quintile is 1.9 times higher than that of the lowest income quintile. This is compared to 2007, where it was only 1.7 times higher. The prevalence of vulnerability to food deprivation also decreased during the same period as it dropped to 14 percent compared to 20 percent in 2007. Such results show a notable improvement in household food security, as approximately 20 percent of Iraq’s population are either deprived (5.7 percent) or potentially deprived (14 percent) compared with 27 percent in 2007. %5.0 - %0 %15.0 - %5.1 %30.0 - %15.1 %51.0 - %30.1 Anbar Basrah Erbil Missan Ninewa Sulaymaniyah Babil Dahuk Kerbala Muthanna Qadissiya Thi-Qar Baghdad Diyala Kirkuk Najaf Salah al-Din Wassit Prevalence of Food Deprivation (%) %6 - %2 %19 - %7 %32 - %20 %54 - %33 Anbar Basrah Erbil Missan Ninewa Sulaymaniyah Babil Dahuk Kerbala Muthanna Qadissiya Thi-Qar Baghdad Diyala Kirkuk Najaf Salah al-Din Wassit Percent of Individuals (%) FOOD CONSUMPTION AND FOOD DEPRIVATION IN IRAQ HOUSEHOLD EXPENDITURE Households within the lowest income quintile spend 50 percent of their consumption expenditure on food, compared to 27 percent for households in the highest income quintile. The IKN survey reveals that average nominal household expenditure increased from around 1 million Iraqi Dinars in 2007 to 1.148 million in 2011 – a 14.7 percent increase. It is noted that the increase in overall household consumption expenditures was driven by higher expenditures on housing, water, and fuel for electricity generators and heating which accounts for 30 percent of the increase, followed by food (28 percent), health (16 percent), and clothing (13 percent). FOOD SECURITY, LIVING CONDITIONS AND SOCIAL TRANSFERS IN IRAQ EXECUTIVE SUMMARY
Transcript of FOOD SECURITY, LIVING CONDITIONS AND … · In Iraq, there are three traditional sources to acquire...

NOVEMBER 2012
The prevalence of food deprivation in Iraq fell from 7.1 percent in 2007 to 5.7 percent in 2011. Accordingly, there are 1.9 million Iraqi individuals suffering from food deprivation, which is approximately 294,000 less food deprived individuals than in 2007. As for the geographic distribution of food deprived individuals, over 500,000 of them live in Basra Governorate (26.6 percent); 350,000 in Baghdad Governorate (17.7 percent); 312,000 in Thi Qar Governorate (16.6 percent) and the remainder distributed within the remaining Governorates.
According the the Iraq Knowledge Network (IKN) survey data, Iraqi households currently spend around 34.9 percent of consumption expenditure on food, which is nearly equivalent to the ratio recorded in 2007 (i.e. 35.6 percent) according to the Iraq Household Socio-Economic survey (IHSES) of 2007.
The average Dietary Energy Consumption reached 2,810 kilocalories per person per day daily in 2011, up by 9 percent compared to the average in 2007 (2,580 kcal/person/day). Despite this improvement, inequality in consumption has widened as consumption of the highest income quintile is 1.9 times higher than that of the lowest income quintile. This is compared to 2007, where it was only 1.7 times higher.
The prevalence of vulnerability to food deprivation also decreased during the same period as it dropped to 14 percent compared to 20 percent in 2007. Such results show a notable improvement in household food security, as approximately 20 percent of Iraq’s population are either deprived (5.7 percent) or potentially deprived (14 percent) compared with 27 percent in 2007.
%5.0 - %0
%15.0 - %5.1
%30.0 - %15.1
%51.0 - %30.1
Anbar
Basrah
Erbil
Missan
Ninewa
Sulaymaniyah
Babil
Dahuk
Kerbala
Muthanna
Qadissiya
Thi-Qar
Baghdad
Diyala
Kirkuk
Najaf
Salah al-Din
Wassit
Prevalence of Food Deprivation (%)
%6 - %2
%19 - %7
%32 - %20
%54 - %33
Anbar
Basrah
Erbil
Missan
Ninewa
Sulaymaniyah
Babil
Dahuk
Kerbala
Muthanna
Qadissiya
Thi-Qar
Baghdad
Diyala
Kirkuk
Najaf
Salah al-Din
Wassit
Percent of Individuals (%)
FOOD CONSUMPTION AND FOOD DEPRIVATION IN IRAQ HOUSEHOLD EXPENDITURE
Households within the lowest income quintile spend 50 percent of their consumption expenditure on food, compared to 27 percent for households in the highest income quintile. The IKN survey reveals that average nominal household expenditure increased from around 1 million Iraqi Dinars in 2007 to 1.148 million in 2011 – a 14.7 percent increase. It is noted that the increase in overall household consumption expenditures was driven by higher expenditures on housing, water, and fuel for electricity generators and heating which accounts for 30 percent of the increase, followed by food (28 percent), health (16 percent), and clothing (13 percent).
FOOD SECURITY, LIVING CONDITIONS AND SOCIAL TRANSFERS IN IRAQEXECUTIVE SUMMARY

In Iraq, there are three traditional sources to acquire food: the marketplace, own production, and the Public Distribution System (PDS). Commercial food expenditures represent around 88 percent of total food expenditures at the national level. However, it only represents 61.4 percent of consumed calories.
SOURCES OF FOOD
The cash value of own produced foods amounts to 1.9 percent of total food expenditure, representing 1.1 percent of total calorie intake. As for the PDS, it plays a minimal role in cash expenditure, as the market value of food acquired through the PDS represents only 8 percent of total value of food expenditures. This means that the cash value of food acquired through the PDS had declined by nearly one half compared with the value of the PDS package in 2007, which was 15 percent of total food expenditures valued at market prices. On average, 35.5 percent of the dietary energy consumed by Iraqi households in 2011 comes from the PDS.
Moreover, the ratio of the market value of the PDS ration to total household expenditure has declined, as the value of the PDS ration has come to represent less than 10 percent of total household expenditures for household in the top 6 income deciles. This highlights the declining importance of the PDS in the household budgets of non poor households as a result of the improvement in overall living conditions since to 2007.
50.0
60.0
44.0
61.4
1.1 1.4 1.9 1.7
52.9
35.5
70.0
20072011
40.0
30.0
20.0
10.0
0.0
Purchased Own Production Away from Home PDS
At the governorate level, the market value of PDS rations declined in all governorates –with the exception of Ninewa Governorate – as approximately 80 percent of Iraqi households received at least one item from the ration card items between middle 2010 and the first quarter of 2011, while 65 percent received at least two items, 25 percent received at least three items, and less than 5 percent received all the items.
Micro simulation analysis conducted using the 2011 IKN survey data suggests that excluding the wealthiest 50 percent of population from receiving the PDS ration will result in an increase in the prevalence of food deprivation 5.7 to 7 percent, while full elimination of the system will increase deprivation to 9 percent. Elimination of the wealthiest segments from the PDS will mostly affect the two poorest quintiles due to declining purchasing power resulting from rising prices of food. The wealthiest 30 percent will not be affected. This highlights the need to institute measures that mitigate the impact of excluding the wealthiest households from negatively affecting the poorest households due to rising prices and falling purchasing power.
%20.0- %35.0
%35.1 - %45.0
%45.1 - %60.0
Percent of Dietary Energy Consumption from the PDS
Anbar
Basrah
Erbil
Missan
Ninewa
Sulaymaniyah
Babil
Dahuk
Kerbala
Muthanna
Qadissiya
Thi-Qar
Baghdad
Diyala
Kirkuk
Najaf
Salah al-Din
Wassit
Dietary Energy Consumption by source of food Extent of dependence on the PDS

The government of Iraq has instituted efforts to reform the PDS. Such efforts include decreasing the number of beneficiaries gradually with the aim of targeting only those living below the poverty line by 2014; reducing the ration basket down to five items and decentralizing the management of the PDS to be managed at the governorate and KRG levels.
The analysis provided in this report sheds light on the vital role of the PDS in ensuring food security and decent living standards for the poorest households. The report also shows that reliance on the system has declined over time and that the role of commercial markets in food availability has led to a decline in the impact of the PDS on commercial food prices.
The report presents an analysis of the cost effectiveness of a poverty targeted Public Distribution System in achieving improved food security and compares it to three possible alternatives: replacing the food basket with direct cash transfers to the poor; distributing the current food basket to those under the poverty line using electronic food vouchers; and using electronic cards to target the poor with alternative food baskets.
OPTION ONE: DIRECT CASH TRANSFERS
This option compares the cost effectiveness of distributing the current food basket with direct cash transfers for the poor beneficiaries (6.4 million people). Replacing the PDS with cash transfers coincides with the recommendations of the PDS Reform High Committee on merging the PDS and the Social Safety Net (SSN).
The results reveal that the cost effectiveness of option one and adopting direct cash transfers is slightly higher than the effectiveness of the current PDS (about 4 percent higher). The estimated annual cost of option 1 is 1.4 billion USD, equivalent to the cost of the current PDS targeted to the poor. Additionally, the results indicate that under option 1, the ratio of expenditures on food among poor households will increase from 48.7 percent to 52.2 percent, indicating that poorer households will be forced to reduce their spending on non-food commodities and basic services.
PDS MANAGEMENT OPTIONS: ACHIEVING COST EFFECTIVENESS OPTION TWO: DISTRIBUTING THE CURRENT FOOD BASKET USING ELECTRONIC VOUCHERS TO THOSE UNDER POVERTY LINE
The estimated cost of maintaining the current ration card system for around 6.4 million poor people is around US$ 1.4 billion, whereas the cost of distributing the same food basked through the private sector using electronic vouchers is estimated at US$ 1.16 billion. Accordingly, increasing reliance on the private sector to provide the card items using electronic food vouchers will increase the efficiency of the PDS by 17 percent compared with the approach to supply chain management and distribution current employed for the PDS.
OPTION THREE: USING ELECTRONIC FOOD VOUCHERS TO TARGET THE POOR WITH ALTERNATIVE FOOD BASKETS
Three different food basket scenarios were considered under option three, all distributed through electronic food vouchers, and their cost effectiveness compared.
• Scenario one: Presents a food basket that maximizes the market value of the food basket transferred to the beneficiaries. The nutritional cost effectiveness of this scenario is 39 percent higher than the current PDS.
• Scenario two: Presents a food basket that maximizes the benefit to on the Iraqi economy through maximizing locally procured commodities. The nutritional cost effectiveness of this scenario is 33 percent higher than the current PDS.
• Scenario three: Presents a food basket that minimizes overall costs. The nutritional cost effectiveness of this scenario is 40 percent higher than the current PDS.
RECOMMENDATIONS FOR PUBLIC POLICY
AGGREGATE FOOD SUPPLY
National food security can be improved through boosting domestic production, particularly of local products that are of good quality and which have a relative advantage competing in the global market. Therefore, it is imperative to enhance the effort to support agricultural development and increase the resources allocated to it. It is necessary to develop and adopt national goals of achieving food security for all by ensuring the availability of basic food commodities in Iraqi markets at reasonable prices and ensuring their quality and safety. Given that wheat flour is the main source of carbohydrates and dietary energy in Iraq, the government must work to maintain sufficient reserves of wheat grain.
The continuing trend of global food price increases underlines the need to develop a national strategy for grain reserves management and to construct additional silos, promote the role of the public and private sectors in this field and improve related infrastructure and institutional capacity.
HOUSEHOLD FOOD SECURITY
The improvement in dietary energy consumption witnessed for Iraqi households on average since 2007 was not met with a decline in the prevalence of food deprivation of a similar magnitude. This is due to the rise in inequality in income and dietary energy consumption observed during the same time period. In order to combat rising inequality and achieve higher levels of food security, the government must ensure or promote the availability of adequate employment opportunities for the poor and vulnerable groups, especially through the private sector, in order to increase the income of the poor from work.
According to the proposals made by the High Committee to Ration the PDS, the targeting of the PDS to the poorest Iraqi should be paralleled by another process of improving the coverage of poor households within the Social Protection System in order to meet their basic needs.
In relation to this suggestion, this report addresses the critical question of estimating the required increase in income – which may be provided through the SSN – that will prevent deterioration in living standards and food security for the poor households as a result of carrying out the planned PDS reforms. This question is addressed in this report through presenting the potential impacts and necessary mitigating measures required at different stages in the process of targeting the PDS.
0%
5%
10%
15%
20%
25%
30%
Poorest 2nd 3rd 4th Richest
quintile
Distriution of SSN bene�ciaries by income quintile
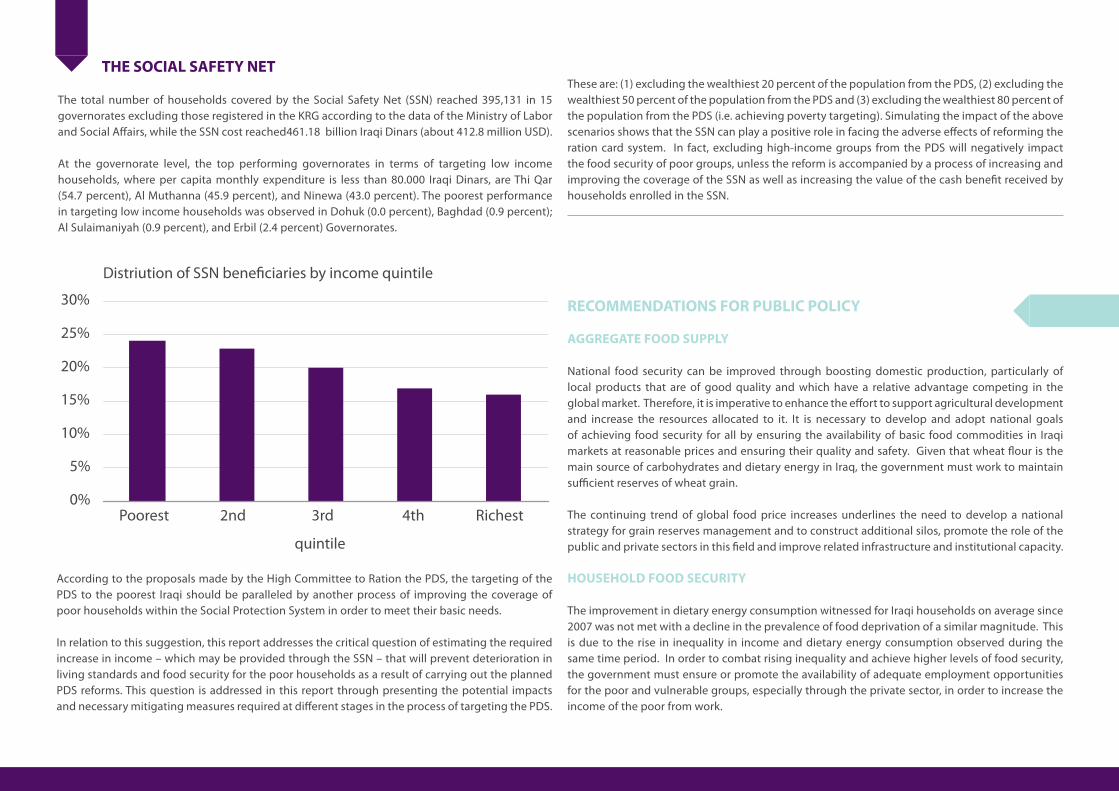
THE SOCIAL SAFETY NET
The total number of households covered by the Social Safety Net (SSN) reached 395,131 in 15 governorates excluding those registered in the KRG according to the data of the Ministry of Labor and Social Affairs, while the SSN cost reached461.18 billion Iraqi Dinars (about 412.8 million USD).
At the governorate level, the top performing governorates in terms of targeting low income households, where per capita monthly expenditure is less than 80.000 Iraqi Dinars, are Thi Qar (54.7 percent), Al Muthanna (45.9 percent), and Ninewa (43.0 percent). The poorest performance in targeting low income households was observed in Dohuk (0.0 percent), Baghdad (0.9 percent); Al Sulaimaniyah (0.9 percent), and Erbil (2.4 percent) Governorates.
These are: (1) excluding the wealthiest 20 percent of the population from the PDS, (2) excluding the wealthiest 50 percent of the population from the PDS and (3) excluding the wealthiest 80 percent of the population from the PDS (i.e. achieving poverty targeting). Simulating the impact of the above scenarios shows that the SSN can play a positive role in facing the adverse effects of reforming the ration card system. In fact, excluding high-income groups from the PDS will negatively impact the food security of poor groups, unless the reform is accompanied by a process of increasing and improving the coverage of the SSN as well as increasing the value of the cash benefit received by households enrolled in the SSN.

Additionally, the government must combat rising inequality in income and dietary energy consumption through enhancing the coverage and performance of the social safety net, improving targeting and continue to provide food for the poor and vulnerable groups through the PDS.
Finally, addressing the issue of micronutrient deficiencies necessitates boosting the cooperation between the health sector and food industries and raising consume awareness on the one hand; and raising awareness among food producers and importers on the importance of providing fortified and micronutrient rich commodities in the markets.
SOCIAL TRANSFERS
Despite that the PDS continues to offer significant benefits for most Iraqi households and undoubtedly maintains a low prevalence of food deprivation, it also suffers from significant constraints as it distorts domestic food markets, affects national resource allocation and is highly regressive due to the lack of targeting mechanisms. Accordingly, addressing this and improving social welfare through social protection systems requires:
• Continuing the process of targeting the PDS to the poorest and most vulnerable households;
• Enhancing the information systems required to rationalize social transfers and support to poor and vulnerable households;
• Distinguish between permanent social welfare beneficiaries registered in the Social Safety Net and temporary beneficiaries suffering from acute poverty due to unemployment or other temporary conditions;
• Raise financial allocations for the Social Safety Net in order to improve coverage and the quality and quantity of the services provided for both permanent and temporary beneficiaries;
• Work to expand the national School Feeding Program;
• Enhance efficiency of the PDS to become more flexible in designing a food basket that is more effective in addressing food and nutrition security in accordance with domestic food consumption habits;
• Amend the Social Safety Net Law to become more flexible in determining criteria for inclusion in the Safety Net.