Food & Beverage Investment Trends - IFAMA Hansen, Financial... · 1. 2017 IFAMA World Conference....
26
1 2017 IFAMA World Conference Strictly Confidential June 2017 Food & Beverage Investment Trends
Transcript of Food & Beverage Investment Trends - IFAMA Hansen, Financial... · 1. 2017 IFAMA World Conference....
1
2017 IFAMA World Conference
Strictly Confidential
June 2017
Food & Beverage Investment Trends

3
Introduction to Rabobank
Section
I
3
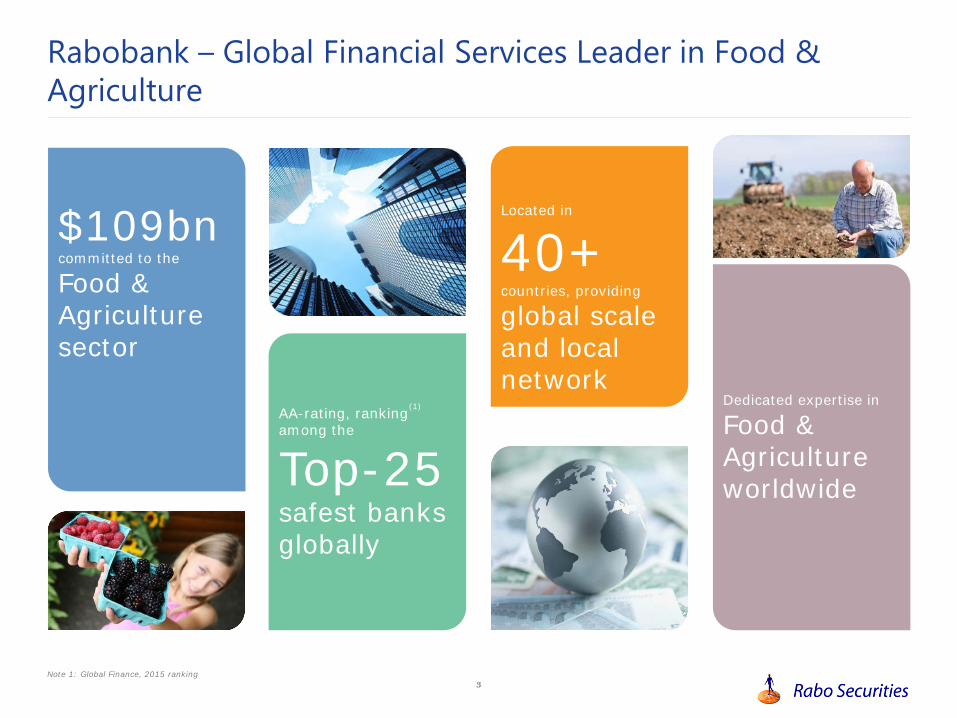
Rabobank – Global Financial Services Leader in Food & Agriculture
$109bncommitted to the
Food & Agriculture sector
Dedicated expertise in
Food & Agriculture worldwide
Located in
40+countries, providing
global scale and local network
AA-rating, ranking among the
Top-25safest banks globally
(1)
Note 1: Global Finance, 2015 ranking

4
Rabobank – Promoting Innovation in the Food & Agriculture Ecosystem
Select Strategic Investors
Growth Capital
Select Private Equity & Venture Capital Investors
Rabobank-affiliated
5
Farm input companies Farmers Trading Processing Food
retail
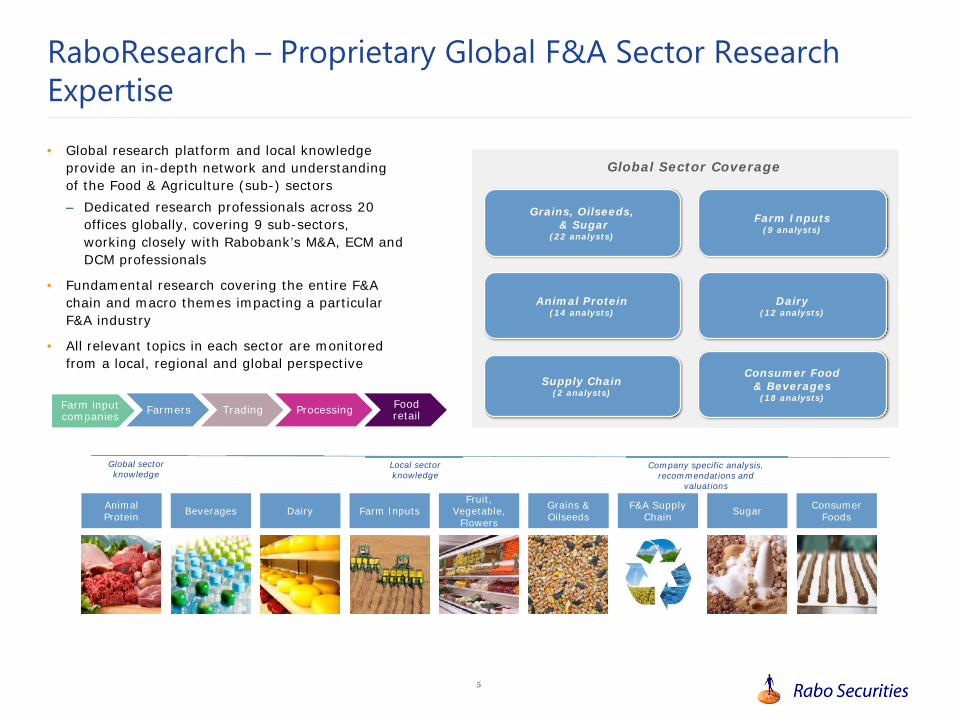
Global Sector Coverage
RaboResearch – Proprietary Global F&A Sector Research Expertise
Animal Protein (14 analysts)
Consumer Food & Beverages
(18 analysts)
Dairy (12 analysts)
Farm Inputs(9 analysts)
Grains, Oilseeds,& Sugar
(22 analysts)
Supply Chain(2 analysts)
• Global research platform and local knowledge provide an in-depth network and understanding of the Food & Agriculture (sub-) sectors– Dedicated research professionals across 20
offices globally, covering 9 sub-sectors, working closely with Rabobank’s M&A, ECM and DCM professionals
• Fundamental research covering the entire F&A chain and macro themes impacting a particular F&A industry
• All relevant topics in each sector are monitored from a local, regional and global perspective
Animal Protein Beverages
Fruit, Vegetable,
FlowersDairy Grains &
OilseedsFarm Inputs F&A Supply Chain Sugar Consumer
Foods
Company specific analysis, recommendations and
valuations
Global sector knowledge
Local sector knowledge

5
Food & Beverage Venture Capital Trends: 2013 – 2017 YTD
II
7
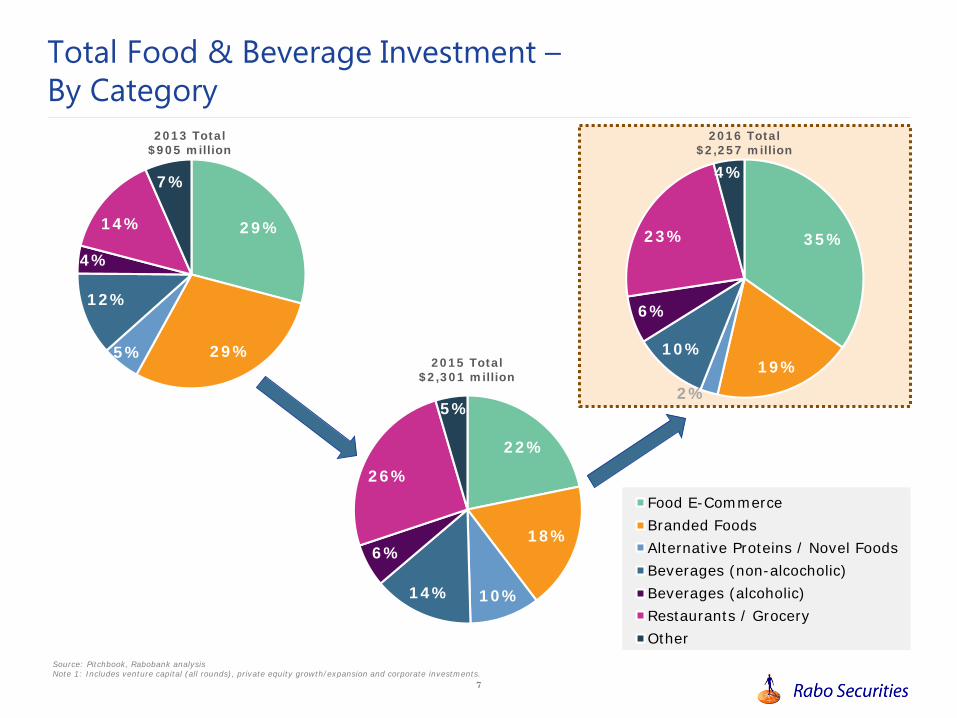
Total Food & Beverage Investment –By Category
Source: Pitchbook, Rabobank analysisNote 1: Includes venture capital (all rounds), private equity growth/expansion and corporate investments.
29%
29%5%
12%
4%
14%
7%
2013 Total $905 million
35%
19%2%
10%
6%
23%
4%
2016 Total $2,257 million
Food E-CommerceBranded FoodsAlternative Proteins / Novel FoodsBeverages (non-alcocholic)Beverages (alcoholic)Restaurants / GroceryOther
22%
18%
10%14%
6%
26%
5%
2015 Total $2,301 million

8
Total Food & Beverage Investment –Quarterly Deal Volume and Value
$221 $174$270
$241$262
$384
$243
$560
$431
$732
$606$533
$371
$584
$903
$400
$81359 51
67 66 69 7362
7894
110 11797
113 108 11591
102
Q12013
Q22013
Q32013
Q42013
Q12014
Q22014
Q32014
Q42014
Q12015
Q22015
Q32015
Q42015
Q12016
Q22016
Q32016
Q42016
Q12017
E-Commerce ($ millions) All Other ($ millions) # Deals
($ in millions)
Source: Pitchbook, Rabobank analysis
9
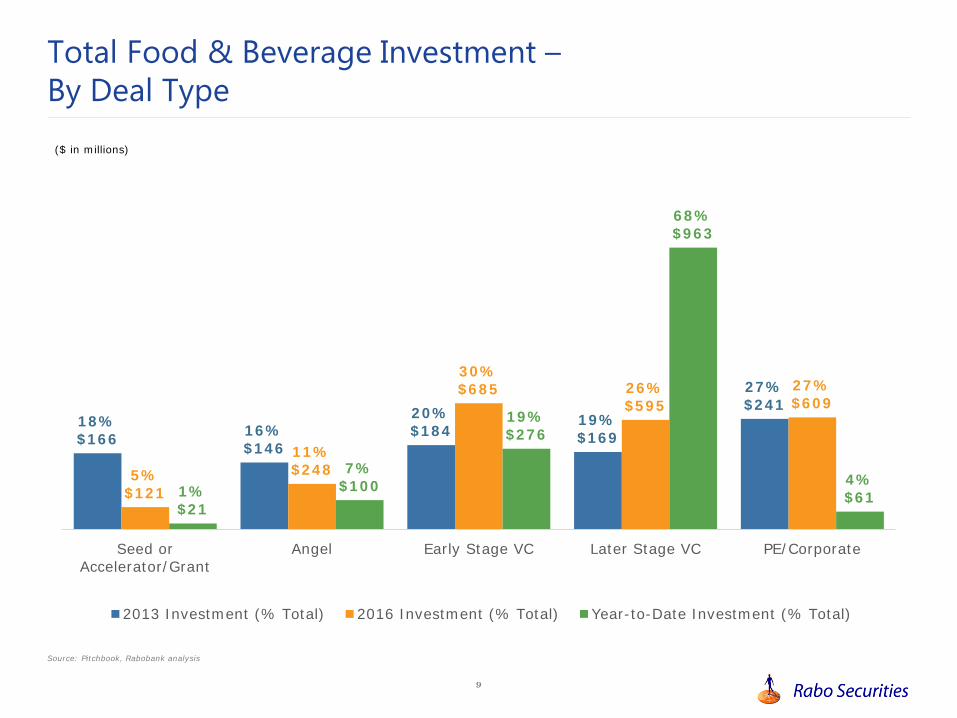
Total Food & Beverage Investment –By Deal Type
18%$166 16%
$146
20%$184
19%$169
27%$241
5%$121
11%$248
30%$685 26%
$59527%$609
1%$21
7%$100
19%$276
68%$963
4%$61
Seed orAccelerator/Grant
Angel Early Stage VC Later Stage VC PE/Corporate
2013 Investment (% Total) 2016 Investment (% Total) Year-to-Date Investment (% Total)
Source: Pitchbook, Rabobank analysis
($ in millions)
5
The Rise of Corporate Venture Capital in Food & Beverage
III
11
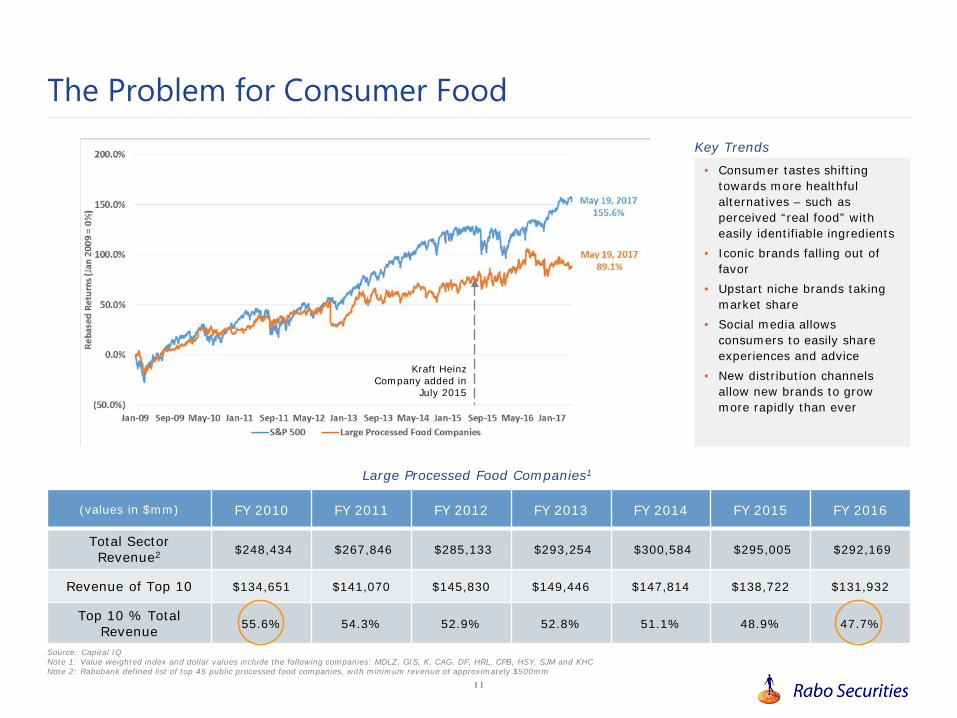
Large Processed Food Companies1
Source: Capital IQNote 1: Value weighted index and dollar values include the following companies: MDLZ, GIS, K, CAG, DF, HRL, CPB, HSY, SJM and KHCNote 2: Rabobank defined list of top 45 public processed food companies, with minimum revenue of approximately $500mm
(values in $mm) FY 2010 FY 2011 FY 2012 FY 2013 FY 2014 FY 2015 FY 2016
Total Sector Revenue2 $248,434 $267,846 $285,133 $293,254 $300,584 $295,005 $292,169
Revenue of Top 10 $134,651 $141,070 $145,830 $149,446 $147,814 $138,722 $131,932
Top 10 % Total Revenue 55.6% 54.3% 52.9% 52.8% 51.1% 48.9% 47.7%
Kraft Heinz Company added in
July 2015
• Consumer tastes shifting towards more healthful alternatives – such as perceived “real food” with easily identifiable ingredients
• Iconic brands falling out of favor
• Upstart niche brands taking market share
• Social media allows consumers to easily share experiences and advice
• New distribution channels allow new brands to grow more rapidly than ever
The Problem for Consumer FoodKey Trends
12
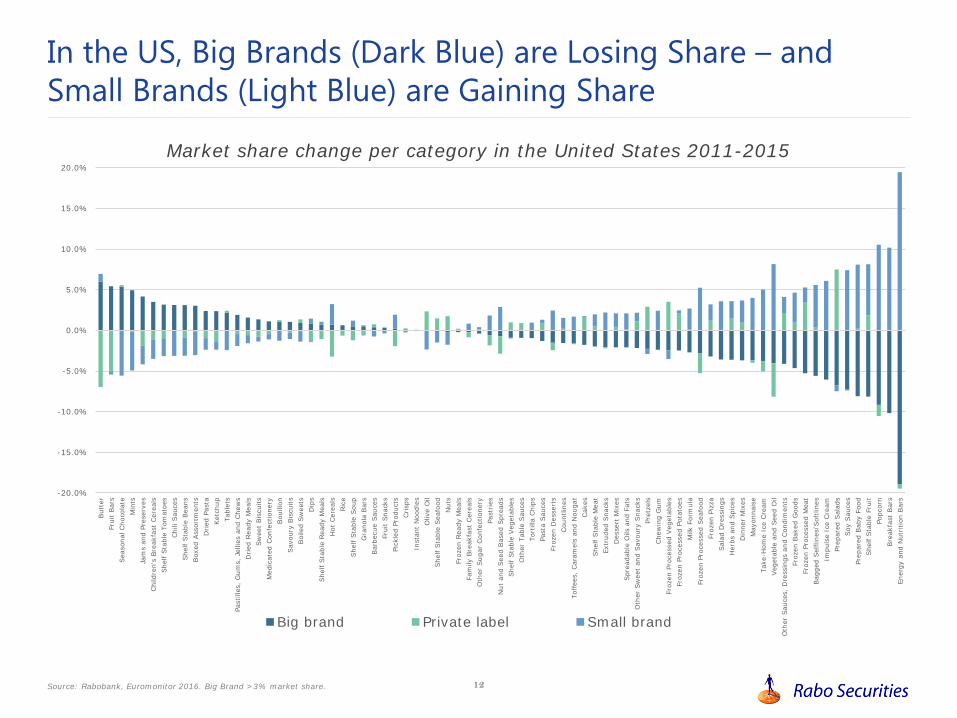
In the US, Big Brands (Dark Blue) are Losing Share – and Small Brands (Light Blue) are Gaining Share
Source: Rabobank, Euromonitor 2016. Big Brand >3% market share.
-20.0%
-15.0%
-10.0%
-5.0%
0.0%
5.0%
10.0%
15.0%
20.0%
But
ter
Frui
t Ba
rsSea
sona
l Cho
cola
teM
ints
Jam
s an
d Pr
eser
ves
Chi
ldre
n's
Brea
kfas
t Cer
eals
She
lf Sta
ble
Tom
atoe
sChi
li Sau
ces
She
lf Sta
ble
Bea
nsBox
ed A
ssor
tmen
tsD
ried
Pas
taKet
chup
Tabl
ets
Past
illes
, G
ums,
Jel
lies
and
Che
ws
Dried
Rea
dy M
eals
Sw
eet
Bis
cuits
Med
icat
ed C
onfe
ctio
nery
Bou
illon
Sav
oury
Bis
cuits
Boi
led
Sw
eets
Dip
sShe
lf Sta
ble
Rea
dy M
eals
Hot
Cer
eals
Ric
eShe
lf Sta
ble
Sou
pG
rano
la B
ars
Bar
becu
e Sa
uces
Frui
t Sn
acks
Pick
led
Prod
ucts
Crisp
sIn
stan
t N
oodl
esO
live
Oil
She
lf Sta
ble
Sea
food
Nut
sFr
ozen
Rea
dy M
eals
Fam
ily B
reak
fast
Cer
eals
Oth
er S
ugar
Con
fect
ione
ryPa
stri
esN
ut a
nd S
eed
Bas
ed S
prea
dsShe
lf Sta
ble
Veg
etab
les
Oth
er T
able
Sau
ces
Tort
illa
Chi
psPa
sta
Sau
ces
Froz
en D
esse
rts
Cou
ntlin
esTo
ffee
s, C
aram
els
and
Nou
gat
Cak
esShe
lf Sta
ble
Mea
tEx
trud
ed S
nack
sD
esse
rt M
ixes
Spr
eada
ble
Oils
and
Fat
sO
ther
Sw
eet
and
Sav
oury
Sna
cks
Pret
zels
Che
win
g G
umFr
ozen
Pro
cess
ed V
eget
able
sFr
ozen
Pro
cess
ed P
otat
oes
Milk
For
mul
aFr
ozen
Pro
cess
ed S
eafo
odFr
ozen
Piz
zaSal
ad D
ress
ings
Her
bs a
nd S
pice
sD
inne
r M
ixes
May
onna
ise
Take
-Hom
e Ic
e Cre
amVeg
etab
le a
nd S
eed
Oil
Oth
er S
auce
s, D
ress
ings
and
Con
dim
ents
Froz
en B
aked
Goo
dsFr
ozen
Pro
cess
ed M
eat
Bag
ged
Sel
fline
s/Sof
tline
sIm
puls
e Ic
e Cre
amPr
epar
ed S
alad
sSoy
Sau
ces
Prep
ared
Bab
y Fo
odShe
lf Sta
ble
Frui
tPo
pcor
nBre
akfa
st B
ars
Ener
gy a
nd N
utritio
n Bar
s
Market share change per category in the United States 2011-2015
Big brand Private label Small brand

13
• Large packaged food companies are no longer in denial about changing consumer trends• Consumer tastes are shifting• Desire for more healthful alternatives, perceived “real food” with easily identifiable ingredients
• Kellogg’s, Post, Kraft Heinz, Campbell Soup………traditional brands are falling out of favor• Young consumers have new tastes and aging consumers have evolving preferences• Market share of top 10 packaged food companies is eroding by over 1% per year
• Consumers are more experimental, more health-conscious (less processed!) and willing to spend• Upstart niche brands from new small- to mid-size competitors are gaining share• Premium private label alternatives are also gaining share
• Social media enables consumers to quickly and easily share experiences and advice• Alternative distribution channels such as mainstream national retailers (Wal-Mart, Costco, Target) and e-
commerce have facilitated new brand distribution and rapid growth• Smaller brands are more nimble and able communicate a differentiated, “underdog” marketing message
There’s No Denying It!
Iconic Brands Are Suffering
Where is the Consumer Going?
How Did This Happen
There is a Problem – How Will Your Company Address These Challenges?
Note: See Rabobank Industry Note “Dude, Where’s My Consumer?” (May 2015) for additional information regarding food and beverage consumer trends.
• How will your company address these challenges?• New brands and products are emerging more quickly and taking share. In addition to internal development
or acquiring proven winners, is there a way that your company can invest in innovation?• Does your culture welcome new ideas, new products, new ways to go about meeting consumer demand?
The Real Questions Are.........
14
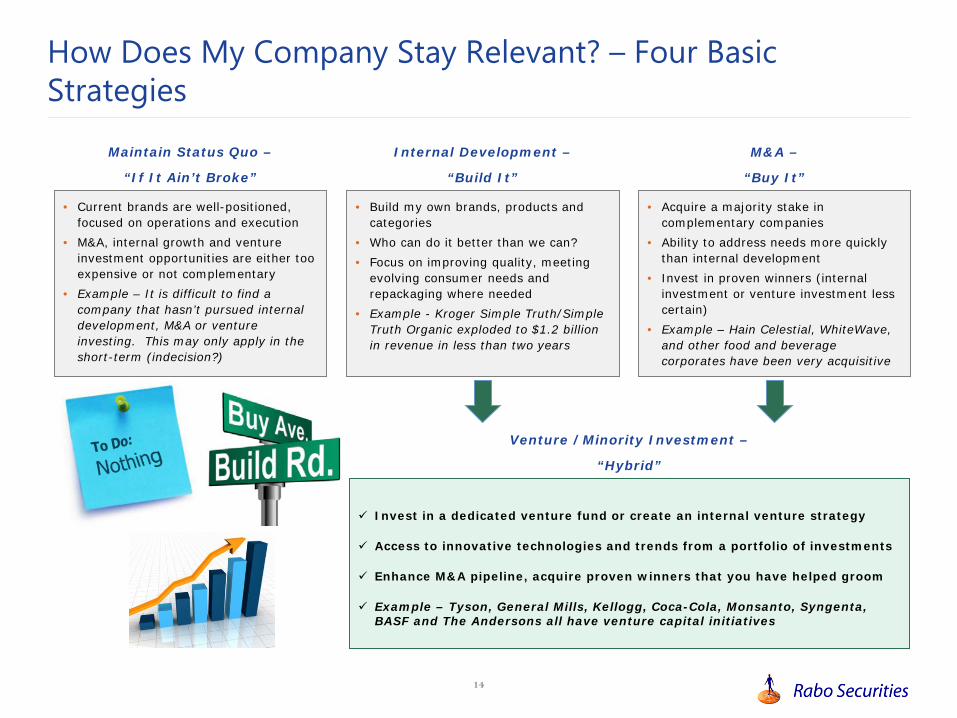
Maintain Status Quo –
“If It Ain’t Broke”
Invest in a dedicated venture fund or create an internal venture strategy
Access to innovative technologies and trends from a portfolio of investments
Enhance M&A pipeline, acquire proven winners that you have helped groom
Example – Tyson, General Mills, Kellogg, Coca-Cola, Monsanto, Syngenta, BASF and The Andersons all have venture capital initiatives
• Acquire a majority stake in complementary companies
• Ability to address needs more quickly than internal development
• Invest in proven winners (internal investment or venture investment less certain)
• Example – Hain Celestial, WhiteWave, and other food and beverage corporates have been very acquisitive
• Current brands are well-positioned, focused on operations and execution
• M&A, internal growth and venture investment opportunities are either too expensive or not complementary
• Example – It is difficult to find a company that hasn’t pursued internal development, M&A or venture investing. This may only apply in the short-term (indecision?)
Internal Development –
“Build It”
Venture /Minority Investment –
“Hybrid”
M&A –
“Buy It”
• Build my own brands, products and categories
• Who can do it better than we can?• Focus on improving quality, meeting
evolving consumer needs and repackaging where needed
• Example - Kroger Simple Truth/Simple Truth Organic exploded to $1.2 billion in revenue in less than two years
How Does My Company Stay Relevant? – Four Basic Strategies
15
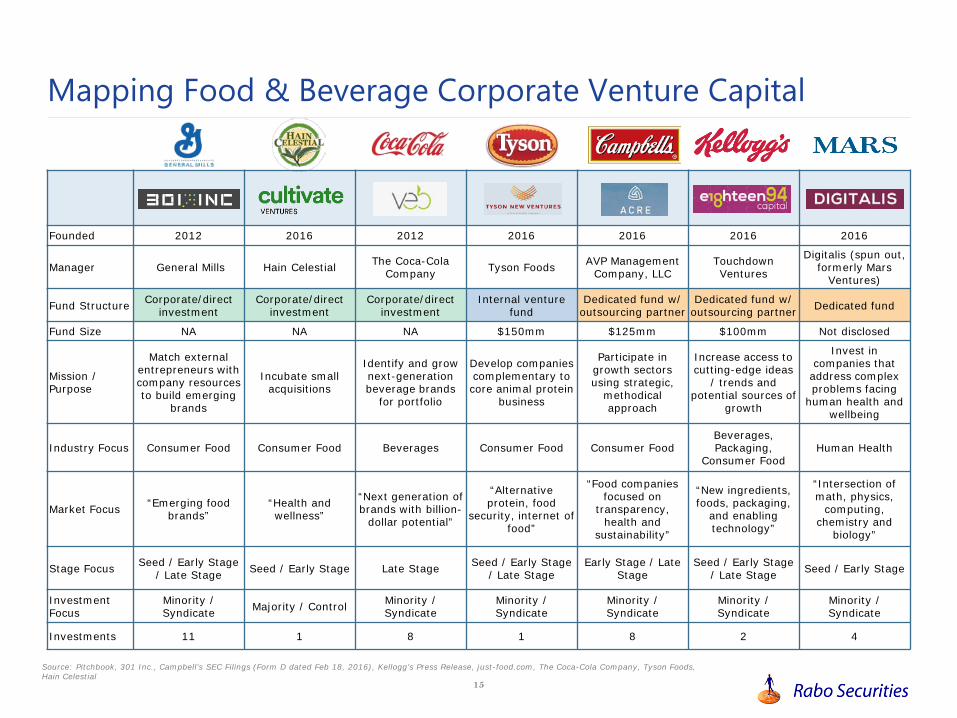
Founded 2012 2016 2012 2016 2016 2016 2016
Manager General Mills Hain Celestial The Coca-Cola Company Tyson Foods AVP Management
Company, LLCTouchdown Ventures
Digitalis (spun out, formerly Mars
Ventures)
Fund Structure Corporate/direct investment
Corporate/direct investment
Corporate/direct investment
Internal venture fund
Dedicated fund w/outsourcing partner
Dedicated fund w/outsourcing partner Dedicated fund
Fund Size NA NA NA $150mm $125mm $100mm Not disclosed
Mission / Purpose
Match external entrepreneurs withcompany resources to build emerging
brands
Incubate small acquisitions
Identify and grow next-generation beverage brands
for portfolio
Develop companiescomplementary to core animal protein
business
Participate in growth sectors using strategic,
methodicalapproach
Increase access to cutting-edge ideas
/ trends andpotential sources of
growth
Invest in companies that
address complex problems facing
human health and wellbeing
Industry Focus Consumer Food Consumer Food Beverages Consumer Food Consumer FoodBeverages, Packaging,
Consumer FoodHuman Health
Market Focus “Emerging food brands”
“Health and wellness”
“Next generation of brands with billion-
dollar potential”
“Alternative protein, food
security, internet of food”
“Food companies focused on
transparency, health and
sustainability”
“New ingredients, foods, packaging,
and enabling technology”
“Intersection of math, physics,
computing, chemistry and
biology”
Stage Focus Seed / Early Stage / Late Stage Seed / Early Stage Late Stage Seed / Early Stage
/ Late StageEarly Stage / Late
StageSeed / Early Stage
/ Late Stage Seed / Early Stage
Investment Focus
Minority / Syndicate Majority / Control Minority /
SyndicateMinority / Syndicate
Minority / Syndicate
Minority / Syndicate
Minority / Syndicate
Investments 11 1 8 1 8 2 4
Mapping Food & Beverage Corporate Venture Capital
Source: Pitchbook, 301 Inc., Campbell’s SEC Filings (Form D dated Feb 18, 2016), Kellogg’s Press Release, just-food.com, The Coca-Cola Company, Tyson Foods, Hain Celestial
16
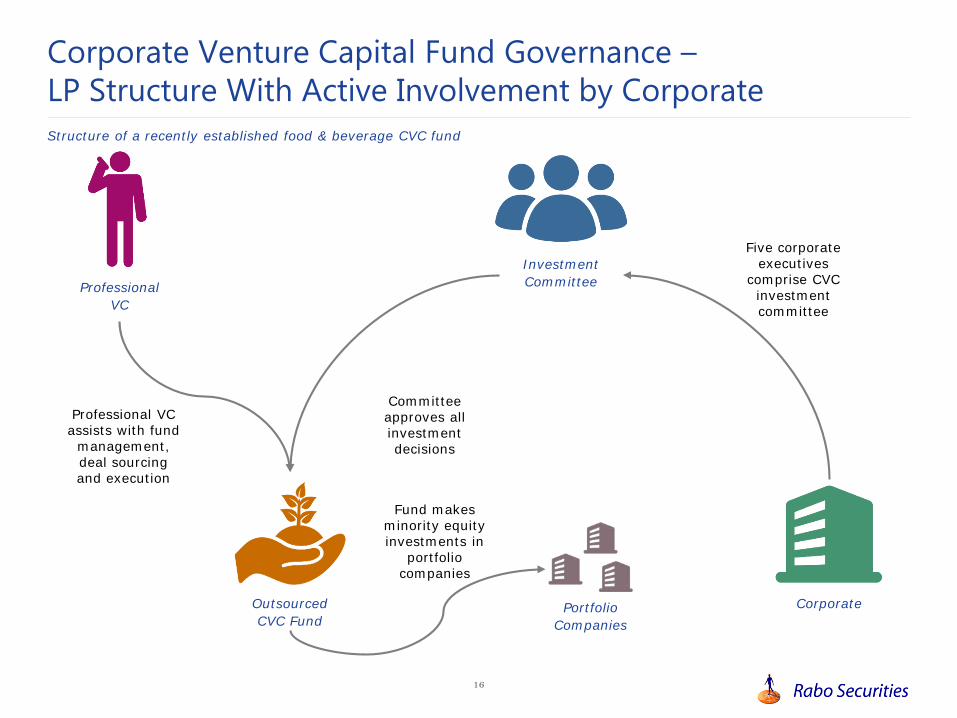
Corporate Venture Capital Fund Governance –LP Structure With Active Involvement by Corporate
Corporate
Professional VC
Investment Committee
Professional VC assists with fund
management, deal sourcing and execution
Committee approves all investment decisions
Five corporate executives
comprise CVC investment committee
Outsourced CVC Fund
Portfolio Companies
Fund makes minority equity investments in
portfolio companies
Structure of a recently established food & beverage CVC fund
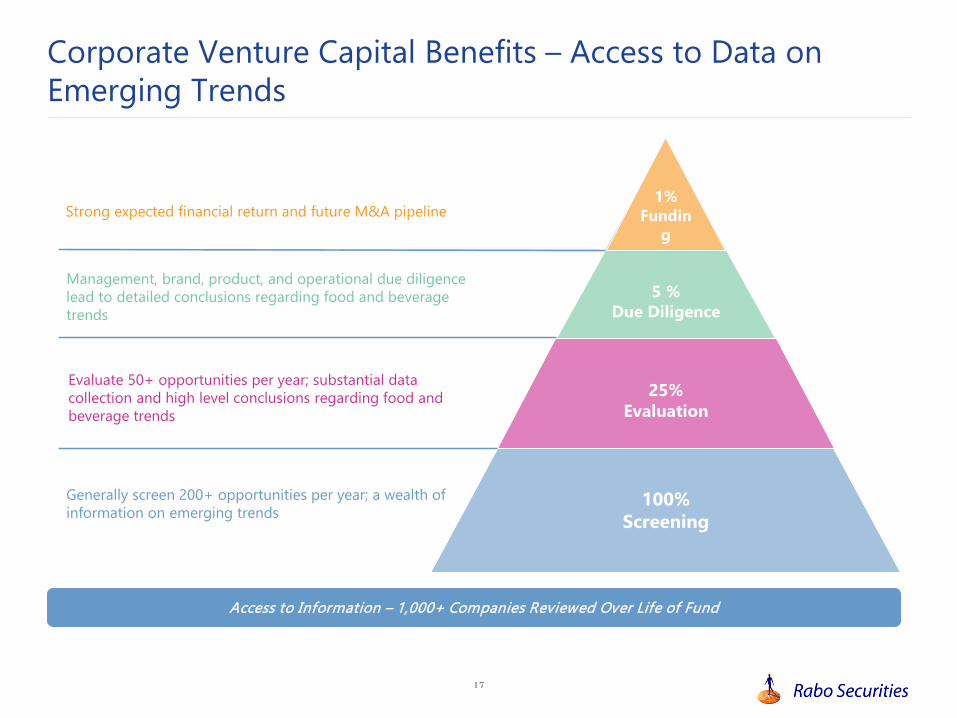
17
1% Fundin
g
5 % Due Diligence
25%Evaluation
100% Screening
Strong expected financial return and future M&A pipeline
Management, brand, product, and operational due diligence lead to detailed conclusions regarding food and beverage trends
Evaluate 50+ opportunities per year; substantial data collection and high level conclusions regarding food and beverage trends
Generally screen 200+ opportunities per year; a wealth of information on emerging trends
Access to Information – 1,000+ Companies Reviewed Over Life of Fund
Corporate Venture Capital Benefits – Access to Data on Emerging Trends

18
Date Target Description Buyer Price ($mm)
EV / Sales
EV / EBITDA
Feb-17 Lightlife Foods Provider of meatless frozen and refrigerated items Maple Leaf Foods 140 3.5x n.a.
Nov-16 KeVita Provider of organic probiotic drinks PepsiCo 250 4.2x n.a.
Aug-16 Tyrrell's Better-For-You snack food business
Amplify Snack Brands 393 3.6x 16.4x
Jul-16 WhiteWaveFoods
Leading organic foods and plant-based beverages Danone 12,065 2.9x 23.6x
Jan-16 EPIC Provisions Grass fed animal based protein bars Annie’s 100 5.0x n.a.
Nov-15 thinkThin Protein enriched bars Glanbia 217 2.6x n.a.
Nov-15 Boulder Brands Gluten-free products and Balance healthy spreads Pinnacle Foods 991 1.9x 18.0x
Oct-15 Diamond Foods Potato chips (Kettle), popcorn and snack nuts Snyder's-Lance 1,942 2.2x 16.8x
Sep-15 Alpine Valley Breads
Organic whole grain breads, private label breads, buns Flowers Foods 120 1.3x n.a.
Sep-15 Quorn Mycoprotein-based, meat-alternative foods Monde Nissin 834 3.7x 18.2x
Aug-15 Dave's Killer Bread Organic whole grain breads Flowers Foods 275 1.7x n.a.
Aug-15 Wallaby Organic Organic dairy products,Australian-style yogurts WhiteWave Foods 125 2.8x n.a.
Jun-15 Fresh Hemp Foods
Hemp hearts, heart bites, protein powders, oil
Compass Diversified Holdings C$132.5 3.0x 20.7x
Jun-15 Vega Plant-based nutrition products WhiteWave Foods 550 5.5x n.a.
Jan-15 KRAVE Pure Foods
Processed meat snacks including premium jerky Hershey 240 6.9x n.a.
Nov-14 Garden Protein Dairy and meat free food products Pinnacle Foods 155 2.7x n.a.
Sep-14 Annie's Distributes natural and organic food products General Mills 823 4.0x 38.6x
Average 3.4x 21.8x
Median 3.0x 18.2x
Date Target Description Buyer Price ($mm)
EV / Sales
EV / EBITDA
Apr-17 Weetabix RTE breakfast cereals Post Holdings GBP 1,400 3.5x 11.7x
Nov-16 ACH Food (spices unit) Spices and food ingredients B&G Foods 365 1.6x 9.4x
Nov-16 Bellisio Foods Provider of frozen food products
Charoen Pokphand Foods 1,075 1.6x 13.1x
Nov-15 Ralcorp (ConAgra) Private brand food products Treehouse Foods 2,700 0.7x 7.7x
Sep-15 Green Giant Leading producer of frozen and canned vegetables B&G Foods 765 1.4x 7.8x
Jun-15 Iglo Foods Frozen foods (including vegetables, fish) Nomad Holdings EUR 2,600 1.7x 8.5x
May-15 Ragu / Bertolli North America pasta sauces brands Mizkan Holdings 2,150 3.6x 10.5x
Jan-15 MOM Brands RTE and hot cereal products Post Holdings 1,152 1.5x 9.6x
Dec-14 Bumble Bee Seafoods Fish and shrimp products Thai Union Frozen
Products 750 0.9x 10.4x
Dec-14 Saputo Snack-cakes Canada Bread 103 0.9x 8.0x
Jun-14 Hillshire Foods Packaged meat and frozen bakery products Tyson Foods 8,932 2.1x 16.7x
Apr-14 Specialty Brands of America
Dry soups and past/rice dishes B&G Foods 155 1.8x 7.8x
Feb-14 Canada Bread Value-added fresh and frozen bakery products Grupo Bimbo 1,671 1.2x 9.3x
Average 1.7x 10.0x
Median 1.6x 9.4x
Food Companies Paying a Premium for Health / Wellness Brands
Source: Rabobank, Capital IQ
Health / Wellness CPG Food
~ 100% EBITDA Multiple Premium for Health / Wellness
19
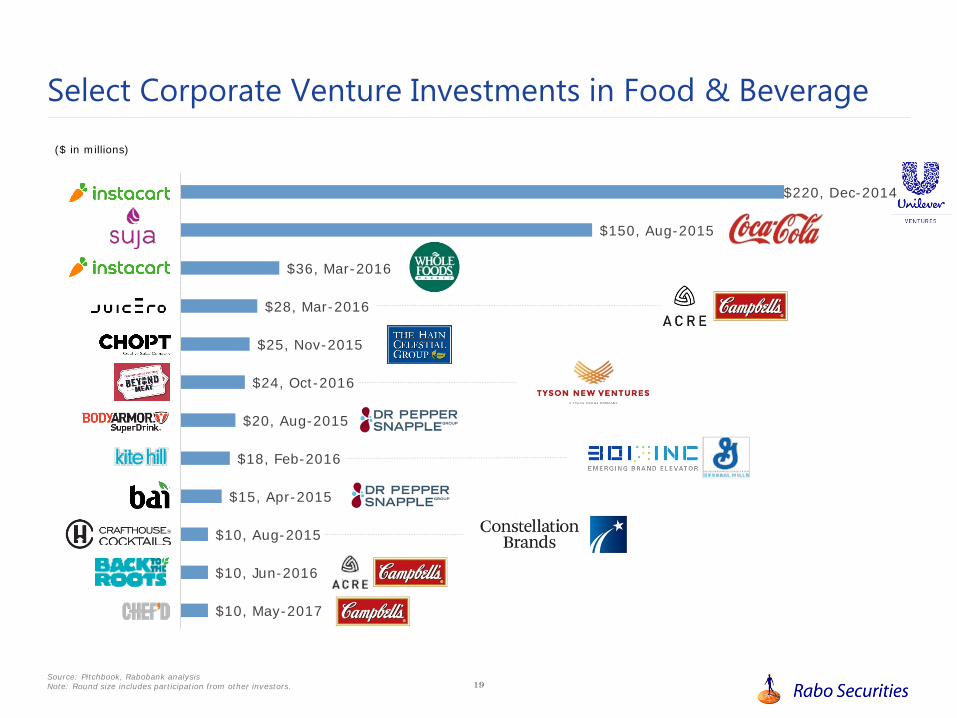
Select Corporate Venture Investments in Food & Beverage
$10, May-2017
$10, Jun-2016
$10, Aug-2015
$15, Apr-2015
$18, Feb-2016
$20, Aug-2015
$24, Oct-2016
$25, Nov-2015
$28, Mar-2016
$36, Mar-2016
$150, Aug-2015
$220, Dec-2014
($ in millions)
Source: Pitchbook, Rabobank analysisNote: Round size includes participation from other investors.

5
Food E-Commerce and Alternative Protein TrendsIV
21
$-
$100
$200
$300
$400
$500
$600
$700
$800
$900
2013 2014 2015 2016 Year to Date
Investment ($ millions)
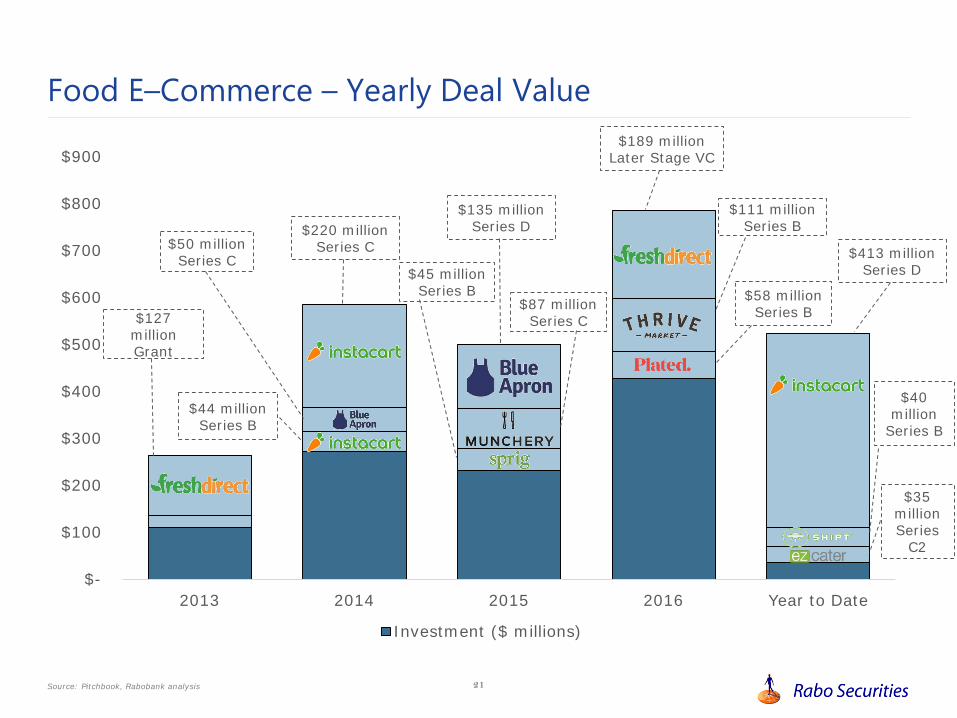
Food E–Commerce – Yearly Deal Value
Source: Pitchbook, Rabobank analysis
$127 millionGrant
$220 millionSeries C$50 million
Series C
$44 millionSeries B
$87 millionSeries C
$45 millionSeries B
$135 millionSeries D
$35 millionSeries
C2
$413 millionSeries D
$189 millionLater Stage VC
$111 millionSeries B
$58 millionSeries B
$40 million
Series B
22
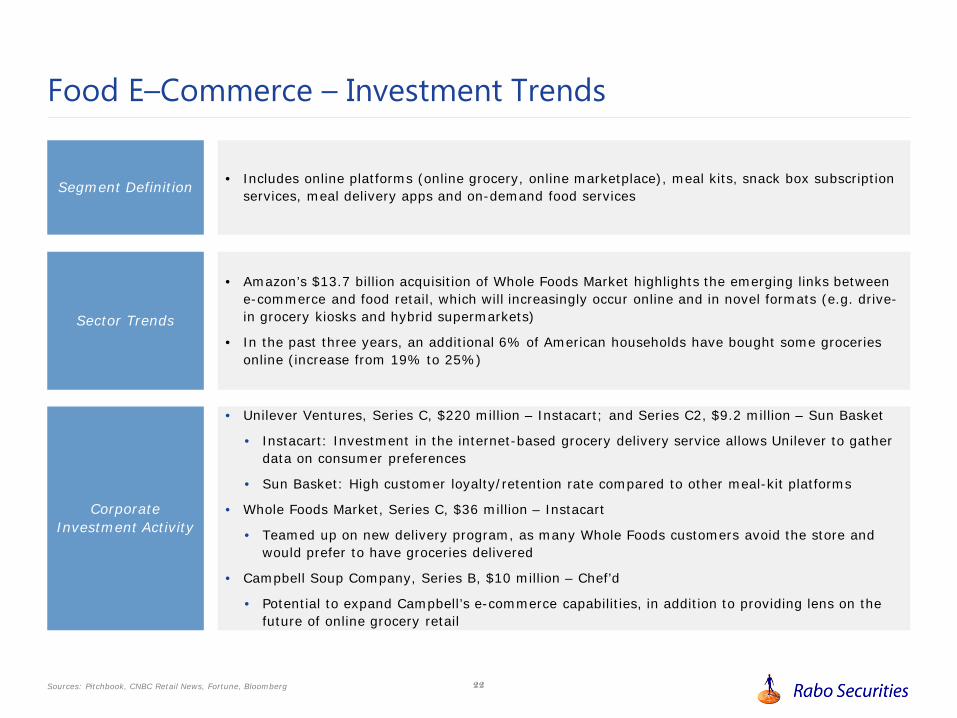
Food E–Commerce – Investment Trends
• Includes online platforms (online grocery, online marketplace), meal kits, snack box subscription services, meal delivery apps and on-demand food services
• Amazon’s $13.7 billion acquisition of Whole Foods Market highlights the emerging links between e-commerce and food retail, which will increasingly occur online and in novel formats (e.g. drive-in grocery kiosks and hybrid supermarkets)
• In the past three years, an additional 6% of American households have bought some groceries online (increase from 19% to 25%)
• Unilever Ventures, Series C, $220 million – Instacart; and Series C2, $9.2 million – Sun Basket
• Instacart: Investment in the internet-based grocery delivery service allows Unilever to gather data on consumer preferences
• Sun Basket: High customer loyalty/retention rate compared to other meal-kit platforms
• Whole Foods Market, Series C, $36 million – Instacart
• Teamed up on new delivery program, as many Whole Foods customers avoid the store and would prefer to have groceries delivered
• Campbell Soup Company, Series B, $10 million – Chef’d
• Potential to expand Campbell’s e-commerce capabilities, in addition to providing lens on the future of online grocery retail
Segment Definition
Sector Trends
Corporate Investment Activity
Sources: Pitchbook, CNBC Retail News, Fortune, Bloomberg

23
$-
$50
$100
$150
$200
$250
2013 2014 2015 2016 Year to Date
Investment ($ millions)
Alternative Protein / Novel Foods – Yearly Deal Value
Source: Pitchbook, Rabobank analysis
$27 millionSeries B
$15 millionSeries C
$23 millionSeries B
$90 millionSeries C
$38 millionSeries C
$108 millionSeries D
$100 millionSeries D
$23 millionSeries F
$17 millionSeries E
$9 millionEarly Stage
VC
$150 millionSeries E

24
Alternative Protein / Novel Foods – Investment Trends
• Includes lab-grown meat, insect-based foods, nut- and plant-based meat alternatives and plant-based dairy products
• Accelerating shift in consumer behavior in North America towards plant-based foods and other alternative proteins
• Technological breakthroughs in the space mean that consumers no longer have to compromise on taste
• Consumption of one first-generation alternative protein, soy, has grown at a CAGR of 5.1% over the past ten years (compared to 2.5% CAGR for meat)
• Tyson New Ventures, Series F, $23.5 million – Beyond Meat
• Tyson New Ventures invests in alternative protein companies that complement Tyson’s core fresh meats, poultry and prepared foods businesses
• By taking minority stakes, Tyson can survey disruptive new entrants, track changing consumer preferences and identify the most successful brands
• 301 Ventures: General Mills, Series B1, $18 million – Kite Hill
• Higher interest in companies that produce plant-based products that “taste good” - John Haugen, Vice President and general manager of 301 Inc.
Segment Definition
Sources: Pitchbook, Fortune, NYT, Kuli Kuli, Luxresearch
Sector Trends
Corporate Investment Activity
25
Contact Details
Rabo Securities USA, Inc.
New York
245 Park Avenue
New York, NY 10167
Rabobank
Eric HansenGlobal Client SolutionsManaging Director
Telephone +1 212 916 7896Email [email protected]

26
Disclaimer
This information has been prepared exclusively by Rabo Securities USA, Inc. (“Rabo Securities” or “RSI”), an operating subsidiary of Coöperative CentraleRaiffeisen-Boerenleenbank, B.A. (“Rabobank”), for the benefit and internal use of the intended recipient. Throughout this document, the use of the nameRabobank shall comprise all entities, and affiliated companies, directors, representatives or employees, to include RSI. However, with respect to thispresentation, in the U.S., any banking services are provided by Rabobank, and any securities related business is provided by RSI, a U.S. registered broker-dealer.
Neither this presentation nor any of its contents may be used for any other purpose without the prior written consent of RSI. The information and opinionscontained in this document are wholly indicative and for discussion purposes only. Neither this document nor any other statement (oral or otherwise) made atany time in connection herewith is an offer, invitation or recommendation to acquire or dispose of any securities or to enter into any transaction.
Potential counterparties are advised to independently review and/or obtain independent professional advice and draw their own conclusions regarding theeconomic benefit and risks of any potential transaction and legal, regulatory, credit, tax and accounting aspects in relation to their particular circumstances.
Distribution of this document does not oblige RSI or Rabobank to enter into any transaction. Any offer would be made at a later date and subject to contract,satisfactory documentation and market conditions. RSI may have or may in the future conduct securities and or investment banking services with companiesmentioned in this document, and may have positions in or options on securities mentioned in this document or any related investments or may buy, sell oroffer to buy or sell such securities or any related investments as principal or agent on the open market or otherwise. Rabobank may have bankingrelationships, local or otherwise, with companies mentioned in this document.
Rabo Securities USA, Inc. makes no representations as to any matter or as to the accuracy or completeness of any statements made herein or made at anytime orally or otherwise in connection herewith and all liability (in negligence or otherwise) in respect of any such matters or statements is expressly excluded,except only in the case of fraud or willful deceit.
In preparing this information, we have relied upon and assumed, without independent verification, the accuracy and completeness of all data made available tous. The information in this presentation reflects general market conditions and our judgment as of this date, all of which are subject to change.