IFAMA workshop - Economist Intelligence Unit
16
Global Food Security Index Project overview for the IFAMA workshop 18 June 2014 Sponsored by
Transcript of IFAMA workshop - Economist Intelligence Unit

Global Food Security Index Project overview
for the
IFAMA workshop
18 June 2014
Sponsored by

Overview
The Global Food Security Index:
ranks and scores 109 countries
according to their relative levels of food security
using 28 indicators from three categories: Affordability; Availability; Quality and Safety.
The index examines the effectiveness of food systems across the internationally established dimensions of food security
The index looks beyond hunger to the underlying factors that influence the ability of consumers to access sufficient amounts of safe, high-quality and affordable food.
Project goal: To establish an evaluative framework for national food systems to understand the drivers of food security
Based on a central definition: Food security exists when people at all times have physical, social and economic access to sufficient and nutritious food that meets their dietary needs for a healthy and active life.

Why an index?
The definition of a benchmarking index:
A benchmarking index is formed when individual indicators and composite indicators are compiled into a single index on the basis of an underlying model. This index reduces complex theory into a single score and measures multi-dimensional concepts that cannot be captured by a single indicator.
A benchmarking index offer a number of benefits:
Summarises complex, multidimensional realities with a view to supporting decision makers
Is easier to interpret than a combination of indicators
Can assess progress over time
Facilitates the task of ranking countries on a complex topic
Is an effective tool to communicate with policymakers and the general public
An index and food security:
Food security is a highly complex concept, encompassing multiple dimensions
An index can provide a framework to prioritise areas for intervention, monitor performance, and make the associated problems more accessible to the general public

Geographic coverage: 109 countries in 2014
Canada, Mexico, United States of America
Argentina, Bolivia, Brazil, Chile, Colombia, Costa Rica, Dominican Republic, Ecuador, El Salvador, Guatemala, Haiti, Honduras, Nicaragua, Panama, Paraguay, Peru, Uruguay, Venezuela
Angola, Benin, Botswana, Burkina Faso, Burundi, Cameroon, Chad, Cote d’Ivoire, Congo, Ethiopia, Ghana, Guinea, Kenya, Madagascar, Malawi, Mali, Mozambique, Niger, Nigeria, Rwanda, Senegal, Sierra Leone, South Africa, Sudan, Tanzania, Togo, Uganda, Zambia
Austria, Belarus, Belgium, Bulgaria, Czech Republic, Denmark, Finland, France, Germany, Greece, Hungary, Italy, Ireland, Netherlands, Norway, Poland, Portugal, Romania, Russia, Serbia, Slovakia, Spain, Sweden, Switzerland, Ukraine, UK
Australia, Azerbaijan, Bangladesh, Cambodia, China, India, Indonesia, Japan, Kazakhstan, Malaysia, Myanmar, Nepal, New Zealand, Pakistan, Philippines, Saudi Arabia, Singapore, South Korea, Sri Lanka, Tajikistan, Thailand, Uzbekistan, Vietnam
Algeria, Egypt, Israel, Jordan, Kuwait, Morocco, Saudi Arabia, Syria, Tunisia, Turkey, UAE, Yemen

Index
Availability
Quality & Safety
Affordability
Index framework
External Adjustment
Diet diversification
Nutritional standards
Micronutrient availability
Protein quality
Food safety
Food consumption as a share of household expenditure
Proportion of population under global poverty line
GDP per capita, $US, PPP
Agricultural import tariffs
Presence of food safety nets
Access to finance for farmers
Sufficiency of supply
Public expenditure on agricultural R&D Agricultural infrastructure
Volatility of agricultural production
Political stability risk
Corruption
Urban absorption capacity
Food loss
Food Price Adjustment Factor
FAO global food price index
adjusted for income growth,
exchange rates and a pass-
through coefficient of global to
national food prices on a
quarterly basis
Applied to Affordability score
Latest release: 22 April 2014
* Composite indicators are bolded.

Index framework: Affordability
Indicator Source Year
Food consumption as a proportion of total household expenditure
FAO; UN; EIU Latest available year in 1990-2014
Proportion of population living under or close to the global poverty line
World Bank, World Development Indicators; UN Development Programme (UNDP)
Latest available year in 2001-11
GDP per capita (at PPP, exchange rates) EIU 2013
Agricultural import tariffs WTO Latest available year in 2009-12
Presence of food safety net programmes
Qualitative scoring by EIU
Access to financing for farmers Qualitative scoring by EIU
The food affordability category measures the ability of consumers to purchase food and the relative costs they may face under both normal circumstances and food-related shocks.
The GFSI looks at Affordability through two primary lenses–whether an average individual has sufficient means to purchase food and the public structures that have established to respond to personal or societal shocks.

Index framework: Availability
The availability category assesses factors that influence the supply of food and the ease of access within a country.
Availability examines how structural elements determine a country’s capacity to produce and distribute food and explores aspects that might create bottlenecks or risks to sufficient availability.
Indicator Source Year
Sufficiency of supply* FAO; WFP; OECD 2006-12
Public expenditure on agricultural R&D EIU based on OECD, WB, ASTI Latest available year in 2001-13
Agricultural infrastructure** EIU; WB; qualitative scoring by EIU 2007-14
Volatility of agricultural production FAO; EIU calculations 1992-2011
Political stability risk EIU 2014
Corruption EIU 2014
Urban absorption capacity EIU; World Bank, World Development Indicators
2012-14
Food loss EIU: FAO 2009
*Composite indicator of average food supply and dependency on chronic food aid.
** Composite indicator of existence of adequate crop storage facilities, road infrastructure and port infrastructure.

Index framework: Quality & Safety
The Quality & Safety category assesses the variety and nutritional quality of average diets, as well as the safety of food.
This category moves beyond the focus of traditional welfare metrics, which are normally related to accessibility, to explore the overall quality of food supplies based on the understanding that food security requires access to nutritious food to meet dietary needs.
Indicator Source Year
Diet diversification FAO 2008-10
Nutritional standards* Qualitative scoring by EIU Latest available year in 1996-2014
Micronutrient availability** FAO 2005-07
Protein quality FAO; WHO; USDA Nutrient database; EIU calculation
2005-10
Food safety*** WHO; qualitative scoring by EIU Latest available in 2007-14
*Composite indicator of existence of national dietary guidelines, existence of national nutrition plan or strategy, and existence of regular nutrition monitoring and surveillance.
** Composite indicator of dietary availability of vitamin A, animal iron and vegetal iron.
***Composite indicator of existence of an agency to ensure health/safety of food, access to potable water and presence of a formal grocery sector.

Using the Index: Overview
GFSI is an evaluative tool for a range of stakeholders who seek to develop an evidence-based approach:
To determining a country’s and region’s strengths and weaknesses within the relevant context
To understand indicators that drive high and low scores in each categories with empirical backup
To identify policy steps that need to be undertaken
Specifically, the GFSI seeks to establish:
The factors affecting food security and the
relationship between them A common data set for a set of countries that
represent over 90% of global population
How countries can improve food systems to reduce food insecurity
Priority areas for each country (eg. trade
policy, infrastructure, agricultural R&D)

Using the Index: Identifying trends
Year-on-year trend analysis can be used to identify and understand dynamic factors of food security.
The GFSI provides year-on-year trends that show how countries have improved or declined overall and across each category and indicator.
Trends analysis highlights:
Areas of improvement
Policy successes and failures
Best practices for improving food security
Overall Score
GDP per Capita (PPP)

Workshop agenda
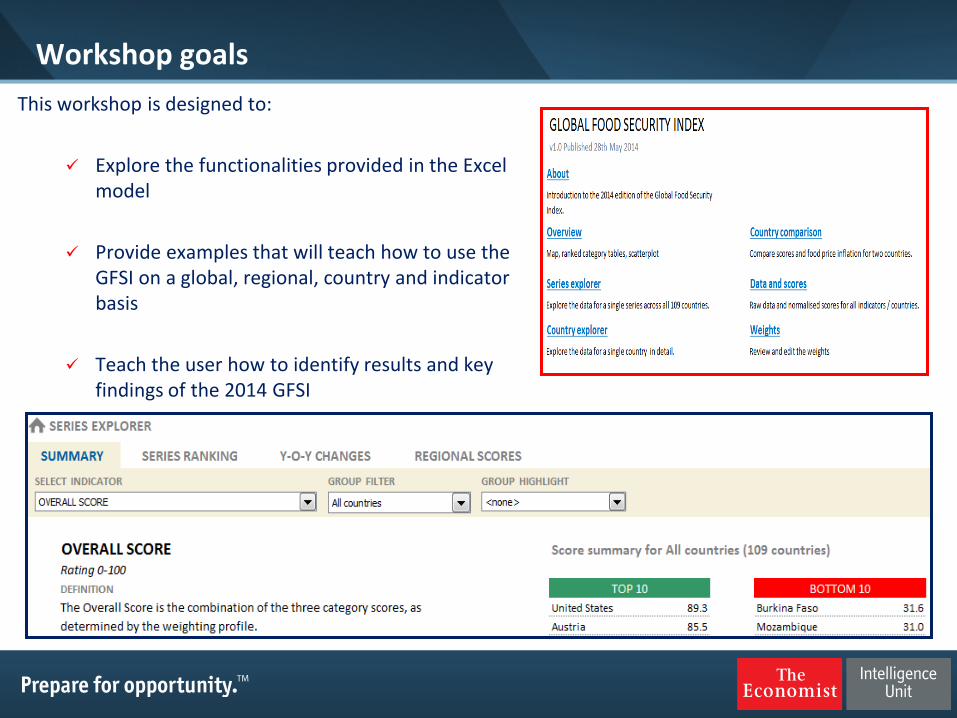
Workshop goals
This workshop is designed to:
Explore the functionalities provided in the Excel model
Provide examples that will teach how to use the GFSI on a global, regional, country and indicator basis
Teach the user how to identify results and key findings of the 2014 GFSI

Workshop materials
Each table has copies of the following materials:
The 2014 Excel model workbook, which is uploaded on the laptops
Table questions, which provide all of the questions that will guide you through the workshop
exercise
Workbook model instructions, which provide a visual explanation of the functionality of the
Excel model
A user guide that lays out the variety of ways the Excel model workbook can be utilised

Model overview: Functionality
The GFSI Excel model has four modules and two additional sections for data analysis:
Overview: displays the overall results from the index through a Map, Category Rankings and a Scatterplot
Series Explorer: provides the most in-depth view of the individual indicators in the index and their definitions with Summary, Series Rankings, Y-O-Y Changes and Regional Scores sub-tabs
Country Explorer: explore data on a country-
specific basis through Country Profile, Indicator Scores, Y-O-Y Changes, Score Table and Data Table sub-tabs
Country Comparison: allows the results of two countries to be compared and contains Summary, Indicator Scores and Food Price Inflation sub-tabs
Data: presents all raw data, normalised scores and data years in a tabular form for all countries, regions and income levels
Weights: shows the weights assigned to each indicator and category that are used to calculate scores and ranks in the GFSI

Contact information
Pat Thaker Regional Director, Middle East & North Africa Economist Intelligence Unit Email: [email protected] Joshua Grundleger Analyst, Custom Research, Americas Economist Intelligence Unit Email: [email protected]
The 2014 GFSI can be found at:
http://foodsecurityindex.eiu.com

Further information
The Economist Intelligence Unit will be available later today to answer any additional questions and provide access to the 2014 GFSI model and interactive tool Time: Today, June 18th between 1:00pm and 3:15pm
Location: This room
Additional materials, including the interactive tool, reports and presentation materials, are available online to be downloaded for free http://foodsecurityindex.eiu.com