
Commercial and Industry Trends Presentation, American Beverage ...
51
Place content here Say whatever you would like to say TITLE Place content here Say whatever you would like to say TITLE TITLE IN ALL CAPS DOUBLE LINED COMMERCIAL AND INDUSTRY TRENDS – STRATEGIES TO GET AHEAD By Harry Kohlmann, Ph.D. American Beverage Licensees – Annual Convention June 2014 Park Street Companies | 1000 Brickell Avenue, Suite 915 | Miami FL, 33131 +1 305 967 7440 | [email protected] | www.parkstreet.com No part of the document may be circulated, quoted, or reproduced for distribution without prior written approval from Park Street. This material was used by Park Street during an oral presentation; it is not a complete record of the discussion.
Transcript of Commercial and Industry Trends Presentation, American Beverage ...
Place content here
Say whatever you would like to say
TITLE
Place content here
Say whatever you would like to say
TITLE
Some fun shapes to use
TITLE IN ALL CAPS
DOUBLE LINED
COMMERCIAL AND INDUSTRY TRENDS – STRATEGIES TO GET AHEAD
By Harry Kohlmann, Ph.D.
American Beverage Licensees – Annual Convention June 2014
Park Street Companies | 1000 Brickell Avenue, Suite 915 | Miami FL, 33131 +1 305 967 7440 | [email protected] | www.parkstreet.com
No part of the document may be circulated, quoted, or reproduced for distribution without prior written approval from Park Street. This material was used by Park Street during an oral presentation; it is not a complete record of the discussion.
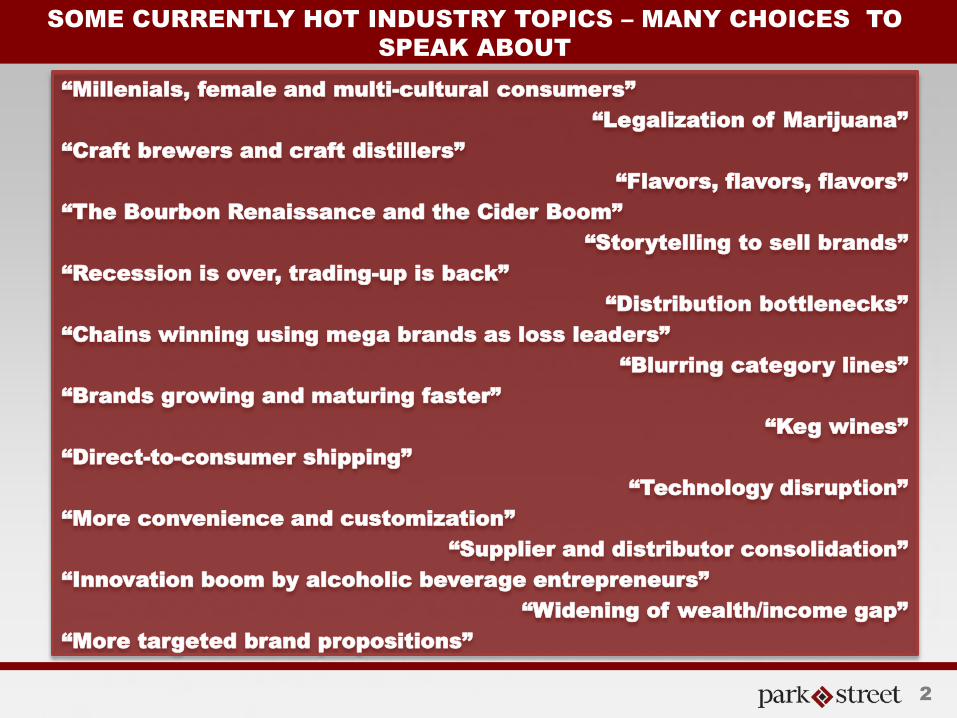
SOME CURRENTLY HOT INDUSTRY TOPICS – MANY CHOICES TO
SPEAK ABOUT
2
“Millenials, female and multi-cultural consumers”
“Legalization of Marijuana”
“Craft brewers and craft distillers”
“Flavors, flavors, flavors”
“The Bourbon Renaissance and the Cider Boom”
“Storytelling to sell brands”
“Recession is over, trading-up is back”
“Distribution bottlenecks”
“Chains winning using mega brands as loss leaders”
“Blurring category lines”
“Brands growing and maturing faster”
“Keg wines”
“Direct-to-consumer shipping”
“Technology disruption”
“More convenience and customization”
“Supplier and distributor consolidation”
“Innovation boom by alcoholic beverage entrepreneurs”
“Widening of wealth/income gap”
“More targeted brand propositions”
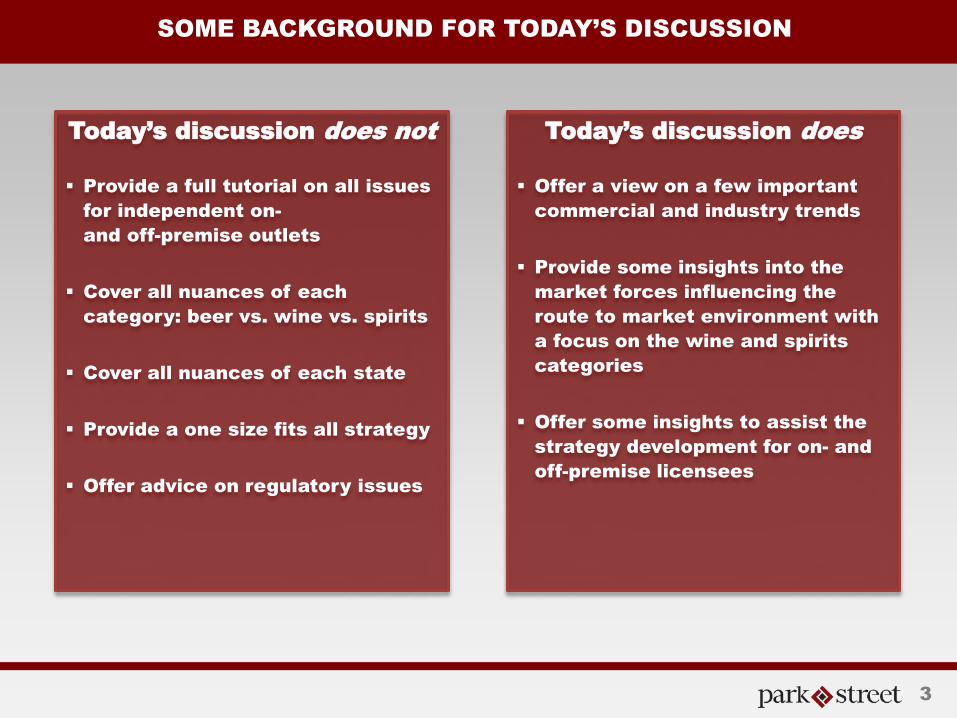
SOME BACKGROUND FOR TODAY’S DISCUSSION
3
Today’s discussion does not
Provide a full tutorial on all issues
for independent on-
and off-premise outlets
Cover all nuances of each
category: beer vs. wine vs. spirits
Cover all nuances of each state
Provide a one size fits all strategy
Offer advice on regulatory issues
Today’s discussion does
Offer a view on a few important
commercial and industry trends
Provide some insights into the
market forces influencing the
route to market environment with
a focus on the wine and spirits
categories
Offer some insights to assist the
strategy development for on- and
off-premise licensees
TITLE IN ALL CAPS
DOUBLE LINED
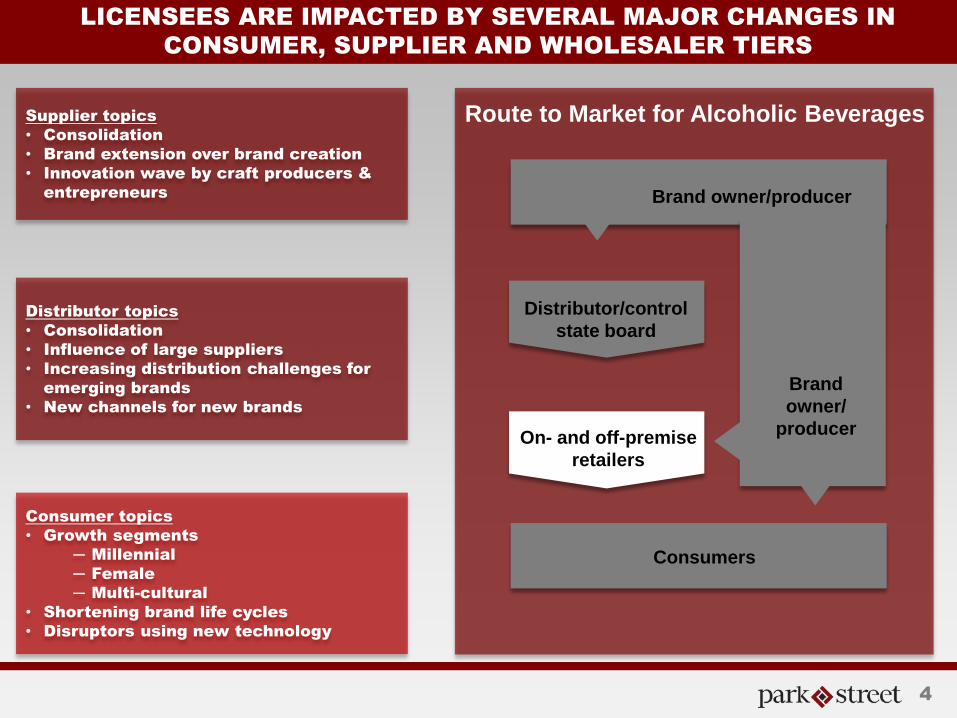
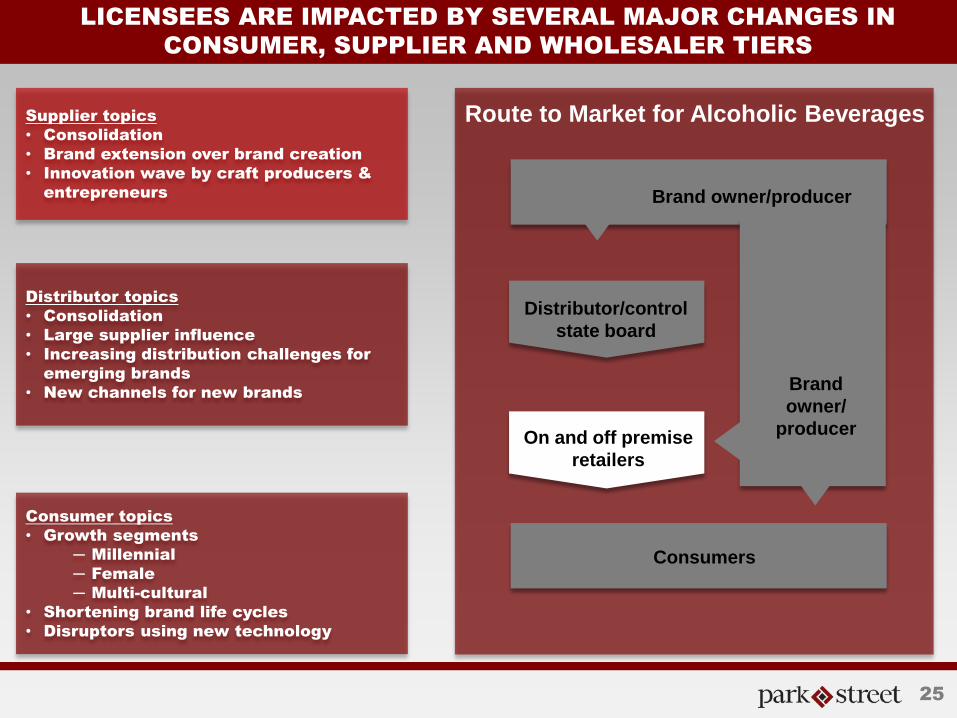
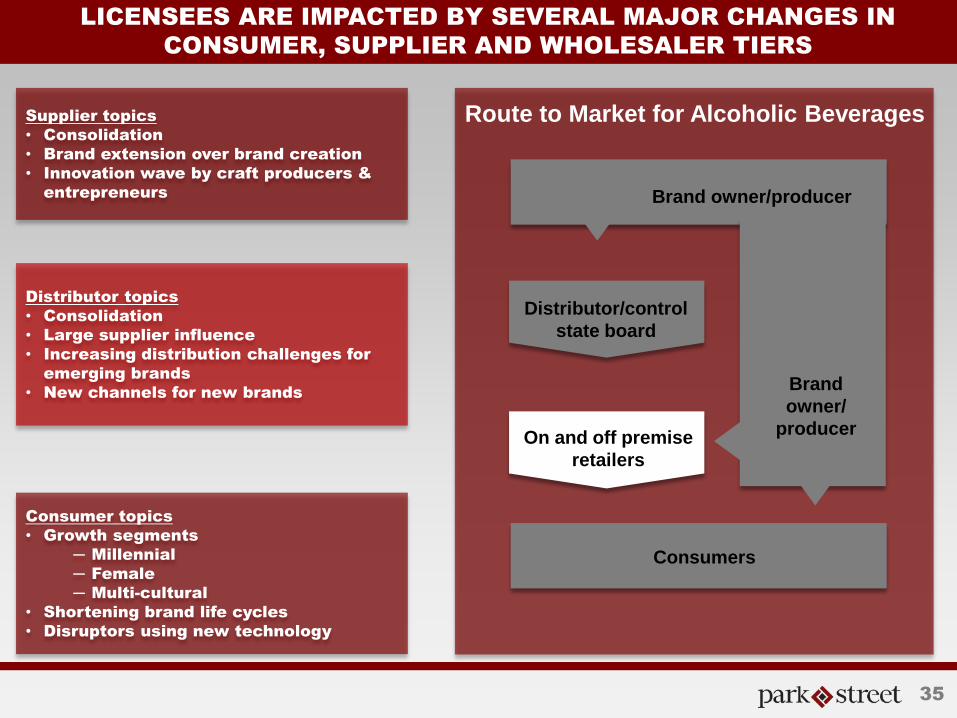
LICENSEES ARE IMPACTED BY SEVERAL MAJOR CHANGES IN
CONSUMER, SUPPLIER AND WHOLESALER TIERS
Route to Market for Alcoholic Beverages
Consumers
Distributor/control state board
On- and off-premise retailers
Brand owner/producer
Brand owner/
producer
4
Consumer topics
• Growth segments
─ Millennial
─ Female
─ Multi-cultural
• Shortening brand life cycles
• Disruptors using new technology
Supplier topics
• Consolidation
• Brand extension over brand creation
• Innovation wave by craft producers &
entrepreneurs
Distributor topics
• Consolidation
• Influence of large suppliers
• Increasing distribution challenges for
emerging brands
• New channels for new brands
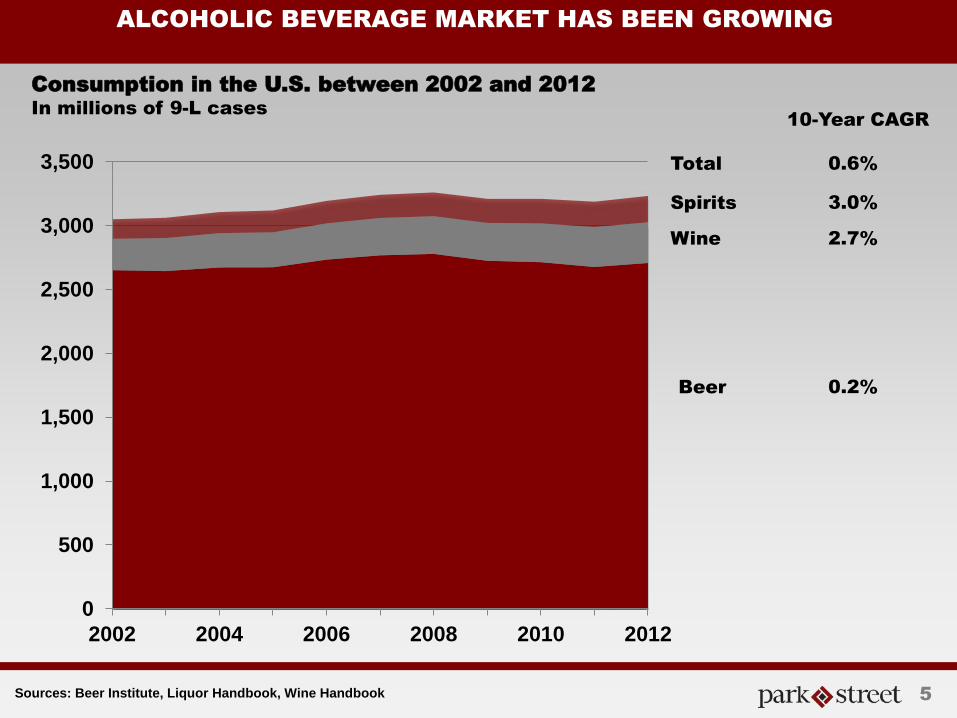
ALCOHOLIC BEVERAGE MARKET HAS BEEN GROWING
0
500
1,000
1,500
2,000
2,500
3,000
3,500
2002 2004 2006 2008 2010 2012
Consumption in the U.S. between 2002 and 2012
In millions of 9-L cases 10-Year CAGR
Beer
Wine
Spirits
5
3.0%
2.7%
0.2%
0.6% Total
Sources: Beer Institute, Liquor Handbook, Wine Handbook
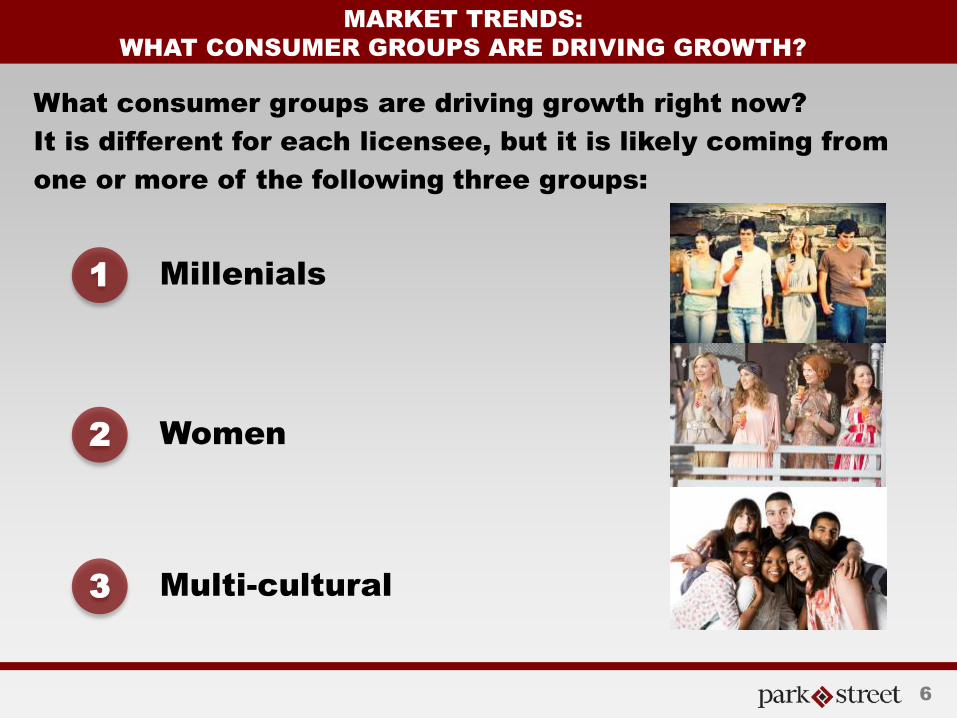
MARKET TRENDS:
WHAT CONSUMER GROUPS ARE DRIVING GROWTH?
What consumer groups are driving growth right now?
It is different for each licensee, but it is likely coming from
one or more of the following three groups:
1 Millenials
2 Women
3 Multi-cultural
6
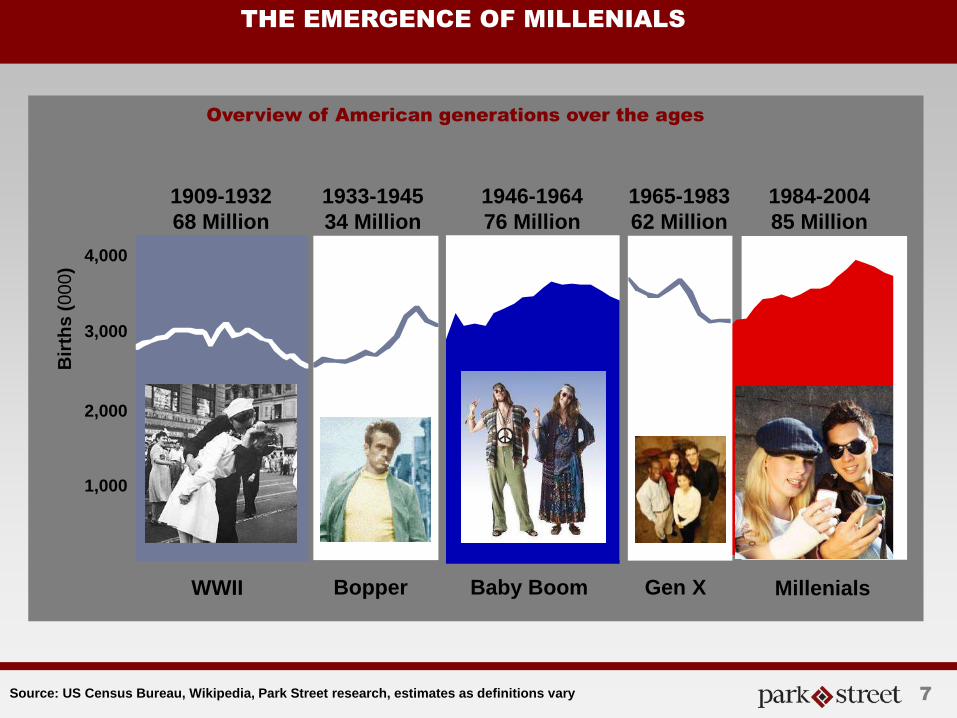
THE EMERGENCE OF MILLENIALS
7 Source: US Census Bureau, Wikipedia, Park Street research, estimates as definitions vary
1,000
2,000
3,000
1,000
2,000
3,000
4,000
1909-1932 68 Million
Bir
ths
(000
)
1933-1945 34 Million
1946-1964 76 Million
WWII Bopper Baby Boom
1965-1983 62 Million
Gen X Millenials
1984-2004 85 Million
Overview of American generations over the ages
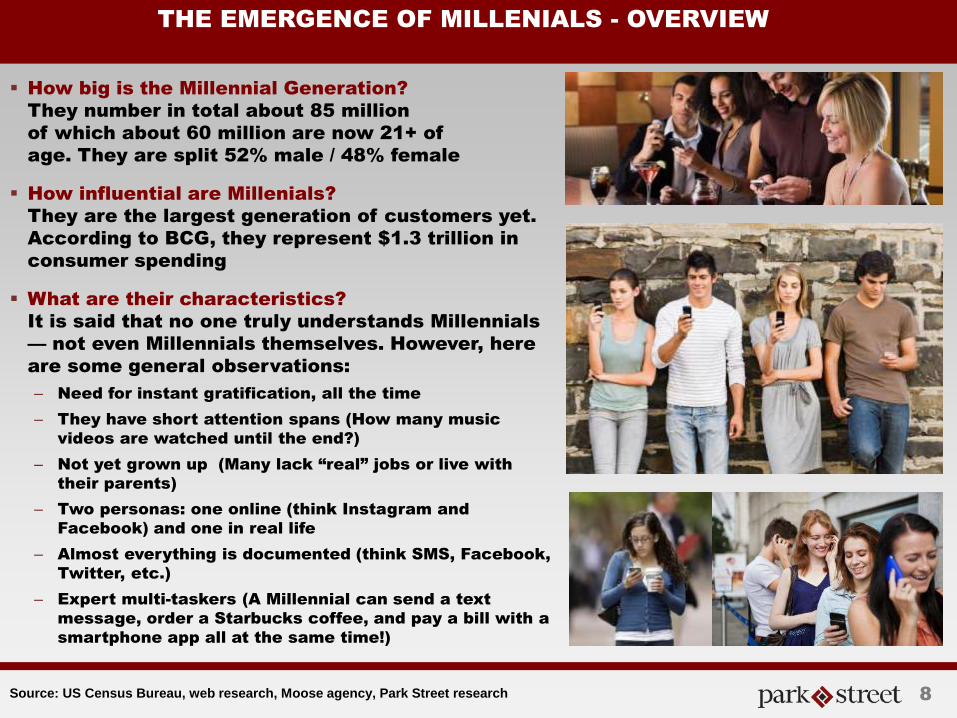
THE EMERGENCE OF MILLENIALS - OVERVIEW
How big is the Millennial Generation?
They number in total about 85 million
of which about 60 million are now 21+ of
age. They are split 52% male / 48% female
How influential are Millenials?
They are the largest generation of customers yet.
According to BCG, they represent $1.3 trillion in
consumer spending
What are their characteristics?
It is said that no one truly understands Millennials
— not even Millennials themselves. However, here
are some general observations:
– Need for instant gratification, all the time
– They have short attention spans (How many music
videos are watched until the end?)
– Not yet grown up (Many lack “real” jobs or live with
their parents)
– Two personas: one online (think Instagram and
Facebook) and one in real life
– Almost everything is documented (think SMS, Facebook,
Twitter, etc.)
– Expert multi-taskers (A Millennial can send a text
message, order a Starbucks coffee, and pay a bill with a
smartphone app all at the same time!)
8 Source: US Census Bureau, web research, Moose agency, Park Street research
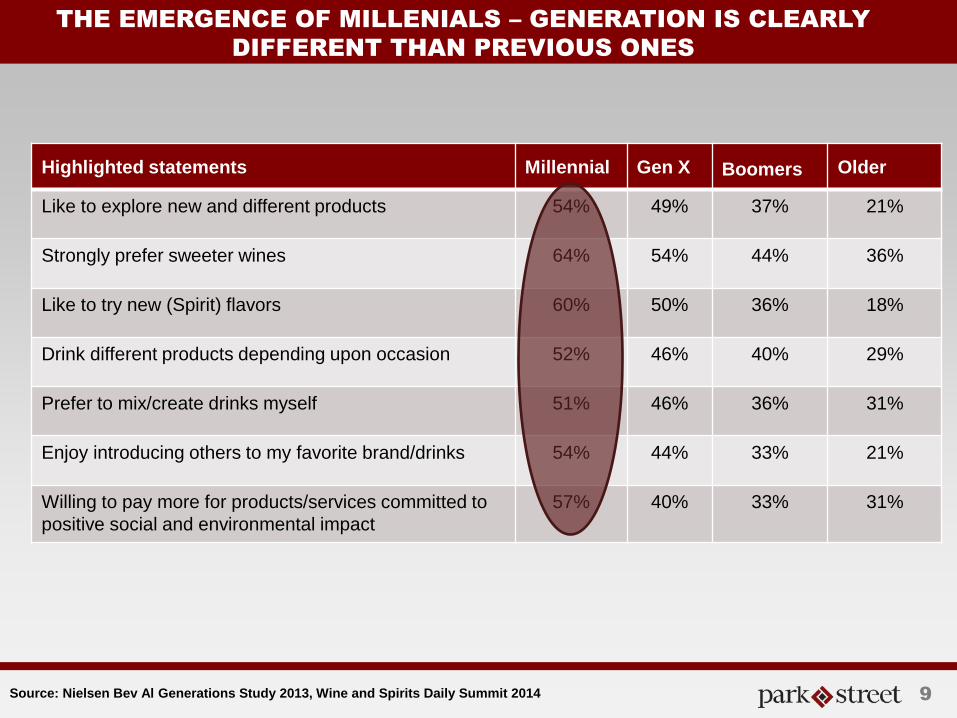
THE EMERGENCE OF MILLENIALS – GENERATION IS CLEARLY
DIFFERENT THAN PREVIOUS ONES
Highlighted statements Millennial Gen X Boomers Older
Like to explore new and different products 54% 49% 37% 21%
Strongly prefer sweeter wines 64% 54% 44% 36%
Like to try new (Spirit) flavors 60% 50% 36% 18%
Drink different products depending upon occasion 52% 46% 40% 29%
Prefer to mix/create drinks myself 51% 46% 36% 31%
Enjoy introducing others to my favorite brand/drinks 54% 44% 33% 21%
Willing to pay more for products/services committed to positive social and environmental impact
57% 40% 33% 31%
Source: Nielsen Bev Al Generations Study 2013, Wine and Spirits Daily Summit 2014 9
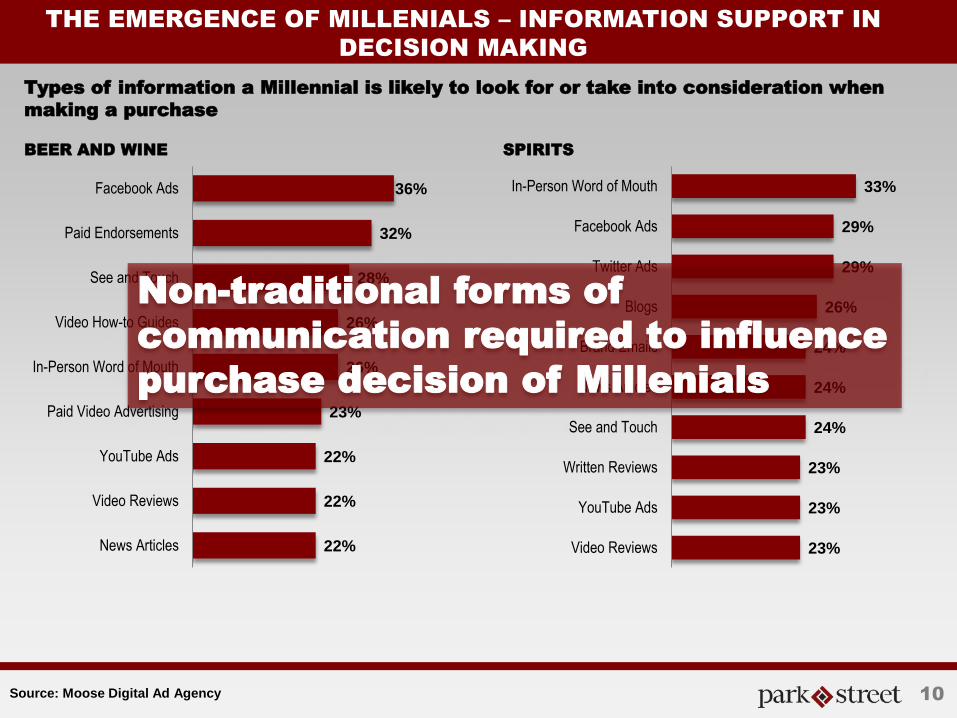
THE EMERGENCE OF MILLENIALS – INFORMATION SUPPORT IN
DECISION MAKING
10
36%
32%
28%
26%
26%
23%
22%
22%
22%
Facebook Ads
Paid Endorsements
See and Touch
Video How-to Guides
In-Person Word of Mouth
Paid Video Advertising
YouTube Ads
Video Reviews
News Articles
33%
29%
29%
26%
24%
24%
24%
23%
23%
23%
In-Person Word of Mouth
Facebook Ads
Twitter Ads
Blogs
Brand Emails
News Articles
See and Touch
Written Reviews
YouTube Ads
Video Reviews
SPIRITS BEER AND WINE
Source: Moose Digital Ad Agency
Non-traditional forms of
communication required to influence
purchase decision of Millenials
Types of information a Millennial is likely to look for or take into consideration when
making a purchase
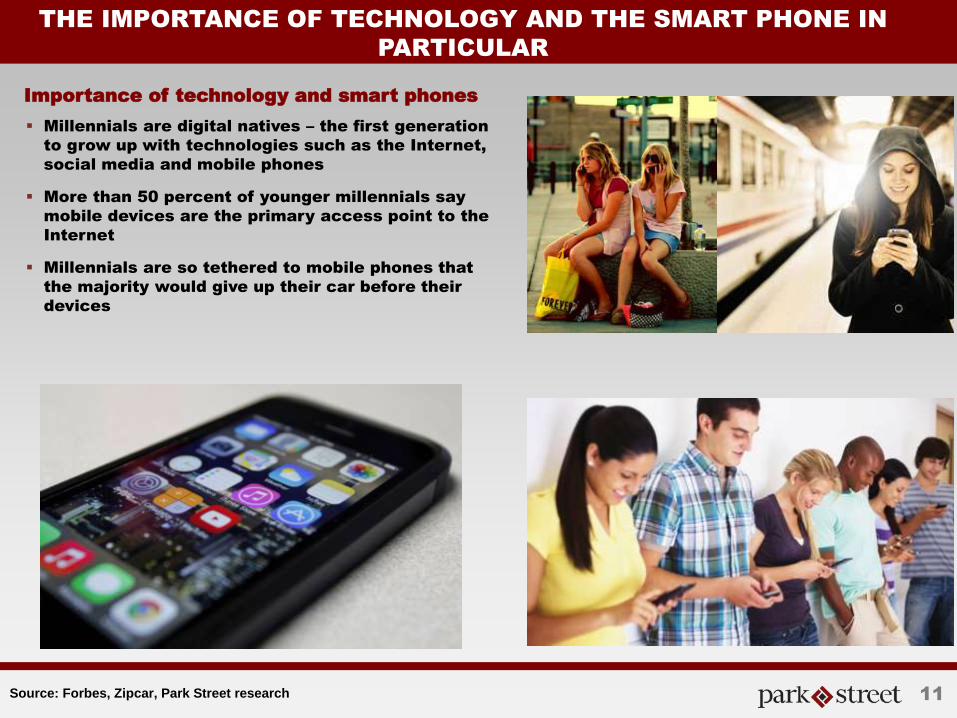
THE IMPORTANCE OF TECHNOLOGY AND THE SMART PHONE IN
PARTICULAR
Importance of technology and smart phones
Millennials are digital natives – the first generation
to grow up with technologies such as the Internet,
social media and mobile phones
More than 50 percent of younger millennials say
mobile devices are the primary access point to the
Internet
Millennials are so tethered to mobile phones that
the majority would give up their car before their
devices
Source: Forbes, Zipcar, Park Street research 11
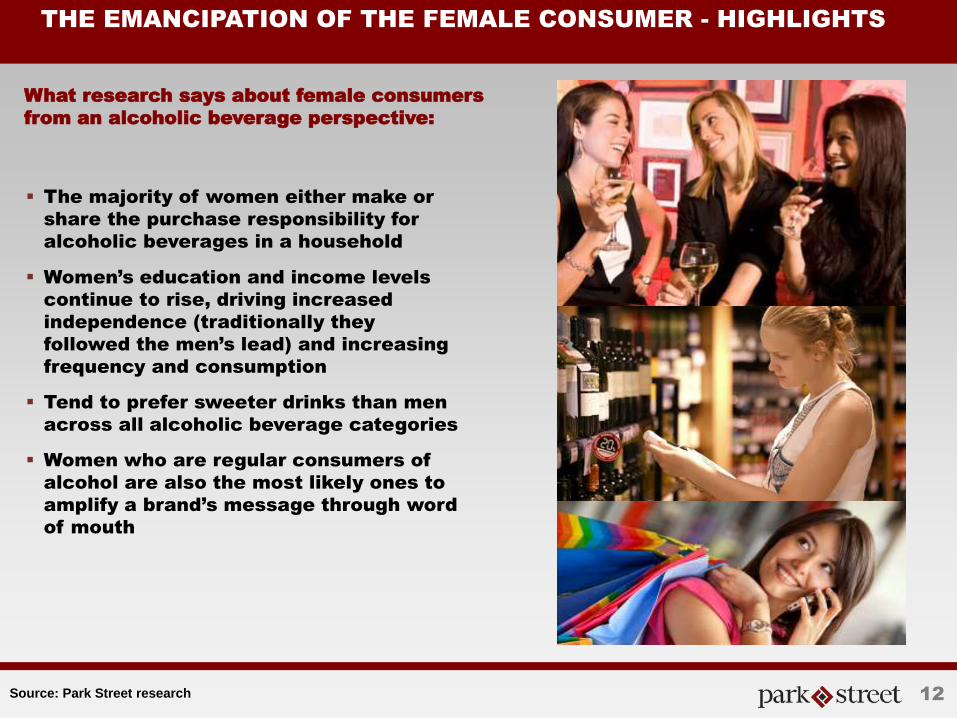
THE EMANCIPATION OF THE FEMALE CONSUMER - HIGHLIGHTS
12
The majority of women either make or
share the purchase responsibility for
alcoholic beverages in a household
Women’s education and income levels
continue to rise, driving increased
independence (traditionally they
followed the men’s lead) and increasing
frequency and consumption
Tend to prefer sweeter drinks than men
across all alcoholic beverage categories
Women who are regular consumers of
alcohol are also the most likely ones to
amplify a brand’s message through word
of mouth
What research says about female consumers
from an alcoholic beverage perspective:
Source: Park Street research
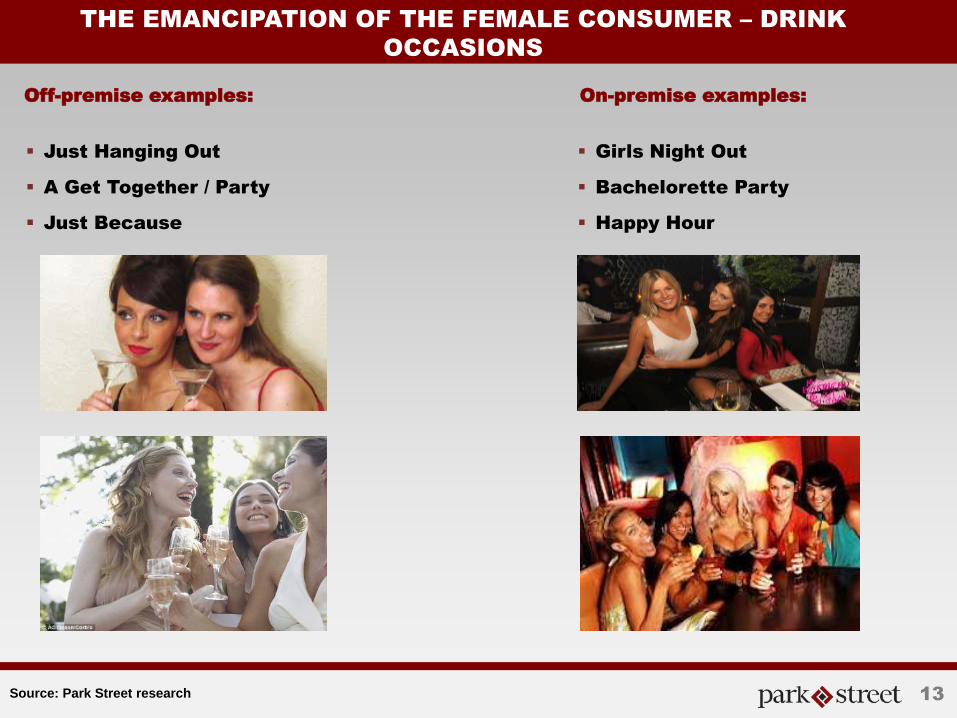
THE EMANCIPATION OF THE FEMALE CONSUMER – DRINK
OCCASIONS
13
Off-premise examples: On-premise examples:
Just Hanging Out
A Get Together / Party
Just Because
Girls Night Out
Bachelorette Party
Happy Hour
Source: Park Street research
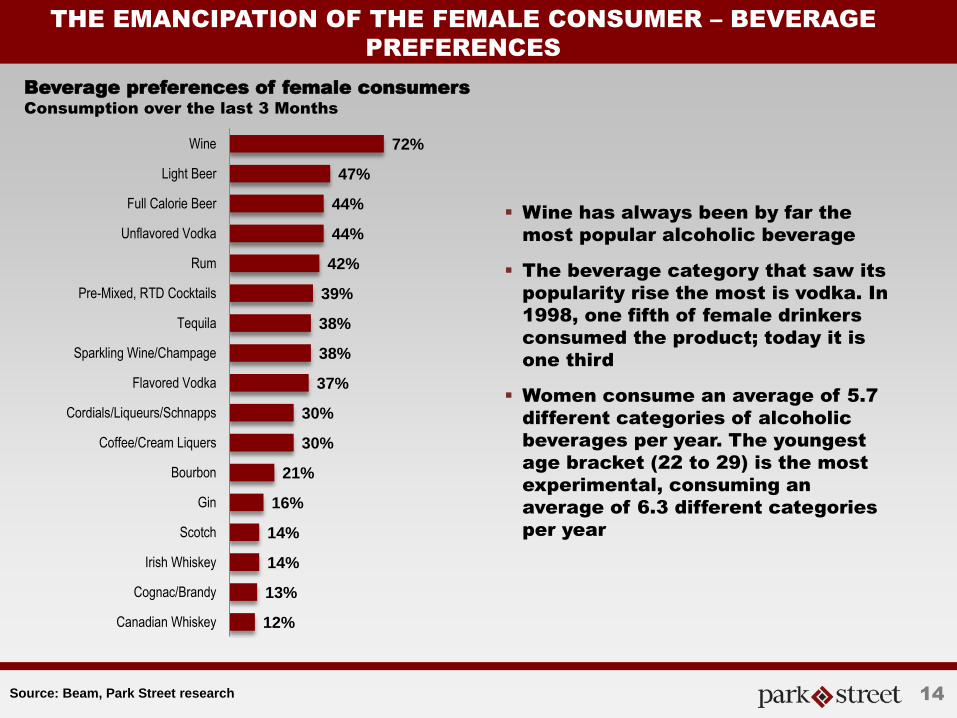
THE EMANCIPATION OF THE FEMALE CONSUMER – BEVERAGE
PREFERENCES
14
72%
47%
44%
44%
42%
39%
38%
38%
37%
30%
30%
21%
16%
14%
14%
13%
12%
Wine
Light Beer
Full Calorie Beer
Unflavored Vodka
Rum
Pre-Mixed, RTD Cocktails
Tequila
Sparkling Wine/Champage
Flavored Vodka
Cordials/Liqueurs/Schnapps
Coffee/Cream Liquers
Bourbon
Gin
Scotch
Irish Whiskey
Cognac/Brandy
Canadian Whiskey
Beverage preferences of female consumers
Consumption over the last 3 Months
Wine has always been by far the
most popular alcoholic beverage
The beverage category that saw its
popularity rise the most is vodka. In
1998, one fifth of female drinkers
consumed the product; today it is
one third
Women consume an average of 5.7
different categories of alcoholic
beverages per year. The youngest
age bracket (22 to 29) is the most
experimental, consuming an
average of 6.3 different categories
per year
Source: Beam, Park Street research
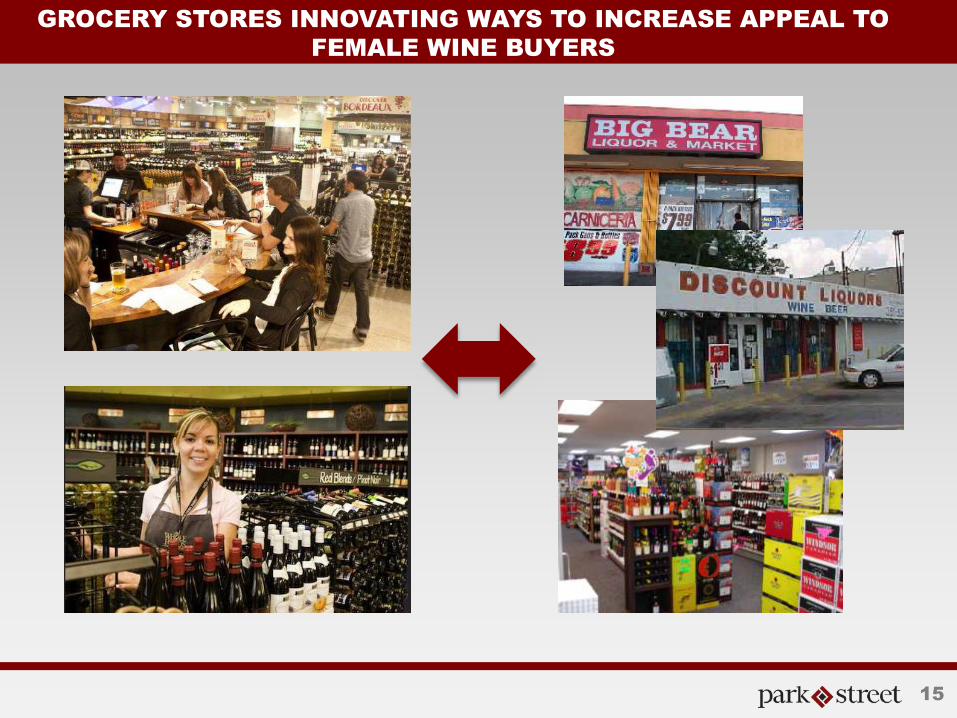
GROCERY STORES INNOVATING WAYS TO INCREASE APPEAL TO
FEMALE WINE BUYERS
15
MARKET TRENDS:
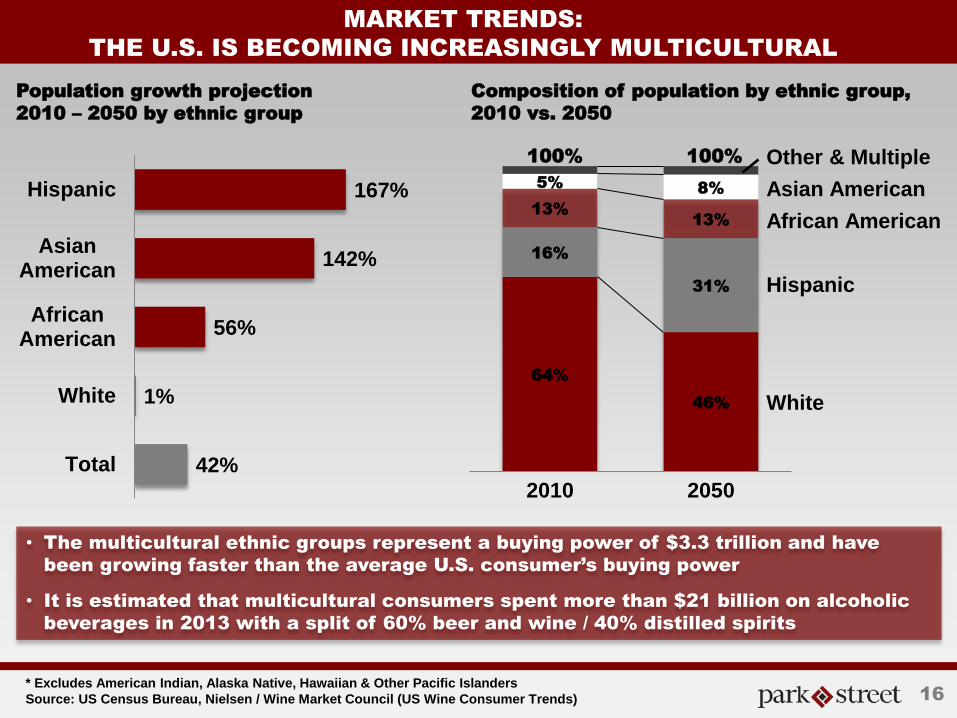
THE U.S. IS BECOMING INCREASINGLY MULTICULTURAL
16
167%
142%
56%
1%
42%
Hispanic
AsianAmerican
AfricanAmerican
White
Total
Population growth projection
2010 – 2050 by ethnic group
Composition of population by ethnic group,
2010 vs. 2050
64%
46%
16%
31%
13%
13%
5% 8%
2010 2050
White
Hispanic
Asian American
African American
Other & Multiple 100% 100%
* Excludes American Indian, Alaska Native, Hawaiian & Other Pacific Islanders Source: US Census Bureau, Nielsen / Wine Market Council (US Wine Consumer Trends)
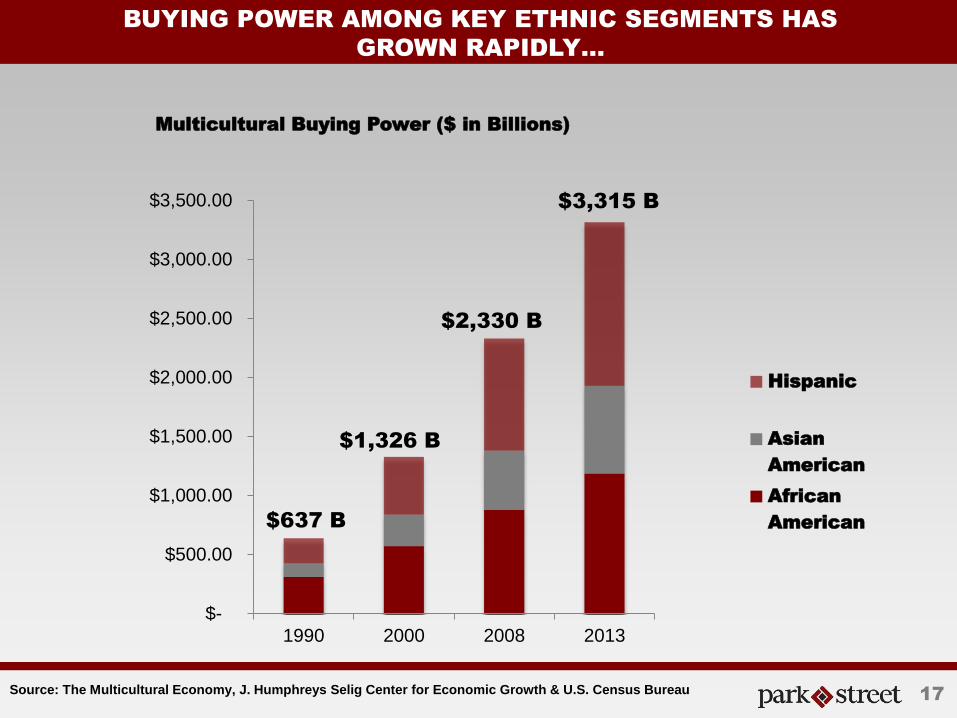
• The multicultural ethnic groups represent a buying power of $3.3 trillion and have
been growing faster than the average U.S. consumer’s buying power
• It is estimated that multicultural consumers spent more than $21 billion on alcoholic
beverages in 2013 with a split of 60% beer and wine / 40% distilled spirits
TITLE IN ALL CAPS
DOUBLE LINED
BUYING POWER AMONG KEY ETHNIC SEGMENTS HAS
GROWN RAPIDLY…
Source: The Multicultural Economy, J. Humphreys Selig Center for Economic Growth & U.S. Census Bureau
Multicultural Buying Power ($ in Billions)
$-
$500.00
$1,000.00
$1,500.00
$2,000.00
$2,500.00
$3,000.00
$3,500.00
1990 2000 2008 2013
Hispanic
Asian
American
African
American
$3,315 B
$2,330 B
$1,326 B
$637 B
17
TITLE IN ALL CAPS
DOUBLE LINED
AND HAS GROWN FASTER THAN THE AVERAGE U.S.
CONSUMER’S BUYING POWER
Source: The Multicultural Economy, J. Humphreys Selig Center for Economic Growth & U.S. Census Bureau
Multicultural Buying Power Growth (in %)
0.00%
1.00%
2.00%
3.00%
4.00%
5.00%
6.00%
7.00%
8.00%
9.00%
10.00%
Multicultural Buying Power Growth (2008-2013)
Total Population
African American
Asian American
Hispanic
5.1% 5.5%
8.3%
8.7%
18
19
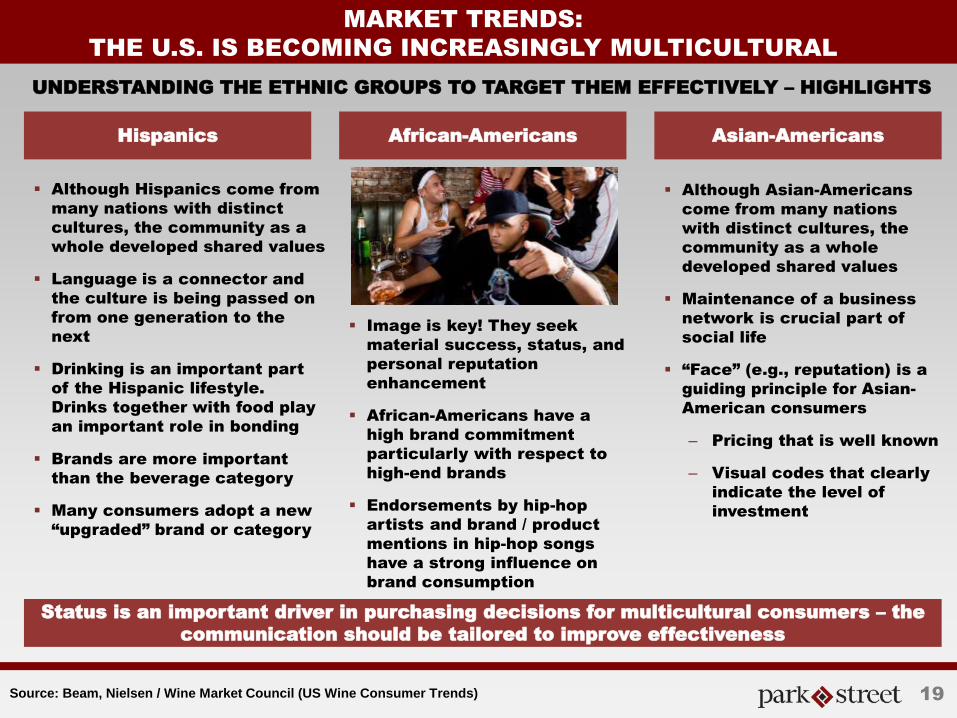
MARKET TRENDS:
THE U.S. IS BECOMING INCREASINGLY MULTICULTURAL
UNDERSTANDING THE ETHNIC GROUPS TO TARGET THEM EFFECTIVELY – HIGHLIGHTS
Hispanics African-Americans Asian-Americans
Although Asian-Americans
come from many nations
with distinct cultures, the
community as a whole
developed shared values
Maintenance of a business
network is crucial part of
social life
“Face” (e.g., reputation) is a
guiding principle for Asian-
American consumers
– Pricing that is well known
– Visual codes that clearly
indicate the level of
investment
Image is key! They seek
material success, status, and
personal reputation
enhancement
African-Americans have a
high brand commitment
particularly with respect to
high-end brands
Endorsements by hip-hop
artists and brand / product
mentions in hip-hop songs
have a strong influence on
brand consumption
Although Hispanics come from
many nations with distinct
cultures, the community as a
whole developed shared values
Language is a connector and
the culture is being passed on
from one generation to the
next
Drinking is an important part
of the Hispanic lifestyle.
Drinks together with food play
an important role in bonding
Brands are more important
than the beverage category
Many consumers adopt a new
“upgraded” brand or category
Source: Beam, Nielsen / Wine Market Council (US Wine Consumer Trends)
Status is an important driver in purchasing decisions for multicultural consumers – the
communication should be tailored to improve effectiveness
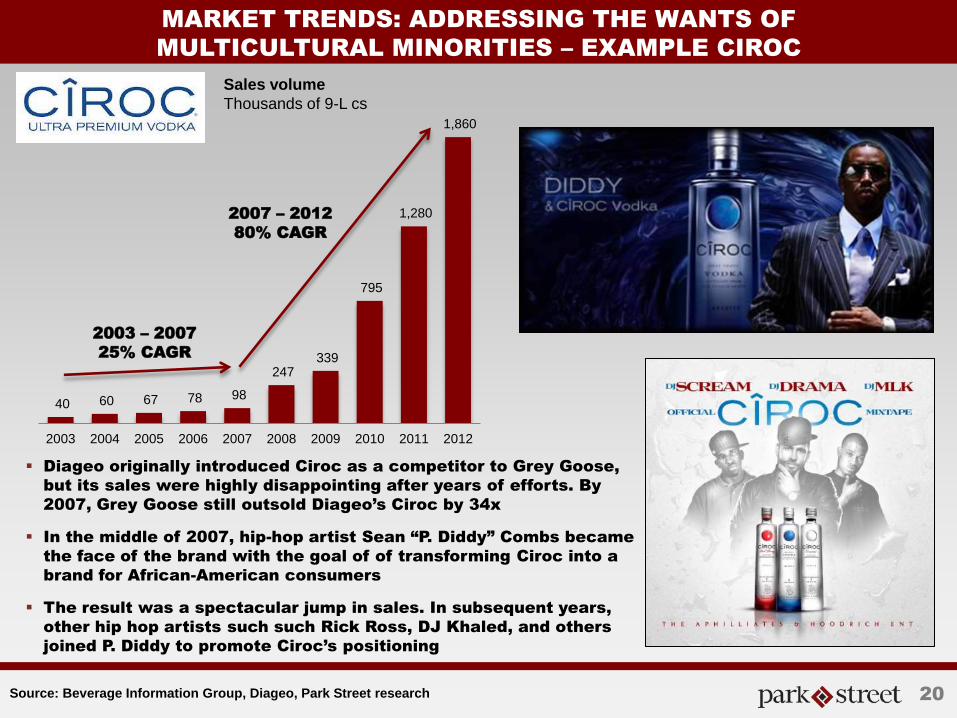
MARKET TRENDS: ADDRESSING THE WANTS OF
MULTICULTURAL MINORITIES – EXAMPLE CIROC
20
40 60 67 78 98
247 339
795
1,280
1,860
2003 2004 2005 2006 2007 2008 2009 2010 2011 2012
2003 – 2007
25% CAGR
2007 – 2012
80% CAGR
Sales volume Thousands of 9-L cs
Diageo originally introduced Ciroc as a competitor to Grey Goose,
but its sales were highly disappointing after years of efforts. By
2007, Grey Goose still outsold Diageo’s Ciroc by 34x
In the middle of 2007, hip-hop artist Sean “P. Diddy” Combs became
the face of the brand with the goal of of transforming Ciroc into a
brand for African-American consumers
The result was a spectacular jump in sales. In subsequent years,
other hip hop artists such such Rick Ross, DJ Khaled, and others
joined P. Diddy to promote Ciroc’s positioning
Source: Beverage Information Group, Diageo, Park Street research
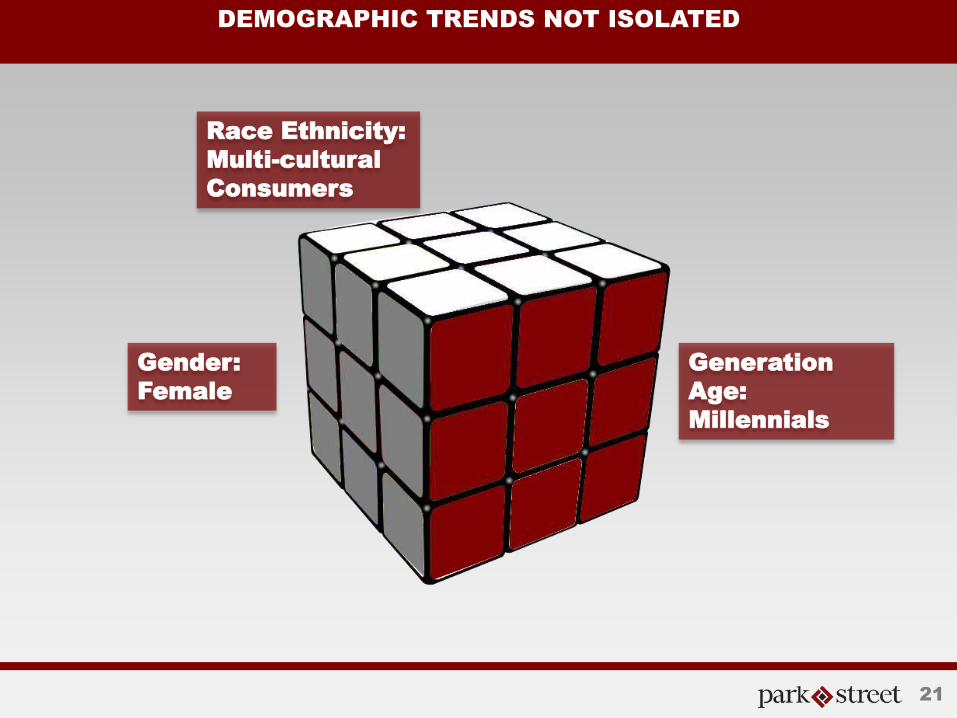
DEMOGRAPHIC TRENDS NOT ISOLATED
Gender:
Female
Generation
Age:
Millennials
Race Ethnicity:
Multi-cultural
Consumers
21
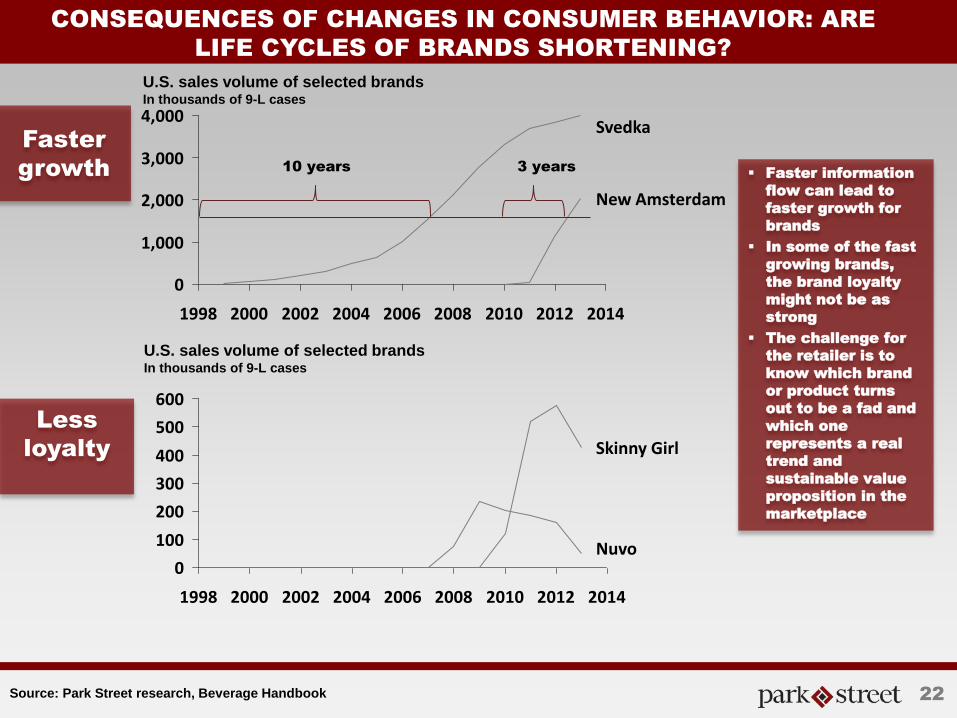
CONSEQUENCES OF CHANGES IN CONSUMER BEHAVIOR: ARE
LIFE CYCLES OF BRANDS SHORTENING?
Faster
growth
Less
loyalty
U.S. sales volume of selected brands In thousands of 9-L cases
Faster information
flow can lead to
faster growth for
brands
In some of the fast
growing brands,
the brand loyalty
might not be as
strong
The challenge for
the retailer is to
know which brand
or product turns
out to be a fad and
which one
represents a real
trend and
sustainable value
proposition in the
marketplace
0
1,000
2,000
3,000
4,000
1998 2000 2002 2004 2006 2008 2010 2012 2014
New Amsterdam
Svedka
10 years 3 years
U.S. sales volume of selected brands In thousands of 9-L cases
0
100
200
300
400
500
600
1998 2000 2002 2004 2006 2008 2010 2012 2014
Nuvo
Skinny Girl
Source: Park Street research, Beverage Handbook 22
CONSEQUENCES OF CHANGES IN CONSUMER BEHAVIOR: RISK
OF TECHNOLOGY DISRUPTORS – OTHER INDUSTRY EXAMPLES
Technology
disruptors in
regulated
industries:
personal
transportation
example
Technology
disruptors in
retail
industries:
video rental
example
Taxi industry is locally and regionally regulated
– very little incentive for participants to
innovate as a way to increase profits
UBER, an App-Powered transportation network
company, recognized that customers are
willing to pay a premium price for convenience,
professionalism, and cleanliness
Resistance of regulators and incumbents
fought by utilizing social media networks of
passionate UBER users
Founded in 2009, most recent valuation at
$18bn
Video rental business initially highly
fragmented with independent stores prior to
being consolidated and dominated by chains
such as Blockbuster, which at its peak had
9,000 stores and 60,000 employees
Netflix, a start-up focused on flat rate DVD-by-
mail entered the market in 1997
Blockbuster turned down an acquisition of
Netflix for $50m in 2000
Blockbuster filed for bankruptcy in 2010 and in
2014 the company ceased operations
Netflix’s market cap in May 2014 exceeded
$23bn
23
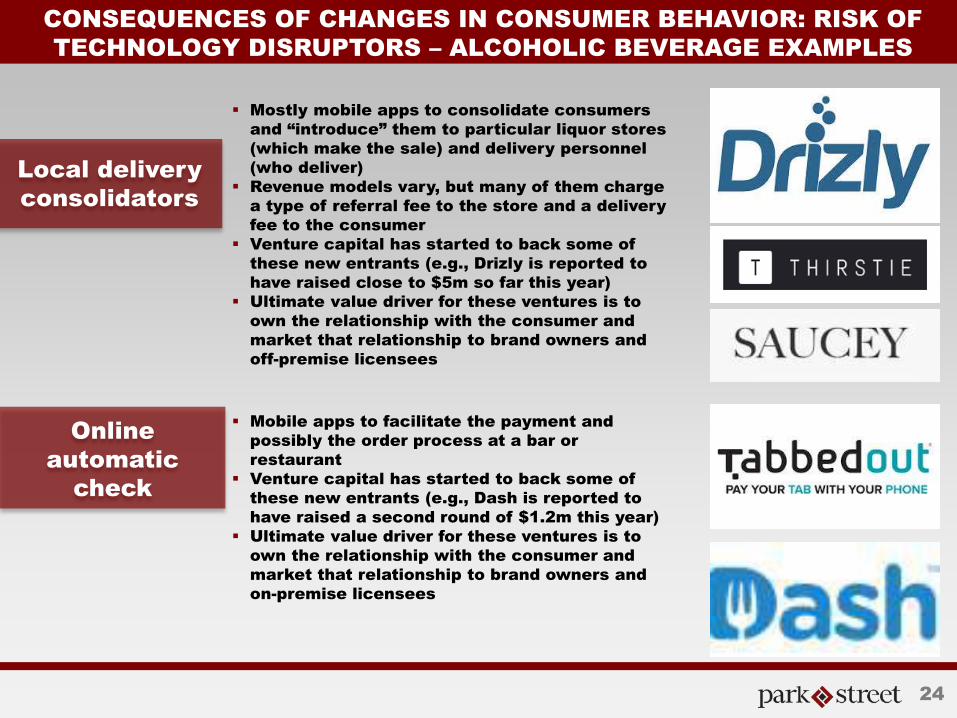
CONSEQUENCES OF CHANGES IN CONSUMER BEHAVIOR: RISK OF
TECHNOLOGY DISRUPTORS – ALCOHOLIC BEVERAGE EXAMPLES
Local delivery
consolidators
Online
automatic
check
Mostly mobile apps to consolidate consumers
and “introduce” them to particular liquor stores
(which make the sale) and delivery personnel
(who deliver)
Revenue models vary, but many of them charge
a type of referral fee to the store and a delivery
fee to the consumer
Venture capital has started to back some of
these new entrants (e.g., Drizly is reported to
have raised close to $5m so far this year)
Ultimate value driver for these ventures is to
own the relationship with the consumer and
market that relationship to brand owners and
off-premise licensees
Mobile apps to facilitate the payment and
possibly the order process at a bar or
restaurant
Venture capital has started to back some of
these new entrants (e.g., Dash is reported to
have raised a second round of $1.2m this year)
Ultimate value driver for these ventures is to
own the relationship with the consumer and
market that relationship to brand owners and
on-premise licensees
24
TITLE IN ALL CAPS
DOUBLE LINED
LICENSEES ARE IMPACTED BY SEVERAL MAJOR CHANGES IN
CONSUMER, SUPPLIER AND WHOLESALER TIERS
Route to Market for Alcoholic Beverages
Consumers
Distributor/control state board
On and off premise retailers
Brand owner/producer
Brand owner/
producer
25
Consumer topics
• Growth segments
─ Millennial
─ Female
─ Multi-cultural
• Shortening brand life cycles
• Disruptors using new technology
Supplier topics
• Consolidation
• Brand extension over brand creation
• Innovation wave by craft producers &
entrepreneurs
Distributor topics
• Consolidation
• Large supplier influence
• Increasing distribution challenges for
emerging brands
• New channels for new brands
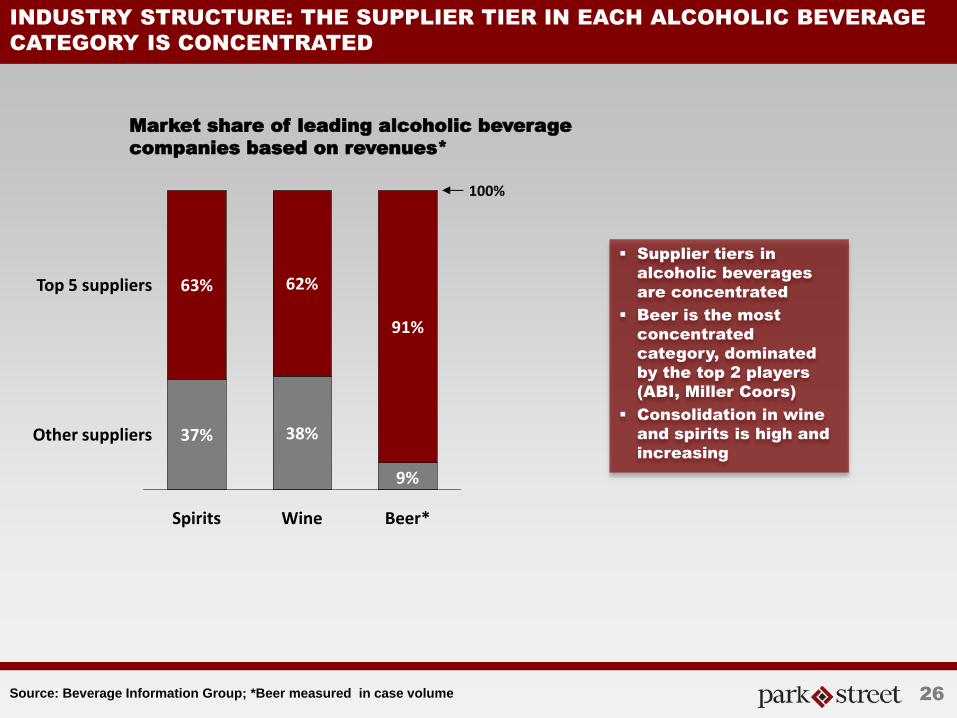
INDUSTRY STRUCTURE: THE SUPPLIER TIER IN EACH ALCOHOLIC BEVERAGE
CATEGORY IS CONCENTRATED
Market share of leading alcoholic beverage
companies based on revenues*
Source: Beverage Information Group; *Beer measured in case volume
37% 38%
63% 62%
91%
9%
Other suppliers
Beer*
Top 5 suppliers
Wine
100%
Spirits
Supplier tiers in
alcoholic beverages
are concentrated
Beer is the most
concentrated
category, dominated
by the top 2 players
(ABI, Miller Coors)
Consolidation in wine
and spirits is high and
increasing
26
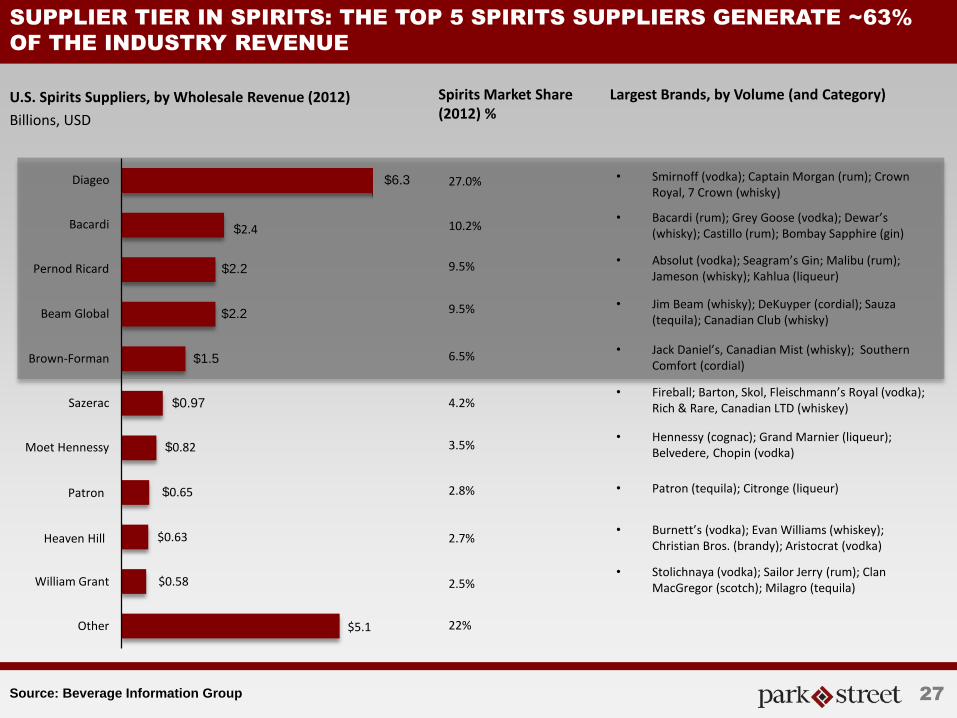
SUPPLIER TIER IN SPIRITS: THE TOP 5 SPIRITS SUPPLIERS GENERATE ~63%
OF THE INDUSTRY REVENUE
• Smirnoff (vodka); Captain Morgan (rum); Crown Royal, 7 Crown (whisky)
U.S. Spirits Suppliers, by Wholesale Revenue (2012)
Billions, USD
Largest Brands, by Volume (and Category)
• Bacardi (rum); Grey Goose (vodka); Dewar’s (whisky); Castillo (rum); Bombay Sapphire (gin)
• Absolut (vodka); Seagram’s Gin; Malibu (rum); Jameson (whisky); Kahlua (liqueur)
• Jim Beam (whisky); DeKuyper (cordial); Sauza (tequila); Canadian Club (whisky)
• Jack Daniel’s, Canadian Mist (whisky); Southern Comfort (cordial)
• Fireball; Barton, Skol, Fleischmann’s Royal (vodka); Rich & Rare, Canadian LTD (whiskey)
• Hennessy (cognac); Grand Marnier (liqueur); Belvedere, Chopin (vodka)
• Burnett’s (vodka); Evan Williams (whiskey); Christian Bros. (brandy); Aristocrat (vodka)
Spirits Market Share (2012) %
• Patron (tequila); Citronge (liqueur)
• Stolichnaya (vodka); Sailor Jerry (rum); Clan MacGregor (scotch); Milagro (tequila)
Patron
$0.97
$2.2
$1.5
Heaven Hill
$0.65
Other $5.1
Sazerac
Beam Global $2.2
Bacardi $2.4
Diageo $6.3
William Grant $0.58
$0.63
Moet Hennessy
Brown-Forman
$0.82
Pernod Ricard
Source: Beverage Information Group
27.0%
10.2%
9.5%
9.5%
6.5%
4.2%
3.5%
2.8%
2.7%
2.5%
22%
27
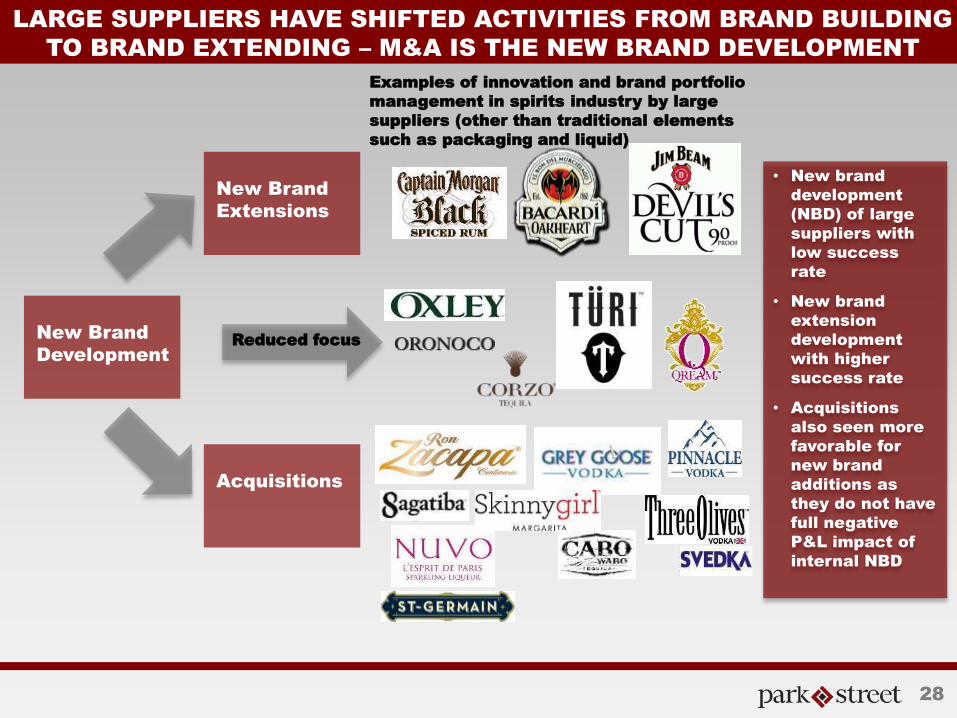
LARGE SUPPLIERS HAVE SHIFTED ACTIVITIES FROM BRAND BUILDING
TO BRAND EXTENDING – M&A IS THE NEW BRAND DEVELOPMENT
Examples of innovation and brand portfolio
management in spirits industry by large
suppliers (other than traditional elements
such as packaging and liquid)
New Brand
Development
Acquisitions
New Brand
Extensions
Reduced focus
28
• New brand
development
(NBD) of large
suppliers with
low success
rate
• New brand
extension
development
with higher
success rate
• Acquisitions
also seen more
favorable for
new brand
additions as
they do not have
full negative
P&L impact of
internal NBD
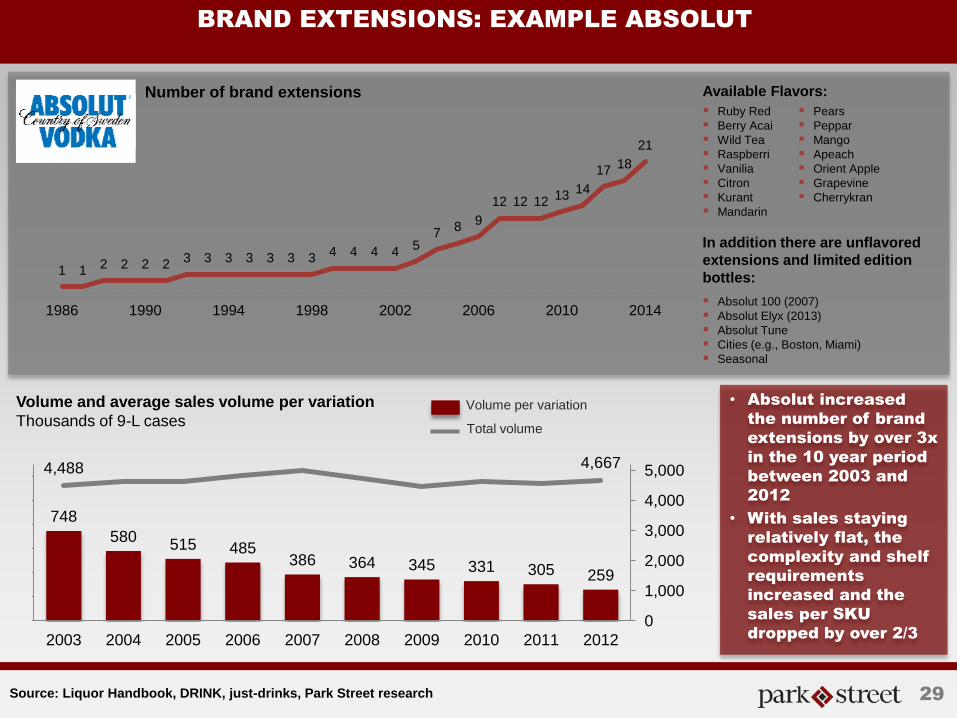
BRAND EXTENSIONS: EXAMPLE ABSOLUT
29
1 1 2 2 2 2 3 3 3 3 3 3 3 4 4 4 4 5 7 8 9
12 12 12 13 14 17 18
21
1986 1990 1994 1998 2002 2006 2010 2014
Source: Liquor Handbook, DRINK, just-drinks, Park Street research
Number of brand extensions
Volume and average sales volume per variation Thousands of 9-L cases
Ruby Red Berry Acai Wild Tea Raspberri Vanilia Citron Kurant Mandarin
Pears Peppar Mango Apeach Orient Apple Grapevine Cherrykran
Available Flavors:
In addition there are unflavored extensions and limited edition bottles:
Absolut 100 (2007) Absolut Elyx (2013) Absolut Tune Cities (e.g., Boston, Miami) Seasonal
748 580 515 485
386 364 345 331 305 259
4,488 4,667
0
1,000
2,000
3,000
4,000
5,000
2003 2004 2005 2006 2007 2008 2009 2010 2011 2012
Volume per variation
Total volume
• Absolut increased
the number of brand
extensions by over 3x
in the 10 year period
between 2003 and
2012
• With sales staying
relatively flat, the
complexity and shelf
requirements
increased and the
sales per SKU
dropped by over 2/3
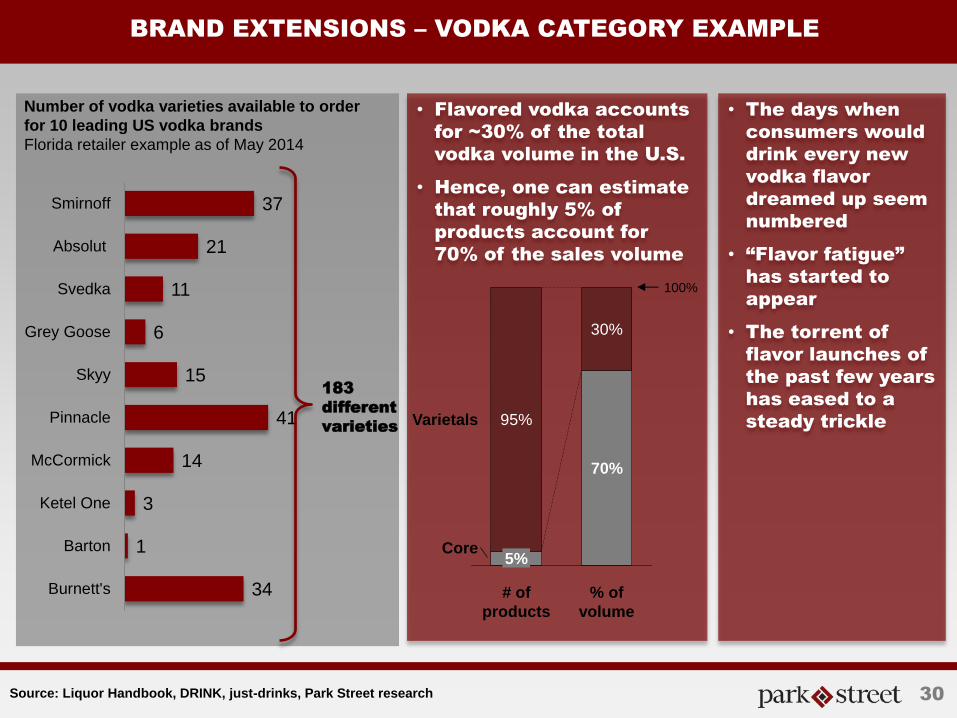
BRAND EXTENSIONS – VODKA CATEGORY EXAMPLE
30 Source: Liquor Handbook, DRINK, just-drinks, Park Street research
37
21
11
6
15
41
14
3
1
34
Smirnoff
Absolut
Svedka
Grey Goose
Skyy
Pinnacle
McCormick
Ketel One
Barton
Burnett's
Number of vodka varieties available to order for 10 leading US vodka brands Florida retailer example as of May 2014
183
different
varieties
• The days when
consumers would
drink every new
vodka flavor
dreamed up seem
numbered
• “Flavor fatigue”
has started to
appear
• The torrent of
flavor launches of
the past few years
has eased to a
steady trickle
• Flavored vodka accounts
for ~30% of the total
vodka volume in the U.S.
• Hence, one can estimate
that roughly 5% of
products account for
70% of the sales volume
Varietals
Core 5%
70%
100%
95%
30%
# of products
% of volume
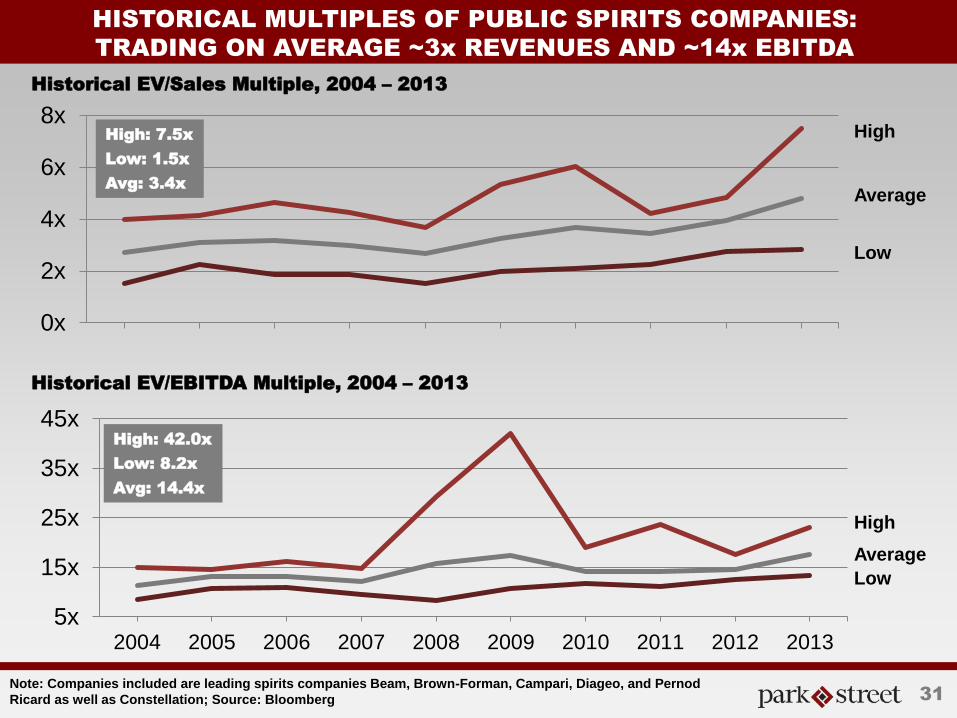
HISTORICAL MULTIPLES OF PUBLIC SPIRITS COMPANIES:
TRADING ON AVERAGE ~3x REVENUES AND ~14x EBITDA
Historical EV/Sales Multiple, 2004 – 2013
31
Note: Companies included are leading spirits companies Beam, Brown-Forman, Campari, Diageo, and Pernod Ricard as well as Constellation; Source: Bloomberg
0x
2x
4x
6x
8xHigh High: 7.5x
Low: 1.5x
Avg: 3.4x
Average
Low
Historical EV/EBITDA Multiple, 2004 – 2013
5x
15x
25x
35x
45x
2004 2005 2006 2007 2008 2009 2010 2011 2012 2013
High
Average Low
High: 42.0x
Low: 8.2x
Avg: 14.4x
TITLE IN ALL CAPS
DOUBLE LINED
32
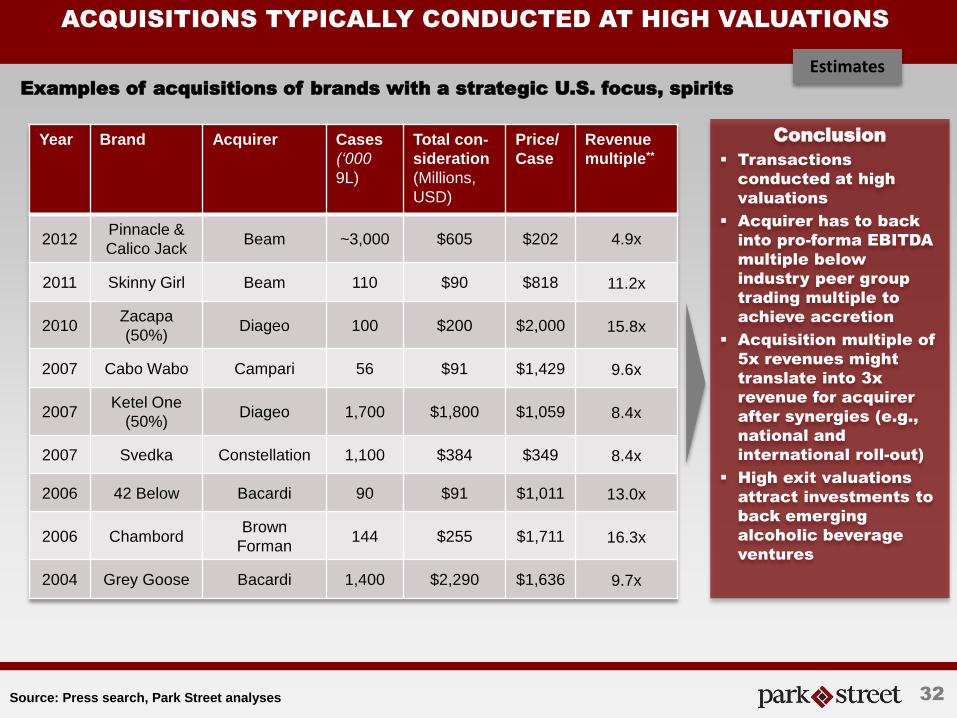
ACQUISITIONS TYPICALLY CONDUCTED AT HIGH VALUATIONS
Year Brand Acquirer Cases (‘000
9L)
Total con-sideration (Millions, USD)
Price/ Case
Revenue multiple**
2012 Pinnacle & Calico Jack
Beam ~3,000 $605 $202 4.9x
2011 Skinny Girl Beam 110 $90 $818 11.2x
2010 Zacapa (50%)
Diageo 100 $200 $2,000 15.8x
2007 Cabo Wabo Campari 56 $91 $1,429 9.6x
2007 Ketel One
(50%) Diageo 1,700 $1,800 $1,059 8.4x
2007 Svedka Constellation 1,100 $384 $349 8.4x
2006 42 Below Bacardi 90 $91 $1,011 13.0x
2006 Chambord Brown
Forman 144 $255 $1,711 16.3x
2004 Grey Goose Bacardi 1,400 $2,290 $1,636 9.7x
Examples of acquisitions of brands with a strategic U.S. focus, spirits
Source: Press search, Park Street analyses
Estimates
Conclusion
Transactions
conducted at high
valuations
Acquirer has to back
into pro-forma EBITDA
multiple below
industry peer group
trading multiple to
achieve accretion
Acquisition multiple of
5x revenues might
translate into 3x
revenue for acquirer
after synergies (e.g.,
national and
international roll-out)
High exit valuations
attract investments to
back emerging
alcoholic beverage
ventures
TITLE IN ALL CAPS
DOUBLE LINED
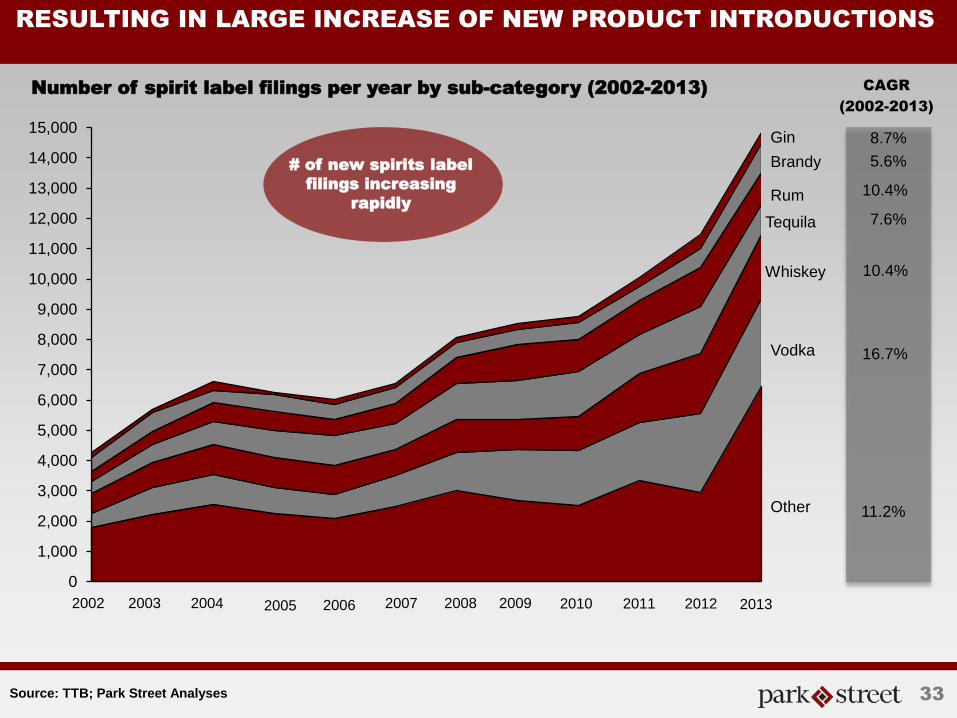
RESULTING IN LARGE INCREASE OF NEW PRODUCT INTRODUCTIONS
CAGR
(2002-2013)
0
1,000
2,000
3,000
4,000
5,000
6,000
7,000
8,000
9,000
10,000
11,000
12,000
13,000
14,000
15,000
Other
Vodka
Whiskey
Tequila
Rum
Brandy
Gin
2012 2011 2010 2009 2008 2007 2006 2005 2004 2003 2002
8.7%
5.6%
10.4%
7.6%
10.4%
16.7%
11.2%
Number of spirit label filings per year by sub-category (2002-2013)
# of new spirits label
filings increasing
rapidly
Source: TTB; Park Street Analyses
2013
33
THE CRAFT DISTILLER MOVEMENT IN THE U.S. IS ONE DRIVER OF THE
INNOVATION BOOM
34 Source: TTB, Park Street analyses
Number of distillers in the US:
414 492
629 727
1168
1501
2008 2009 2010 2011 2012 2013
• The number of distilleries operating in the
U.S. more than tripled in the last five years
(ACDA estimates number of craft distillers
operating at over 600 in 2014)
• If the craft spirits movement is as
successful as the craft brewing movement,
the category could reach over 17 million
cases by the end of the decade
TITLE IN ALL CAPS
DOUBLE LINED
LICENSEES ARE IMPACTED BY SEVERAL MAJOR CHANGES IN
CONSUMER, SUPPLIER AND WHOLESALER TIERS
Route to Market for Alcoholic Beverages
Consumers
Distributor/control state board
On and off premise retailers
Brand owner/producer
Brand owner/
producer
35
Consumer topics
• Growth segments
─ Millennial
─ Female
─ Multi-cultural
• Shortening brand life cycles
• Disruptors using new technology
Supplier topics
• Consolidation
• Brand extension over brand creation
• Innovation wave by craft producers &
entrepreneurs
Distributor topics
• Consolidation
• Large supplier influence
• Increasing distribution challenges for
emerging brands
• New channels for new brands
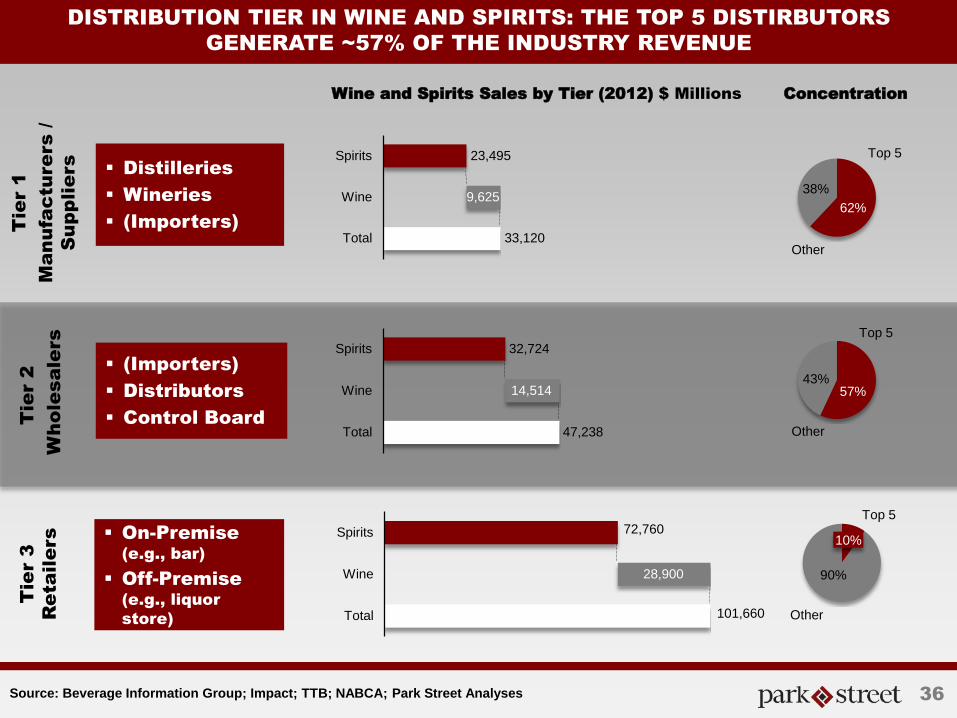
DISTRIBUTION TIER IN WINE AND SPIRITS: THE TOP 5 DISTIRBUTORS
GENERATE ~57% OF THE INDUSTRY REVENUE
Tie
r 2
W
ho
le
sa
le
rs
Distilleries
Wineries
(Importers)
(Importers)
Distributors
Control Board
Tie
r 3
Re
ta
ile
rs
On-Premise
(e.g., bar)
Off-Premise
(e.g., liquor
store)
Wine and Spirits Sales by Tier (2012) $ Millions
32,724
Total
Spirits
47,238
Wine 14,514
72,760
101,660 Total
Wine 28,900
Spirits
Concentration
38% 62%
Other
Top 5
43%
Other
Top 5
57%
Top 5
Other
9,625
Spirits
33,120
23,495
Total
Wine
Tie
r 1
Ma
nu
fa
ctu
re
rs /
Su
pp
lie
rs
Source: Beverage Information Group; Impact; TTB; NABCA; Park Street Analyses
90%
10%
36
TITLE IN ALL CAPS
DOUBLE LINED
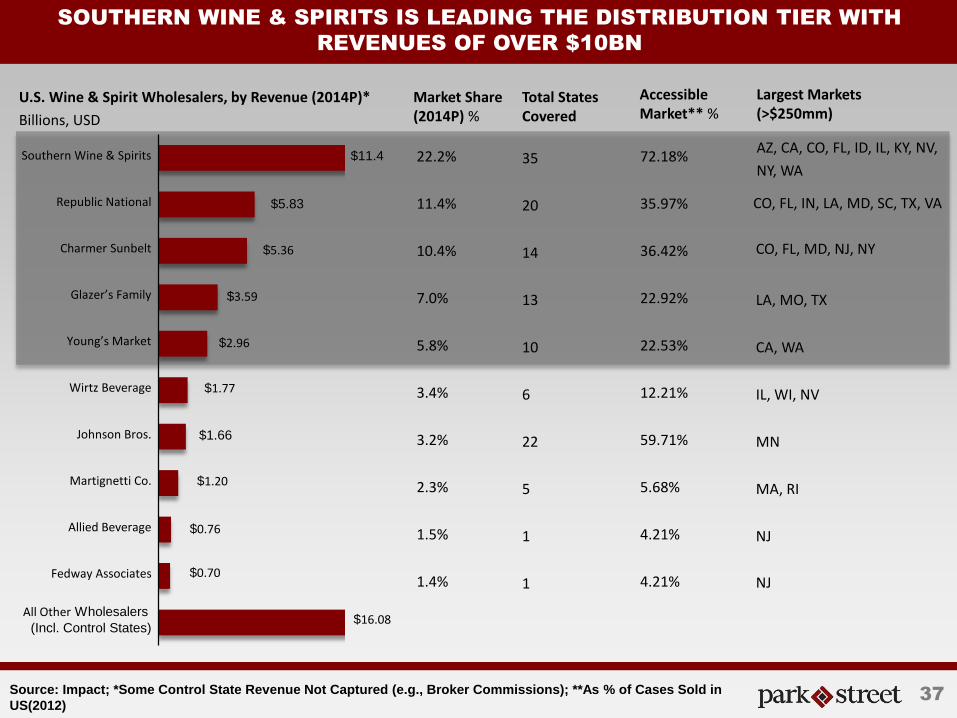
SOUTHERN WINE & SPIRITS IS LEADING THE DISTRIBUTION TIER WITH
REVENUES OF OVER $10BN
22.2%
Allied Beverage
Young’s Market
$5.83
$11.4
Glazer’s Family
Johnson Bros.
All Other Wholesalers (Incl. Control States)
$0.76
Wirtz Beverage
Fedway Associates
$1.20
$2.96
$16.08
$3.59
$1.66
Charmer Sunbelt
Martignetti Co.
$5.36
$0.70
$1.77
Republic National
Southern Wine & Spirits AZ, CA, CO, FL, ID, IL, KY, NV,
NY, WA
11.4%
CO, FL, MD, NJ, NY 10.4%
CO, FL, IN, LA, MD, SC, TX, VA
7.0% LA, MO, TX
5.8% CA, WA
3.4% IL, WI, NV
3.2% MN
2.3% MA, RI
1.5% NJ
1.4% NJ
35
20
14
13
10
6
22
5
1
1
72.18%
35.97%
36.42%
22.92%
22.53%
12.21%
59.71%
5.68%
4.21%
4.21%
U.S. Wine & Spirit Wholesalers, by Revenue (2014P)*
Billions, USD
Market Share (2014P) %
Largest Markets (>$250mm)
Total States Covered
Accessible Market** %
Source: Impact; *Some Control State Revenue Not Captured (e.g., Broker Commissions); **As % of Cases Sold in US(2012)
37
TITLE IN ALL CAPS
DOUBLE LINED
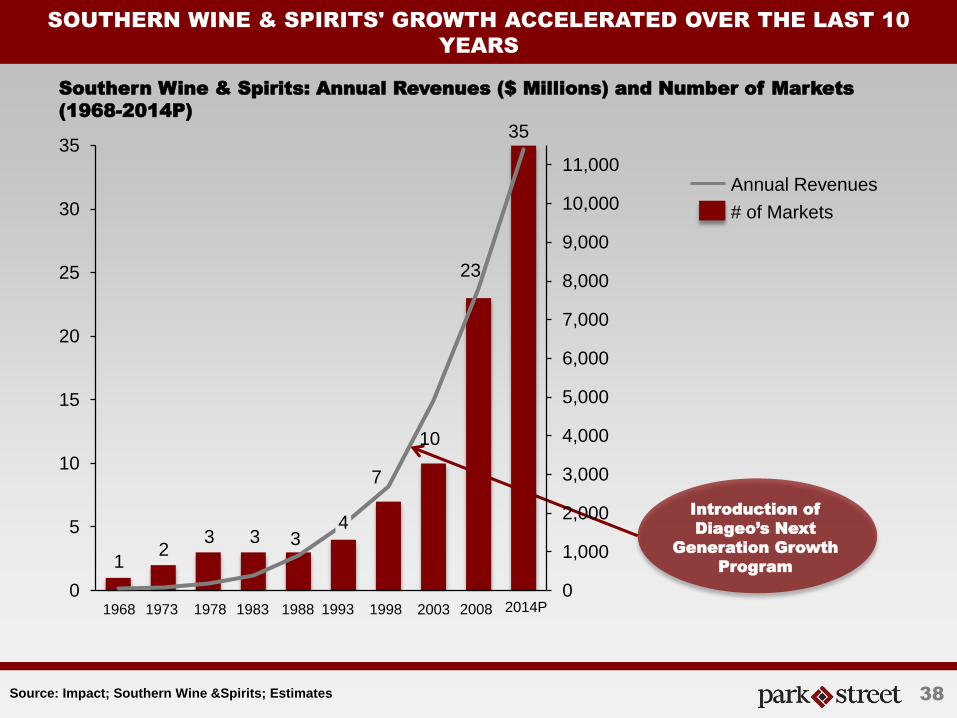
SOUTHERN WINE & SPIRITS' GROWTH ACCELERATED OVER THE LAST 10
YEARS
1 2
3 3
7
10
23
35
0
1,000
2,000
3,000
4,000
5,000
6,000
7,000
8,000
9,000
10,000
11,000
0
5
10
15
20
25
30
35
2008 2003 1998 1993
4
1988
3
1983 1978 1973 1968
# of Markets
Annual Revenues
Introduction of
Diageo’s Next
Generation Growth
Program
Southern Wine & Spirits: Annual Revenues ($ Millions) and Number of Markets
(1968-2014P)
Source: Impact; Southern Wine &Spirits; Estimates
2014P
38
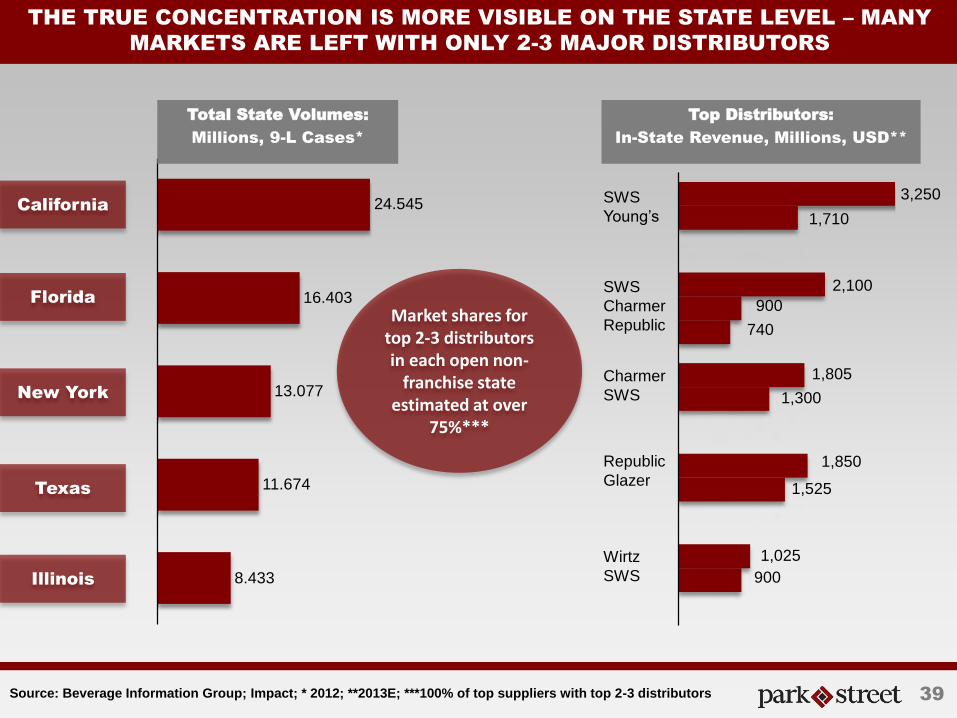
THE TRUE CONCENTRATION IS MORE VISIBLE ON THE STATE LEVEL – MANY
MARKETS ARE LEFT WITH ONLY 2-3 MAJOR DISTRIBUTORS
California
Texas
New York
Florida
Illinois
24.545
13.077
11.674
8.433
16.403 900
900
740
2,100
1,710
1,025
1,525
1,850
1,300
1,805
SWS Young’s
Republic Glazer
SWS Charmer Republic
Wirtz SWS
Charmer SWS
Top Distributors:
In-State Revenue, Millions, USD**
Total State Volumes:
Millions, 9-L Cases*
3,250
Source: Beverage Information Group; Impact; * 2012; **2013E; ***100% of top suppliers with top 2-3 distributors 39
Market shares for top 2-3 distributors in each open non-
franchise state estimated at over
75%***
TITLE IN ALL CAPS
DOUBLE LINED
40
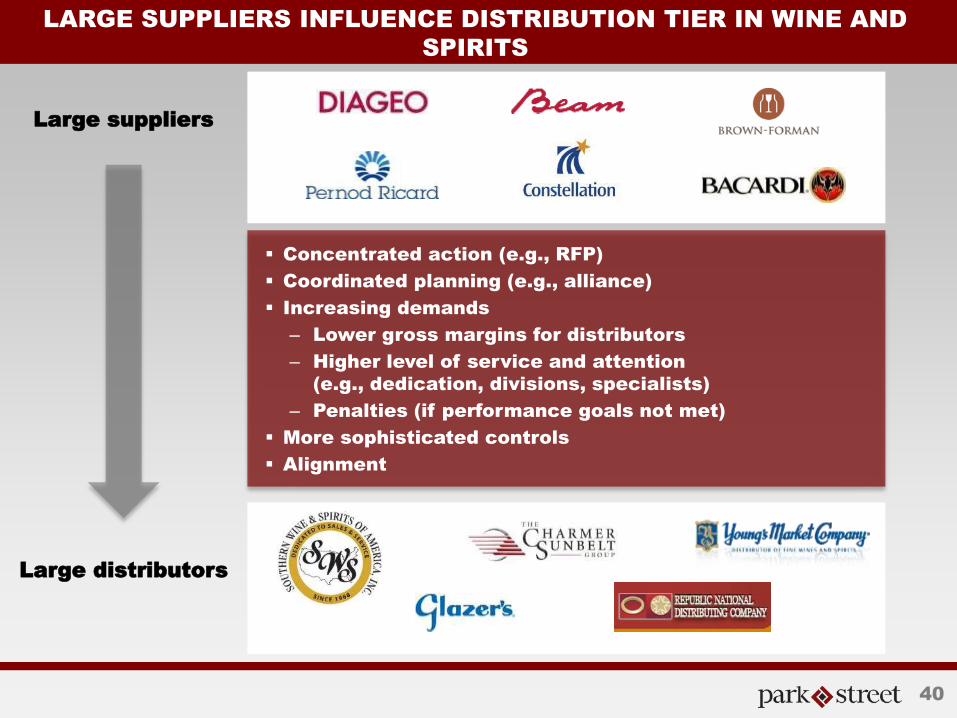
LARGE SUPPLIERS INFLUENCE DISTRIBUTION TIER IN WINE AND
SPIRITS
Large suppliers
Concentrated action (e.g., RFP)
Coordinated planning (e.g., alliance)
Increasing demands
– Lower gross margins for distributors
– Higher level of service and attention
(e.g., dedication, divisions, specialists)
– Penalties (if performance goals not met)
More sophisticated controls
Alignment
Large distributors
Supplier tier
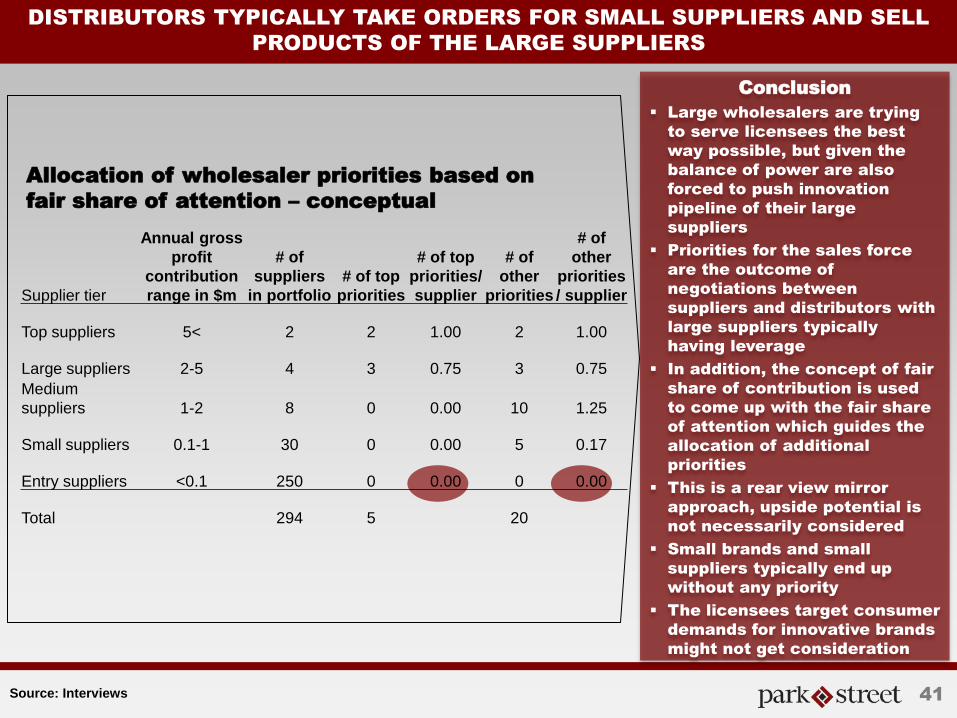
Annual gross profit
contribution range in $m
# of suppliers
in portfolio # of top
priorities
# of top priorities/ supplier
# of other
priorities
# of other
priorities/ supplier
Top suppliers 5< 2 2 1.00 2 1.00
Large suppliers 2-5 4 3 0.75 3 0.75 Medium suppliers 1-2 8 0 0.00 10 1.25
Small suppliers 0.1-1 30 0 0.00 5 0.17
Entry suppliers <0.1 250 0 0.00 0 0.00
Total 294 5 20
41
DISTRIBUTORS TYPICALLY TAKE ORDERS FOR SMALL SUPPLIERS AND SELL
PRODUCTS OF THE LARGE SUPPLIERS
Source: Interviews
Conclusion
Large wholesalers are trying
to serve licensees the best
way possible, but given the
balance of power are also
forced to push innovation
pipeline of their large
suppliers
Priorities for the sales force
are the outcome of
negotiations between
suppliers and distributors with
large suppliers typically
having leverage
In addition, the concept of fair
share of contribution is used
to come up with the fair share
of attention which guides the
allocation of additional
priorities
This is a rear view mirror
approach, upside potential is
not necessarily considered
Small brands and small
suppliers typically end up
without any priority
The licensees target consumer
demands for innovative brands
might not get consideration
Allocation of wholesaler priorities based on
fair share of attention – conceptual
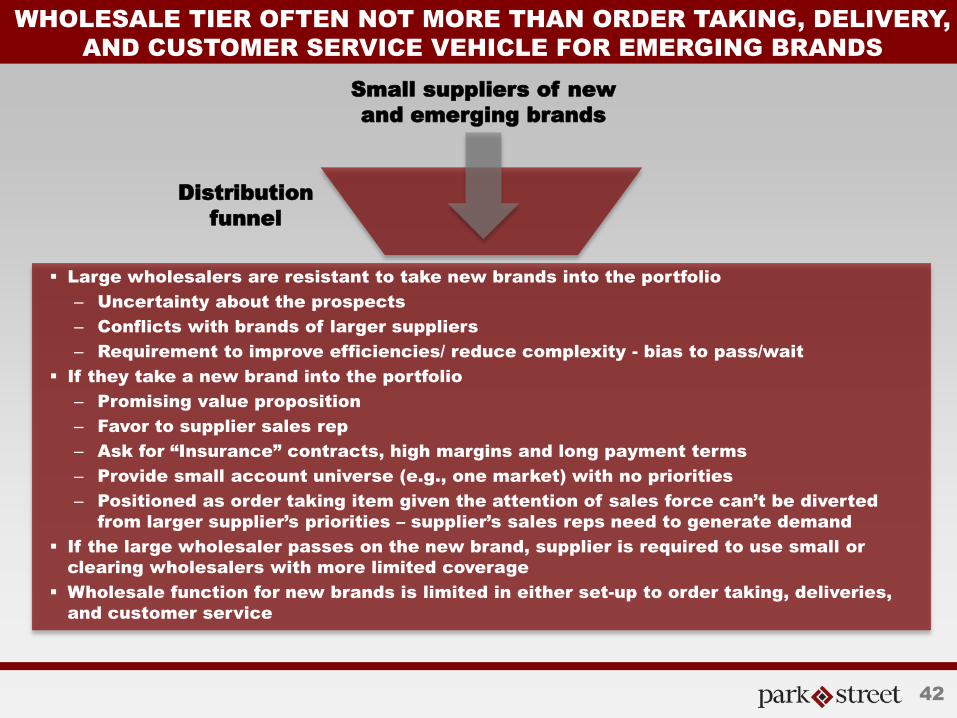
WHOLESALE TIER OFTEN NOT MORE THAN ORDER TAKING, DELIVERY,
AND CUSTOMER SERVICE VEHICLE FOR EMERGING BRANDS
42
Small suppliers of new
and emerging brands
Large wholesalers are resistant to take new brands into the portfolio
– Uncertainty about the prospects
– Conflicts with brands of larger suppliers
– Requirement to improve efficiencies/ reduce complexity - bias to pass/wait
If they take a new brand into the portfolio
– Promising value proposition
– Favor to supplier sales rep
– Ask for “Insurance” contracts, high margins and long payment terms
– Provide small account universe (e.g., one market) with no priorities
– Positioned as order taking item given the attention of sales force can’t be diverted
from larger supplier’s priorities – supplier’s sales reps need to generate demand
If the large wholesaler passes on the new brand, supplier is required to use small or
clearing wholesalers with more limited coverage
Wholesale function for new brands is limited in either set-up to order taking, deliveries,
and customer service
Distribution
funnel
TITLE IN ALL CAPS
DOUBLE LINED
43
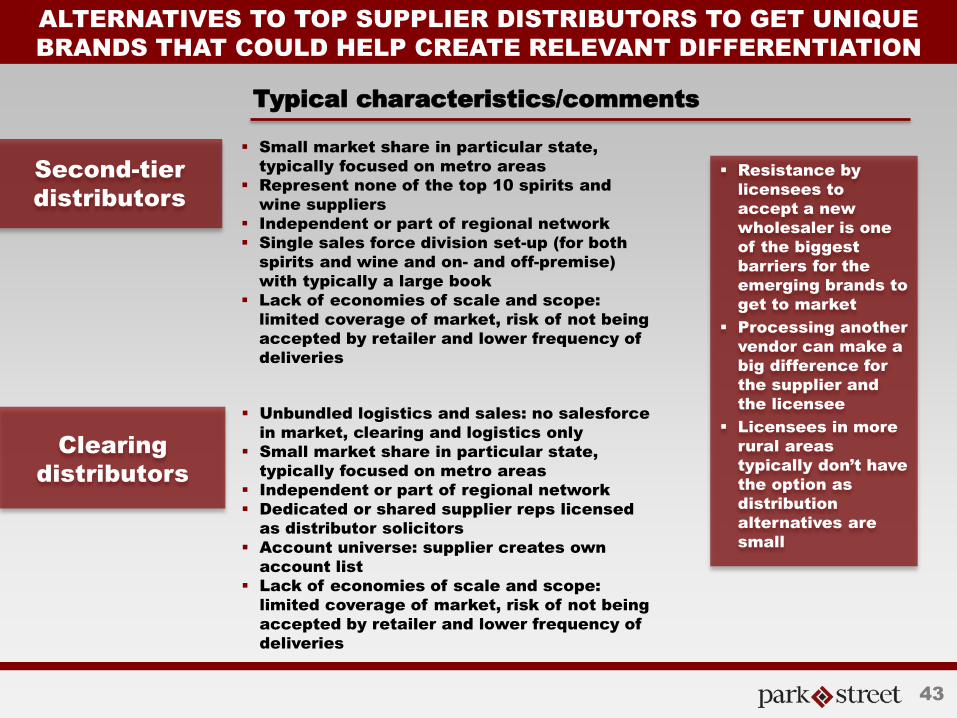
ALTERNATIVES TO TOP SUPPLIER DISTRIBUTORS TO GET UNIQUE
BRANDS THAT COULD HELP CREATE RELEVANT DIFFERENTIATION
Unbundled logistics and sales: no salesforce
in market, clearing and logistics only
Small market share in particular state,
typically focused on metro areas
Independent or part of regional network
Dedicated or shared supplier reps licensed
as distributor solicitors
Account universe: supplier creates own
account list
Lack of economies of scale and scope:
limited coverage of market, risk of not being
accepted by retailer and lower frequency of
deliveries
Small market share in particular state,
typically focused on metro areas
Represent none of the top 10 spirits and
wine suppliers
Independent or part of regional network
Single sales force division set-up (for both
spirits and wine and on- and off-premise)
with typically a large book
Lack of economies of scale and scope:
limited coverage of market, risk of not being
accepted by retailer and lower frequency of
deliveries
Second-tier
distributors
Clearing
distributors
Typical characteristics/comments
Resistance by
licensees to
accept a new
wholesaler is one
of the biggest
barriers for the
emerging brands to
get to market
Processing another
vendor can make a
big difference for
the supplier and
the licensee
Licensees in more
rural areas
typically don’t have
the option as
distribution
alternatives are
small
EMERGING BRANDS CAN BE A SOURCE OF COMPETITIVE ADVANTAGE
FOR A LICENSEE
44
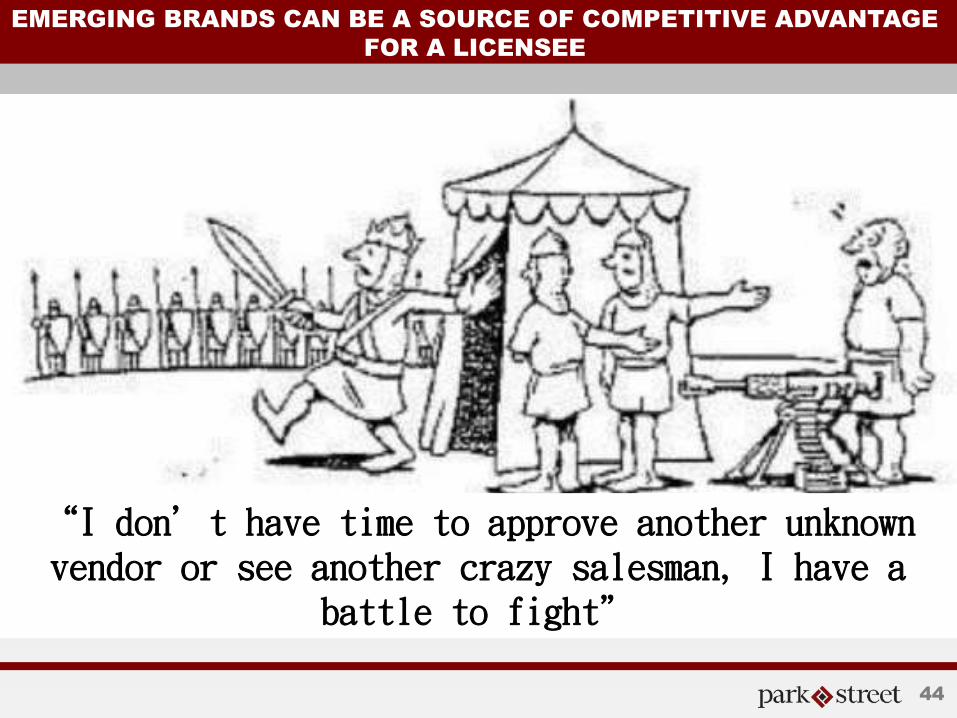
“I don’t have time to approve another unknown vendor or see another crazy salesman, I have a
battle to fight”
EMERGING BRANDS CAN BE A SOURCE OF COMPETITIVE ADVANTAGE
FOR A LICENSEE
45
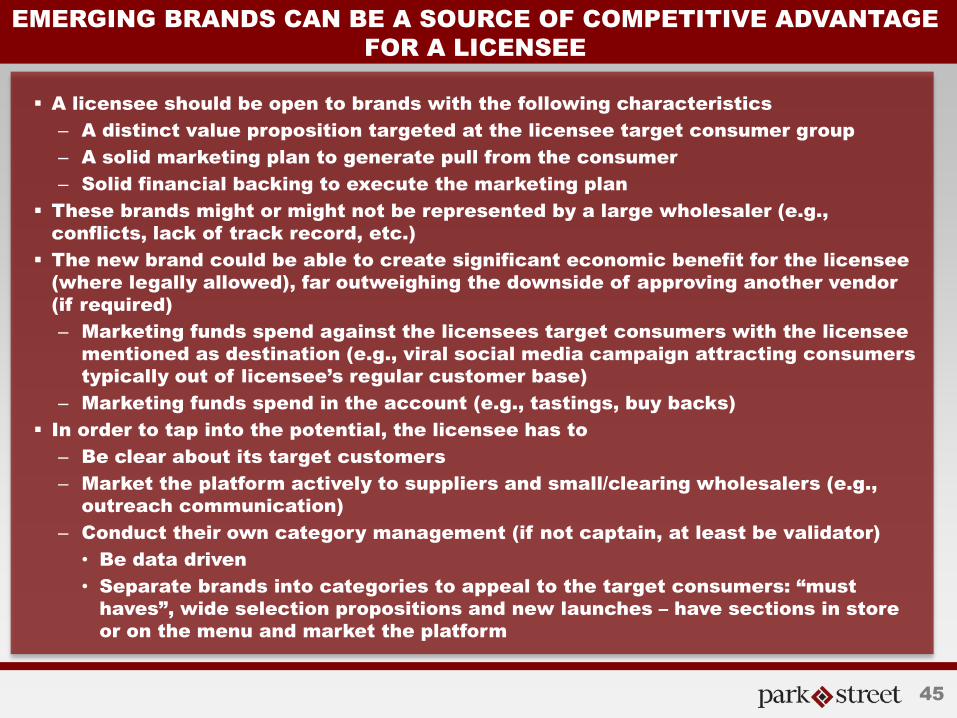
A licensee should be open to brands with the following characteristics
– A distinct value proposition targeted at the licensee target consumer group
– A solid marketing plan to generate pull from the consumer
– Solid financial backing to execute the marketing plan
These brands might or might not be represented by a large wholesaler (e.g.,
conflicts, lack of track record, etc.)
The new brand could be able to create significant economic benefit for the licensee
(where legally allowed), far outweighing the downside of approving another vendor
(if required)
– Marketing funds spend against the licensees target consumers with the licensee
mentioned as destination (e.g., viral social media campaign attracting consumers
typically out of licensee’s regular customer base)
– Marketing funds spend in the account (e.g., tastings, buy backs)
In order to tap into the potential, the licensee has to
– Be clear about its target customers
– Market the platform actively to suppliers and small/clearing wholesalers (e.g.,
outreach communication)
– Conduct their own category management (if not captain, at least be validator)
• Be data driven
• Separate brands into categories to appeal to the target consumers: “must
haves”, wide selection propositions and new launches – have sections in store
or on the menu and market the platform
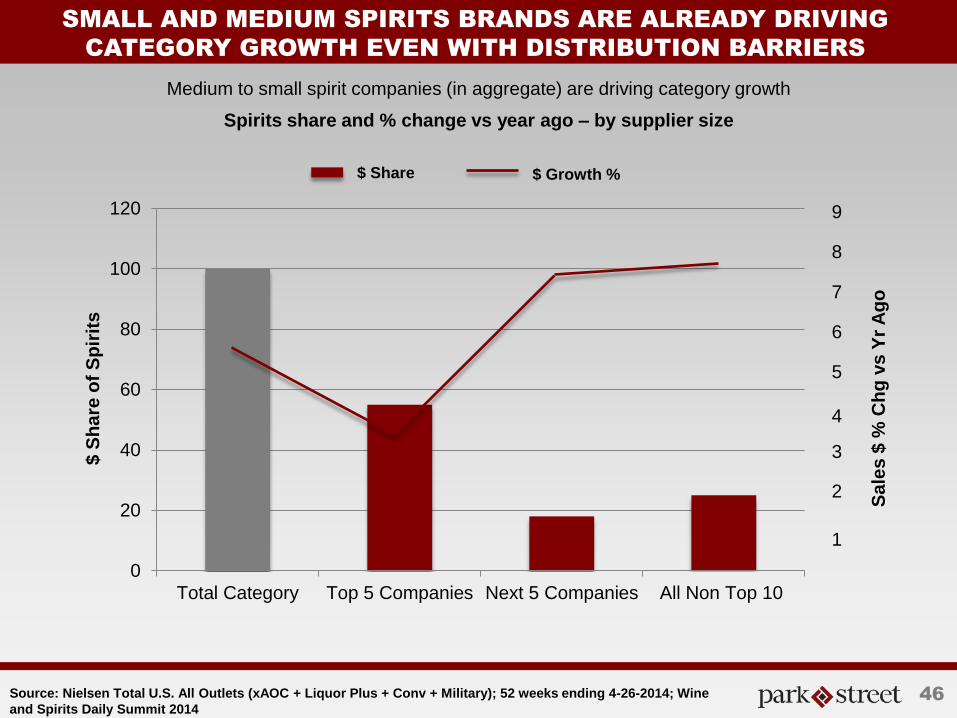
SMALL AND MEDIUM SPIRITS BRANDS ARE ALREADY DRIVING
CATEGORY GROWTH EVEN WITH DISTRIBUTION BARRIERS
Source: Nielsen Total U.S. All Outlets (xAOC + Liquor Plus + Conv + Military); 52 weeks ending 4-26-2014; Wine and Spirits Daily Summit 2014
0
20
40
60
80
100
120
Total Category Top 5 Companies Next 5 Companies All Non Top 10
9
8
7
6
5
4
3
2
1
Sal
es $
% C
hg
vs
Yr
Ag
o
Medium to small spirit companies (in aggregate) are driving category growth
Spirits share and % change vs year ago – by supplier size $
Sh
are
of
Sp
irit
s
$ Share $ Growth %
46
SUMMARY
47
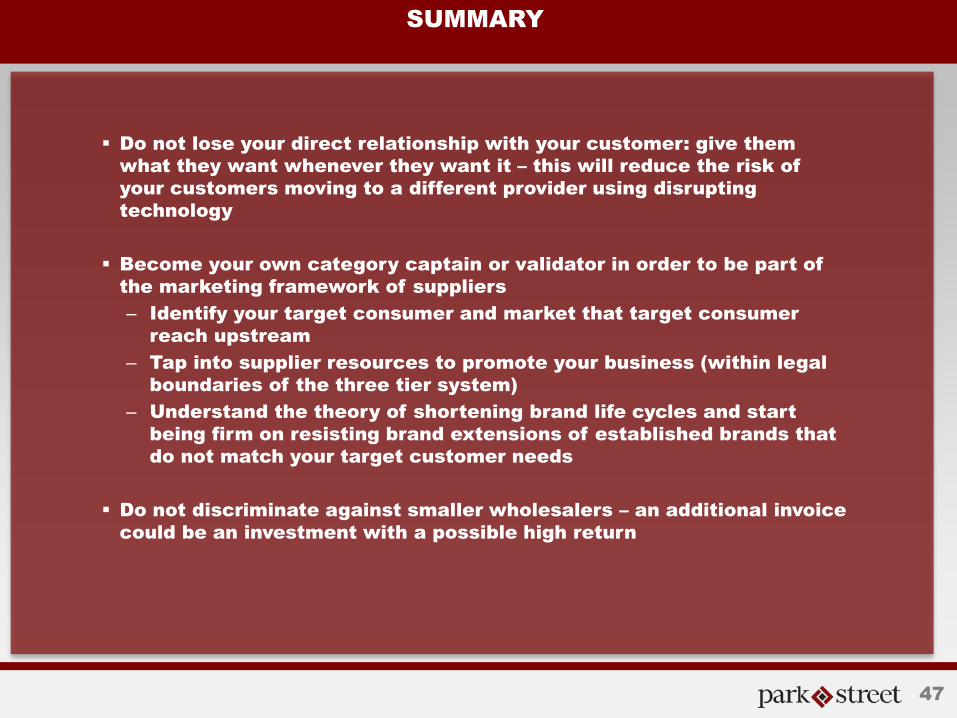
Do not lose your direct relationship with your customer: give them
what they want whenever they want it – this will reduce the risk of
your customers moving to a different provider using disrupting
technology
Become your own category captain or validator in order to be part of
the marketing framework of suppliers
– Identify your target consumer and market that target consumer
reach upstream
– Tap into supplier resources to promote your business (within legal
boundaries of the three tier system)
– Understand the theory of shortening brand life cycles and start
being firm on resisting brand extensions of established brands that
do not match your target customer needs
Do not discriminate against smaller wholesalers – an additional invoice
could be an investment with a possible high return
APPENDIX
48
TITLE IN ALL CAPS
DOUBLE LINED
49
ABOUT PARK STREET
Park Street is a leading provider of diversified services, working capital, and trade
financing for domestic and imported alcoholic beverage brands. The company is
headquartered in Miami, FL with operations across the U.S. and supports over
1,000 brands from more than 70 countries around the world. Park Street was
launched in 2003 by McKinsey & Company alumni and is led by executives with
long-standing industry relationships and decades of experience with leading global
beverage companies such as Bacardi, E. & J. Gallo, Diageo, Coca Cola, and more.
The company serves a broad range of wine and spirits clients including craft
distillers, multi-brand global suppliers, owner operators, vineyard owners, celebrity
brands, and more.
Park Street offers a fully integrated solution across back-office services, working
capital investment, and advisory services. With more than fifty-five years of
combined experience among its senior management team and expertise in
operations, strategy, information technology, finance, and deal structuring and
negotiation, Park Street is able to help clients overcome their most complex
challenges, accelerate growth, and capitalize on compelling opportunities.
Whether a client would benefit from back-office support, working capital
investment, advisory services, or all of the above, Park Street provides a
professional and comprehensive solution which integrates seamlessly across
service areas and with the client organization.
TITLE IN ALL CAPS
DOUBLE LINED
50
PARK STREET SERVICES (1 of 2)
Back-Office
Services
Distribution:
Direct-to-Retail
Park Street provides a cost-effective, turn-key solution to manage the
thousands of complex details required to import (if applicable), transport,
insure, warehouse, sell (all 50 states), and receive payment for alcoholic
beverage products in the U.S. — all while maintaining compliance with
federal and state alcoholic beverage control laws and tax requirements.
The three core benefits to Park Street’s foreign and domestic clients are:
(i) achieving cost-effectiveness, (ii) enhancing operational performance,
and (iii) focusing client resources on sales, marketing, and brand
enhancement among consumers. With precision and transparency, Park
Street manages the logistics, compliance, order fulfillment, data
management, customer service, and accounting from the point the
product is picked up at the producer until it is delivered to the customer
and the customer invoice is paid. Park Street’s operational infrastructure
integrates seamlessly with domestic and foreign production facilities
resulting in streamlined operations.
In select key markets (FL, NY, NJ, CA), clients can leverage Park Street’s
distribution network to sell imported and domestic product directly to
retailers (restaurants, bars, liquor stores, etc.). This distribution model is
attractive to both established and emerging brands. It allows established
brands to lower cost by leveraging the wholesale clearing model and
enables emerging brands to enter new markets quickly and inexpensively
in order to demonstrate initial market traction (i.e., test market
campaign) before moving on to a traditional distributor. Brand owners
also utilize Park Street’s distribution capabilities to sell additional
products not supported by their traditional distributor (i.e., supplementary
distribution).
TITLE IN ALL CAPS
DOUBLE LINED
51
PARK STREET SERVICES (2 of 2)
Compliance
Management
Working
Capital & Trade
Finance
Park Street offers a full suite of compliance set-up and management
services in order to help domestic and international alcoholic beverage
companies go live and operate in adherence with federal and state laws
and regulations. The company’s compliance set-up and management
services provide an easy and cost-effective solution which enables clients
to avoid costly delays and penalties and remain focused on the core
competencies which drive brand growth.
Advisory
Services
Export
Solutions
Park Street offers accounts receivable financing (factoring), revolving
credit facilities, term loans secured by accounts receivables and other
assets, guarantees, and letters of credit. The underwriting process focuses
on the quality and liquidity of the collateral/assets (e.g., creditworthiness
of the distributor, payment history, inventory turnover rate), as well as the
financial stability of the brand owner.
Park Street provides advisory services focused on the alcoholic beverage
sector, including, among others, business building, route-to-market
planning, organizational effectiveness, strategic partnerships, joint
ventures, and negotiation support. Park Street collaborates with clients to
identify and implement value-creating solutions in a wide range of
scenarios including start-up, growth acceleration, exit, and more.
Park Street’s export solutions enable domestic suppliers to access
markets around the world and allow foreign suppliers to utilize free trade
zones at select U.S. ports to service regional and sub-regional markets
(e.g., Mexico, Caribbean, Central America, South America). Services
include, among others, warehousing, logistics management, regulatory
compliance, order fulfillment, invoicing, and customer service.