
Fly-In Fly-Out and Regional Impact Assessments...In conducting the analysis in this report ACIL...
51
Fly-in Fly-out and regional impact assessments A regional development impact assessment framework for fly-in fly-out projects Final report prepared for the Regional Development Council January 2009
Transcript of Fly-In Fly-Out and Regional Impact Assessments...In conducting the analysis in this report ACIL...
Fly-in Fly-out and regional impact assessments
A regional development impact assessment framework for fly-in
fly-out projects
Final report prepared for the Regional Development Council
January 2009
© ACIL Tasman Pty Ltd
This work is copyright. The Copyright Act 1968 permits fair dealing for study, research, news reporting, criticism or review. Selected passages, tables or diagrams may be reproduced for such purposes provided acknowledgment of the source is included. Permission for any more extensive reproduction must be obtained from ACIL Tasman on (03) 9600 3144.
Reliance and Disclaimer
The professional analysis and advice in this report has been prepared by ACIL Tasman for the exclusive use of the party or parties to whom it is addressed (the addressee) and for the purposes specified in it. This report is supplied in good faith and reflects the knowledge, expertise and experience of the consultants involved. The report must not be published, quoted or disseminated to any other party without ACIL Tasman’s prior written consent. ACIL Tasman accepts no responsibility whatsoever for any loss occasioned by any person acting or refraining from action as a result of reliance on the report, other than the addressee.
In conducting the analysis in this report ACIL Tasman has endeavoured to use what it considers is the best information available at the date of publication, including information supplied by the addressee. Unless stated otherwise, ACIL Tasman does not warrant the accuracy of any forecast or prediction in the report. Although ACIL Tasman exercises reasonable care when making forecasts or predictions, factors in the process, such as future market behaviour, are inherently uncertain and cannot be forecast or predicted reliably.
ACIL Tasman shall not be liable in respect of any claim arising out of the failure of a client investment to perform to the advantage of the client or to the advantage of the client to the degree suggested or assumed in any advice or forecast given by ACIL Tasman.
ACIL Tasman Pty Ltd ABN 68 102 652 148 Internet www.aciltasman.com.au
Melbourne (Head Office) Level 6, 224-236 Queen Street Melbourne VIC 3000 Telephone (+61 3) 9600 3144 Facsimile (+61 3) 9600 3155 Email [email protected]
Darwin Suite G1, Paspalis Centrepoint 48-50 Smith Street Darwin NT 0800 GPO Box 908 Darwin NT 0801 Telephone (+61 8) 8943 0643 Facsimile (+61 8) 8941 0848 Email [email protected]
Brisbane Level 15, 127 Creek Street Brisbane QLD 4000 GPO Box 32 Brisbane QLD 4001 Telephone (+61 7) 3009 8700 Facsimile (+61 7) 3009 8799 Email [email protected]
Perth Centa Building C2, 118 Railway Street West Perth WA 6005 Telephone (+61 8) 9449 9600 Facsimile (+61 8) 9322 3955 Email [email protected]
Canberra Level 1, 33 Ainslie Place Canberra City ACT 2600 GPO Box 1322 Canberra ACT 2601 Telephone (+61 2) 6103 8200 Facsimile (+61 2) 6103 8233 Email [email protected]
Sydney PO Box 1554 Double Bay NSW 1360 Telephone (+61 2) 9389 7842 Facsimile (+61 2) 8080 8142 Email [email protected]
For information on this report Please contact: Peter Johnson Telephone (08) 9456 2211 Mobile 0411 497 399 Email [email protected]
Fly-in Fly-out and regional impact assessments
iii
Contents 1 Introduction 1
2 The economic effects of FIFO 2 2.1 Regional leakages 2 2.2 Regional infrastructure and government services 2 2.3 Labour supply 3 2.4 Other considerations 3 2.5 Summary 4
3 The Western Australian approvals process 5 3.1 Approvals process 5 3.2 Integrated project approvals system process 6 3.3 Environmental protection 7 3.4 Department of Treasury and Finance 8
4 Economic modelling approaches 9 4.1 Input-output analysis 9
4.1.1 Assumptions 9 4.1.2 Measuring impacts 10 4.1.3 Limitations of I-O Analysis 11 4.1.4 Summary: I-O analysis 12
4.2 Computable general equilibrium modelling 12 4.2.1 Regional level analysis 16 4.2.2 Summing up 16
4.3 Cost benefit analysis 17 4.3.1 Comparison against a baseline 17 4.3.2 CBA Methodology 18 4.3.3 Common CBA Techniques 21 4.3.4 Issues and Limitations 24 4.3.5 Summary: CBA 24
5 Availability of models 26 5.1 Input-output tables 26 5.2 Cost-benefit 26 5.3 CGE models 26
6 Data requirements 28 6.1 Input-output tables 28 6.2 Cost benefit analysis 28 6.3 CGE modelling 29
Fly-in Fly-out and regional impact assessments
6.4 Confidentiality of data 29
7 Transparency, accessibility and ease of use 31 7.1 Input-output tables 31 7.2 Cost benefit analysis 31 7.3 CGE modelling 32
8 Costs of using models 33 8.1 Input-output tables 33 8.2 Cost benefit analysis 34 8.3 CGE modelling 34
9 Recommendations 36 9.1 Is there a "best" model? 36
9.1.1 Requirements of the model 36 9.1.2 Simplicity and transparency: 37
9.2 What is the recommended approach? 38 9.3 Stylised example 38
9.3.1 Methodology 39 9.3.2 Data 39 9.3.3 Issues 40 9.3.4 Assumptions 42 9.3.5 The analysis – CGE 42 9.3.6 The analysis – CBA 44
9.4 The approvals process 44 9.4.1 Cut off project size 44 9.4.2 Responsibility for the analysis 45 9.4.3 Resolving issues around conflicting results 45
References 46
Boxes, charts, figures and tables Box 1 The Queensland Government approach 12 Box 2 Historical underpinnings of general equilibrium modelling 14 Box 3 The ABC Mining Company 38 Figure 1 Typical approvals process 6 Figure 2 Illustrative scenario analysis using Tasman Global 15 Figure 3 Cost-Benefit analysis decision process 18
iv
Fly-in Fly-out and regional impact assessments
Introduction 1
1 Introduction Fly-in fly-out (FIFO) workforces have become a major part of Western Australia’s mining industry. The Regional Development Council (the Council) is of the view that the increasing use of FIFO on resource projects in regional WA represents a loss of real and potential benefits to regional communities.
The Council is concerned that the economic and social impacts of FIFO (relative to the use of a permanently based regional workforce) are not currently incorporated into the analysis underpinning the current project decision making process. Failure to fully understand the regional impacts of a proposed project prevents the Government, community and project proponents from developing and implementing strategies that would result in better regional outcomes and allow for forward planning to address possible bottlenecks and shortcomings.
ACIL Tasman has undertaken an analysis of available economic models and modelling/analytical techniques, with particular reference to their suitability for potential use in the Western Australian State Government Approvals process. The purpose of this study is to recommend a suitable approach to modelling/analysing regional resource projects to ensure that the economic impacts of a FIFO versus a residential workforce are understood.
Fly-in Fly-out and regional impact assessments
2 The economic effects of FIFO Consider a proposed regional mining project that has two choices for the provision of site labour: • a residential workforce • a fly-in fly out workforce.
At the regional and state level, there are economic differences between the two alternatives.
2.1 Regional leakages A FIFO worker usually has their main residence outside of the region in which their employment is based. To support their main residences, and their families, FIFO workers will repatriate most of their income back to their home region. Therefore, a FIFO workforce will invariably have a large leakage of wage and salary income away from the region in which they are working.
Residential workers need to spend a larger share of their income in the region in which they work to meet their living costs, particularly where workers permanently relocate to the region and bring family members with them. Thus, all things being equal, a resident workforce will have relatively less leakage of income and associated private spending from the region.
This difference in leakage is one of the main economic differences between a FIFO and a resident workforce. The additional local spending associated with a resident workforce creates opportunities for other businesses to establish within the region so as to service this increased local demand.
The opportunities that arise from local workforce spending are often more available to local small businesses than are opportunities for direct interaction with the operators of major projects. This is because the large companies that undertake resource developments frequently centralise their purchasing activities in capital cities; they also often impose strict prequalification requirements which small to medium sized regional businesses find difficult and expensive to meet. Providing goods and services to local consumers, on the other hand, is often more in keeping with the capacity of regional businesses.
2.2 Regional infrastructure and government services
Increased local demand from a resident workforce will include increased demand for local infrastructure, such as for schools, roads and hospitals, as
The economic effects of FIFO 2
Fly-in Fly-out and regional impact assessments
well as demand for additional teachers, doctors, nurses and police etc. At a state level, the additional demand for government provided regional infrastructure and services is an important consideration. Additional school placements in, for example, the Perth metropolitan area, may well be met with existing infrastructure and teachers, while a concentrated increase in regional WA may require the construction of a new school or the expansion of an existing one. In addition, the cost of providing teachers to regional Western Australia is higher than the cost in Perth. It can also be challenging to encourage professionals that are in short supply even in metropolitan areas, such as doctors and nurses, to relocate to remote regions.
Thus the impact of workforce location on government expenditure is also an important component of any evaluation of a FIFO versus resident workforce.
2.3 Labour supply Assuming that sufficient workers are available for either a FIFO or residential workforce, the labour needs of the proposed project will be satisfied. However, an advantage of a residential workforce is that the workers attracted to the regional resource project will frequently be accompanied by a spouse.
Spouses of these workers often bring valuable skills with them to regional economies - skills that are frequently difficult to attract to the region in their own right, such as in the professions of teaching or nursing. Unskilled or semi-skilled spouses are also valuable contributors to local economies. In those professions where wages tend to be lower such as in the hospitality industry, it is difficult to attract workers. However, spouses of resource related workers may be available to undertake lower paid - but still valuable - work within the community.
2.4 Other considerations Another factor to consider in the context of FIFO versus a residential workforce is environmental impacts. If the region near the proposed project has some environmental sensitivity, it may well be that a FIFO workforce has a “lighter footprint” compared to a residential workforce.
Greenhouse implications should also be considered and this works in at least two ways: firstly the additional carbon cost of flying to and from the region in a FIFO situation, and secondly the additional carbon cost of housing families in some of the hotter regions of Western Australia.
Social impacts associated with FIFO workers have been discussed in the literature in terms of family issues in their home region. There are also issues raised about FIFO workforces in the region of the resource project to do with
The economic effects of FIFO 3
Fly-in Fly-out and regional impact assessments
lack of community involvement and some anti-social behaviour. The lack of a resident workforce often denies regional communities access to local potential community leaders, volunteers (such as volunteer fire and ambulance officers as well as sporting coaches and administrators) and community participants (such as members of sporting teams and local associations). The existence of an active community adds to the ‘sense of community’ of a place.
Environmental and social issues are not always easy to account for in simple economic terms. Nonetheless, they are important issues that need to be acknowledged.
2.5 Summary Ideally all of the above factors need to be considered in the modelling/analysis of the impact of a FIFO workforce versus a resident workforce. In some instances the consideration of these factors will be modelled, with a quantitative outcome from the modelling. However, in other circumstances it will not be feasible to quantify the implications of a factor; nevertheless in these circumstances a qualitative assessment can shed light on the importance of the factor to the regional community and to the State.
The economic effects of FIFO 4
Fly-in Fly-out and regional impact assessments
3 The Western Australian approvals process
There is no formal requirement for economic analysis or modelling in the Western Australian approvals process. A number of companies do, however, undertake economic analysis and modelling as under the Environmental Protection Act 1986, the Minister may consider broader impacts when assessing whether to approve a development or not.
The following sections provide a brief overview of the approvals process for industrial and resource developments in Western Australia as described by the Department of Industry and Resources. Each section highlights where economic analysis or modelling may benefit an application for approval.
3.1 Approvals process Gaining necessary approvals and permits for a proposal in Western Australia can involve initiating and managing several parallel processes.
The Western Australian Department of Industry and Resources and the Office of Development Approvals Coordination (ODAC) both provide project proponents with guidance as to the process.
The major government approvals steps to get a project off the ground are obtaining access to land (or waters) and securing approval to use that land (or waters) for the project activity. In addition, some secondary approvals such as for the use of explosives and dangerous goods are usually needed. For some particularly large and complex projects a State Agreement may be developed.
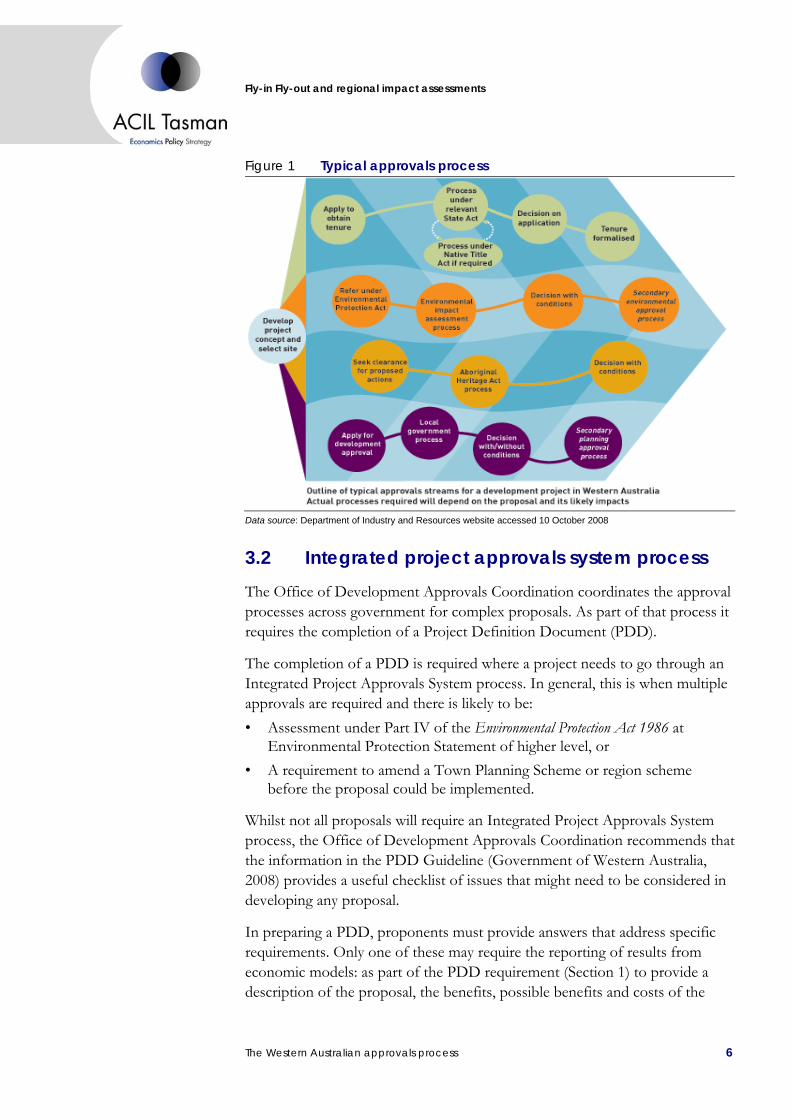
A typical approvals process is illustrated in Figure 1. Actual processes will depend on the proposal and its likely impacts.
The Western Australian approvals process 5
Fly-in Fly-out and regional impact assessments
Figure 1 Typical approvals process
Data source: Department of Industry and Resources website accessed 10 October 2008
3.2 Integrated project approvals system process The Office of Development Approvals Coordination coordinates the approval processes across government for complex proposals. As part of that process it requires the completion of a Project Definition Document (PDD).
The completion of a PDD is required where a project needs to go through an Integrated Project Approvals System process. In general, this is when multiple approvals are required and there is likely to be: • Assessment under Part IV of the Environmental Protection Act 1986 at
Environmental Protection Statement of higher level, or • A requirement to amend a Town Planning Scheme or region scheme
before the proposal could be implemented.
Whilst not all proposals will require an Integrated Project Approvals System process, the Office of Development Approvals Coordination recommends that the information in the PDD Guideline (Government of Western Australia, 2008) provides a useful checklist of issues that might need to be considered in developing any proposal.
In preparing a PDD, proponents must provide answers that address specific requirements. Only one of these may require the reporting of results from economic models: as part of the PDD requirement (Section 1) to provide a description of the proposal, the benefits, possible benefits and costs of the
The Western Australian approvals process 6
Fly-in Fly-out and regional impact assessments
proposal to Western Australia in general must be described. There is no specific recommendation as to what these benefits should include.
The PDD requirements are more specific with regard to environment issues, as spelt out in Section 4 of the document. The issues covered in this section include: • Impacts on flora and fauna • Impact on environmentally sensitive areas • Impact on coastal zones or marine areas (if applicable) • Impact on waterways such as wetlands or estuaries (if applicable) • Impact on water or groundwater hydrology • Availability of and access to water supply • Impact on emissions in the region and state • Impact of waste and its disposal.
Section 4 of the PDD guidelines also covers some social aspects, such as: • Impact on any objective or place of heritage value (if applicable) • Likelihood of a significant impact on community infrastructure.
3.3 Environmental protection Projects that are likely to have significant environmental impact are governed by: • The Environmental Protection Act 1986 (WA) (EP Act) administered by the
Western Australian Department of Environment and Conservation (DEC) • The Environmental Protection and Biodiversity Conservation Act 1999 (Cwlth)
(EPBC Act) administered by the Commonwealth Department of Environment, Water, Heritage and the Arts.
The Environmental Protection Authority (EPA) assesses proposals under the EP Act and advises the Minister for the Environment on whether, and under what conditions, they could be approved. It decides whether an Environmental Impact Assessment (EIA) should be undertaken.
The EPA normally adopts one of five levels of assessment: • Assessment on Referral Information (ARI) • Proposal Unlikely to be Environmentally Acceptable (PUEA) • Environmental Protection Statement (EPS) • Public Environmental Review (PER) • Environmental Review and Management Program (ERMP)
Under EPA assessment it is the proponent's responsibility to demonstrate that:
The Western Australian approvals process 7
Fly-in Fly-out and regional impact assessments
• Planning and design of the proposal incorporates best practicable measures to avoid, and, where this is not possible, to minimise impacts on the environment
• The unavoidable impacts of the proposal are environmentally acceptable, taking into account cumulative impacts that have already occurred in the region, and principles of sustainability.
The principles of sustainability are described in the State Sustainability Strategy (2003) and include consideration of economic variables such as: • Long term economic health • Net benefit from development – development should strive to provide net
environmental, social and economic benefit for future generations
On the basis of the EIA, the EPA advises the Minister for the Environment regarding approval of a project. The Minister, who may take into account broader issues than those considered by the EPA, determines approval, and any conditions to be imposed. These broader issues may but are not required to include economic benefits.
3.4 Department of Treasury and Finance The Department of Treasury and Finance evaluates the impact of major investment proposals on the Western Australian economy. In a document released in 2002 it stated that projects with a present value whole-of-life cost of over $5 million and with significant flow-on impacts may warrant a full benefit-cost analysis. Benefit-cost analysis involves estimation of shadow prices and adjustments for a variety of externalities. In some rare instances, multiplier analysis may be appropriate to examine the indirect impacts of projects. Computer-aided project assessment tools are available to assist with this type of analysis1.
1 Department of Treasury and Finance, Project Evaluation Guidelines, 2002, p 25
The Western Australian approvals process 8
Fly-in Fly-out and regional impact assessments
4 Economic modelling approaches There are various types of economic models and modelling techniques. Many of these are based on partial equilibrium analysis that usually considers a single market. However, in economic analysis, linkages between markets and how these linkages develop and change over time can be critical for assessing project impacts.
There are three approaches that are generally used to clarify the economy wide impacts of a major project. One approach is to estimate input-output multipliers directly from an input-output database of the region. An alternative approach is to use a general equilibrium model of the regional, and/or state and national economies (these models are under pinned by input-output databases). Additionally, cost-benefit analysis can be performed.
This section discusses each modelling/analysis option.
4.1 Input-output analysis An input-output (I-O) table is an accounting framework in which the relationships between industries, households, governments and the traded sector are described. Input-output tables provide detailed information about the inputs used by an industry and the relative importance of industry relationships at a point in time.
Input-output tables and the associated input-output multipliers are tools that are often used to calculate the contribution that an industry makes to the rest of the economy. For example, input-output multipliers can be used to analyse the effect of an industry expansion on the rest of the economy. Input-output multipliers are derived from an input-output table and estimate the direct and indirect effects of an expansion in a particular industry.
4.1.1 Assumptions
The derivation of multipliers from input-output tables requires certain restrictive assumptions to be made. When deriving Type 1 (or simple) multipliers (multipliers which are derived only from the inter-industry interactions presented in the input-output table) the assumptions include: • constant prices • fixed technology • fixed import shares • unlimited supplies of all resources, including labour and capital.
Economic modelling approaches 9
Fly-in Fly-out and regional impact assessments
Type 2 (or total) multipliers (which include not only inter-industry interactions, but also the interaction between wages and household consumption (consumption effects) make the same assumptions as Type 1 (simple) multipliers and also assume that there is a fixed relationship between income and private consumption.
The assumption of unlimited supplies of all resources, including labour and capital can be a severe impediment to credible analysis in situations where economic constraints are present. Remote regions in Western Australia may face such constraints, particularly for labour.
The assumptions underpinning multiplier analysis also mean that the analysis cannot take into account all forms of interdependence between industries. The ABS in its 1996 paper which explained multipliers noted:
The input-output tables underlying multiplier analysis only take account of one form of interdependence, namely the sales and purchase links between industries. Other interdependence such as collective competition for factors of production, changes in commodity prices which induce producers and consumers to alter the mix of their purchases and other constraints which operate on the economy as a whole are not generally taken into account.
The combination of the assumptions used and the excluded interdependence means that input-output multipliers are higher than would realistically be the case. In other words, they tend to overstate the potential impact of final demand stimulus. The overstatement is potentially more serious when large changes in demand and production are considered (ABS 1996, p. 24).
Input-output tables and multipliers are based on the cost structure of industries and the level of economic activity at a particular point in time. They are not well suited to the analysis of social, environment or population changes.
4.1.2 Measuring impacts
Once an I-O table has been constructed, it provides a simple method for measuring the impact of any change in regional and state economic activity on the economy as a whole, and on individual industries. The results of the I-O analysis are frequently presented in the context of implications for: • Output - measures the total value of output generated by all industries in
the economy • Value-added - measures the sum of wages, profits and indirect taxes and is
used to measure the size of an economy in terms of Gross Product • Income - measures the total increase in compensation of employees by all
industries • Employment - measures the impact on full time equivalent employment.
Economic modelling approaches 10
Fly-in Fly-out and regional impact assessments
While the I-O analysis can be used for various purposes, the approach for estimating the effects of FIFO on regions would be focused on the impact of a project on particular region in the WA economy, rather than individual industries as a whole. I-O analysis is by no means exhaustive, but rather provides an indication of the potential impacts on the economy. In this regard, I-O analysis is only a partial measure of total impact and results are highly dependent upon assumptions concerning the structure of the economy and the interrelationships between industries.
The most basic form of I-O analysis involves the use of an I-O table, also known as transaction or flow table. The Australian Bureau of Statistics compiles the I-O tables for the national accounts. The latest full set of I-O tables represents the national economy in 2004-05.
Nevertheless, in order to conduct an economic analysis of regional impacts of FIFO for specific regions a set of regional I-O tables for WA would have to be constructed. This process is complex and requires detailed regional and state wide data. There are only a limited number of consultants, academics and public servants with the capacity to construct regional input-output tables.
4.1.3 Limitations of I-O Analysis
The limitations of the I-O analysis relate to four key simplifying assumptions underpinning the model: • Each industry in the I-O table is assumed to produce a single output • There can be no substitution between the goods or services of different
industry sectors • There are constant returns to scale in production such that the inputs to
production of all industry sectors are in fixed proportion to the level of output from that industry
• The total effect of production in several sectors is equal to the sum of the separate effects.
Therefore, particular care should be used when interpreting multiplier impacts, as they represent a linear response from the increase in final demand under implicit assumptions that an economy or industry has no spare capacity and that the productivity of that industry is constant.
The I-O approach ignores the opportunity costs associated with diverting resources from other productive activities as the model has no mechanism whereby the prices of factors (land, labour and capital) adjust in response to changes in demand. As such, I-O analysis does not consider the efficiency of an investment and the wider social implications. I-O analyses are not well suited to the analysis of social or population changes that might arise over the life of a mining project.
Economic modelling approaches 11
Fly-in Fly-out and regional impact assessments
4.1.4 Summary: I-O analysis
In general, I-O analyses provide a straight forward and relatively simplistic analysis of the economic effects of a project on an economy with pre-established assumptions. However, because the results tend to represent upper level limits on possible impacts the use of input-output multipliers is generally considered very much a second best option by Australian Governments (see Box 1).
Box 1 The Queensland Government approach
The Queensland Government has established its Project Assurance Framework which encompasses the assessment of projects and programs undertaken or subsidised by the Queensland Government. The Project Assurance Framework sets the foundation for ensuring that project management is undertaken effectively across the Queensland Public Sector, and that the Government achieves value for money from its significant investment in project activity. Under the framework the Government stipulates that projects should be assessed for direct State budget impacts as well as for net economic benefits to the community as these could outweigh the net financial costs to Government.
In respect to I-O analysis the Queensland Treasury has certain reservations about the use of multipliers in economic impact analysis, as these can significantly overstate economic impacts2. Nevertheless, the Queensland Treasury provides State and Regional I-O tables on their Treasury homepage.
In order to assess the net benefit to the community the guidelines stipulate the use of a CBA3. Furthermore, the Queensland Government also conducts its own CGE modelling of projects, but only for projects which are of significant magnitude (large capital expenditure) or for modelling economy-wide policy changes like the introduction of an emissions trading scheme. This is due to the nature of CCGE models, as these are very rigorous, and as a result could be time consuming, complex and data intensive.
Finally, the Queensland Treasury states that: ”The choice of an appropriate methodology for economic impact analysis must be undertaken on a case by case basis. Additionally, it is important that the analysis is presented in a manner in which the assumptions underpinning the results are clear. A rigorous assessment should include sensitivity analysis providing information on how changes in the models’ specification, reflecting alternate assumptions, would affect the results.”
4.2 Computable general equilibrium modelling Computable general equilibrium (CGE) models mimic the workings of the economy through a system of interdependent behavioural and accounting equations which are linked to an input-output database. These models provide a representation of the whole economy, set in a national and international trading context, starting with individual markets, producers and consumers and building up the system via demands and production from each component. When an economic shock or disturbance is applied to a model, each of the
2 http://www.oesr.qld.gov.au/queensland-by-theme/economic-performance/research-
papers/overview-econ-impact-analysis/overview-econ-impact-analysis.pdf 3 http://www.treasury.qld.gov.au/office/knowledge/docs/project-assurance-
framework/business-case-development.pdf
Economic modelling approaches 12
Fly-in Fly-out and regional impact assessments
markets adjusts according to the set of behavioural parameters which are underpinned by economic theory.
An example of a behavioural parameter is the price elasticity of demand – the responsiveness of demand for a commodity to a change in the price of that commodity. Each of these markets, for example the market for a commodity or a factor such as labour or land or the market for capital goods, is then linked through trade and investment flows.
Like I-O multipliers, CGE models can be used to analyse the effect of a change in the output of an industry and the direct and indirect flow-on effects this has on the rest of the economy. However, in addition to recognising the linkages between industries, these models also recognise the constraints that apply in an economy (e.g. increased demand for labour may push the costs of labour up if there is full employment).
The economic structure is represented in CGE models by a set of social accounting matrices, or I-O tables linked through trade and investment flows. The database is combined with a set of equations that blends standard macroeconomic accounting identities with well established microeconomic theory to underpin production, consumption, investment and trade. The stylised representation is that of agents (consumers and producers) that are assumed to be in general equilibrium such as that described by Debreu (1954). The historical underpinning of general equilibrium models is presented in Box 2.
CGE models are based on a substantial body of economic theory that includes such theories as cost minimisation or utility maximisation. In this context, CGE models are based on causality rather than correlation. This distinction is important. For example, the causation approach to modelling establishes a behavioural framework where producers are minimising costs in response to changing economic conditions. When the price of an input rises relative to a substitute, the producer will purchase less of the relatively more expensive input.
Most CGE models are dynamic which means that their outputs can be analysed at different points in time in aggregate and by industry. Economic variables which can be analysed include: • Real Gross State Product (or Real Gross Regional Product)4
4 Real Gross Product is a measure of the total real market value of goods and services
produced in the economy of interest (the region, the state, or Australia etc.) in a year after deducting the real cost of goods and services used up in the process of production but before deducting allowances for the consumption of fixed capital. The Real Gross Regional
Economic modelling approaches 13
Fly-in Fly-out and regional impact assessments
• Real Net State Income (Real Net Regional Income)5 • Real Consumption • Real Industry output • Full time equivalent employment.
Box 2 Historical underpinnings of general equilibrium modelling
The emergence of general equilibrium theory is attributable to work undertaken at the Lausanne School by Leon Walras and Vilfredo Pareto. They set about generalising and extending Neoclassical economic theory using mathematical exposition. Walras pursued questions such as the existence of a general equilibrium solution and its stability by defining a set of simultaneous market demand and supply equations – this underpins the "Walrasian" approach. Pareto was more concerned with the decision making of firms and households and the resulting general equilibrium.
In the 1950s, these strains of thought were brought together by practitioners such as Tjalling Koopmans, Kenneth Arrow and Gérard Debreu under the Neo-Walrasian school of thought. Arrow and Debreu (1954) laid the foundations of this school of thought.
For an economic system with given technological and resource limitations, individual needs and tastes, a valuation equilibrium with respect to a set of prices is a state where no consumer can make himself better off without spending more, and no producer can make a larger profit. (Debreu 1954)
The use of general equilibrium analysis to calculate the impact of policy options can be traced back to Harberger (1962, 1964), but this work was generally restricted to two or three sector analysis.
It wasn’t until Shoven and Whalley (1972) began to use more detailed and sophisticated taxation models that the use of general equilibrium analysis began to consider not only taxation issues but issues such as technological change, employment policy and natural resource policy (see for example, Whalley (1975), Shoven (1976), Ballentine and Thirsk (1979), Keller (1980), Piggot (1980), Slemrod (1983) and Piggot and Whalley (1985)). These models were able to consider not only efficiency but equity effects of various policy changes.
Static CGE models provide only a before and after picture of the economy. The impact of any project or policy being the difference between these two economic states of equilibrium - this is referred to as comparative static analysis and given the level of computing power that is now available static models are rarely used.
Product therefore includes compensation of all employees working in the region and returns to land and capital (profit and depreciation) employed in the region.
5 Real Net Income is calculated by subtracting the returns to land, labour and capital which flow into or out of the economy of interest (the region, the state, or Australia etc.) in a year from Real Gross Product for the same year.
Economic modelling approaches 14
Fly-in Fly-out and regional impact assessments
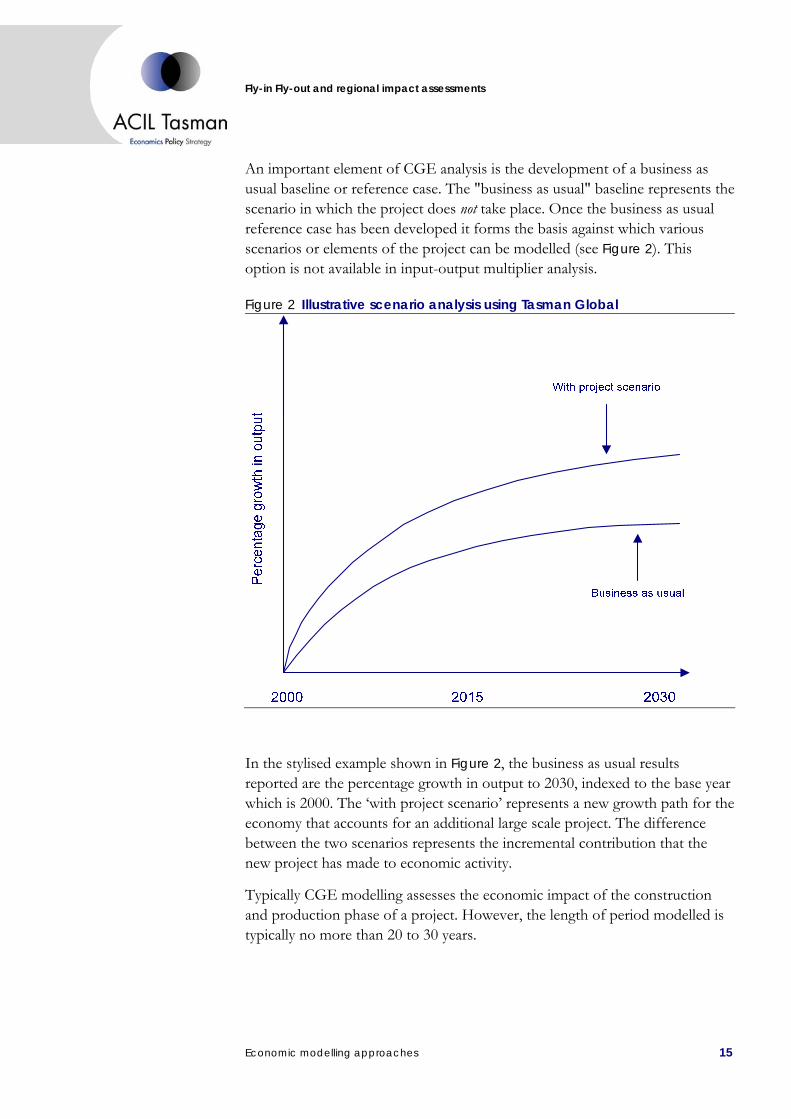
An important element of CGE analysis is the development of a business as usual baseline or reference case. The "business as usual" baseline represents the scenario in which the project does not take place. Once the business as usual reference case has been developed it forms the basis against which various scenarios or elements of the project can be modelled (see Figure 2). This option is not available in input-output multiplier analysis.
Figure 2 Illustrative scenario analysis using Tasman Global
In the stylised example shown in Figure 2, the business as usual results reported are the percentage growth in output to 2030, indexed to the base year which is 2000. The ‘with project scenario’ represents a new growth path for the economy that accounts for an additional large scale project. The difference between the two scenarios represents the incremental contribution that the new project has made to economic activity.
Typically CGE modelling assesses the economic impact of the construction and production phase of a project. However, the length of period modelled is typically no more than 20 to 30 years.
Economic modelling approaches 15
Fly-in Fly-out and regional impact assessments
4.2.1 Regional level analysis
Modern CGE models in Australia can include a full representation of each state and territory with each jurisdiction being analysed as a separate economy within the model. Below the state level these models can frequently be used to analyse regional impacts. This regional analysis is accomplished in one of two ways, either through a bottom-up or top-down approach.
With a bottom-up approach the region or regions being analysed are treated as a fully detailed economy, just as each state and territory economy is analysed. Therefore, the model produces results that include a definition of regional price effects.
The alternative top-down approach takes state level results and the regional results are based on exogenously determined shares of the state results. The top-down approach cannot differentiate regional from state level prices.
When considering the economic impacts of FIFO versus a permanent resident workforce on a regional economy it is important to analyse the impact on Net Regional Income rather than Gross Regional Product. This is because the former takes account of the leakage of income to the rest of the state, national and/or foreign economy, whereas the latter by reporting a gross figure does not. This may more efficiently analysed using a bottom up approach as incomes flows can be directly allocated in this type of model.
4.2.2 Summing up
One complaint sometimes levelled at CGE modelling is that the models are “black boxes”. In part this complaint arises because of the computing used to drive the model and the thousands of simultaneous equations which are solved to reach a modelled equilibrium. However, it must be stressed that the equations which underpin the credible models used in Australia are based on rigorous economic theory.
This theory and the use of the models is generally well understood and highly respected by Australian Government decision makers, such as the Western Australian Department of Treasury and Finance. CGE can be a powerful tool for understanding the implications of FIFO (or residential workforces) to a region and the State as it recognises not only the direct and second round impacts but the third and fourth round etc. impacts of a major project in a region.
The weakness of CGE is that it can only model market impacts on economic variables such as regional gross product, consumption, production and population etc. CGE does not have the capacity to model wider social or
Economic modelling approaches 16
Fly-in Fly-out and regional impact assessments
environmental impacts. (That said, many CGE models can now model the implications of a project for carbon emissions.)
4.3 Cost benefit analysis A cost benefit analysis (CBA) is a process of identifying, measuring and comparing the costs and benefits of a project in current prices terms. The costs and benefits should ideally comprise all direct as well as indirect – external – costs associated with a project or program.
Quantitative cost benefit analysis is conceptually simple, comparing a stream of costs with a stream of benefits where both elements are discounted through time. To the fullest extent possible, benefits and costs ought to be expressed in discounted constant dollars. Benefits and costs should be compared against a baseline, which is the best assessment of the way the world would look without the proposed activity. This baseline is equivalent to the “opportunity cost” of undertaking the activity. If the benefits outweigh this opportunity cost then the project has a positive cost benefit ratio and should proceed.
Once the full range of benefits and costs are understood it is common practice to comprehensively list and qualitatively compare costs and benefits. The aim is then to quantify the stream of benefits and costs. A discount rate is then applied to these streams of benefits and costs to able comparisons to be made. Because results may be sensitive to the choice of discount rate and the valuation techniques used, sensitivity analysis should always be undertaken.
It should be borne in mind that it may be extremely difficult to estimate all of the costs and benefits. However, even where a full quantitative assessment of costs and benefits does not occur, the process of comprehensively listing costs and benefits can provide useful insights.
4.3.1 Comparison against a baseline
As noted above, benefits and costs should be compared against a baseline, which is the best assessment of the way the world would look without the proposed activity (see Figure 3).
A baseline in respect to a new mining project would be the costs and benefits in keeping the status quo, which might be compared to a new mining project with a FIFO workforce and/or the same project with a permanent resident workforce. Alternatively, the baseline could be a FIFO operation compared with the costs and benefits from a permanent resident workforce.
Overall, CBA can be considered as a framework for evaluation rather than a model. As a result, the analysis of a FIFO workfoce will have to be built from the ground up for each resource project evaluated on an individual basis.
Economic modelling approaches 17
Fly-in Fly-out and regional impact assessments
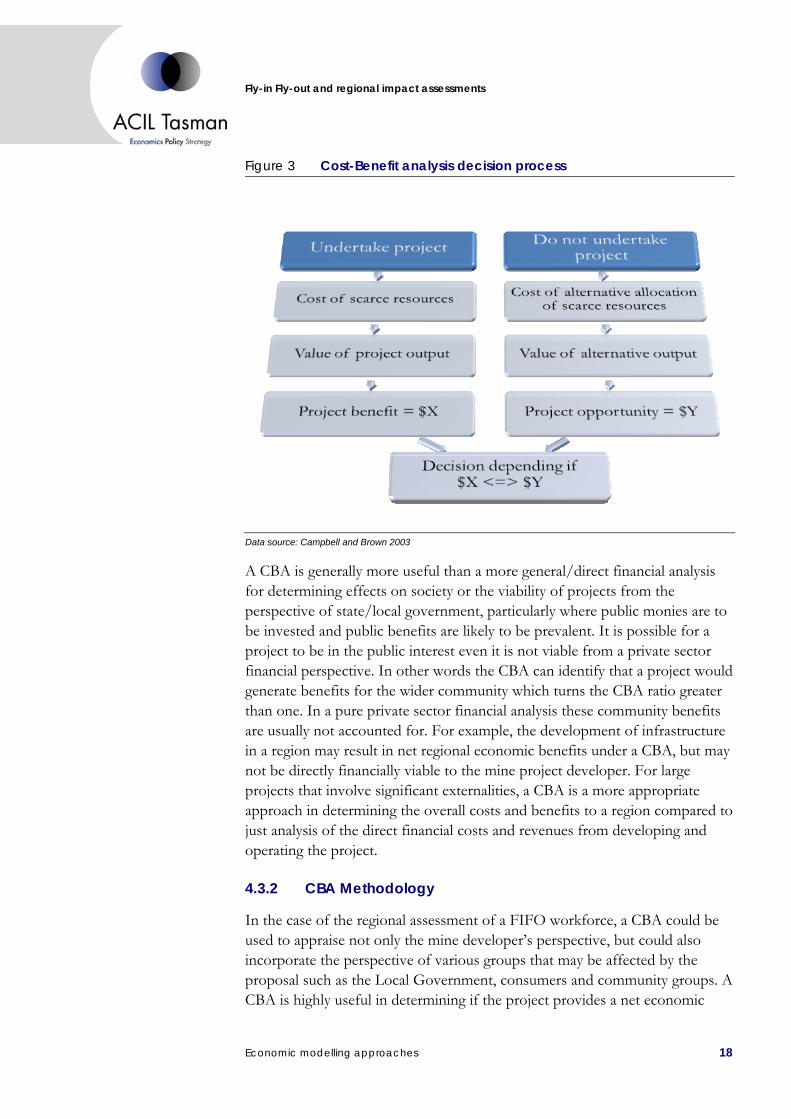
Figure 3 Cost-Benefit analysis decision process
Data source: Campbell and Brown 2003
A CBA is generally more useful than a more general/direct financial analysis for determining effects on society or the viability of projects from the perspective of state/local government, particularly where public monies are to be invested and public benefits are likely to be prevalent. It is possible for a project to be in the public interest even it is not viable from a private sector financial perspective. In other words the CBA can identify that a project would generate benefits for the wider community which turns the CBA ratio greater than one. In a pure private sector financial analysis these community benefits are usually not accounted for. For example, the development of infrastructure in a region may result in net regional economic benefits under a CBA, but may not be directly financially viable to the mine project developer. For large projects that involve significant externalities, a CBA is a more appropriate approach in determining the overall costs and benefits to a region compared to just analysis of the direct financial costs and revenues from developing and operating the project.
4.3.2 CBA Methodology
In the case of the regional assessment of a FIFO workforce, a CBA could be used to appraise not only the mine developer’s perspective, but could also incorporate the perspective of various groups that may be affected by the proposal such as the Local Government, consumers and community groups. A CBA is highly useful in determining if the project provides a net economic
Economic modelling approaches 18
Fly-in Fly-out and regional impact assessments
benefit to the community as a whole. Also it provides a decision-making tool for the efficient allocation of public finances by the Government. In the case of a FIFO workforce compared with the alternative of developing a more localised permanent resident workforce, the analysis should incorporate any expenditure undertaken by the mine proponent and the government, which in turn can be assessed against the benefits to the community as a whole.
The CBA is based on calculating the net present values (NPV) of all cost and benefit items calculated for the economic life of the project. The net benefit indicates the extent to which benefits exceed or fall short of costs. If the net benefit is positive, then the project is said to result in an overall gain to the community.
A CBA tries to be comprehensive and transparent, aiming to take into account and list all relevant positive and negative impacts of a project. In connection to assessing FIFO operations, the costs included in the CBA could include costs of FIFO travel, higher labour turnover rates and the establishment of temporary accommodation. The benefits should include variables such as the increased income to the community from increased demand, increased revenue to the mine operator and/or the local government. These costs and benefits can be considered from the perspective of the region where the mine is located and from the perspective of the state and (if necessary) for the nation.
Furthermore, a CBA should account for any positive and negative externalities, even if a monetary value is not placed on all of them. Externalities may be positive or negative; they are the consequence of an economic activity which impacts on a third party. Aircraft noise and greenhouse gas pollution are both examples of negative externalities. A community's increased participation in physical recreation is generally considered to have positive externalities on health outcomes.
Ideally all benefits and costs should be listed and even if a value cannot be assigned, a qualitative analysis of the importance of the benefit or cost should be undertaken. Since the CBA can be easily applied to a range of projects it is one of the most commonly used economic evaluation methods. However, in developing this report, no example was found of its use in Western Australia in the analysis of a FIFO compared to a permanent resident workforce.
Despite the CBA’s relative simplicity, the methodology has been criticised for limiting quantification of benefits to those which market values are readily available and excluding values for non-monetary effects, such as quality of life and intangible effects that cannot be readily priced. Nonetheless, a CBA can be extended to incorporate the valuation of non-marketed goods and services, such as environmental and social benefits and costs of a proposal.
Economic modelling approaches 19
Fly-in Fly-out and regional impact assessments
Overall, a CBA is comprised of four steps.
Step 1: Determine key assumptions
Documenting the assumptions used in the analysis and the reasons for choosing them is a crucial part of the evaluation process, as these will underpin and determine the extent of the CBA. This should capture and explain all the assumptions underlying all capital and recurrent estimates regarding labour costs, energy costs, demand growth, charges, etc. in the analysis and the rationale for those assumptions. Furthermore, before costs and benefits can be appropriately identified, the spatial reference area of the analysis needs to be determined. This will help to delineate whether the project costs and benefits fall within the region or wider state area. This delineation will help to limit the extent of the study and the nature of any externalities included later in the CBA calculations such that the effects are limited to the region in question.
Stage 2: Identify and estimate the economic benefits and costs of the project
The costs and benefits are measured irrespective of how these are distributed, that is the analysis is conducted from the point of view of the regional community and the state as a whole rather than from a private perspective. For example, the analysis should not only consider the cost of establishing infrastructure but also the benefits to the population from better safer infrastructure.
Furthermore, the costs and benefits should be identified on a comprehensive basis not only on a market transaction basis, and should represent the “true” economic worth adjusted for external market distortions. This could include effects such as the possibility of regional house price increases due to the increase in regional population. Estimating these somewhat intangible costs and benefits for the region is complex, given that the analysis is being undertaken prior to the investment occurring. However, one means of assessing these benefits and costs is from assessments of outcomes from other similar project investments in regions which have similarities with the region of interest. Sensitivity analysis would be important if the data is from such sources.
Consultations with various stakeholders will help to identify the full range of costs and benefits to be incorporated in the analysis. To enable meaningful comparisons to be made between FIFO and a permanent resident workforce alternative, it is important that estimates of costs be undertaken on a consistent basis and that valuation of costs is undertaken on the same basis as benefits between both options. In addition, the level of assessment should be made according to the scope, cost, complexity, riskiness and sensitivity of the mining project.
Economic modelling approaches 20
Fly-in Fly-out and regional impact assessments
Stage 3: Calculate the economic net present value
In this stage, the stream of costs and benefits is discounted to real present values, to arrive at the NPV of the assessment options. Discounting is a technique used to compare costs and benefits that occur in different time periods. It is a separate concept from inflation. A more detailed discussion on the choice of discount rates is set out below.
A project is economically viable if its NPV is greater than zero - that is the total discounted value of the benefits is greater than the total discounted costs and as a result the project is found to have a benefit cost ratio greater than one. Furthermore, calculating the NPV of different alternatives (e.g. a FIFO project compared to the same project, but with a permanent resident workforce) will provide a basis on which alternatives can be easily compared.
Stage 4: Assess risks and sensitivities
An integral part of any CBA is the identification of risks and the evaluation of the sensitivity of project and program outcomes to key assumptions. A particular point to be addressed is the tendency of project proponents and governments to overestimate benefits and underestimate costs – the so called “optimism bias”. As such, sensitivity analysis can identify the range of outcomes under which a project and program will remain viable, and also can highlight specific parts of a project which will have a significant influence on the outcome. Consequently the sensitivity analysis helps to identify key performance measures to be monitored throughout the life of a project.
4.3.3 Common CBA Techniques
Determining discount rates
CBA involves comparing projects options with different flows of financial and/or economic costs and benefits occurring in different time periods and time horizons. Discounting recognises that the use of money is costly – a dollar today is worth more than a dollar in five years time. This concept is known as the time value of money. The time value of money means that cash inflows and outflows occurring in different time periods cannot simply be added together to determine the overall net cost or net benefit of a project. It is necessary to remove the effect of the time value of money – that is cash flows have to be discounted back. This enables projects to be compared in present value terms. Further, if a range of alternative projects are being considered it should be recognised that different projects and different project options have different market risk profiles.
Economic modelling approaches 21
Fly-in Fly-out and regional impact assessments
In this regard, a future revenue or benefit stream which may be highly risky should not be valued as highly as an alternative, less risky, stream with the same nominal value. In these circumstances a higher discount rate for the riskier benefit stream would be appropriate.
There are a number of discount rates which could be appropriate for the assessment of mining projects including those with FIFO programs. One reference point used as a discount rate for projects and programs is the interest rate for government borrowings for a term relevant to the expected duration of the project. However, given that the government can be expected not to default and hence will pay the interest on its borrowings, this rate should be treated as the riskless rate of return. Alternatively, the long-term average real economic growth rate, with an additional allowance for major risks and time preference for current consumption, can be used as the discount rate. As this is a real discount rate, an allowance for inflation needs to be added to discount flows of costs and benefits expressed in nominal terms.
The Western Australian Department of Treasury and Finance released evaluation guidelines for State funded projects in August 2005. These guidelines, which cover financial and economic analysis state in respect of financial analysis that the discount rate depends on the circumstances:
There is no prescribed discount rate. In general, the discount rate should be based on:
• cost of funds - agencies should apply the Western Australian Treasury Corporation (WATC) long-term borrowing rate as the risk-free rate;
• adding to this risk-free rate a premium to allow for risk, based on industry norms; and
• where appropriate, add a further premium to reflect scarcity of capital funds and the availability of other capital investment projects that demonstrate higher internal rates of return (Department of Treasury and Finance, 2005, p. 18).
The NSW Government prefers the stream of costs and benefits to be discounted by a real discount rate of 7%, with sensitivity testing using discount rates of 4% and 10%. In comparison, the QLD Government prefers a interest rate equal to the rate for Government borrowing for a term relevant to the expected duration (for example 10-year QTC bonds for a project expected to generate most costs and benefits within 10 years). Alternatively the QLD Government stipulates the use of the long-term average risk adjusted real economic growth rate, or a rate of return on debt and equity for comparable private sector projects.
Economic modelling approaches 22
Fly-in Fly-out and regional impact assessments
Risk assessment
As noted above, risk assessment can be incorporated into the CBA framework in order to account for uncertainty about future outcomes of projects and programs. Assigning probabilities to particular outcomes corrects for the possibility of overestimation of costs and benefits.
Correcting for any over estimation bias can be applied to all three components of the CBA – that is the capital costs, the duration of the project and the operating costs and benefits. The capital costs can be adjusted according to the degree of confidence in the capital costs estimates, the management of generic risks in the project, and the amount of work undertaken to identify and mitigate specific project risks. In many cases expectations related to market conditions will have to be incorporated into the CBA, and assumptions can be compared to similar projects on which base adjustments to cost estimates can be undertaken.
Probabilities will also reduce these adjustments according to the degree of confidence in the capital duration estimates, the management of generic risks in the project, and the amount of work undertaken to identify and mitigate specific project risks. For example, an extension of time for completion of the project would delay the commencement of the flow of benefits, and therefore affect the NPV of benefits for the project option.
Adjustments for optimism in estimating operating costs can be made for known market factors (for example, rates of wage increase, rents) and experience in similar projects. These adjustments could be made within the sensitivity analysis for a project - that is the sensitivity analysis could build in a range of assumptions for wages growth, changes in population, changes in taxes and charges, and budget outlays.
A Monte Carlo analysis is sometimes incorporated into the CBA. Monte Carlo analysis involves replacing single entries for key inputs to a CBA with probability distributions of values for these inputs. The range of possible values would be based on sensitivity testing. In Monte Carlo analysis a calculation of costs and benefits is carried out many times randomly using a computer program, to combine different input values selected from the probability distributions for the inputs. The results consist of a set of probability distributions showing how changes in key inputs are likely to affect project outcomes. As a result the Monte Carlo analysis can show the percentage chance of the cost of a project being below an acceptable maximum, or the benefits exceeding a minimum level. Monte Carlo analysis would only be necessary in circumstances where the size and complexity of the project is considerable.
Economic modelling approaches 23
Fly-in Fly-out and regional impact assessments
Shadow pricing and valuing non-monetary benefits
As discussed previously, the CBA should aim to incorporate the full range of economic, social and environmental costs and benefits of a project. An economic valuation of environmental assets seeks to measure environmental goods and services, ideally in dollar terms, but at a minimum in qualitative terms.
However, many social and environmental costs and benefits do not have a market price attached to them. There are a number of different approaches which can be applied in order to value these effects. The prices for these costs and benefits can be based on observed changes to existing commodities and goods (this is known as hedonic pricing). For example the change in house prices due to increased demand following an introduction of a new mining project in a similar regional location. An alternative approach relies on surveys of the general public as to what price they attach to a particular benefit or are willing to accept as a cost (contingent value approach). However, such an approach to measuring value can be very expensive to implement.
4.3.4 Issues and Limitations
Despite the conceptual simplicity and intuitive appeal of comparing benefits with costs, many problems can be expected to be encountered in practice. These include difficulties in: • Identifying the full range of benefits and costs and where they fall in the
region or the wider state (these costs and benefits include, where appropriate, positive or negative externalities)
• Differentiating benefits from costs • Quantifying the benefits and costs, especially in the case of externalities, as
there is no market price • Choosing an appropriate discount rate for comparing costs and benefits
over time • Handling multi-attributed and intermediate outcomes.
4.3.5 Summary: CBA
CBA can be considered as an evaluation framework rather than a model. As a result, the analysis of a FIFO project and a permanent residential workforce project will have to be built from the ground up for each project evaluated. Nevertheless, CBA represents a commonly used and understood tool for assessing projects where regional outcomes are important. With this in mind the CBA needs to identify benefits and costs at a regional level as well as benefits and costs at the state (and if appropriate) the national level.
Economic modelling approaches 24
Fly-in Fly-out and regional impact assessments
The CBA provides a structured and a transparent way of assessing projects as it attempts to list and capture all possible cost and benefits of a project. Nevertheless, it can be intensive in terms of data collection and estimation of the input costs and benefits. This is due to the fact that the costs and benefits of externalities are usually not readily available and considerable resources have to be allocated in order to estimate these. Furthermore, in a number of cases the estimation of indirect cost and benefits will depend on assumptions made and can be open to discussion.
In some circumstances it can be appropriate to use CBA in conjunction with CGE analysis; circumstances where this approach can be useful include where there are significant non-market benefits or costs associated with the proposed investment. As noted previously, CGE is not well suited to the analysis of non-market benefits or costs. However, it is very well suited to the analysis of the economic impacts of a project on a region, state or nation. The Net income outputs of the CGE modelling could be used as an input to the CBA analysis in circumstances where it is assessed that there are significant non-market benefits and/or costs.
Economic modelling approaches 25
Fly-in Fly-out and regional impact assessments
5 Availability of models
5.1 Input-output tables There are a limited number of published input-output tables and multipliers for the Development Commission regions of Western Australia: • a Kimberley table for 1994/95 (Johnson, 2001) • a Pilbara table for 1994/95 (Johnson, 2003) • a Gascoyne table for 2001/02 (Gascoyne Development Commission,
2004).
It is known that tables for other Development Commission regions have been produced for use in economic impact assessments: however, these have not been published. These include tables for the Peel, South West, Wheatbelt and Mid West regions.
5.2 Cost-benefit Cost benefit is not a model, it is an analytical technique. Cost benefit analysis can be applied at any regional level.
5.3 CGE models The best known of the CGE models in Australia are the Monash family of models developed at the Centre of Policy Studies (COPS) at Monash University in Melbourne. The Monash Multiregional Forecasting Model (MMRF) is frequently applied to economic assessments in Western Australia and is used by the Western Australian Department of Treasury and Finance. MMRF applies the top-down procedure to Western Australian modelling results to derive the regional economic impacts. The standard regions in the MMRF are statistical divisions (as defined by the Australian Bureau of Statistics).
TERM (The Enormous Regional Model) is a bottom-up model of the Australian economy and covers the 57 statistical divisions of Australia (including the nine statistical divisions of Western Australia). TERM is also a product of COPS. (More background on the COPS regional modelling can be found at http://www.monash.edu.au/policy/regmods.htm).
An alternative CGE model with regional capabilities is the Tasman Global model developed jointly by two economic consulting companies: ACIL Tasman and Prime Research. Tasman Global has its origins in the GTAP
Availability of models 26
Fly-in Fly-out and regional impact assessments
model, initially developed at Purdue University in the United States of America. Tasman Global can analyse any and all of the Development Commissions of WA and has been applied to projects with Development Commission regions in the past. Tasman Global uses a bottom-up approach.
The Australian Bureau of Agricultural and Resource Economics (ABARE), based in Canberra, are proficient in CGE modelling. Their Ausregion model is capable of bottom up modelling of statistical divisions within all states of Australia.
Access Economics, a Canberra/Melbourne based economic consultancy, has the AERCGEM model, which also has a bottom-up regional capability. Both ABARE's models and Access Economics' AERCGEM model have their origins with the GTAP model.
MMRF, TERM, Tasman Global, Ausregion and AERGEM are dynamic CGE models producing year on year results. An older comparative static model has been used to perform regional analysis in WA: the WAT (WA two region model (Johnson, 2003). The WAT model is no longer in use.
Availability of models 27
Fly-in Fly-out and regional impact assessments
6 Data requirements The quality of analysis produced from the three techniques described in this report depends heavily upon the quality of the data used. It can be seen from the following discussion that all techniques are relatively data intensive.
6.1 Input-output tables Assuming an appropriate I-O table is available for the region under consideration, in order to undertake a full economic impact assessment of a resource development project, spending data related to the production and operations phase of the project is required. This data should include a detailed list of items/services to be purchased and the source (region, rest of WA, rest of Australia or foreign imports) of these purchases, with special attention to those purchases that are likely to be made from within the region. The differences in the cost of construction and in operation costs between a FIFO workforce and a resident workforce will also be needed. Employment numbers during construction and operation, under both FIFO and resident workforce, would also be required.
Workforce wages and salaries data will be important for the analysis in order to estimate impacts associated with local spending by the workforce, whether FIFO or residential. A FIFO workforce may still spend within the region, so long as the workers have access to local retailers. FIFO in a remote location obviously prevents this being a realistic option.
If an appropriate I-O table is not available for the region under consideration, it would be necessary to construct a new table. The construction of I-O tables is generally undertaken by a specialist. However, the data required to construct a new I-O table would at a minimum include employment and output data by industry for the region of interest.
6.2 Cost benefit analysis As noted above, CBA can be a standalone analysis or the approach can be used in conjunction with the output of CGE modelling or multipliers derived from I-O modelling.
Typically, impact assessment CBA involves the input of I-O multipliers to assess indirect economic impacts. However, a preferred approach would be to use the outputs of CGE modelling. The information required would include:
Data requirements 28
Fly-in Fly-out and regional impact assessments
• Background on the region of interest’s growth, infrastructure etc. and the likelihood for change in the absence of the project
• Project construction costing over time, by region in which items were sourced and expended
• Operating costs and revenues, by region • Estimates of the increase in population arising as a result of a project’s
decision to operate with a permanent resident workforce • Estimates of the interaction between a FIFO workforce and the region of
interest arising as a result of a project’s decision to operate with a FIFO workforce
• Wages and salaries paid by region • Returns to capital • Project related income transfers into or out of the region of interest • Estimates of the indirect effects (may be estimated using multipliers or
CGE) on businesses supplying the project • Implications of the project on the cost of housing e.g. rents • Estimates of the social implications for the region of interest • Implications of any positive or negative externalities (e.g. Greenhouse gas
emissions) and their impact on the regions of interest. • Implications of the project on demand for public infrastructure and any
additional investments in public infrastructure required as a result of the project (Note if this impact is estimated using multipliers or CGE no additional work is required for the CBA).
6.3 CGE modelling To undertake CGE modelling of a resource project the same project data required for I-O modelling (described above) would be needed. In addition to that data, the following data items/information would be required: • Demographics of a typical workforce in the region (so as to estimate
potential additional workers provided by spouses and the potential need for additional public infrastructure)
• Capacity and use of current public infrastructure • Location of shareholders of the resource project's proponent (in order to
estimate income distributions).
6.4 Confidentiality of data Economic impact assessments are ideally performed with access to detailed project data. Frequently the analysts utilising this data will be subject to confidentiality agreements to protect the interests of the project proponents.
Data requirements 29
Fly-in Fly-out and regional impact assessments
The impact analysis technique applied - I-O, cost benefit or CGE modelling - takes this data as an input. The results produced from the analysis are usually presented in such a manner that the confidentiality of the data used is protected. For example, I-O and CGE approaches produce results at a very aggregated level, such as gross domestic product (GDP)6, total output, total employment and total private consumption impacts.
Providing higher level economic impacts (GDP, total employment etc.) prevents the confidential detail in proponent’s data being revealed. It is also possible using input-output and CGE approaches to estimate impacts on the output and employment of different industries in the economy (regional, State or national). Even when these more detailed analytical results are released, the confidential information is still well protected; however, this is reviewed on a case by case basis.
As noted previously, the results of CBA are presented in NPV terms and as a benefit cost ratio both of which assist with maintaining the confidentiality of project data. However, typically the stream of benefits and costs is also presented in a report appendix; this information would most likely need to be aggregated up or kept confidential to the investor and the government assessing the project.
6 GDP captures value added at the national level and is the value used to measure the size of
the Australian economy. Gross state product (GSP) and gross regional product (GRP) are the state and regional equivalents respectively.
Data requirements 30
Fly-in Fly-out and regional impact assessments
7 Transparency, accessibility and ease of use
7.1 Input-output tables Input-output analysis is the simplest of the three techniques being considered, particularly when used at a national level, where the Australian Bureau of Statistics has created the I-O tables and estimated the multipliers.
However, state and region regional I-O tables are not as readily available and can vary in quality and are frequently out of date. Nevertheless, I-O analysis is the quickest method to implement if a regional I-O table of sufficient quality is available.
On the other hand, there are relatively few economists with training and practical experience in the development of I-O tables and the calculation and use of multipliers. As a result, if applied by analysts not familiar with the technique, the methodology can be subject to misuse.
7.2 Cost benefit analysis CBA if done rigorously will at a minimum list and qualitatively assess all benefits and costs. Hence the methodology offers considerable transparency. However, the estimation of indirect cost and benefits will depend on assumptions made and can be open to discussion (as noted above in some instance input multipliers or CGE modelling may be used to quantify net economic impacts). Sensitivity analysis of the discount rate used and any other key assumptions made helps to add to the rigour of the CBA methodology.
On the other hand, CBA can be time and cost intensive if quantitative assessments are made (in terms of data collection and estimation of the costs and benefits), particularly if taken to the extreme using methods such as contingent valuation and survey techniques. The use of such techniques could only be justified for very large projects, which are expected to have very large negative externalities. Often the costs can be mitigated by using data from a review of the literature supplemented by sensitivity analysis.
Most microeconomic economists have had training in the theory of CBA and many economists working in universities, the public service and in the private sector would have the expertise to conduct at least a basic analysis. Use of non-market techniques such as contingent valuation is more specialised and hence less accessible.
Transparency, accessibility and ease of use 31
Fly-in Fly-out and regional impact assessments
7.3 CGE modelling CGE models are proprietary models; however, versions of the MMRF and TERM model are available to download. These downloadable versions are supported by databases that do not have the detail of the full model; they are, however, more than adequate for most analyses.
The MMRF model contains over 9,000 lines of model code. Other models are similarly complex. Therefore, modelling cannot be easily undertaken by analysts that are not thoroughly familiar with the technique and with the specific model to be used. With such a high level of complexity, these models lack the transparency of a simpler technique such as I-O modelling. Despite that, the results from CGE modelling should be explainable in terms of the model's underlying economic theory.
Transparency, accessibility and ease of use 32
Fly-in Fly-out and regional impact assessments
8 Costs of using models The cost of applying I-O and CGE techniques consists of three components: 1. The cost of utilising the intellectual property (model purchase or usage fee)
or in some cases the cost of creating the intellectual property (for example creating an input-output table for a region)
2. The cost of purchasing the data required to perform the analysis 3. The analysts' labour costs and any disbursement costs.
As CBA is a methodology rather than a model only the later two costs are relevant.
The costs described below will be exclusive of GST unless otherwise stated. These costs are provided as a guide only and do not represent a quote from ACIL Tasman. Actual costs would be dependent on the scope of work and the complexity of the project.
8.1 Input-output tables Where a regional I-O table is not available, the cost of producing the table varies depending upon the amount of available data at the regional level. The more data that is available the better the regional I-O table will represent the regional economy. More data requires more processing time and so the cost of the regional table increases with its quality, as should be expected. There is frequently a requirement for data purchases for the creation of regional I-O tables, adding to the overall costs.
A reasonable estimate for the cost of creating a basic regional I-O table is $2,000 to $5,000. However, tables that make extensive use of regional data can cost in excess of $10,000 to produce.
Data may need to be purchased to provide descriptive information on the region, for example demographics. These costs, where present, are usually less than $500.
It is the analysts’ time that contributes the most cost to economic analysis using input-output tables and input-output multipliers. Much of the analysts time will be spent on the data provided by the project proponent, preparing it for use with the input-output table and multipliers: putting the data in a format consistent with industry definitions used in input-output tables.
Costs of using models 33
Fly-in Fly-out and regional impact assessments
The analysts’ time on a resource project economic impact analysis may cost around $15,000. This time would include the analyst comparing impacts associated with a FIFO workforce compared to a resident workforce.
Therefore, an estimate of the overall cost of input-output analysis of a regional resource project, including an analysis of FIFO versus a residential workforce would be in the order of $15,000 to $25,000 plus disbursements and GST.
If it was required that the analysis include FIFO from a regional centre (in addition to the analysis of FIFO from Perth), then additional work would be required to estimate impacts on the host region - around $2,500 to $7,500 additional cost, plus disbursements and GST.
8.2 Cost benefit analysis Cost benefit analysis like I-O analysis relies on the availability of data and its cost to purchase. The cost of an analysis will depend on the complexity of the issues and the detail required. A brief regional analysis with only a qualitative assessment of non-market outcomes could cost in the order of $20,000 to $30,000, plus any disbursements and GST. However, if an analysis is required at the regional and state level, the cost could escalate to between $30,000 and $40,000 plus any disbursements and GST.
If the project involved considerable non-market benefits or costs and if these costs needed to be quantified directly rather than by undertaking a review of the literature the costs could rise significantly and could be in the order of $80,000 to $100,000 plus any disbursements and GST.
8.3 CGE modelling CGE model owners may charge a base fee when they use their models on an analysis. This fee is to cover the intellectual property included in the model. This fee can be up to $4,000.
As with I-O analysis, CGE modelling may require the purchase of some data. A data cost of in the order of $500 is not unreasonable.
Again it is the analysts’ time that contributes the most to the cost of economic analysis using CGE models. As with I-O analysis, much of the analysts time will be spent manipulating the data provided by the project proponent and preparing it for use with the model (for example, putting the provided data into a format consistent with industry definitions used in the model).
The analysts’ time on a resource project economic impact analysis may cost around $25,000 to $45,000. This time would include the analyst comparing impacts associated with a FIFO workforce compared to a permanent resident
Costs of using models 34
Fly-in Fly-out and regional impact assessments
workforce. A large price range has been included here as costs may vary considerably between modellers and these prices are generally not "common knowledge". Also the complexity associated with these impact assessments can vary considerably between projects. The number of regions to be analysed will also contribute to the cost, further if the region of interest is not already explicitly incorporated in the model additional database development can be required.
Therefore, an estimate of the overall cost of CGE analysis of a regional resource project, including an analysis of FIFO versus a residential workforce would be in the order of $25,000 to $50,000 plus disbursements and GST.
If it was required that the analysis include FIFO from a regional centre (in addition to the analysis of FIFO from Perth), then additional work would be required to estimate impacts on the host region - around $5,000 to $8,000 in additional cost plus disbursements and GST.
Costs of using models 35
Fly-in Fly-out and regional impact assessments
9 Recommendations
9.1 Is there a "best" model?
9.1.1 Requirements of the model
In choosing a "best" model we should first remind ourselves what we are requiring of the model/approach, as discussed in Section 2, we require that: 1. Leakages from the regional economy associated with FIFO workers
income are addressed 2. Additional government costs associated with regional residential workers
and their families are incorporated 3. The potential for additional regional labour supply from resident workers
spouses is considered 4. Other factors, such as potential environmental and social costs, are
addressed or at least acknowledged.
Point 1 can be addressed with I-O analysis in two ways: by adjusting the derivation of I-O multipliers so that income that is spent in the local region is identified separately from income sent to another region; and/or by dealing with workers spending on an individual item-by-item basis. In either approach the difference between spending patterns by resident versus FIFO workforces can be analysed.
CGE analysis can also address these differences by sending income from the region containing the resource project to an alternative region. This approach may require modifications to some of the existing CGE models in use - the Tasman Global model is known to have this capability currently and it should not be difficult for other models to incorporate this capability if not already available in the models.
Cost benefit analysis can also be used to consider the issue of income leakage.
Point 2 will not be covered in a simple I-O analysis. However, after undertaking additional research, along the lines covered in the CBA, multiplier analysis of the impact of additional government expenditures could be undertaken. Analysis of this type will need to assume that any regional government expenditure is balanced by a decrease in government expenditure elsewhere in the WA economy.
CGE models include a Government services industry, and in some models separate representations of the education and health industries. The output of
Recommendations 36
Fly-in Fly-out and regional impact assessments
these industries will increase or decrease in response to a change in demand. However, the industries are stylised representations of government/health/education services output and do not take necessarily account of the wide range of output types associated the delivery of government services in a region or state. Hence, a more appropriate means of addressing the issue would be for the modellers to undertake additional research to clarify the likely change in government services infrastructure demand and model the increase in investment required directly, along similar lines to the modelling of the project investment. Any additional government infrastructure capital can be modelled as being financed by reduced capital expenditure elsewhere or through government debt.
Point 3 cannot be covered using I-O analysis. The I-O approach assumes that there is an unlimited supply of labour in the region. Therefore I-O cannot assess the benefits of additional regional labour as a result of a project worker’s spouse relocating to the region.
CGE models, which are capable of imposing a labour supply limitation, are well suited to address the impacts associated with additional regional labour resulting from spouse relocation.
Cost benefit analysis is also able to consider how the additional labour provided by the spouses of resource project workers can affect the region’s labour supply and address any labour demand shortages.
Point 4 is generally the domain of cost benefit analysis. CGE models can address certain environmental costs - they are extensively used to assess the implications of climate change and the imposition of greenhouse gas emissions trading. However, these models are not generally applied across other environmental or social issues.
I-O analysis can be applied to assess Greenhouse gas issues; however, they are now rarely used for this purpose as CGE models are seen as a more appropriate tool.
9.1.2 Simplicity and transparency:
There can be no "easy to use" best model that meets the requirement to analyse the regional impacts of resource projects, particularly if the different impacts of a FIFO workforce and a residential workforce are to be examined. Greater simplicity requires greater abstraction from reality; however, to credibly analyse the impact of resource projects at the regional level requires a model with significant detail. In addition, skilled professionals will be needed to run any model or to conduct any cost benefit analysis. Knowledgeable professionals will be required to interpret model/analysis outcomes.
Recommendations 37
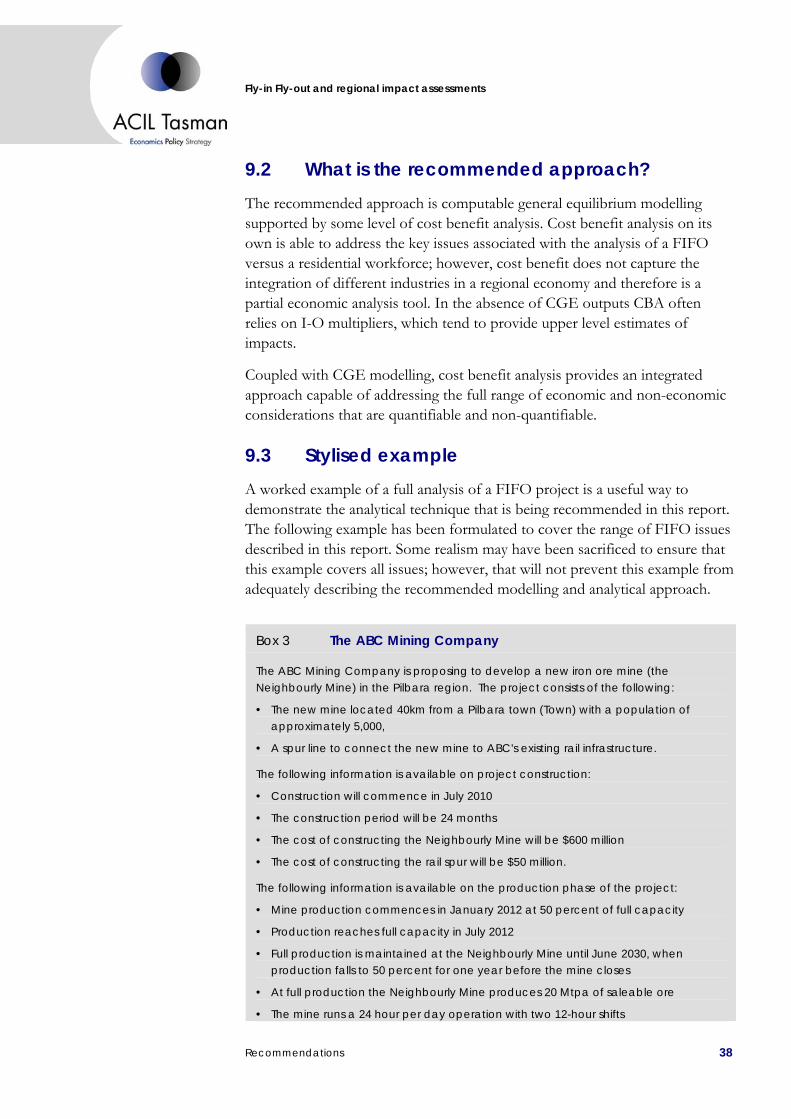
Fly-in Fly-out and regional impact assessments
9.2 What is the recommended approach? The recommended approach is computable general equilibrium modelling supported by some level of cost benefit analysis. Cost benefit analysis on its own is able to address the key issues associated with the analysis of a FIFO versus a residential workforce; however, cost benefit does not capture the integration of different industries in a regional economy and therefore is a partial economic analysis tool. In the absence of CGE outputs CBA often relies on I-O multipliers, which tend to provide upper level estimates of impacts.
Coupled with CGE modelling, cost benefit analysis provides an integrated approach capable of addressing the full range of economic and non-economic considerations that are quantifiable and non-quantifiable.
9.3 Stylised example A worked example of a full analysis of a FIFO project is a useful way to demonstrate the analytical technique that is being recommended in this report. The following example has been formulated to cover the range of FIFO issues described in this report. Some realism may have been sacrificed to ensure that this example covers all issues; however, that will not prevent this example from adequately describing the recommended modelling and analytical approach.
Box 3 The ABC Mining Company
The ABC Mining Company is proposing to develop a new iron ore mine (the Neighbourly Mine) in the Pilbara region. The project consists of the following:
• The new mine located 40km from a Pilbara town (Town) with a population of approximately 5,000,
• A spur line to connect the new mine to ABC's existing rail infrastructure.
The following information is available on project construction:
• Construction will commence in July 2010
• The construction period will be 24 months
• The cost of constructing the Neighbourly Mine will be $600 million
• The cost of constructing the rail spur will be $50 million.
The following information is available on the production phase of the project:
• Mine production commences in January 2012 at 50 percent of full capacity
• Production reaches full capacity in July 2012
• Full production is maintained at the Neighbourly Mine until June 2030, when production falls to 50 percent for one year before the mine closes
• At full production the Neighbourly Mine produces 20 Mtpa of saleable ore
• The mine runs a 24 hour per day operation with two 12-hour shifts
Recommendations 38
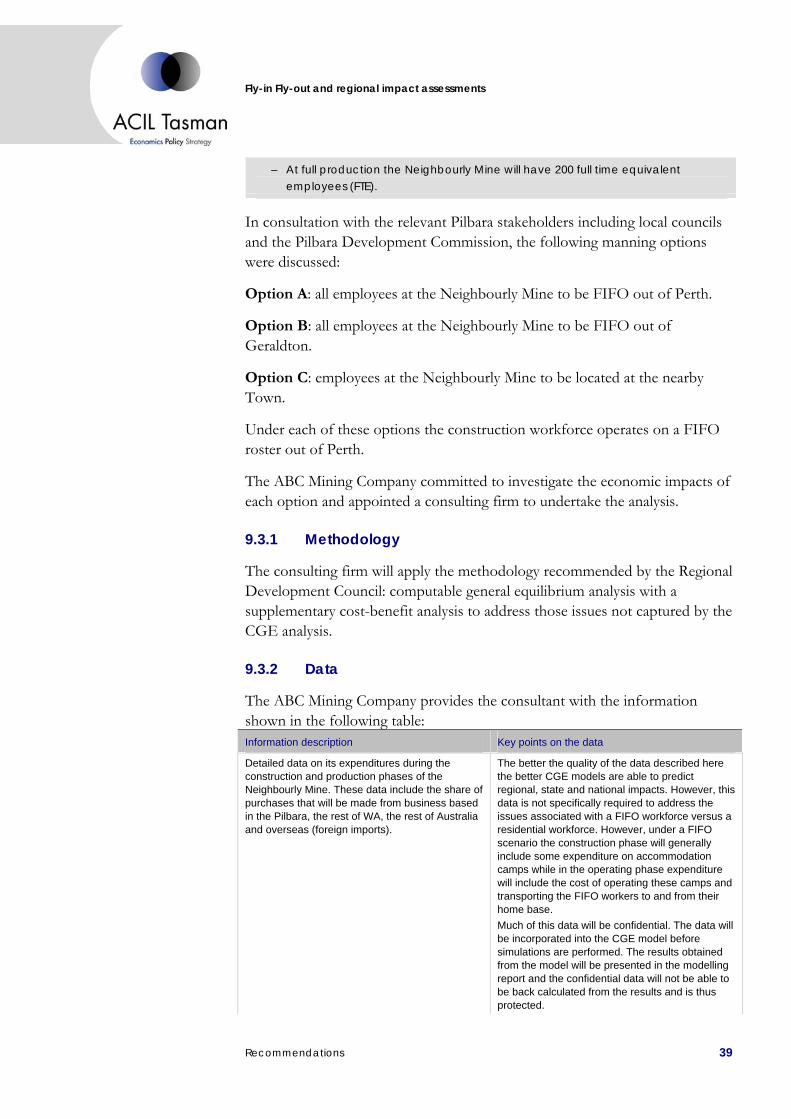
Fly-in Fly-out and regional impact assessments
– At full production the Neighbourly Mine will have 200 full time equivalent employees (FTE).
In consultation with the relevant Pilbara stakeholders including local councils and the Pilbara Development Commission, the following manning options were discussed:
Option A: all employees at the Neighbourly Mine to be FIFO out of Perth.
Option B: all employees at the Neighbourly Mine to be FIFO out of Geraldton.
Option C: employees at the Neighbourly Mine to be located at the nearby Town.
Under each of these options the construction workforce operates on a FIFO roster out of Perth.
The ABC Mining Company committed to investigate the economic impacts of each option and appointed a consulting firm to undertake the analysis.
9.3.1 Methodology
The consulting firm will apply the methodology recommended by the Regional Development Council: computable general equilibrium analysis with a supplementary cost-benefit analysis to address those issues not captured by the CGE analysis.
9.3.2 Data
The ABC Mining Company provides the consultant with the information shown in the following table: Information description Key points on the data
Detailed data on its expenditures during the construction and production phases of the Neighbourly Mine. These data include the share of purchases that will be made from business based in the Pilbara, the rest of WA, the rest of Australia and overseas (foreign imports).
The better the quality of the data described here the better CGE models are able to predict regional, state and national impacts. However, this data is not specifically required to address the issues associated with a FIFO workforce versus a residential workforce. However, under a FIFO scenario the construction phase will generally include some expenditure on accommodation camps while in the operating phase expenditure will include the cost of operating these camps and transporting the FIFO workers to and from their home base. Much of this data will be confidential. The data will be incorporated into the CGE model before simulations are performed. The results obtained from the model will be presented in the modelling report and the confidential data will not be able to be back calculated from the results and is thus protected.
Recommendations 39
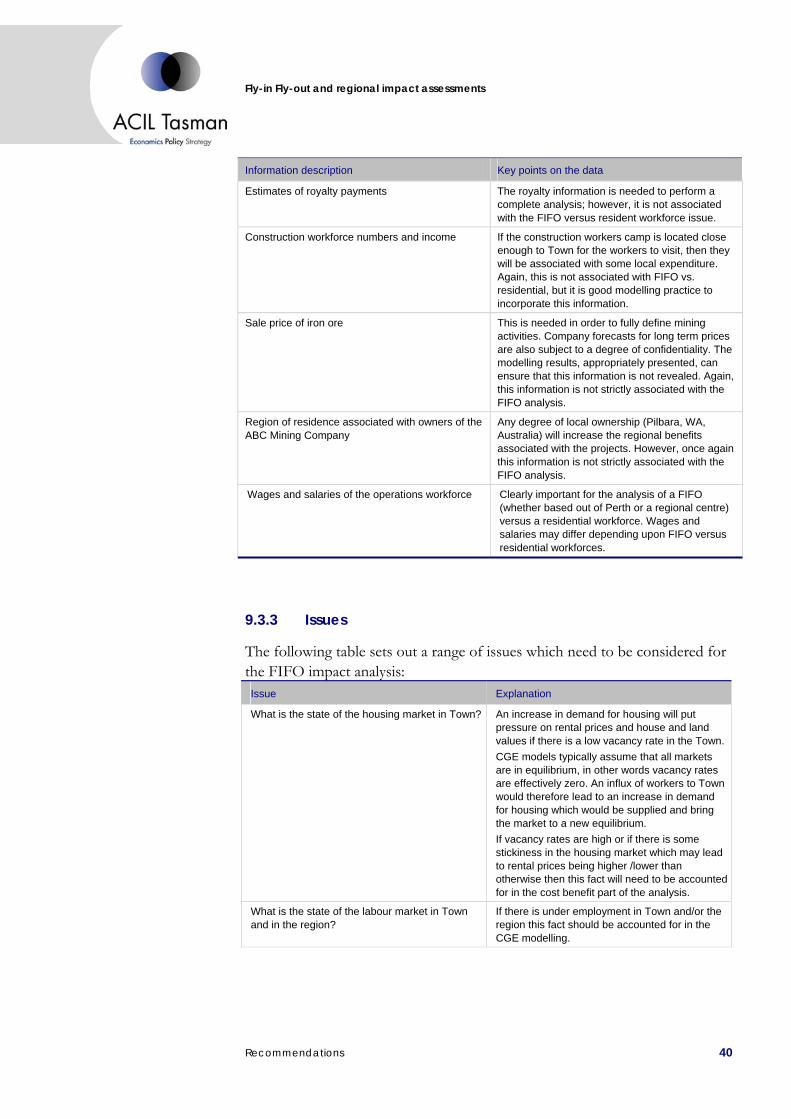
Fly-in Fly-out and regional impact assessments
Information description Key points on the data
Estimates of royalty payments The royalty information is needed to perform a complete analysis; however, it is not associated with the FIFO versus resident workforce issue.
Construction workforce numbers and income If the construction workers camp is located close enough to Town for the workers to visit, then they will be associated with some local expenditure. Again, this is not associated with FIFO vs. residential, but it is good modelling practice to incorporate this information.
Sale price of iron ore This is needed in order to fully define mining activities. Company forecasts for long term prices are also subject to a degree of confidentiality. The modelling results, appropriately presented, can ensure that this information is not revealed. Again, this information is not strictly associated with the FIFO analysis.
Region of residence associated with owners of the ABC Mining Company
Any degree of local ownership (Pilbara, WA, Australia) will increase the regional benefits associated with the projects. However, once again this information is not strictly associated with the FIFO analysis.
Wages and salaries of the operations workforce Clearly important for the analysis of a FIFO (whether based out of Perth or a regional centre) versus a residential workforce. Wages and salaries may differ depending upon FIFO versus residential workforces.
9.3.3 Issues
The following table sets out a range of issues which need to be considered for the FIFO impact analysis: Issue Explanation
What is the state of the housing market in Town? An increase in demand for housing will put pressure on rental prices and house and land values if there is a low vacancy rate in the Town. CGE models typically assume that all markets are in equilibrium, in other words vacancy rates are effectively zero. An influx of workers to Town would therefore lead to an increase in demand for housing which would be supplied and bring the market to a new equilibrium. If vacancy rates are high or if there is some stickiness in the housing market which may lead to rental prices being higher /lower than otherwise then this fact will need to be accounted for in the cost benefit part of the analysis.
What is the state of the labour market in Town and in the region?
If there is under employment in Town and/or the region this fact should be accounted for in the CGE modelling.
Recommendations 40
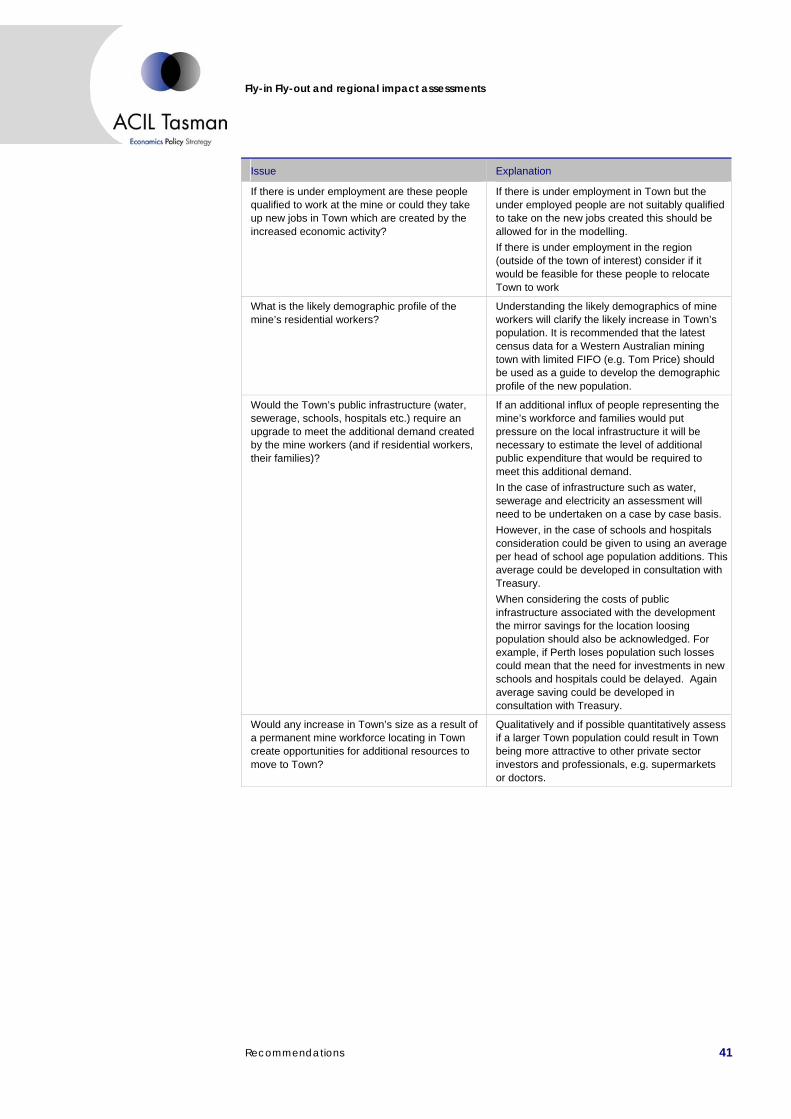
Fly-in Fly-out and regional impact assessments
Issue Explanation
If there is under employment are these people qualified to work at the mine or could they take up new jobs in Town which are created by the increased economic activity?
If there is under employment in Town but the under employed people are not suitably qualified to take on the new jobs created this should be allowed for in the modelling. If there is under employment in the region (outside of the town of interest) consider if it would be feasible for these people to relocate Town to work
What is the likely demographic profile of the mine’s residential workers?
Understanding the likely demographics of mine workers will clarify the likely increase in Town’s population. It is recommended that the latest census data for a Western Australian mining town with limited FIFO (e.g. Tom Price) should be used as a guide to develop the demographic profile of the new population.
Would the Town’s public infrastructure (water, sewerage, schools, hospitals etc.) require an upgrade to meet the additional demand created by the mine workers (and if residential workers, their families)?
If an additional influx of people representing the mine’s workforce and families would put pressure on the local infrastructure it will be necessary to estimate the level of additional public expenditure that would be required to meet this additional demand. In the case of infrastructure such as water, sewerage and electricity an assessment will need to be undertaken on a case by case basis. However, in the case of schools and hospitals consideration could be given to using an average per head of school age population additions. This average could be developed in consultation with Treasury. When considering the costs of public infrastructure associated with the development the mirror savings for the location loosing population should also be acknowledged. For example, if Perth loses population such losses could mean that the need for investments in new schools and hospitals could be delayed. Again average saving could be developed in consultation with Treasury.
Would any increase in Town’s size as a result of a permanent mine workforce locating in Town create opportunities for additional resources to move to Town?
Qualitatively and if possible quantitatively assess if a larger Town population could result in Town being more attractive to other private sector investors and professionals, e.g. supermarkets or doctors.
Recommendations 41
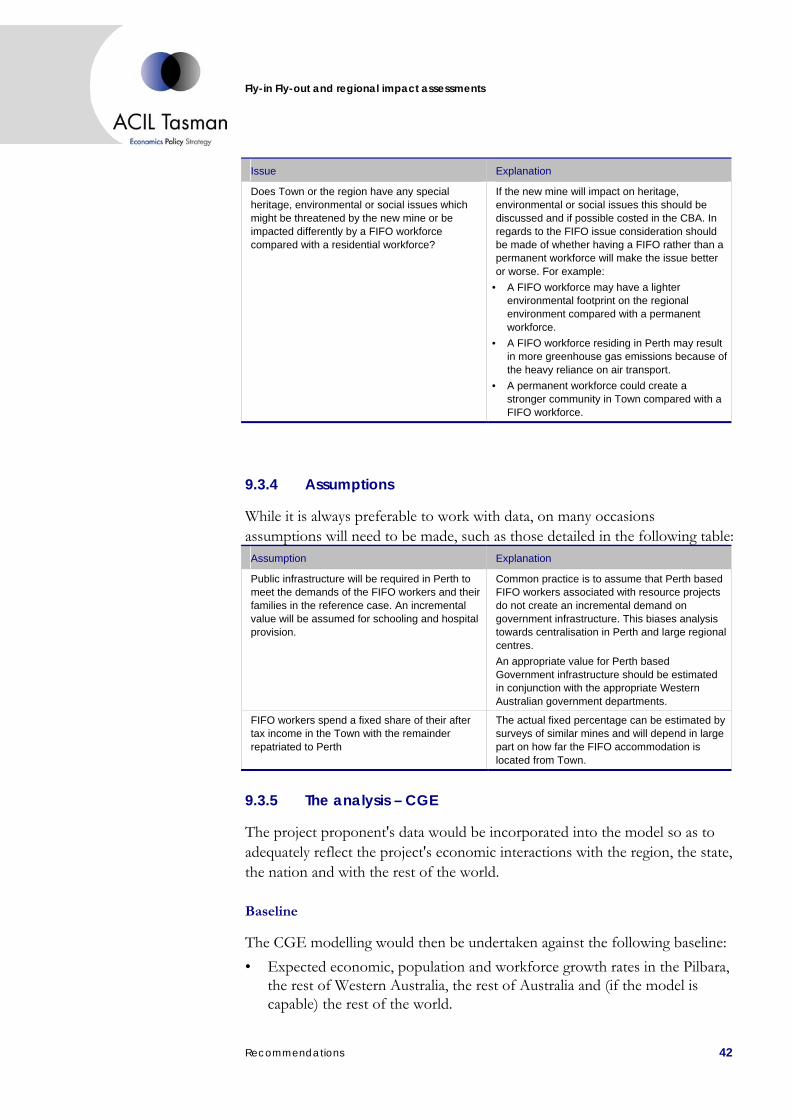
Fly-in Fly-out and regional impact assessments
Issue Explanation
Does Town or the region have any special heritage, environmental or social issues which might be threatened by the new mine or be impacted differently by a FIFO workforce compared with a residential workforce?
If the new mine will impact on heritage, environmental or social issues this should be discussed and if possible costed in the CBA. In regards to the FIFO issue consideration should be made of whether having a FIFO rather than a permanent workforce will make the issue better or worse. For example:
• A FIFO workforce may have a lighter environmental footprint on the regional environment compared with a permanent workforce.
• A FIFO workforce residing in Perth may result in more greenhouse gas emissions because of the heavy reliance on air transport.
• A permanent workforce could create a stronger community in Town compared with a FIFO workforce.
9.3.4 Assumptions
While it is always preferable to work with data, on many occasions assumptions will need to be made, such as those detailed in the following table: Assumption Explanation
Public infrastructure will be required in Perth to meet the demands of the FIFO workers and their families in the reference case. An incremental value will be assumed for schooling and hospital provision.
Common practice is to assume that Perth based FIFO workers associated with resource projects do not create an incremental demand on government infrastructure. This biases analysis towards centralisation in Perth and large regional centres. An appropriate value for Perth based Government infrastructure should be estimated in conjunction with the appropriate Western Australian government departments.
FIFO workers spend a fixed share of their after tax income in the Town with the remainder repatriated to Perth
The actual fixed percentage can be estimated by surveys of similar mines and will depend in large part on how far the FIFO accommodation is located from Town.
9.3.5 The analysis – CGE
The project proponent's data would be incorporated into the model so as to adequately reflect the project's economic interactions with the region, the state, the nation and with the rest of the world.
Baseline
The CGE modelling would then be undertaken against the following baseline: • Expected economic, population and workforce growth rates in the Pilbara,
the rest of Western Australia, the rest of Australia and (if the model is capable) the rest of the world.
Recommendations 42
Fly-in Fly-out and regional impact assessments
• No development of the Neighbourly Mine.
This baseline run is used as the basis for comparison when asking the question: what is the economic impact of the project?
First project simulation – Option A
Under Option A all mine workers are FIFO from Perth. Under this option it is necessary to estimate the share of FIFO workers income that would be spent within the Pilbara. This share would depend upon the distance the FIFO camp is from Town, the goods and services available at the FIFO camp, the goods and services available in Town and the roster the FIFO employees worked.
The model simulation would then be undertaken to include the construction and operation of the Neighbourly Mine. The majority of the income earned by the FIFO workers would be repatriated to Perth.
Under Option A it would be reasonable to assume that the additional workers were not sourced from within the Pilbara even though they would be working there. It would therefore be prudent to assume that the FIFO workers represented an increase in labour supply to the region. By approaching the modelling in this way it prevents the Perth based FIFO workers in part or in whole being taken from other Pilbara businesses.
Finally, it would be necessary to factor in additional government investment to account for greater demand on infrastructure (schools, hospitals, etc) in Perth. This additional capital would be financed by debt and modelled with interest only payments – an approach used by Treasury for some of its modelling.
Second project simulation – Option B
Under Option B all mine workers are FIFO from Geraldton. This option would be modelled very similarly to the FIFO from Perth option. The only differences being that income would be repatriated to Geraldton rather than to Perth and that the additional Government investment would be in Geraldton.
Third project simulation – Option C
Under Option C all mine workers become residents of Town in the Pilbara. It may still be prudent, with this option, to allow some repatriation of income to Perth or to other WA regions, as some mine workers maintain properties outside of the region they work, intending to move back "home" after a certain period. However, it will be reasonable to assume that most income is spent within the Pilbara.
Recommendations 43
Fly-in Fly-out and regional impact assessments
The mine workers are likely to be recruited from sources within the Pilbara as well as from outside the region. The new workers from outside the region will also bring spouses that will add to the workforce in the Town/Pilbara. These labour movements will need to be accounted for.
Finally, additional government spending in the Pilbara, financed by debt and with interest only paid, will need to be included in the analysis.
The results
The results produced from the modelling will allow comparisons to be made between each option and the baseline and between options. The results will allow comparisons of numerous economic variables, including: • Employment • Gross regional product (GRP), gross state product (GSP) and gross
domestic product (GDP) • Net income • Industry output and employment.
9.3.6 The analysis – CBA
To some extent CGE modelling can be a "blunt instrument" that does not take into account all the subtleties of local markets. For example, CGE models may not capture the lost opportunities associated with alternative uses. These issues along with any costs and benefits arising from social and environmental factors can be assessed qualitatively and if feasible quantitatively in the CBA.
Ideally a CBA for each of the three options should be undertaken at the region and state level. The economic, social and environmental benefits and the costs of each option should be identified and listed and qualitatively assessed.
Where feasible, the value of the flow of economic, social and environmental benefits and costs should be estimated. The stream of costs and benefits for each option should then be discounted to real present values of the benefits and costs, to arrive at the NPV of the assessment options.
Sensitivities around key assumptions and the discount rate used should also be evaluated by the consultant.
9.4 The approvals process
9.4.1 Cut off project size
As discussed in Section 3, there is no clear requirement for any resource project to undertake economic impact analysis. Resource projects frequently
Recommendations 44
Fly-in Fly-out and regional impact assessments
involve the spending of $100 million or more, often much more. This expenditure has major direct and indirect implications for policy makers as well as the local and wider economy and community. Impact analysis, including regional impact analysis should be conducted for major projects. We recommend that full economic impact assessments should be considered for projects with a capital cost of $100 million or more. It is recommended that the FIFO versus permanent residential workforce analysis should be included in the economic impact assessment where it is considered that existing community infrastructure makes a residential workforce feasible without the need to construct new townships.
9.4.2 Responsibility for the analysis
The project proponent should take responsibility for the analysis. Care should be taken that the proponent consults widely to ensure that options for an alternative to a FIFO from Perth are canvassed. Where the proponent has evidence that a residential workforce would prevent the project from being viable, the FIFO workforce versus residential workforce part of the analysis would not need to be undertaken.
9.4.3 Resolving issues around conflicting results
CGE models can produce different results when asked the same question. Not only can different CGE models produce different results, the same CGE model can produce different results when asked the same question.
The most likely cause of the differences between models and model run is the different assumptions used in each analysis. This is often what creates the conflict between model results.
It is import to ensure that modellers provide a clear description of all the assumptions (of the model and the scenarios being modelled) used in the modelling to ensure that the assumptions are appropriate and the drivers of the results are understood. If this occurs any conflicts or inconsistencies with the outputs of other CGE simulations are able to be understood.
Recommendations 45
Fly-in Fly-out and regional impact assessments
References Arrow, K.J. and Debreu, G (1954). "Existence of an Equilibrium for a Competitive Economy." Econometrica 22(3).
Australian Bureau of Statistics (1996). Information Paper, Australian National Accounts: Introduction to Input-Output Multipliers. ABS Catalogue No. 5246.0
Ballentine, G. and Thirsk, W (1979). "The Fiscal Incidence of Some Community Experiments in Fiscal Federalism: Technical Report, Community Services Analysis Division." Canada Mortgage and Housing Corporation, Ottawa.
Debreu, G. (1954). "Valuation Equilibrium and Pareto Optimum," Proceedings from the National Academy of Sciences 40(7): 588–592.
Department of Treasury and Finance (2005). Project Evaluation Guidelines. Perth: Government of Western Australia.
Gascoyne Development Commission (2004). An Input-Output Table for the Gascoyne Region of Western Australia. Gascoyne Development Commission.
Government of Western Australia (2008). Integrated Project Approvals System. Government of Western Australia.
Harberger, A (1962). "The Incidence of the Corporation Income Tax." Journal of the Political Economy 70: 215-40.
_____ (1964). "Taxation, Resource Allocation and Welfare, In The Role of Direct and Indirect Taxes in the Federal Reserve System." Princeton University Press, Princeton, New Jersey.
Johnson, P. L. (2001). An Input-Output Table for the Kimberley Region of Western Australia. Kimberley Development Commission.
Johnson, P. L. (2003). "Input-Output Tables for Western Australia and the Pilbara and Kimberley Regions", Chapter 3 in Aspects of Regional Economic Analysis, PhD Thesis, University of Western Australia.
Keller, W. (1980). Tax Incidence: A General Equilibrium Approach. Amsterdam, North Holland.
Piggot, J (1980). A General Equilibrium Evaluation of Australian Tax Policy. PhD Dissertation, University of London.
Recommendations 46
Fly-in Fly-out and regional impact assessments
Piggot, J. and Whalley, J (1985). "UK Tax Policy and Applied General Equilibrium Analysis". Cambridge University Press, Cambridge.
Slemrod, J (1983). "A General Equilibrium Model of Taxation with Endogenous Fiscal Behaviour". In M Feldstein ed., Behavioural Simulation Methods in Tax Policy Analysis: 427-54. Chicago University Press, Chicago.
Shoven, J. B. (1976). "The Incidence and Efficiency Effects of Taxes on Income from Capital." Journal of Political Economy 84: 1261-83.
Shoven, J. B. and Whalley, J (1972). "A General Equilibrium Calculation of the Effects of Differential Taxation of Income from Capital in the US." Journal of Public Economics 1: 281-322.
Whalley, J (1975). "A General Equilibrium Assessment of the 1973 United Kingdom Tax Reform." Economica 42: 139-61.
Recommendations 47


![AHLUWALIA CONTRACTS (INDIA) LIMITED [ACIL] - … Investor PPT Nov.pdf · AHLUWALIA CONTRACTS (INDIA) LIMITED [ACIL] ... management and ethos, which is being ... Aluminum Smelter Plant](https://static.fdocuments.us/doc/165x107/5b7915677f8b9a332d8ceece/ahluwalia-contracts-india-limited-acil-investor-ppt-novpdf-ahluwalia.jpg)