
Florida Lodging Trends Report - The Plasencia Group...The Plasencia Group has compiled the...
28
February 2020 Florida Lodging Trends Report Photo via visittampabay.com
Transcript of Florida Lodging Trends Report - The Plasencia Group...The Plasencia Group has compiled the...

February 2020
FloridaLodging TrendsReport
Photo via visittampabay.com

The Plasencia Group has compiled the information in the following report from sources we believe to be reliable, and the information is presumed to be accurate. Should you find any incorrect data, please let us know so that we may convey the correction to the original data source. The PlasenciaGroup does not warrant that this information is accurate, up-to-date or complete. Use of this information without verification from independent sources is at your own risk. Also, please note some prices are approximate.
2
Table ofContents
Florida Lodging Trends 3
The Plasencia Group 20
Select Representative 25 Engagements
Florida Lodging Report / February 2020

3
FloridaLodging Trends
Florida Lodging Report / February 2020

4
FLORIDA LODGING TRENDS
The outlook for Florida lodging investments remains positive, with optimism regarding future performance and continued investor interest in major markets.
Florida Lodging Trend Highlights
Performance is steady among Florida’s hotels and resorts. Even with an influx of supply to many markets causing occupancy levels to flatten, upside in Average Daily Rate (ADR) remains for many regions across the state. While most major Florida markets experienced ADR growth in 2019, the rate of growth moderated from 2018 for the majority of markets.
Investor interest in Florida lodging assets is steady. Transaction volume in the state in 2019 almost reached 2018’s gross number, though price per key has increased noticeably and exceeds the U.S. average substantially.
The full impact of coronavirus on tourism in the United States is yet to be ascertained. We believe Florida markets will suffer less than other markets, particularly those in the Northeast and on the Pacific Coast, that attract more tourism from China.
Florida’s population growth continues to be driven by transplants from the Northeast. The Sunshine State is once again the top state for relocation within the country, with 587,000 new residents arriving from other states in 2018 according to the U.S. Census Bureau. The impact of the Tax Cuts and Jobs Act of 2017 on tax-heavy Northeastern states in particular, along with business-friendly policies in Florida, have led to a heavy influx of residents to Florida, many of whom are professionals.
5
FLORIDA LODGING TRENDS
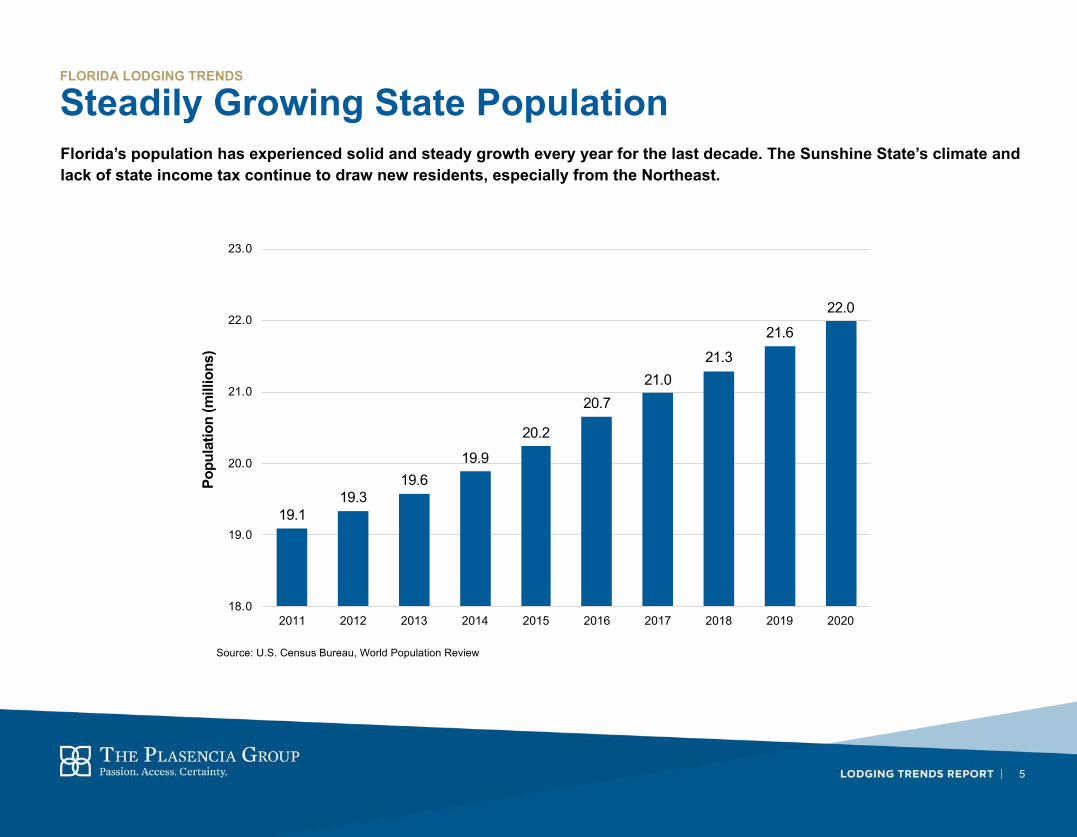
Florida’s population has experienced solid and steady growth every year for the last decade. The Sunshine State’s climate andlack of state income tax continue to draw new residents, especially from the Northeast.
Source: U.S. Census Bureau, World Population Review
Steadily Growing State Population
19.119.3
19.619.9
20.2
20.721.0
21.321.6
22.0
18.0
19.0
20.0
21.0
22.0
23.0
2011 2012 2013 2014 2015 2016 2017 2018 2019 2020
Popu
latio
n (m
illio
ns)
6
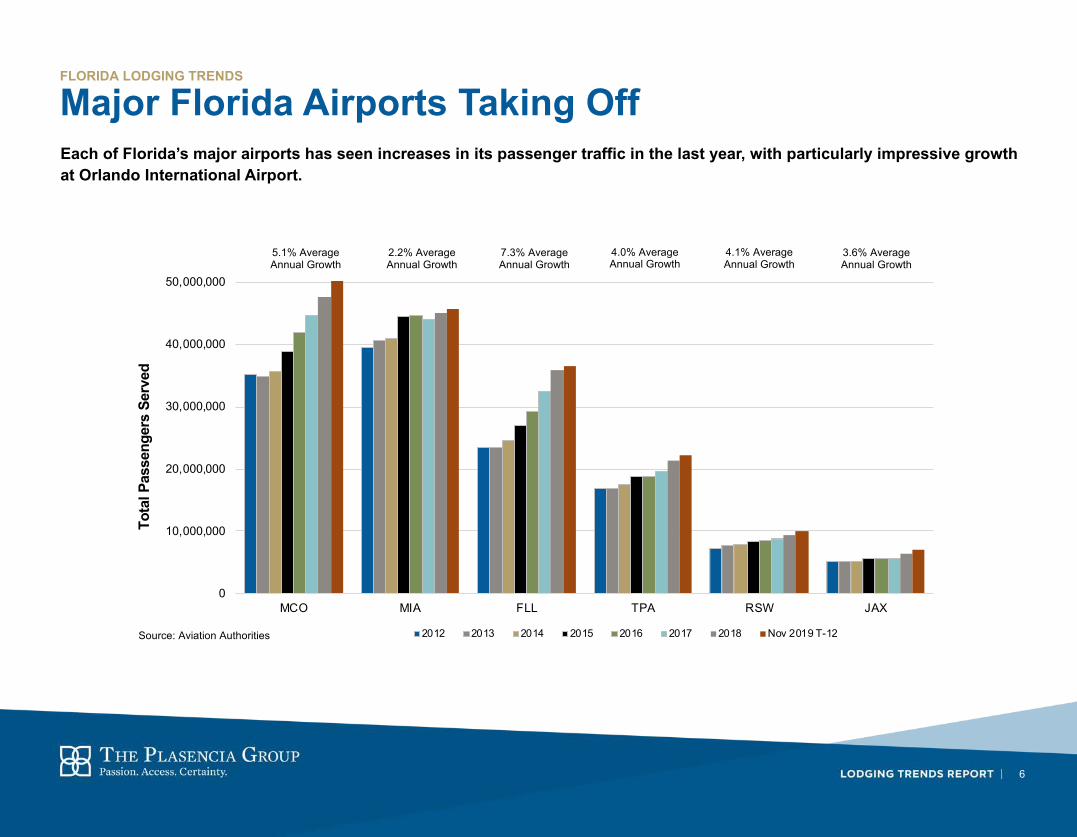
Major Florida Airports Taking OffFLORIDA LODGING TRENDS
Each of Florida’s major airports has seen increases in its passenger traffic in the last year, with particularly impressive growth at Orlando International Airport.
Source: Aviation Authorities
5.1% Average Annual Growth
2.2% Average Annual Growth
7.3% Average Annual Growth
4.0% Average Annual Growth
4.1% Average Annual Growth
3.6% Average Annual Growth
0
10,000,000
20,000,000
30,000,000
40,000,000
50,000,000
MCO MIA FLL TPA RSW JAX
Tota
l Pas
seng
ers
Serv
ed
2012 2013 2014 2015 2016 2017 2018 Nov 2019 T-12

7
Historical RevPAR Performance – Top 25FLORIDA LODGING TRENDS
Despite flattening RevPAR in 2019, Miami remains near the top of STR’s Top 25, ahead of gateway markets such as Boston and Los Angeles.
2014 2015 2016 2017 2018 2019
Market RevPAR Market RevPAR Market RevPAR Market RevPAR Market RevPAR Market RevPARNew York $223.53 New York $219.39 New York $222.54 New York $221.60 New York $228.96 New York $220.06 Oahu Island $186.68 San Francisco $188.05 San Francisco $194.55 Oahu Island $194.08 Oahu Island $199.70 San Francisco $205.99 San Francisco $174.81 Oahu Island $187.32 Oahu Island $191.59 San Francisco $189.73 San Francisco $197.72 Oahu Island $202.62 Miami $144.87 Miami $152.83 Miami $143.95 Boston $145.41 Miami $152.81 Miami $149.19 Boston $133.24 Boston $143.81 Boston $142.88 Miami $144.78 Boston $150.72 Boston $147.41 Los Angeles $116.01 Los Angeles $126.19 Los Angeles $139.65 Los Angeles $140.85 Los Angeles $143.49 Los Angeles $143.74 San Diego $106.39 San Diego $115.11 San Diego $119.39 San Diego $123.74 San Diego $130.93 Anaheim $129.51 Anaheim $104.05 Anaheim $113.31 Anaheim $118.11 Seattle $122.72 Anaheim $125.65 San Diego $127.95 Seattle $104.02 Seattle $113.14 Seattle $116.53 Anaheim $121.88 Seattle $123.94 Seattle $118.86 Washington $100.49 Washington $105.75 Washington $110.77 Washington $115.06 Washington $111.51 Washington $112.81 New Orleans $99.90 New Orleans $103.30 New Orleans $102.12 Nashville $105.87 Nashville $107.87 Nashville $110.54 Chicago $93.39 Chicago $99.88 Nashville $100.50 New Orleans $101.61 New Orleans $105.21 New Orleans $103.91 Denver $84.86 Nashville $93.11 Chicago $99.79 Chicago $98.09 Chicago $103.17 Chicago $101.63 Nashville $84.20 Denver $91.41 Denver $93.83 Orlando $96.40 Orlando $98.68 Denver $100.27 Philadelphia $82.69 Philadelphia $87.24 Philadelphia $91.60 Denver $96.34 Denver $96.26 Orlando $96.60 Orlando $79.63 Orlando $86.19 Orlando $87.62 Tampa $92.28 Philadelphia $94.60 Tampa $95.65 Houston $76.71 Tampa $82.28 Tampa $87.10 Philadelphia $89.11 Tampa $92.73 Philadelphia $95.38 Minneapolis $72.54 Phoenix $79.77 Phoenix $82.69 Phoenix $85.89 Phoenix $90.42 Phoenix $94.23 Tampa $72.33 Minneapolis $76.72 Minneapolis $80.59 Minneapolis $77.59 Minneapolis $82.96 Minneapolis $80.93 Phoenix $71.92 Houston $74.42 Dallas $73.89 Atlanta $75.08 Atlanta $76.94 Atlanta $79.56 Dallas $63.39 Dallas $69.81 Atlanta $72.41 Dallas $73.60 Dallas $74.16 Dallas $73.79 Atlanta $62.66 Atlanta $68.40 St. Louis $66.61 Houston $71.97 Detroit $70.46 St. Louis $69.50 St. Louis $61.57 St. Louis $64.73 Houston $65.15 St. Louis $68.30 St. Louis $68.13 Detroit $69.02 Detroit $57.97 Detroit $61.91 Detroit $64.04 Detroit $67.96 Houston $66.57 Norfolk $67.20 Norfolk $49.30 Norfolk $53.87 Norfolk $59.46 Norfolk $62.64 Norfolk $65.03 Houston $64.16
Source: STR

8
Historical RevPAR Change – Top 25FLORIDA LODGING TRENDS
While many of STR’s Top 25 markets have either moderated or decreased in RevPAR, Tampa’s growth remains strong.
2014 2015 2016 2017 2018 2019
Market % Change Market % Change Market % Change Market % Change Market % Change Market % ChangeNashville 19.0% Tampa 13.8% Los Angeles 10.8% Houston 10.5% Minneapolis 6.9% Phoenix 4.5%Denver 16.2% Phoenix 12.8% Norfolk 8.2% Orlando 10.0% Miami 6.3% Denver 4.3%Atlanta 13.1% Nashville 11.1% Nashville 8.0% Detroit 6.0% Philadelphia 6.0% San Francisco 4.2%San Francisco 12.6% Dallas 10.0% Atlanta 6.0% Tampa 5.5% San Diego 5.8% Atlanta 3.4%Seattle 12.6% Anaheim 9.4% Tampa 6.0% Nashville 5.4% Phoenix 5.3% Anaheim 3.0%Tampa 12.0% Atlanta 9.3% Dallas 5.7% Seattle 5.3% Chicago 5.1% Tampa 3.0%Boston 10.8% Orlando 9.1% Minneapolis 5.1% Norfolk 4.9% San Francisco 4.3% Norfolk 2.9%Orlando 10.7% Los Angeles 8.8% Philadelphia 5.1% Phoenix 4.1% Detroit 4.0% Nashville 2.7%Phoenix 10.5% Seattle 8.8% Washington 4.9% Washington 3.9% Boston 3.9% Oahu Island 2.5%Los Angeles 10.3% San Diego 8.6% Anaheim 4.3% Atlanta 3.8% Norfolk 3.9% St. Louis 2.2%Detroit 10.0% Boston 7.9% Phoenix 4.1% San Diego 3.6% New Orleans 3.8% Washington 1.2%St. Louis 10.0% Denver 7.9% Detroit 3.8% Anaheim 3.5% New York 3.4% Philadelphia 0.7%Houston 9.7% San Francisco 7.5% San Diego 3.8% St. Louis 2.8% Anaheim 3.1% Los Angeles 0.2%Anaheim 9.5% Norfolk 7.4% San Francisco 3.6% Denver 2.6% Oahu Island 2.7% Dallas -0.3%San Diego 9.4% Chicago 6.9% Seattle 2.9% Boston 1.8% Atlanta 2.6% Orlando -1.1%Dallas 9.0% Detroit 6.6% St. Louis 2.9% Oahu Island 1.7% Orlando 2.5% New Orleans -1.4%Minneapolis 7.5% Miami 6.0% Denver 2.8% Miami 0.8% Nashville 2.2% Chicago -1.6%Chicago 7.1% Minneapolis 5.8% Oahu Island 2.5% Los Angeles 0.7% Los Angeles 1.9% Detroit -1.9%Miami 7.0% Philadelphia 5.5% Orlando 1.9% New York -0.3% Seattle 0.8% Miami -2.1%Oahu Island 6.5% Washington 5.4% Chicago 0.1% Dallas -0.4% Dallas 0.7% San Diego -2.1%Washington 5.2% St. Louis 5.3% Boston -0.6% New Orleans -0.5% Tampa 0.7% Boston -2.3%Norfolk 5.0% Oahu Island 4.1% New Orleans -1.1% Chicago -1.7% Denver 0.0% Minneapolis -2.4%Philadelphia 4.7% New Orleans 3.4% New York -1.8% San Francisco -2.4% St. Louis -0.2% Houston -3.4%New Orleans 4.6% New York -1.7% Miami -5.5% Philadelphia -2.7% Washington -3.2% New York -3.5%New York 2.3% Houston -3.3% Houston -12.4% Minneapolis -3.6% Houston -7.5% Seattle -4.0%
Source: STR

9
Historical RevPAR Performance By MarketFLORIDA LODGING TRENDS
Major markets across Florida have maintained RevPAR growth throughout 2019, highlighted by an impressive 7% increase St. Petersburg. Three of the top four markets for RevPAR growth in Florida are in the Tampa Bay area.
RevPAR RevPAR Change RevPAR Rank
2016 2017 2018 2019 2017 2018 2019 2016 2017 2018 2019
Florida Keys $204.27 $209.37 $204.73 $212.53 1.8% -2.2% 3.8% 1 1 1 1
Naples MSA $141.11 $148.00 $153.66 $156.20 5.3% 3.8% 1.7% 3 2 2 2
Miami/Hialeah $143.95 $144.35 $152.33 $149.19 0.7% 5.5% -2.1% 2 3 3 3
Palm Beach County $120.68 $127.45 $133.17 $133.36 5.9% 4.5% 0.1% 4 4 4 4
Clearwater $98.85 $104.17 $110.61 $114.82 4.7% 6.2% 3.8% 8 8 6 5
Ft. Lauderdale $107.66 $110.70 $114.42 $111.56 2.8% 3.4% -2.5% 5 5 5 6
St. Petersburg $103.44 $108.05 $104.09 $111.38 4.6% -3.7% 7.0% 7 7 8 7
Ft. Myers $104.08 $108.43 $107.41 $107.75 4.0% -0.9% 0.3% 6 6 7 8
Tampa Core $98.28 $102.80 $104.00 $106.93 4.6% 1.2% 2.8% 9 9 9 9
Orlando MSA $87.62 $96.27 $97.64 $96.60 10.0% 1.4% -1.1% 11 11 10 10
Sarasota/Bradenton $96.02 $100.14 $93.85 $91.08 4.5% -6.3% -2.9% 10 10 11 11
Jacksonville (Duval) $62.61 $67.09 $71.72 $72.12 7.2% 6.9% 0.6% 13 13 12 12
Gainesville $66.79 $73.54 $67.69 $64.46 10.1% -8.0% -4.8% 12 12 13 13
Ranked by 2019 RevPAR Source: STR
10
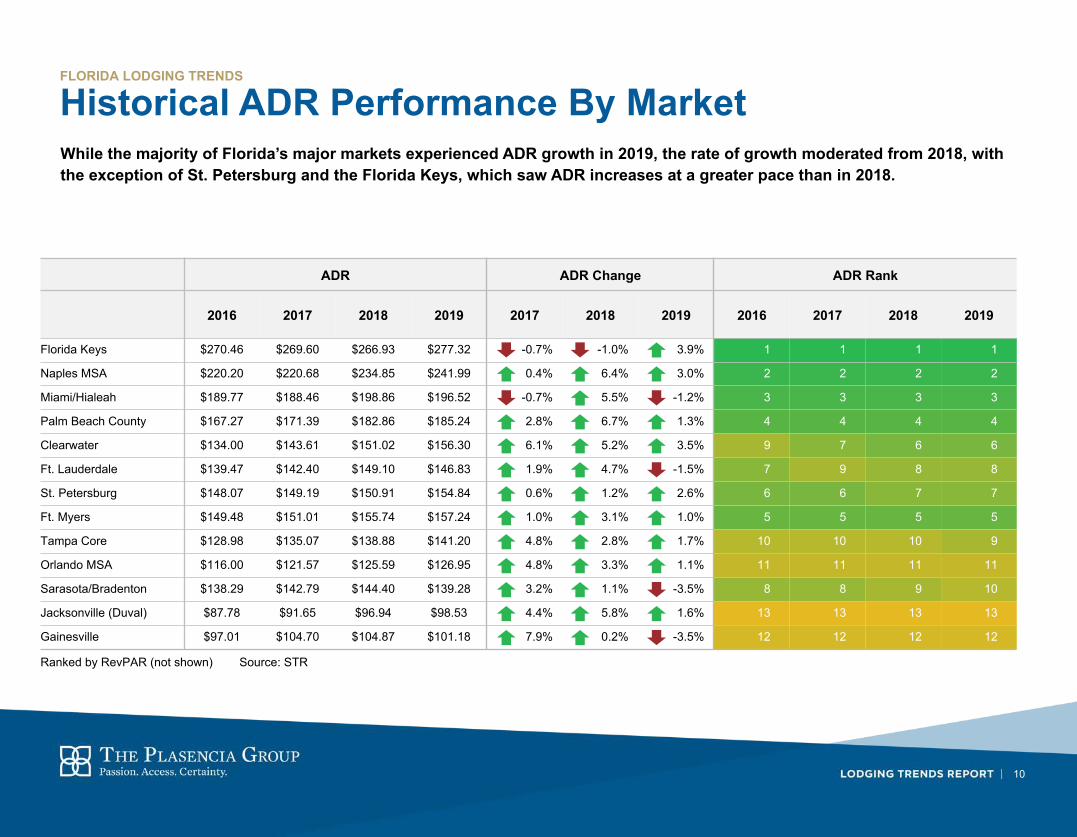
Historical ADR Performance By MarketFLORIDA LODGING TRENDS
While the majority of Florida’s major markets experienced ADR growth in 2019, the rate of growth moderated from 2018, with the exception of St. Petersburg and the Florida Keys, which saw ADR increases at a greater pace than in 2018.
ADR ADR Change ADR Rank
2016 2017 2018 2019 2017 2018 2019 2016 2017 2018 2019
Florida Keys $270.46 $269.60 $266.93 $277.32 -0.7% -1.0% 3.9% 1 1 1 1
Naples MSA $220.20 $220.68 $234.85 $241.99 0.4% 6.4% 3.0% 2 2 2 2
Miami/Hialeah $189.77 $188.46 $198.86 $196.52 -0.7% 5.5% -1.2% 3 3 3 3
Palm Beach County $167.27 $171.39 $182.86 $185.24 2.8% 6.7% 1.3% 4 4 4 4
Clearwater $134.00 $143.61 $151.02 $156.30 6.1% 5.2% 3.5% 9 7 6 6
Ft. Lauderdale $139.47 $142.40 $149.10 $146.83 1.9% 4.7% -1.5% 7 9 8 8
St. Petersburg $148.07 $149.19 $150.91 $154.84 0.6% 1.2% 2.6% 6 6 7 7
Ft. Myers $149.48 $151.01 $155.74 $157.24 1.0% 3.1% 1.0% 5 5 5 5
Tampa Core $128.98 $135.07 $138.88 $141.20 4.8% 2.8% 1.7% 10 10 10 9
Orlando MSA $116.00 $121.57 $125.59 $126.95 4.8% 3.3% 1.1% 11 11 11 11
Sarasota/Bradenton $138.29 $142.79 $144.40 $139.28 3.2% 1.1% -3.5% 8 8 9 10
Jacksonville (Duval) $87.78 $91.65 $96.94 $98.53 4.4% 5.8% 1.6% 13 13 13 13
Gainesville $97.01 $104.70 $104.87 $101.18 7.9% 0.2% -3.5% 12 12 12 12
Ranked by RevPAR (not shown) Source: STR

11
Historical Occupancy Performance By MarketFLORIDA LODGING TRENDS
In keeping with national trends, Occupancy in most major Florida markets has flattened as new supply has been introduced. Of all major Florida Metropolitan Statistical Areas, Tampa-St. Petersburg-Clearwater is the only one with Occupancy growth.
Occupancy Occupancy Change Occupancy Rank
2016 2017 2018 2019 2017 2018 2019 2016 2017 2018 2019
Florida Keys 75.5% 77.7% 76.7% 76.6% 2.5% -1.2% -0.1% 5 3 3 1
Naples MSA 64.1% 67.1% 65.4% 64.6% 4.9% -2.4% -1.3% 13 13 11 12
Miami/Hialeah 75.9% 76.6% 76.6% 75.9% 1.4% 0.0% -0.9% 3 4 4 4
Palm Beach County 72.2% 74.4% 72.8% 72.0% 3.0% -2.1% -1.1% 7 6 8 8
Clearwater 73.8% 72.5% 73.2% 73.5% -1.3% 1.0% 0.3% 6 8 7 6
Ft. Lauderdale 77.2% 77.7% 76.7% 76.0% 0.8% -1.3% -1.0% 1 2 2 3
St. Petersburg 69.9% 72.4% 69.0% 71.9% 3.9% -4.8% 4.3% 9 9 9 9
Ft. Myers 69.6% 71.8% 69.0% 68.5% 3.0% -3.9% -0.6% 10 10 10 10
Tampa Core 76.2% 76.1% 74.9% 75.7% -0.1% -1.6% 1.1% 2 5 5 5
Orlando MSA 75.5% 79.2% 77.7% 76.1% 4.9% -1.8% -2.1% 5 1 1 2
Sarasota/Bradenton 69.4% 70.1% 65.0% 65.4% 1.3% -7.3% 0.6% 11 12 12 11
Jacksonville (Duval) 71.3% 73.2% 74.0% 73.2% 2.6% 1.1% -1.1% 8 7 6 7
Gainesville 68.9% 70.2% 64.5% 63.7% 1.9% -8.1% -1.3% 12 11 13 13
Ranked by RevPAR (not shown) Source: STR

12
Occupancy
2012
2013
20142015
20162017
2018
2019
2012
2013
2014
20152016 2017
20182019
$70
$105
$140
$175
$210
$245
$280
55% 60% 65% 70% 75% 80%
Florida Keys
Naples MSA
Miami/Hialeah
Palm Beach County
Ft. Lauderdale
Tampa Core
St. Petersburg
Clearwater
Ft. Myers
Sarasota/Bradenton
Orlando MSA
Jacksonville (Duval)
Gainesville
Historical Occupancy And ADR By MarketFLORIDA LODGING TRENDS
While Average Daily Rate continues to increase across the state, Occupancy is crawling back toward previous levels.
ADR

13
Select Single Asset Sales – 2019 FLORIDA LODGING TRENDS
Florida’s highest per-key transactions have been concentrated in South Florida over the last year, including some lofty prices for independent hotels in Miami Beach.
Transactions greater than $20 million and $150,000 per key, sorted by price per keySources: Real Capital Analytics, various news outlets, The Plasencia Group
Date Property City Keys Opened Price Per Key ↓ Qualifier
Feb-19 1 Hotel South Beach Miami Beach 426 1970 $610,000,000 $1,431,925 Confirmed
Feb-19 Raleigh Hotel Miami Beach 105 1940 $103,000,000 $980,952 Confirmed
Jun-19 Waldorf Astoria Boca Raton Boca Raton 1,047 1926 $875,000,000 $835,721 Approximate
May-19 Palm House Hotel Palm Beach 79 1964 $39,600,000 $501,266 Approximate
Aug-19 South Seas Hotel Miami Beach 112 1941 $52,000,000 $464,286 Approximate
Aug-19 Lord Balfour Hotel Miami Beach 81 1940 $34,750,000 $429,012 Approximate
Sep-19 Residence Inn Pompano Beach Oceanfront Pompano Beach 106 1933 $44,000,000 $415,094 Approximate
Feb-19 Bali Hai Beach Resort Holmes Beach 42 1971 $16,890,000 $402,143 Confirmed
Oct-19 Alden Hotel Miami Beach Miami Beach 71 1939 $21,300,000 $300,000 Confirmed
Sep-19 Eurostars Langford Miami 126 1925 $37,000,000 $293,651 Confirmed
Jul-19 Westin Tampa Bay Tampa 244 2008 $68,000,000 $278,689 Confirmed
Mar-19 Renaissance Fort Lauderdale Fort Lauderdale 236 2001 $63,220,000 $267,881 Confirmed
Jun-19 Mayfair Hotel & Spa Miami 179 1985 $46,750,000 $261,173 Confirmed
Dec-19 Howard Johnson Resort St. Pete Beach St. Pete Beach 133 1969 $34,500,000 $259,398 Approximate
14
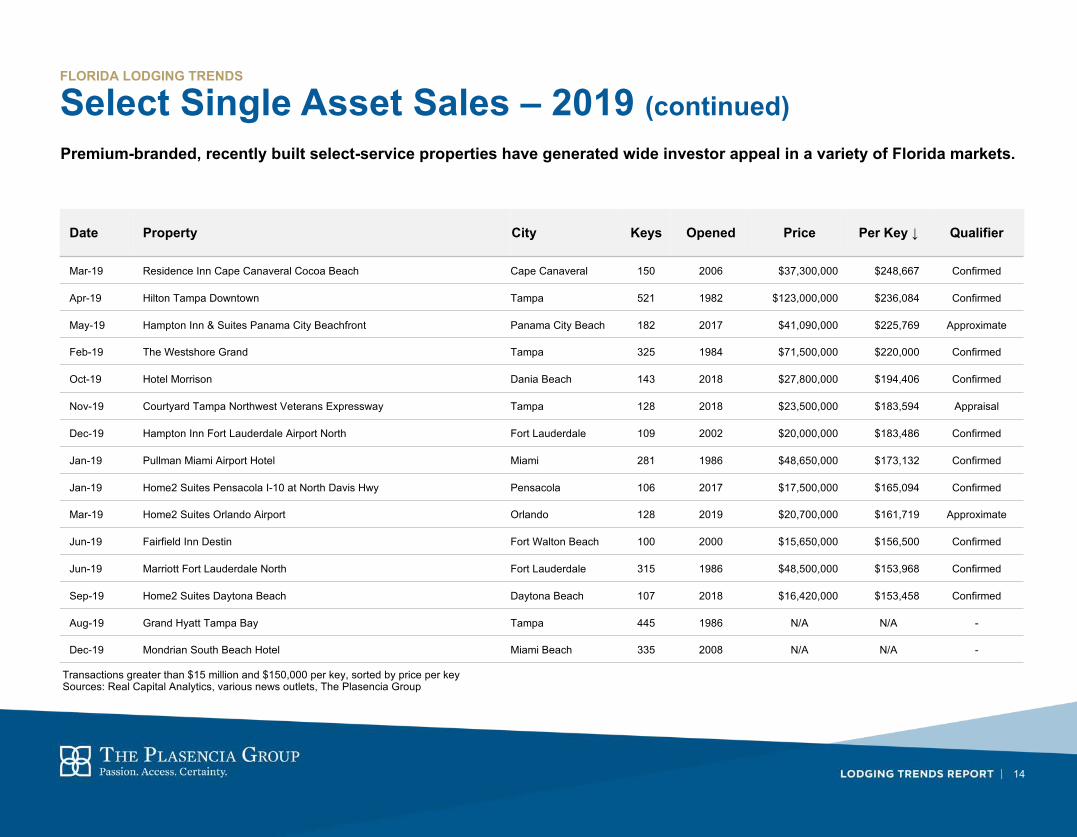
Select Single Asset Sales – 2019 (continued)FLORIDA LODGING TRENDS
Premium-branded, recently built select-service properties have generated wide investor appeal in a variety of Florida markets.
Transactions greater than $15 million and $150,000 per key, sorted by price per keySources: Real Capital Analytics, various news outlets, The Plasencia Group
Date Property City Keys Opened Price Per Key ↓ Qualifier
Mar-19 Residence Inn Cape Canaveral Cocoa Beach Cape Canaveral 150 2006 $37,300,000 $248,667 Confirmed
Apr-19 Hilton Tampa Downtown Tampa 521 1982 $123,000,000 $236,084 Confirmed
May-19 Hampton Inn & Suites Panama City Beachfront Panama City Beach 182 2017 $41,090,000 $225,769 Approximate
Feb-19 The Westshore Grand Tampa 325 1984 $71,500,000 $220,000 Confirmed
Oct-19 Hotel Morrison Dania Beach 143 2018 $27,800,000 $194,406 Confirmed
Nov-19 Courtyard Tampa Northwest Veterans Expressway Tampa 128 2018 $23,500,000 $183,594 Appraisal
Dec-19 Hampton Inn Fort Lauderdale Airport North Fort Lauderdale 109 2002 $20,000,000 $183,486 Confirmed
Jan-19 Pullman Miami Airport Hotel Miami 281 1986 $48,650,000 $173,132 Confirmed
Jan-19 Home2 Suites Pensacola I-10 at North Davis Hwy Pensacola 106 2017 $17,500,000 $165,094 Confirmed
Mar-19 Home2 Suites Orlando Airport Orlando 128 2019 $20,700,000 $161,719 Approximate
Jun-19 Fairfield Inn Destin Fort Walton Beach 100 2000 $15,650,000 $156,500 Confirmed
Jun-19 Marriott Fort Lauderdale North Fort Lauderdale 315 1986 $48,500,000 $153,968 Confirmed
Sep-19 Home2 Suites Daytona Beach Daytona Beach 107 2018 $16,420,000 $153,458 Confirmed
Aug-19 Grand Hyatt Tampa Bay Tampa 445 1986 N/A N/A -
Dec-19 Mondrian South Beach Hotel Miami Beach 335 2008 N/A N/A -

15
Select Portfolio Sales – 2019 FLORIDA LODGING TRENDS
The majority of Florida hotels involved in 2019 portfolio sales have been select-service properties tied to major brand families.
Date Property City Keys Opened Price Per Key Qualifier
Oct-19 Queensgate US Freehand Hotel Acquisition 2019 916 $400,000,000 $436,681 Confirmed
Freehand Miami Miami Beach 80 1936
Jan-19 Project Monarch II 2019 1,058 $229,000,000 $216,446 Confirmed
Residence Inn Tampa Westshore Tampa 160 2001
TownePlace Suites Tampa Westshore Airport Tampa 122 2008
Courtyard Fort Myers Lehigh Acres 134 2007
SpringHill Suites Fort Myers Airport Lehigh Acres 106 2006
Nov-19 Starwood/Schulte US Hotel Portfolio 2019 2,327 Undisclosed
Holiday Inn Miami Doral Doral 129 1997
Staybridge Suites Miami Doral Doral 96 1999
Holiday Inn Express Miami Doral Doral 103 1997
Hilton Garden Inn Fort Lauderdale Southwest Miramar Miramar 149 2002
Nov-19 Dune RE US Hotel Portfolio 2019 501 Undisclosed
Staybridge Suites Miami Doral Doral 96 1999
Holiday Inn Express Miami Doral Doral 103 1997
Transactions greater than $20 million, sorted by total portfolio price.Sources: Real Capital Analytics, various news outlets, The Plasencia Group

16
Florida Transaction EnvironmentFLORIDA LODGING TRENDS
Transaction volume in 2019 almost reached 2018’s gross number, though price per key has increased noticeably.
Source: Real Capital Analytics
$0
$70,000
$140,000
$210,000
$280,000
$350,000
$0.0
$1.0
$2.0
$3.0
$4.0
$5.0
$6.0
$7.0
$8.0
2009 2010 2011 2012 2013 2014 2015 2016 2017 2018 2019
Price per KeyG
ross
Vol
ume
(bill
ions
)
Florida Gross Volume (billions) Florida Price per Key U.S. Price per Key

17
Construction Pipeline – Select ProjectsFLORIDA LODGING TRENDS
Hotel City Chain Scale Rooms Open Date ↓
JW Marriott Orlando Bonnet Creek Orlando Luxury 516 Q1 2020
The Ben, Autograph Collection West Palm Beach Upper Upscale 208 Q1 2020
Hotel Indigo Miami Brickell Miami Upscale 140 Q1 2020
Celino South Beach Miami Beach Luxury 132 Q1 2020
Sadigo Hotel Miami Beach Upscale 80 Q1 2020
JW Marriott Tampa Water Street Tampa Luxury 519 Q2 2020
The Ritz-Carlton, South Beach Miami Beach Luxury 375 Q2 2020
Collins Park Hotel Miami Beach Upper Upscale 296 Q2 2020
Loews Tallahassee Washington Square Tallahassee Upper Upscale 270 Q2 2020
The Luminary Fort Myers, Autograph Collection Fort Myers Upper Upscale 243 Q2 2020
Hyatt Centric Las Olas Fort Lauderdale Upper Upscale 238 Q2 2020
AC Hotel Orlando Church Street Plaza Orlando Upscale 180 Q2 2020
The Celeste, Tribute Portfolio Orlando Upper Upscale 179 Q2 2020
Aparium Ybor City Hotel Tampa Upper Upscale 177 Q2 2020
Hyatt House Orlando International Drive Orlando Upscale 175 Q2 2020
SpringHill Suites Cape Canaveral Cape Canaveral Upscale 151 Q2 2020
Source: Lodging Development Corporation
Development over the next six months in the upper three chain scales is primarily focused in South Florida.

18
Construction Pipeline – Select Projects (continued)FLORIDA LODGING TRENDS
The pipeline of scheduled-to-open hotels from mid-year to the end of 2020 largely consists of select-service assets.
Hotel City Chain Scale Rooms Open Date ↓
Canopy West Palm Beach Downtown West Palm Beach Upscale 150 Q2 2020
Courtyard Fort Lauderdale at Flagler Village Fort Lauderdale Upscale 150 Q2 2020
Legoland Pirate Island Hotel Winter Haven Upscale 150 Q2 2020
Hotel Maren, Curio Collection Fort Lauderdale Upper Upscale 141 Q2 2020
Four Seasons Fort Lauderdale Fort Lauderdale Luxury 130 Q2 2020
SpringHill Suites Lakeland Center Lakeland Upscale 126 Q2 2020
Hyatt Place Vilano Beach Vilano Beach Upscale 120 Q2 2020
Hilton Garden Inn Apopka City Center Apopka Upscale 114 Q2 2020
Hilton Garden Inn Miramar Beach Miramar Beach Upscale 111 Q2 2020
Hilton Garden Inn Ocala Downtown Ocala Upscale 107 Q2 2020
Hyatt Place Space Coast Titusville Upscale 106 Q2 2020
Hyatt Place Palm Bay Palm Bay Upscale 106 Q2 2020
Hilton Garden Inn Winter Park Ravaudage Winter Park Upscale 102 Q2 2020
Renaissance St. Augustine St. Augustine Upper Upscale 89 Q2 2020
Marriott | AC Hotel Dania Pointe Dania Beach Upper Upscale 350 Q3 2020
Source: Lodging Development Corporation

19
Construction Pipeline – Select Projects (continued)FLORIDA LODGING TRENDS
Hotel City Chain Scale Rooms Open Date ↓
Hyatt Place | Hyatt House Tampa Downtown Tampa Upscale 345 Q3 2020
DoubleTree Cocoa Beach Oceanfront Cocoa Beach Upscale 295 Q3 2020
Hotel Effie at Sandestin Golf & Beach Resort Miramar Beach Upper Upscale 250 Q3 2020
Hilton Aventura Aventura Upper Upscale 192 Q3 2020
Hotel Melby, Tapestry Collection Melbourne Upscale 156 Q3 2020
Courtyard at Trio Jacksonville Upscale 145 Q3 2020
Courtyard Pensacola West Pensacola Upscale 124 Q3 2020
Compass by Margaritaville Bradenton Bradenton Upscale 123 Q3 2020
Vib Hotel Orlando International Drive Orlando Upscale 118 Q3 2020
Aloft | Element Orlando Seaworld Orlando Upscale 284 Q4 2020
Hilton Garden Inn | Home2 Suites Orlando Orlando Upscale 224 Q4 2020
AC Hotel Sawgrass Mills Mall Sunrise Upscale 174 Q4 2020
Courtyard Kennedy Space Center Titusville Upscale 152 Q4 2020
Hilton Garden Inn Homestead Homestead Upscale 130 Q4 2020
Hyatt House Tallahassee Railroad Square Tallahassee Upscale 120 Q4 2020
Source: Lodging Development Corporation

20
The Plasencia GroupOverview
Florida Lodging Report / February 2020
21
THE PLASENCIA GROUP OVERVIEW
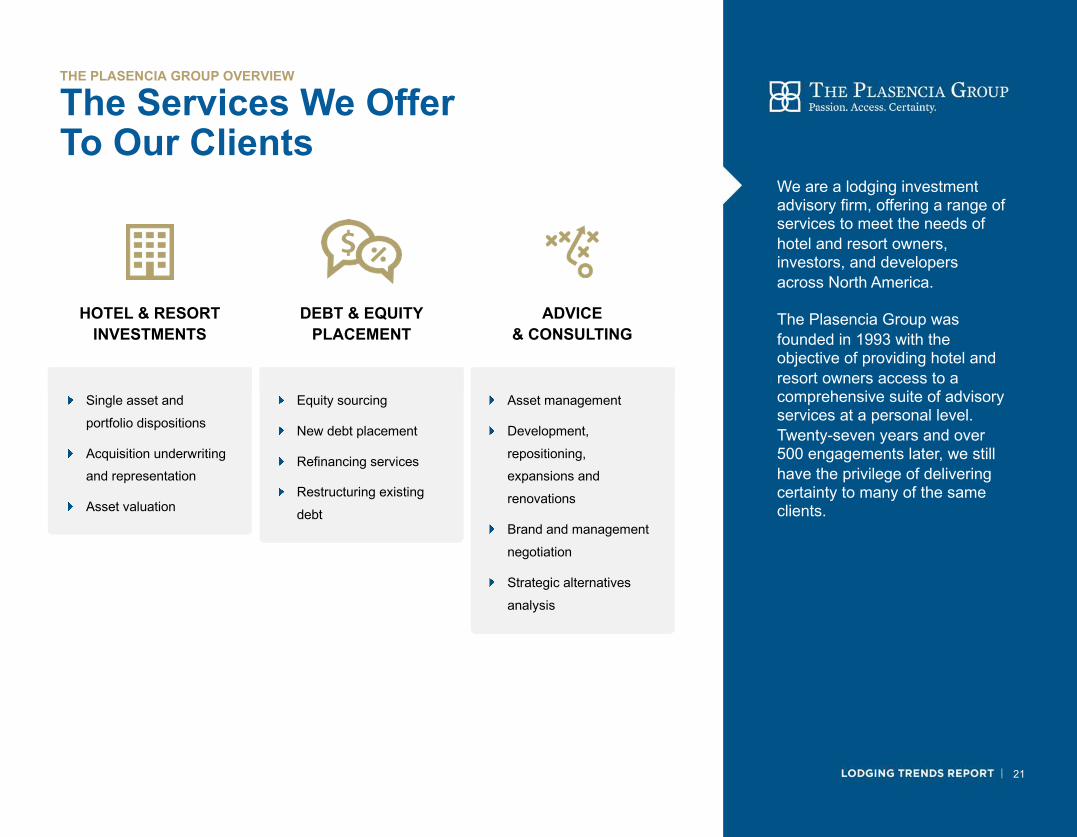
We are a lodging investment advisory firm, offering a range of services to meet the needs of hotel and resort owners, investors, and developers across North America.
The Plasencia Group was founded in 1993 with the objective of providing hotel and resort owners access to a comprehensive suite of advisory services at a personal level. Twenty-seven years and over 500 engagements later, we still have the privilege of delivering certainty to many of the same clients.
Single asset and portfolio dispositions
Acquisition underwriting and representation
Asset valuation
HOTEL & RESORTINVESTMENTS
DEBT & EQUITYPLACEMENT
ADVICE& CONSULTING
Equity sourcing
New debt placement
Refinancing services
Restructuring existing debt
Asset management
Development, repositioning, expansions and renovations
Brand and management negotiation
Strategic alternatives analysis
The Services We OfferTo Our Clients

22
THE PLASENCIA GROUP OVERVIEW
Passion. Access. Certainty.
The Plasencia Group takes pride in successfully serving our clients with ardent passion, providing direct access to high-level decision-makers, and providing the certainty of a thorough and professionally-orchestrated process.
Every member of the firm is dedicated to delivering for our clients with a personalized level of commitment that is unsurpassed in our industry. Our goal is to make this singular approach the appreciable difference that earns our clients’ trust time and again.
Candor builds and maintains our clients’ trust.We work hard to create a relationship and experience that will make you feel as though you’re one of one, rather than one of many. Our mutual success is built on personal trust and candid advice.
Our clients and their projects are our primary focus.When our clients are successful, we’re successful, so each engagement receives the attention it deserves from our firm’s principals and support staff. We create a customized plan for each engagement, with a focus tailored to that client’s objectives.
Our tenacity leads more deals to completion.We work on a select number of engagements at a time, and are more likely to see your project to completion successfully. In fact, The Plasencia Group has exceeded a 90% engagement completion rate since January 2018.
What Sets Us Apart

23
THE PLASENCIA GROUP OVERVIEW
We have been privileged to deliver results for some of the most sophisticated investors in the industry, serving as advisor to many of them on several engagements across the nearly three decades The PlasenciaGroup has been in business.
Twenty-Seven Yearsof Client Success

24
THE PLASENCIA GROUP OVERVIEW
Experience that meets your needs.Each of our principals comes to the table with relevant experience from outside the traditional commercial real estate realm. We draw on our backgrounds in lodging operations, investments, banking, design, and construction to offer objective perspectives to our clients. Additional team members, including Managing Directors and Financial Analysts, are available to support each of our endeavors.
Founder &Chief Executive Officer
Tampa, Florida37 Years Experience
(813) [email protected]
Lou PlasenciaSenior
Asset ManagerMiami, Florida
34 Years Experience
(954) [email protected]
Tony HaddadManagingDirector
Tampa, Florida9 Years Experience
(813) [email protected]
Nick PlasenciaManagingDirector
Tampa, Florida7 Years Experience
(813) [email protected]
Chris Plasencia
Your Florida Team

25
Select RepresentativeEngagements
Florida Lodging Report / February 2020

26
Current and Recent Florida EngagementsSELECT REPRESENTATIVE ENGAGEMENTS
Our team’s experience with lodging assets in the Sunshine State is a meaningful part of what’s made our firm successful over the years. From transactions to asset management to development management consulting, we understand the nuances of investing in Florida.
The Vinoy Renaissance Resort & Golf Club
St. Petersburg, FloridaSCG Hospitality
Acquisition, Renovation,Asset Management
Courtyard Courtyard Fort Lauderdale
Fort Lauderdale, Florida
Fillmore HospitalityDisposition
Hyatt Place at the Forum
Fort Myers, Florida
Summit Hotel PropertiesDisposition
Select ServicePortfolio
Bonita Springs, Florida
Wheelock Street CapitalDisposition
Renaissance International Plaza
Tampa, Florida
Ashford Hospitality TrustDisposition
Westin Tampa Bay
Tampa, Florida
Impact PropertiesDisposition
The Breakwater Development
Amelia Island, Florida
Signature LandStrategic Consulting &
Development
Grand Hyatt Tampa Bay
Tampa, Florida
GEM Realty GroupRenovation

27
Representative National EngagementsSELECT REPRESENTATIVE ENGAGEMENTS
The combination of local knowledge and national presence make our team the go-to advisors for investors ranging from institutional fund managers to individuals, whether they own nationwide portfolios or a single hotel or resort. To review additional historical projects, please visit: tpghotels.com/representative-engagements
Hyatt Regency Houston North
Houston, Texas
Client
Le MéridienNew Orleans
New Orleans, Louisiana
Park Hotels & ResortsDisposition
Loews Hollywood
Los Angeles, California
MetLife Real Estate InvestorsAsset Management
FairmontGeorgetown
Washington, D.C.
MetLife Real Estate InvestorsRenovation
Kingston Resorts
Myrtle Beach, South Carolina
RLJ Lodging TrustDisposition
Hyatt Place King of Prussia
King of Prussia, Pennsylvania
Wurzak Hotel GroupDisposition
HotelBrand Expansion
Nationwide
The Little Nell Hotel GroupStrategic Consulting
Hyatt Regency Houston Intercontinental Airport
Houston, Texas
Carlyle GroupDisposition
DoubleTree DenverWestminster
Denver, Colorado
Hotel Capital AdvisorsDisposition

© 2020, The Plasencia Group, Inc.