First preliminary study on micro plastic within
18
Plastic in the marine and lacustrine ecosystem: from the problem to the new recycling frontier RIMINI 11 novembre 2016 First preliminary study on micro plastic within italian lakes www.legambiente.it/marinelitter
Transcript of First preliminary study on micro plastic within

Plastic in the marine and lacustrine ecosystem:from the problem to the new recycling frontier
RIMINI 11 novembre 2016
First preliminary
study on micro
plastic within
italian lakes
www.legambiente.it/marinelitter

Microplastics
The micro plastic are plastic particles with a size smaller than 5 mm.They can have primary origin (pellets from preproduction, textile fibers or abrasive microspheres) or secondary, if derivatives from the disintegration of larger waste by physical agents.
Their presence increase constantly in the environment; dispersed in marine and terrestrial ecosystems, it is very difficult to quantify their effects, pollution and it is impossible to remove them completely. That is why the knowledge and prevention are extremely important.
Since 70s, the scientific community have been making many studies on the presence and dispersion of micro plastics in the marine environment.However, recently, there is a growing awareness that even freshwaters are not immune to this problem.Carried by water stream and sewers, macro and micro plastics are increasing in lakes also, defining a new and dangerous menace for thesefragile semi closed systems, which might be more sensitive to the presenceof waste, in particular to the micro particles, which originate. On this issue, in Italy in particular, there is a lack of information and studies.
www.legambiente.it/marinelitter

Risks and danger of micro plastics
- Ingestion by fish, crustaceans, bivalve molluscs (oysters and mussels) and birds. This occurs not only in the sea but also in freshwater ecosystems, representing a danger for lacustrine birdlife, limnetic organism and fish population.
- Ingestion also lead to a sensation of fullness that drive the organisms to stop feed, or to the asphyxiation (in particular for filters organisms).
- Bioaccumulation throughout the trophic chain to the organism we use to eat
- Toxicity due to adsorption of polluting substances present in the environment but also to the additives contained in the plastic
- Invasion of alien sessile species, xenobiotic pollutants and virus carried by plastic debris
www.legambiente.it/marinelitter

The survey 2016
Over the 2016 edition of Goletta dei Laghi, Legambiente, in collaboration with ENEA, Ca’ Foscari University of Venice and ArpaUmbria and Lega Navale Italiana, has conducted a survey aiming at providing a first and initial overview on presence of micro plastic in the main Italian lakes.
Six lakes analyzed, from June to July 2016: Lake Maggiore, Iseo and Garda in northern Italy, Lake Bolsena, Albano and Trasimeno in central Italy. Records concerning the Trasimeno basin are not yet available, so the following data refer to the first five mentioned lakes.
The crew of Goletta dei Laghi performed over 55 hours of navigation, for a total 32 segments per lake, averagely 6 per lake.For the task, they used a manta trawl, a sampling floating instrument equipped with an ultrafine mesh, used for a total of 17 hours. The manta is dropped and dragged by a boat and, while immerged averagely 20 cm below the surface, it can filter the flushing water inside the ultrafine mesh and so collect all the solid surface material over 300 micrometers.
www.legambiente.it/marinelitter
LakeBolsena
Lake Maggiore
Lake Iseo
Garda Lake
LakeAlbano
Sampling and analysis protocol 1/2
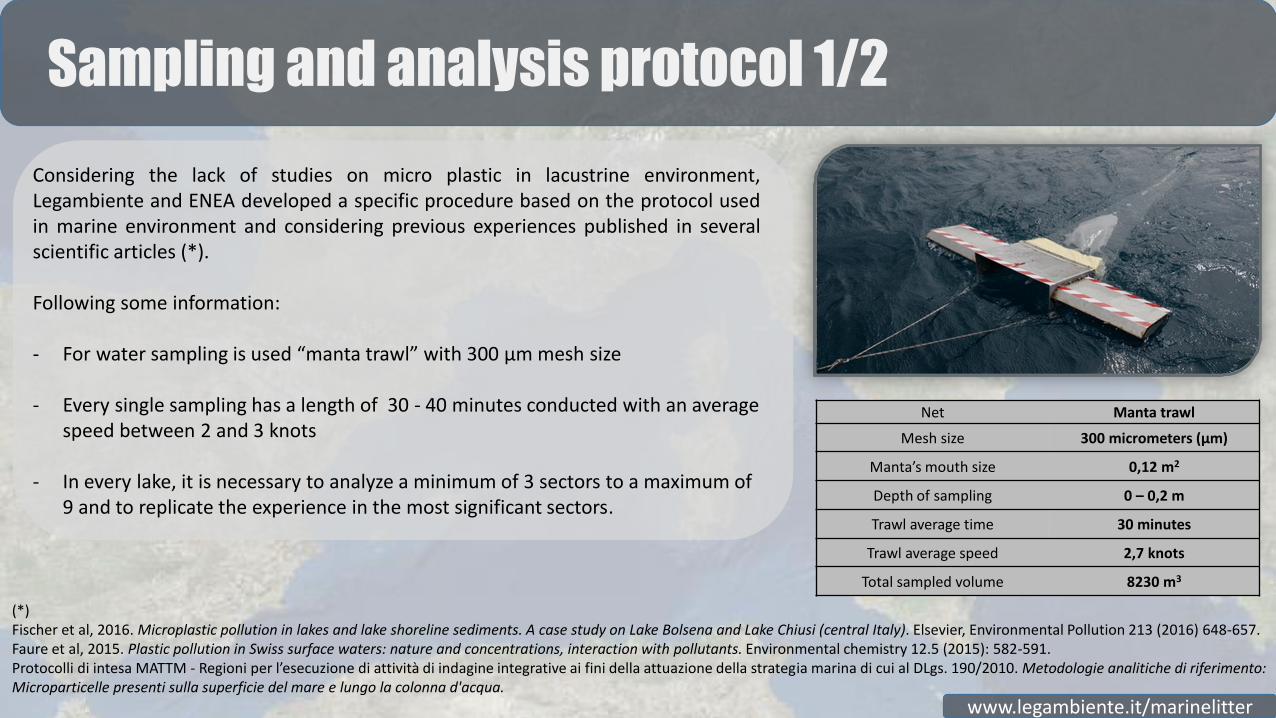
Considering the lack of studies on micro plastic in lacustrine environment,Legambiente and ENEA developed a specific procedure based on the protocol usedin marine environment and considering previous experiences published in severalscientific articles (*).
Following some information:
- For water sampling is used “manta trawl” with 300 µm mesh size
- Every single sampling has a length of 30 - 40 minutes conducted with an average speed between 2 and 3 knots
- In every lake, it is necessary to analyze a minimum of 3 sectors to a maximum of 9 and to replicate the experience in the most significant sectors.
www.legambiente.it/marinelitter
(*) Fischer et al, 2016. Microplastic pollution in lakes and lake shoreline sediments. A case study on Lake Bolsena and Lake Chiusi (central Italy). Elsevier, Environmental Pollution 213 (2016) 648-657.Faure et al, 2015. Plastic pollution in Swiss surface waters: nature and concentrations, interaction with pollutants. Environmental chemistry 12.5 (2015): 582-591.Protocolli di intesa MATTM - Regioni per l’esecuzione di attività di indagine integrative ai fini della attuazione della strategia marina di cui al DLgs. 190/2010. Metodologie analitiche di riferimento: Microparticelle presenti sulla superficie del mare e lungo la colonna d'acqua.
Net Manta trawl
Mesh size 300 micrometers (µm)
Manta’s mouth size 0,12 m2
Depth of sampling 0 – 0,2 m
Trawl average time 30 minutes
Trawl average speed 2,7 knots
Total sampled volume 8230 m3

- The collected samples must be immediately analyzed on board bya pile of sieves with different mesh size and stored in cans filledwith hydrogen peroxide at 4°C
- Notes concerning specific and general information (weather,presence of pollution, winds, gps waypoint, ecc) are recorded in aform filled out by a member of the crew
In Enea labs, the samples were separate from the organic residuesand counted by a binocular stereoscope (20x). In addition, the labcrew noted form and color of the plastic particles also.Next phase, which is still in progress, will define the chemicalcharacterization of the polymers by infrared spectrometry.
This report analyzed and elaborated data concerning microplastic particles from 1 to 5 mm.
www.legambiente.it/marinelitter
Sampling and analysis protocol 2/2
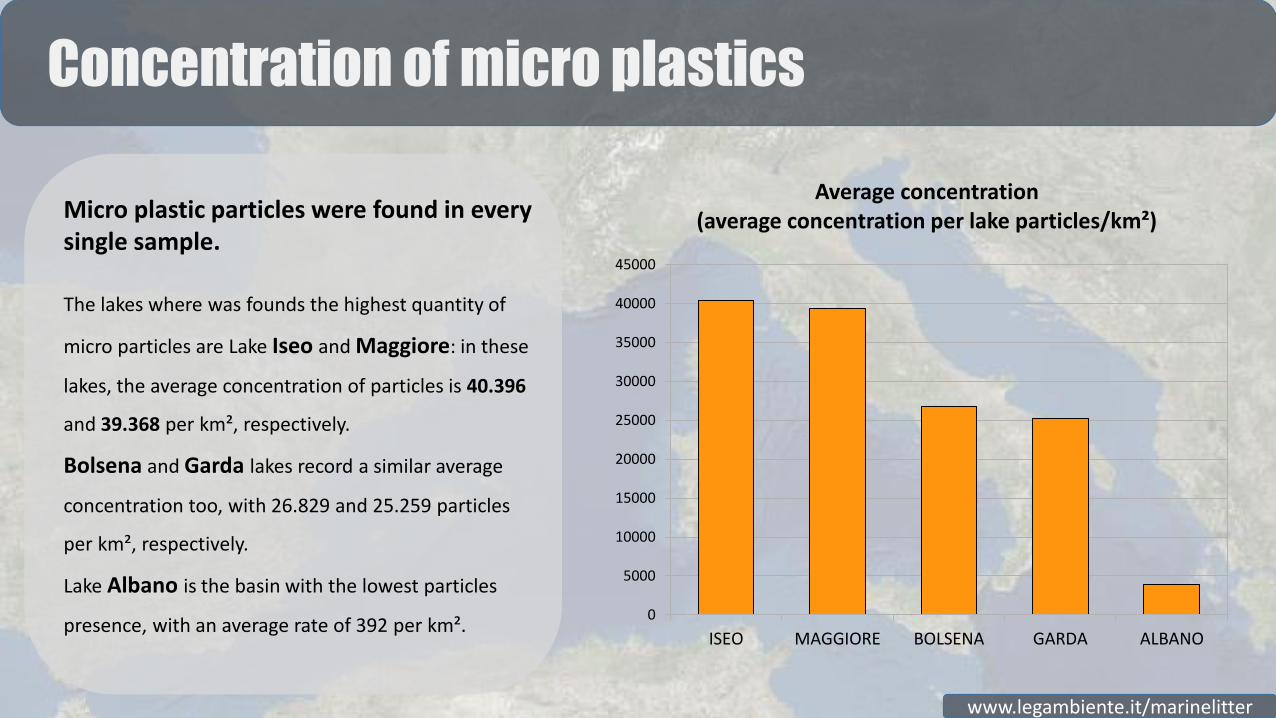
Concentration of micro plastics
Micro plastic particles were found in every single sample.
The lakes where was founds the highest quantity of
micro particles are Lake Iseo and Maggiore: in these
lakes, the average concentration of particles is 40.396
and 39.368 per km², respectively.
Bolsena and Garda lakes record a similar average
concentration too, with 26.829 and 25.259 particles
per km², respectively.
Lake Albano is the basin with the lowest particles
presence, with an average rate of 392 per km².
www.legambiente.it/marinelitter
0
5000
10000
15000
20000
25000
30000
35000
40000
45000
ISEO MAGGIORE BOLSENA GARDA ALBANO
Average concentration(average concentration per lake particles/km²)

Comparison among segments with higher concentration
Many factors can influence the presence of micro plastics in a specific area: weather conditions, wind, presence of pollution, water shift, etc.. but it is possible to record some common characteristics in the sector with higher micro plastics concentration.
Considering the northern lakes, as an example, it is easy to notice how the segments measured in the narrowest part of the basin report the highest concentration. In lakes Iseo and Garda, the narrowest sector correspond with the area where the principle tributaries flow in the lakes, otherwise in Lake Maggiore the narrow zone is between Arona (NO) and Angera (VA).
The lakes in Lazio, central Italy, have different characteristics compared to northern subalpine lakes, so It not possible, in this phase, to make a link between the sector and its micro plastic concentration.
www.legambiente.it/marinelitter
56859
63253
55145
36144
6789
0
10000
20000
30000
40000
50000
60000
70000
Lovere (Bg) –Pisogne (Bs)
Iseo
Arona (No) –Angera (Va)
Maggiore
Riva del Garda (Tn) –Torbole sul Garda (Tn)
Garda
Isola Bisentina– Isola Martana
Bolsena
Lato nord (E – W)
Albano
Sectors with higher concetration(average concentration per sector, particles/km²)
Micro plastics by type 1/2
www.legambiente.it/marinelitter
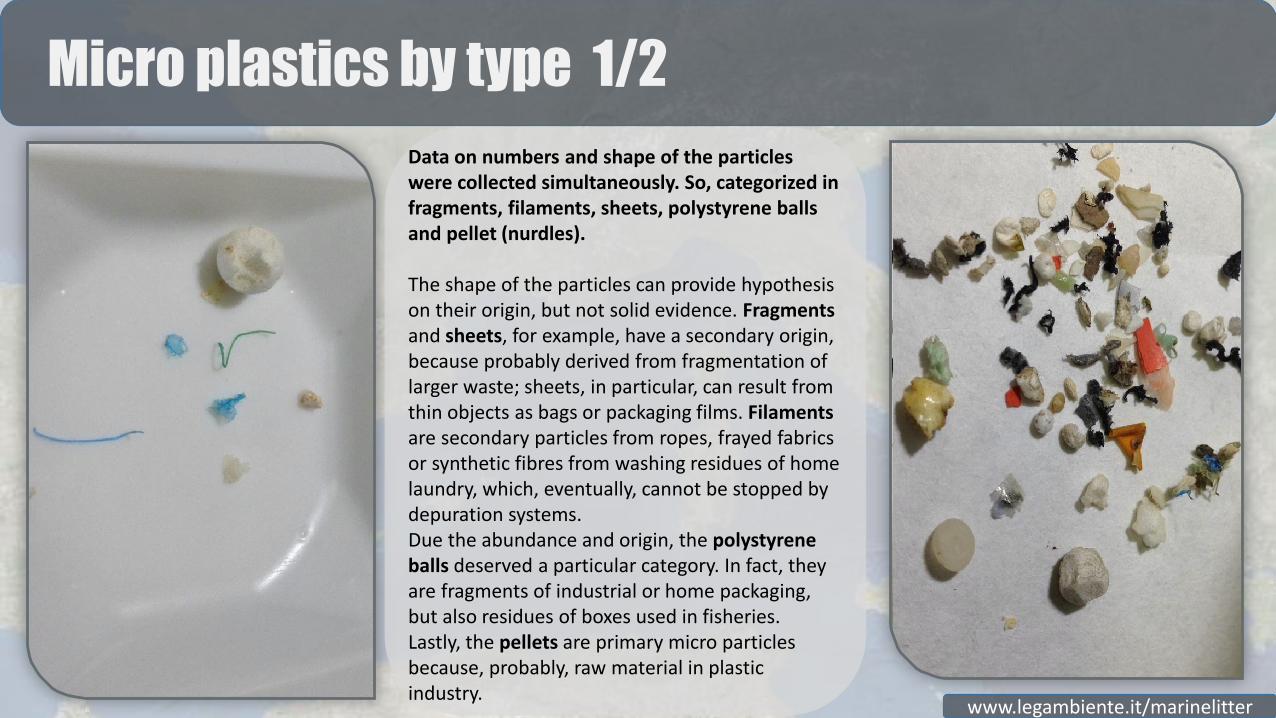
Data on numbers and shape of the particles were collected simultaneously. So, categorized in fragments, filaments, sheets, polystyrene balls and pellet (nurdles).
The shape of the particles can provide hypothesis on their origin, but not solid evidence. Fragmentsand sheets, for example, have a secondary origin, because probably derived from fragmentation of larger waste; sheets, in particular, can result from thin objects as bags or packaging films. Filamentsare secondary particles from ropes, frayed fabrics or synthetic fibres from washing residues of home laundry, which, eventually, cannot be stopped by depuration systems.Due the abundance and origin, the polystyrene balls deserved a particular category. In fact, they are fragments of industrial or home packaging, but also residues of boxes used in fisheries.Lastly, the pellets are primary micro particles because, probably, raw material in plastic industry.

Micro plastics by type 2/2
The fragments are the most abundant particles (70% of allcollected particles) and, with filaments (6,8%) was spotted in every lake.Polystyrene, on the other hand, despite the large presence(14%), it was spotted only in sample from northern lakes. In Lakes of Lazio stand out the presence of sheets shapedfragments (7,2%).
www.legambiente.it/marinelitter
70,1
6,8
7,2
14,3
1,4 0,3
Micro plastic type percentage
0%
10%
20%
30%
40%
50%
60%
70%
80%
90%
100%
Iseo Maggiore Garda Bolsena Albano
Distribution percentage per lakeof micro plastic type
Other
Pellet
Polystyrene
Sheets
Filaments
Fragments

More informations lake to lake
www.legambiente.it/marinelitter

Lake Iseo
The high average concentration in IS1 sector can result by the position, where all the outgoing flows are concentrated.
It is very important to underline the conditions of the lake during the sampling activities. In fact, on those days over 500 thousand people visited the “Floating piers” by Christo. Installation and maintaining, further the huge presence of people, may have led particular elements that may have influenced the sampling.
www.legambiente.it/marinelitter
0
10000
20000
30000
40000
50000
60000
Predore (Bg) – Pilzone (Bs)
Riva di Solto (Bg) –Castro (Bg)
Lovere (Bg) – Pisogne (Bs)
Average concentration per sector(particles/km²)
Sampl. date Drops Avg volume of filtered water Avg concentration per lake particles/km2)
28/06/2016 6 215 40.396 ± 20.398
ID_sector Sector Avg concentration per sector (particles/km²)
IS1 Predore (Bg) – Pilzone (Bs) 49.880
IS2 Riva di Solto (Bg) – Castro (Bg) 14.448
IS3 Lovere (Bg) – Pisogne (Bs) 56.859
Lake Iseo has an average density of over 40 thousand particles per square kilometer. For each sector (IS1, IS2, and IS3) were performed two trawls, for a total of 6 drop of the manta.The highest concentration of micro plastic was found in the northern segment, the IS3, because, probablyintercepted the materials carried by the Oglio river (and therefore from the Camonica valley) and the municipalspillway of Pisogne. Furthermore, by the microbiological analysis of Goletta dei Laghi these two spot are chronicallyaffected by sewage pollution.
IS3
IS2
IS1

Lake Maggiore
The average concentration of micro particles it is over 39 thousands per km2. Five sectors established, in sector MA3 were trawled two segments and the manta was dropped 7 times.The sector MA2, where recorded the highest average concentration of particles per square kilometers, suffers from the proximity of the Torrent Vevera and Arona and Dormelletto areas, two chronically polluted spots in accordance with Golettadei Laghi’s microbiological analysis. The MA3 is the northern sector, the largest one and, probably, intercepts currents from northern Lake Ticino and those from Toce River.
www.legambiente.it/marinelitter
Sampling in Lake Maggiore focused in the southern basin.
Sampl. date Drops Avg volume of filtered water Avg concentration per lake particles/km2)
06/07/2016 7 245 39.368 ± 13.953
ID_sector Sector Avg concentration per sector (particles/km²)
MA1 Sesto Calende (Lisanza) (Va) – Dormelletto (No) 17.015
MA2 Arona (No) – Angera (Va) 63.253
MA3 Ispra (Va) – Monvalle (Va) 45.261
MA4 Lesa (No) – Meina (No) 18.520
MA5 Arona (No) - Dormelletto (No) 41.009
0
10000
20000
30000
40000
50000
60000
70000
Sesto Calende (Lisanza)(Va) –
Dormelletto (No)
Arona (No) – Angera (Va) Ispra (Va) – Monvalle (Va) Lesa (No) – Meina (No) Arona (No) - Dormelletto(No)
Average concentration per sector (particles/km²)
MA3
MA4
MA2
MA1
MA5
MA1

Lake Garda
The sector with highest concentrationof plastic particles is the GA5, locatedin the northern narrowest area of the basin and influenced by Sacra River and torrents Varone and Arbola.The day of the sampling was a raining, so the weather condition could haveinfluenced the collection of the particles.The sectors in the southern lake are located in the largest part of the basinand the rough water of the samplingday could have determined the lowestconcentration of particles spotted.GA1 and GA2 are the sectors with the higher concentration of particles and the closer to the Brescia’s coastwhere, usually, the analysis of Goletta dei Laghi detected the presence of untreated wastewater (Padenghe sul Garda e Desenzano del Garda).
www.legambiente.it/marinelitter
The Lake Garda (or Benaco), with its surface, is the largest Italian lake. The segments to trawl were performed in the northern area of Trentino and in Sirmione peninsula (Bs). The Garda Lake has an average densityof more than 25 thousand particles per square kilometer. In the southern part of the basin, we investigated four sectors. In GA4, in particular, were trawled three segments; due the narrow zone, in the northern area has been trawled 3 segments on a single sector (GA5) and the manta was dropped 9 times.
0
10000
20000
30000
40000
50000
60000
Desenzano del Garda (Bs) – verso
Sirmione
Desenzano del Garda (Bs) – verso
NNE
Desenzano del Garda (Bs) – verso
NE
Sirmione (Bs) –verso NE
Riva del Garda (Tn) – Torbole sul
Garda (Tn)
Average concentration per sector(particles/km²)
Sampl. date Drops Avg volume of filtered water Avg concentration per lake particles/km2)
11-12/07/2016 9 276 25259 ± 20934
ID_sector Sector Avg concentration per sector (particles/km²)
GA1 Desenzano del Garda (Bs) – verso Sirmione 15.930
GA2 Desenzano del Garda (Bs) – verso NNE 29.808
GA3 Desenzano del Garda (Bs) – verso NE 3.291
GA4 Sirmione (Bs) – verso NE 4.291
GA5 Riva del Garda (Tn) – Torbole sul Garda (Tn) 55.145
GA5
GA4
GA1
GA3
GA2

Lake Bolsena
www.legambiente.it/marinelitter
Lake Bolsena report an average concentration of almost 27thousands particles per square kilometer. Here three different sectors were defined and in the first one (BO1), between the towns of Capodimonte and Marta, 3 segments had be trawled and the manta was dropped in water 5 times.The sampling activity was concentrated in the northern area of the basin, in the triangle between Capodimonte, the Bisentina Island and the Martana Island. The sectors with higher concentration of plastic particles per square kilometer are those parallel to the coastal line, BO1 and BO3. The sector BO2 was monitored from north to south, from Bisentina Island to Capodimonte.It’s useful to underline the presence of pollution from untreated wastewaters. Golettadei Laghi frequently reports this contamination.
Sampl. date Drops Avg volume of filtered water Avg concentration per lake particles/km2)
17/07/2016 5 278 26829 ± 12399
ID_sector Sector Avg concentration per sector (particles/km²)
BO1 Capodimonte (Vt) – Marta (Vt) 36.112
BO2 Isola Bisentina – Isola Martana 36.144
BO3 Isola Bisentina – Campodimonte (Vt) 8.231
0
5000
10000
15000
20000
25000
30000
35000
40000
Capodimonte (Vt) – Marta (Vt) Isola Bisentina – Isola Martana Isola Bisentina – Campodimonte (Vt)
Average concentration per sector (particles/km²)
BO1
BO2BO3
Lake Albano
www.legambiente.it/marinelitter
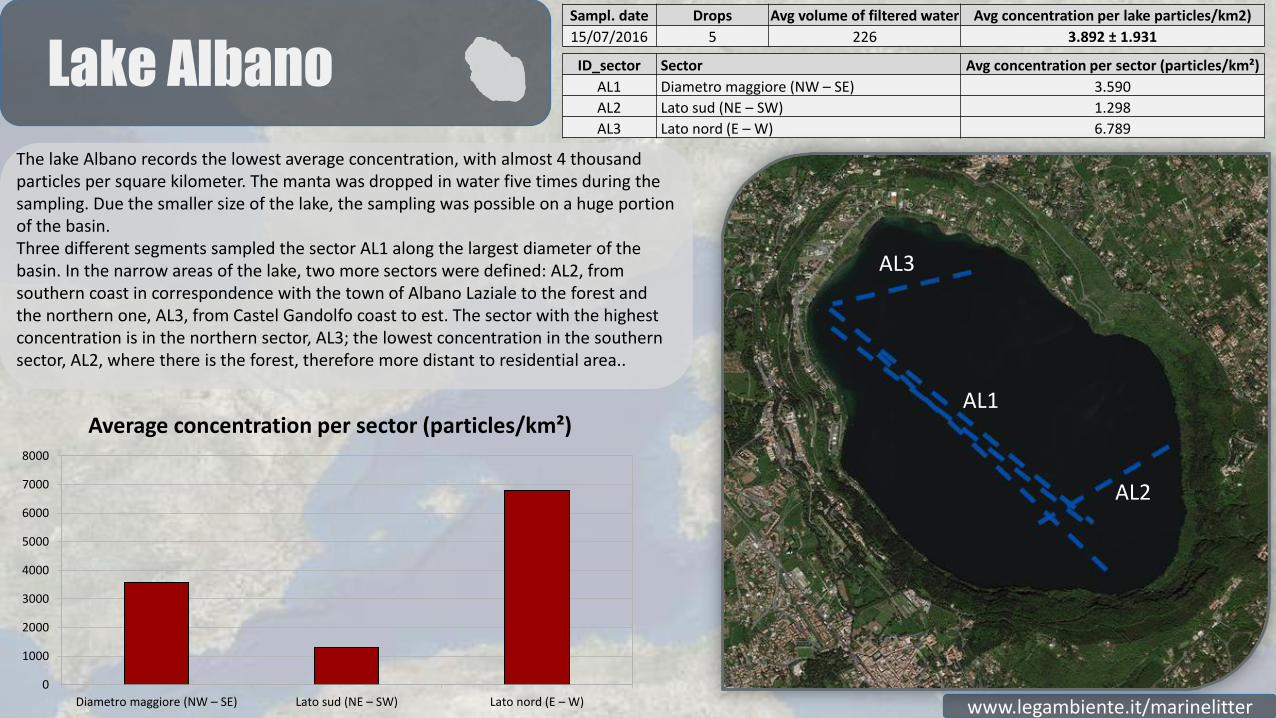
The lake Albano records the lowest average concentration, with almost 4 thousandparticles per square kilometer. The manta was dropped in water five times during the sampling. Due the smaller size of the lake, the sampling was possible on a huge portionof the basin.Three different segments sampled the sector AL1 along the largest diameter of the basin. In the narrow areas of the lake, two more sectors were defined: AL2, from southern coast in correspondence with the town of Albano Laziale to the forest and the northern one, AL3, from Castel Gandolfo coast to est. The sector with the highestconcentration is in the northern sector, AL3; the lowest concentration in the southernsector, AL2, where there is the forest, therefore more distant to residential area..
0
1000
2000
3000
4000
5000
6000
7000
8000
Diametro maggiore (NW – SE) Lato sud (NE – SW) Lato nord (E – W)
Average concentration per sector (particles/km²)
Sampl. date Drops Avg volume of filtered water Avg concentration per lake particles/km2)
15/07/2016 5 226 3.892 ± 1.931
ID_sector Sector Avg concentration per sector (particles/km²)
AL1 Diametro maggiore (NW – SE) 3.590
AL2 Lato sud (NE – SW) 1.298
AL3 Lato nord (E – W) 6.789
AL3
AL1
AL2

More informations
www.legambiente.it/marinelitter
See photo and videos of survey on www.facebook.com/golettalaghiand Youtube channel http://bit.ly/29wOk5h

For LEGAMBIENTE: Giuseppe Adamo, Alice Madeleine Bilgeri, Serena Carpentieri, Flavia Cerri, Lucia Coscia, Stefania Di Vito, Katiuscia Eroe, Antonio Giannattasio, Marco Mancini, Simone Nuglio, Giorgio Zampetti.
For ENEA: Federica Colucci, Mauro Falconieri, Valentina Iannilli, Francesca Lecce, Patrizia Menegoni, Alessandra Paolini, Loris Pietrelli, Gianluca Poeta, Maria Sighicelli, Claudia Trotta.
INFO: [email protected]
Special thanks
Technical partners
Legambiente in collaboration with Enea,
Ca' Foscari University of Venezia, Arpa
Umbria and Lega Navale Italiana