Audited Preliminary Results For Year Ended ... - Micro … · Audited Preliminary Results For Year...
68
Audited Preliminary Results For Year Ended 30 April 2016 Kevin Loosemore, Mike Phillips, Stephen Murdoch, Nils Brauckmann 14th July 2016
Transcript of Audited Preliminary Results For Year Ended ... - Micro … · Audited Preliminary Results For Year...

Audited Preliminary ResultsFor Year Ended 30 April 2016
Kevin Loosemore, Mike Phillips,
Stephen Murdoch, Nils Brauckmann
14th July 2016

Safe Harbour Statement
• The following presentation is being made only to, and is only directed at, persons to whom such presentation may lawfully be communicated (“relevant persons”). Any person who is not a relevant person should not act or rely on this presentation or any of its contents. Information in the following presentation relating to the price at which relevant investments have been bought or sold in the past or the yield on such investments cannot be relied upon as a guide to the future performance of such investments.
• This presentation does not constitute an offering of securities or otherwise constitute an invitation or inducement to any person to underwrite, subscribe for or otherwise acquire securities in Micro Focus International plc (the “Company”) or any company which is a subsidiary of the Company.
• The release, publication or distribution or this presentation in certain jurisdictions may be restricted by law, and therefore persons in such jurisdictions into which this presentation is released, published or distributed should inform themselves about, and observe, such restrictions.
• Certain statements contained in this presentation constitute forward-looking statements. All statements other than statements of historical facts included in this presentation, including, without limitation, those regarding the Company’s financial condition, business strategy, plans and objectives, are forward-looking statements. These forward-looking statements can be identified by the use of forward-looking terminology, including the terms “believes”, “estimates”, “anticipates”, “expects”, “intends”, “may”, “will”, or “should” or, in each case, their negative or other variat ions or comparable terminology. Such forward-looking statements involve known and unknown risks, uncertainties and other factors, which may cause the actual results, performance or achievements of the Company, or industry results, to be materially different from any future results, performance or achievements expressed or implied by such forward-looking statements. Such forward-looking statements are based on numerous assumptions regarding the Company’s present and future business strategies and the environment in which the Company will operate in the future. Such risks, uncertainties and other factors include, among others: the level of expenditure committed to development and deployment applications by organisations; the level of deployment-related turnover expected by the Company; the degree to which organisations adopt web-enabled services; the rate at which large organisations migrate applications from the mainframe environment; the continued use and necessity of the mainframe for business critical applications; the degree of competition faced by the Company; growth in the information technology services market; general economic and business conditions, particularly in the United States; changes in technology and competition; and the Company’s ability to attract and retain qualified personnel. These forward-looking statements speak only as at the date of this presentation. Except as required by the Financial Conduct Authority, or by law, the Company does not undertake any obligation to update or revise publicly any forward-looking statement, whether as a result of new information, future events, or otherwise.
2

Agenda
Overview and Outlook
Financial Review
Micro Focus Operations
SUSE Operations
Question and Answer
3

Overview
Kevin Loosemore
Executive Chairman

Overview
Results at the high end of management expectations
Total Shareholder Return strategy continues
• Final Dividend increased by 50.7% to 49.74 cents (2015: 33.00
cents)
• Full Year Dividend increased by 37.8% to 66.68 cents
(2015: 48.40 cents)
• Return of Value to shareholders in 2017
5

Preview Questions – A Range of Topics
• Is there any change in strategy?
• How and when are you going to return excess cash?
• Is the TAG acquisition delivering as planned?
• What’s the plan re acquisitions?
6
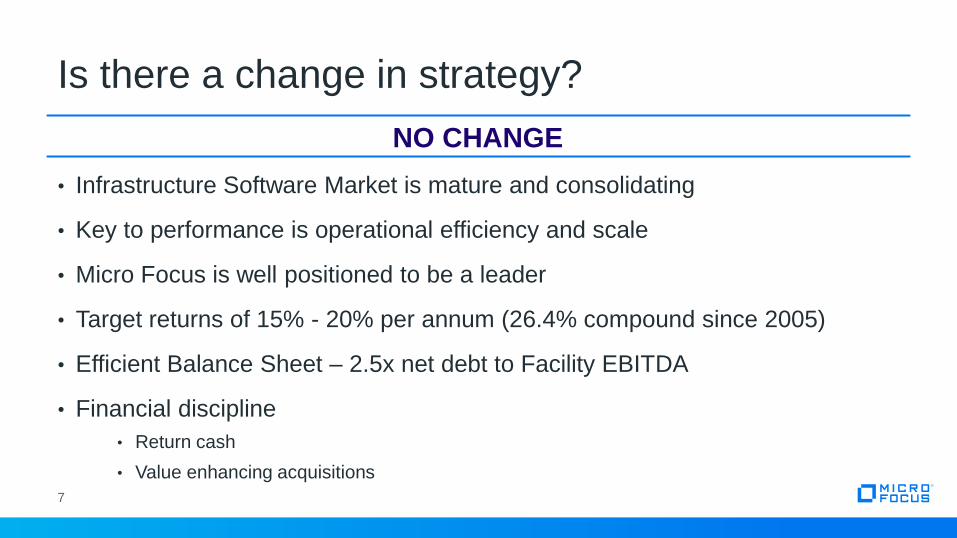
• Infrastructure Software Market is mature and consolidating
• Key to performance is operational efficiency and scale
• Micro Focus is well positioned to be a leader
• Target returns of 15% - 20% per annum (26.4% compound since 2005)
• Efficient Balance Sheet – 2.5x net debt to Facility EBITDA
• Financial discipline
• Return cash
• Value enhancing acquisitions
7
Is there a change in strategy?
NO CHANGE
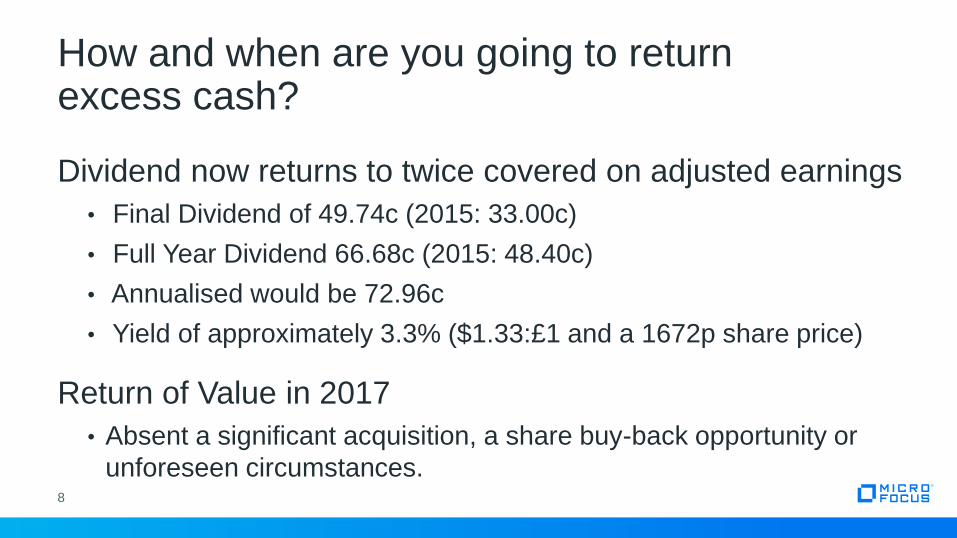
Dividend now returns to twice covered on adjusted earnings
• Final Dividend of 49.74c (2015: 33.00c)
• Full Year Dividend 66.68c (2015: 48.40c)
• Annualised would be 72.96c
• Yield of approximately 3.3% ($1.33:£1 and a 1672p share price)
Return of Value in 2017
• Absent a significant acquisition, a share buy-back opportunity or
unforeseen circumstances.8
How and when are you going to return excess cash?
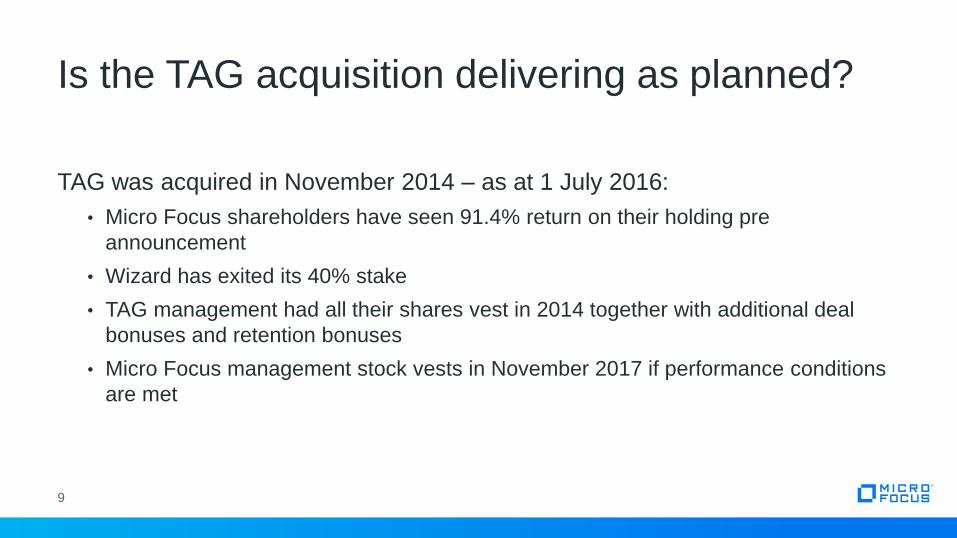
TAG was acquired in November 2014 – as at 1 July 2016:
• Micro Focus shareholders have seen 91.4% return on their holding pre
announcement
• Wizard has exited its 40% stake
• TAG management had all their shares vest in 2014 together with additional deal
bonuses and retention bonuses
• Micro Focus management stock vests in November 2017 if performance conditions
are met
9
Is the TAG acquisition delivering as planned?
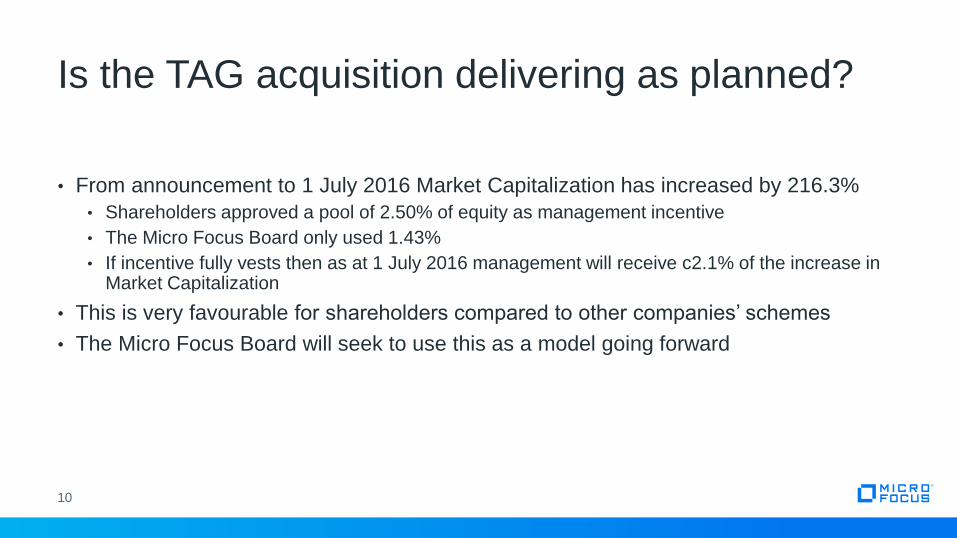
• From announcement to 1 July 2016 Market Capitalization has increased by 216.3%
• Shareholders approved a pool of 2.50% of equity as management incentive
• The Micro Focus Board only used 1.43%
• If incentive fully vests then as at 1 July 2016 management will receive c2.1% of the increase in Market Capitalization
• This is very favourable for shareholders compared to other companies’ schemes
• The Micro Focus Board will seek to use this as a model going forward
10
Is the TAG acquisition delivering as planned?
We will pursue acquisitions that fit our industrial strategy
and give enhanced returns to shareholders:
• Mature
• Infrastructure
• Sticky
11
What’s the plan re acquisitions?
NO CHANGE

Creating Greater Flexibility for M&A
At the AGM we will be seeking additional flexibility to avoid
being at a competitive disadvantage:
• Resolution: Grant the Board authority to implement an ASG
scheme in the event of an acquisition that can deliver shareholders
returns of 50% to 100% over three years
• Resolution: Grant the Board authority to allocate an additional 10%
of share capital in the event of an appropriate acquisition
12
• Consistent double digit shareholder returns
• Revenue in FY17 minus 2% to zero
• Compared to FY16 CCY pro-forma with Serena
• FY17 revenue exit rate flat with FY16 and anticipate
revenue growth in FY18
• Maintain target net debt at 2.5 times Facility EBITDA
• Appropriate value enhancing acquisitions13
Outlook

Financial Review
Mike Phillips
CFO

Results at a Glance
15
FY 2016
$m
FY 2015
$mChange
Total Revenue at Constant Currency 1,245.0 804.0 54.9%
- Licence 304.8 251.5 21.2%
- Maintenance 644.5 425.5 51.5%
- Subscriptions 248.9 94.9 162.3%
- Consultancy 46.8 32.1 45.8%
Total Reported Revenue 1,245.0 834.5 49.2%
NON GAAP MEASURES
Adjusted EBITDA
Constant Currency 546.8 344.0 59.0%
Reported 546.8 357.6 52.9%
Underlying Adjusted EBITDA
Constant Currency 532.5 334.7 59.1%
Reported 532.5 348.3 52.9%
STATUTORY MEASURES
Pre-tax profit
Constant Currency 195.4 81.3 140.3%
Reported 195.4 91.4 113.8%
Net debt 1,078.0 1,403.5 -23.2%
Earnings per share Cents Cents
Diluted 71.61 56.71 26.3%
Adjusted diluted 146.70 129.43 13.3%
Dividend per share 66.68 48.40 37.8%

On a pro-forma CCY basis to provide a better comparison of performance
• Total revenues of $1,245.0m (2015: pro-forma CCY $1,270.7m), a reduction of 2.0%, at the top of the range of management’s guidance
• Growth in SUSE subscription and consultancy revenues
• Offset by anticipated declines in Micro Focus revenues
• Adjusted EBITDA of $546.8m (2015: pro-forma CCY $499.3m), an increase of 9.5%
• Underlying Adjusted EBITDA of $532.5m (2015: pro-forma CCY $486.8m), an increase of 9.4%
Growth in Adjusted diluted earnings per share of 13.3% to 146.70 cents (2015: 129.43 cents)
Acquisition of Serena Software Inc. (“Serena”) announced on 22 March 2016
• Purchase price of $540.0m on a cash and debt free basis,
• Funded by existing and extended revolving credit facility of $375m and a placing of 10.87m shares at a price of 1,455 pence raising £158.2m ($225.7m) gross and £156.1m ($222.7m) net.
• Completion of the Serena acquisition took place on 2 May 2016
• Revenue of $162.3m and Underlying Adjusted EBITDA of $80.9m in the year ended 31 January 2016
16
Key Highlights
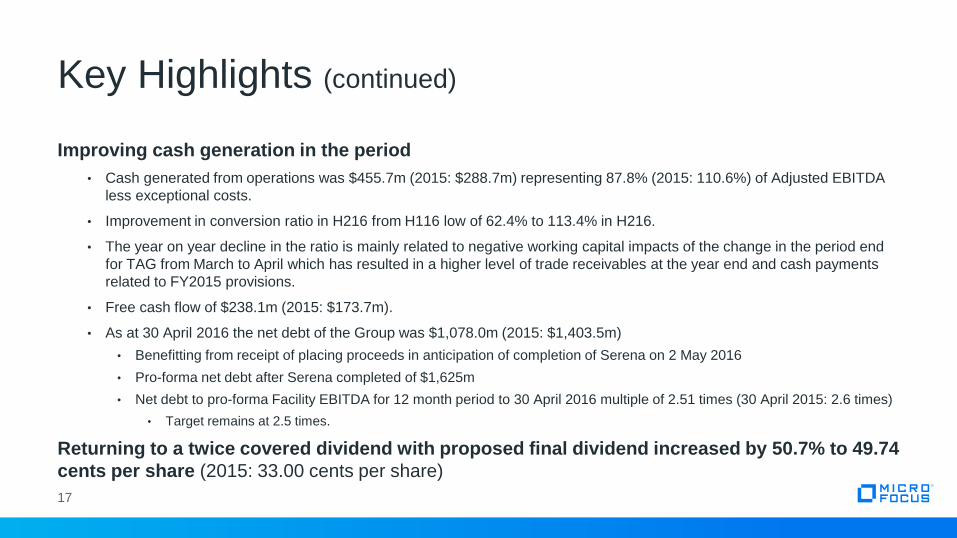
Improving cash generation in the period
• Cash generated from operations was $455.7m (2015: $288.7m) representing 87.8% (2015: 110.6%) of Adjusted EBITDA
less exceptional costs.
• Improvement in conversion ratio in H216 from H116 low of 62.4% to 113.4% in H216.
• The year on year decline in the ratio is mainly related to negative working capital impacts of the change in the period end
for TAG from March to April which has resulted in a higher level of trade receivables at the year end and cash payments
related to FY2015 provisions.
• Free cash flow of $238.1m (2015: $173.7m).
• As at 30 April 2016 the net debt of the Group was $1,078.0m (2015: $1,403.5m)
• Benefitting from receipt of placing proceeds in anticipation of completion of Serena on 2 May 2016
• Pro-forma net debt after Serena completed of $1,625m
• Net debt to pro-forma Facility EBITDA for 12 month period to 30 April 2016 multiple of 2.51 times (30 April 2015: 2.6 times)
• Target remains at 2.5 times.
Returning to a twice covered dividend with proposed final dividend increased by 50.7% to 49.74
cents per share (2015: 33.00 cents per share)
17
Key Highlights (continued)
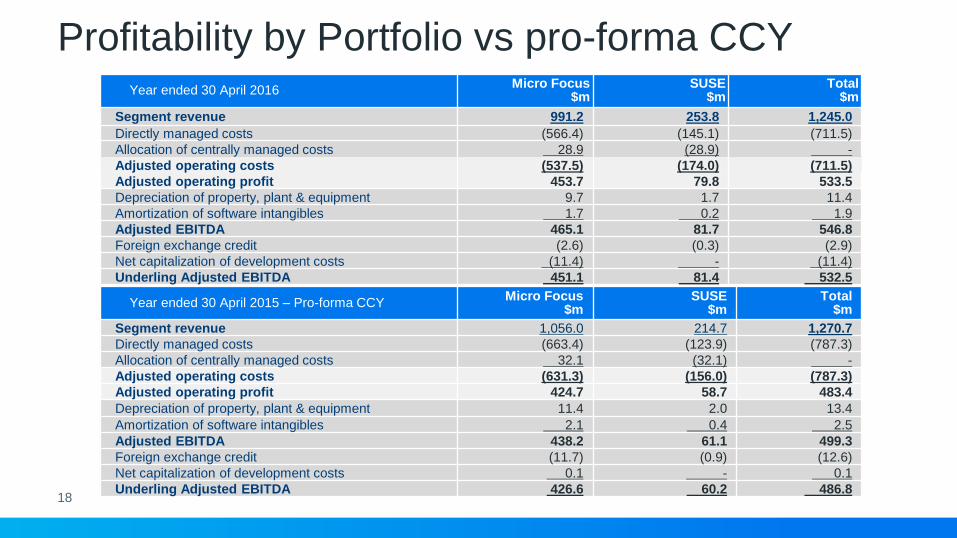
Profitability by Portfolio vs pro-forma CCY
18
Year ended 30 April 2015 – Pro-forma CCYMicro Focus
$mSUSE
$mTotal
$m
Segment revenue 1,056.0 214.7 1,270.7
Directly managed costs (663.4) (123.9) (787.3)
Allocation of centrally managed costs 32.1 (32.1) -
Adjusted operating costs (631.3) (156.0) (787.3)
Adjusted operating profit 424.7 58.7 483.4
Depreciation of property, plant & equipment 11.4 2.0 13.4
Amortization of software intangibles 2.1 0.4 2.5
Adjusted EBITDA 438.2 61.1 499.3
Foreign exchange credit (11.7) (0.9) (12.6)
Net capitalization of development costs 0.1 - 0.1
Underling Adjusted EBITDA 426.6 60.2 486.8
Year ended 30 April 2016Micro Focus
$mSUSE
$mTotal
$m
Segment revenue 991.2 253.8 1,245.0
Directly managed costs (566.4) (145.1) (711.5)
Allocation of centrally managed costs 28.9 (28.9) -
Adjusted operating costs (537.5) (174.0) (711.5)
Adjusted operating profit 453.7 79.8 533.5
Depreciation of property, plant & equipment 9.7 1.7 11.4
Amortization of software intangibles 1.7 0.2 1.9
Adjusted EBITDA 465.1 81.7 546.8
Foreign exchange credit (2.6) (0.3) (2.9)
Net capitalization of development costs (11.4) - (11.4)
Underling Adjusted EBITDA 451.1 81.4 532.5
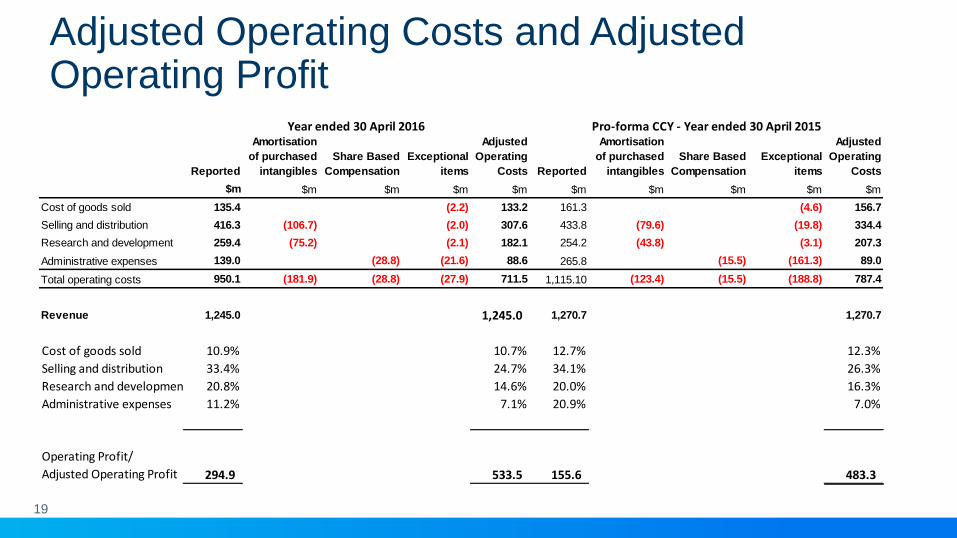
Adjusted Operating Costs and Adjusted Operating Profit
19
Reported
Amortisation
of purchased
intangibles
Share Based
Compensation
Exceptional
items
Adjusted
Operating
Costs Reported
Amortisation
of purchased
intangibles
Share Based
Compensation
Exceptional
items
Adjusted
Operating
Costs
$m $m $m $m $m $m $m $m $m $m
Cost of goods sold 135.4 (2.2) 133.2 161.3 (4.6) 156.7
Selling and distribution 416.3 (106.7) (2.0) 307.6 433.8 (79.6) (19.8) 334.4
Research and development 259.4 (75.2) (2.1) 182.1 254.2 (43.8) (3.1) 207.3
Administrative expenses 139.0 (28.8) (21.6) 88.6 265.8 (15.5) (161.3) 89.0
Total operating costs 950.1 (181.9) (28.8) (27.9) 711.5 1,115.10 (123.4) (15.5) (188.8) 787.4
Revenue 1,245.0 1,245.0 1,270.7 1,270.7
Cost of goods sold 10.9% 10.7% 12.7% 12.3%
Selling and distribution 33.4% 24.7% 34.1% 26.3%
Research and development 20.8% 14.6% 20.0% 16.3%
Administrative expenses 11.2% 7.1% 20.9% 7.0%
Operating Profit/
Adjusted Operating Profit 294.9 533.5 155.6 483.3
Year ended 30 April 2016 Pro-forma CCY - Year ended 30 April 2015
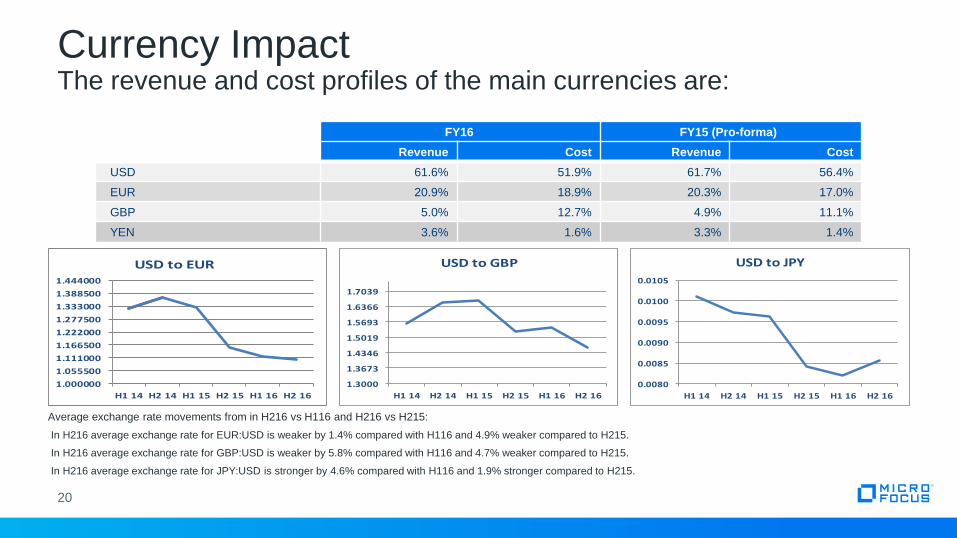
Currency ImpactThe revenue and cost profiles of the main currencies are:
20
FY16 FY15 (Pro-forma)
Revenue Cost Revenue Cost
USD 61.6% 51.9% 61.7% 56.4%
EUR 20.9% 18.9% 20.3% 17.0%
GBP 5.0% 12.7% 4.9% 11.1%
YEN 3.6% 1.6% 3.3% 1.4%
Average exchange rate movements from in H216 vs H116 and H216 vs H215:
In H216 average exchange rate for EUR:USD is weaker by 1.4% compared with H116 and 4.9% weaker compared to H215.
In H216 average exchange rate for GBP:USD is weaker by 5.8% compared with H116 and 4.7% weaker compared to H215.
In H216 average exchange rate for JPY:USD is stronger by 4.6% compared with H116 and 1.9% stronger compared to H215.
1.000000
1.055500
1.111000
1.166500
1.222000
1.277500
1.333000
1.388500
1.444000
H1 14 H2 14 H1 15 H2 15 H1 16 H2 16
USD to EUR
1.3000
1.3673
1.4346
1.5019
1.5693
1.6366
1.7039
H1 14 H2 14 H1 15 H2 15 H1 16 H2 16
USD to GBP
0.0080
0.0085
0.0090
0.0095
0.0100
0.0105
H1 14 H2 14 H1 15 H2 15 H1 16 H2 16
USD to JPY

FY15 Pro-forma CCY Revenue and Underlying Adjusted EBITDA
21
Revenue
$m
Costs
$m
Underlying
Adjusted EBITDA
$m
As reported at actual rates of exchange 1,320.7 817.7 503.0
Based on FY16 currency rates 1,270.7 783.9 486.8
Currency Impact (3.8)% 4.1% (3.2)%
Pro-forma is year to 30 April 15
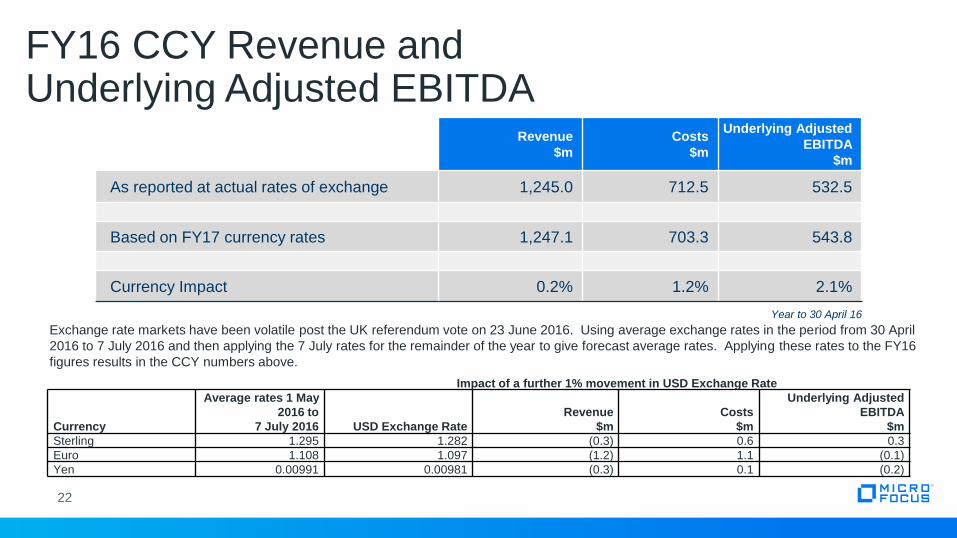
FY16 CCY Revenue and Underlying Adjusted EBITDA
22
Revenue
$m
Costs
$m
Underlying Adjusted
EBITDA
$m
As reported at actual rates of exchange 1,245.0 712.5 532.5
Based on FY17 currency rates 1,247.1 703.3 543.8
Currency Impact 0.2% 1.2% 2.1%
Year to 30 April 16
Exchange rate markets have been volatile post the UK referendum vote on 23 June 2016. Using average exchange rates in the period from 30 April
2016 to 7 July 2016 and then applying the 7 July rates for the remainder of the year to give forecast average rates. Applying these rates to the FY16
figures results in the CCY numbers above.
Impact of a further 1% movement in USD Exchange Rate
Currency
Average rates 1 May
2016 to
7 July 2016 USD Exchange Rate
Revenue
$m
Costs
$m
Underlying Adjusted
EBITDA
$m
Sterling 1.295 1.282 (0.3) 0.6 0.3
Euro 1.108 1.097 (1.2) 1.1 (0.1)
Yen 0.00991 0.00981 (0.3) 0.1 (0.2)
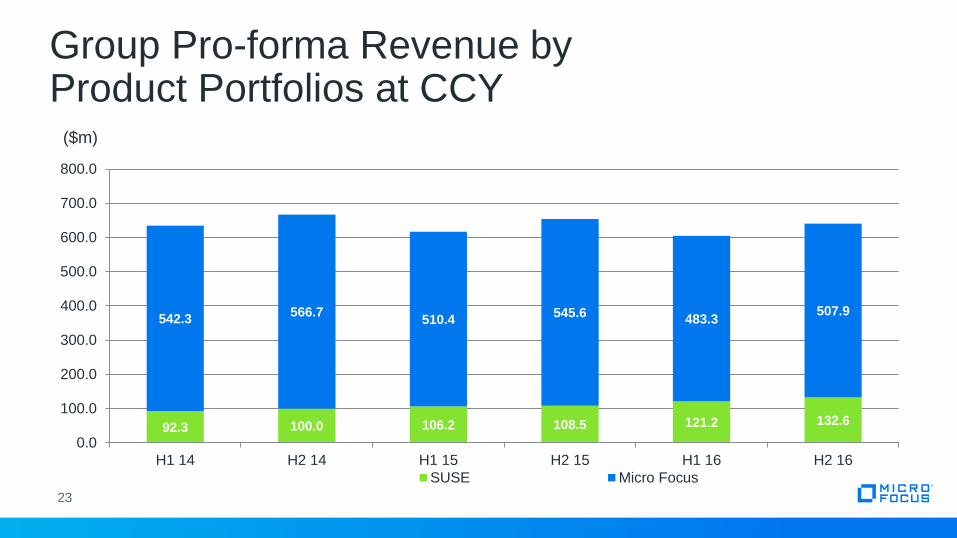
Group Pro-forma Revenue by Product Portfolios at CCY
23
($m)
92.3 100.0 106.2 108.5 121.2 132.6
542.3566.7
510.4545.6
483.3507.9
0.0
100.0
200.0
300.0
400.0
500.0
600.0
700.0
800.0
H1 14 H2 14 H1 15 H2 15 H1 16 H2 16
SUSE Micro Focus

FY 2016 Revenue by Portfolio Group
24
Year ended 30 April 2016As Reported
Year ended 30 April 2015Pro-forma CCY 1
Year ended 30 April 2016 Pro-forma CCY Growth
Year ended 30 April 2015As reported
$m $m % $m
Micro Focus Product Portfolio
Licence 304.8 320.3 (4.8%) 261.0
Maintenance 644.5 686.3 (6.1%) 440.6
Consultancy 41.9 49.4 (15.2%) 31.8
991.2 1,056.0 (6.1%) 733.4
SUSE Product Portfolio
Subscription 248.9 210.5 18.2% 98.2
Consultancy 4.9 4.2 16.7% 2.9
253.8 214.7 18.2% 101.1
Total Revenue
Licence 304.8 320.3 (4.8%) 261.0
Maintenance 644.5 686.3 (6.1%) 440.6
Subscription 248.9 210.5 18.2% 98.2
Consultancy 46.8 53.6 (12.7%) 34.7
Revenue 1,245.0 1,270.7 (2.0%) 834.5 1 Unaudited

SUSE
• Total Contract Value (“TCV”)
• The value of the invoiced amount on any contract (“Billings”)
• Weighted Average Contract Period
• For the contracts signed and/or invoiced in the period the weighted average invoice period in months
• Annual Contract Value (“ACV”)
• The first 12 months value of the TCV in the period. Billings less than 12 months are included in full
SUSE and Micro Focus
• Subscription and maintenance contract renewal rates are not being provided
• Our methodology is still being refined in order to accommodate data from our multiple systems
• Trending the maintenance revenues provides the best guidance for those revenue streams
25
Metrics Being Provided

Group Pro-forma Revenue at CCY by Type($m)
26
COBOL Development & Mainframe Solutions
0.0
20.0
40.0
60.0
80.0
100.0
120.0
140.0
160.0
H1 14 H2 14 H1 15 H2 15 H1 16 H2 16
Maintenance Licence Services
0.0
20.0
40.0
60.0
80.0
100.0
120.0
140.0
160.0
H1 14 H2 14 H1 15 H2 15 H1 16 H2 16
Maintenance Licence Services
Host Connectivity

Group Pro-forma Revenue at CCY by Type($m)
27
0.0
20.0
40.0
60.0
80.0
100.0
120.0
140.0
160.0
H1 14 H2 14 H1 15 H2 15 H1 16 H2 16
Maintenance Licence Services
0.0
20.0
40.0
60.0
80.0
100.0
120.0
140.0
160.0
H1 14 H2 14 H1 15 H2 15 H1 16 H2 16
Maintenance Licence Services
Identity & Access Security Development & IT Operations Management Tools

Group Pro-forma Revenue at CCY by Type($m)
28
0.0
20.0
40.0
60.0
80.0
100.0
120.0
140.0
160.0
H1 14 H2 14 H1 15 H2 15 H1 16 H2 16
Maintenance Licence Services
0.0
20.0
40.0
60.0
80.0
100.0
120.0
140.0
160.0
H1 14 H2 14 H1 15 H2 15 H1 16 H2 16
Subscription Services
Collaboration & Networking SUSE
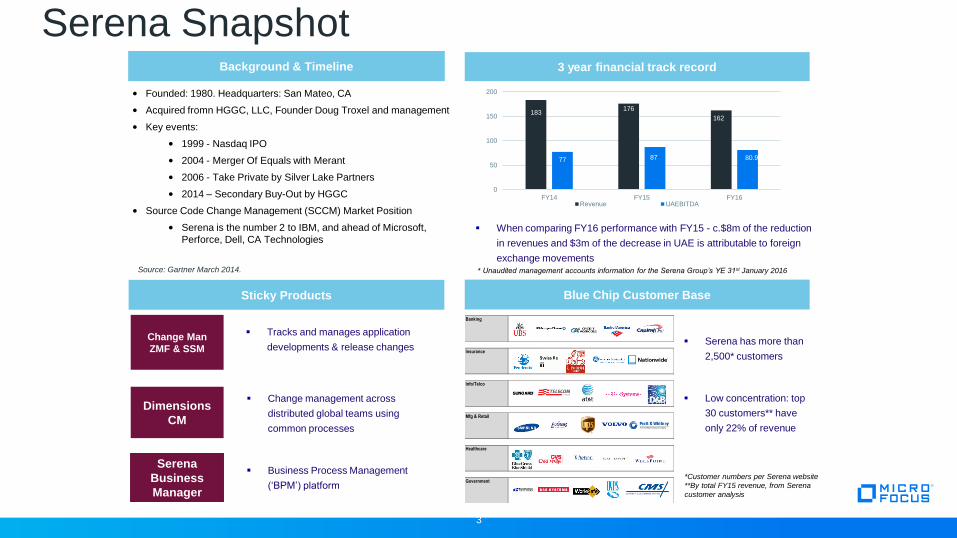
Serena SnapshotBackground & Timeline 3 year financial track record
• Founded: 1980. Headquarters: San Mateo, CA
• Acquired fromn HGGC, LLC, Founder Doug Troxel and management
• Key events:
• 1999 - Nasdaq IPO
• 2004 - Merger Of Equals with Merant
• 2006 - Take Private by Silver Lake Partners
• 2014 – Secondary Buy-Out by HGGC
• Source Code Change Management (SCCM) Market Position
• Serena is the number 2 to IBM, and ahead of Microsoft,
Perforce, Dell, CA Technologies
Sticky Products
3
Blue Chip Customer Base
Banking
Insurance
Info/Telco
Mfg & Retail
Healthcare
Government
Tracks and manages application
developments & release changesChange Man
ZMF & SSM
Serena
Business
Manager
Business Process Management
(‘BPM’) platform
Dimensions
CM
Change management across
distributed global teams using
common processes
Serena has more than
2,500* customers
Low concentration: top
30 customers** have
only 22% of revenue
*Customer numbers per Serena website
**By total FY15 revenue, from Serena
customer analysis
* Unaudited management accounts information for the Serena Group’s YE 31st January 2016Source: Gartner March 2014.
When comparing FY16 performance with FY15 - c.$8m of the reduction
in revenues and $3m of the decrease in UAE is attributable to foreign
exchange movements
183176
162
77 87 80.9
0
50
100
150
200
FY14 FY15 FY16Revenue UAEBITDA

FY16 CCY Revenue and Underlying Adjusted EBITDA for the Enlarged Group
30
Revenue
$m
Costs
$m
Underlying Adjusted
EBITDA
$m
Serena – year ended 31 January 2016 162.3 81.4 80.9
Restated on FY17 currency rates 161.1 80.1 81.0
Existing Group 1,247.1 703.3 543.8
Enlarged Group FY16 at FY17 currency rates 1,408.2 783.4 624.8
FY17 revenue guidance of minus 2% to zero% off the FY16 CCY revenues would give a range of $1,380.0m to $1,408.2m.

Exceptional Costs
31
2016
$m
2015
$m
Acquisition costs 0.5 26.9
Pre-acquisition costs 5.6 -
Property costs 6.0 18.2
Severance costs (4.8) 30.7
Impairment of Intangible Assets - 11.6
Impairment of prepayments - 1.7
Royalty provision release (3.0) -
Integration costs 23.6 7.6
Accelerated amortization of facility fees - 2.4
Total 27.9 99.1

Summary Balance Sheet
32
30 April 2016
$m
30 April 2015
$m
Non-current assets 3,681.3 3,879.6
Inventories 0.1 0.1
Trade and other receivables 268.2 218.7
Current tax receivables 18.0 -
Cash and cash equivalents 667.2 241.3
Assets classified as held for sale 0.9 0.9
Total assets 4,635.7 4,340.6
Liabilities
Current liabilities
Trade and other payables 188.1 161.4
Borrowings 275.3 125.7
Provisions 10.5 49.3
Current tax liabilities 22.4 67.9
Deferred income 565.5 583.7
Non-current liabilities
Deferred income 196.5 194.9
Borrowings 1,470.0 1,519.1
Retirement benefit obligations 31.7 32.7
Long-term provisions 14.3 17.9
Other non-current liabilities 3.7 5.3
Deferred tax liabilities 264.0 304.6
Total liabilities 3,042.0 3,062.5
Net assets 1,593.7 1,278.1
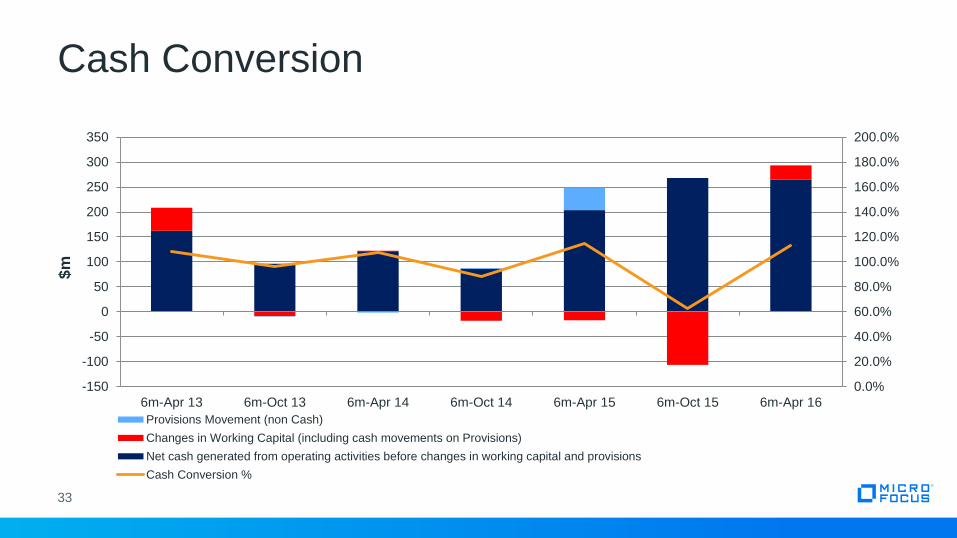
Cash Conversion
33
0.0%
20.0%
40.0%
60.0%
80.0%
100.0%
120.0%
140.0%
160.0%
180.0%
200.0%
-150
-100
-50
0
50
100
150
200
250
300
350
6m-Apr 13 6m-Oct 13 6m-Apr 14 6m-Oct 14 6m-Apr 15 6m-Oct 15 6m-Apr 16
$m
Provisions Movement (non Cash)
Changes in Working Capital (including cash movements on Provisions)
Net cash generated from operating activities before changes in working capital and provisions
Cash Conversion %

Changes in Working Capital
34
0
5
10
15
20
25
30
35
40
45
50
55
60
65
(140)
(120)
(100)
(80)
(60)
(40)
(20)
0
20
40
60
80
100
120
6m-Apr 13 6m-Oct 13 6m- Apr 14 6m-Oct 14 6m-Apr 15 6m-Oct 15 6m-Apr 16
Days S
ale
s O
uts
tan
din
g
Trade Debtors Deferred Income Provision (cash element) TAG Acq Costs Others DSO
$2.6m $28.5m
Net Change in Working Capital
$6.0m
$m
$(8.7)m $(19.5)m $(17.0)m $(106.4)m

• Reported effective tax rate (“ETR”) in the period is 16.6% (2015: minus 11.0%)
• Adjusted ETR in the period is 23.1% (2015: 21.2%) in line with guidance range of 21% to 25%
35
Taxation
Year ended30 April 2016
$mETR
Year ended30 April 2015
$mETR
Profit before tax (PBT) 195.4 91.4
Share based compensation 28.8 15.5
Amortization of purchased intangibles 181.9 88.3
Exceptional costs 27.9 96.7
Exceptional finance costs - 2.4
Adjusted PBT 434.0 294.3
Tax (charge) / credit as reported (32.4) 16.6% 10.0 (11.0)%
Tax on adjusted items (67.8) (62.5)
Other tax items (below) - (9.9)
Adjusted tax charge (100.2) 23.1% (62.4) 21.2%
Other tax items in the prior year included the recognition of deferred tax assets relating to tax credits as a result of the TAG acquisition ($5.1m) and the recognition of UK patent box benefits
relating to the year ended 30 April 2014 ($4.8m)
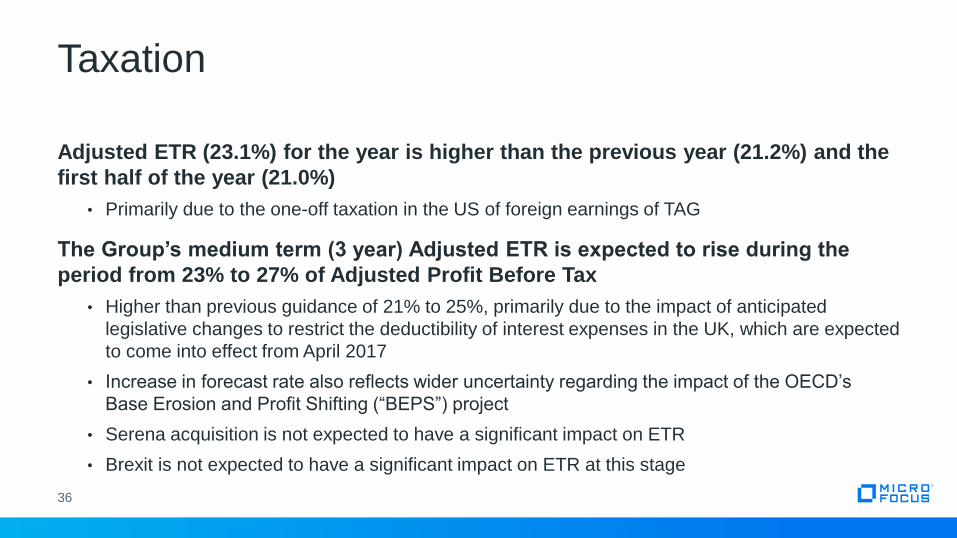
Adjusted ETR (23.1%) for the year is higher than the previous year (21.2%) and the
first half of the year (21.0%)
• Primarily due to the one-off taxation in the US of foreign earnings of TAG
The Group’s medium term (3 year) Adjusted ETR is expected to rise during the
period from 23% to 27% of Adjusted Profit Before Tax
• Higher than previous guidance of 21% to 25%, primarily due to the impact of anticipated
legislative changes to restrict the deductibility of interest expenses in the UK, which are expected
to come into effect from April 2017
• Increase in forecast rate also reflects wider uncertainty regarding the impact of the OECD’s
Base Erosion and Profit Shifting (“BEPS”) project
• Serena acquisition is not expected to have a significant impact on ETR
• Brexit is not expected to have a significant impact on ETR at this stage
36
Taxation

Taxes paid during the year were $79.3m (2015: net receipt $1.8m) reflecting
the following:
• $24.5m paid under Accelerated Payment Notice issued by HMRC in relation to historic UK tax
claim, where discussions with HMRC are ongoing
• $27.2m paid in the US in respect of Federal income tax liabilities for FY15 and FY16
• Tax liabilities for those years are now expected to be significantly lower than anticipated when those
payments were made, which accounts for the majority of the current tax receivables on the balance
sheet of $18.0m. This will reduce Group cash tax payable in FY17.
• Reduction is due to the offset of deferred tax assets, so no impact on Group ETR.
• $17.0m was received in the US in the prior year relating to the settlement of tax audits and
historic overpayments
37
Taxation

Profitability by Portfolio vs pro-forma CCY
38
Year ended 30 April 2015 – Pro-forma CCYMicro Focus
$mSUSE
$mTotal
$m
Segment revenue 1,056.0 214.7 1,270.7
Directly managed costs (663.4) (123.9) (787.3)
Allocation of centrally managed costs 32.1 (32.1) -
Adjusted operating costs (631.3) (156.0) (787.3)
Adjusted operating profit 424.7 58.7 483.4
Depreciation of property, plant & equipment 11.4 2.0 13.4
Amortization of software intangibles 2.1 0.4 2.5
Adjusted EBITDA 438.2 61.1 499.3
Foreign exchange credit (11.7) (0.9) (12.6)
Net capitalization of development costs 0.1 - 0.1
Underling Adjusted EBITDA 426.6 60.2 486.8
Year ended 30 April 2016Micro Focus
$mSUSE
$mTotal
$m
Segment revenue 991.2 253.8 1,245.0
Directly managed costs (566.4) (145.1) (711.5)
Allocation of centrally managed costs 28.9 (28.9) -
Adjusted operating costs (537.5) (174.0) (711.5)
Adjusted operating profit 453.7 79.8 533.5
Depreciation of property, plant & equipment 9.7 1.7 11.4
Amortization of software intangibles 1.7 0.2 1.9
Adjusted EBITDA 465.1 81.7 546.8
Foreign exchange credit (2.6) (0.3) (2.9)
Net capitalization of development costs (11.4) - (11.4)
Underling Adjusted EBITDA 451.1 81.4 532.5

FY16 Micro Focus Portfolio Update
Stephen Murdoch
CEO

• Delivered financial commitments
• Restructured four TAG business units and original Micro Focus into two portfolios: SUSE & Micro Focus
• Delivered significant levels of synergies
• Moved from annual bookings focus to quarterly revenue cadence
• Simplified branding from six brands to Micro Focus and SUSE
• Rationalized property portfolio from 128 offices to 83 offices
• Created a comprehensive IT systems strategy for the Group
• Strengthened the team
• New HR director, new Director of Finance, new IT leaders in infrastructure and operations
• New Global Channels leader, new GTM operations leader, new leader for APJ overall and for ANZ
• Serena Acquisition
40
FY16: A Year of Significant Progress and Change

Micro Focus Pro-forma revenue at CCY
41
Year ended 30 April 2016
As Reported
Year ended 30 April 2015
Pro-forma CCY 1
Year ended 30 April 2016
Growth$m $m %
CDMSLicence 104.7 105.9 (1.1%)Maintenance 145.2 141.9 2.3%Consultancy 8.9 8.1 9.9%
258.8 255.9 1.1%Host ConnectivityLicence 89.9 94.6 (5.0%)Maintenance 105.4 105.8 (0.4%)Consultancy 2.9 4.0 (27.5%)
198.2 204.4 (3.0%)Identity, Access & SecurityLicence 52.4 43.1 21.6%Maintenance 142.2 147.0 (3.3%)Consultancy 22.1 27.6 (19.9%)
216.7 217.7 (0.5%)
Development & IT Operations Management Tools
Licence 33.9 41.8 (18.9%)Maintenance 121.3 136.7 (11.3%)Consultancy 2.2 2.8 (21.4%)
157.4 181.3 (13.2%)Collaboration & NetworkingLicence 23.9 34.9 (31.5%)Maintenance 130.4 154.9 (15.8%)Consultancy 5.8 6.9 (15.9%)
160.1 196.7 (18.6%)Micro Focus Product PortfolioLicence 304.8 320.3 (4.8%)Maintenance 644.5 686.3 (6.1%)Consultancy 41.9 49.4 (15.2%)
991.2 1,056.0 (6.1%)
1 Unaudited

Micro Focus - Profitability vs pro-forma CCY
42
Micro Focus Product Portfolio
Year ended
30 April 2016$m
Year ended 30 April 2015
Pro-forma CCY$m
Segment revenue 991.2 1,056.0
Directly managed costs (586.4) (663.4)
Allocation of centrally managed costs 28.9 32.1
Adjusted operating costs (537.5) (631.3)
Adjusted operating profit 453.7 424.7
Depreciation of property, plant & equipment 9.7 11.4
Amortization of software intangibles 1.7 2.1
Adjusted EBITDA 465.1 438.2
Foreign exchange credit (2.6) (11.7)
Net capitalization of development costs (11.4) 0.1
Underling Adjusted EBITDA 451.1 426.6
Underlying Adjusted EBITDA margin 45.5% 40.4%

Enablers: Clarity of direction & purpose underpinned by great people
LFR: EXECUTION: granular approach via 4 BOX model
MFR: STABILIZATION: improve trends through incremental improvements across the board
CFR: CONSISTENCY: underpin delivery of customer value
Efficiency & Enablement Identify & Close Integrate & Leverage
RemoveComplexity
Re-shape
Deliver FY17 Financial Plan
Balance fixing the short term with re-engineering for the long term
Simplify processes, improve underlying data quality, analytics and reporting
Organizational Model Systems & Application
Model
Simplified Platform for GrowthGo-to Market Acquisitions
FY17 Imperatives: Deliver in 17 and Build for 18+
43
39
• Consistent execution of strategy and four phase plan
• Delivery of our financial plan
• Standardizing systems and simplifying business operations
• Accelerating progress on improving the effectiveness of Go-to-Market
• Highly focused development and product management to optimize the
performance of each sub-portfolio
44
FY17 Priorities

FY16 SUSE Portfolio UpdateLondon, 14th July 2016
Nils Brauckmann
CEO

FY16 – A Successful Year For SUSE
The SUSE growth charter:
“Sustainable, Profitable Revenue Growth Above Market Rate”
All relevant KPIs showed growth
• Revenue of $253.8m with y/y growth of 18.2%
• Deferred revenue balance of $326.8m with y/y growth of 23.3%
• TCV of $301.3m with y/y growth of 14.3%
• ACV of $174.8m with y/y growth of 17.9%
Open source business with market leading profitability
• Underlying Adjusted EBITDA of $81.4m
• y/y increase of 35.2 %
• Profit margin of 32.1% with y/y improvement of 4.1%
4246
FY16 Progress and Expansion
• Expanded headcount across different business functions and
geographies
• Aligned the critical supporting organizations much more tightly with the
SUSE business
• Extended SUSE’s presence and contribution in key open source
projects and relevant industry groups
• Development of SUSE leadership team to support growth charter
4747

SUSE Regional Revenue Performance
48
North America and International had successful years with revenue growing at 24.3% and 17.5% respectively.
APJ, whilst showing a smaller increase of revenues, has a solid foundation to grow from. SUSE now operates
with a dedicated GTM sales organization in this region, and FY16 featured stronger TCV and ACV performance.
Regional Revenue Performance
Year ended
30 April 2016 Actual
$m
Year ended
30 April 2015 Pro-forma CCY 1
$m
Year ended
30 April 2015 Pro-forma
CCY (Decline)/Growth
%
SUSE
North America 108.6 87.4 24.3%
International 115.6 98.4 17.5%
Asia Pacific & Japan 29.6 28.9 2.4%
Total 253.8 214.7 18.2% 1 unaudited
48
SUSE Regional TCV and ACV Performance
• North America had a successful year with TCV growing at 32.9% and
ACV growing at 29.9%.
• APJ had a successful year with TCV growing at 26.7% and ACV
growing at 17.1%.
• International TCV results declined by 2.7% on a tough compare due to
very strong performance in the prior year and ACV grew at 6.4%.
4949
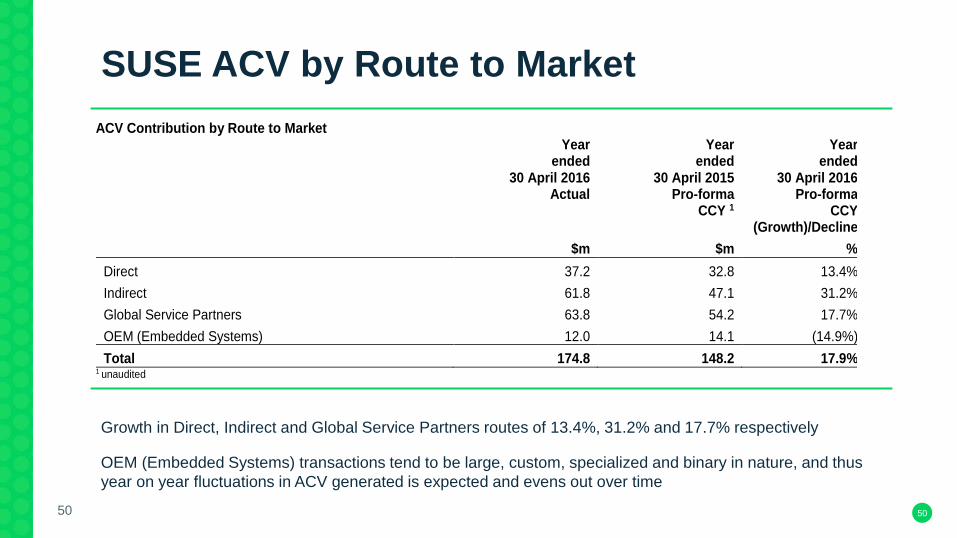
SUSE ACV by Route to Market
50
Growth in Direct, Indirect and Global Service Partners routes of 13.4%, 31.2% and 17.7% respectively
OEM (Embedded Systems) transactions tend to be large, custom, specialized and binary in nature, and thus
year on year fluctuations in ACV generated is expected and evens out over time
ACV Contribution by Route to Market
Year ended
30 April 2016 Actual
Year ended
30 April 2015 Pro-forma
CCY 1
Year ended
30 April 2016 Pro-forma
CCY (Growth)/Decline
$m $m %
Direct 37.2 32.8 13.4%
Indirect 61.8 47.1 31.2%
Global Service Partners 63.8 54.2 17.7%
OEM (Embedded Systems) 12.0 14.1 (14.9%)
Total 174.8 148.2 17.9% 1 unaudited
50

Alliance and GSP Relationship Progress
• Intel includes SUSE Linux Enterprise Server for High Performance
Computing as first commercial Linux in Intel’s HPC Orchestrator solution
• HPE and SUSE are delivering a Software Defined Storage Solution with
SUSE Enterprise Storage on HPE storage-optimized Apollo servers and
HPE general-purpose ProLiant servers
• SAP selected SUSE OpenStack Cloud as the IaaS for SAP HANA Cloud
Platform
• SUSE Linux Enterprise Server is the first commercial Linux to be
supported on IBM LinuxONE
5151

FY17 Outlook
“Sustainable, Profitable Revenue Growth Above Market Rate*”
• Growing deferred revenue balance, to be recognized in FY17, is a good
foundation for ongoing growth
• Continued investment in building out the organization to ensure improvements in
execution capacity across all major business functions and geographies
• Further investment in marketing program spend to drive demand generation and
build brand awareness for SUSE (SUSECon - Washington DC, 7-11 November
2016)
* 13-14% market growth in line with SUSE management view of industry analyst estimates 5252


Overview
• Results at the high end of management expectations
• Total Shareholder Return strategy continues
• Final Dividend increased by 50.7% to 49.74 cents (2015: 33.00 cents)
• Full Year Dividend increased by 37.8% to 66.68 cents (2015: 48.40 cents)
• Return of Value to shareholders in 2017
Outlook
• Consistent double digit shareholder returns
• Revenue in FY17 minus 2% to zero
• Compared to FY16 CCY pro-forma with Serena
• FY17 revenue exit rate flat with FY16 and anticipate revenue growth in FY18
• Maintain target net debt at 2.5 times to Facility EBITDA
• Appropriate value enhancing acquisitions
54
Micro Focus Overview and Outlook

Appendix

Consolidated Income Statement
56
Year ended 30 April 2016
$’000
Year ended 30 April 2015
$’000
Revenue 1,245,049 834,539
Cost of sales (135,432) (91,490)
Gross profit 1,109,617 743,049
Selling and distribution costs (416,333) (290,475)
Research and development expenses (259,388) (162,349)
Administrative expenses (138,962) (142,989)
Operating profit 294,934 147,236
Analyzed as:
Adjusted Operating profit 533,514 347,773
Share based compensation (28,793) (15,561)
Amortization of purchased intangibles (181,934) (88,298)
Exceptional items (27,853) (96,678)
Operating profit 294,934 147,236
Share of results of associates (2,190) (788)
Net finance costs (97,348) (55,021)
Profit before tax 195,396 91,427
Taxation (32,424) 10,024
Profit for the period 162,972 101,451
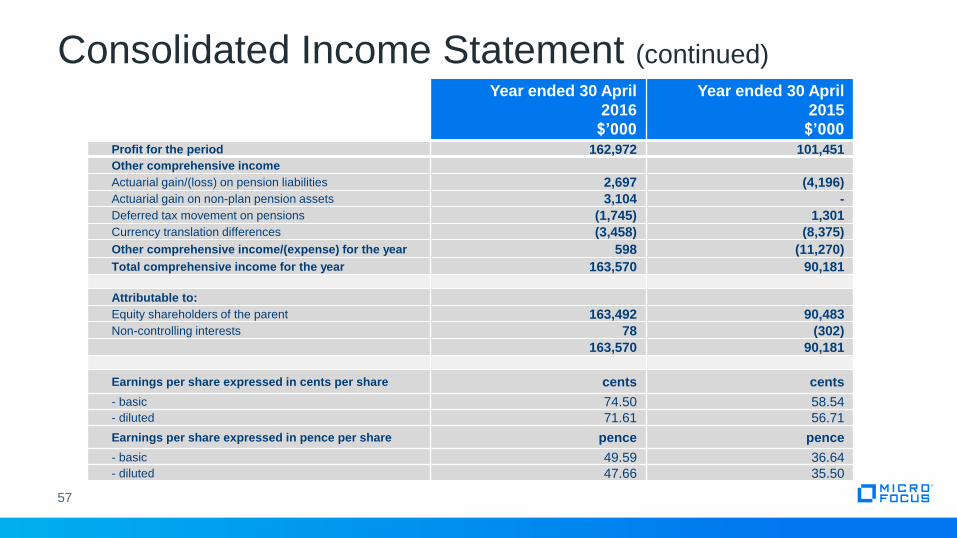
Consolidated Income Statement (continued)
57
Year ended 30 April
2016
$’000
Year ended 30 April
2015
$’000
Profit for the period 162,972 101,451
Other comprehensive income
Actuarial gain/(loss) on pension liabilities 2,697 (4,196)
Actuarial gain on non-plan pension assets 3,104 -
Deferred tax movement on pensions (1,745) 1,301
Currency translation differences (3,458) (8,375)
Other comprehensive income/(expense) for the year 598 (11,270)
Total comprehensive income for the year 163,570 90,181
Attributable to:
Equity shareholders of the parent 163,492 90,483
Non-controlling interests 78 (302)
163,570 90,181
Earnings per share expressed in cents per share cents cents
- basic 74.50 58.54- diluted 71.61 56.71
Earnings per share expressed in pence per share pence pence
- basic 49.59 36.64- diluted 47.66 35.50

Consolidated Balance StatementAs at 30 April 2016
$’000
As at 30 April 2015
$’000
ASSETS
Non-current assets
Goodwill 2,436,168 2,421,745
Other intangible assets 966,555 1,132,221
Property, plant and equipment 40,867 42,896
Investments in associates 12,711 14,901
Long-term pension assets 22,272 14,076
Other non-current assets 4,002 3,909
Deferred tax assets 198,757 249,886
3,681,332 3,879,634
Current assets
Inventories 93 110
Trade and other receivables 268,186 218,645
Current tax receivables 18,016 -
Cash and cash equivalents 667,178 241,324
Assets classified as held for sale 888 888
954,361 460,967
TOTAL ASSETS 4,635,693 4,340,601
LIABILITIES
Current liabilities
Trade and other payables 188,090 161,365
Borrowings 275,256 125,733
Provisions 10,545 49,334
Current tax liabilities 22,426 67,895
Current deferred income 565,480 583,703
1,061,797 988,030
Non-current liabilities
Non-current deferred income 196,483 194,863
Borrowings 1,469,953 1,519,130
Retirement benefit obligations 31,669 32,742
Long-term provisions 14,354 17,919
Other non-current liabilities 3,671 5,264
Deferred tax liabilities 264,038 304,592
1,980,168 2,074,510
TOTAL LIABILITIES 3,041,965 3,062,540
NET ASSETS 1,593,728 1,278,061
58

Balance Sheet (continued)
59
As at 30 April 2016
$’000
As at 30 April 2015
$’000
EQUITY
Ordinary shares 39,573 39,555
Share premium account 190,293 16,087
Merger reserve 988,104 1,168,104
Capital redemption reserve 163,363 163,363
Retained earnings (deficit) 228,344 (96,479)
Foreign currency translation reserve (deficit) (17,006) (13,548)
TOTAL EQUITY ATTRIBUTABLE TO OWNERS OF THE PARENT 1,592,671 1,277,082
Non-controlling interests 1,057 979
TOTAL EQUITY 1,593,728 1,278,061

As reported Year ended 30 April 2016 Year ended 30 April 2015
$'000 % of revenue $'000 % of revenue
Revenue 1,245,049 834,539
Cost of sales (135,432) 10.9% (91,490) 11.0%
Selling and distribution costs (416,333) 33.4% (290,475) 34.8%
Research and development expenses (259,388) 20.8% (162,349) 19.5%
Administrative expenses (138,962) 11.2% (142,989) 17.1%
Total costs (950,115) (687,303)
Operating profit 294,934 147,236
Group Income Statement: Key Ratios
60

EBITDA Reconciliation
61
Year ended
30 April 2016
$’000
Year ended
30 April 2015
$’000
Operating profit 294,934 147,236
Exceptional items 27,853 96,678
Share-based compensation charge 28,793 15,561
Amortization of purchased intangibles 181,934 88,298
Adjusted operating profit 533,514 347,773
Depreciation 11,419 7,674
Amortization of software 1,864 2,189
Adjusted EBITDA 546,797 357,636
EBITDA 509,666 264,986
Amortization of capitalized development costs (19,515) (19,589)
Exceptional items 27,853 96,678
Share-based compensation charges 28,793 15,561
Adjusted EBITDA 546,797 357,636
Adjusted EBITDA less Exceptional items 518,944 260,958
Cash generated from continuing operations 455,730 288,741
Cash conversion ratio = Cash generated from continuing operations
Adjusted EBITDA less Exceptional items87.8% 110.6%

Cash Generated from Operations
62
Year ended 30 April 2016
$’000
Year ended 30 April 2015
$’000
Cash flows from operating activities
Profit after tax 162,972 101,451
Adjustments for:
Net interest 97,348 55,021
Taxation 32,424 (10,024)
Share of results of associates 2,190 788
Operating profit 294,934 147,236
Research and development tax credits (2,041) (2,135)
Depreciation 11,419 7,674
Loss on disposal of property, plant and equipment 109 41
Gain on disposal of intangible assets - (1,603)
Amortization of intangibles 203,313 109,092
Impairment of intangibles - 984
Impairment of long-term assets - 11,642
Share-based compensation 28,793 15,561
Exchange movements (2,915) (87)
Provisions (43,031) 46,485
Changes in working capital:
Inventories 28 39
Trade and other receivables (49,175) 40,127
Payables and other liabilities 30,917 (108,558)
Deferred income (16,603) 21,657
Pension funding in excess of charge to operating profit (18) 586
Cash generated from operations 455,730 288,741
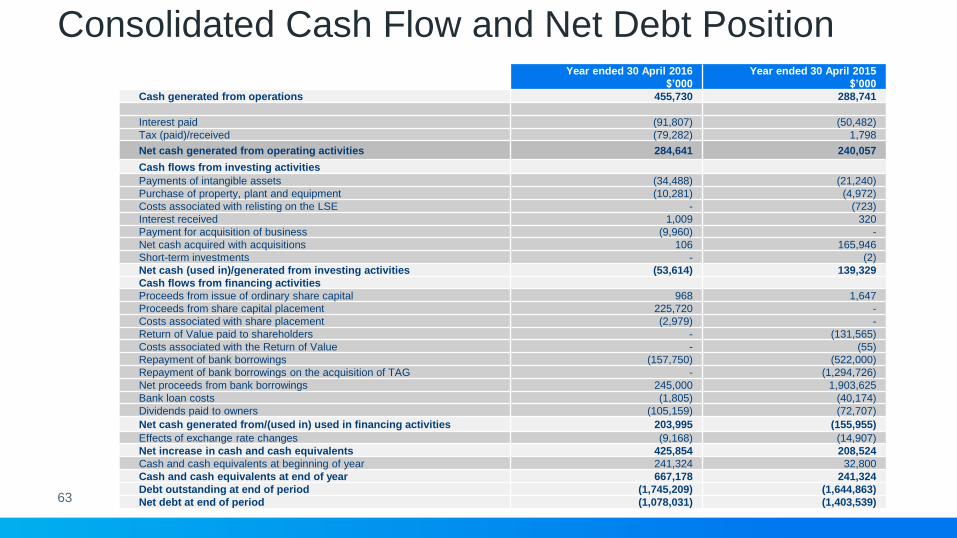
Consolidated Cash Flow and Net Debt Position
63
Year ended 30 April 2016
$’000
Year ended 30 April 2015
$’000
Cash generated from operations 455,730 288,741
Interest paid (91,807) (50,482)
Tax (paid)/received (79,282) 1,798
Net cash generated from operating activities 284,641 240,057
Cash flows from investing activities
Payments of intangible assets (34,488) (21,240)
Purchase of property, plant and equipment (10,281) (4,972)
Costs associated with relisting on the LSE - (723)
Interest received 1,009 320
Payment for acquisition of business (9,960) -
Net cash acquired with acquisitions 106 165,946
Short-term investments - (2)
Net cash (used in)/generated from investing activities (53,614) 139,329
Cash flows from financing activities
Proceeds from issue of ordinary share capital 968 1,647
Proceeds from share capital placement 225,720 -
Costs associated with share placement (2,979) -
Return of Value paid to shareholders - (131,565)
Costs associated with the Return of Value - (55)
Repayment of bank borrowings (157,750) (522,000)
Repayment of bank borrowings on the acquisition of TAG - (1,294,726)
Net proceeds from bank borrowings 245,000 1,903,625
Bank loan costs (1,805) (40,174)
Dividends paid to owners (105,159) (72,707)
Net cash generated from/(used in) used in financing activities 203,995 (155,955)
Effects of exchange rate changes (9,168) (14,907)
Net increase in cash and cash equivalents 425,854 208,524
Cash and cash equivalents at beginning of year 241,324 32,800
Cash and cash equivalents at end of year 667,178 241,324
Debt outstanding at end of period (1,745,209) (1,644,863)
Net debt at end of period (1,078,031) (1,403,539)

Pro-forma Revenues by Geography at Constant Currency
64
Geographic Analysis Revenue
(at constant currency) Year ended 30 April 2016 Year ended 30 April 2015 (Pro-forma) 1
$m % $m %
CDMS
North America 116.2 44.9% 110.6 43.2%
International 108.9 42.1% 114.4 44.7%
Asia Pacific 33.7 13.0% 30.9 12.1%
Total 258.8 100.0% 255.9 100.0%
Host Connectivity
North America 141.0 71.1% 131.8 64.5%
International 48.9 24.7% 59.6 29.2%
Asia Pacific 8.3 4.2% 13.0 6.3%
Total 198.2 100.0% 204.4 100.0%
IAS
North America 108.7 50.2% 115.2 52.9%
International 90.8 41.9% 82.4 37.9%
Asia Pacific 17.2 7.9% 20.1 9.2%
Total 216.7 100.0% 217.7 100.0%
Development & ITOM
North America 79.7 50.6% 100.4 55.4%
International 61.1 38.8% 63.2 34.9%
Asia Pacific 16.6 10.6% 17.7 9.7%
Total 157.4 100.0% 181.3 100.0%
Collaboration & Network
North America 79.6 49.7% 103.4 52.6%
International 67.3 42.0% 75.5 38.4%
Asia Pacific 13.2 8.3% 17.8 9.0%
Total 160.1 100.0% 196.7 100.0%
Micro Focus
North America 525.2 53.0% 561.4 53.2%
International 377.0 38.0% 395.1 37.4%
Asia Pacific 89.0 9.0% 99.5 9.4%
Total 991.2 100.0% 1,056.0 100.0%
SUSE
North America 108.6 42.8% 87.4 40.7%
International 115.6 45.5% 98.4 45.8%
Asia Pacific 29.6 11.7% 28.9 13.5%
Total 253.8 100.0% 214.7 100.0%
TOTAL
North America 633.8 50.9% 648.8 51.1%
International 492.6 39.6% 493.5 38.8%
Asia Pacific 118.6 9.5% 128.4 10.1%
TOTAL 1,245.0 100.0% 1,270.7 100.0%
1 Unaudited
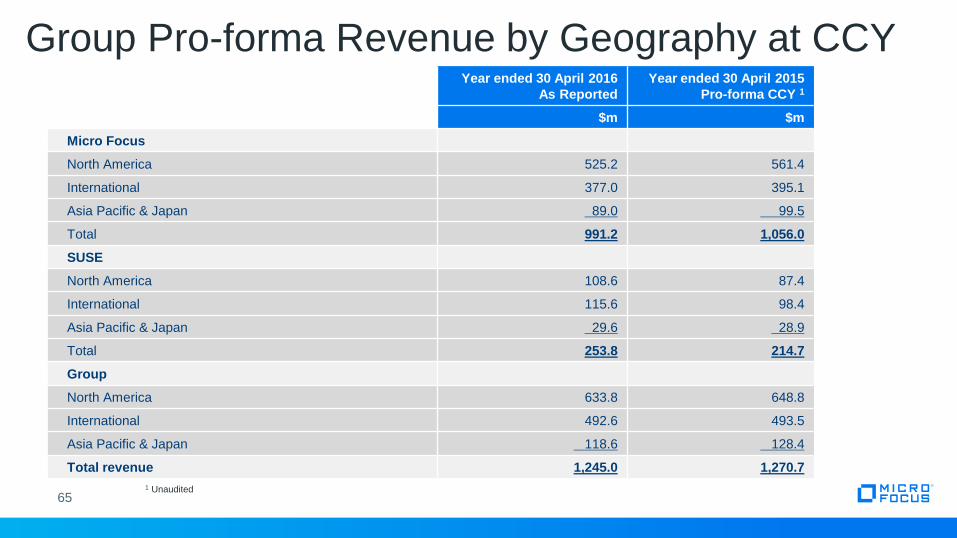
Group Pro-forma Revenue by Geography at CCY
65
Year ended 30 April 2016
As Reported
Year ended 30 April 2015
Pro-forma CCY 1
$m $m
Micro Focus
North America 525.2 561.4
International 377.0 395.1
Asia Pacific & Japan 89.0 99.5
Total 991.2 1,056.0
SUSE
North America 108.6 87.4
International 115.6 98.4
Asia Pacific & Japan 29.6 28.9
Total 253.8 214.7
Group
North America 633.8 648.8
International 492.6 493.5
Asia Pacific & Japan 118.6 128.4
Total revenue 1,245.0 1,270.7
1 Unaudited

North America International(EMEA, LATAM)
APJ
Corporate Operations
Finance IT HR
Product Development
Legal Business Operations & PMO
Field Marketing
Product Management
Go To Market
Product
Development
NA, EMEA & APJ(LATAM from MF
shared team)
Product Management
Field Marketing
Services, Customer Care, Renewals,
Shared Marketing Services, Sales Operations
Channel, Systems
Integrators & OEM Channel, Systems Integrators & Independent Software Vendors
Product Group
Overall Organizational Model: One company with two product portfolios balancing focus with leverage of scale
66
Go To Market
Product Group

SUSE ACV Share by Route to MarketFY16 vs. FY15
67
In aggregate the ACV mix by route to market remained stable in FY16 compared to FY15 as we saw homogenous
contribution to SUSE’s growth from the various routes to market.
67