Preliminary Investigation on Battery Sizing Investigation ...

Preliminary Investigation of the Corrosion Behaviorof Proprietary Micro-alloyed Steels in Aerated
and Deaerated Brine SolutionsLawrence Onyeji and Girish Kale
(Submitted June 28, 2017; in revised form September 7, 2017; published online October 27, 2017)
The corrosion performance of fairly new generation of micro-alloyed steels was compared in differentconcentrations of aerated and deaerated brines. Electrochemical polarization, weight loss and surfaceanalyses techniques were employed. The results showed a threshold of corrosion rate at 3.5 wt.% NaCl inboth aerated and deaerated solutions. The average corrosion current density for steel B, for example,increased from 1.3 lA cm22 in 1 wt.% NaCl to 1.5 lA cm22 in 3.5 wt.% NaCl, but decreased to1.4 lA cm22 in 10 wt.% deaerated NaCl solutions. The aerated solutions exhibited an average of over 80%increase in corrosion current density in the respective concentrations when compared with the deaeratedsolution. These results can be attributed to the effects of dissolved oxygen (DO) which has a maximumsolubility in 3.5 wt.% NaCl. DO as a depolarizer and electron acceptor in cathodic reactions acceleratesanodic metal dissolution. The difference in carbon content and microstructures occasioned by thermo-mechanical treatment contributed to the witnessed variation in corrosion performance of the steels.Specifically, the results of the various corrosion techniques corroborated each other and showed that thecorrosion rate of the micro-alloyed steels can be ranked as CRSteel A<CRX65<CRSteel B<CRSteel C.
Keywords aerated solutions, brine, corrosion behavior, deaeratedsolution, electrochemical techniques, micro-alloysteels
1. Introduction
Corrosion attack of oil and gas facilities is one of thegreatest challenges to the operators in the industry. Therefore,assessing the impact of corrosion is of immediate concerns. Theeffects of corrosion if not controlled can affect production,cause economic loss and create ecological problems with theattendant security risks to life and properties (Ref 1, 2). Crudeoil and its products are mixtures of hydrocarbon which bythemselves are not corrosive. However, they become corrosivein the presence of impurities and other components such aswater, chloride salts, carbon dioxide (CO2), hydrogen sulfide(H2S), elemental sulfur, dissolved oxygen, organic acids andsulfate-reducing bacteria (SRB) (Ref 1, 3-5). Tremendousefforts have been made to mitigate and control the effects ofcorrosion. Some of these efforts have led to the development ofvarious corrosion control techniques such as the use ofcomposite materials (Ref 6, 7); various corrosion resistancesteels (CRS) (Ref 8, 9), inhibitors (Ref 10), electrochemicalprotection (Ref 11, 12) and coating techniques (Ref 13-17).These techniques are either too expensive for effectivedeployment or too difficult to sustain and therefore have notadequately solved the problem of corrosion in the oil and gasindustries. Choi et al. (Ref 18, 19) have proposed the
development of new materials with high corrosion resistanceat low cost as the most effective option to tackle the menace ofcorrosion in oil and gas industry.
Dissolved oxygen (DO) is one of the major corrosionenhancing components in crude oil. Liu et al. (Ref 1), Ismailand Adan (Ref 20) and Jung et al. (Ref 21) reported that thecorrosion effect of dissolved oxygen is more prevalent than allother impurities present in crude oil. Liu et al. (Ref 1) studiedthe effects of chlorides, temperature, pH, carbon dioxide (CO2)and dissolved oxygen (DO) on the corrosion-induced leakageof the inner wall of crude oil pipeline. These studies showedthat the effect of DO on the corrosion rate of the pipeline wasdominant when compared with CO2 corrosion. Ismail and Adan(Ref 20) investigated the corrosion behavior of AISI 1040 steelin NaCl with different sulfate and chloride contents in thepresence and absence of oxygen. The results revealed that thecorrosion rate was higher in solutions containing oxygen thanin all other deoxygenated solutions. Jung et al. (Ref 21) after anextensive laboratory experiments observed that the corrosionrates for galvanized steel pipe (GSP), carbon steel pipe (CSP)and ductile cast-iron pipe (DCIP) decreased to 72, 75 and 91%,respectively, when DO concentration was reduced from 9± 0.5to 2± 0.5 mg/L. These results are in agreement with the reportsof Islam and Farhat (Ref 22), Chilingar et al. (Ref 23) andPopoola et al. (Ref 24) that DO is a depolarizer and electronacceptor in cathodic reaction and therefore accelerates theanodic dissolution of metals. Also confirming this statement,Yari (Ref 2) reported that in a basic or neutral solution, oxygenreduction reaction in Eq 1 is the predominant cathodic reactionin competition with hydrogen evolution reaction of Eq 2.
Neutral=basic solutions: O2 gð Þ þ 2H2O lð Þ þ 4e� ! 4OH�aqð Þ
ðEq 1ÞLawrence Onyeji and Girish Kale, School of Chemical and ProcessEngineering, University of Leeds, Leeds LS2 9JT, UK. Contacte-mails: [email protected] and [email protected].
JMEPEG (2017) 26:5741–5752 �The Author(s). This article is an open access publicationhttps://doi.org/10.1007/s11665-017-3031-x 1059-9495/$19.00
Journal of Materials Engineering and Performance Volume 26(12) December 2017—5741

In hydrogen revolution : 2Hþaqð Þ þ 2e� ! H2 gð Þ ðEq 2Þ
The effect of DO on the corrosion of oil and gas facilities issignificantly influenced by the presence of other components ofcrude oil streams such as chloride salts. According to research-ers (Ref 2, 25-28), the concentration of chloride can influencethe solubility of oxygen in produced water. Yari (Ref 2) specifi-cally reported that the maximum oxygen concentration in sea-water is obtained in 3.5 wt.% NaCl solution. This worktherefore is aimed at investigating the electrochemical behaviorof three fairly new class of micro-alloyed steels, whose corro-sion behavior has not been fully investigated, in different con-centrations of aerated and deaerated brine solutions.
2. Experimentals
2.1 Materials and Material Preparations
Three micro-alloyed steels designated as Steel A, Steel Band Steel C with chemical compositions listed in Table 1 wereused in this work. These steels which are meant for productionof pipes are fairly new in the family of micro-alloyed steels, andtheir corrosion propensity has not been satisfactorily under-stood. A fourth material, API 5L X65 whose corrosionperformance in different media has been investigated andadjudged as the most widely used pipeline material, was usedas reference specimen (Ref 29-31). The specimens were wetgrinded using MetaServ 250 Grinder-Polisher. Silicon carbidepapers of different fineness up to P1200 grit were used. Eachsteel specimen after grinding was rinsed with distilled water,degreased with acetone, dried with compressed air and kept in adesiccator briefly until corrosion setup was ready. The speci-mens for OM and SEM/EDX analyses were further polishedusing 5, 3, and 1 lm abrasive diamond slurry, degreased withacetone, rinsed with distilled water and dried with compressedair. The final polished surfaces were etched with 2% nital andanalyzed using Zeiss AxioCam MRc 5 Optical Microscopy(OM) and Carl Zeiss EVO MA15 Scanning Electron Micro-scopy/Energy-Dispersed X-ray (SEM/EDAX).
2.2 Experimental Setups and Conditions
The experimental setup and conditions are summarized inTable 2. To ensure reproducibility, each of the four steels waspolarized in triplicate using the parameters in Table 2. Theanodic and cathodic branches of Tafel plots were conductedseparately starting with the cathodic scan, followed by 15-minopen-circuit potential before the anodic sweep. This was to avoidsurface alteration and electrolyte contamination as a result of irondissolution during anodic sweep (Ref 32, 33). The guidelines inASTM G102-89 (Ref 34) and Tait (Ref 35) were used to mergethe branches. Tafel extrapolation technique was employed to
extract Tafel corrosion parameters such as corrosion currentdensity (iCorr), corrosion potentials (ECorr) and anodic (bA) andcathodic (bC) constants. The corrosion rate of the steels wascalculated by inserting the values of corrosion current density(iCorr) obtained from Tafel extrapolation techniques in Eq 3
CR ¼ 3:27� 10�3 � iCorr � E:W :
q; ðEq 3Þ
where CR = corrosion rate (mm year�1), iCorr = corrosioncurrent density (lA cm�2), E.W. = equivalent weight (g) andq = density of the sample (g cm�3).
At the end of the polarization, the specimens were carefullyremoved from the cell, rinsed with deionized water and driedwith nitrogen gas. Carl Zeiss EVO MA15 Scanning ElectronMicroscopy/Energy-Dispersed X-ray (SEM/EDAX) was usedto characterize the corroded surfaces so as to identify theirmorphology and elemental composition.
2.3 Weight Loss
The corrosion rates of the steels were also assessed byweight loss technique. The steels were wet grinded up to P1200grit with silicon carbide paper, washed with distilled water,ultrasonically cleaned in acetone for 4 min and dried in warmair. This was followed by careful measurements of the surfacedimensions with which the surface area of the specimens werecomputed. The specimens were weighed using Adam PW124analytical precision weighing balance, and the weight recordedas W1. Each of the three specimens were prepared. Thespecimens were then hung inside a beaker containing 3.5 wt.%NaCl at ambient temperature. One of the specimens wasremoved from the beaker after 24, 48 and 72 h, respectively.The corrosion products on the specimens were chemicallycleaned in specific solution (500 mL of HCl + 500 mL ofdeionized water + 5 g of hexamethylenetetramine) with vigor-ous stirring for 10 min, rinsed with deionized water, dried inwarm air and reweighed (W2). The weight loss of the samplesdue to immersion for the respective time was then calculated as(W1�W2), and the corrosion rate computed using Eq 4,
CR ¼ 8:76� 104 � W1 �W2ð ÞqAt
; ðEq 4Þ
where CR = corrosion rate (mm/year), q = density (g/cm3),A = surface are of the sample (cm2) and t = immersion time(hours).
3. Results and Discussion
3.1 Microstructural Characteristics of the Samples
The optical and SEM micrographs of the as-received steelsare shown in Fig. 1 and 2, respectively. These figures show that
Table 1 Elemental specifications of the steels (%)
Steels C Si Mn P S Cr V Ti Nb Mo Cu Fe
A 0.12 0.18 1.27 0.008 0.002 0.11 0.057 0.001 0.054 0.17 0.12 BalanceB 0.22 0.032 1.4 0.012 0.001 0.25 0.005 0.023 0.002 0.07 0.03 BalanceB 0.25 0.26 0.54 0.01 0.001 0.99 0.005 0.008 0.022 0.46 0.098 BalanceX65 0.12 0.18 1.27 0.008 0.002 0.11 0.057 0.001 0.054 0.17 0.12 Balance
5742—Volume 26(12) December 2017 Journal of Materials Engineering and Performance
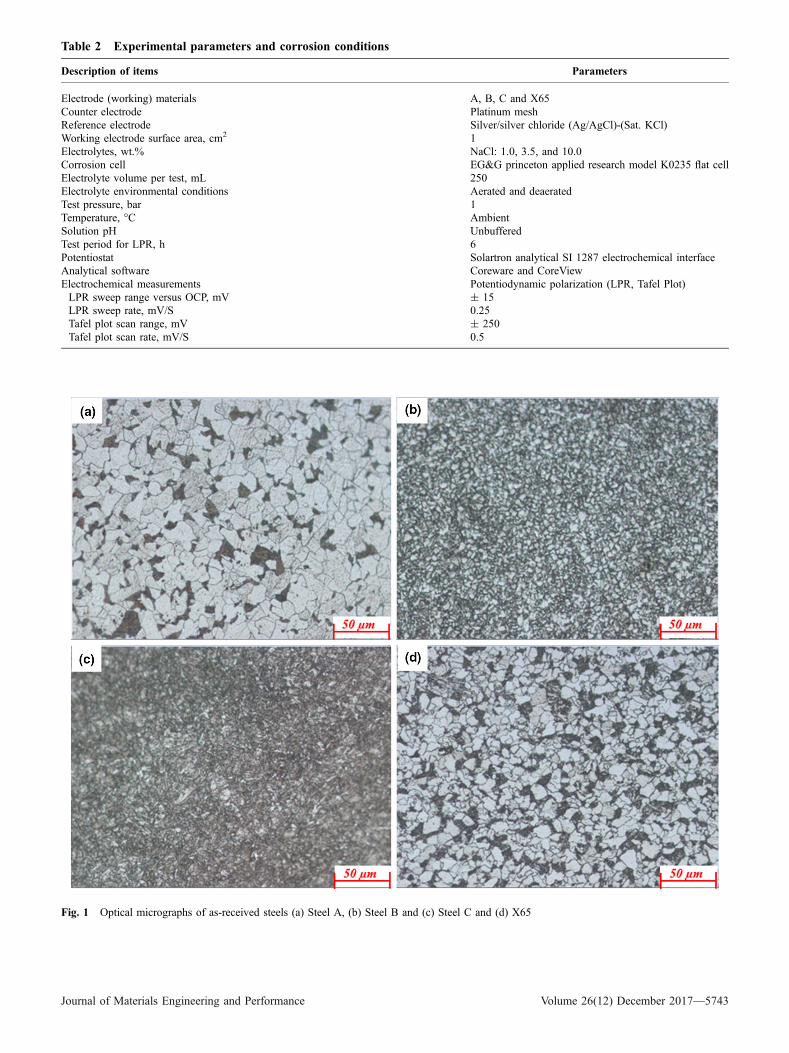
Table 2 Experimental parameters and corrosion conditions
Description of items Parameters
Electrode (working) materials A, B, C and X65Counter electrode Platinum meshReference electrode Silver/silver chloride (Ag/AgCl)-(Sat. KCl)Working electrode surface area, cm2 1Electrolytes, wt.% NaCl: 1.0, 3.5, and 10.0Corrosion cell EG&G princeton applied research model K0235 flat cellElectrolyte volume per test, mL 250Electrolyte environmental conditions Aerated and deaeratedTest pressure, bar 1Temperature, �C AmbientSolution pH UnbufferedTest period for LPR, h 6Potentiostat Solartron analytical SI 1287 electrochemical interfaceAnalytical software Coreware and CoreViewElectrochemical measurements Potentiodynamic polarization (LPR, Tafel Plot)LPR sweep range versus OCP, mV ± 15LPR sweep rate, mV/S 0.25Tafel plot scan range, mV ± 250Tafel plot scan rate, mV/S 0.5
Fig. 1 Optical micrographs of as-received steels (a) Steel A, (b) Steel B and (c) Steel C and (d) X65
Journal of Materials Engineering and Performance Volume 26(12) December 2017—5743

Steels A, B and X65 consist of light and dark zones which inthe optical micrographs are ferrite and pearlite phases, respec-tively. In SEM micrographs, these zones are colonies of pearlitewithin the ferrite matrix. The lamellae structures of the pearlitephase are clearly visible in Fig. 2(a). Another distinctive featureof the micrographs of these three specimens is their grain(phase) sizes which within each sample are the same anduniformly distributed. However, the grain sizes of the steelsdiffer from each other.
The difference in the grain size of these specimens is mademore evident by Fiji-ImageJ analysis and ASTM grain sizenumber computed according to ASTM E112-12 standard (Ref36). These are shown in Table 3. The small grain size numbersof the steels can be attributed to the presence of alloyingelements such as Nb, Ti and V which researchers (Ref 29, 37,38) have observed are good grain refiners. The ferrite–pearliteratio of Steels A, B and X65 can be ranked as SteelB<X65<Steel A as indicated in Table 3. This differencein microstructures and grain size is linked to the chemicalcomposition of the steels (Ref 39, 40) and the thermo-mechanical processes involved in their production (Ref 10,40, 41).
Steel A and X65 as indicated in Table 1 have the samechemical composition, but Fig. 1 and 2 showed that they havedifferent microstructures. Similar cases have been reported inthe literatures (Ref 40, 42, 43) where different microstructures
were obtained from carbon steel with the same chemicalcomposition and vice versa depending on heat treatment route.These authors have reported that the precipitation, volumetricfraction, uniformity and distribution of pearlite in carbon steelscan be attributed to carbon content and thermo-mechanicalprocesses (heat treatment routes). Ochoa et al. (Ref 40)obtained different microstructures of API 5L X42 using threedifferent heat treatment routes with each of the microstructuresexhibiting variant corrosion behavior in CO2- saturated 0.5 MNaCl solution. Asiful (Ref 43) through repeated quenching alsoimpacted different microstructures on E34 micro-alloyed steelwhich showed different corrosion rates in 3.5 wt.% NaClsolution. Thus, although Steel A and X65 have the samechemical composition (Table 1), their different microstructuralbehaviors (Fig. 2) could be linked to heat treatment processesused.
The optical and SEM micrographs of Steel C shown inFig. 1(c) and 2(c), respectively, revealed bainitic structure withevenly distributed acicular ferrites (Ref 29). Literaturesrevealed that bainitic structures are formed when the decom-position of austenite to ferrite and pearlites is restrained by thepresence of micro-alloying elements (Ref 29, 37, 41, 44, 45).Kermani and Morshed (Ref 46) and Kermani et al. (Ref 38)identified Cr and Mo as alloying elements that retard decom-position of martensite or austenite to ferrites and carbides. SteelC as shown in Table 1 contains more Cr (0.99 wt.%) and Mo
Fig. 2 SEM micrographs of as-received samples (a) Steel A, (b) Steel B and (c) Steel C and (d) X65
5744—Volume 26(12) December 2017 Journal of Materials Engineering and Performance
(0.46 wt.%) than the other steels. This could have necessitatedits bainitic structure.
3.2 Electrochemical Tests
Linear polarization resistance (LPR) and Tafel extrapolationtechniques were used to assess the corrosion behavior of thesteels in both aerated and deaerated aqueous solutions of NaClat ambient temperature. LPR was conducted for 6 h, while thepotentiodynamic polarization was performed after 6 h LPR.This is because LPR technique generally uses only minorperturbation around OCP (� 15 mV in this caseÞ and so doesnot significantly affect the surface of specimen. That is why it isused for assessing long time corrosion propensity of metals(Ref 47). Also, the alternating potential measurement helps tostabilize the OCP after each LPR scan. The solutions werestirred throughout the period of the tests. This was to ensurethat the surface concentration of the species was approximatelyequal to the bulk concentration and thus minimizes the effect ofdiffusion polarization (Ref 47-50). Three different concentra-tions of NaCl namely 1.0, 3.5 and 10.0 wt.% were used. ForLPR measurements, the specimens were polarized within therange of± 15 mV versus OCP and at a scan rate of0.25 mV s�1 for 6 h. For the potentiodynamic polarization,the Tafel cathodic and anodic branches were scanned sepa-rately. However, the effective scan range for the two sweepswas± 250 mV versus OCP and at a scan rate of 0.5 mV/s. Theohmic drop of the experimental setup was calculated to ensureit is too minute and so was neglected. This was achieved usingEq 5 as reported by Oelssner et al. (Ref 49)
RU ¼ Z
2KA; ðEq 5Þ
where Z = the gap between the working electrode and the ref-erence electrode (mm), K = the electrical conductivity of3.5 wt.% NaCl solution (mS/cm) (Ref 51) and A = the areaof the working electrode (mm2).
The estimated ohmic drop was about 0.1 lX. This is verynegligible and hence was neglected in all the tests.
3.2.1 Linear Polarization Resistance Techniques. Fig-ure 3 shows the plots of average LPR corrosion rate againsttime for the four specimens in three different concentrations(1.0, 3.5 and 10.0 wt.%) of aerated and deaerated NaClsolutions at ambient temperature and for 6 h. It can be observedfrom Fig. 3(a-c) that the plots of corrosion rate versus time forall the four specimens in aerated media increased with time, butfor steels in Fig. 3(c). This increase in corrosion rate accordingto Davis (Ref 52) and Taits (Ref 35) can be ascribed to theporosity of the air-formed oxide film on the surface of thespecimens which could not protect the steels from corrosion.On the other hand, Fig. 3(d-f) showed decreasing corrosion ratewith time for all the steels in the deaerated media. This signifiedthat the dissolution of the air-formed oxide film on the surface
of the specimens hindered increase in corrosion rate (Ref 35,52). A closer observation of Fig. 3(d-f) shows that thecorrosion rate of the steels in the deaerated solutions has begunto stabilize within the 6-h test. Vera et al. (Ref 29) and ElDesouky and Aboeldahab (Ref 53) also attributed the decreasein corrosion rate to the formation of corrosion products on thesurface of the specimens.
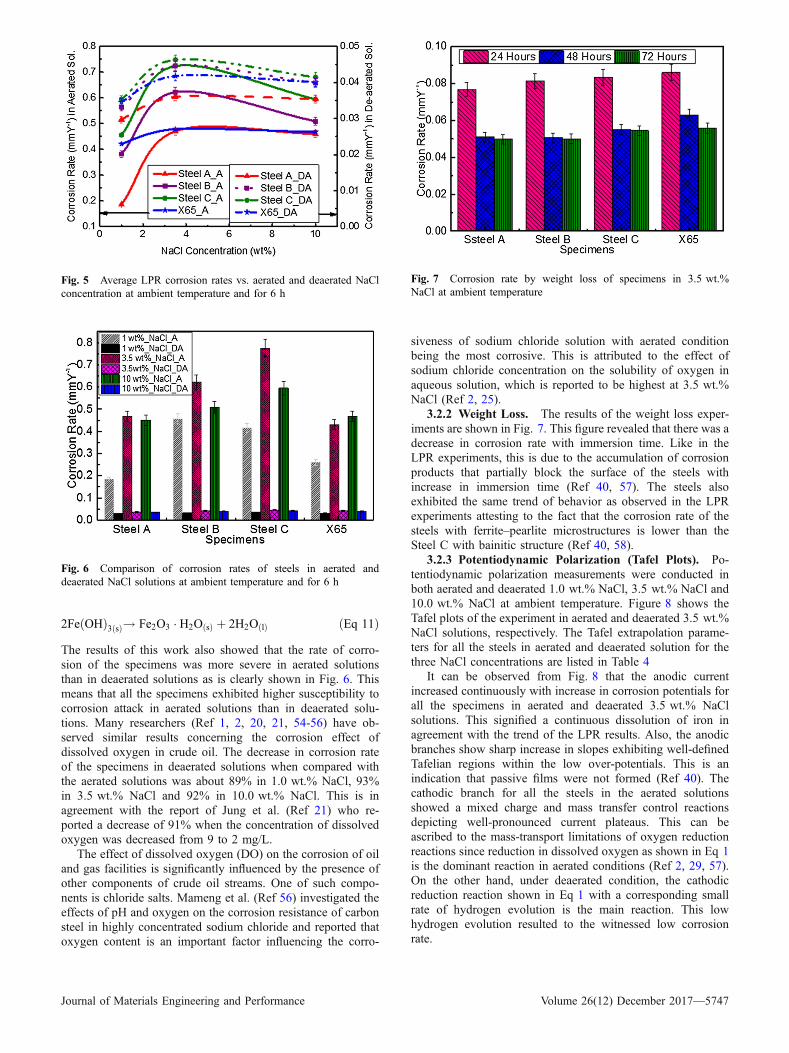
The plots of the average corrosion rate for the respectivesteels in 1.0, 3.5 and 10.0 wt.% NaCl solutions at ambienttemperature and for 6 h are compared in Fig. 4(a) aerated and4(b) deaerated. These figures show that the corrosion attack forall the four specimens was more severe in 3.5 wt.% NaClsolution for both aerated and deaerated solutions than in theother two concentrations (1.0 and 10.0 wt.%). This is inagreement with the reports of Yari (Ref 2) and Fang et al. (Ref25). Dissolved oxygen (DO) as an electron acceptor (Ref 21-24) in redox reactions and a depolarizer (Ref 23) accelerates thedissolution of metals in chloride environment. The witnesseddecrease in corrosion rate with increase in NaCl concentration,according to Eliyan et al. (Ref 27), can also be attributed to thedecrease in the solubility of oxygen with increase in NaClconcentration. Fang et al. (Ref 25) also reported that theadsorption of chloride on the surface of the steels contributed tothe reduction in corrosion rate with increase in salt concentra-tion.
The reports of these authors elucidate the decrease incorrosion rate in 10 wt.% NaCl solution as shown in Fig. 4.However, the effect of oxygen content on the corrosion of steelin aqueous solution of NaCl has not been clearly understood assome authors presented divergence results. For instance, ElDesouky and Aboeldahab (Ref 53) studied the effect ofdifferent concentration of NaCl (0.1–2 M) on maraging steeland reported a continuous increase in corrosion rate withincrease in NaCl concentration. In agreement with El Desoukyand Aboeldahab (Ref 53), Liu et al. (Ref 1) categorized theeffect of chloride ion on corrosion of carbon steels as smoothinvariant stage, slow rise stage and the rapid rise stage.
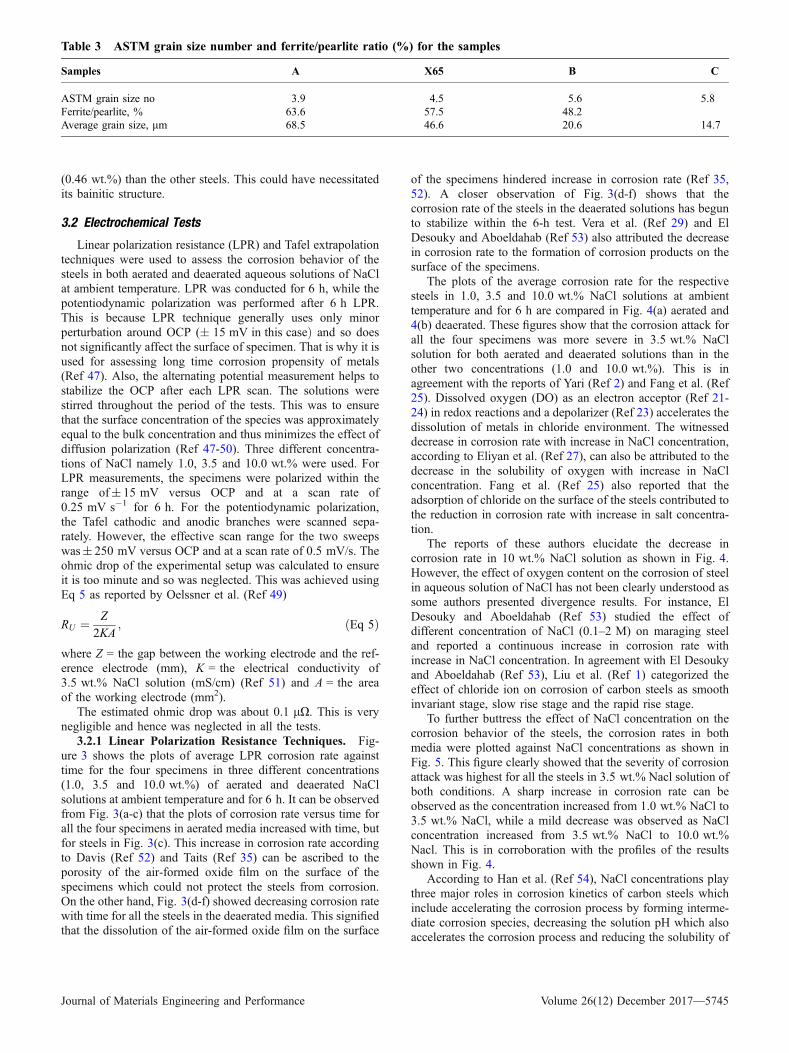
To further buttress the effect of NaCl concentration on thecorrosion behavior of the steels, the corrosion rates in bothmedia were plotted against NaCl concentrations as shown inFig. 5. This figure clearly showed that the severity of corrosionattack was highest for all the steels in 3.5 wt.% Nacl solution ofboth conditions. A sharp increase in corrosion rate can beobserved as the concentration increased from 1.0 wt.% NaCl to3.5 wt.% NaCl, while a mild decrease was observed as NaClconcentration increased from 3.5 wt.% NaCl to 10.0 wt.%Nacl. This is in corroboration with the profiles of the resultsshown in Fig. 4.
According to Han et al. (Ref 54), NaCl concentrations playthree major roles in corrosion kinetics of carbon steels whichinclude accelerating the corrosion process by forming interme-diate corrosion species, decreasing the solution pH which alsoaccelerates the corrosion process and reducing the solubility of
Table 3 ASTM grain size number and ferrite/pearlite ratio (%) for the samples
Samples A X65 B C
ASTM grain size no 3.9 4.5 5.6 5.8Ferrite/pearlite, % 63.6 57.5 48.2Average grain size, lm 68.5 46.6 20.6 14.7
Journal of Materials Engineering and Performance Volume 26(12) December 2017—5745

the dissolved oxygen with the attendant decrease in corrosionrate. The net effect of increase in NaCl concentration is thereduction in corrosion rate. This means that the effect ofreduction in DO solubility (salting out) dominates the other twocompeting effects. This was also reported by Yari (Ref 2) that ina basic or neutral solution, oxygen reduction reaction is thepredominant cathodic reaction in competition with the hydro-gen evolution reaction. Caceres et al. (Ref 55) also reported thatthe major reaction governing corrosion in most practical oilfieldapplication is the reduction reaction of oxygen present insolution. Vera et al. (Ref 29) summarized the electrochemicaland chemical reactions that occur during metal dissolution inaqueous solutions as shown in Eq 6-11.
Anodic reaction: Fe sð Þ ! Fe2þaqð Þ þ 2e� ðEq 6Þ
Cathodic reaction: O2 gð Þ þ 2H2O lð Þ þ 4e� ! 4OH�aqð Þ ðEq 7Þ
Total reaction: 2Fe sð Þ þ O2 gð Þ þ 2H2O lð Þ ! 2Fe2þaqð Þ þ 4OH�aqð Þ
ðEq 8Þ
Fe2þaqð Þ þ 2OH�aqð Þ ! Fe OHð Þ2 sð Þ ðEq 9Þ
4Fe OHð Þ3 sð Þ þO2 gð Þ þ 2H2O lð Þ ! 4Fe OHð Þ3 sð Þ ðEq 10Þ
Fig. 3 Average LPR corrosion rates of the steels in aerated and deaerated brine solutions at ambient temperature and for 6 h: (a) 1.0 wt.% aer-ated, (b) 3.5 wt.% aerated, (c) 10.0 wt.% aerated, (d) 1 wt.% deaerated, (e) 3.5 wt.% deaerated, (f) 10 wt.% deaerated
Fig. 4 Average LPR corrosion rates of steels in different concentration NaCl solutions: (a) deaerated and (b) aerated at ambient temperatureand for 6 h
5746—Volume 26(12) December 2017 Journal of Materials Engineering and Performance
2Fe OHð Þ3 sð Þ! Fe2O3 � H2O sð Þ þ 2H2O lð Þ ðEq 11Þ
The results of this work also showed that the rate of corro-sion of the specimens was more severe in aerated solutionsthan in deaerated solutions as is clearly shown in Fig. 6. Thismeans that all the specimens exhibited higher susceptibility tocorrosion attack in aerated solutions than in deaerated solu-tions. Many researchers (Ref 1, 2, 20, 21, 54-56) have ob-served similar results concerning the corrosion effect ofdissolved oxygen in crude oil. The decrease in corrosion rateof the specimens in deaerated solutions when compared withthe aerated solutions was about 89% in 1.0 wt.% NaCl, 93%in 3.5 wt.% NaCl and 92% in 10.0 wt.% NaCl. This is inagreement with the report of Jung et al. (Ref 21) who re-ported a decrease of 91% when the concentration of dissolvedoxygen was decreased from 9 to 2 mg/L.
The effect of dissolved oxygen (DO) on the corrosion of oiland gas facilities is significantly influenced by the presence ofother components of crude oil streams. One of such compo-nents is chloride salts. Mameng et al. (Ref 56) investigated theeffects of pH and oxygen on the corrosion resistance of carbonsteel in highly concentrated sodium chloride and reported thatoxygen content is an important factor influencing the corro-
siveness of sodium chloride solution with aerated conditionbeing the most corrosive. This is attributed to the effect ofsodium chloride concentration on the solubility of oxygen inaqueous solution, which is reported to be highest at 3.5 wt.%NaCl (Ref 2, 25).
3.2.2 Weight Loss. The results of the weight loss exper-iments are shown in Fig. 7. This figure revealed that there was adecrease in corrosion rate with immersion time. Like in theLPR experiments, this is due to the accumulation of corrosionproducts that partially block the surface of the steels withincrease in immersion time (Ref 40, 57). The steels alsoexhibited the same trend of behavior as observed in the LPRexperiments attesting to the fact that the corrosion rate of thesteels with ferrite–pearlite microstructures is lower than theSteel C with bainitic structure (Ref 40, 58).
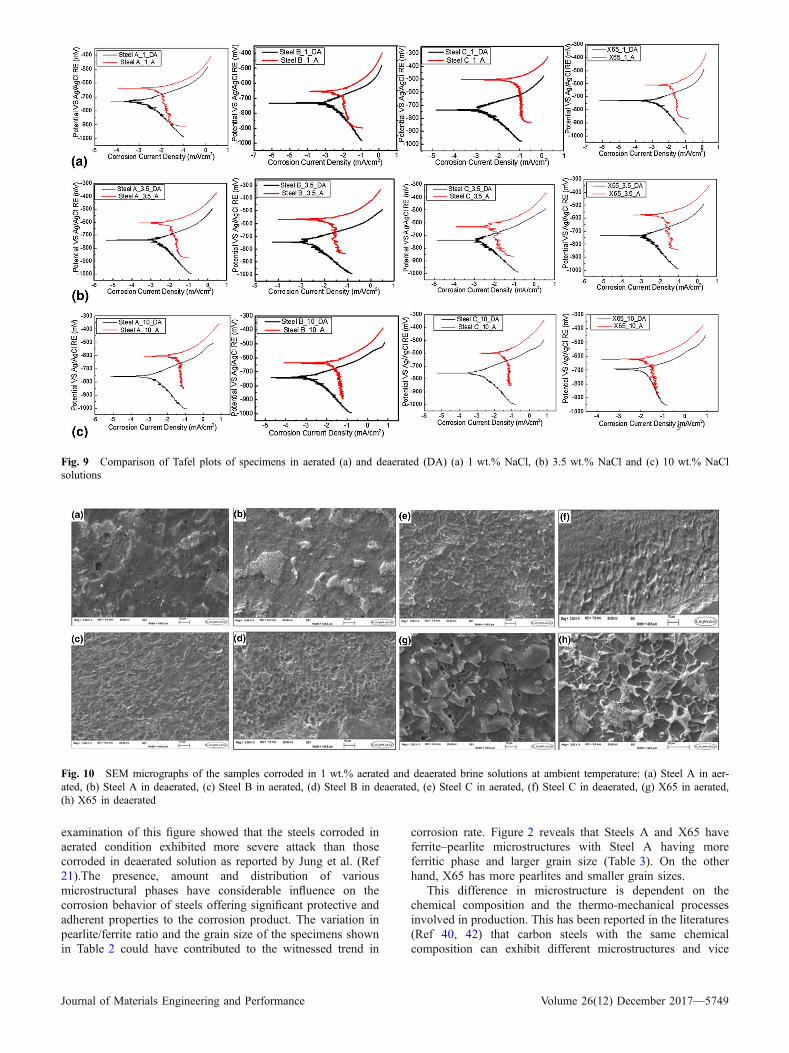
3.2.3 Potentiodynamic Polarization (Tafel Plots). Po-tentiodynamic polarization measurements were conducted inboth aerated and deaerated 1.0 wt.% NaCl, 3.5 wt.% NaCl and10.0 wt.% NaCl at ambient temperature. Figure 8 shows theTafel plots of the experiment in aerated and deaerated 3.5 wt.%NaCl solutions, respectively. The Tafel extrapolation parame-ters for all the steels in aerated and deaerated solution for thethree NaCl concentrations are listed in Table 4
It can be observed from Fig. 8 that the anodic currentincreased continuously with increase in corrosion potentials forall the specimens in aerated and deaerated 3.5 wt.% NaClsolutions. This signified a continuous dissolution of iron inagreement with the trend of the LPR results. Also, the anodicbranches show sharp increase in slopes exhibiting well-definedTafelian regions within the low over-potentials. This is anindication that passive films were not formed (Ref 40). Thecathodic branch for all the steels in the aerated solutionsshowed a mixed charge and mass transfer control reactionsdepicting well-pronounced current plateaus. This can beascribed to the mass-transport limitations of oxygen reductionreactions since reduction in dissolved oxygen as shown in Eq 1is the dominant reaction in aerated conditions (Ref 2, 29, 57).On the other hand, under deaerated condition, the cathodicreduction reaction shown in Eq 1 with a corresponding smallrate of hydrogen evolution is the main reaction. This lowhydrogen evolution resulted to the witnessed low corrosionrate.
Fig. 5 Average LPR corrosion rates vs. aerated and deaerated NaClconcentration at ambient temperature and for 6 h
Fig. 6 Comparison of corrosion rates of steels in aerated anddeaerated NaCl solutions at ambient temperature and for 6 h
Fig. 7 Corrosion rate by weight loss of specimens in 3.5 wt.%NaCl at ambient temperature
Journal of Materials Engineering and Performance Volume 26(12) December 2017—5747

O2 gð Þ þ H2O lð Þ þ 4e� ! 4OH�aqð Þ ðEq 12Þ
2H2O lð Þ þ 2e� ! H2 gð Þ þ 2OH�aqð Þ ðEq 13Þ
The Tafel plots for other environmental conditions (aerated 1and 10.0 wt.% and deaerated 1.0 and 10.0 wt.%) displayedsimilar profiles, but with a mild current plateaus in the deaer-ated solutions which is due to virtually absence of DO.
The Tafel plots of the experiments in aerated and deaerated1.0 wt.% NaCl, 3.5 wt.% NaCl and 10.0 wt.% NaCl solutionsshown in Fig. 9 vividly revealed that the corrosion currentdensity in aerated media is more than in the deaerated media.This is in corroboration with the results of LPR experimentsand with the report of Jung (Ref 21).
It is evident from Fig. 9 and Table 4 that there was acathodic shift (i.e., in the negative direction), which for Steel A(for instance) increased from � 607 mV in aerated 10% NaCl
solution to � 758 mV in deaerated 10% NaCl solution. Thiscathodic shift in corrosion potential is an indication that thecorrosion process was mainly accelerated by cathodic reactions(Ref 59). This gave a corresponding decrease in corrosioncurrent density from 17 lA cm�2 in the aerated solutions to0.9 lA cm�2 in the deaerated solutions of Steel A. Thesevalues are comparable with the report of other authors (Ref 3,30, 31). Since corrosion current density iCorr is proportionallyrelated to corrosion rate (CR) (Ref 59, 60) and from the valuesof iCorr in Tables 4, the corrosion rates of the steels in bothaerated and deaerated solutions can be ranked asCRSteelA <CRX65 <CRSteelB <CRSteelC. This trend of corrosionrate corroborated the linear polarization resistance results andcan be attributed to the chemical compositions and microstruc-tures of the samples.
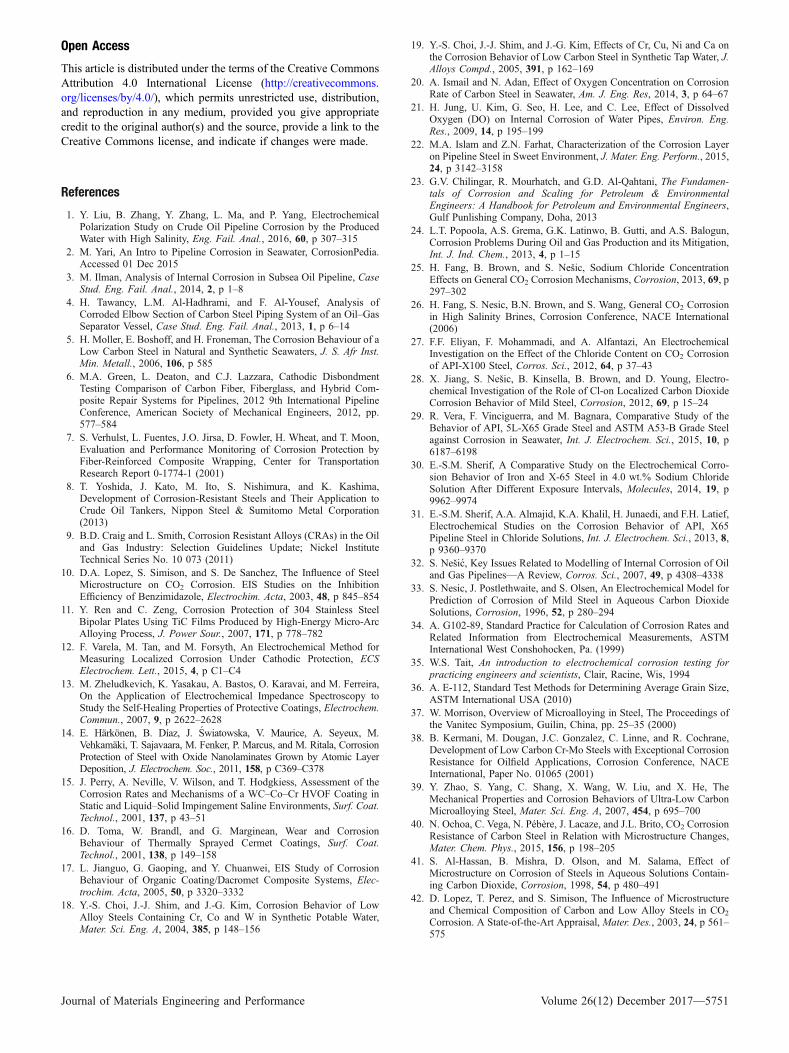
Figure 10 shows the SEM micrographs of the specimenscorroded in aerated and deaerated 1 wt.% NaCl. A closer
Fig. 8 Tafel plots of specimens in aerated and deaerated 3.5 wt.% NaCl solutions at ambient temperature
Table 4 Tafel extrapolation parameters of the specimens in aerated and deaerated solutions of three NaCl concentrations
NaCl (wt.%) Sample ECorr; mV iCorr, lA/cm2 ba, mV/dec bc, mV/dec
1.0 Aerated Steel A � 637 6.00 38 145Steel B � 656 7.50 60 175Steel C � 502 11.00 38 120X65 � 611 6.50 65 120
1.0 Aerated Steel A � 733 1.19 54 94Steel B � 732 1.25 53 96Steel C � 726 1.37 57 122X65 � 730 1.22 49 105
3.5 Aerated Steel A � 590 21.00 65 449Steel B � 591 24.00 69 411Steel C � 581 28.00 55 530X65 � 580 21.50 64 450
3.5 Deaerated Steel A � 742 1.40 53 99Steel B � 740 1.50 55 117Steel C � 738 1.60 55 108X65 � 738 1.40 53 111
10.0 Deaerated Steel A � 607 17.00 40 80Steel B � 634 20.00 65 265Steel C � 600 23.00 55 155X65 � 621 18.00 50 120
10.0 Deaerated Steel A � 758 0.90 54 86Steel B � 741 1.35 51 90Steel C � 742 1.4 56 101X65 � 731 1.16 40 64
5748—Volume 26(12) December 2017 Journal of Materials Engineering and Performance
examination of this figure showed that the steels corroded inaerated condition exhibited more severe attack than thosecorroded in deaerated solution as reported by Jung et al. (Ref21).The presence, amount and distribution of variousmicrostructural phases have considerable influence on thecorrosion behavior of steels offering significant protective andadherent properties to the corrosion product. The variation inpearlite/ferrite ratio and the grain size of the specimens shownin Table 2 could have contributed to the witnessed trend in
corrosion rate. Figure 2 reveals that Steels A and X65 haveferrite–pearlite microstructures with Steel A having moreferritic phase and larger grain size (Table 3). On the otherhand, X65 has more pearlites and smaller grain sizes.
This difference in microstructure is dependent on thechemical composition and the thermo-mechanical processesinvolved in production. This has been reported in the literatures(Ref 40, 42) that carbon steels with the same chemicalcomposition can exhibit different microstructures and vice
Fig. 9 Comparison of Tafel plots of specimens in aerated (a) and deaerated (DA) (a) 1 wt.% NaCl, (b) 3.5 wt.% NaCl and (c) 10 wt.% NaClsolutions
Fig. 10 SEM micrographs of the samples corroded in 1 wt.% aerated and deaerated brine solutions at ambient temperature: (a) Steel A in aer-ated, (b) Steel A in deaerated, (c) Steel B in aerated, (d) Steel B in deaerated, (e) Steel C in aerated, (f) Steel C in deaerated, (g) X65 in aerated,(h) X65 in deaerated
Journal of Materials Engineering and Performance Volume 26(12) December 2017—5749

versa depending on heat treatment route. This can significantlyaffect the corrosion behavior (protective and adherent proper-ties of corrosion film) of carbon steel. When a freshly polishedcarbon and low-alloyed steel with ferrite–pearlite microstruc-tures is immersed in an electrolyte, selective dissolution of theferrite phase takes place leaving the pearlite unaffected. Theundissolved pearlite forms cementite platelets. The adherenceand protectiveness of the corrosion product film is related to thepresence of these cementite platelets which strengthen andanchor the films to the metal substrate (Ref 42, 45). Someauthors (Ref 32, 41, 42, 61) have also reported that cementiteacts as cathode, while the ferrite acts as the anode in ferrite–pearlite microstructures. It follows that the specimen withhigher cathode–anode (pearlite–ferrite) ratio should be moresusceptible to corrosion attack (Ref 23, 24, 60). Pearlite phasehas also been observed to increase with carbon content (Ref 62,63). Therefore, the specimen with higher carbon content hasmore pearlite phase and consequently greater cathode to anoderatio resulting in higher corrosion rate. This phenomenon wasexhibited by the three steels with ferrite–pearlite microstruc-tures (Steels A, B and X65) used in this work.
Another distinctive characteristic of these micro-alloyedsteels is their grain size as shown in Table 3. Asiful et al.(Ref 43) noted that small grain microstructures have moresurface area and so are more prone to corrosion attack. Itthen means that the combine effect of these two factors(cathode–anode ratio and grain size) majorly contributed toSteel A exhibiting a better corrosion performance than X65.Thus, although Steel A and X65 have the same chemicalcomposition (Table 1), their different microstructural behav-iors (Fig. 2) could be due to heat treatment processes used.This in turn contributed to the witnessed variation in theircorrosion performance. Steel B also consist of ferrite–pearlitephase with finer grain size and globular structure leading toporous and flaky corrosion film with poor adhesion as shownin Fig. 10(c) and (d) and hence exhibiting a much lowercorrosion resistance than Steel A and X65. This corroboratedthe report of Islam and Farhat (Ref 22). The protrudinglaminar cementite can be clearly seen in Fig. 10 for steels A(Fig. 10a and b) and X65 (Fig. 10g and h), suggesting thatthe ferrite phases have suffered dissolution, while thecementite appeared unaffected (Ref 64).
Steel C consists of bainitic structures with dispersed acicularferrite. This formed a sludge-like corrosion product whichaccording to Zhao (Ref 39) renders the specimen unprotectedagainst corrosion attack. These sludge-like corrosion productsallow the ingress of corrosion species to the substrate leading tosevere corrosion spallation (Ref 64) as shown in Fig. 10(e) and(f). Steel C also has high Cr and Mo content. These elementsimprove corrosion resistance by favoring passivity (Ref 29, 38,41, 46, 65). Kermani et al. (Ref 38) and Kermani and Morshed(Ref 46) observed that an optimum Cr content, which issubjected to other alloying constituents and heat treatment, hada significant beneficial role on the CO2 corrosion performanceof the steels. Ueda et al. (Ref 65) showed that below 60 �C, theeffect of Cr addition in enhancing corrosion performance waseffective with Cr content more than 1 wt.%. Other authors (Ref62, 63) have equally reported that the corrosion resistance ofcarbon steels deceases with increasing carbon content. It thenmeans that due to high carbon content and low Cr content(< 1 wt.%), the effect of Cr in enhancing corrosion perfor-mance of steel C was not pronounced. This is because the high
carbon content formed carbides with Cr (Ref 38, 66–68)leading to increased cathodic site and therefore increasedcorrosion rate (Ref 29, 41).
The work of Kermani et al. (Ref 38) also showed thatvanadium (V) had a major beneficial effect in reducingcorrosion rate and that V in the excess of 50% stoichiometricratio of carbon is needed to obtain the best combination ofcorrosion resistance. Thus, using simple charge/mass balancecalculation, only about 0.005 wt.% C is required to precipitateas carbide with the available V in Steel C (Table 1). Conse-quently, the excess/balance C content will precipitate with Cr aschromium carbide. This also contributed to increased corrosionrate of Steel C.
4. Conclusion
The corrosion behavior of three fairly new generation steelsin the family of micro-alloyed steel with varying chemicalcompositions and microstructures and whose corrosion char-acteristics have not been properly understood were comparedwith API 5L X65 carbon steel in different concentrations ofaerated and deaerated brine solutions using linear polarizationresistance, potentiodynamic polarization and weight loss tech-niques. The corrosion products on the surface of the steels werecharacterized using SEM/EDAX analysis. From the results ofthe experiments, the following conclusions can be drawn:
The three fairly new class of micro-alloyed steels exhibitedcomparable corrosion properties of micro-alloyed steels havingpresented similar corrosion characteristics with the referencespecimen (API 5L X65). The potentiodynamic polarizationplots of these steels showed a well-defined anodic Tafel region,but the cathodic behavior indicated a mixed charge and masstransfer control reactions with a more pronounced limitingcurrent plateaus in the aerated solution. This was ascribed to themass-transport limitations of oxygen reduction reactions occa-sioned by the presence of dissolved oxygen in the aeratedsolutions leading to about 80% higher corrosion rate than in thedeaerated solutions. The corrosion rate of these proprietarysteels increased with increase in NaCl concentration displayinga threshold in 3.5 wt.% NaCl solutions due to decrease in thesolubility of oxygen (salting out) and the adsorption of chlorideon the surface of the steels. Also, the specimens demonstratedvariations in corrosion rate which was linked to their chemicalcomposition and microstructures whereby the specimens withferrite–pearlite microstructures as well as smaller grain size andless carbon content presented better corrosion resistance in bothaerated and deaerated solutions. In general, the results of thevarious corrosion techniques and the surface analysis employedcorroborated each other and showed that the corrosion rate(CR) of the specimens can be ranked as CRSteelA <CRX65 <CRSteelB <CRSteelC. Thus, within the limit of experimentalerror, only Steel A showed a better corrosion performance thanthe reference specimen (API 5L X65).
Acknowledgment
We wish to acknowledge and appreciate the sponsorship of thiswork by Petroleum Technology Development Fund (PTDF),Abuja, Nigeria. For supplying the micro-alloyed steels used inthis work, we say thank you to Professor B. Kermani.
5750—Volume 26(12) December 2017 Journal of Materials Engineering and Performance
Open Access
This article is distributed under the terms of the Creative CommonsAttribution 4.0 International License (http://creativecommons.org/licenses/by/4.0/), which permits unrestricted use, distribution,and reproduction in any medium, provided you give appropriatecredit to the original author(s) and the source, provide a link to theCreative Commons license, and indicate if changes were made.
References
1. Y. Liu, B. Zhang, Y. Zhang, L. Ma, and P. Yang, ElectrochemicalPolarization Study on Crude Oil Pipeline Corrosion by the ProducedWater with High Salinity, Eng. Fail. Anal., 2016, 60, p 307–315
2. M. Yari, An Intro to Pipeline Corrosion in Seawater, CorrosionPedia.Accessed 01 Dec 2015
3. M. Ilman, Analysis of Internal Corrosion in Subsea Oil Pipeline, CaseStud. Eng. Fail. Anal., 2014, 2, p 1–8
4. H. Tawancy, L.M. Al-Hadhrami, and F. Al-Yousef, Analysis ofCorroded Elbow Section of Carbon Steel Piping System of an Oil–GasSeparator Vessel, Case Stud. Eng. Fail. Anal., 2013, 1, p 6–14
5. H. Moller, E. Boshoff, and H. Froneman, The Corrosion Behaviour of aLow Carbon Steel in Natural and Synthetic Seawaters, J. S. Afr Inst.Min. Metall., 2006, 106, p 585
6. M.A. Green, L. Deaton, and C.J. Lazzara, Cathodic DisbondmentTesting Comparison of Carbon Fiber, Fiberglass, and Hybrid Com-posite Repair Systems for Pipelines, 2012 9th International PipelineConference, American Society of Mechanical Engineers, 2012, pp.577–584
7. S. Verhulst, L. Fuentes, J.O. Jirsa, D. Fowler, H. Wheat, and T. Moon,Evaluation and Performance Monitoring of Corrosion Protection byFiber-Reinforced Composite Wrapping, Center for TransportationResearch Report 0-1774-1 (2001)
8. T. Yoshida, J. Kato, M. Ito, S. Nishimura, and K. Kashima,Development of Corrosion-Resistant Steels and Their Application toCrude Oil Tankers, Nippon Steel & Sumitomo Metal Corporation(2013)
9. B.D. Craig and L. Smith, Corrosion Resistant Alloys (CRAs) in the Oiland Gas Industry: Selection Guidelines Update; Nickel InstituteTechnical Series No. 10 073 (2011)
10. D.A. Lopez, S. Simison, and S. De Sanchez, The Influence of SteelMicrostructure on CO2 Corrosion. EIS Studies on the InhibitionEfficiency of Benzimidazole, Electrochim. Acta, 2003, 48, p 845–854
11. Y. Ren and C. Zeng, Corrosion Protection of 304 Stainless SteelBipolar Plates Using TiC Films Produced by High-Energy Micro-ArcAlloying Process, J. Power Sour., 2007, 171, p 778–782
12. F. Varela, M. Tan, and M. Forsyth, An Electrochemical Method forMeasuring Localized Corrosion Under Cathodic Protection, ECSElectrochem. Lett., 2015, 4, p C1–C4
13. M. Zheludkevich, K. Yasakau, A. Bastos, O. Karavai, and M. Ferreira,On the Application of Electrochemical Impedance Spectroscopy toStudy the Self-Healing Properties of Protective Coatings, Electrochem.Commun., 2007, 9, p 2622–2628
14. E. Harkonen, B. Dıaz, J. Swiatowska, V. Maurice, A. Seyeux, M.Vehkamaki, T. Sajavaara, M. Fenker, P. Marcus, and M. Ritala, CorrosionProtection of Steel with Oxide Nanolaminates Grown by Atomic LayerDeposition, J. Electrochem. Soc., 2011, 158, p C369–C378
15. J. Perry, A. Neville, V. Wilson, and T. Hodgkiess, Assessment of theCorrosion Rates and Mechanisms of a WC–Co–Cr HVOF Coating inStatic and Liquid–Solid Impingement Saline Environments, Surf. Coat.Technol., 2001, 137, p 43–51
16. D. Toma, W. Brandl, and G. Marginean, Wear and CorrosionBehaviour of Thermally Sprayed Cermet Coatings, Surf. Coat.Technol., 2001, 138, p 149–158
17. L. Jianguo, G. Gaoping, and Y. Chuanwei, EIS Study of CorrosionBehaviour of Organic Coating/Dacromet Composite Systems, Elec-trochim. Acta, 2005, 50, p 3320–3332
18. Y.-S. Choi, J.-J. Shim, and J.-G. Kim, Corrosion Behavior of LowAlloy Steels Containing Cr, Co and W in Synthetic Potable Water,Mater. Sci. Eng. A, 2004, 385, p 148–156
19. Y.-S. Choi, J.-J. Shim, and J.-G. Kim, Effects of Cr, Cu, Ni and Ca onthe Corrosion Behavior of Low Carbon Steel in Synthetic Tap Water, J.Alloys Compd., 2005, 391, p 162–169
20. A. Ismail and N. Adan, Effect of Oxygen Concentration on CorrosionRate of Carbon Steel in Seawater, Am. J. Eng. Res, 2014, 3, p 64–67
21. H. Jung, U. Kim, G. Seo, H. Lee, and C. Lee, Effect of DissolvedOxygen (DO) on Internal Corrosion of Water Pipes, Environ. Eng.Res., 2009, 14, p 195–199
22. M.A. Islam and Z.N. Farhat, Characterization of the Corrosion Layeron Pipeline Steel in Sweet Environment, J. Mater. Eng. Perform., 2015,24, p 3142–3158
23. G.V. Chilingar, R. Mourhatch, and G.D. Al-Qahtani, The Fundamen-tals of Corrosion and Scaling for Petroleum & EnvironmentalEngineers: A Handbook for Petroleum and Environmental Engineers,Gulf Punlishing Company, Doha, 2013
24. L.T. Popoola, A.S. Grema, G.K. Latinwo, B. Gutti, and A.S. Balogun,Corrosion Problems During Oil and Gas Production and its Mitigation,Int. J. Ind. Chem., 2013, 4, p 1–15
25. H. Fang, B. Brown, and S. Nesic, Sodium Chloride ConcentrationEffects on General CO2 Corrosion Mechanisms, Corrosion, 2013, 69, p297–302
26. H. Fang, S. Nesic, B.N. Brown, and S. Wang, General CO2 Corrosionin High Salinity Brines, Corrosion Conference, NACE International(2006)
27. F.F. Eliyan, F. Mohammadi, and A. Alfantazi, An ElectrochemicalInvestigation on the Effect of the Chloride Content on CO2 Corrosionof API-X100 Steel, Corros. Sci., 2012, 64, p 37–43
28. X. Jiang, S. Nesic, B. Kinsella, B. Brown, and D. Young, Electro-chemical Investigation of the Role of Cl-on Localized Carbon DioxideCorrosion Behavior of Mild Steel, Corrosion, 2012, 69, p 15–24
29. R. Vera, F. Vinciguerra, and M. Bagnara, Comparative Study of theBehavior of API, 5L-X65 Grade Steel and ASTM A53-B Grade Steelagainst Corrosion in Seawater, Int. J. Electrochem. Sci., 2015, 10, p6187–6198
30. E.-S.M. Sherif, A Comparative Study on the Electrochemical Corro-sion Behavior of Iron and X-65 Steel in 4.0 wt.% Sodium ChlorideSolution After Different Exposure Intervals, Molecules, 2014, 19, p9962–9974
31. E.-S.M. Sherif, A.A. Almajid, K.A. Khalil, H. Junaedi, and F.H. Latief,Electrochemical Studies on the Corrosion Behavior of API, X65Pipeline Steel in Chloride Solutions, Int. J. Electrochem. Sci., 2013, 8,p 9360–9370
32. S. Nesic, Key Issues Related to Modelling of Internal Corrosion of Oiland Gas Pipelines—A Review, Corros. Sci., 2007, 49, p 4308–4338
33. S. Nesic, J. Postlethwaite, and S. Olsen, An Electrochemical Model forPrediction of Corrosion of Mild Steel in Aqueous Carbon DioxideSolutions, Corrosion, 1996, 52, p 280–294
34. A. G102-89, Standard Practice for Calculation of Corrosion Rates andRelated Information from Electrochemical Measurements, ASTMInternational West Conshohocken, Pa. (1999)
35. W.S. Tait, An introduction to electrochemical corrosion testing forpracticing engineers and scientists, Clair, Racine, Wis, 1994
36. A. E-112, Standard Test Methods for Determining Average Grain Size,ASTM International USA (2010)
37. W. Morrison, Overview of Microalloying in Steel, The Proceedings ofthe Vanitec Symposium, Guilin, China, pp. 25–35 (2000)
38. B. Kermani, M. Dougan, J.C. Gonzalez, C. Linne, and R. Cochrane,Development of Low Carbon Cr-Mo Steels with Exceptional CorrosionResistance for Oilfield Applications, Corrosion Conference, NACEInternational, Paper No. 01065 (2001)
39. Y. Zhao, S. Yang, C. Shang, X. Wang, W. Liu, and X. He, TheMechanical Properties and Corrosion Behaviors of Ultra-Low CarbonMicroalloying Steel, Mater. Sci. Eng. A, 2007, 454, p 695–700
40. N. Ochoa, C. Vega, N. Pebere, J. Lacaze, and J.L. Brito, CO2 CorrosionResistance of Carbon Steel in Relation with Microstructure Changes,Mater. Chem. Phys., 2015, 156, p 198–205
41. S. Al-Hassan, B. Mishra, D. Olson, and M. Salama, Effect ofMicrostructure on Corrosion of Steels in Aqueous Solutions Contain-ing Carbon Dioxide, Corrosion, 1998, 54, p 480–491
42. D. Lopez, T. Perez, and S. Simison, The Influence of Microstructureand Chemical Composition of Carbon and Low Alloy Steels in CO2
Corrosion. A State-of-the-Art Appraisal, Mater. Des., 2003, 24, p 561–575
Journal of Materials Engineering and Performance Volume 26(12) December 2017—5751
43. A.H. Seikh, Influence of Heat Treatment on the Corrosion ofMicroalloyed Steel in Sodium Chloride Solution, J. Chem., 2013, doi:10.1155/2013/587514
44. D. Matlock and J. Speer, Microalloying Concepts and Application inLong Products, Mater. Sci. Technol., 2009, 25, p 1118–1125
45. C. Palacios and J. Shadley, Characteristics of Corrosion Scales onSteels in a CO2-Saturated NaCl Brine, Corrosion, 1991, 47, p 122–127
46. M. Kermani and A. Morshed, Carbon Dioxide Corrosion in Oil andGas Production-A Compendium, Corrosion, 2003, 59, p 659–683
47. Printon Applied Research, Electrochemistry and Corrosion: Overviewand Techniques, Princeton Applied Research, 801 S. Illinois Avenue,Oak Ridge, TN 37830. Accessed 07 Sept 2017
48. G. Walter, Problems Arising in the Determination of AccurateCorrosion Rates from Polarization Resistance Measurements, Corros.Sci., 1977, 17, p 983–993
49. J.R. Scully, Polarization Resistance Method for Determination ofInstantaneous Corrosion Rates, Corrosion, 2000, 56, p 199–218
50. W. Oelssner, F. Berthold, and U. Guth, The iR Drop–Well-Known ButOften Underestimated in Electrochemical Polarization Measurementsand Corrosion Testing, Mater. Corros., 2006, 57, p 455–466
51. S. Nesic, N. Thevenot, J.L. Crolet, D. Drazic, ElectrochemicalProperties of Iron Dissolution in the Presence of CO2-Basics Revisited,Corrosion Conference, NACE International, Paper No. 3 (1996)
52. R.C. Weast, M.J. Astle, and W.H. Beyer, CRC Handbook of Chemistryand Physics, CRC Press, Boca Raton, 1988
53. J.R. Davis, Corrosion: Understanding the Basics, ASM International,Materials Park, 2000
54. H. El Desouky and H.A. Aboeldahab, Effect of Chloride Concentrationon the Corrosion Rate of Maraging Steel, Open J. Phys. Chem., 2014,4, p 147
55. J. Han, J.W. Carey, and J. Zhang, Effect of Sodium Chloride onCorrosion of Mild Steel in CO2-Saturated Brines, J. Appl. Elec-trochem., 2011, 41, p 741–749
56. L. Caceres, T. Vargas, and L. Herrera, Influence of Pitting and IronOxide Formation During Corrosion of Carbon Steel in UnbufferedNaCl Solutions, Corros. Sci., 2009, 51, p 971–978
57. S.H. Mameng, A. Bergquist, and E. Johansson, Corrosion of StainlessSteel in Sodium Chloride Brine Solutions, A Corrosion Management
and Applications Engineering Magazine; Outokumpu, acom vol. 2(2014)
58. M. Henriquez, N. Pebere, N. Ochoa, and A. Viloria, ElectrochemicalInvestigation of the Corrosion Behavior of API, 5L-X65 Carbon Steelin Carbon Dioxide Medium, Corrosion, 2013, 69, p 1171–1179
59. Q. Wu, Z. Zhang, X. Dong, and J. Yang, Corrosion Behavior of Low-Alloy Steel Containing 1% Chromium in CO2 Environments, Corros.Sci., 2013, 75, p 400–408
60. Z. Yin, X. Wang, R. Gao, S. Zhang, and Z. Bai, ElectrochemicalBehavior and Mechanism of CO2 Corrosion on P110 Steel inSimulated Oilfield Solution, Anti-Corros. Methods Mater., 2011, 58,p 227–233
61. P. Sarkar, P. Kumar, M.K. Manna, and P. Chakraborti, MicrostructuralInfluence on the Electrochemical Corrosion Behaviour of Dual-PhaseSteels in 3.5% NaCl Solution, Mater. Lett., 2005, 59, p 2488–2491
62. T. Tanupabrungsun, B. Brown, S. Nesic, Effect of pH on CO2
Corrosion of Mild Steel at Elevated Temperatures, Corrosion Confer-ence & Expo, NACE International, Ohio University, Paper No. 2348(2013)
63. D.V. Edmonds and R.C. Cochrane, The Effect of Alloying on theResistance of Carbon Steel for Oilfield Applications to CO2 Corrosion,Mater. Res., 2005, 8, p 377–385
64. J. Guo, S. Yang, C. Shang, Y. Wang, and X. He, Influence of CarbonContent and Microstructure on Corrosion Behaviour of Low Alloy Steelsin a Cl� Containing Environment, Corros. Sci., 2009, 51, p 242–251
65. S. Wu, Z. Cui, F. He, Z. Bai, S. Zhu, and X. Yang, Characterization ofthe Surface Film Formed from Carbon Dioxide Corrosion on N80Steel, Mater. Lett., 2004, 58, p 1076–1081
66. M. Ueda, H. Takabe, and P.I. Nice, The Development and Implemen-tation of a New Alloyed Steel for Oil and Gas Production Wells,Corrosion Conference, NACE International, Paper No. 00154 (2000)
67. E. David, C. Robert, and G. Rosa, Effect of Microalloying, PrincipallyWith Vanadium, Processing Conditions and Microstructure on Resis-tance to CO2 Corrosion, J. Iron Steel Res. (International), 2011, 18, p183–191
68. A. Dugstad, H. Hemmer, and M. Seiersten, Effect of Steel Microstruc-ture on Corrosion Rate and Protective Iron Carbonate Film Formation,Corrosion, 2001, 57, p 369–378
5752—Volume 26(12) December 2017 Journal of Materials Engineering and Performance