Financial highlights - inchcape.com · £2,340 .1m-13.8% Tradingprofit* £23 .1m-66.8% Sales £92...
124
Transcript of Financial highlights - inchcape.com · £2,340 .1m-13.8% Tradingprofit* £23 .1m-66.8% Sales £92...

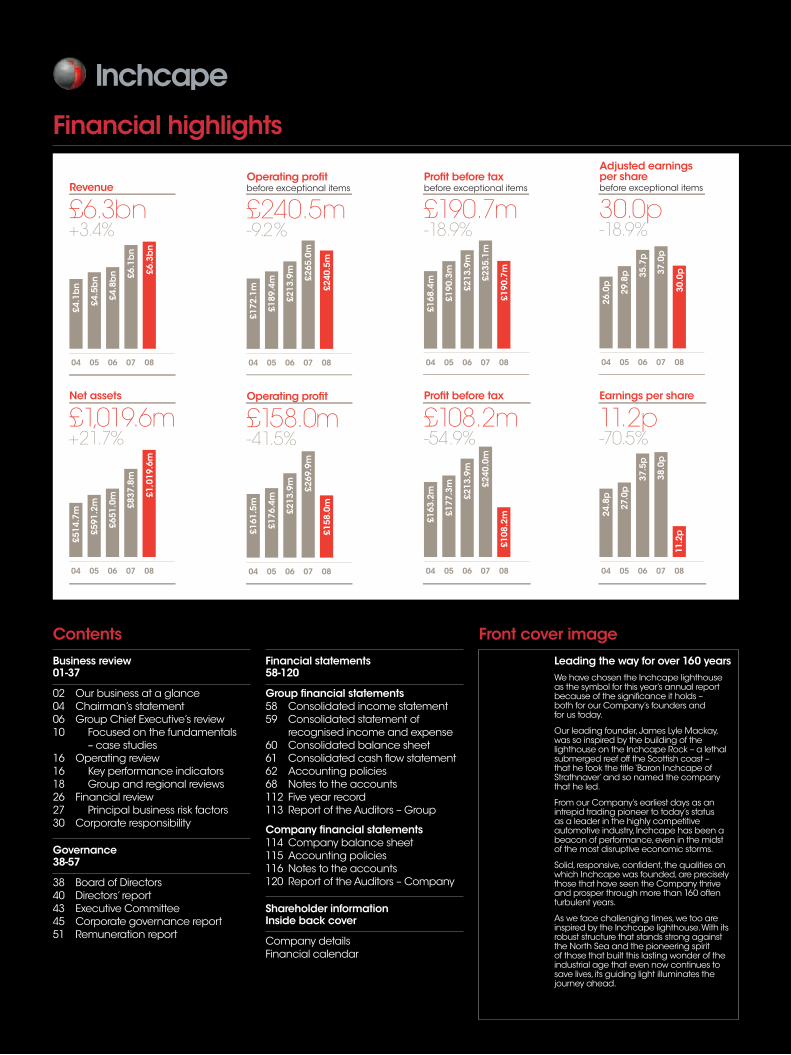
Leading the way for over 160 yearsWe have chosen the Inchcape lighthouseas the symbol for this year’s annual reportbecause of the significance it holds –both for our Company’s founders andfor us today.
Our leading founder,James Lyle Mackay,was so inspired by the building of thelighthouse on the Inchcape Rock – a lethalsubmerged reef off the Scottish coast –that he took the title ‘Baron Inchcape ofStrathnaver’and so named the companythat he led.
From our Company’s earliest days as anintrepid trading pioneer to today’s statusas a leader in the highly competitiveautomotive industry, Inchcape has been abeacon of performance,even in the midstof the most disruptive economic storms.
Solid, responsive,confident, the qualities onwhich Inchcape was founded,are preciselythose that have seen the Company thriveand prosper throughmore than 160 oftenturbulent years.
As we face challenging times,we too areinspired by the Inchcape lighthouse.With itsrobust structure that stands strong againstthe North Sea and the pioneering spiritof those that built this lasting wonder of theindustrial age that even now continues tosave lives, its guiding light illuminates thejourney ahead.
ContentsBusiness review01-37
02 Our business at a glance04 Chairman’s statement06 Group Chief Executive’s review10 Focused on the fundamentals
– case studies16 Operating review16 Key performance indicators18 Group and regional reviews26 Financial review27 Principal business risk factors30 Corporate responsibility
Governance38-57
38 Board of Directors40 Directors’ report43 Executive Committee45 Corporate governance report51 Remuneration report
Financial statements58-120
Group financial statements58 Consolidated income statement59 Consolidated statement of
recognised income and expense60 Consolidated balance sheet61 Consolidated cash flow statement62 Accounting policies68 Notes to the accounts112 Five year record113 Report of theAuditors – Group
Company financial statements114 Company balance sheet115 Accounting policies116 Notes to the accounts120 Report of theAuditors – Company
Shareholder informationInside back cover
Company detailsFinancial calendar
Financial highlights
0807060504
Revenue
£6.3bn+3.4%
£4.1bn
£4.5bn
£4.8bn £6.1bn
£6.3bn
0807060504
Operating profitbefore exceptional items
£240.5m-9.2%
£172
.1m
£189
.4m
£213
.9m
£265
.0m
£240
.5m
0807060504
Profit before taxbefore exceptional items
£190.7m-18.9%
£168
.4m
£190
.3m
£213
.9m
£235
.1m
£190
.7m
0807060504
Adjusted earningsper sharebefore exceptional items
30.0p-18.9%
26.0
p
29.8
p 35.7
p
37.0
p
30.0
p
0807060504
Net assets
£1,019.6m+21.7%
£514
.7m
£591
.2m
£651
.0m
£837
.8m
£1,0
19.6
m
0807060504
Operating profit
£158.0m-41.5%
£161
.5m
£176
.4m
£213
.9m
£269
.9m
£158
.0m
0807060504
Profit before tax
£108.2m-54.9%
£163
.2m
£177
.3m
£213
.9m
£240
.0m
£108
.2m
0807060504
Earnings per share
11.2p-70.5%
24.8
p
27.0
p
37.5
p
38.0
p
11.2
p
Front cover image

1
www.inchcape.com
Businessreview
01-37Governa
nce38-57
Financia
lstatem
ents58-120
Shareho
lderinfo
rmation
Insidebackcover
Inchcape’s key strengths…Several factors combine to give Inchcape strength in theglobal automotive retail and distribution industry:
• An industry leader with a track record of growth andprudent governance.
• A proven and resilient business model with broad geographiccoverage across 26 mature and emerging markets,with scaleoperations and a leading position in 14 markets.
• Long-standing relationships with strong brand partners whohave a history of outperforming the market,providing accessto a pipeline of attractive new car models.
• A passionate and relentless focus on superior customer servicethat underpins a history of industry-leading performance.
• A proactive management team,with a blend of industryexpertise and blue-chip company experience,which hasresponded decisively to the rapid and unprecedenteddownturn in the automotive industry.
• Well positioned to benefit from opportunities when the marketrecovers – a leaner business with scale presence,broadgeographic spread,partnered with strong automotive brands.
As an industry leader,we see opportunity today as we buildthe platform to emerge even stronger tomorrow.
We are solid, responsive and confident.
André LacroixGroup Chief Executive
2
Inchcape plc Annual Report and Accounts 2008
Business review
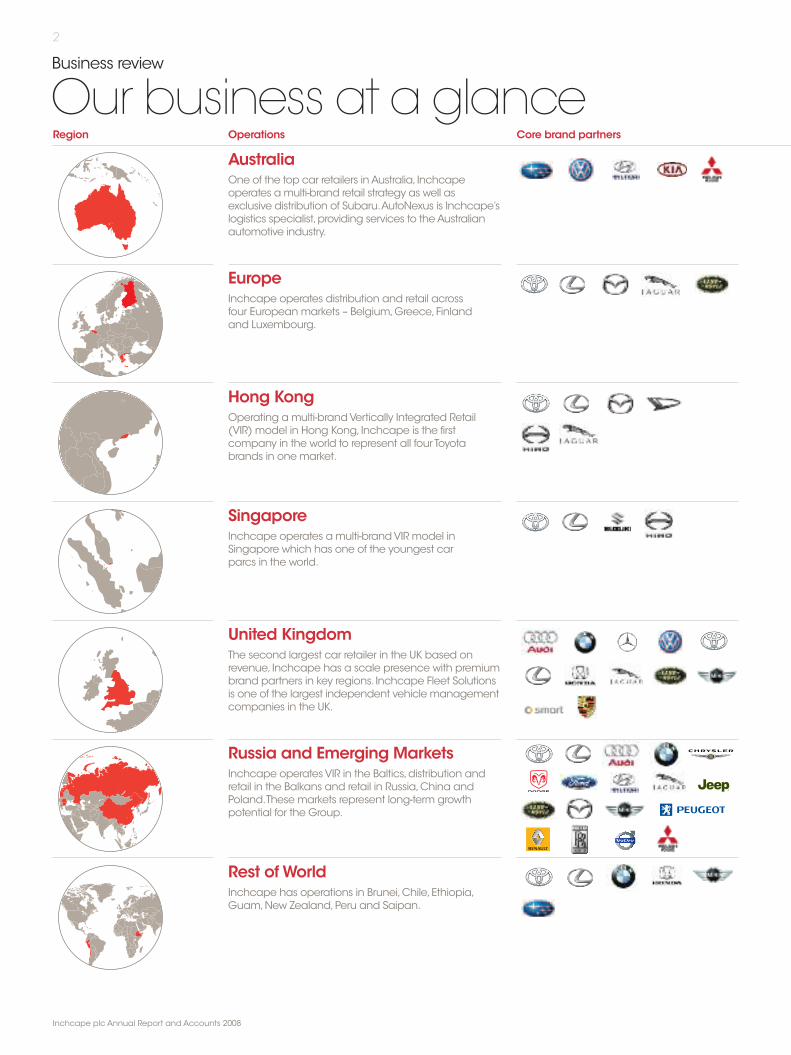
Our business at a glanceRegion Operations Core brand partners
One of the top car retailers inAustralia, Inchcapeoperates amulti-brand retail strategy as well asexclusive distribution of Subaru.AutoNexus is Inchcape’slogistics specialist,providing services to theAustralianautomotive industry.
Australia
Inchcape operates distribution and retail acrossfour Europeanmarkets – Belgium,Greece,Finlandand Luxembourg.
Europe
Operating amulti-brandVertically Integrated Retail(VIR) model in Hong Kong, Inchcape is the firstcompany in the world to represent all four Toyotabrands in one market.
Hong Kong
Inchcape operates a multi-brandVIR model inSingapore which has one of the youngest carparcs in the world.
Singapore
The second largest car retailer in the UK based onrevenue, Inchcape has a scale presence with premiumbrand partners in key regions. Inchcape Fleet Solutionsis one of the largest independent vehicle managementcompanies in the UK.
United Kingdom
Inchcape operatesVIR in the Baltics,distribution andretail in the Balkans and retail in Russia,China andPoland.These markets represent long-term growthpotential for the Group.
Russia and Emerging Markets
Inchcape has operations in Brunei,Chile,Ethiopia,Guam,New Zealand,Peru and Saipan.
Rest of World
3
www.inchcape.com
Businessreview
01-37Governa
nce38-57
Financia
lstatem
ents58-120
Shareho
lderinfo
rmation
Insidebackcover
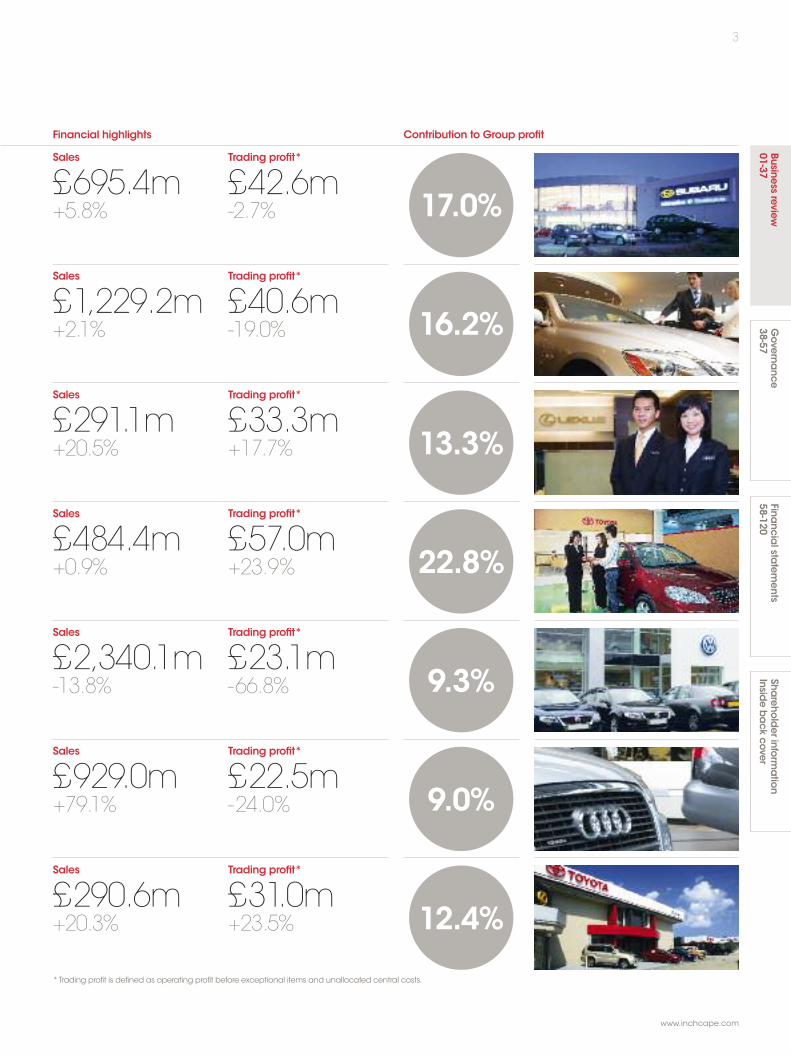
Sales
£695.4m+5.8%
Financial highlights Contribution to Group profit
Trading profit*
£42.6m-2.7%
Sales
£1,229.2m+2.1%
Trading profit*
£40.6m-19.0%
Sales
£291.1m+20.5%
Trading profit*
£33.3m+17.7%
Sales
£484.4m+0.9%
Trading profit*
£57.0m+23.9%
Sales
£2,340.1m-13.8%
Trading profit*
£23.1m-66.8%
Sales
£929.0m+79.1%
Trading profit*
£22.5m-24.0%
Sales
£290.6m+20.3%
Trading profit*
£31.0m+23.5%
17.0%
16.2%
13.3%
22.8%
9.3%
9.0%
12.4%
*Trading profit is defined as operating profit before exceptional items and unallocated central costs.

Business review
Chairman’s statement4
Inchcape plc Annual Report and Accounts 2008Inchcape plc Annual Report and Accounts 2008
Despite the weakening trading conditionsin many markets around the world,weare pleased to report results for 2008 inline with our expectations, reflecting theprogress we have made against ourgrowth strategy and the benefits ofexcellent portfolio diversification.
PerformanceGroup sales have increased by 3.4% to£6.3bn for the full year to 31 December2008,benefiting from strategic and focusedacquisitions and from organic sales growthin most of our markets.On a like for like,constant currency basis, sales fell by 4.3%reflecting the impact of an unprecedentedand rapid downturn that started to affectour industry in the second half of 2008.
Profit before tax and exceptional items of£190.7m was 18.9% lower than 2007 andadjusted earnings per share fell 18.9% to30p.On a statutory basis,which includesexceptional items,profit before tax of£108.2m was 54.9% below 2007 andearnings per share fell 70.5% to 11.2p.
We responded swiftly to the market declineby reducing our cost base,closing 24 lessprofitable sites, reducing our workforce bymore than 2,000 people and implementingother restructuring measures which areexpected to generate an annualised savingof approximately £58m at 2009 exchangerates.These actions have resulted in anexceptional charge in 2008 of £28.3mtogether with a charge of £54.2m forgoodwill impairment largely due to thedownturn in Latvia.
When reviewing the performance ofour business units, trading profit is a keymeasure and is defined as operating profitexcluding the impact of exceptional itemsand unallocated central costs.
In our Distribution businesses we grewsales by 5.8% despite challenging tradingconditions.We primarily benefited fromstrong performances in Singapore,wherewe outperformed the market with newmodel launches and strong commercialvehicle sales resulting in a trading profitgrowth of 23.9%, in Hong Kong with atrading profit growth of 17.7% and in theRest ofWorld with trading profit growthof 23.2%.We retained market share as wellas market leadership in Greece and salesin Belgium grew 0.2% on 2007 under verydifficult conditions. In Australia,whilst newmodels helped to improve market shareby 10bp, the market decline resulted in atrading profit decrease of 3.7%.The UK fleetmanagement business, Inchcape FleetSolutions,suffered from a residual valueprovision increase of £8.5m.
4
Inchcape has a provenand resilient businessmodel.The industryfaces an unprecedenteddownturn but we willremain solid by focusingon our core activities.
Peter JohnsonChairman
5
www.inchcape.com
Businessreview
01-37Governa
nce38-57
Financia
lstatem
ents58-120
Shareho
lderinfo
rmation
Insidebackcover
Sales in our Retail businesses grew by 1.6%in 2008,benefiting from our acquisitions inRussia,9.3% growth in Australia and a newLexus retail centre in China.Across Europe,sales grew 3.0% as a result of strongperformance in Greece and Finland. In theUK we outperformed the market with like forlike sales falling 5.4% in a market which fell11.3%. In the Russia and Emerging Marketssegment, trading profits increased by 40.9%largely as a result of our acquisitions inRussia and growth in Poland.
Acquisition and disposal summaryWemade further progress in our UK disposalprogramme in accordance with our strategyto streamline the business following theacquisition of EuropeanMotor Holdings plc in2007.We sold ourVauxhall business and themajority of ourVolvo retail outlets for a totalconsideration of £17.0m.These transactionsfollowed the disposals of InchcapeAutomotive,Wilcomatic,and the Bentley,Ferrari and Maserati retail outlets in 2007.
We have reinvested the proceeds fromthese disposals into our Russia and EmergingMarkets segment,announcing in March theacquisition of the remaining 24.9% stake inour St Petersburg business for a total cashconsideration of £28.5m.This gave the Groupfull ownership of its operations in St Petersburgand was another step in the implementationof the Group’s multi-brand Retail footprint,providing broad segment coverage in whatis expected to be one of the fastest growingmarkets in the world.
In April,we announced further expansion inthis market with the acquisition of an initial75.1% shareholding in Musa Motors group,one of Russia’s largest car retailing groups,giving Inchcape a significant scale positionin Moscow through 16 sites with key globalbrand partners.The initial considerationwas £100.3m (see note 27 for details).Thisacquisition has positioned Inchcape withone of the largest networks of premiumbrands in Moscow.
In May we announced another landmarkin our expansion into the Chinese marketwith the official opening of our whollyowned Lexus retail centre in Shaoxing.
During the year we also sold our Frenchoperation to its management team for aconsideration of £7.6m.
DividendThe Board is not recommending thepayment of a final ordinary dividend for theyear in light of the current deterioration oftrading conditions (2007 – 10.5p).The Boardrecommended a half year dividend for 2008of 5.46p which reflected a 4.0% increase onthe half year 2007 dividend.
We currently do not expect to recommendany dividend for the financial year ending31 December 2009.
We intend to return to our stated aim ofmaintaining a progressive dividend policyas soon as trading conditions allow.
Share buy backThe Group purchased £16.0m of its sharesin 2008 through the acquisition of 4.5mshares,now held asTreasury shares atan average price of £3.59 per share.
Approach to governance andmanagementWe continue to focus on the importanceof good governance and observe theCombined Code and other relevantguidance for listed companies in our globaloperations. Integrating socially responsiblebehaviour into every aspect of how weoperate and define ourselves remains highon our agenda. In 2008 we have built onthe foundations of a global approach toCorporate Responsibility (CR) that is makingresponsible economic,environmental andsocial behaviour intrinsic to the way we work.
PeopleOur people strategy is to have engagedpeople in winning teams,creating theultimate customer experience for our brandpartners.On behalf of the Board, I wish toexpress thanks to our colleagues across theGroup for their commitment and spirit indelivering these results for 2008.
I would like tomake specialmention ofWilliamTsui,Chairman of InchcapeAsia-Pacific whosadly passed away in February 2009,after 18years with theGroup.Under his leadership,ourbusinesses in Hong Kong,Macau,Singapore,Brunei,Guam and Saipan consolidated theirmarket leading positions.LatterlyWilliamspearheaded our entry into China.Williamwill be remembered for his passion for themotor industry and our customers and forhis truly inspirational leadership.
Strengthening our capital structureThe Group has historically maintained whatwas considered to be an appropriate levelof borrowings given the prevailing economicenvironment.Given the prospect of a difficulttrading environment in 2009 and beyond,we intend to continue our actions to reducenet debt. In order to further strengthen theposition of the Group, the Board believes itis both appropriate and in the best interestsof its shareholders to raise net proceedsof approximately £232m in equity via aRights Issue which we announced on19 March 2009.
We intend to use the net proceedsof this Rights Issue to reduce the levelof indebtedness which in the short term
will increase headroom and delay therefinancing of existing facilities. In the longerterm,we expect that strengthening theGroup’s balance sheet through thisRights Issue together with the actionwe have taken to lower our cost base,our geographic spread and diversifiedrevenue streams,will better position usto take advantage of market recovery.
OutlookAlthough the Group expects tradingconditions to remain extremely challengingthroughout 2009 and the actual results forJanuary and February were well below lastyear, they have exceededmanagement’sexpectations in difficult markets,due to agood start to the year in Singapore anda stabilisation of UK used car margins.Currently,March order levels for the Group’sUK operations are in line with our revisedexpectations.The fundamentals of theGroup remain solid and our strategicdirection is clear.We have respondedquickly and decisively to global economicconditions.Our experiencedmanagementteams,our track record of operationalexcellence,our focus on superior customerservice and the strength of our relationshipswith our brand partners give us confidencethat we will successfully weather the currentstorm in our industry and emerge stronger.
Board changeAs previously announced, I will beretiring from the position of Non-executiveChairman in May 2009, following 14 yearswith the Company,six years as Group ChiefExecutive and three years as Chairman.I am delighted that Ken Hanna,who hasbeen a Non-executive Director of Inchcapefor six years, is to be appointed Non-executiveChairman of the Group with effect from14 May 2009.Ken has considerable skillsand expertise with a proven track recordboth at a financial and operational leveland as a Non-executive Director,as well asdirect experience of operating businessesin emerging and developedmarkets.
I have thoroughly enjoyed my years withInchcape,especially working with so manytalented colleagues both on the Board andin the business and I know that I am leavingthe Group in very good hands.
Peter JohnsonChairman
6
Inchcape plc Annual Report and Accounts 2008
Business review
Group Chief Executive’s review
André LacroixGroup Chief Executive Inchcape is a leading independent,
international automotive distributor andretailer,with scale operations in Australia,Belgium,Greece,Hong Kong,Russia,Singapore and the UK as well as operationsin 19 other markets.We represent some ofthe world’s leading automotive brands withwhomwe have long-standing relationships.
During 2008, the car industry facedunprecedented challenges as the economicdownturn spread rapidly across the world.
While Inchcape is not immune to thedownturn, I believe we are well placed toride it out successfully,based on the intrinsicstrengths of our business together with theprudent and decisive actions we are taking,so that we will be well positioned to capitaliseon market recovery.
We have more than 160 years of successfulinternational trade experience based ona pioneering spirit that has seen us at theforefront of every industry in which we haveparticipated.Our focus today is squarelyon the car market where we have beenan industry leading retailer and distributorfor many years.We continue to owe thispre-eminence to two fundamental factors:the resilience of our business model,andthe clarity of our vision and strategy.
In addition,we have an exceptional seniorteam with an in-depth knowledge of theautomotive industry and local markets andwho share a collective record of decisive,successful management in the face ofeconomic upheaval.
We are a provenindustry leader,solidly positionedfor market recovery.
7
www.inchcape.com
Businessreview
01-37Governa
nce38-57
Financia
lstatem
ents58-120
Shareho
lderinfo
rmation
Insideback
cover
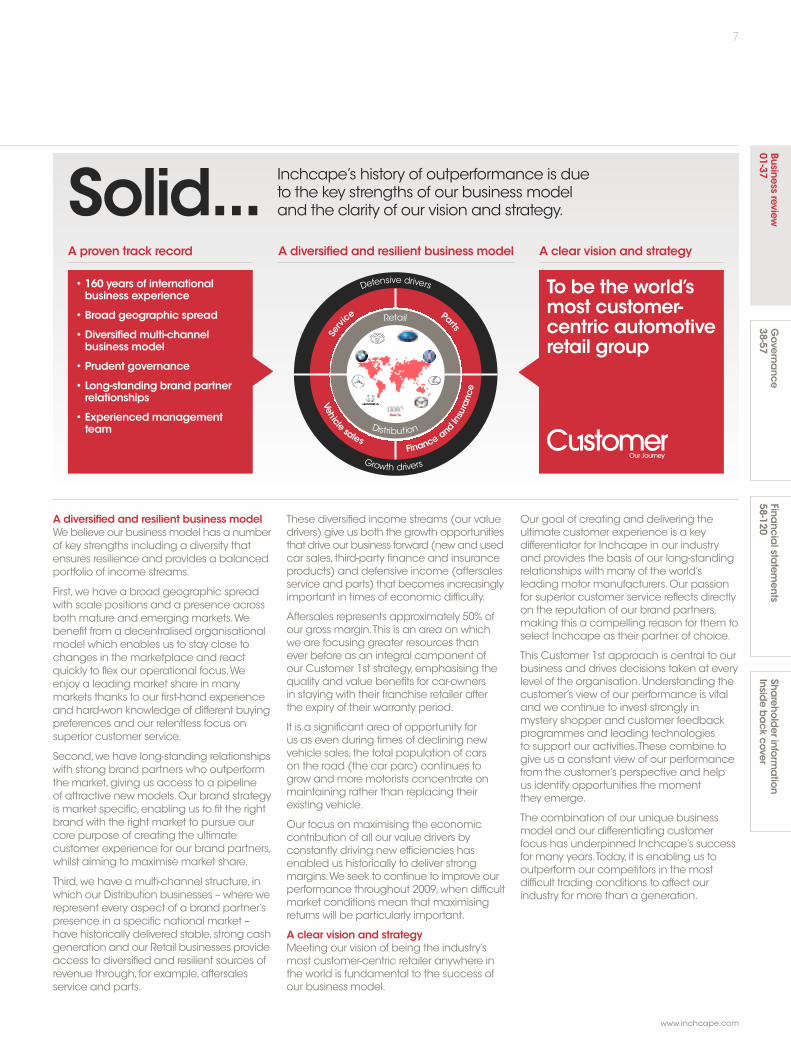
Solid...Aproven track record A diversified and resilient business model
• 160 years of internationalbusiness experience
• Broad geographic spread
• Diversified multi-channelbusiness model
• Prudent governance
• Long-standing brand partnerrelationships
• Experienced managementteam
A diversified and resilient business modelWebelieve our businessmodel has a numberof key strengths including a diversity thatensures resilience and provides a balancedportfolio of income streams.
First,we have a broad geographic spreadwith scale positions and a presence acrossboth mature and emerging markets.Webenefit from a decentralised organisationalmodel which enables us to stay close tochanges in the marketplace and reactquickly to flex our operational focus.Weenjoy a leading market share in manymarkets thanks to our first-hand experienceand hard-won knowledge of different buyingpreferences and our relentless focus onsuperior customer service.
Second,we have long-standing relationshipswith strong brand partners who outperformthe market,giving us access to a pipelineof attractive newmodels.Our brand strategyis market specific,enabling us to fit the rightbrand with the right market to pursue ourcore purpose of creating the ultimatecustomer experience for our brand partners,whilst aiming to maximise market share.
Third,we have amulti-channel structure, inwhich our Distribution businesses – where werepresent every aspect of a brand partner’spresence in a specific national market –have historically delivered stable,strong cashgeneration and our Retail businesses provideaccess to diversified and resilient sources ofrevenue through, for example,aftersalesservice and parts.
Inchcape’s history of outperformance is dueto the key strengths of our business modeland the clarity of our vision and strategy.
These diversified income streams (our valuedrivers) give us both the growth opportunitiesthat drive our business forward (newandusedcar sales, third-party finance and insuranceproducts) and defensive income (aftersalesservice and parts) that becomes increasinglyimportant in times of economic difficulty.
Aftersales represents approximately 50% ofour gross margin.This is an area on whichwe are focusing greater resources thanever before as an integral component ofour Customer 1st strategy,emphasising thequality and value benefits for car-ownersin staying with their franchise retailer afterthe expiry of their warranty period.
It is a significant area of opportunity forus as even during times of declining newvehicle sales, the total population of carson the road (the car parc) continues togrow andmore motorists concentrate onmaintaining rather than replacing theirexisting vehicle.
Our focus on maximising the economiccontribution of all our value drivers byconstantly driving new efficiencies hasenabled us historically to deliver strongmargins.We seek to continue to improve ourperformance throughout 2009,when difficultmarket conditions mean that maximisingreturns will be particularly important.
A clear vision and strategyMeeting our vision of being the industry’smost customer-centric retailer anywhere inthe world is fundamental to the success ofour business model.
To be the world’smost customer-centric automotiveretail group
A clear vision and strategy
Our goal of creating and delivering theultimate customer experience is a keydifferentiator for Inchcape in our industryand provides the basis of our long-standingrelationships with many of the world’sleading motor manufacturers.Our passionfor superior customer service reflects directlyon the reputation of our brand partners,making this a compelling reason for them toselect Inchcape as their partner of choice.
This Customer 1st approach is central to ourbusiness and drives decisions taken at everylevel of the organisation.Understanding thecustomer’s view of our performance is vitaland we continue to invest strongly inmystery shopper and customer feedbackprogrammes and leading technologiesto support our activities.These combine togive us a constant view of our performancefrom the customer’s perspective and helpus identify opportunities the momentthey emerge.
The combination of our unique businessmodel and our differentiating customerfocus has underpinned Inchcape’s successfor many years.Today, it is enabling us tooutperform our competitors in the mostdifficult trading conditions to affect ourindustry for more than a generation.
Financean
dInsurance
Vehicle sales
Growth drivers
Serv
ice
Defensive drivers
Parts
Retail
Distribution

8
Inchcape plc Annual Report and Accounts 2008
Business review
Group Chief Executive’s review continued
Responsive... We have been responsive to therapid and unprecedented industrydownturn and are proactivelymanaging the business with ahigh-impact programme.
1GrowingmarketshareFocusing on brandmanagement,customer funnelconversion,outstanding serviceand new productlaunches
2Growingaftersales
Furtherstrengtheningcustomer service,increasingcustomer retentionand enhancingproductivity
3Reducingcosts
Prompt action byreducing employeeheadcount,closingnon-profitable sitesand reducing allnon-essentialprogrammes
4ManagingworkingcapitalFocusing onworking capitalcontrol to bringinventory levelsin-line with marketdemand
5ReducingcapitalexpenditureReducingdiscretionarycapital expenditurein agreement withbrand partners
Our five key priorities
Managing the downturnWe have responded swiftly to the economicdownturn with decisive management actionto make our business even sharper,moreeffective andmore efficient.We believethis will help us both minimise the negativeimpact from the current downturn andprepare us to emerge stronger whenthe market recovers.We have narrowedour management focus to the five basicsof our business,our ‘five key priorities’:growing market share whilst protectingmargins;growing aftersales; reducing costs;managing working capital; and reducinguncommitted capital expenditure.
Focusing on these priorities now,meansthat we will be well-placed to takeadvantage of the growth opportunitiesthat come with recovery.
Market share growthGrowing market share whilst protectingmargins in our Retail businesses springsdirectly from our Customer 1st strategy,with afocus on traffic conversion through rigorous,disciplined sales processes and outstandinglevels of customer service.Further, in today’smarket,our ability to help customers gainaccess to the finance credit they need tobuy a car is a clear advantage. In ourDistribution businesses we will grow ourmarket share through disciplined marketingeffectiveness, taking full advantage of ourbrand partners’new product launches andoffering strong value for money propositionsto our customers.
Aftersales growthGrowing our aftersales business will comefrom focused service and parts marketing,a strong emphasis on retaining customersand providing outstanding levels of customerservice through, for example,our ‘VehicleHealth Check’.The key for us today is torecognise and respond to every transactionas an opportunity to build a long-termcustomer relationship that delivers valueto both parties.This is central to ourCustomer 1st strategy.
Further, in our aftersales workshops,wecontinue to apply ourselves to drivingproductivity enhancement and thereforegross margin.
Cost reductionIn terms of cost saving,we already haveamajor restructuring programme underway that will deliver an annualised benefitof approximately £58m,based on 2009exchange rates.This includes a 12%reduction of our global workforce, tight newrestrictions on travel and a retail site andoffice rationalisation which by the first halfof 2009 will have resulted in the closure of24 less profitable sites,comprising 16 retailcentres,one used car centre and onePDI centre in the UK, two retail centres inGreece and four in the Baltics.The Grouphas implemented a general hiring freezeand a policy of no salary increases in 2009or management bonuses for 2008.
Additionally,we are negotiating harderthan ever before on everything we spendand successfully taking advantage ofreduced advertising media costs.
Working capital managementManaging our working capital as efficientlyas possible is a top priority right across thebusiness.Unsold stock on forecourts is amajor expense for any motor retailer andwe have set stock reduction targets acrossthe Group.We have the support of ourbrand partners to match our inventorylevels to the newmarket demand,whichis successfully helping us to contain ourworking capital levels.
Capital expenditure reductionOur forward capital expenditure programmeis largely driven by the agreements we havein place with our brand partners,some ofwhich commit us to building new retailcentres in an agreed expansion timetable.The excellent relationships we have withour brand partners however,mean wehave been able to defer some projects.In addition,we are slowing some aspectsof the implementation of our new SAPsystem across the Group,while streamliningits adoption in our Retail business to benefitas rapidly as possible from its maincommercial advantages.
p11 p12 p13 p14 p15
9
www.inchcape.com
Businessreview
01-37Governa
nce38-57
Financia
lstatem
ents58-120
Shareho
lderinfo
rmation
Insideback
cover
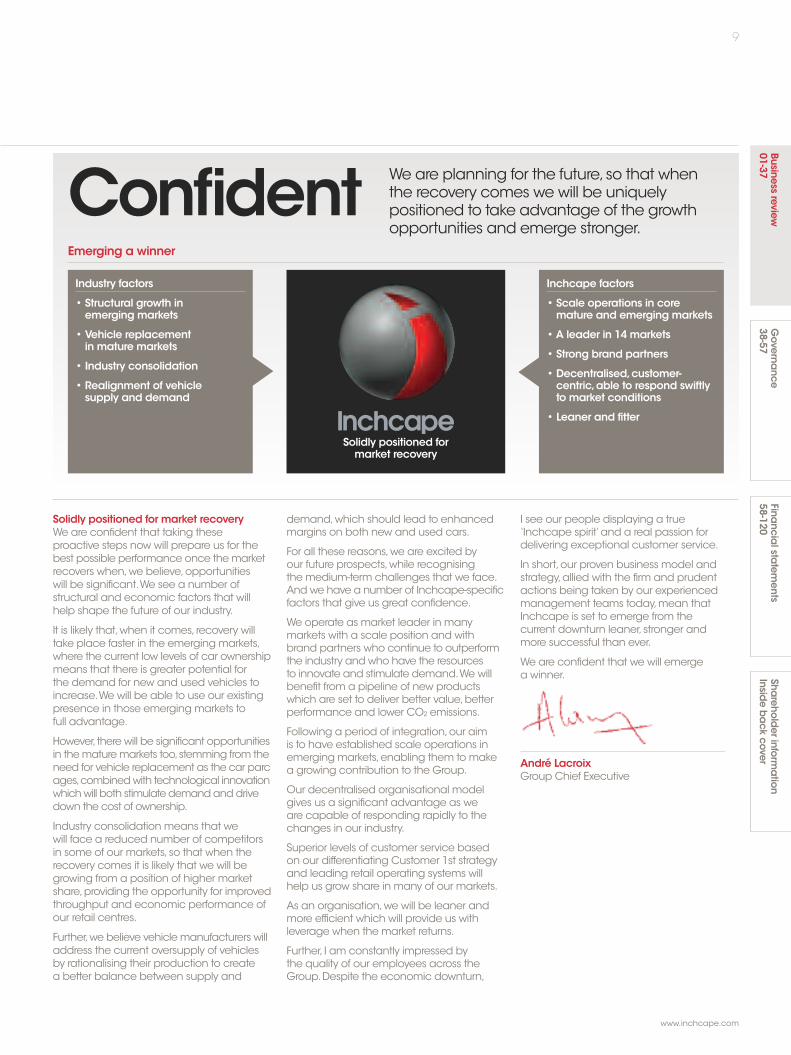
Confident We are planning for the future,so that whenthe recovery comes we will be uniquelypositioned to take advantage of the growthopportunities and emerge stronger.
Solidly positioned for market recoveryWe are confident that taking theseproactive steps now will prepare us for thebest possible performance once themarketrecovers when,we believe,opportunitieswill be significant.We see a number ofstructural and economic factors that willhelp shape the future of our industry.
It is likely that,when it comes, recovery willtake place faster in the emerging markets,where the current low levels of car ownershipmeans that there is greater potential forthe demand for new and used vehicles toincrease.We will be able to use our existingpresence in those emerging markets tofull advantage.
However,there will be significant opportunitiesin thematuremarkets too,stemming from theneed for vehicle replacement as the car parcages,combinedwith technological innovationwhichwill both stimulate demandand drivedown the cost of ownership.
Industry consolidation means that wewill face a reduced number of competitorsin some of our markets,so that when therecovery comes it is likely that we will begrowing from a position of higher marketshare,providing the opportunity for improvedthroughput and economic performance ofour retail centres.
Further,we believe vehiclemanufacturers willaddress the current oversupply of vehiclesby rationalising their production to createa better balance between supply and
demand,which should lead to enhancedmargins on both new and used cars.
For all these reasons,we are excited byour future prospects,while recognisingthe medium-term challenges that we face.And we have a number of Inchcape-specificfactors that give us great confidence.
We operate as market leader in manymarkets with a scale position and withbrand partners who continue to outperformthe industry and who have the resourcesto innovate and stimulate demand.We willbenefit from a pipeline of new productswhich are set to deliver better value,betterperformance and lower CO2 emissions.
Following a period of integration,our aimis to have established scale operations inemerging markets,enabling them to makea growing contribution to the Group.
Our decentralised organisational modelgives us a significant advantage as weare capable of responding rapidly to thechanges in our industry.
Superior levels of customer service basedon our differentiating Customer 1st strategyand leading retail operating systems willhelp us grow share in many of our markets.
As an organisation,we will be leaner andmore efficient which will provide us withleverage when the market returns.
Further, I am constantly impressed bythe quality of our employees across theGroup.Despite the economic downturn,
I see our people displaying a true‘Inchcape spirit’and a real passion fordelivering exceptional customer service.
In short,our proven business model andstrategy,allied with the firm and prudentactions being taken by our experiencedmanagement teams today,mean thatInchcape is set to emerge from thecurrent downturn leaner,stronger andmore successful than ever.
We are confident that we will emergea winner.
André LacroixGroup Chief Executive
Emerging a winner
Industry factors
• Structural growth inemerging markets
• Vehicle replacementin mature markets
• Industry consolidation
• Realignment of vehiclesupply and demand
Inchcape factors
• Scale operations in coremature and emerging markets
• A leader in 14 markets
• Strong brand partners
• Decentralised,customer-centric,able to respond swiftlyto market conditions
• Leaner and fitter
Solidly positioned formarket recovery
10
Our management teamacross the Group haveresponded decisively tothe challenging marketclimate and haveadapted quickly to focustheir attention on theimportant areas thatare fundamental to thefuture of our business
André LacroixGroup Chief Executive
Focused on the fundamentals
Responding quicklyActing decisively
11
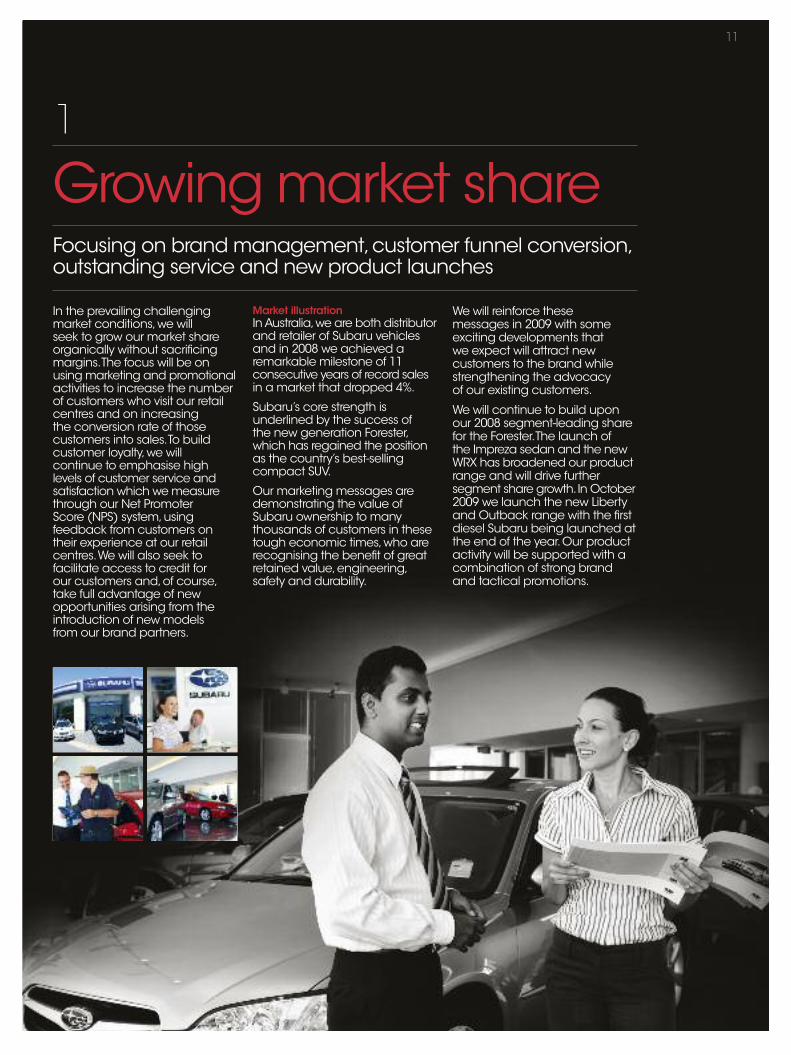
Growingmarket shareFocusing on brandmanagement,customer funnel conversion,outstanding service and new product launches
1
In the prevailing challengingmarket conditions,we willseek to grow our market shareorganically without sacrificingmargins.The focus will be onusingmarketing and promotionalactivities to increase the numberof customers who visit our retailcentres and on increasingthe conversion rate of thosecustomers into sales.To buildcustomer loyalty,we willcontinue to emphasise highlevels of customer service andsatisfaction which wemeasurethrough our Net PromoterScore (NPS) system,usingfeedback from customers ontheir experience at our retailcentres.We will also seek tofacilitate access to credit forour customers and,of course,take full advantage of newopportunities arising from theintroduction of newmodelsfrom our brand partners.
Market illustrationInAustralia,we are both distributorand retailer of Subaru vehiclesand in 2008 we achieved aremarkable milestone of 11consecutive years of record salesin a market that dropped 4%.
Subaru’s core strength isunderlined by the success ofthe new generation Forester,which has regained the positionas the country’s best-sellingcompact SUV.
Our marketing messages aredemonstrating the value ofSubaru ownership to manythousands of customers in thesetough economic times,who arerecognising the benefit of greatretained value,engineering,safety and durability.
We will reinforce thesemessages in 2009 with someexciting developments thatwe expect will attract newcustomers to the brand whilestrengthening the advocacyof our existing customers.
We will continue to build uponour 2008 segment-leading sharefor the Forester.The launch ofthe Impreza sedan and the newWRX has broadened our productrange and will drive furthersegment share growth.In October2009 we launch the new Libertyand Outback range with the firstdiesel Subaru being launched atthe end of the year.Our productactivity will be supported with acombination of strong brandand tactical promotions.

12
2
Aftersales revenues havehistorically shown a greaterresilience tomarket downturnsthan new car sales,as theaftersales market is drivenmore by the size and age ofthe car parc and technologicaladvances than it is by newcar sales.Accordingly,we areimplementing a number ofactions to help maximise thebenefits of the aftersales revenuestream andmaintain long-termconsumer relationships.Keymeasures being undertakeninclude focusing marketingand sales efforts on the retentionof customers who are nearingthe end of the warranty periodon their new vehicle.There willalso be a focus on the use ofmanagement tools such ascapture rate,vehicle healthcheck and the NPS system tomonitor customer satisfactionand increase customer retention.
Market illustrationAtMazda Hong Kongwe haveapplied a strong focus onretaining customers of vehiclesover three years old.As a resultof effective local marketing
and adapting our serviceofferings to cars of different ageswe have increased service loyaltylevels significantly.
Flexible,pre-paidmaintenanceservice packages includeadditional benefits like prioritybooking and a free odourisingtreatment.We also offer a pre-inspection safety test packagewith special discounts onreplacement parts.
Packages for newer vehicleshave been developed too,like our 12-step exterior surfacetreatment, interior cleansing andengine compartment cleaning.
Growing aftersalesFurther strengthening customer service, increasingcustomer retention and enhancing productivity

13
Reducing costsPrompt action by reducing employee headcount,closingnon-profitable sites and reducing all non-essential programmes
3
As a result of prompt actionstaken to reduce the Group’s costbase to reflect the deterioration inmarket conditions,our workforcehas been reduced by more than2,000 people across the Group.
In addition,24 less profitablesites,comprising 16 retail centres,one used car centre and onePDI centre in the UK, two retailcentres in Greece and four inthe Baltics will be closed by thefirst half of 2009.The Group hasimplemented a general hiringfreeze and a policy of no salary
increases in 2009ormanagementbonuses for 2008.Further,wehave tight new restrictions ontravel.The cost of the restructuringwill be approximately £28.3m,with an expected annualsaving of approximately £58mat 2009 exchange rates from2009 onwards.
We will continue to monitorclosely and review our cost basein light of the prevailing tradingandmarket conditions to ensurethat it reflects appropriately ourongoing requirements.
Annualised benefit
£58m

Managingworking capitalFocusing on working capital control to bringinventory levels in line with market demand
4
14
As a result of the abrupt salesdeclines in many of our marketsand the long lead time on ordersfor new vehicles placed with ourbrand partners, inventory levelshave been higher than desirable.Vehicle orders were reducedduring the second half of 2008to reflect the prevailing marketconditions and we are seekingto reduce significantly the level ofinventory held across the Group’sDistribution and Retail businesses.
We are also targeting areduction in the length of timevehicles will remain in inventoryat current levels of trading.Specific sales incentives havebeen put in place with the aimof accelerating this reduction, inparticular in respect of vehicleswhich have been in inventory forover six months.
Market illustrationIn the UK,we have taken decisivemanagement action to addressour used car stock.In addition to adisciplined approach to reviewingdaily stock lists and applyingtight pricing management,wehave introduced an even firmerapproval process for all buyingof used cars.
Further, through our strongrelationships with our brandpartners,we have reduced thenumber of demonstrator vehiclesthat we hold in stock.Along withan incentive programme to drivedown inventory, this has led to asubstantial improvement in ourUK working capital and vehiclestock position.

15
Reducing capitalexpenditureReducing discretionary capital expenditurein agreement with brand partners
5
We are confident that our recentinvestments have placed us in astrong position to benefit whenthe markets rebound.Therewill be considerable pent-upconsumer demand in emergingmarkets,based on low levels ofcar ownership,and we believeour scale position in theseterritories will reap their reward.While we are putting on hold anyuncommitted new investments,we are completing projects thatare already under way andhonouring our commitments
to our brand partners,with whomwe have excellent relationships.This has meant that we havebeen able to defer some projectsand should we see furthermarket deterioration,we havescope for additional deferment.
Further,capital outlay on ournew SAP system has beenslowed whilst at the same timewe are accelerating its roll-outinto our Retail businesses,suchthat we can take advantage ofearlier gains from this investment.
16
Inchcape plc Annual Report and Accounts 2008
Business review
Operating review
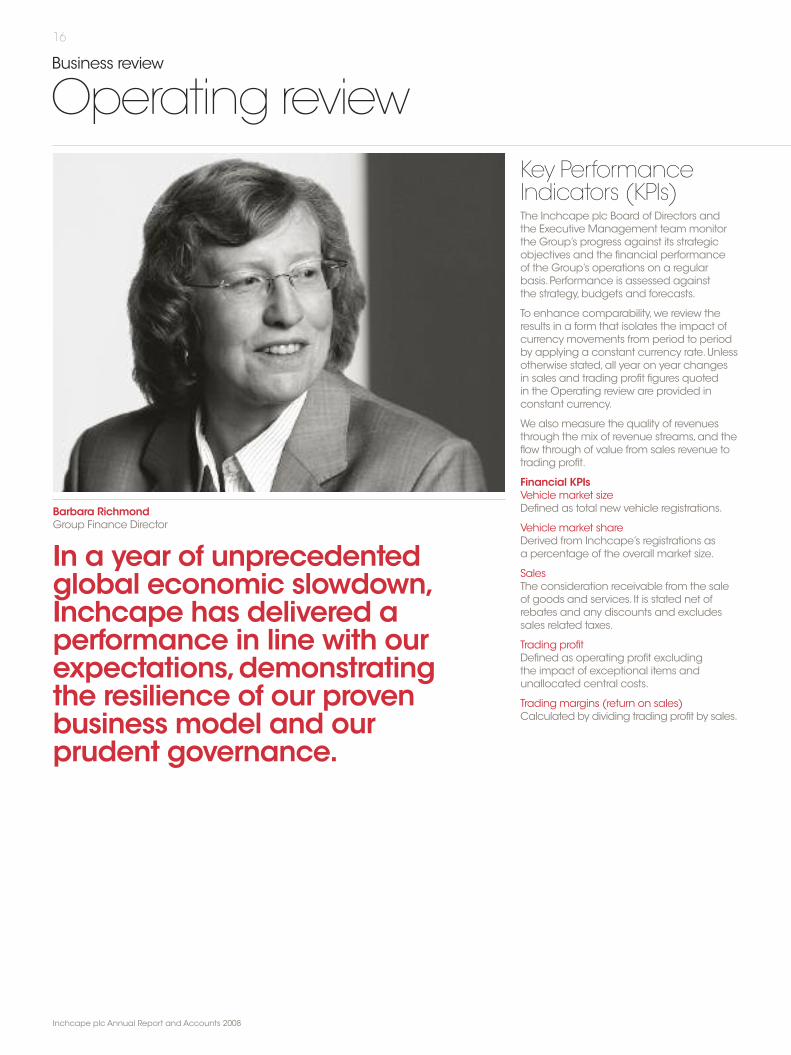
Barbara RichmondGroup Finance Director
Key PerformanceIndicators (KPIs)The Inchcape plc Board of Directors andthe Executive Management teammonitorthe Group’s progress against its strategicobjectives and the financial performanceof the Group’s operations on a regularbasis.Performance is assessed againstthe strategy,budgets and forecasts.
To enhance comparability,we review theresults in a form that isolates the impact ofcurrency movements from period to periodby applying a constant currency rate.Unlessotherwise stated,all year on year changesin sales and trading profit figures quotedin the Operating review are provided inconstant currency.
We also measure the quality of revenuesthrough the mix of revenue streams,and theflow through of value from sales revenue totrading profit.
Financial KPIsVehicle market sizeDefined as total new vehicle registrations.
Vehicle market shareDerived from Inchcape’s registrations asa percentage of the overall market size.
SalesThe consideration receivable from the saleof goods and services. It is stated net ofrebates and any discounts and excludessales related taxes.
Trading profitDefined as operating profit excludingthe impact of exceptional items andunallocated central costs.
Trading margins (return on sales)Calculated by dividing trading profit by sales.
In a year of unprecedentedglobal economic slowdown,Inchcape has delivered aperformance in line with ourexpectations,demonstratingthe resilience of our provenbusiness model and ourprudent governance.
17
www.inchcape.com
Businessreview
01-37Governa
nce38-57
Financia
lstatem
ents58-120
Shareho
lderinfo
rmatio
nInsid
eback
cover
Like for like sales and like for like trading profitExcludes the impact of acquisitions from thedate of acquisition until the thirteenth monthof ownership and businesses that are sold orclosed. It further removes the impact of retailcentres that are relocated.This is from thedate of opening until the thirteenth monthof trading in the new location.
Group profit before taxThe profit made after operating and interestexpense but before tax is charged.
Group working capitalDefined as inventory, receivables,payablesand supplier-related credit.
Operating cash flowDefined as trading profit adjusted fordepreciation and amortisation plus thechange in working capital.
Non-financial KPIsWe continue to measure several non-financial KPIs,particularly regardingcustomer service, relating to both thepurchase of new and used vehicles andalso aftersales.For example,Net PromoterScore (NPS) is being used to measurecustomer satisfaction across the Group,in line with our vision to be the world’s mostcustomer-centric automotive retailer.
Further,wemeasure employee engagementGroup-wide through our annual Heartbeatsurvey conducted in partnership with Gallup.
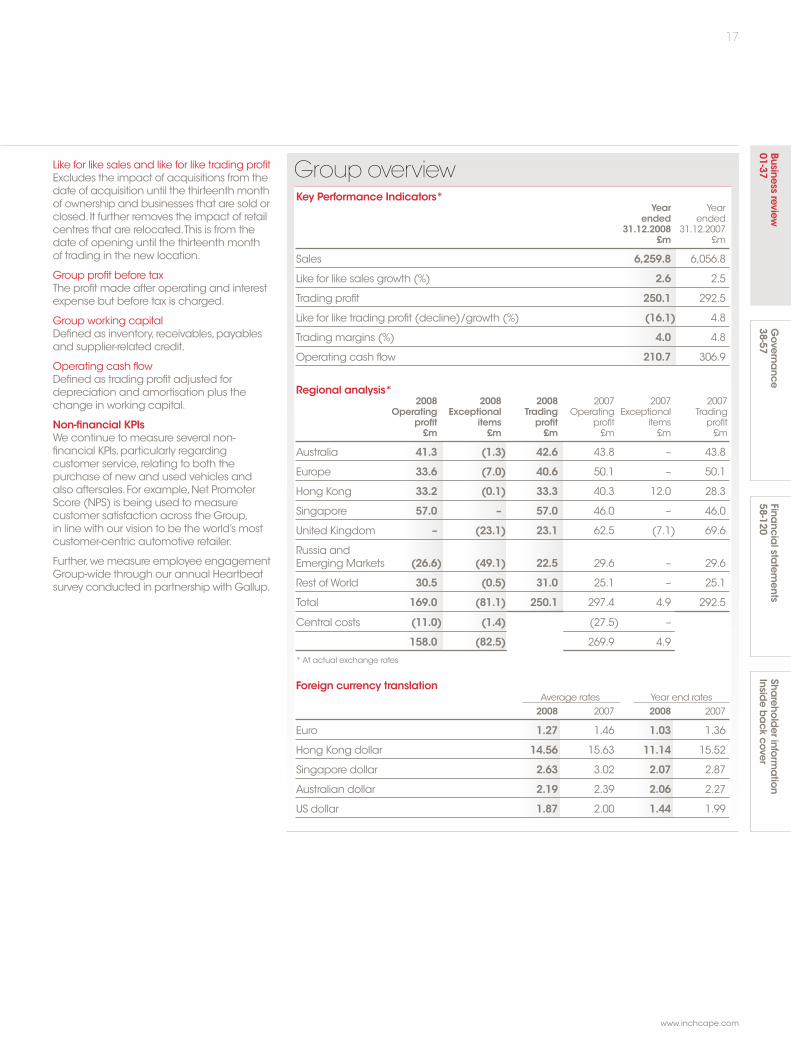
Group overviewKey Performance Indicators*
Year Yearended ended
31.12.2008 31.12.2007£m £m
Sales 6,259.8 6,056.8
Like for like sales growth (%) 2.6 2.5
Trading profit 250.1 292.5
Like for like trading profit (decline)/growth (%) (16.1) 4.8
Trading margins (%) 4.0 4.8
Operating cash flow 210.7 306.9
Regional analysis*2008 2008 2008 2007 2007 2007
Operating Exceptional Trading Operating Exceptional Tradingprofit items profit profit items profit£m £m £m £m £m £m
Australia 41.3 (1.3) 42.6 43.8 – 43.8
Europe 33.6 (7.0) 40.6 50.1 – 50.1
Hong Kong 33.2 (0.1) 33.3 40.3 12.0 28.3
Singapore 57.0 – 57.0 46.0 – 46.0
United Kingdom – (23.1) 23.1 62.5 (7.1) 69.6
Russia andEmerging Markets (26.6) (49.1) 22.5 29.6 – 29.6
Rest ofWorld 30.5 (0.5) 31.0 25.1 – 25.1
Total 169.0 (81.1) 250.1 297.4 4.9 292.5
Central costs (11.0) (1.4) (27.5) –
158.0 (82.5) 269.9 4.9
* At actual exchange rates
Foreign currency translationAverage rates Year end rates2008 2007 2008 2007
Euro 1.27 1.46 1.03 1.36
Hong Kong dollar 14.56 15.63 11.14 15.52
Singapore dollar 2.63 3.02 2.07 2.87
Australian dollar 2.19 2.39 2.06 2.27
US dollar 1.87 2.00 1.44 1.99

economic downturn resulting in a like forlike trading profit decline of 84.2% with theBaltics particularly affected.
Our Rest ofWorld segment delivered strongresults with like for like sales growth of 11.2%and like for like trading profit growth of 16.4%contributing a total trading profit for 2008of £30.8m.
Retail businessOur Retail businesses have been significantlyaffected by the global decline and overallwe saw a reduction in like for like sales of3.5%.Total trading profit decreased by 36.6%.
In the UK we continue to outperform. In amarket which declined by 11% our like forlike sales reduced by 5.4%.Trading marginsreduced from 2.4% to 1.2%.
Across Europe we continue to drive ourturnaround strategy. In 2008, like for likerevenues declined by 1.2%,delivering atotal trading profit of £0.7m.
In our Russia and EmergingMarkets segment,like for like sales increased by 3.8%, resultingin a total trading profit of £18.6m, largely dueto our recent acquisitions in Russia.
Distribution businessAlthough like for like sales were 5.2% downversus 2007, trading margins remainedbuoyant at 7.3%,delivering a total tradingprofit of £192.9m.
Across Europe,we delivered some solidresults in the face of significantly reducedmarkets.Our GreekToyota and Lexusbusiness retained its market leadershipposition to deliver trading profit growth of6.6%.The Belgian market grew 2%,partlyaided by the biennial motor show,howeverour share declined by 1.0ppt, resulting ina 12.8% decline in like for like sales.
The markets in Asia continued to be verycompetitive,with the market in Hong Konggrowing 7% for the full year,but declining by41% in Q4. In Singapore,market conditionswere challenging,as expected,and themarket declined by 13% (excluding parallelimports).However,with strong marketingcampaigns and newmodel launchestogether with the impact of the appreciationof theYen on our competitors,we achieveda 7.9% increase in trading profit.
Our Russia and Emerging Markets segmenthas been significantly affected by the
18
Inchcape plc Annual Report and Accounts 2008
Business review
Operating review continued
GroupThe prevailing conditions in the globalfinancial markets have significantly affectedthe demand for,and price levels of,newand used vehicles.
In Q4 2008 most of our markets experienceda significant downturn: the UK declined27%;Hong Kong 41%;Greece 21% andAustralia 15%.
These significant market declines havecontributed to a decline in our Groupoperating profit,before exceptional items,of 17.4% for the full year, from sales whichdeclined by 3.3%.This compares to the firstsix months where we reported operatingprofit growth of 13.4% before exceptionals,on sales which grew by 5.1%.
The sales decline was however partiallymitigated by a solid performance fromaftersales,on which our like for like revenuesgrew by 4.2% for the Group for the fullyear compared to 2007.This is an area ofsignificant opportunity which has receivedan increasing focus through 2008 and willcontinue to do so in 2009 and beyond.
We responded swiftly to the market declineby reducing our cost base,closing 24 lessprofitable sites, reducing our workforce bymore than 2,000 people and implementingother restructuring measures which areexpected to generate an annualised savingof approximately £58m at 2009 exchangerates.These actions have resulted in anexceptional charge in 2008 of £28.3mtogether with a charge of £54.2m forgoodwill impairment largely due to thedownturn in Latvia.
We continue to reflect our managementstructure in our reporting by separatelyproviding an analysis of the two segmentsof our business,Retail and Distribution,bygeographical region.We have continued ourexpansion into emergingmarkets,particularlyin the strategically important Russian market.We continue to include Russia,China, theBalkans, the Baltics and Poland within theRussia and Emerging Markets segment onthe basis that these markets have started togrow but have yet to reach amature stageof development and accordingly are in thegrowth phase of the development cycle.We have re-named the segment ‘Russiaand Emerging Markets’ in our reporting.
19
www.inchcape.com
Businessreview
01-37Governa
nce38-57
Financia
lstatem
ents58-120
Shareho
lderinfo
rmatio
nInsid
eback
cover
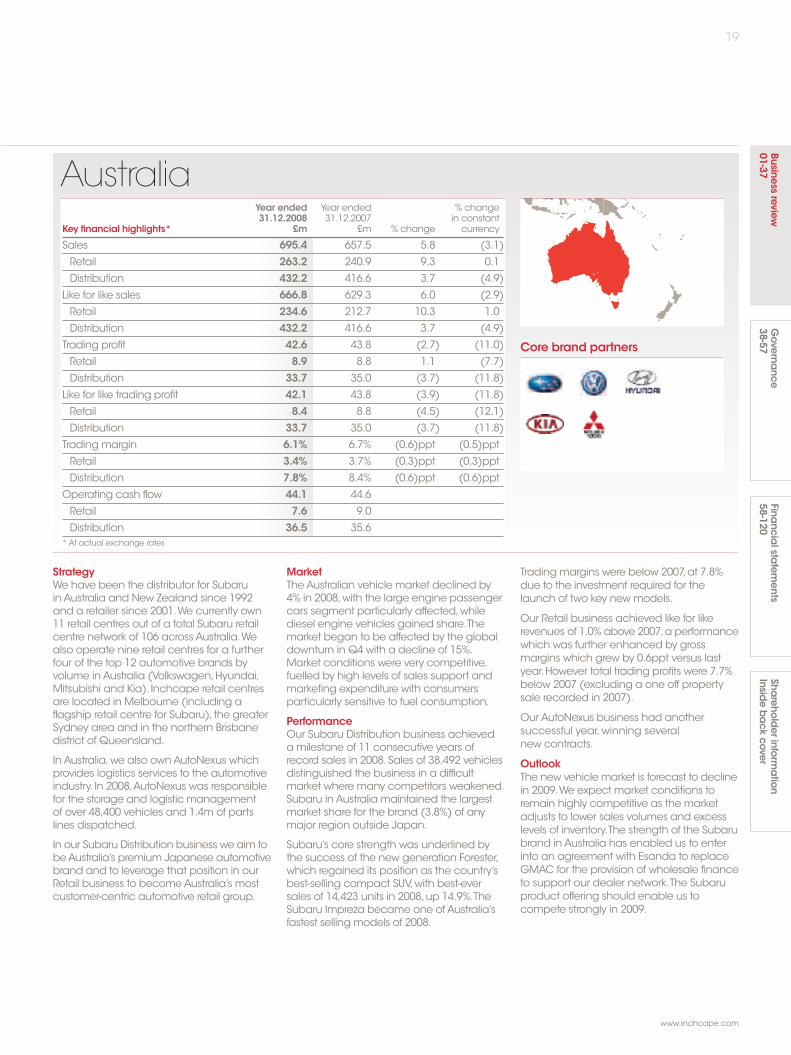
AustraliaYear ended Year ended % change31.12.2008 31.12.2007 in constant
Key financial highlights* £m £m % change currency
Sales 695.4 657.5 5.8 (3.1)
Retail 263.2 240.9 9.3 0.1
Distribution 432.2 416.6 3.7 (4.9)
Like for like sales 666.8 629.3 6.0 (2.9)
Retail 234.6 212.7 10.3 1.0
Distribution 432.2 416.6 3.7 (4.9)
Trading profit 42.6 43.8 (2.7) (11.0)
Retail 8.9 8.8 1.1 (7.7)
Distribution 33.7 35.0 (3.7) (11.8)
Like for like trading profit 42.1 43.8 (3.9) (11.8)
Retail 8.4 8.8 (4.5) (12.1)
Distribution 33.7 35.0 (3.7) (11.8)
Trading margin 6.1% 6.7% (0.6)ppt (0.5)ppt
Retail 3.4% 3.7% (0.3)ppt (0.3)ppt
Distribution 7.8% 8.4% (0.6)ppt (0.6)ppt
Operating cash flow 44.1 44.6
Retail 7.6 9.0
Distribution 36.5 35.6* At actual exchange rates
Core brand partners
StrategyWe have been the distributor for Subaruin Australia and New Zealand since 1992and a retailer since 2001.We currently own11 retail centres out of a total Subaru retailcentre network of 106 across Australia.Wealso operate nine retail centres for a furtherfour of the top 12 automotive brands byvolume inAustralia (Volkswagen,Hyundai,Mitsubishi and Kia). Inchcape retail centresare located in Melbourne (including aflagship retail centre for Subaru), the greaterSydney area and in the northern Brisbanedistrict of Queensland.
In Australia,we also ownAutoNexus whichprovides logistics services to the automotiveindustry. In 2008,AutoNexus was responsiblefor the storage and logistic managementof over 48,400 vehicles and 1.4m of partslines dispatched.
In our Subaru Distribution business we aim tobeAustralia’s premium Japanese automotivebrand and to leverage that position in ourRetail business to becomeAustralia’s mostcustomer-centric automotive retail group.
MarketTheAustralian vehicle market declined by4% in 2008,with the large engine passengercars segment particularly affected,whilediesel engine vehicles gained share.Themarket began to be affected by the globaldownturn in Q4 with a decline of 15%.Market conditions were very competitive,fuelled by high levels of sales support andmarketing expenditure with consumersparticularly sensitive to fuel consumption.
PerformanceOur Subaru Distribution business achievedamilestone of 11 consecutive years ofrecord sales in 2008.Sales of 38,492 vehiclesdistinguished the business in a difficultmarket where many competitors weakened.Subaru in Australia maintained the largestmarket share for the brand (3.8%) of anymajor region outside Japan.
Subaru’s core strength was underlined bythe success of the new generation Forester,which regained its position as the country’sbest-selling compact SUV,with best-eversales of 14,423 units in 2008,up 14.9%.TheSubaru Impreza became one of Australia’sfastest selling models of 2008.
Trading margins were below 2007,at 7.8%due to the investment required for thelaunch of two key newmodels.
Our Retail business achieved like for likerevenues of 1.0% above 2007,a performancewhich was further enhanced by grossmargins which grew by 0.6ppt versus lastyear.However total trading profits were 7.7%below 2007 (excluding a one off propertysale recorded in 2007).
Our AutoNexus business had anothersuccessful year,winning severalnew contracts.
OutlookThe new vehicle market is forecast to declinein 2009.We expect market conditions toremain highly competitive as the marketadjusts to lower sales volumes and excesslevels of inventory.The strength of the Subarubrand in Australia has enabled us to enterinto an agreement with Esanda to replaceGMAC for the provision of wholesale financeto support our dealer network.The Subaruproduct offering should enable us tocompete strongly in 2009.
Europe
Core brand partners
20
Inchcape plc Annual Report and Accounts 2008
Business review
Operating review continued
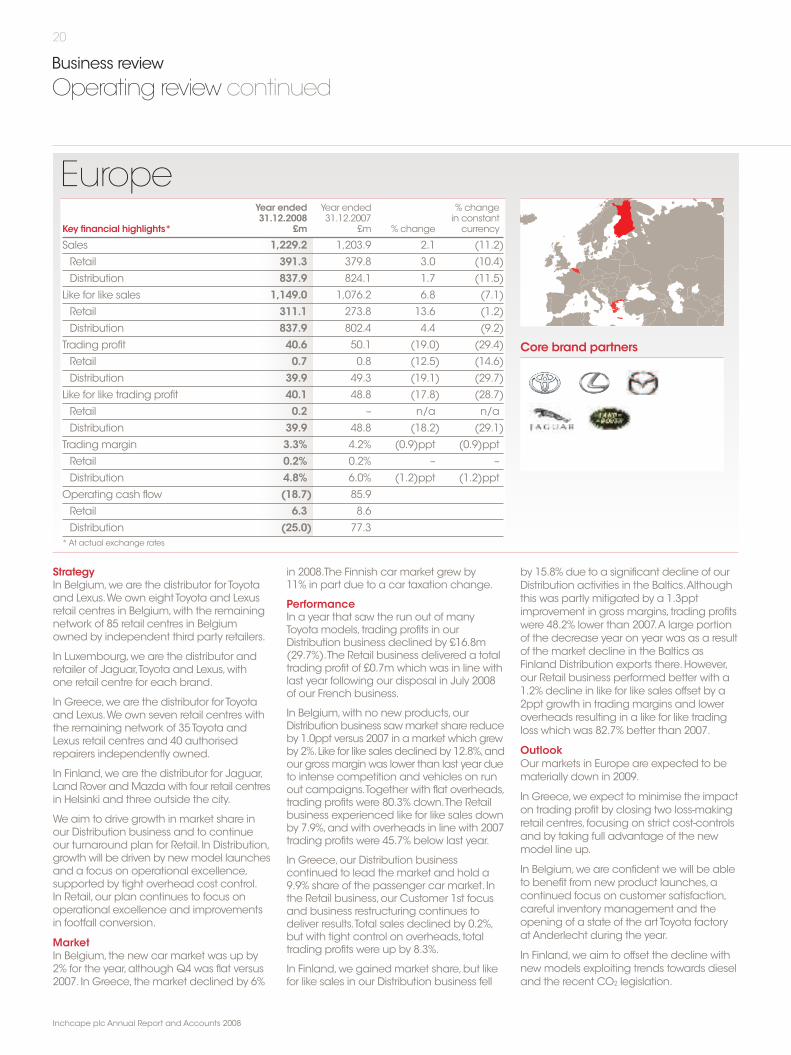
Year ended Year ended % change31.12.2008 31.12.2007 in constant
Key financial highlights* £m £m % change currency
Sales 1,229.2 1,203.9 2.1 (11.2)
Retail 391.3 379.8 3.0 (10.4)
Distribution 837.9 824.1 1.7 (11.5)
Like for like sales 1,149.0 1,076.2 6.8 (7.1)
Retail 311.1 273.8 13.6 (1.2)
Distribution 837.9 802.4 4.4 (9.2)
Trading profit 40.6 50.1 (19.0) (29.4)
Retail 0.7 0.8 (12.5) (14.6)
Distribution 39.9 49.3 (19.1) (29.7)
Like for like trading profit 40.1 48.8 (17.8) (28.7)
Retail 0.2 – n/a n/a
Distribution 39.9 48.8 (18.2) (29.1)
Trading margin 3.3% 4.2% (0.9)ppt (0.9)ppt
Retail 0.2% 0.2% – –
Distribution 4.8% 6.0% (1.2)ppt (1.2)ppt
Operating cash flow (18.7) 85.9
Retail 6.3 8.6
Distribution (25.0) 77.3* At actual exchange rates
StrategyIn Belgium,we are the distributor for Toyotaand Lexus.We own eight Toyota and Lexusretail centres in Belgium,with the remainingnetwork of 85 retail centres in Belgiumowned by independent third party retailers.
In Luxembourg,we are the distributor andretailer of Jaguar,Toyota and Lexus,withone retail centre for each brand.
In Greece,we are the distributor for Toyotaand Lexus.We own seven retail centres withthe remaining network of 35Toyota andLexus retail centres and 40 authorisedrepairers independently owned.
In Finland,we are the distributor for Jaguar,Land Rover andMazdawith four retail centresin Helsinki and three outside the city.
We aim to drive growth in market share inour Distribution business and to continueour turnaround plan for Retail. In Distribution,growth will be driven by newmodel launchesand a focus on operational excellence,supported by tight overhead cost control.In Retail,our plan continues to focus onoperational excellence and improvementsin footfall conversion.
MarketIn Belgium,the new car market was up by2% for the year,although Q4 was flat versus2007. In Greece, the market declined by 6%
in 2008.The Finnish car market grew by11% in part due to a car taxation change.
PerformanceIn a year that saw the run out of manyToyota models, trading profits in ourDistribution business declined by £16.8m(29.7%).The Retail business delivered a totaltrading profit of £0.7m which was in line withlast year following our disposal in July 2008of our French business.
In Belgium,with no new products,ourDistribution business sawmarket share reduceby 1.0ppt versus 2007 in amarket which grewby 2%.Like for like sales declined by 12.8%,andour grossmargin was lower than last year dueto intense competition and vehicles on runout campaigns.Together with flat overheads,trading profits were 80.3% down.The Retailbusiness experienced like for like sales downby 7.9%,and with overheads in line with 2007trading profits were 45.7% below last year.
In Greece,our Distribution businesscontinued to lead the market and hold a9.9% share of the passenger car market. Inthe Retail business,our Customer 1st focusand business restructuring continues todeliver results.Total sales declined by 0.2%,but with tight control on overheads, totaltrading profits were up by 8.3%.
In Finland,we gainedmarket share,but likefor like sales in our Distribution business fell
by 15.8% due to a significant decline of ourDistribution activities in the Baltics.Althoughthis was partly mitigated by a 1.3pptimprovement in gross margins, trading profitswere 48.2% lower than 2007.A large portionof the decrease year on year was as a resultof the market decline in the Baltics asFinland Distribution exports there.However,our Retail business performed better with a1.2% decline in like for like sales offset by a2ppt growth in trading margins and loweroverheads resulting in a like for like tradingloss which was 82.7% better than 2007.
OutlookOur markets in Europe are expected to bematerially down in 2009.
In Greece,we expect to minimise the impacton trading profit by closing two loss-makingretail centres, focusing on strict cost-controlsand by taking full advantage of the newmodel line up.
In Belgium,we are confident we will be ableto benefit from new product launches,acontinued focus on customer satisfaction,careful inventory management and theopening of a state of the art Toyota factoryat Anderlecht during the year.
In Finland,we aim to offset the decline withnewmodels exploiting trends towards dieseland the recent CO2 legislation.
Hong Kong
Core brand partners
21
www.inchcape.com
Businessreview
01-37Governa
nce38-57
Financia
lstatem
ents58-120
Shareho
lderinfo
rmatio
nInsid
eback
cover
Year ended Year ended % change31.12.2008 31.12.2007 in constant
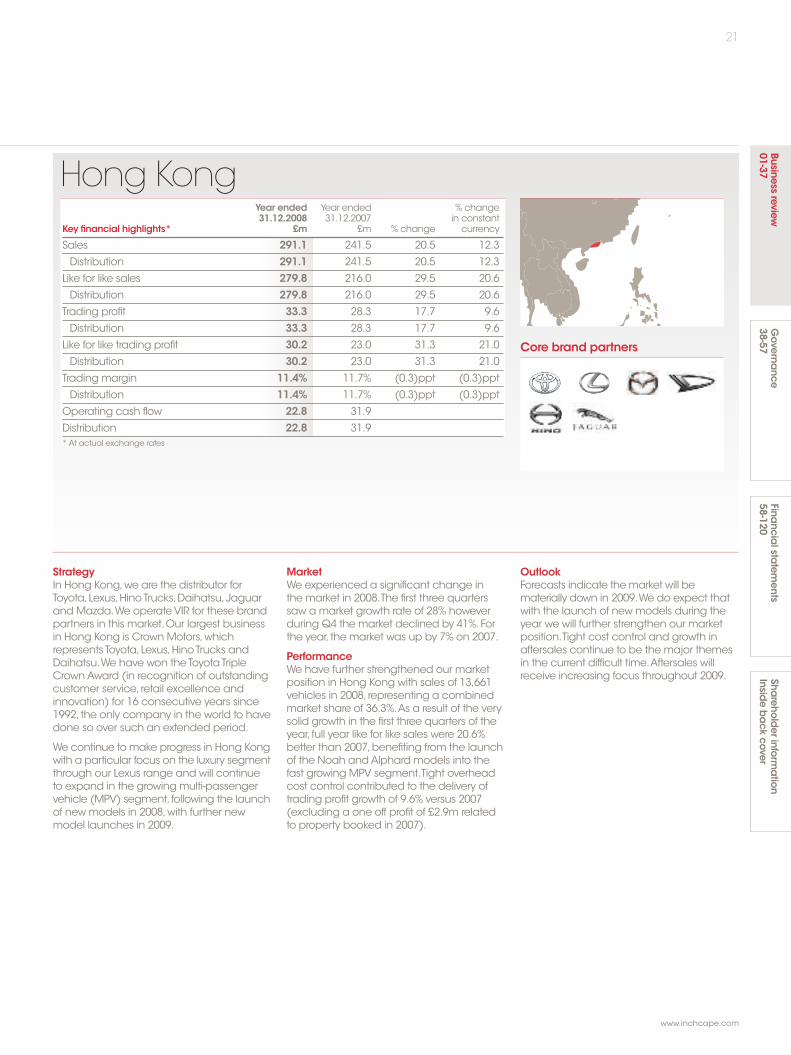
Key financial highlights* £m £m % change currency
Sales 291.1 241.5 20.5 12.3
Distribution 291.1 241.5 20.5 12.3
Like for like sales 279.8 216.0 29.5 20.6
Distribution 279.8 216.0 29.5 20.6
Trading profit 33.3 28.3 17.7 9.6
Distribution 33.3 28.3 17.7 9.6
Like for like trading profit 30.2 23.0 31.3 21.0
Distribution 30.2 23.0 31.3 21.0
Trading margin 11.4% 11.7% (0.3)ppt (0.3)ppt
Distribution 11.4% 11.7% (0.3)ppt (0.3)ppt
Operating cash flow 22.8 31.9
Distribution 22.8 31.9* At actual exchange rates
OutlookForecasts indicate themarket will bematerially down in 2009.We do expect thatwith the launch of newmodels during theyear we will further strengthen our marketposition.Tight cost control and growth inaftersales continue to be the major themesin the current difficult time.Aftersales willreceive increasing focus throughout 2009.
StrategyIn Hong Kong,we are the distributor forToyota,Lexus,HinoTrucks,Daihatsu,Jaguarand Mazda.We operateVIR for these brandpartners in this market.Our largest businessin Hong Kong is Crown Motors,whichrepresents Toyota,Lexus,HinoTrucks andDaihatsu.We have won theToyotaTripleCrownAward (in recognition of outstandingcustomer service, retail excellence andinnovation) for 16 consecutive years since1992, the only company in the world to havedone so over such an extended period.
We continue to make progress in Hong Kongwith a particular focus on the luxury segmentthrough our Lexus range and will continueto expand in the growing multi-passengervehicle (MPV) segment, following the launchof newmodels in 2008,with further newmodel launches in 2009.
MarketWe experienced a significant change inthe market in 2008.The first three quarterssaw amarket growth rate of 28% howeverduring Q4 the market declined by 41%.Forthe year, the market was up by 7% on 2007.
PerformanceWe have further strengthened our marketposition in Hong Kong with sales of 13,661vehicles in 2008, representing a combinedmarket share of 36.3%.As a result of the verysolid growth in the first three quarters of theyear, full year like for like sales were 20.6%better than 2007,benefiting from the launchof the Noah andAlphard models into thefast growing MPV segment.Tight overheadcost control contributed to the delivery oftrading profit growth of 9.6% versus 2007(excluding a one off profit of £2.9m relatedto property booked in 2007).
Singapore
Core brand partners
22
Inchcape plc Annual Report and Accounts 2008
Business review
Operating review continued
Year ended Year ended % change31.12.2008 31.12.2007 in constant
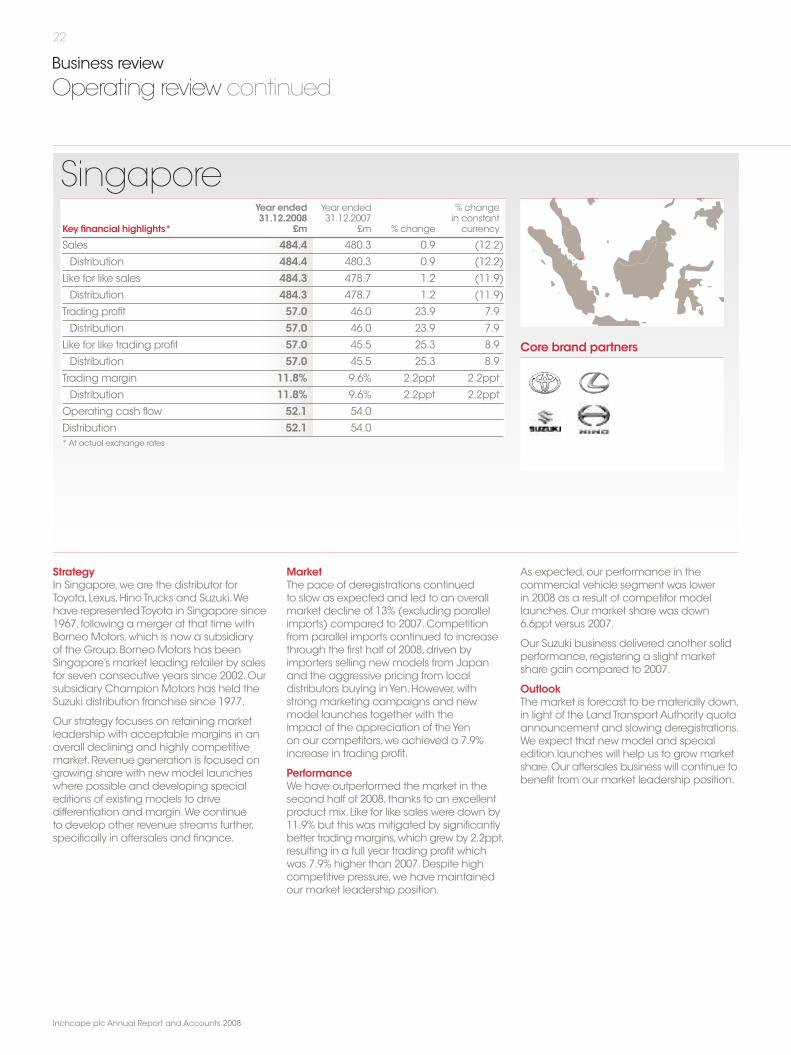
Key financial highlights* £m £m % change currency
Sales 484.4 480.3 0.9 (12.2)
Distribution 484.4 480.3 0.9 (12.2)
Like for like sales 484.3 478.7 1.2 (11.9)
Distribution 484.3 478.7 1.2 (11.9)
Trading profit 57.0 46.0 23.9 7.9
Distribution 57.0 46.0 23.9 7.9
Like for like trading profit 57.0 45.5 25.3 8.9
Distribution 57.0 45.5 25.3 8.9
Trading margin 11.8% 9.6% 2.2ppt 2.2ppt
Distribution 11.8% 9.6% 2.2ppt 2.2ppt
Operating cash flow 52.1 54.0
Distribution 52.1 54.0* At actual exchange rates
StrategyIn Singapore,we are the distributor forToyota,Lexus,HinoTrucks and Suzuki.Wehave representedToyota in Singapore since1967, following amerger at that time withBorneo Motors,which is now a subsidiaryof the Group.Borneo Motors has beenSingapore’s market leading retailer by salesfor seven consecutive years since 2002.Oursubsidiary Champion Motors has held theSuzuki distribution franchise since 1977.
Our strategy focuses on retaining marketleadership with acceptable margins in anoverall declining and highly competitivemarket.Revenue generation is focused ongrowing share with newmodel launcheswhere possible and developing specialeditions of existing models to drivedifferentiation andmargin.We continueto develop other revenue streams further,specifically in aftersales and finance.
MarketThe pace of deregistrations continuedto slow as expected and led to an overallmarket decline of 13% (excluding parallelimports) compared to 2007.Competitionfrom parallel imports continued to increasethrough the first half of 2008,driven byimporters selling newmodels from Japanand the aggressive pricing from localdistributors buying inYen.However,withstrong marketing campaigns and newmodel launches together with theimpact of the appreciation of theYenon our competitors,we achieved a 7.9%increase in trading profit.
PerformanceWe have outperformed the market in thesecond half of 2008, thanks to an excellentproduct mix.Like for like sales were down by11.9% but this was mitigated by significantlybetter tradingmargins,which grew by 2.2ppt,resulting in a full year trading profit whichwas 7.9% higher than 2007.Despite highcompetitive pressure,we have maintainedour market leadership position.
As expected,our performance in thecommercial vehicle segment was lowerin 2008 as a result of competitor modellaunches.Our market share was down6.6ppt versus 2007.
Our Suzuki business delivered another solidperformance, registering a slight marketshare gain compared to 2007.
OutlookThe market is forecast to be materially down,in light of the LandTransport Authority quotaannouncement and slowing deregistrations.We expect that newmodel and specialedition launches will help us to growmarketshare.Our aftersales business will continue tobenefit from our market leadership position.

UK
Core brand partners
23
www.inchcape.com
Businessreview
01-37Governa
nce38-57
Financia
lstatem
ents58-120
Shareho
lderinfo
rmatio
nInsid
eback
cover
Year ended Year ended % change31.12.2008 31.12.2007 in constant
Key financial highlights £m £m % change currency
Sales 2,340.1 2,713.5 (13.8) (13.8)
Retail 2,319.4 2,646.0 (12.3) (12.3)
Distribution 20.7 67.5 (69.3) (69.3)
Like for like sales 2,192.3 2,331.2 (6.0) (6.0)
Retail 2,171.6 2,294.8 (5.4) (5.4)
Distribution 20.7 36.4 (43.1) (43.1)
Trading profit 23.1 69.6 (66.8) (66.8)
Retail 28.8 64.7 (55.5) (55.5)
Distribution (5.7) 4.9 (216.3) (216.3)
Like for like trading profit 26.1 69.8 (62.6) (62.6)
Retail 31.8 64.8 (51.0) (51.0)
Distribution (5.7) 5.0 (214.0) (214.0)
Trading margin 1.0% 2.6% (1.6)ppt (1.6)ppt
Retail 1.2% 2.4% (1.2)ppt (1.2)ppt
Distribution (27.5)% 7.4% (34.9)ppt (34.9)ppt
Operating cash flow 154.1 60.0
Retail 154.8 53.3
Distribution (0.7) 6.7
IFS offers fleet management and leasingservices to corporate and governmentcustomers.With over 50 years’experience inthe automotive industry, IFS has a combinedfleet size of approximately 31,000 vehicles.
MarketThe economic downturn createdunprecedented challenges for the UKautomotive industry in 2008.We saw asignificant change in the market fromMay2008,with a rapid acceleration of the declinethrough the second and third quarters,resulting in a full year decline of 11% to 2.1munits.Diesel market share reached an all-timehigh of 43.6%.Market pricing was significantlyaffected, resulting in used car prices beingwell below 2007 levels.
PerformanceWe continue to outperform our competitorsand in the face of an 11%market decline,we achieved a like for like retail sales dropof 5.4% versus 2007.Pressure on new andusedmargins continued throughout 2008and as a result like for like trading marginsdeclined from 2.4% to 1.2% in 2008.
An £8.5m increase in residual valueprovision in IFS has resulted in a like for liketrading loss of £5.7m.This provision increaseis due to the fall in used car pricing, resultingin lower than expected realisable values onleased vehicles which will be returned overthe next two to three years.
OutlookThe new vehicle market is expected todecline materially in 2009.Notwithstandingthis decline,much greater stability isanticipated in the used vehicle marketwhile aftersales is expected to continueto make a significant contribution.
StrategyIn the UK, Inchcape has a significant retailbusiness with 130 franchised retail centresand a focus on core premium/premium-volume brand partners.We also operatea fleet leasing business, Inchcape FleetSolutions (IFS).
Since May 2006, the Group has acquiredand integrated LindAutomotive GroupHoldings Limited and European MotorHoldings plc.The enlarged portfolio hasextended the Group’s geographic reachand we now have scale operations in thecore regions of the South East,Midlands,North and North East of England.
We have streamlined our portfolio to focuson the following core brands:Audi,BMW,Honda,Jaguar,Land Rover,Lexus,Mercedes-Benz,MINI,Porsche,smart,Toyota andVolkswagen.
We aim to create significant differentiationby delivering an outstanding level ofcustomer service through our InchcapeAdvantage programme and drive growthin aftersales and car finance penetration.

Russia and Emerging Markets
Core brand partners
24
Inchcape plc Annual Report and Accounts 2008
Business review
Operating review continued
Year ended Year ended % change31.12.2008 31.12.2007 in constant
Key financial highlights* £m £m % change currency
Sales 929.0 518.6 79.1 57.1
Retail 623.9 276.6 125.6 98.5
Distribution 305.1 242.0 26.1 10.1
Like for like sales 573.6 518.6 10.6 (3.0)
Retail 326.3 276.6 18.0 3.8
Distribution 247.3 242.0 2.2 (10.7)
Trading profit 22.5 29.6 (24.0) (33.3)
Retail 18.6 13.2 40.9 24.2
Distribution 3.9 16.4 (76.2) (79.1)
Like for like trading profit 13.6 29.9 (54.5) (60.4)
Retail 10.6 13.5 (21.5) (31.4)
Distribution 3.0 16.4 (81.7) (84.2)
Trading margin 2.4% 5.7% (3.3)ppt (3.3)ppt
Retail 3.0% 4.8% (1.8)ppt (1.8)ppt
Distribution 1.3% 6.8% (5.5)ppt (5.5)ppt
Operating cash flow (67.3) 7.6
Retail (12.4) 5.5
Distribution (54.9) 2.1* At actual exchange rates
StrategyWe operate 20 retail businesses in Moscowand St Petersburg.Two further retail centresfor Toyota are under construction,one inMoscow and one in St Petersburg.
In St Petersburg,we own and operate one ofthe largest car retailing businesses in the city.In 2008,we acquired a 75.1% shareholdingin MusaMotors,one of the largest car retailgroups in Russia,providing the Group withscale presence in the Moscow region.
We are a distributor for Toyota and Lexusin Bulgaria and Romania. In Romania,we have increased our retail presence inBucharest with a new large-scale facility.In Bulgaria,we are increasing our retailpresence in Sofia and developing ourindependent network in the countryside.In addition,we are the distributor for Toyotaand Lexus in Macedonia andAlbania.
In Poland,we retail BMW andMINI inWarsaw andWroclaw.
In the Baltics,we are the distributor and weoperateVIR for Mazda,Jaguar and LandRover.We are also the retailer for BMW,Mitsubishi and Hyundai in these markets.We have market-leading positions in Latviawith a 12% share and in Lithuania with 15%.
In China,we haveToyota and Lexus retailcentres in Shaoxing.A third retail centre, forLexus in Shanghai, is due to open in 2009.
MarketThe second half of the year saw a significantshift in all emerging markets. In Russia, themarket for international brands fell by 6% inQ4, the first decline in many years. In China,although the passenger car market declinedby 6% in 2008, foreign brand sales grew by8%.The Balkansmarket dropped 11% in 2008(Q4 decline of 37%) and the Baltics marketdeclined 22% in 2008 (Q4 decline of 50%). InPoland, the market increased by 6% in 2008,largely reflecting good economic growth.
PerformanceOur Musa Motors acquisition performedin line with expectations in the six monthsto December.Our existing business inSt Petersburg delivered like for like tradingprofits that were 14.7% higher than 2007.Overall,Russia contributed £18.9m oftrading profit to the Group in 2008.
Our performance in the Baltics was affectedby a significant market decline with Latviathe worst affected.Overall trading profitsdeclined by £9.5m versus 2007.We continueto restructure our business in the region toreflect the current and projected futurebusiness environment.
In the Balkans,overall trading profit fell by£9.0m in 2008 primarily as a result of a 78.6%drop in trading profit in Romania.
In Poland, like for like trading profit increasedby 120.5% with a sales increase of 21%.
In China,we successfully opened our Lexussite in Shaoxing in January and we saw salesfrom our existingToyota site grow by 56.3%versus 2007. Including the new Lexus sitetotal revenues in China grew by 212.2%.
OutlookIn Russia,2009 is expected to be challenging,with the market forecast to be materiallydown.The Group should benefit fromexpected increase in the highly profitablearea of aftersales.
The markets in the Baltics and the Balkansare expected to be substantially down.
Although the Polish market is expectedto be down in 2009, the Group expectsimprovements in sales processes and theopening of a new BMW retail centre inWarsaw to offset this forecast lack of growth.
In China,growth is forecast to continue,althoughmore slowly than in recent years,and will be helped by our new Lexus siteopening in Shanghai in 2009.
Rest of World
Core brand partners
25
www.inchcape.com
Businessreview
01-37Governa
nce38-57
Financia
lstatem
ents58-120
Shareho
lderinfo
rmatio
nInsid
eback
cover
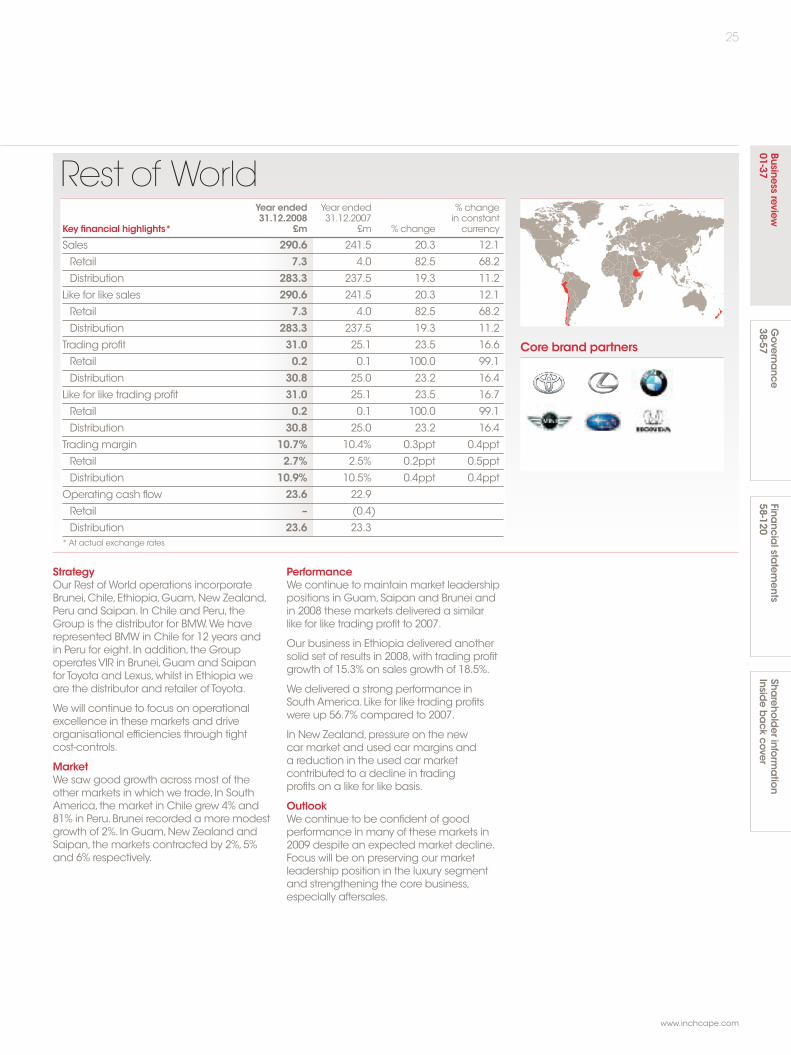
Year ended Year ended % change31.12.2008 31.12.2007 in constant
Key financial highlights* £m £m % change currency
Sales 290.6 241.5 20.3 12.1
Retail 7.3 4.0 82.5 68.2
Distribution 283.3 237.5 19.3 11.2
Like for like sales 290.6 241.5 20.3 12.1
Retail 7.3 4.0 82.5 68.2
Distribution 283.3 237.5 19.3 11.2
Trading profit 31.0 25.1 23.5 16.6
Retail 0.2 0.1 100.0 99.1
Distribution 30.8 25.0 23.2 16.4
Like for like trading profit 31.0 25.1 23.5 16.7
Retail 0.2 0.1 100.0 99.1
Distribution 30.8 25.0 23.2 16.4
Trading margin 10.7% 10.4% 0.3ppt 0.4ppt
Retail 2.7% 2.5% 0.2ppt 0.5ppt
Distribution 10.9% 10.5% 0.4ppt 0.4ppt
Operating cash flow 23.6 22.9
Retail – (0.4)
Distribution 23.6 23.3* At actual exchange rates
StrategyOur Rest ofWorld operations incorporateBrunei,Chile,Ethiopia,Guam,New Zealand,Peru and Saipan. In Chile and Peru, theGroup is the distributor for BMW.We haverepresented BMW in Chile for 12 years andin Peru for eight. In addition, the GroupoperatesVIR in Brunei,Guam and Saipanfor Toyota and Lexus,whilst in Ethiopia weare the distributor and retailer of Toyota.
We will continue to focus on operationalexcellence in these markets and driveorganisational efficiencies through tightcost-controls.
MarketWe saw good growth across most of theother markets in which we trade. In SouthAmerica, the market in Chile grew 4% and81% in Peru.Brunei recorded amore modestgrowth of 2%. In Guam,New Zealand andSaipan, the markets contracted by 2%,5%and 6% respectively.
PerformanceWe continue to maintain market leadershippositions in Guam,Saipan and Brunei andin 2008 these markets delivered a similarlike for like trading profit to 2007.
Our business in Ethiopia delivered anothersolid set of results in 2008,with trading profitgrowth of 15.3% on sales growth of 18.5%.
We delivered a strong performance inSouthAmerica.Like for like trading profitswere up 56.7% compared to 2007.
In New Zealand,pressure on the newcar market and used car margins anda reduction in the used car marketcontributed to a decline in tradingprofits on a like for like basis.
OutlookWe continue to be confident of goodperformance in many of these markets in2009 despite an expected market decline.Focus will be on preserving our marketleadership position in the luxury segmentand strengthening the core business,especially aftersales.

26
Inchcape plc Annual Report and Accounts 2008
Business review
Financial review
Acquisitions and disposalsThe Group continued its expansion inemerging markets in 2008 and invested atotal of £135.4m in acquisitions,offset bytotal proceeds from disposal of non-corebusinesses of £27.3m.
In March, the Group acquired theremaining 24.9% stake in the St Petersburgbusiness for a total cash consideration of£28.5m.As a result, the Group now owns100% of one of the largest automotive retailbusinesses in St Petersburg, the secondlargest city in Russia.
In July, the Group acquired a 75.1%interest in Musa Motors group for an initialconsideration of US$200m,with a furtherpayment due dependent on 2008 Earningsbefore Interest,Tax andAmortisation (EBITA)and subject to a cap of US$250m.Theremaining 24.9% is due to be acquired inearly 2011 for a payment dependent on2010 EBITA,again subject to a cap ofUS$250m.As a result, the Group hastherefore accounted for Musa Motorsgroup as if it was a wholly-owned subsidiary.This acquisition provides the Group with asignificant scale position in Moscow.
The Group disposed of its non-coreVauxhallbusiness and the majority of its Volvo retailcentres in the UK for £17.0m and also soldits French operation to its managementteam for a consideration of £7.6m.
Capital expenditureThe Groupmaintained its policy of investingto improve the operating standards of itsretail centres and to develop new greenfieldcentres at a cost of £117.8m.The Groupalso continued with its implementationplan for a global SAP system for its operatingbusinesses.The first retail centre went livewith the system in February 2009.
Capital expenditure relating to SAP in 2008was £18.7m.
Minority interestsProfits attributable to minority interestsreduced to £3.9m in 2008 from £5.7min 2007.This was largely the result of theacquisition in March 2008 of the remaining24.9% interest in our St Petersburg businessesfrom the joint venture partner, the OlimpGroup.The Group’s minority interests atthe year end principally comprise a 33%minority holding in UABVitvela,Lithuaniaand 10% in SubaruAustralia.
Foreign currencyDuring 2008,the Group benefited by £22.9mfrom translation of its overseas profits intoSterling at the 2008 average exchange rate.
Following the recent fall in Sterling againstmost of the Group’s major currencies,aBoard decision has been taken to protectthe 2009 earnings by purchasing Sterlingcall options on amatching basis withoverseas earnings for all major territories,excluding Russia.
Cash flow and net debtThe Group’s operations continued to becash generative in 2008,with cash flow fromoperating activities of £183.7m.The tightmanagement of working capital in the faceof the downturn in the automotive sector hasbeen a key factor in the delivery of this result.
During the year, the Group returned nearly£90m to shareholders with £73.1m throughdividend payments and £16.0m througha programme of buying shares in themarket. In addition, the Group invested£264.0m in acquisitions and capitalexpenditure, funded by additionalborrowing facilities,and realised £54.5mfrom the disposal of businesses and otherassets.Overall, the Group had net debt of£407.8m at 31 December 2008 comparedto £213.5m at 31 December 2007.
PensionsDuring the year,and in line with the fundingprogramme agreed with theTrustees in2006, the Groupmade cash contributions tothe UK defined benefit scheme amountingto £20.8m.However,a reduction in themarket value of scheme assets during 2007has resulted in a net pension surplus at31 December 2008 of £6.0m,compared toa net surplus at the end of 2007 of £28.5m.
The Group has produced results in line withour expectations.The following Financialreview details the financial implications ofour operational activity and the risks whichwemonitor and take steps to mitigate.
Central costsUnallocated central costs for the full yearare £9.6m before exceptional items,downfrom £27.5m in 2007.This decrease is largelya reflection of the Group’s performanceduring the year which has resulted in nomanagement bonuses being paid andan overall credit being recorded in respectof share-based awards.
Joint ventures and associatesThe share of profit after tax of joint ventureshas decreased by £1.3m to £2.2m in 2008.This is mainly as a result of the acquisitionof the remaining stake in our joint venturein Djibouti,thereby converting it to a 100%owned subsidiary.
Exceptional itemsThe exceptional items consist of goodwillimpairment charges of £54.2m,a one offcharge of £28.3m in connection with therestructuring of certain Group businesses,(which is expected to deliver approximately£58m of annualised cost savings at 2009exchange rates) and a £3.6m exceptionaltax charge.The exceptional profit recordedin 2007 related to the sale of Inchroy (£12.0mprofit), InchcapeAutomotive and non-coreretail centres in the UK (£7.1m loss).
Net financing costsThe net financing cost of £52.0mwas £18.6mhigher than in 2007 and is a reflection of theGroup’s higher level of net debt.The majorityof the additional interest relates to thefinancing of the Musa acquisition, togetherwith the annualised cost of the acquisition oftheAudi and Peugeot businesses in Russia,the acquisitions in the Baltics in 2007 andthe higher level of working capital reflectingthe downturn in the markets.
TaxThe subsidiaries headline tax rate for theyear is 26% compared to 25% in 2007.Thisincrease arises due to the mix of profitsacross the territories in which we operate.The rate is expected to increase in 2009due once again to the profit mix,and tothe restricted ability to obtain tax relief onUK financing costs.
Delivering solid results despitethe unprecedented globaldecline in the car industry.
27
www.inchcape.com
Businessreview
01-37Governa
nce38-57
Financia
lstatem
ents58-120
Shareho
lderinfo
rmation
Insideback
cover
Principal business risk factors
Enterprise risk identificationand managementThe Group applies an effective system ofrisk management in terms of identifyingandmonitoring actions to manage theserisks.Further details of the Group’s riskmanagement process can be foundon page 47 and 48.
Risk is a part of doing business; the riskmanagement system aims to provideassurance to the Board on the effectivenessof our control framework in managing riskagainst a background of highly diverseand competitive markets.The key benefitsof the system include:maximised resourceefficiency through controlled prioritisationof issues,benchmarking betweenbusiness units, sharing of best practiceand effective crisis management.
The following provides an overview of theprincipal business risk areas facing theGroup along with a description,whererelevant,of the mitigating actions in place.
Market conditionsOver the past 12 months, the global carindustry has suffered an unprecedentedand rapid downturn.This downturn andthe broader economic conditions havehad an impact on the Group.The Groupis focusing on five core business priorities(described on page 8).This focus isintended to position the Group to takeadvantage of improvements in themarketsin which it operates as and when theybegin to recover.
Another aspect of the current marketconditions is the availability of credit forour customers. Inchcape is using itsrelationships with external financeproviders and its brand partners to try andsecure such credit on acceptable terms.
Brand partnersThe strength of relationships with ourbrand partners is critical to the ongoingsuccess of the Group.Wemaintainthese relationships through constantfocus on performance,effectivecommunication and ensuring thatour objectives are closely aligned tothose of our brand partners.
The brand partners whom we representmay also be affected by the currentdownturn,which in turn could have animpact on the Group.However,we believethat our brand partners are amongst thestrongest in the industry and are thereforebest placed to weather the currentmarket conditions.
Treasury management and policyThe centralised treasury departmentmanages the key financial risks of theGroup encompassing funding andliquidity risk, interest rate risk,counterpartyrisk and currency risk.TheTreasury functionoperates as a service centre under Board-approved objectives and policies.
Funding and liquidity riskThe Group’s policy is to ensure that thefunding requirements forecast by theGroup can bemet within available,committed facilities.
The inventory lead time in the automotiveindustry can present a liquidity risk in acontracting market,however this is offsetby strict controls on inventory levels whichwere tightened across the Group duringthe year.Access to supplier credit alsoreduces the Group’s exposure to currentcredit markets,as this funding is generallyavailable on extended and favourableterms,even in a contracting market,andthis credit funds the largest cash outflowsof the Group.
The effect of the current general reductionin credit availability has not yet increasedthe liquidity risk exposure of the Group,asthe actual liquidity position of the Group issecure in the medium term,due to thecurrent committed and availableborrowing facilities in place.
At the end of the year theGroup’s principalcommitted facility for general corporatepurposes,was a five year syndicated£500m revolving credit facility put in placewith relationship banks inApril 2007. InApril2008 the maturity of this facility wasextended for an additional year to 2013.This facility was drawn by £370mat the yearend.A three year term loan of £35m put inplace in April 2007 was fully drawn duringthe year.
The Group also has in place fundingwith Private Placement loan notes totalling$550m.Loan notes totalling $350mmaturein May 2017 and a further $200m of loannotes mature in May 2019.
In July 2008 the Group put in place athree year syndicated £185m revolvingcredit facility and a £40m bilateral facilitywith relationship banks.These facilitieswere not drawn at the year end.
The committed bank facilities and PrivatePlacement borrowings are all the subjectof one financial covenant being an interestcover covenant based on an adjustedEBITA measure to interest on consolidatedborrowings.The covenant is tested on atrailing 12 month basis at 30 June and31 December each year and is requiredto be not less than three to one.The Groupwas compliant with this covenant duringthe year and regularly monitors actualand prospective compliance.
The proceeds of the Rights Issue,announced on 19 March 2009,areintended to reduce indebtedness,whichin the short term will increase headroomand delay the refinancing of existingfacilities. In the longer-term, this will betterposition the Group to take advantage ofmarket recovery.
Currency riskThe Group has transactional currencyexposures,where sales or purchases byan operating unit are in currencies otherthan in that unit’s reporting currency.For a significant proportion of the Groupthese exposures are removed,as tradingis denominated in the relevant localcurrency. In particular, local billingarrangements are in place for manybusinesses with our brand partners.For those businesses that continue to bebilled in foreign currency,Group policy isthat committed transactional exposuresare hedged into the reporting currencyof that business. If possible, foreignexchange exposures will be matchedinternally before hedging externally.
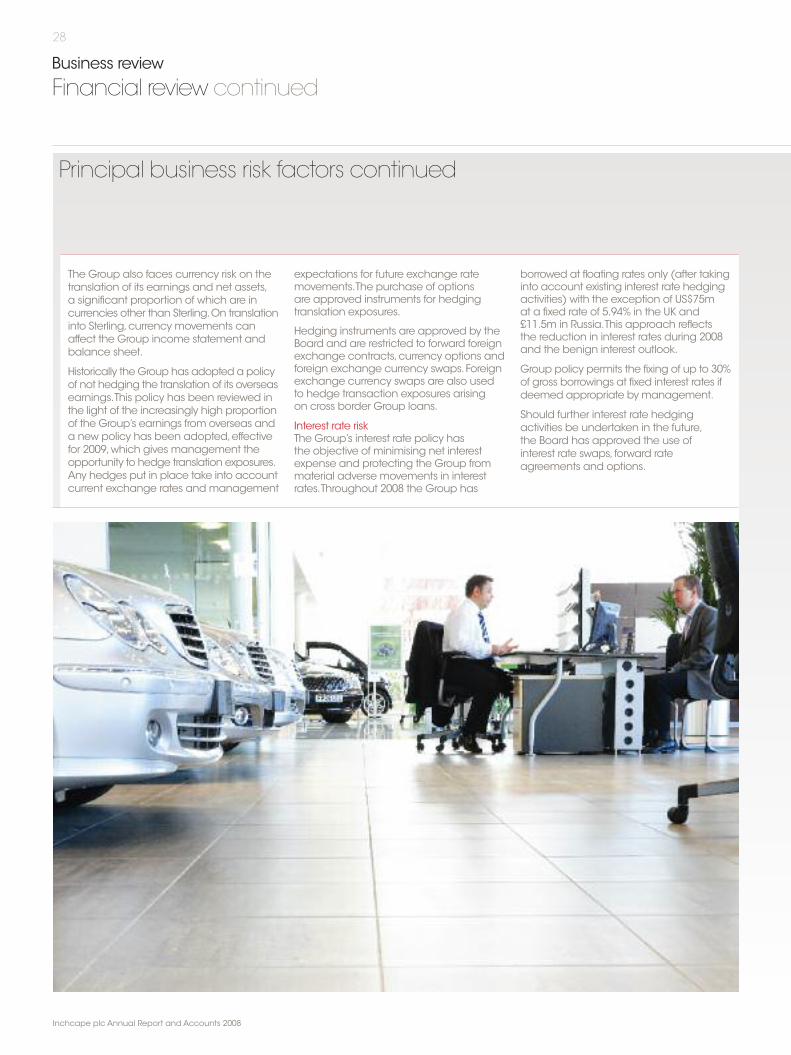
28
Inchcape plc Annual Report and Accounts 2008
Business review
Financial review continued
Principal business risk factors continued
The Group also faces currency risk on thetranslation of its earnings and net assets,a significant proportion of which are incurrencies other than Sterling.On translationinto Sterling,currency movements canaffect the Group income statement andbalance sheet.
Historically theGroup has adopted a policyof not hedging the translation of its overseasearnings.This policy has been reviewed inthe light of the increasingly high proportionof the Group’s earnings from overseas anda new policy has been adopted,effectivefor 2009,which gives management theopportunity to hedge translation exposures.Any hedges put in place take into accountcurrent exchange rates andmanagement
expectations for future exchange ratemovements.The purchase of optionsare approved instruments for hedgingtranslation exposures.
Hedging instruments are approved by theBoard and are restricted to forward foreignexchange contracts,currency options andforeign exchange currency swaps.Foreignexchange currency swaps are also usedto hedge transaction exposures arisingon cross border Group loans.
Interest rate riskThe Group’s interest rate policy hasthe objective of minimising net interestexpense and protecting the Group frommaterial adverse movements in interestrates.Throughout 2008 the Group has
borrowed at floating rates only (after takinginto account existing interest rate hedgingactivities) with the exception of US$75mat a fixed rate of 5.94% in the UK and£11.5m in Russia.This approach reflectsthe reduction in interest rates during 2008and the benign interest outlook.
Group policy permits the fixing of up to 30%of gross borrowings at fixed interest rates ifdeemed appropriate by management.
Should further interest rate hedgingactivities be undertaken in the future,the Board has approved the use ofinterest rate swaps, forward rateagreements and options.

29
www.inchcape.com
Businessreview
01-37Governa
nce38-57
Financia
lstatem
ents58-120
Shareho
lderinfo
rmation
Insideback
cover
Counterparty riskThe amount due from counterparties,arising from cash deposits and the useof financial instruments,creates credit risk.Limits are in place which reduce creditrisk by stipulating the aggregate amountand duration of exposure to any onecounterparty dependent upon theapplicable credit rating.Credit ratings andthe appropriate limits are reviewed regularly.
There is also a risk in the currenteconomic climate where the Groupoperates distribution businesses relatingto the financial health of the Group’sthird party dealer networks.However, theGroup has a long and successful historyof managing distribution businesses andan experiencedmanagement teamrunning day-to-day operations.
PensionsThe Group has defined benefit pensionschemes to which it may be requiredto increase its contributions in the eventof an adverse change in the Group’sfinancial position and/or to fund anincrease in the cost of future benefits.The Groupmaintains an open dialoguewith the pension trustees to ensure thatthey have appropriate information uponwhich to base their decisions.
Acquisition integrationThe Group has grown considerably inrecent years as a result of acquisitions.Due to the unprecedented economicdownturn, it is possible that the Groupwill not realise all the projected benefitsof the acquisitions,however the Groupcontinues to integrate the acquiredentities successfully.
Litigation and regulatory riskThe Group is subject to laws andregulations in each of the countries inwhich it operates,all of which are subjectto change and which if breached couldhave an impact on its business.The Groupensures that it obtains timely informationabout forthcoming changes and that ithas robust procedures in place tominimiseany risk of detriment or non-compliance.
The Group’s operations also expose itto the risk of litigation. In order to mitigatethis risk,processes are in place whichare aimed at reducing the potential forlitigation and for escalating any problemswhich do arise with a view to managingthe exposure appropriately.
Attracting,developing and retainingtalented employeesThe ability of the Group to achieve itsstrategic objectives depends partly onits ability to recruit, retain and develophighly skilled competent people at alllevels.The Group has a talent reviewprocess, remuneration is externallybenchmarked to ensure ongoingcompetitiveness and succession plansare developed for all key positions.
Refer to page 32 for further informationabout our people strategy.
Barbara RichmondGroup Finance Director19 March 2009

30
Inchcape plc Annual Report and Accounts 2008
Business review
Corporate responsibility
2008 has built on the foundations of aGroup approach to CR that is makingresponsible economic,environmental andsocial behaviour intrinsic to the way wework.The Group’s approach to CR has beenrecognised by its inclusion again in 2008 inthe FTSE 4 Good index.The company hasalso taken part again in the CarbonDisclosure Project’s review.
Our responsibilitiesThis section of theAnnual Report sets outthe key principles of our CR Programme.It provides insight into the developmentsin respect of our people,our emphasison and approach to creating the ultimatecustomer experience for our brand partners,highlights the achievements in respect of theGroup’s impact on the communities in whichwe operate and outlines a new developmentin 2008 with themeasurement of the Group’sCO2 footprint.
At Inchcape we take responsibility for theimpact our activities have on:
• Our people
• Our customers
• Our communities
• Our environment
Corporate responsibility (CR) is very importantto the Inchcape Group and we continue to becommitted to integrating socially responsiblebehaviour into every aspect of how we operateand define ourselves.
The past160 yearsInchcape has aheritage of integrityand a history of caringfor its local markets,its people and itscustomers
2006New strengthen andexpand corporatestrategy defined
Focus on encouragingcommunity support
2007Core purpose defined,values refreshed
New people strategyannounced
2008CR strategyimplemented andKPIs listed
Focus on CO2 emissionstracking for the Group
Our CR journey
Governance and managementThe Board is responsible for the strategicdirection of all CR initiatives and theprogramme as a whole.The Board isultimately accountable to our shareholdersfor our CR Programme.Day to daymanagement of the CR Programme hasbeen delegated to the CR Committeecomprising of the Group’s General Counciland Group Company Secretary,Director ofStrategy,Assistant Company Secretary andGroup Communications Manager.Aboveall, the CR Committee’s role is to ensure thatour day to day business operations respondto the opportunities and avoid the risks,posed by CR-related issues.
A network of locally based CR Champions(employees with Group and localresponsibilities) support the work of the CRCommittee across three areas of strategicfocus:our people,our communities andour environment.Our activities are focusedthrough our internal CRAware campaign.
As part of the risk management processesembedded throughout the Group,environmental, social and governance risksare identified andmitigated appropriately.
Business conductIn 2008,we reviewed our business and ethicspolicy and will roll out the updated policyduring the first half of 2009. In addition toproviding a framework for managing ouroperations in line with a consistent set ofstandards of behaviour,we have introduceda specific CR element to the design toensure that CR remains at the forefront ofour activities.
31
www.inchcape.com
Businessreview
01-37Governa
nce38-57
Financia
lstatem
ents58-120
Shareho
lderinfo
rmation
Insidebackcover
Progress againstour goals in 2008In the context of the early stage ofour CR journey,we chose the followingstrategically important targets for 2008:
Objective Raising employee engagementthrough the various initiatives from our peoplestrategy including significant reward anddevelopment plans
Goal attainment Attained
Objective Extending our employee surveyto our global employee base
Goal attainment Attained
Objective Extending best practice in healthand safety to our operations worldwide
Goal attainment Attained
Objective Supporting the communities inwhich we operate through focused initiatives
Goal attainment Attained
Objective Identifying and definingenvironmental initiatives for 2008 and beyond
Goal attainment Attained
Respect foreach other
Winningtogether
Treating every£ as our own
Integrity withoutcompromise
Pioneeringnew ideas
Passionateaboutcustomers
Caring for ourenvironment
People are at the heart of who we are,how we think and howwe act; Inchcape is successful because of ‘us’.We celebratediversity,we value and learn from each other and feel proud tobe working with the best.We have faith in each other and showeach other real loyalty.
We are strong as individuals,but we are even stronger as ateam.We are part of a rich global network and together weachieve great things.We enjoy working with each other andalways achieve more when we do.
We are committed to putting the customer first every day,everytime,everywhere.We are energised by making our customersfeel special,which we do by delivering brilliant basics andcreating magic moments.
This is our company and we feel proud to be part of it.We seecost as a good thing,as long as it creates value.What we hateis waste,so we think before we spend.
An intrepid sprit is the essence of Inchcape.We lead our industryby example.We liberate talent and prize initiative.We areprepared to take risks,drawing on our powerful global resourcesof creativity and insight.
We have no‘hidden agendas’.We have an uncompromisingcommitment to transparency and ethical principles.We believein a straight-talking,human approach.We take personalresponsibility for what we say and do. In an industry not famedfor trust,customers choose us for our clarity,honesty and realism.
Each one of us plays our part in addressing global concernsthrough our local,everyday actions.We integrate an awarenessof our environmental impact with responsible business decision-making and we advance opportunities to reduce our industry’sbearing upon our planet.
Driven by our valuesPeople power our responsible cultureWe believe it is the enthusiasm and understanding of our people that will shape andpower Inchcape’s CR culture.We combine the local knowledge,enthusiasm and expertiseof our employees worldwide with our clearly defined values,standards and policies toenable us to contribute responsibly and sustainably to society.
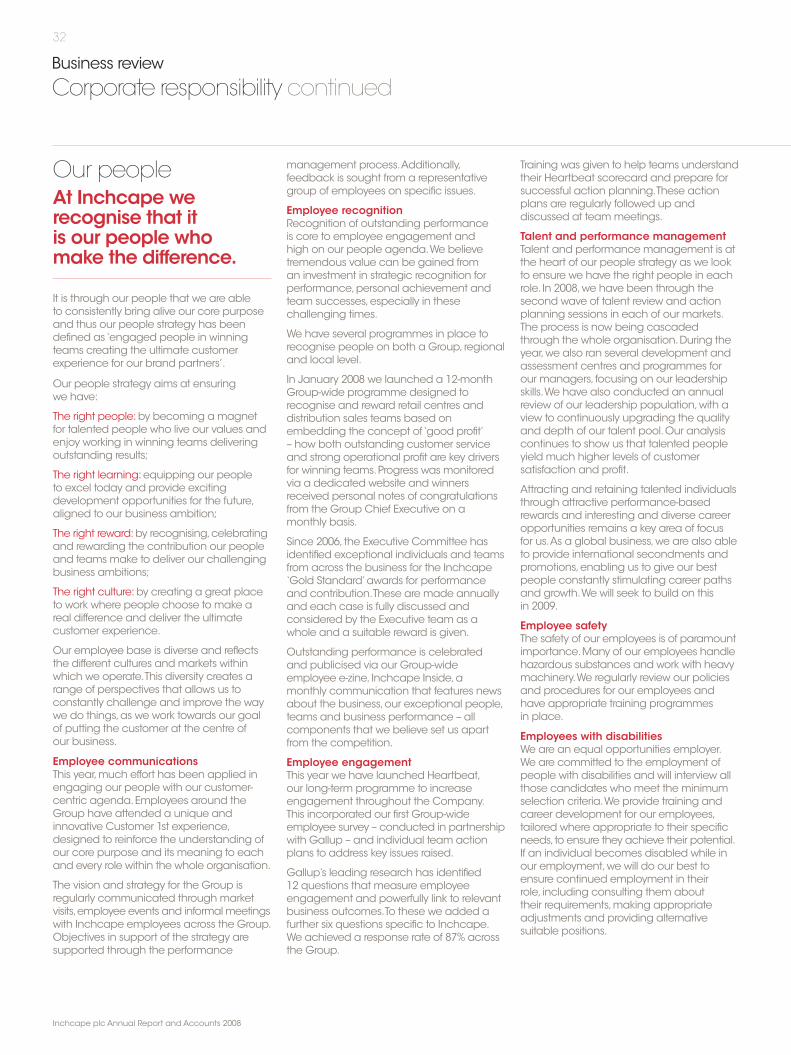
32
Inchcape plc Annual Report and Accounts 2008
Business review
Corporate responsibility continued
Our peopleAt Inchcape werecognise that itis our people whomake the difference.
It is through our people that we are ableto consistently bring alive our core purposeand thus our people strategy has beendefined as‘engaged people in winningteams creating the ultimate customerexperience for our brand partners’.
Our people strategy aims at ensuringwe have:
The right people:by becoming amagnetfor talented people who live our values andenjoy working in winning teams deliveringoutstanding results;
The right learning:equipping our peopleto excel today and provide excitingdevelopment opportunities for the future,aligned to our business ambition;
The right reward:by recognising,celebratingand rewarding the contribution our peopleand teams make to deliver our challengingbusiness ambitions;
The right culture:by creating a great placeto work where people choose to make areal difference and deliver the ultimatecustomer experience.
Our employee base is diverse and reflectsthe different cultures andmarkets withinwhich we operate.This diversity creates arange of perspectives that allows us toconstantly challenge and improve the waywe do things,as we work towards our goalof putting the customer at the centre ofour business.
Employee communicationsThis year,much effort has been applied inengaging our people with our customer-centric agenda.Employees around theGroup have attended a unique andinnovative Customer 1st experience,designed to reinforce the understanding ofour core purpose and its meaning to eachand every role within the whole organisation.
The vision and strategy for the Group isregularly communicated throughmarketvisits,employee events and informalmeetingswith Inchcape employees across the Group.Objectives in support of the strategy aresupported through the performance
management process.Additionally,feedback is sought from a representativegroup of employees on specific issues.
Employee recognitionRecognition of outstanding performanceis core to employee engagement andhigh on our people agenda.We believetremendous value can be gained froman investment in strategic recognition forperformance,personal achievement andteam successes,especially in thesechallenging times.
We have several programmes in place torecognise people on both a Group, regionaland local level.
In January 2008 we launched a 12-monthGroup-wide programme designed torecognise and reward retail centres anddistribution sales teams based onembedding the concept of ‘good profit’– how both outstanding customer serviceand strong operational profit are key driversfor winning teams.Progress was monitoredvia a dedicated website and winnersreceived personal notes of congratulationsfrom the Group Chief Executive on amonthly basis.
Since 2006, the Executive Committee hasidentified exceptional individuals and teamsfrom across the business for the Inchcape‘Gold Standard’awards for performanceand contribution.These are made annuallyand each case is fully discussed andconsidered by the Executive team as awhole and a suitable reward is given.
Outstanding performance is celebratedand publicised via our Group-wideemployee e-zine, Inchcape Inside,amonthly communication that features newsabout the business,our exceptional people,teams and business performance – allcomponents that we believe set us apartfrom the competition.
Employee engagementThis year we have launched Heartbeat,our long-term programme to increaseengagement throughout the Company.This incorporated our first Group-wideemployee survey – conducted in partnershipwith Gallup – and individual team actionplans to address key issues raised.
Gallup’s leading research has identified12 questions that measure employeeengagement and powerfully link to relevantbusiness outcomes.To these we added afurther six questions specific to Inchcape.We achieved a response rate of 87% acrossthe Group.
Training was given to help teams understandtheir Heartbeat scorecard and prepare forsuccessful action planning.These actionplans are regularly followed up anddiscussed at teammeetings.
Talent and performance managementTalent and performancemanagement is atthe heart of our people strategy as we lookto ensure we have the right people in eachrole. In 2008,we have been through thesecond wave of talent review and actionplanning sessions in each of our markets.The process is now being cascadedthrough the whole organisation.During theyear,we also ran several development andassessment centres and programmes forour managers, focusing on our leadershipskills.We have also conducted an annualreview of our leadership population,with aview to continuously upgrading the qualityand depth of our talent pool.Our analysiscontinues to show us that talented peopleyield much higher levels of customersatisfaction and profit.
Attracting and retaining talented individualsthrough attractive performance-basedrewards and interesting and diverse careeropportunities remains a key area of focusfor us.As a global business,we are also ableto provide international secondments andpromotions,enabling us to give our bestpeople constantly stimulating career pathsand growth.We will seek to build on thisin 2009.
Employee safetyThe safety of our employees is of paramountimportance.Many of our employees handlehazardous substances and work with heavymachinery.We regularly review our policiesand procedures for our employees andhave appropriate training programmesin place.
Employees with disabilitiesWe are an equal opportunities employer.We are committed to the employment ofpeople with disabilities and will interview allthose candidates whomeet the minimumselection criteria.We provide training andcareer development for our employees,tailored where appropriate to their specificneeds,to ensure they achieve their potential.If an individual becomes disabled while inour employment,we will do our best toensure continued employment in theirrole, including consulting them abouttheir requirements,making appropriateadjustments and providing alternativesuitable positions.
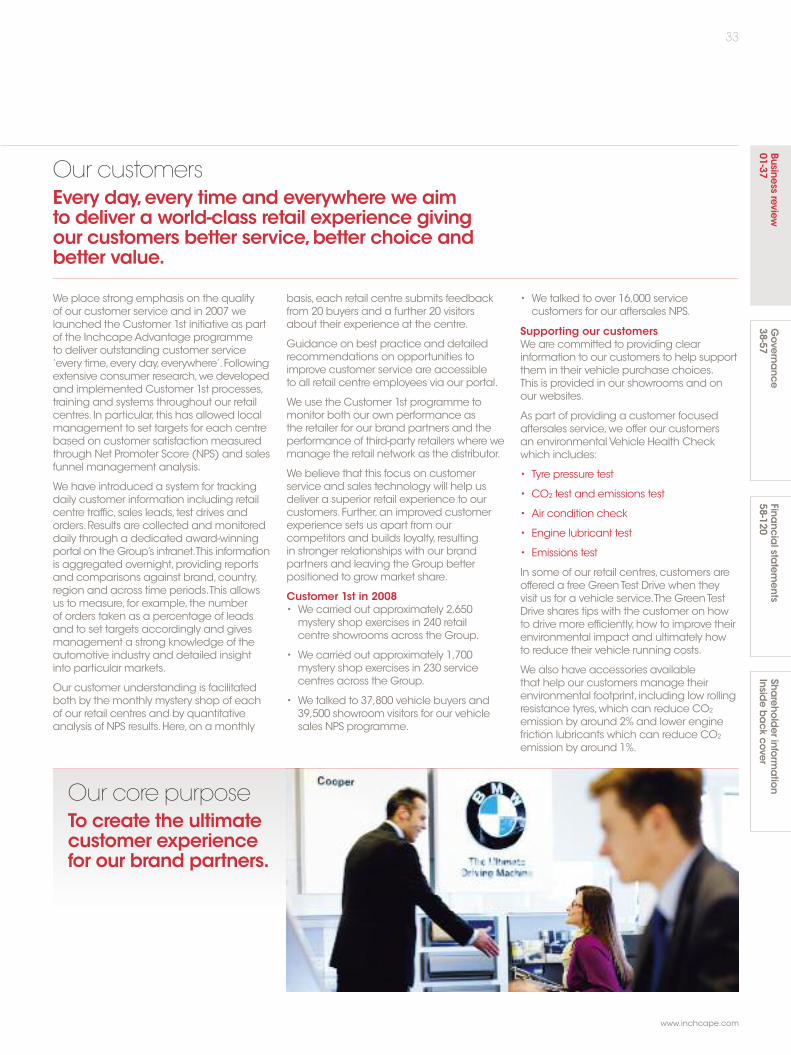
33
www.inchcape.com
Businessreview
01-37Governa
nce38-57
Financia
lstatem
ents58-120
Shareho
lderinfo
rmation
Insidebackcover
Our customersEvery day,every time and everywhere we aimto deliver a world-class retail experience givingour customers better service,better choice andbetter value.
We place strong emphasis on the qualityof our customer service and in 2007 welaunched the Customer 1st initiative as partof the InchcapeAdvantage programmeto deliver outstanding customer service‘every time,every day,everywhere’.Followingextensive consumer research,we developedand implemented Customer 1st processes,training and systems throughout our retailcentres. In particular, this has allowed localmanagement to set targets for each centrebased on customer satisfaction measuredthrough Net Promoter Score (NPS) and salesfunnel management analysis.
We have introduced a system for trackingdaily customer information including retailcentre traffic,sales leads, test drives andorders.Results are collected andmonitoreddaily through a dedicated award-winningportal on theGroup’s intranet.This informationis aggregated overnight,providing reportsand comparisons against brand,country,region and across time periods.This allowsus to measure, for example, the numberof orders taken as a percentage of leadsand to set targets accordingly and givesmanagement a strong knowledge of theautomotive industry and detailed insightinto particular markets.
Our customer understanding is facilitatedboth by the monthly mystery shop of eachof our retail centres and by quantitativeanalysis of NPS results.Here,on amonthly
basis,each retail centre submits feedbackfrom 20 buyers and a further 20 visitorsabout their experience at the centre.
Guidance on best practice and detailedrecommendations on opportunities toimprove customer service are accessibleto all retail centre employees via our portal.
We use the Customer 1st programme tomonitor both our own performance asthe retailer for our brand partners and theperformance of third-party retailers where wemanage the retail network as the distributor.
We believe that this focus on customerservice and sales technology will help usdeliver a superior retail experience to ourcustomers.Further,an improved customerexperience sets us apart from ourcompetitors and builds loyalty, resultingin stronger relationships with our brandpartners and leaving the Group betterpositioned to growmarket share.
Customer 1st in 2008• We carried out approximately 2,650mystery shop exercises in 240 retailcentre showrooms across the Group.
• We carried out approximately 1,700mystery shop exercises in 230 servicecentres across the Group.
• We talked to 37,800 vehicle buyers and39,500 showroom visitors for our vehiclesales NPS programme.
Our core purposeTo create the ultimatecustomer experiencefor our brand partners.
• We talked to over 16,000 servicecustomers for our aftersales NPS.
Supporting our customersWe are committed to providing clearinformation to our customers to help supportthem in their vehicle purchase choices.This is provided in our showrooms and onour websites.
As part of providing a customer focusedaftersales service,we offer our customersan environmentalVehicle Health Checkwhich includes:
• Tyre pressure test
• CO2 test and emissions test
• Air condition check
• Engine lubricant test
• Emissions test
In some of our retail centres,customers areoffered a free GreenTest Drive when theyvisit us for a vehicle service.The GreenTestDrive shares tips with the customer on howto drive more efficiently,how to improve theirenvironmental impact and ultimately howto reduce their vehicle running costs.
We also have accessories availablethat help our customers manage theirenvironmental footprint, including low rollingresistance tyres,which can reduce CO2
emission by around 2% and lower enginefriction lubricants which can reduce CO2
emission by around 1%.

Our communitiesWith our extensive international interests,Inchcape firmly believes in supporting themany different communities and cultures withinwhich we operate,often through sponsorshipand support of local charities for local people.We have highlighted some of the work that wehave been undertaking in our communities.
34
Inchcape plc Annual Report and Accounts 2008
Donations by Lexus owners,matched byCrownMotors Limited,have contributedtowards the construction of the CuihuaCentral Primary School of Lu Quan inKunming, in the mountainous southwestprovince ofYunnan in China.The schoolbegan operation in January 2008,benefiting around 600 students frompoor backgrounds.
Lexus owners in Hong Kong haveenthusiastically embraced theopportunity to reach out to thesechildren,whomight otherwise beunable to have any formal education.
Business review
Corporate responsibility continued
1.Hong KongOpening of ‘Crown Motors ElementarySchool’ – Cuihua Central PrimarySchool, Kunming
In support of the Pammakaristos Institution,Toyota Hellas purchased equipment to helpbuild a centre dedicated to children’s healthand wellbeing.The Pammakaristos Institutionis a non-profit charitable organisation thatprovides protection as well as educationfor children. It is subsidised by the HellenicMinistry of Health &Welfare.
Toyota Hellas has supported thePammakaristos Institution in a varietyof ways over the year.
5.GreeceToyota Hellas donates to thePammakaristos Institution
1
2
34
5
6
7

35
www.inchcape.com
Businessreview
01-37Governa
nce38-57
Financia
lstatem
ents58-120
Shareho
lderinfo
rmation
Insidebackcover
Toyota Romania was proud to sponsor theToyota Romanian International Marathon,the first major athletic event to take placein Bucharest,on 12 October 2008.
This momentous event was organised bythe Bucharest Running Club in partnershipwith Bucharest City Hall, the Saatchi &Saatchi advertisement agency and theRomanianAthletics Federation.
6.RomaniaToyota RomanianInternational Marathon
Inchcape supports a children’s projectin Ethiopia called Missionaries of CharityRehabilitation Centre (MCRC) run byJutta De Muynck.The project focuseson children with emotional or physicaldisabilities,HIV,while helping singlemothers in need.Jutta also providestraining for young teachers in the region.
When the school first opened, it wasa privately funded initiative called the‘School Aware Project’.Children werecramped into a four m2 mud hut; it had
no chairs,desks or other supplies.Todaythe school is flourishing and will soonmove to a larger compound withclassrooms,a separate dining roomand a computer room.
In October 2008, Inchcape donated£12,500.This is being used to supportMCRC’s work by providing children withfood,medical and emotional care aswell as education.
7.EthiopiaInchcape in the Ethiopian community
In recognition of Inchcape Retail’scommitment to good causes and betteringthe local community, Inchcape Retail in theUK received a‘Payroll Giving Quality MarkGold’award for making Payroll Givingavailable to colleagues.
Monies donated through Inchcape’s schemeare given to BEN, the automotive charity.This charity supports people from across theautomotive and related industries who facehardship or distress and offers financial,emotional and practical help and support tomore than 15,000 men,women and childrenwho have a connection with the sector.
2.United KingdomInchcape receives awardfor payroll giving
The highly anticipated Lexus Charity GolfDay was held in July 2008 at the prestigiousTanah Merah Country Club,Garden Course.288 participants attended for a day of golf,networking and charity.
In the evening after the event, the Dover ParkHospice was presented with a donationcheque of SGD108,000.This record-breakingamount is the highest ever raised by theLexus Charity Golf Day and it will certainlygo a long way in helping the hospiceprovide palliative care for patients.
3.SingaporeBorneo Motors Singapore:Lexus Charity Golf Day supportsthe Dover Park Hospice
Our Brunei business NBT, the largestlocal car retailer,was pleased tosupport Megamas and BruneiShell Petroleum (BSP) in promotinggreater road safety awareness inBrunei Darussalam through providingcars for defensive driving courses.
NBT officially handed over twoToyota Corollas to MegamasTrainingCompany Sdn Bhd at the NBT KualaBelait Toyota showroom in June 2008.
4.BruneiNBT sponsor Corollas fordefensive driving course
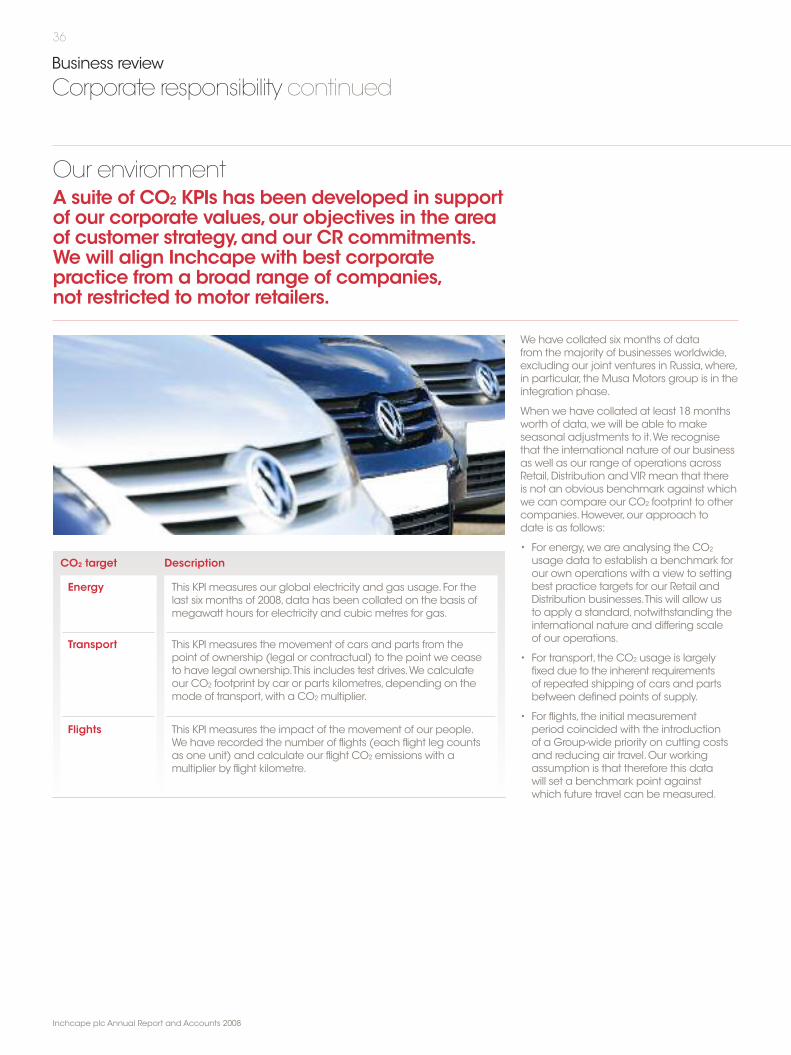
36
Business review
Corporate responsibility continued
Our environmentA suite of CO2 KPIs has been developed in supportof our corporate values,our objectives in the areaof customer strategy,and our CR commitments.We will align Inchcape with best corporatepractice from a broad range of companies,not restricted to motor retailers.
We have collated six months of datafrom the majority of businesses worldwide,excluding our joint ventures in Russia,where,in particular, the Musa Motors group is in theintegration phase.
When we have collated at least 18 monthsworth of data,we will be able to makeseasonal adjustments to it.We recognisethat the international nature of our businessas well as our range of operations acrossRetail,Distribution andVIR mean that thereis not an obvious benchmark against whichwe can compare our CO2 footprint to othercompanies.However,our approach todate is as follows:
• For energy,we are analysing the CO2
usage data to establish a benchmark forour own operations with a view to settingbest practice targets for our Retail andDistribution businesses.This will allow usto apply a standard,notwithstanding theinternational nature and differing scaleof our operations.
• For transport, the CO2 usage is largelyfixed due to the inherent requirementsof repeated shipping of cars and partsbetween defined points of supply.
• For flights, the initial measurementperiod coincided with the introductionof a Group-wide priority on cutting costsand reducing air travel.Our workingassumption is that therefore this datawill set a benchmark point againstwhich future travel can bemeasured.
Inchcape plc Annual Report and Accounts 2008
This KPI measures our global electricity and gas usage.For thelast six months of 2008,data has been collated on the basis ofmegawatt hours for electricity and cubic metres for gas.
CO2 target Description
Energy
This KPI measures the movement of cars and parts from thepoint of ownership (legal or contractual) to the point we ceaseto have legal ownership.This includes test drives.We calculateour CO2 footprint by car or parts kilometres,depending on themode of transport,with a CO2 multiplier.
This KPI measures the impact of the movement of our people.We have recorded the number of flights (each flight leg countsas one unit) and calculate our flight CO2 emissions with amultiplier by flight kilometre.
Transport
Flights

37
www.inchcape.com
Businessreview
01-37Governa
nce38-57
Financia
lstatem
ents58-120
Shareho
lderinfo
rmation
Insidebackcover
Our goals for 2009During 2009,we will be collecting and analysingconsistent data to establish our Group carbonfootprint and to determine specific policies.
• Collate a minimum of 18 months data.• Validate the data collected by market.• Measure CO2 impact.
Objectives Target
Build a solid databasefrom which to determineCO2 reduction policies
• Top six mature markets – UK,Belgium,Australia,Hong Kong,Singapore and Greece – to developlocal policies which will be reviewed to establishGroup-wide policies.
• Publish Group-wide policies on website.• Publish information on community projects.• Share best practice from CR champions.
Collate InchcapeCR policies
Launch CR section ofInchcape website toraise awareness acrossthe Group
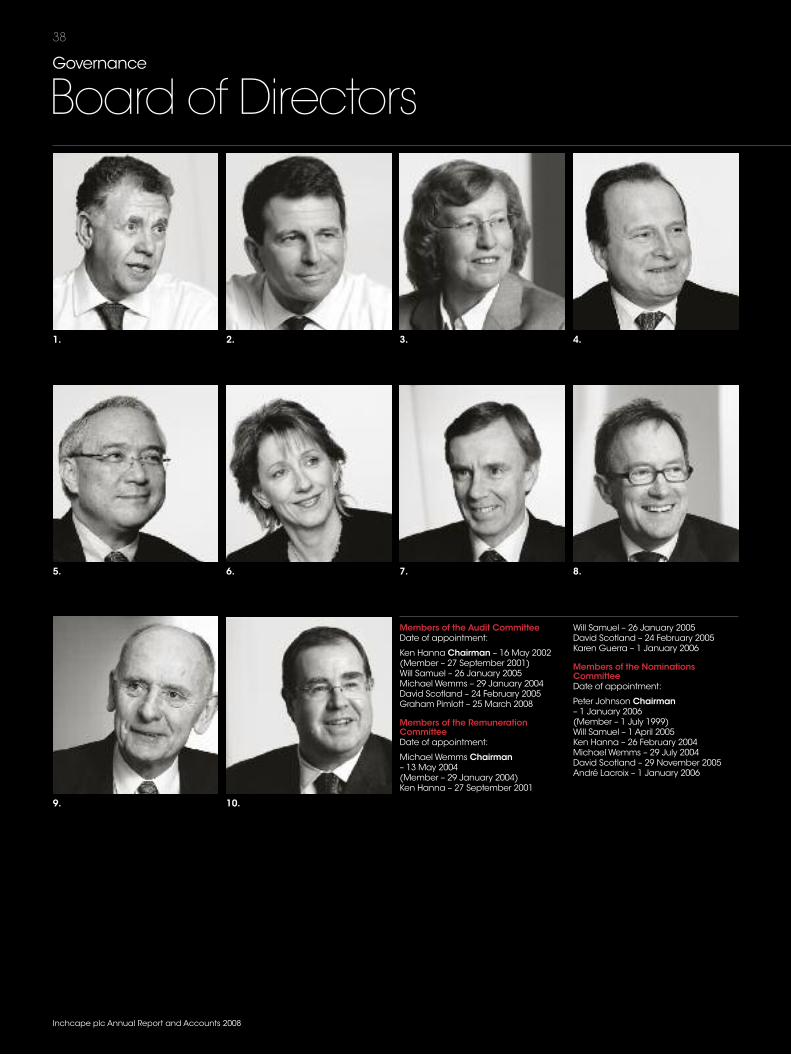
38
Inchcape plc Annual Report and Accounts 2008
Governance
Board of Directors
1. 2. 3. 4.
5. 6. 7. 8.
9. 10.
Members of the Audit CommitteeDate of appointment:
Ken Hanna Chairman – 16 May 2002(Member – 27 September 2001)Will Samuel – 26 January 2005Michael Wemms – 29 January 2004David Scotland – 24 February 2005Graham Pimlott – 25 March 2008
Members of the RemunerationCommitteeDate of appointment:
Michael Wemms Chairman– 13 May 2004(Member – 29 January 2004)Ken Hanna – 27 September 2001
Will Samuel – 26 January 2005David Scotland – 24 February 2005Karen Guerra – 1 January 2006
Members of the NominationsCommitteeDate of appointment:
Peter Johnson Chairman– 1 January 2006(Member – 1 July 1999)Will Samuel – 1 April 2005Ken Hanna – 26 February 2004Michael Wemms – 29 July 2004David Scotland – 29 November 2005André Lacroix – 1 January 2006
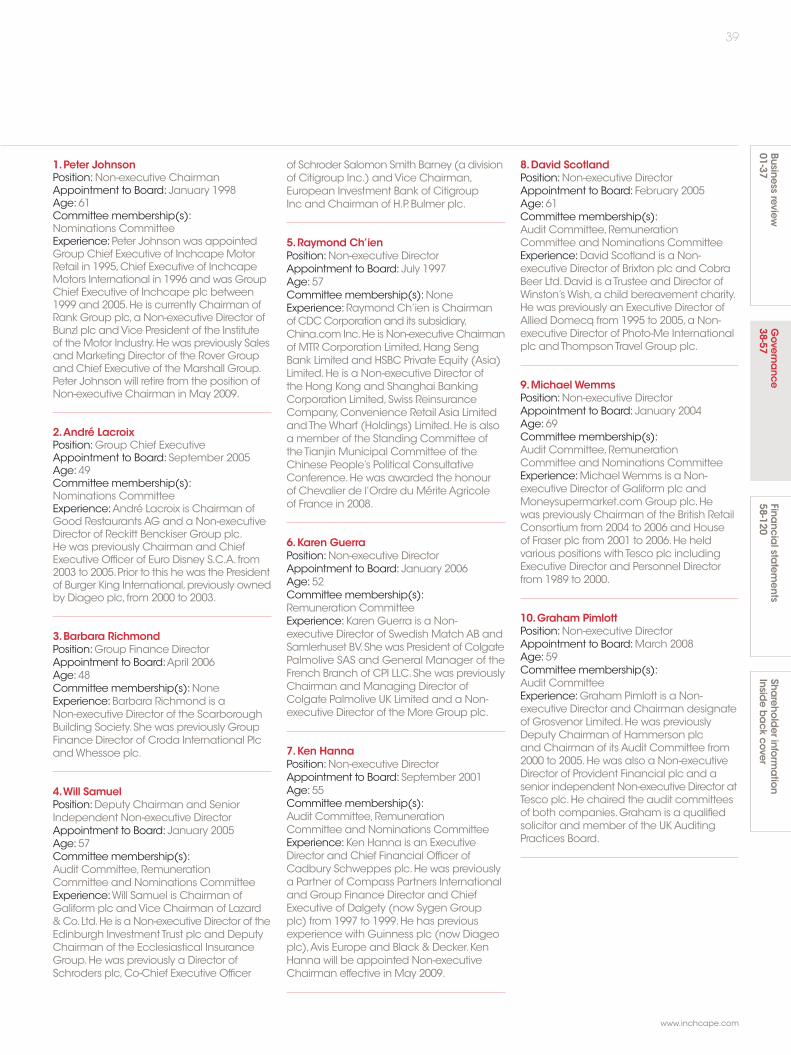
39
www.inchcape.com
Businessreview
01-37Governa
nce38-57
Financia
lstatem
ents58-120
Shareho
lderinfo
rmation
Insideback
cover
1.Peter JohnsonPosition:Non-executive ChairmanAppointment to Board: January 1998Age: 61Committee membership(s):Nominations CommitteeExperience:Peter Johnson was appointedGroup Chief Executive of InchcapeMotorRetail in 1995,Chief Executive of InchcapeMotors International in 1996 and was GroupChief Executive of Inchcape plc between1999 and 2005.He is currently Chairman ofRank Group plc,a Non-executive Director ofBunzl plc andVice President of the Instituteof the Motor Industry.He was previously SalesandMarketing Director of the Rover Groupand Chief Executive of the Marshall Group.Peter Johnson will retire from the position ofNon-executive Chairman in May 2009.
2.André LacroixPosition:Group Chief ExecutiveAppointment to Board: September 2005Age: 49Committee membership(s):Nominations CommitteeExperience:André Lacroix is Chairman ofGood Restaurants AG and a Non-executiveDirector of Reckitt Benckiser Group plc.He was previously Chairman and ChiefExecutive Officer of Euro Disney S.C.A. from2003 to 2005.Prior to this he was the Presidentof Burger King International,previously ownedby Diageo plc, from 2000 to 2003.
3.Barbara RichmondPosition:Group Finance DirectorAppointment to Board:April 2006Age: 48Committee membership(s):NoneExperience: Barbara Richmond is aNon-executive Director of the ScarboroughBuilding Society.She was previously GroupFinance Director of Croda International PlcandWhessoe plc.
4.Will SamuelPosition:Deputy Chairman and SeniorIndependent Non-executive DirectorAppointment to Board: January 2005Age: 57Committee membership(s):Audit Committee,RemunerationCommittee and Nominations CommitteeExperience:Will Samuel is Chairman ofGaliform plc andVice Chairman of Lazard&Co.Ltd.He is a Non-executive Director of theEdinburgh Investment Trust plc and DeputyChairman of the Ecclesiastical InsuranceGroup.He was previously a Director ofSchroders plc,Co-Chief Executive Officer
of Schroder Salomon Smith Barney (a divisionof Citigroup Inc.) andVice Chairman,European Investment Bank of CitigroupInc and Chairman of H.P.Bulmer plc.
5.Raymond Ch’ienPosition:Non-executive DirectorAppointment to Board: July 1997Age: 57Committee membership(s):NoneExperience: Raymond Ch’ien is Chairmanof CDCCorporation and its subsidiary,China.com Inc.He is Non-executiveChairmanof MTR Corporation Limited,Hang SengBank Limited and HSBC Private Equity (Asia)Limited.He is a Non-executive Director ofthe Hong Kong and Shanghai BankingCorporation Limited,Swiss ReinsuranceCompany,Convenience Retail Asia LimitedandTheWharf (Holdings) Limited.He is alsoa member of the Standing Committee oftheTianjin Municipal Committee of theChinese People’s Political ConsultativeConference.He was awarded the honourof Chevalier de l’Ordre du Mérite Agricoleof France in 2008.
6.Karen GuerraPosition:Non-executive DirectorAppointment to Board: January 2006Age: 52Committee membership(s):Remuneration CommitteeExperience: Karen Guerra is a Non-executive Director of Swedish MatchAB andSamlerhuset BV.She was President of ColgatePalmolive SAS and General Manager of theFrench Branch of CPI LLC.She was previouslyChairman andManaging Director ofColgate Palmolive UK Limited and a Non-executive Director of the More Group plc.
7.Ken HannaPosition:Non-executive DirectorAppointment to Board: September 2001Age: 55Committee membership(s):Audit Committee,RemunerationCommittee and Nominations CommitteeExperience: Ken Hanna is an ExecutiveDirector and Chief Financial Officer ofCadbury Schweppes plc.He was previouslya Partner of Compass Partners Internationaland Group Finance Director and ChiefExecutive of Dalgety (now Sygen Groupplc) from 1997 to 1999.He has previousexperience with Guinness plc (now Diageoplc),Avis Europe and Black & Decker.KenHanna will be appointed Non-executiveChairman effective in May 2009.
8.David ScotlandPosition:Non-executive DirectorAppointment to Board: February 2005Age: 61Committee membership(s):Audit Committee,RemunerationCommittee and Nominations CommitteeExperience:David Scotland is a Non-executive Director of Brixton plc and CobraBeer Ltd.David is aTrustee and Director ofWinston’sWish,a child bereavement charity.He was previously an Executive Director ofAllied Domecq from 1995 to 2005,a Non-executive Director of Photo-Me Internationalplc andThompsonTravel Group plc.
9.MichaelWemmsPosition:Non-executive DirectorAppointment to Board: January 2004Age: 69Committee membership(s):Audit Committee,RemunerationCommittee and Nominations CommitteeExperience:MichaelWemms is a Non-executive Director of Galiform plc andMoneysupermarket.comGroup plc.Hewas previously Chairman of the British RetailConsortium from 2004 to 2006 and Houseof Fraser plc from 2001 to 2006.He heldvarious positions with Tesco plc includingExecutive Director and Personnel Directorfrom 1989 to 2000.
10.Graham PimlottPosition:Non-executive DirectorAppointment to Board:March 2008Age: 59Committee membership(s):Audit CommitteeExperience:Graham Pimlott is a Non-executive Director and Chairman designateof Grosvenor Limited.He was previouslyDeputy Chairman of Hammerson plcand Chairman of its Audit Committee from2000 to 2005.He was also a Non-executiveDirector of Provident Financial plc and asenior independent Non-executive Director atTesco plc.He chaired the audit committeesof both companies.Graham is a qualifiedsolicitor andmember of the UKAuditingPractices Board.
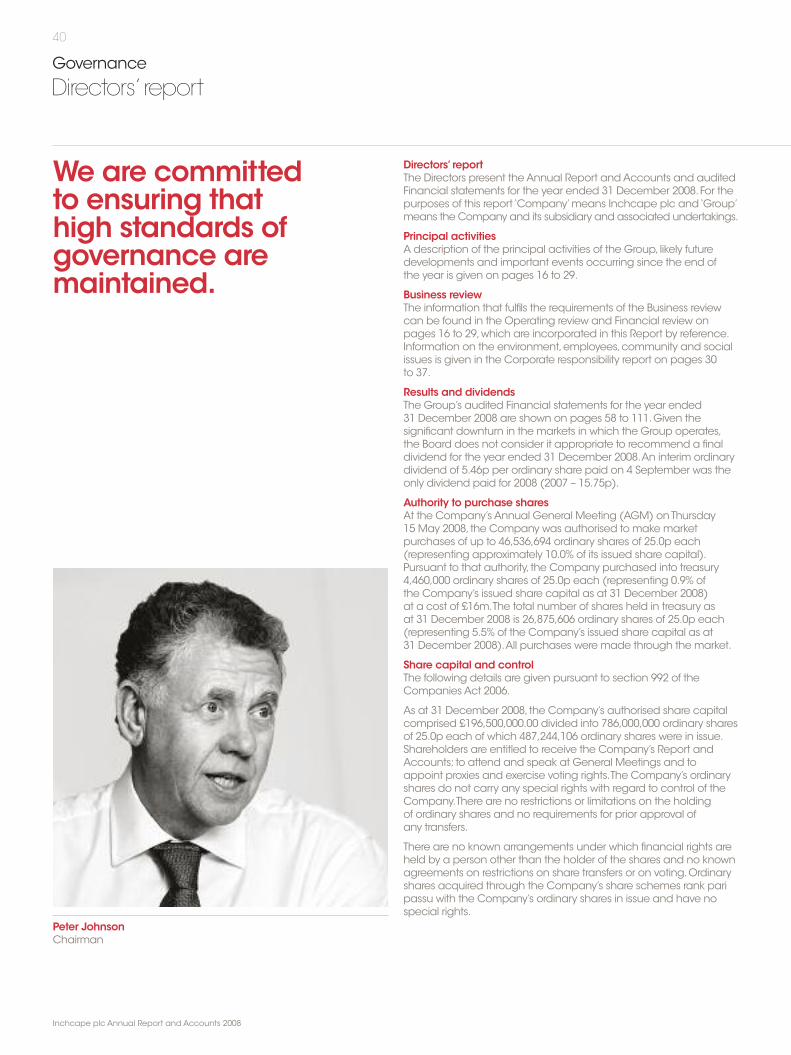
40
Inchcape plc Annual Report and Accounts 2008
Governance
Directors’ report
Peter JohnsonChairman
Directors’ reportThe Directors present theAnnual Report andAccounts and auditedFinancial statements for the year ended 31 December 2008.For thepurposes of this report ‘Company’means Inchcape plc and‘Group’means the Company and its subsidiary and associated undertakings.
Principal activitiesA description of the principal activities of the Group, likely futuredevelopments and important events occurring since the end ofthe year is given on pages 16 to 29.
Business reviewThe information that fulfils the requirements of the Business reviewcan be found in the Operating review and Financial review onpages 16 to 29,which are incorporated in this Report by reference.Information on the environment,employees,community and socialissues is given in the Corporate responsibility report on pages 30to 37.
Results and dividendsThe Group’s audited Financial statements for the year ended31 December 2008 are shown on pages 58 to 111.Given thesignificant downturn in the markets in which the Group operates,the Board does not consider it appropriate to recommend a finaldividend for the year ended 31 December 2008.An interim ordinarydividend of 5.46p per ordinary share paid on 4 September was theonly dividend paid for 2008 (2007 – 15.75p).
Authority to purchase sharesAt the Company’s Annual General Meeting (AGM) onThursday15 May 2008, the Company was authorised to make marketpurchases of up to 46,536,694 ordinary shares of 25.0p each(representing approximately 10.0% of its issued share capital).Pursuant to that authority, the Company purchased into treasury4,460,000 ordinary shares of 25.0p each (representing 0.9% ofthe Company’s issued share capital as at 31 December 2008)at a cost of £16m.The total number of shares held in treasury asat 31 December 2008 is 26,875,606 ordinary shares of 25.0p each(representing 5.5% of the Company’s issued share capital as at31 December 2008).All purchases were made through the market.
Share capital and controlThe following details are given pursuant to section 992 of theCompanies Act 2006.
As at 31 December 2008, the Company’s authorised share capitalcomprised £196,500,000.00 divided into 786,000,000 ordinary sharesof 25.0p each of which 487,244,106 ordinary shares were in issue.Shareholders are entitled to receive the Company’s Report andAccounts; to attend and speak at General Meetings and toappoint proxies and exercise voting rights.The Company’s ordinaryshares do not carry any special rights with regard to control of theCompany.There are no restrictions or limitations on the holdingof ordinary shares and no requirements for prior approval ofany transfers.
There are no known arrangements under which financial rights areheld by a person other than the holder of the shares and no knownagreements on restrictions on share transfers or on voting.Ordinaryshares acquired through the Company’s share schemes rank paripassu with the Company’s ordinary shares in issue and have nospecial rights.
We are committedto ensuring thathigh standards ofgovernance aremaintained.
41
www.inchcape.com
Businessreview
01-37Governa
nce38-57
Financia
lstatem
ents58-120
Shareho
lderinfo
rmation
Insideback
cover
As far as the Company is aware there are no persons with significantdirect or indirect holdings in the Company,save as disclosed in thetable set out under the heading‘significant shareholdings’belowwhich shows those persons who have notified the Company oftheir interest in the Company’s ordinary shares pursuant to Rule 5of the Disclosure andTransparency Rules.
The appointment and replacement of Directors is governedby the Company’s articles of association.
Any changes to the articles of association must be approved bythe shareholders in accordance with the legislation in force fromtime to time.
The Directors have authority to issue and allot ordinary sharespursuant to article 7 of the Company’s articles of association.The Directors have authority to make market purchases of ordinaryshares.This authority is renewed annually at theAGM.
The Company is not party to any significant agreements thatwould take effect,alter or terminate upon a change of controlof the Company following a takeover bid.
Except as shown below, the Company does not have agreementswith any Director or employee providing compensation for loss ofoffice or employment that occurs because of a takeover bid,exceptfor provisions in the rules of the Company’s share schemes whichmay result in options or awards granted to employees to vest ona takeover.
Dale Butcher is entitled to receive an enhanced payment if hiscontract is terminated due to a change of control of twelve months’salary,a bonus payment based on the average of the prior threeyears’bonus payments,a deferred twelve month pension annuityand a payment in lieu of use of his company car.
Directors’ indemnityA qualifying third party indemnity (QTPI),as permitted by theCompany’s articles of association and sections 309A to 309C of theCompanies Act 2006,has been granted by the Company to eachof the Directors of the Company.Under the provisions of the QTPI theCompany undertakes to indemnify each Director against liability tothird parties (excluding criminal and regulatory penalties) and topay Directors’costs as incurred,provided that they are reimbursedto the Company if the Director is found guilty or, in an action broughtby the Company, judgement is given against the Director.
Significant shareholdingsAs at 13 March 2009, the following notifications of substantialinterests in the Company’s issued ordinary share capital had beenreceived pursuant to the provisions of the Companies Act 2006:
% atHolding No.of shares 13 Mar 09
AVIVA Investors Global Services 58,287,219 12.66
Mr George Horesh 44,687,781 9.71
Lloyds Banking Group 38,187,696 8.30
F&CAsset Management 26,347,905 5.72
Toyota Motor Corporation 25,230,108 5.48
DirectorsThe names of the Directors,plus brief biographical details, includingthose Directors offering themselves for election or re-election,aregiven on page 38.Each Director held office throughout the year,except Graham Pimlott who joined on 25 March 2008.
David Scotland andMichaelWemms will retire by rotation at theAGM and offer themselves for re-election in accordance with thearticles of association.
At the 2008AGM,Peter Johnson gave notice of his intention to retireat the 2009AGM.The Nominations Committee has recommendedto the Board that Ken Hanna replace Peter Johnson as Chairman.Ken Hanna will also offer himself for re-election at theAGM.Fulldetails can be found in the Nominations Committee report onpage 50.
Directors’ interestsThe table below shows the beneficial interests,other than shareoptions, including family interests,on the dates indicated, in theordinary shares of the Company of the persons who were Directorsat 31 December 2008.
Ordinary shares of 25.0p each31 Dec 2008 1 Jan 2008
Peter Johnson 209,425 205,972
André Lacroix 459,160 317,254
Barbara Richmond 161,916 98,314
Raymond Ch’ien 136,369 130,000
Karen Guerra 20,000 0
Ken Hanna 37,000 37,000
Graham Pimlott 20,000 –
Will Samuel 12,000 12,000
David Scotland 11,298 11,298
MichaelWemms 7,564 7,210
Details of share options held by Directors, including under theExecutive share option plan and save as you earn (SAYE) scheme,together with details of awards under the deferred bonus plan andco-investment plan,are shown in notes 3,4 and 5 on pages 56and 57.
Employee benefit trustThe Executive Directors of the Company, together with otheremployees of the Group,are potential beneficiaries of the InchcapeEmployeeTrust (Trust) and,as such,are deemed to be interestedin any ordinary shares held by theTrust.At 31 December 2008, theTrust’s shareholding totalled 2,315,380 ordinary shares (1 January2007 – 1,715,739 ordinary shares).
Between 1 January 2009 and 6 March 2009 theTrust did nottransfer any shares to satisfy the exercise of awards underemployee share plans.

42
Inchcape plc Annual Report and Accounts 2008
Governance
Directors’ report continued
Transactions with DirectorsNo transaction,arrangement or agreement required to be disclosedunder the Companies Act 2006 and IAS 24 was outstanding at31 December 2008,or occurred during the year, for any Directorand/or connected person (2007 – none).
Related party transactionsThe Company entered into no related party transactions thatrequire disclosure.
Creditor payment policyThe Company has no trade creditors (2007 – none).The Group isresponsible for agreeing the terms and conditions, including termsof payment under which business transactions with the Group’ssuppliers are conducted.Whilst the Group does not follow anysingle external code or standard, in line with Inchcape Group policy,payments to suppliers are made in accordance with agreed termsand conditions.
Going concernIn determining whether the Group is a going concern, the Directorshave reviewed the Group’s current financial position and haveprepared detailed financial projections.These projections reflectthe recent unprecedented downturn in economic conditions andcredit availability across the Group’s operations, the actions alreadytaken to restructure the business and the plans in place to focusoperations on the five core priorities of growingmarket share,growingaftersales,managing working capital and reducing overheads andcapital expenditure (see page 8).
The projections also assume that: new car sales will continue todecline in 2009 and not begin to recover until the second half of2010; the service and parts business will be more resilient to thedownturn; lower UK interest rates will continue; key brand partnerswill remain in production and supply on normal terms of trade;and there will be no further significant downturn in the globaleconomic environment.
These projections,even after allowing for headroom toaccommodate a reasonable downside scenario (includingweaker trading and adverse movements in currency and interestrates), indicate that the Group would be able to manage itsoperations so as to remain within its current facilities and incompliance with its banking covenant.
Accordingly,after making enquiries, the Directors have a reasonableexpectation that the Company and the Group have adequateresources to continue as a going concern for the foreseeable future.As such, the Company and the Group continue to adopt the goingconcern basis in preparing the annual report and accounts.
Charitable and political donationsThe Group’s charitable donations, including the amounts,areshown on page 35.
No political donations were made during 2008.
Events after the balance sheet dateSee note 32 on page 111.
Principal business risk factorsThese risks are shown on pages 27 to 29.
Auditors and disclosure of information to auditorsSo far as the Directors are aware, there is no relevant auditinformation of which the Company’s auditors are unaware.
The Directors have taken all the steps that they ought to have takenas Directors in order to make themselves aware of any relevant auditinformation and to establish that the Company’s auditors are awareof that information.
Key contractual and other arrangementsOther than arrangements with SAP, the Company’s contracts areat an operating unit level rather than a Group level.As a result noindividual supplier or customer contract is significant to the business.
The Group’s relationships with its brand partners are managed atGroup level.However, the contracts with brand partners are at alocal level with day to day management being led by eachoperating business.
Annual General MeetingTheAGMwill be held at 11.00 a.m.onThursday 14 May 2009at The Royal Automobile Club,89-91 Pall Mall, London SW1Y 5HS.The notice convening the meeting and the resolutions to be putto the meeting, together with the explanatory notes,are given inthe Circular to all shareholders.
The auditors,PricewaterhouseCoopers LLP,have indicated theirwillingness to continue in office.A resolution to reappoint themas auditors will be proposed at theAGM.
By order of the Board
Claire ChapmanGeneral Counsel and Group Company SecretaryInchcape plc

43
www.inchcape.com
Businessreview
01-37Governa
nce38-57
Financia
lstatem
ents58-120
Shareho
lderinfo
rmation
Insideback
cover
Martin TaylorPosition:Chief Executive Officer,Europe Distribution,Africa and SouthAmericaAppointment to Executive Committee: February 2006Age: 54Skills and experience:Martin joined the Group in 1984 in theFinance Division,having been a Senior Manager in Coopers& Lybrand.He becameManaging Director of Toyota HellasGreece in 1987. In 1991,he moved to the position of Chairmanof Toyota Belgium and from 2000 he took on wider regionalresponsibilities including Europe Distribution in 2006.Martin isa qualified chartered accountant.
Claire ChapmanPosition:General Counsel and Group Company SecretaryAppointment to Executive Committee:March 2007Age: 41Skills and experience:Claire joined the Group on 12 March 2007.Formerly General Counsel,Europe,Middle East andAfrica,ReutersPLC,Claire is a qualified solicitor,England andWales and attorney,NewYork and has her Masters in International Law.
Dale ButcherPosition:Group Business Development DirectorAppointment to Executive Committee: February 2006Age: 53Skills and experience: Dale joined British Timken,a subsidiaryof theTimken Company,as a Financial Analyst in 1980 andmoved to Kuwait to work for theAlghanim Company as BusinessDevelopment Manager from 1982.Dale joined Inchcape in 1985,initially in Group Finance and then as a Divisional Director forInchcapeTesting and Business Machines. In 1996,Dale wasappointed Group Business Development Director.He is alsoa Member of London Regional CBI Council.
Tony GeorgePosition:Group Human Resources DirectorAppointment to the Executive Committee: February 2007Age: 44Skills and experience:Tony joined the Group on 1 February 2007.Hehas over 20 years of experience in Human Resources and GeneralManagement in International FMCG and retail companies. In hisprior roles he was HR Director,Corporate Functions forVodafone plcand,before that,SeniorVice President International Partner Resourcesfor Starbucks Coffee Company based in the USA.He has alsoworked with ICI in India and Diageo in the UK.
John McConnellPosition:Chief Executive Officer, InchcapeAustralia and New ZealandAppointment to the Executive Committee: February 2006Age: 47Skills and experience: John worked for Reckitt & Colman,now ReckittBenckiser, for thirteen years in various senior financial roles inAustralia,Germany and the UK.He joined InchcapeAustralia in May 1999as Finance Director and in 2003 moved into the role of ManagingDirector for Sydney Retail,AutoNexus and Inchcape Motors beforebecoming Chief Executive Officer for Australia and New Zealand inMay 2005.John holds a BEc andMBA.
WilliamTsuiPosition:Chairman, InchcapeAsia-Pacific LimitedAppointment to Executive Committee: February 2006Age: 65Skills & Experience:William has held various positions withinCapitol Oldsmobile,Sunrise Chrysler,Plymouth and Mitsubishiin Sacramento,California.He was also General Manager ofJefferson Motors Inc. in Concord,California andVice Presidentof Marketing for Ford Motors in San Francisco,California.Williamjoined CrownMotors Limited in Hong Kong in 1991 as GeneralManager of Sales and Marketing and becameManagingDirector in 1994.Between 2000 and 2007,he was Chief ExecutiveOfficer of Borneo Motors Limited in Singapore;Chairman andChief Executive Officer of Crown Motors Limited and subsequentlybecame Chairman and Chief Executive Officer of InchcapeAsia-Pacific Limited. In 2007,he was appointed as Chairmanand Chief Executive Officer for Inchcape China and Chairmanof InchcapeAsia-Pacific Limited.
As mentioned in the Chairman’s statement,WilliamTsui sadlypassed away in February 2009.
Trevor AmeryPosition:Chairman,SubaruAustraliaDirector, InchcapeAustraliaAppointment to the Executive Committee: February 2006Age: 55Skills and experience:Trevor has 26 years’automotive experiencewith senior roles in accounting,marketing and operations.He wasthe Managing Director of SubaruAustralia for thirteen years whichwas awardedAustralian Market of theYear in 1995.Trevor is alsoa Director of a software development company and the FederalChambers of Automotive Industries.Trevor retired from the Groupin January 2009.
Spencer LockPosition:Chief Executive, Inchcape Retail UKAppointment to Executive Committee: February 2006Age: 42Skills and experience: Spencer joined Inchcape Retail as Financeand Insurance Director in 1998. In 1999 he was appointed FranchiseDirector for theToyota and Lexus Division and subsequently for otherfranchises, including the Premier Automotive Group andMercedes-Benz.He took up the newly created position of Operations Directorin February 2004 before being appointed Managing Director inSeptember of that year. In April 2007,he was appointed asChief Executive.
Governance
Executive Committee

44
Inchcape plc Annual Report and Accounts 2008
Governance
Executive Committee continued
George AshfordPosition:Managing Director,European RetailAppointment to Executive Committee:October 2006Age: 41Skills and experience:George joined Kingfisher Plc in 1994 inthe Business Development Department and then moved to YumRestaurants International,previously Pepsi Restaurants International,in 1996.He spent ten years withYum holding several seniormanagement positions which culminated in Board positions inYum’stwo UK based operating businesses.He was Product ExcellenceDirector for KFC (GB) from 2000 to 2003 and Operations Director forPizza Hut (UK) from 2003 to 2006.He joined Inchcape in March 2006as Director of Implementation, InchcapeAdvantage.
Immo RupfPosition:Managing Director, Inchcape RussiaAppointment to Executive Committee:March 2006Age: 44Skills and experience: Immo was a Partner andVice President of theBoston Consulting Group (BCG) in Munich,Shanghai and Paris from1989 to 2003 and Group Chief Financial Officer for AlcoaAsia andLatin America from 2004 to 2006.His main focus at BCG andAlcoawas on business strategy,corporate development and performancemanagement for automotive and consumer businesses.
Ken LeePosition:Group Communications DirectorAppointment to Executive Committee:November 2006Age: 52Skills and experience: Ken held the position of Group MarketingDirector for the RAC from 1999 to 2003,being part of the team thatacquired and then led the business post-demutualisation.Duringhis tenure, the company successfully moved from a car breakdownorganisation to a customer-focused motoring services group.Priorto the RAC,Ken worked for Lex Service plc for five years,where,asMarketing Director,he successfully established the Hyundai brand inthe UK.Ken joined Inchcape UK as Marketing Director in September2003 where he led the development of a pioneering customerexperience programme.
Patrick S LeePosition:Managing Director, Inchcape North AsiaAppointment to Executive Committee:November 2006Age: 47Skills and experience: Before joining Inchcape,Patrick was theGroup General Manager,Sales and Marketing of Kerry BeveragesLtd from 1998 to mid 2006.His experience in auto retailing camefrom aToronto Honda dealership where he worked for three yearsand was awarded the highest honour ‘Sales Master’by HondaCanada in 1991 and 1992.He started his career in brandmarketingwith Procter & Gamble,and he has worked in various locationsincluding Geneva,Thailand and Hong Kong.Patrick is a SAP GlobalProgramme Board Member and received academic achievementin his MBA.
Bertrand MalletPosition:Group Strategy DirectorAppointment to Executive Committee: July 2008Age: 36Skills and experience: Before joining Inchcape,Bertrand spentover six years with Euro Disney in both strategy and sales roles,mostrecently as Managing Director for the French market.Prior to joiningEuro Disney he spent five years as a senior consultant with Bain& Company both in France and in the USA.He began his careerwith Automobiles Peugeot in Stockholm,Sweden.

45
www.inchcape.com
Governance
Corporate governance report
Businessreview
01-37Governa
nce38-57
Financia
lstatements
58-120Shareho
lderinfo
rmation
Insidebackcover
Governance frameworkThe Board is committed to ensuring that the Group deliversshareholder value in the long term and recognises that goodgovernance will facilitate the achievement of sustainable growth.
The following sections explain how the Company has compliedwith the main and supporting principles of the 2006 CombinedCode (Code). It is the Board’s view that it has been fully compliantwith the Code throughout the year.
A statement of the Directors’ responsibilities for preparing theFinancial statements, including a statement regarding the statusof the Company as a going concern, is on page 42.
The Board of DirectorsThe Board comprises a Non-executive Chairman, sevenNon-executive Directors and two Executive Directors.
The role of Chairman and Group Chief Executive are separateand there is a clear division of responsibilities.The Chairman,Peter Johnson, is responsible for the leadership of the Board andthe balance of its membership.The Group Chief Executive,AndréLacroix, is responsible for leading and managing the business,with support from the Executive Committee.
Will Samuel is the Deputy Chairman and Senior IndependentNon-executive Director.
Ken Hanna is the Chairman of the Audit Committee,Michael Wemmsis Chairman of the Remuneration Committee and Peter Johnson isChairman of the Nominations Committee.
Graham Pimlott was appointed as a Non-executive Directoron 25 March 2008.
The biographies of the Directors (including details of otherdirectorships held) and the Executive Committee are on page 39and 43 to 44 respectively.The Chairman’s other significantcommitments are also included in his biography on page 39 andthe Board is satisfied that these do not have a detrimental impacton his time commitment to the Company.
At the 2008 Annual General Meeting (AGM), Peter Johnsonannounced his intention to retire from the Company. Ken Hanna,a Non-executive Director, will take over the role as Chairman at the2009 AGM. Further details of the appointment can be found in theNominations Committee report on page 50.
The Company’s articles of association require that every Directorwill seek re-election to the Board at least every three years, subjectto election by shareholders at their first AGM.The reappointment ofa Non-executive Director after six years is subject to a rigorous review.A Non-executive Director who has served for more than nine yearsis subject to annual re-election.All Directors are subject to theprovisions of the Companies Act 2006 in relation to the removalof directors.
The details of those Directors subject to re-election are shownon page 41.
In accordance with the Companies Act 2006 and the principlesof good governance, the Board is collectively responsible forpromoting the success of the Company and for providing strongleadership within a framework of prudent and effective controlsthat enable risks to be assessed and managed.
There is a schedule of Matters Reserved for the Board, which isreviewed annually, and which identifies those matters that theBoard does not delegate to management. Matters are referredto the Board as a whole and no one individual or small groupof individuals has unfettered powers of decision making.
Matters Reserved for the BoardSummary• Responsibility for overall management of the Group and
the approval of long-term objectives and strategy;
• Approval of the Group’s financial policy, material capitalexpenditure, acquisitions and disposals;
• Approval of any changes to the Group’s capital structure,corporate structure and operational structure;
• Approval of Annual and Interim reports and any financial results;
• Declaration of interim and recommendation of final dividend;
• Approval of accounting and treasury polices;
• Ensuring maintenance of internal control systems andrisk management processes;
• Approval of all circulars, listing particulars and resolutions sentto shareholders;
• Approval of changes to the Board and its Committees, andapproval of the Committee’s terms of reference and theschedule of Matters Reserved for the Board;
• Approval of the division of responsibilities between theChairman and Group Chief Executive;
• Recommending the election or re-election of Directors toshareholders and the appointment or removal of the GroupCompany Secretary;
• Recommending the appointment or removal of the externalauditor to the shareholders;
• Reviewing the Group’s corporate governance arrangementsand approval of the Group’s policies;
• Approval of major changes to the Group’s pension schemesand changes in the fund management arrangements;
• Approval of the appointment of principal external advisors.
The full schedule of Matters Reserved for the Board can be foundat www.inchcape.com/aboutus/corporategovernance.
Specific responsibilities have been delegated to Board Committees,details of which are given on pages 49 to 51.
The Company provides insurance cover in respect of legal actionagainst its Directors, which is reviewed on an annual basis.
Board meetings and attendanceThe Board held nine scheduled meetings during 2008, whichincluded overseas meetings at the Company’s facilities inSingapore and Russia.The Board also met for ad hoc meetingsto deal with specific issues.Where a Director is unable to attenda meeting, he/she is advised in advance of the matters to bediscussed and given an opportunity to make his/her views knownto the Chairman, Committee Chairman or Group CompanySecretary before the meeting.
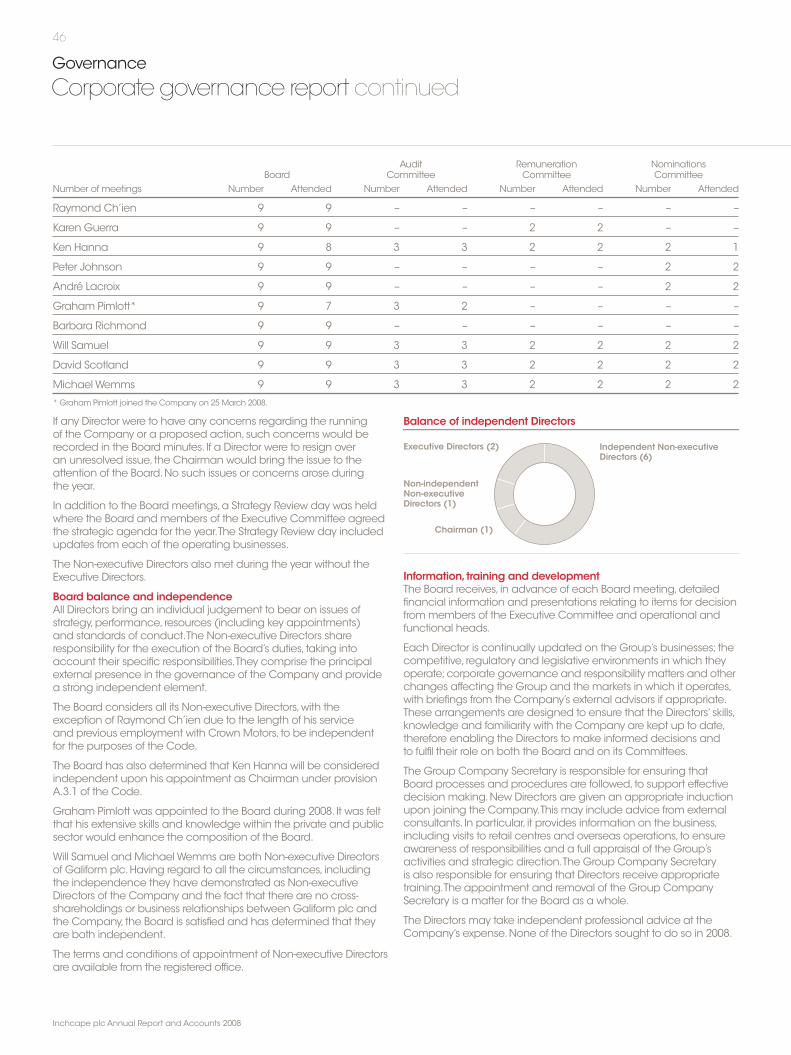
46
Inchcape plc Annual Report and Accounts 2008
Governance
Corporate governance report continued
If any Director were to have any concerns regarding the runningof the Company or a proposed action, such concerns would berecorded in the Board minutes. If a Director were to resign overan unresolved issue, the Chairman would bring the issue to theattention of the Board. No such issues or concerns arose duringthe year.
In addition to the Board meetings, a Strategy Review day was heldwhere the Board and members of the Executive Committee agreedthe strategic agenda for the year.The Strategy Review day includedupdates from each of the operating businesses.
The Non-executive Directors also met during the year without theExecutive Directors.
Board balance and independenceAll Directors bring an individual judgement to bear on issues ofstrategy, performance, resources (including key appointments)and standards of conduct.The Non-executive Directors shareresponsibility for the execution of the Board’s duties, taking intoaccount their specific responsibilities.They comprise the principalexternal presence in the governance of the Company and providea strong independent element.
The Board considers all its Non-executive Directors, with theexception of Raymond Ch’ien due to the length of his serviceand previous employment with Crown Motors, to be independentfor the purposes of the Code.
The Board has also determined that Ken Hanna will be consideredindependent upon his appointment as Chairman under provisionA.3.1 of the Code.
Graham Pimlott was appointed to the Board during 2008. It was feltthat his extensive skills and knowledge within the private and publicsector would enhance the composition of the Board.
Will Samuel and Michael Wemms are both Non-executive Directorsof Galiform plc. Having regard to all the circumstances, includingthe independence they have demonstrated as Non-executiveDirectors of the Company and the fact that there are no cross-shareholdings or business relationships between Galiform plc andthe Company, the Board is satisfied and has determined that theyare both independent.
The terms and conditions of appointment of Non-executive Directorsare available from the registered office.
Information,training and developmentThe Board receives, in advance of each Board meeting, detailedfinancial information and presentations relating to items for decisionfrom members of the Executive Committee and operational andfunctional heads.
Each Director is continually updated on the Group’s businesses; thecompetitive, regulatory and legislative environments in which theyoperate; corporate governance and responsibility matters and otherchanges affecting the Group and the markets in which it operates,with briefings from the Company’s external advisors if appropriate.These arrangements are designed to ensure that the Directors’ skills,knowledge and familiarity with the Company are kept up to date,therefore enabling the Directors to make informed decisions andto fulfil their role on both the Board and on its Committees.
The Group Company Secretary is responsible for ensuring thatBoard processes and procedures are followed, to support effectivedecision making. New Directors are given an appropriate inductionupon joining the Company.This may include advice from externalconsultants. In particular, it provides information on the business,including visits to retail centres and overseas operations, to ensureawareness of responsibilities and a full appraisal of the Group’sactivities and strategic direction.The Group Company Secretaryis also responsible for ensuring that Directors receive appropriatetraining.The appointment and removal of the Group CompanySecretary is a matter for the Board as a whole.
The Directors may take independent professional advice at theCompany’s expense. None of the Directors sought to do so in 2008.
Executive Directors (2)
Non-independentNon-executiveDirectors (1)
Chairman (1)
Independent Non-executiveDirectors (6)
Balance of independent Directors
Audit Remuneration NominationsBoard Committee Committee Committee
Number of meetings Number Attended Number Attended Number Attended Number Attended
Raymond Ch’ien 9 9 – – – – – –
Karen Guerra 9 9 – – 2 2 – –
Ken Hanna 9 8 3 3 2 2 2 1
Peter Johnson 9 9 – – – – 2 2
André Lacroix 9 9 – – – – 2 2
Graham Pimlott* 9 7 3 2 – – – –
Barbara Richmond 9 9 – – – – – –
Will Samuel 9 9 3 3 2 2 2 2
David Scotland 9 9 3 3 2 2 2 2
Michael Wemms 9 9 3 3 2 2 2 2
* Graham Pimlott joined the Company on 25 March 2008.
47
www.inchcape.com
Performance evaluationThe Board undertook a formal evaluation of its own and eachBoard Committee’s performance, roles and terms of reference.The Board considers that an evaluation of its performance is key toensuring an effective Board, which in turn is vital to the success ofthe Company.The Board reviewed the process in November 2008and determined that an external facilitation was not necessary.The decision was based on the fact that the composition of theBoard had not changed significantly during 2008 and the Boardhad successfully implemented recommended changes from the2006 external evaluation and the 2007 evaluation.
Led by the Chairman and supported by the Group CompanySecretary, a performance evaluation questionnaire was used forthe performance evaluation process.This questionnaire covered theeffectiveness of the Board, each Committee’s performance againstobjectives, preparation for and performance at meetings andcorporate governance matters. It addressed the issues raised bythe Higgs Review on the role and effectiveness of Non-executiveDirectors published in January 2003. Following the evaluation, theBoard members concluded that appropriate actions have beenidentified to address areas that could be improved and that, overall,the Board and Committees continued to perform effectively.
The Chairman evaluates the performance of the Non-executiveDirectors and met with each individually to discuss performance.The Non-executive Directors, chaired by the Senior IndependentNon-executive Director, met without the presence of the Chairmanto evaluate the Chairman’s performance.
Following the performance evaluation process, the Chairman hasconfirmed that the Non-executive Directors standing for re-electionat this year’s AGM continue to perform effectively and demonstratecommitment to their roles.The Board will continue to reviewperformance annually.
Relationship with shareholdersThe Board understands the importance of maintaining goodcommunication with its shareholders.After the preliminary andinterim announcements,meetings are held with institutional investorsto keep them up to date with the Company’s progress throughoutthe year and to discuss any issues they may have. This ensures thatinvestors have a balanced view of performance and the issuesfacing the Company.
In 2008, the meetings were attended by the Group Chief Executive,the Group Finance Director and the Investor Relations Manager. TheChairman and Non-executive Directors are also given the opportunityto meet institutional shareholders.The Senior Independent Non-executive Director is available to shareholders if contact throughnormal channels is inappropriate.
Other meetings are held for investors and analysts that cover a widerange of issues including strategy, performance and governance.The Investor Relations Manager provided the Board with regularupdates on the views of the Company’s major investors. Duringthe year, the Board received external presentations from advisors,including the Company’s brokers, on shareholder and marketperception of the Company’s strategy.
The Board is equally concerned with the views of privateshareholders. The Group Company Secretary manages day today communication with these shareholders and they are activelyencouraged to give their views using the prepaid reply form issuedeach year with the AGM documentation.This is particularly usefulfor shareholders unable to attend the AGM in person.
The AGM provides an opportunity for private shareholders toengage with the Directors and shareholders are invited to raise anymatters of interest to them.At the meeting the Company complieswith the Code as it relates to voting, the separation of resolutionsand the attendance of Committee chairmen. In line with the Code,details of proxy voting by shareholders, including votes withheld, aremade available on the Company’s website following the meeting.
The Company continues to monitor and encourage provisionsallowing shareholders to receive electronic communications.These arrangements allow the Company to take advantageof environmental and cost benefits from reduced paper usage,printing and postage costs whilst investors are able to receivecommunications in the form most appropriate to their needs.Shareholders are entitled to change the way in which theyreceive shareholder communications at any time.
The Disclosure Committee ensures that all relevant communicationsare made available to the London Stock Exchange andshareholders. All material information reported is made availablesimultaneously on the Company’s website, ensuring access toCompany announcements.
Internal controlsThe Board is responsible for the establishment and review of theCompany’s internal operational and compliance control systems.The internal control systems are designed to ensure:
• Effective and efficient operations;
• Quality of internal and external reporting;
• Internal control and compliance with appropriate lawsand regulations.
The implementation of internal control systems is the responsibilityof the Executive Committee.
In compliance with provision C.2.1 of the Code and the Turnbullguidance, the Board annually reviews the effectiveness of theCompany’s internal control systems and reports to shareholders.
The Board has ensured that a process for managing significantrisk has been in place during the year.
The process is designed to manage, rather than eliminate, the risk offailure to achieve business objectives. In establishing and reviewingthe system of internal control, the Directors have regard to the natureand extent of relevant risks, the likelihood of loss being incurred andthe costs of control.
The system can only provide a reasonable but not absoluteassurance against any material mis-statement or loss and cannoteliminate business risk.
The Board has delegated the responsibility of reviewing in detail theeffectiveness of the Company’s internal control systems to the AuditCommittee.The Audit Committee reports its findings to the Board asa whole so that a view can be taken.
Risk identification,assessment and managementTo assist the Board and the Audit Committee in managing internalcontrols, the Group operates a Risk Management Strategy Group(RMSG),which is chaired by the Group Chief Executive.Membershipthroughout the year comprised the Group Finance Director, theGroup Company Secretary, the Group Treasury Director and theGroup Audit and Risk Director.
Businessreview
01-37Governa
nce38-57
Financia
lstatements
58-120Shareho
lderinfo
rmation
Insidebackcover

48
Inchcape plc Annual Report and Accounts 2008
The RMSG meets quarterly to consider what changes to riskmanagement and control processes should be recommended.Its review covers matters such as responses to significant risks thathave been identified, output from monitoring processes (includinginternal audit reports) and changes to be made to the internalcontrol systems. It also follows up on areas that require improvementand reports back to the Audit Committee.
Control procedures and monitoring systemsA Group Risk Register, which identifies key risks, the impact shouldthey occur and actions being taken to manage these risks at thedesired level, is produced for each business unit. In addition, actionsto be taken in the event that such risks crystallise and proposedimprovements to the way they are managed are also included.The Group Risk Register is approved by the RMSG and the ExecutiveCommittee and forwarded to the Audit Committee for discussionat their meetings.
The Group also monitors its control procedures in the followingkey areas:
Financial reportingThere is a comprehensive system with an annual budget approvedby Directors.Monthly actual results are reviewed and reported againstbudget and, where appropriate, revised forecasts are presented atBoard meetings.
Investment appraisalThe Group has clearly defined policies for capital expenditure.These include annual budgets and detailed appraisal andreview procedures.
Internal auditThe adequacy and effectiveness of the Group’s internal controlsystems are monitored by the Internal Audit team who report tothe Audit Committee on a regular basis. Internal Audit also worksclosely with management and the external auditor.
Business unit controlsEach business in the Group is required to identify its key risks and thecontrol procedures in place to mitigate those risks.This evaluationtakes place twice a year as part of the preparation and update ofthe business plans.
In 2008, the Managing Director and Finance Director of eachbusiness unit in the Group was asked to sign a compliancecertificate to confirm: the accuracy and completeness of theaccounts submitted for consolidation; compliance with local lawsand regulations; the absence of fraud; the absence of conflicteddirectorships and compliance with Inchcape policies.
Directors’ responsibilitiesThe Directors are responsible for preparing the Financial statementsin accordance with International Financial Reporting Standards(IFRS) as adopted by the European Union (EU), and the parentCompany Financial statements and the Directors’ Remunerationreport in accordance with applicable law and United KingdomAccountancy Standards (United Kingdom Generally AcceptedAccounting Practice).The Group and parent Company Financialstatements are required by law to give a true and fair view of thestate of affairs of the Company and the Group and the profit orloss of the Group for that period.
In preparing those Financial statements, the Directors are required to:
• Select suitable accounting policies and then apply themconsistently;
• Make judgements and estimates that are reasonable andprudent;
• State that the Group Financial statements comply with IFRS asadopted by the EU, and, with regard to the parent CompanyFinancial statements, that applicable UK Accounting Standardshave been followed,subject to any material departures disclosedand explained in the Financial statements;
• Prepare Group and parent Company Financial statements ona going concern basis, unless it is inappropriate to presume thatthe Company and the Group will continue in business, in whichcase there should be supporting assumptions or qualificationsas necessary.
The Directors are responsible for keeping proper accounting records,which disclose with reasonable accuracy at any time the financialposition of the Company and the Group and enable them to ensurethat the Group Financial statements comply with the CompaniesAct and Article 4 of the IAS Regulation and the Company Financialstatements and the Directors’ Remuneration report complies withthe Directors Remuneration Report Regulations 2002.They are alsoresponsible for safeguarding the assets of the Company and theGroup, and hence for taking reasonable steps for the preventionand detection of fraud and other irregularities.
The Directors are responsible for the maintenance and integrity ofthe Company’s website.The work carried out by the auditors doesnot involve consideration of these matters, and accordingly theauditors accept no responsibility for any changes that may haveoccurred to the Financial statements since they were initiallypresented on the website. Information published on the internet isaccessible in many countries with different legal requirements.Legislation in the UK governing the preparation and dissemination ofFinancial statements may differ from legislation in other jurisdictions.
Each of the Directors confirms that to the best of their knowledge:
• The Group Financial statements, which have been prepared inaccordance with IFRSs as adopted by the EU, give a true and fairview of the assets, liabilities, financial position and profit of theGroup, and;
• The Operating review and Financial review shown on pages16 to 29, include a fair review of the development andperformance of the business and the position of the Group,together with a description of the principal risks anduncertainties that it faces.
Board committees
ExecutiveCommittee
NominationsCommittee
CorporateResponsibility
Committee
RemunerationCommittee
Group CapitalCommittee
Risk ManagementStrategy Group
AuditCommittee
Inchcape plc
Governance
Corporate governance report continued

49
www.inchcape.com
The Board delegates certain responsibilities to its principalCommittees.All Committee Chairmen report verbally on theproceedings of the Committee at the next Board meeting.The GroupCompany Secretary acts as Secretary to all of the Board Committees.
The Executive Committee has primary responsibility for the day today management of the Group’s operations within agreed limitsset by the Board. It is chaired by the Group Chief Executive.
The Corporate Responsibility Committee is chaired by the GroupChief Executive. Its report is set out on pages 30 to 37.
Audit Committee report
Members From To
Ken Hanna – Chairman 16 May 2002 To date
Will Samuel 26 January 2005 To date
Michael Wemms 29 January 2004 To date
David Scotland 24 February 2005 To date
Graham Pimlott 25 March 2008 To date
GovernanceThe Audit Committee comprises five independent Non-executiveDirectors.The Committee is chaired by Ken Hanna who is achartered accountant with extensive experience of serving asa Finance Director of a FTSE 100 company.
Will Samuel is a chartered accountant.The Board has determinedthat he has recent and relevant financial experience. GrahamPimlott is a member of the UK Auditing Practices Board.
The Audit Committee met three times during 2008, to coincide withkey dates in the Company’s financial calendar.Attendance of thesemeetings are shown on page 46.
No-one other than the Audit Committee Chairman and its membersis entitled to attend the meetings. However, the Chairman, GroupChief Executive, Group Finance Director, Group Audit and RiskDirector and the external auditors attend by invitation.
In addition, the Audit Committee meets privately with the externalauditors twice a year.
The Audit Committee may take legal, accounting or other advice,at the Company’s expense, when it believes it necessary to do so.None was taken during 2008, other than from the Company’sexternal auditors.
Responsibilities• Monitoring the integrity of the Financial statements of the
Company and any formal announcement relating to itsperformance;
• Reviewing internal financial controls and internal control andrisk management systems;
• Monitoring and reviewing the effectiveness of the internalaudit function;
• Making recommendations to the Board in relation to theappointment and removal of the external auditor;
• Reviewing the external auditor’s independence and objectivityand the effectiveness of the audit process;
• Reviewing and implementing the policy on the engagementof the external auditor to supply non-audit services; and
• Reviewing the Company’s arrangements for employees to raiseconcerns confidentially about possible improprieties in relationto financial reporting or other matters.
The Audit Committee discharged all its responsibilities, as set outin its Terms of Reference, during the year.
The full Terms of Reference can be found atwww.inchcape.com/aboutus/corporategovernance.
ActivitiesDuring 2008, the principal activities of the Audit Committee includedreviews of the following:
• Interim and full year results and all other formal announcementsrelating to financial performance;
• The internal audit plan and the results of the internal auditors’work, including monitoring management’s responsiveness tofindings and recommendations;
• The Company’s internal financial controls and the internalcontrol and risk management system;
• The terms of engagement with the external auditor at the startof each audit and the scope of the audit to be provided;
• The audit plan with the external auditor at the planning andreporting stage;
• The effectiveness of the internal and external audit function;
• Whistleblowing provisions;
• Relevant disclosures in this report; and
• Terms of Reference.
The Company’s whistleblowing policy is communicated toemployees on a global basis.The policy enables employees toraise concerns with the Disclosure Response Team in cases whereconduct may be deemed to be contrary to the Company’s policiesor values.
In addition to the above activities, the Audit Committee reviewedits policy regarding the scope and extent of any non-audit servicesprovided to it by its external auditors.The purpose of the policy is toensure that the external auditors remain objective and independent.A procedure is in place which must be complied with prior to theauditors being engaged in non-audit work.There is a clear divisionof responsibility between audit and non-audit staff, and financiallimits are imposed on permitted areas of non-audit work such astax advice.The Audit Committee has acted in compliance with thispolicy during 2008.
A full statement of the fees paid for audit and non-audit services isprovided in note 3 on page 79.
Businessreview
01-37Governa
nce38-57
Financia
lstatements
58-120Shareho
lderinfo
rmation
Insidebackcover
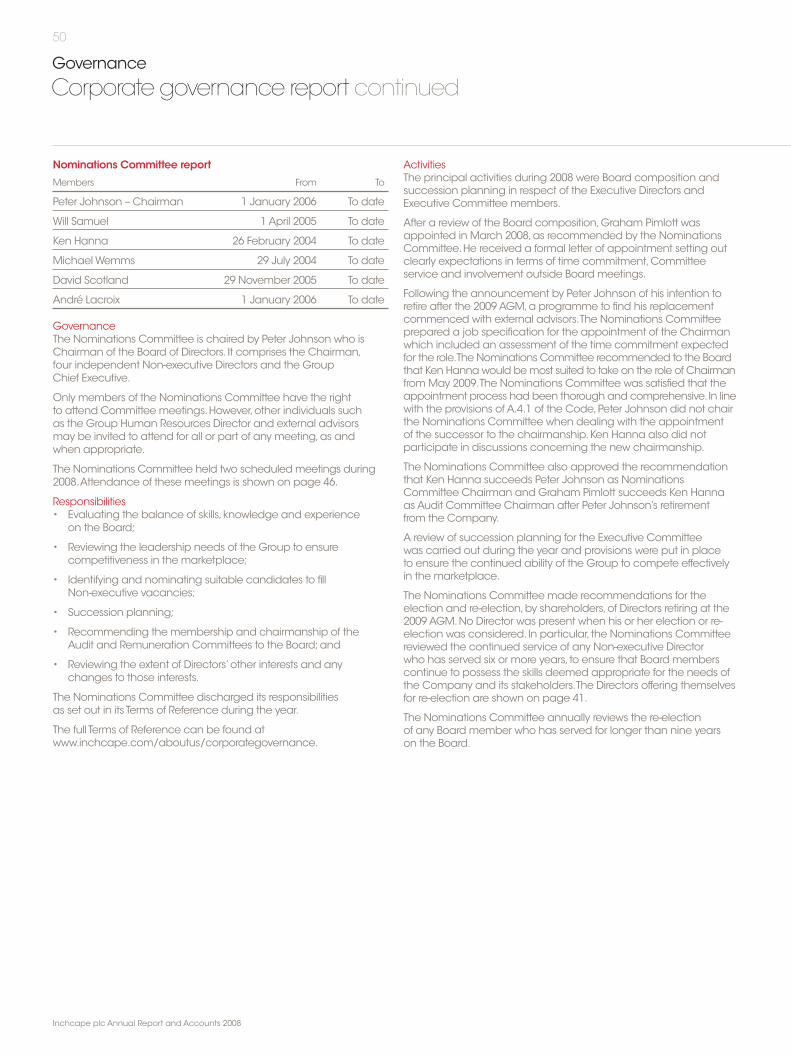
50
Inchcape plc Annual Report and Accounts 2008
Nominations Committee report
Members From To
Peter Johnson – Chairman 1 January 2006 To date
Will Samuel 1 April 2005 To date
Ken Hanna 26 February 2004 To date
Michael Wemms 29 July 2004 To date
David Scotland 29 November 2005 To date
André Lacroix 1 January 2006 To date
GovernanceThe Nominations Committee is chaired by Peter Johnson who isChairman of the Board of Directors. It comprises the Chairman,four independent Non-executive Directors and the GroupChief Executive.
Only members of the Nominations Committee have the rightto attend Committee meetings. However, other individuals suchas the Group Human Resources Director and external advisorsmay be invited to attend for all or part of any meeting, as andwhen appropriate.
The Nominations Committee held two scheduled meetings during2008.Attendance of these meetings is shown on page 46.
Responsibilities• Evaluating the balance of skills, knowledge and experience
on the Board;
• Reviewing the leadership needs of the Group to ensurecompetitiveness in the marketplace;
• Identifying and nominating suitable candidates to fillNon-executive vacancies;
• Succession planning;
• Recommending the membership and chairmanship of theAudit and Remuneration Committees to the Board; and
• Reviewing the extent of Directors’ other interests and anychanges to those interests.
The Nominations Committee discharged its responsibilitiesas set out in its Terms of Reference during the year.
The full Terms of Reference can be found atwww.inchcape.com/aboutus/corporategovernance.
ActivitiesThe principal activities during 2008 were Board composition andsuccession planning in respect of the Executive Directors andExecutive Committee members.
After a review of the Board composition, Graham Pimlott wasappointed in March 2008, as recommended by the NominationsCommittee. He received a formal letter of appointment setting outclearly expectations in terms of time commitment, Committeeservice and involvement outside Board meetings.
Following the announcement by Peter Johnson of his intention toretire after the 2009 AGM, a programme to find his replacementcommenced with external advisors.The Nominations Committeeprepared a job specification for the appointment of the Chairmanwhich included an assessment of the time commitment expectedfor the role.The Nominations Committee recommended to the Boardthat Ken Hanna would be most suited to take on the role of Chairmanfrom May 2009.The Nominations Committee was satisfied that theappointment process had been thorough and comprehensive.In linewith the provisions of A.4.1 of the Code, Peter Johnson did not chairthe Nominations Committee when dealing with the appointmentof the successor to the chairmanship. Ken Hanna also did notparticipate in discussions concerning the new chairmanship.
The Nominations Committee also approved the recommendationthat Ken Hanna succeeds Peter Johnson as NominationsCommittee Chairman and Graham Pimlott succeeds Ken Hannaas Audit Committee Chairman after Peter Johnson’s retirementfrom the Company.
A review of succession planning for the Executive Committeewas carried out during the year and provisions were put in placeto ensure the continued ability of the Group to compete effectivelyin the marketplace.
The Nominations Committee made recommendations for theelection and re-election, by shareholders, of Directors retiring at the2009 AGM. No Director was present when his or her election or re-election was considered. In particular, the Nominations Committeereviewed the continued service of any Non-executive Directorwho has served six or more years, to ensure that Board memberscontinue to possess the skills deemed appropriate for the needs ofthe Company and its stakeholders.The Directors offering themselvesfor re-election are shown on page 41.
The Nominations Committee annually reviews the re-electionof any Board member who has served for longer than nine yearson the Board.
Governance
Corporate governance report continued
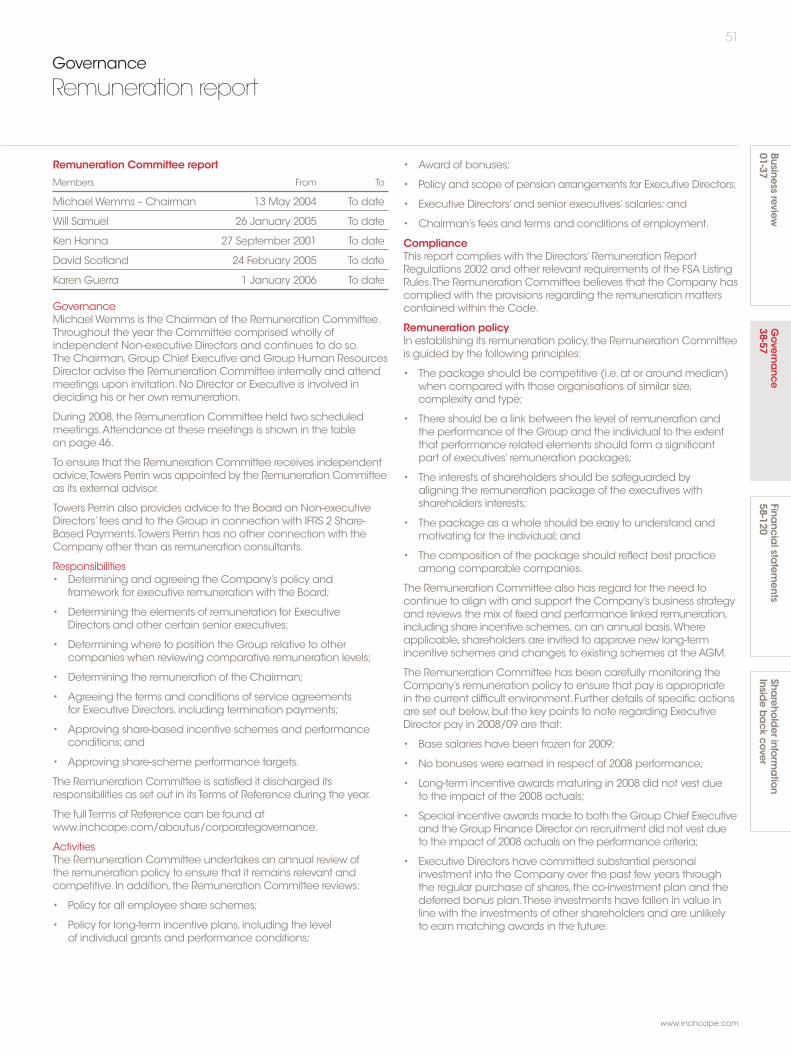
51
www.inchcape.com
Remuneration Committee report
Members From To
Michael Wemms – Chairman 13 May 2004 To date
Will Samuel 26 January 2005 To date
Ken Hanna 27 September 2001 To date
David Scotland 24 February 2005 To date
Karen Guerra 1 January 2006 To date
GovernanceMichael Wemms is the Chairman of the Remuneration Committee.Throughout the year the Committee comprised wholly ofindependent Non-executive Directors and continues to do so.The Chairman, Group Chief Executive and Group Human ResourcesDirector advise the Remuneration Committee internally and attendmeetings upon invitation. No Director or Executive is involved indeciding his or her own remuneration.
During 2008, the Remuneration Committee held two scheduledmeetings.Attendance at these meetings is shown in the tableon page 46.
To ensure that the Remuneration Committee receives independentadvice,Towers Perrin was appointed by the Remuneration Committeeas its external advisor.
Towers Perrin also provides advice to the Board on Non-executiveDirectors’ fees and to the Group in connection with IFRS 2 Share-Based Payments.Towers Perrin has no other connection with theCompany other than as remuneration consultants.
Responsibilities• Determining and agreeing the Company’s policy and
framework for executive remuneration with the Board;
• Determining the elements of remuneration for ExecutiveDirectors and other certain senior executives;
• Determining where to position the Group relative to othercompanies when reviewing comparative remuneration levels;
• Determining the remuneration of the Chairman;
• Agreeing the terms and conditions of service agreementsfor Executive Directors, including termination payments;
• Approving share-based incentive schemes and performanceconditions; and
• Approving share-scheme performance targets.
The Remuneration Committee is satisfied it discharged itsresponsibilities as set out in its Terms of Reference during the year.
The full Terms of Reference can be found atwww.inchcape.com/aboutus/corporategovernance.
ActivitiesThe Remuneration Committee undertakes an annual review ofthe remuneration policy to ensure that it remains relevant andcompetitive. In addition, the Remuneration Committee reviews:
• Policy for all employee share schemes;
• Policy for long-term incentive plans, including the levelof individual grants and performance conditions;
• Award of bonuses;
• Policy and scope of pension arrangements for Executive Directors;
• Executive Directors’ and senior executives’ salaries; and
• Chairman’s fees and terms and conditions of employment.
ComplianceThis report complies with the Directors’ Remuneration ReportRegulations 2002 and other relevant requirements of the FSA ListingRules.The Remuneration Committee believes that the Company hascomplied with the provisions regarding the remuneration matterscontained within the Code.
Remuneration policyIn establishing its remuneration policy, the Remuneration Committeeis guided by the following principles:
• The package should be competitive (i.e. at or around median)when compared with those organisations of similar size,complexity and type;
• There should be a link between the level of remuneration andthe performance of the Group and the individual to the extentthat performance related elements should form a significantpart of executives’ remuneration packages;
• The interests of shareholders should be safeguarded byaligning the remuneration package of the executives withshareholders interests;
• The package as a whole should be easy to understand andmotivating for the individual; and
• The composition of the package should reflect best practiceamong comparable companies.
The Remuneration Committee also has regard for the need tocontinue to align with and support the Company’s business strategyand reviews the mix of fixed and performance linked remuneration,including share incentive schemes, on an annual basis.Whereapplicable, shareholders are invited to approve new long-termincentive schemes and changes to existing schemes at the AGM.
The Remuneration Committee has been carefully monitoring theCompany’s remuneration policy to ensure that pay is appropriatein the current difficult environment. Further details of specific actionsare set out below, but the key points to note regarding ExecutiveDirector pay in 2008/09 are that:
• Base salaries have been frozen for 2009;
• No bonuses were earned in respect of 2008 performance;
• Long-term incentive awards maturing in 2008 did not vest dueto the impact of the 2008 actuals;
• Special incentive awards made to both the Group Chief Executiveand the Group Finance Director on recruitment did not vest dueto the impact of 2008 actuals on the performance criteria;
• Executive Directors have committed substantial personalinvestment into the Company over the past few years throughthe regular purchase of shares, the co-investment plan and thedeferred bonus plan.These investments have fallen in value inline with the investments of other shareholders and are unlikelyto earn matching awards in the future.
Businessreview
01-37Governa
nce38-57
Financia
lstatements
58-120Shareho
lderinfo
rmation
Insidebackcover
Governance
Remuneration report

52
Inchcape plc Annual Report and Accounts 2008
Governance
Remuneration report continued
Looking forward, the Committee is committed to ensuring that theremuneration arrangements in place are suitably structured to helpdrive the Company’s recovery and to support the current businesspriorities. In particular, the following decisions have been maderegarding the pay arrangements in 2009:
• The economic profit element of the 2009 bonus plan is nowfocused on operating cash flow;
• The performance condition attaching to the 2009 executiveshare option grant will also be based on longer term operatingcash flow; and.
• Long-term incentive award levels in 2009 will be significantlyreduced due to the suspension of the co-investment plan.
Base salaryBase salaries are set by the Remuneration Committee, takinginto account the individual’s level of responsibility, experienceand performance. Base salary is the only element of remunerationthat is pensionable.
In setting base salary levels, the Remuneration Committee also takesaccount of levels in comparable companies.The comparator grouphas a retail focus and includes companies with a strong consumeremphasis.This is in line with the Company’s strategic aim ofcustomer centricity and its desire to attract retail talent.
During 2008, the Executive Directors received a salary increase of8.0%.With the increase, the Executive Directors’ base salary levelswere slightly below comparator group median.The ExecutiveDirectors will not receive a salary increase during 2009.
Annual bonusThe Remuneration Committee sets annual bonus plans for theExecutive Directors including performance measures, targets andthe maximum levels of individual bonus opportunities. In 2008, thebonus plan was based on 70% Economic Profit, 20% Net PromoterScore (NPS) and 10% achievement of personal objectives.
During 2008, the Company achieved the NPS target set at the startof the year and both the Executive Directors fully achieved theirpersonal objectives. However, the Company did not meet theperformance target set for Economic Profit and therefore nobonuses were paid in respect of 2008.
For 2009, the Remuneration Committee has decided to changethe financial performance criteria for the annual bonus plan fromEconomic Profit to Cash Flow from Operating Activities (CFOA) asthis is more aligned to the Company’s current strategic priorities.Asin previous years, NPS, our customer service measure, and personalobjectives will be the other criteria used to calculate bonus.
For 2009, bonus plans will be based on 70% CFOA, 20% NPS and10% personal objectives. If all of these targets are achieved in fullthe Executive Directors will receive 50% of their base salary andhigher payments will be received for performance above targetto a maximum of 120% of base salary.
Executive share option planUnder the plan, share options are granted to Executive Directorsand senior executives throughout the Group. Options are normallygranted following the announcement of preliminary annual results.During 2008, the Remuneration Committee made annual grants oftwo times base salary, taking into account the Executive Directors’and Company performance. Details of executive share optionsgranted to Executive Directors are shown in note 3 on page 56.
As in previous years, executive share options granted in 2008 will vestif the Company’s earnings per share (EPS) exceeds the increase onthe UK Retail Price Index (RPI), over a three year period, according tothe scale set below.
EPS growth per annum Vesting percentage
Less than RPI+3.0% 0.0%
RPI+3.0% 25%
RPI+8.0% 100%
Between RPI+3.0% and RPI+8.0% Straight line basis
There will be no retesting
As outlined in the Chairman’s statement on page 5, the Companyannounced a Rights Issue on 19 March 2009. Clearly this will havean impact on the number of executive share option awards thatthe Company will grant during 2009 after the Rights Issue has takenplace.As such the Remuneration Committee is not in a positionto detail the number of executive share options to be awardedwith shareholders at this stage. However, outlined below are theperformance conditions the Remuneration Committee intends touse with regard to the 2009 award.The Company will consult, asappropriate, with its shareholders and institutional bodies beforefinal decisions are made.
The Remuneration Committee intends to set performanceconditions that are specifically tailored to the Company’s currentbusiness strategy and reflect the focus on cash flow.Accordingly,the measure that will be used will be growth in Cash Flow fromOperating Activities (CFOA), according to the scale set out below.The Remuneration Committee has set CFOA targets that it considersat least as challenging as the previous EPS hurdle.
Options awarded in 2009 will vest to the following sliding scale:
CFOA growth Vesting percentage
Less than 70% of target 0.0%
70% of target 25%
100% of target 100%
Between 70% and 100% of target Straight line basis
Base salary
120%
50%
Maximum bonus
Target performance
André Lacroix and Barbara Richmond bonus plan 2009

53
www.inchcape.com
Co-investment planThe co-investment plan was introduced during 2008 after receivingshareholder approval in 2007.André Lacroix can invest up to 50%and Barbara Richmond can invest up to 40% of post tax annualsalary to obtain ordinary shares in the Company. In exceptionalcircumstances, the Remuneration Committee may determine thatcircumstances justify that up to 100% of post tax annual salary canbe invested.No such exceptional circumstances have arisen to date.Details of awards are shown in note 4 on page 57.The plan hasbeen extended to certain other senior executives below Board level.
The shares acquired will be matched at the end of the three yearvesting period.The match will be determined by performanceagainst the cumulative Economic Profit (EP) target.
Awards will vest according to the following sliding scale:
EP growth over three years Matching shares
Less than RPI+3.0% 0
RPI+3.0% 1:1
RPI+12.0% 2:1
Between RPI+3.0% and RPI+12.0% Straight line basis
As noted previously, the Remuneration Committee has decided tosuspend the co-investment plan for 2009.
Deferred bonus planThe deferred bonus plan was a voluntary plan for Executive Directorsand certain other senior executives. Final awards under this planwere made in 2007. Details of these awards are shown in note 4on page 56.
Save as you earn (SAYE)Executive Directors are eligible to participate in the Company’s SAYEscheme on the same terms as other employees. Participants makemonthly savings, to a maximum of £250 per month, over a threeyear period.At the end of the savings period the funds are used topurchase shares under option.The acquisition of shares under thisscheme is not subject to the satisfaction of a performance target.
Executive share ownershipTo emphasise the importance the Remuneration Committee placesin executive share ownership, Executive Directors are required tohold a fixed number of shares equivalent to 200% of base salary.Each Executive Director has five years from 2007, or date ofappointment (if later), to reach this shareholding target.
The shares held by the Executive Directors is shown on page 41.
Retirement benefitsThe Inchcape Group (UK) Pension Scheme (UK Scheme) providesbenefits for Executive Directors and certain senior executives atnormal retirement age of 65.The benefit is equal to a maximum oftwo-thirds of final base salary, where salary has a scheme-specificceiling of £117,600 in the 2008/09 tax year, subject to completionof between 20 and 40 years’ service. Pensions in payment areguaranteed to increase in line with the lesser of 5.0% and theincrease in the UK Retail Price Index (RPI).This will be reviewedin 2009 in light of recent changes to guidelines.
The UK Scheme requires members who join after March 2005 tocontribute 7.0% of base salary up to the scheme-specific ceilingof £117,600 in the 08/09 tax year.
Executive Directors, whose base salary is higher than £117,600,are paid a monthly cash supplement to enable them to makeadditional pension arrangements. Barbara Richmond receivedsuch supplements in 2008. Details of the amounts paid are shownon page 55.André Lacroix received a cash supplement of 40 %of his base salary in lieu of a formal pension provision. He is not amember of the UK Scheme except in respect of the life assurancebenefit for death in service.
A lump sum life assurance benefit of four times full base salaryis provided on death in service. For pension scheme members,a spouse’s pension of either half or two thirds of the prospectivemember’s pension may also be payable. Children’s pensionsmay also be payable of up to one-third of the member’s pension.
Taxable and other benefitsThese include items such as company cars, medical careand life assurance premiums.These benefits are in line with theremuneration policy framework.These benefits are non-pensionable.
Total Shareholder ReturnThe following graph illustrates the Group’s Total Shareholder Return(TSR) over a five year period, relative to the performance of the totalreturn index of the FTSE mid-250 group of companies (excludinginvestment trusts).TSR is essentially share price growth plus re-investeddividends.The FTSE mid-250 has been chosen as the most suitablecomparator group as it is the general market index in whichInchcape plc appears.
Growth in the Value of a Hypothetical £100 Holding Over Five Years FTSE 250 (excludinginvestment companies) Comparison Based on 30 Trading Day Average Values
Inchcape
FTSE mid 250 excluding investment trust
Service contractsThe Company’s policy is for Executive Directors’ service contractnotice periods to be no longer than 12 months, except inexceptional circumstances. Both current contracts contain noticeperiods of 12 months. In the event of termination, the Company willseek fair mitigation of contractual rights.Within legal constraints, theRemuneration Committee tailors its approach, in the event of earlytermination, to the circumstances of each individual case.
0
100
200
300
Dec 08Dec 07Dec 06Dec 05Dec 04Dec 03
Historical TSR performance
Businessreview
01-37Governa
nce38-57
Financia
lstatements
58-120Shareho
lderinfo
rmation
Insidebackcover
54
Inchcape plc Annual Report and Accounts 2008
The contracts of Executive Directors do not provide for anyenhanced payments in the event of a change of control in theCompany (upon which vesting of outstanding long-term incentiveawards would be on a time-related pro-rata basis, subject to thesatisfaction of the relevant performance criteria).
There have been no payments made during the year in relationto compensation for loss of office.
Name Date of contract Notice period Unexpired term
André 01 September 05 12 months from To normalLacroix the Director; retirement age
12 months fromthe Company
Barbara 03 April 06 12 months from To normalRichmond the Director; retirement age
12 months fromthe Company
Non-executive Directors are appointed for an initial period ofthree years, which may be extended by agreement with the Board.No Non-executive Director is engaged on a service contract withthe Company.
Policy on external appointmentsThe Company recognises that its Executive Directors may be invitedto become Non-executive Directors of other companies and thatthis additional experience is likely to benefit the Company. ExecutiveDirectors are generally allowed to accept one Non-executiveappointment as long as it is not likely to lead to conflicts of interestor undue time commitments.The Group Chief Executive is permittedto hold two such appointments.The policy in respect of ExecutiveDirectors’ commitments is kept under review by the NominationsCommittee.Any fees received for these duties may be retained bythe Executive Director.
André Lacroix is the Non-executive Chairman of Good RestaurantsAG, for which he does not receive a fee and a Non-executiveDirector of Reckitt Benckiser for which he received a fee of £14,500plus Reckitt Benckiser shares to the value of £3,000.
Barbara Richmond is a Non-executive Director of ScarboroughBuilding Society for which she received a fee of £38,000.
Non-executive Directors’ fees reportChairman’s remunerationThe Chairman’s remuneration was determined by the RemunerationCommittee, taking advice from Towers Perrin on best practice andcompetitive levels and taking into account responsibilities and timecommitment. Life assurance is provided under the Inchcape Group(UK) Pension Scheme but the appointment is not pensionable, noris the Chairman eligible for pension scheme membership orparticipation in the Company’s bonus, share option or otherincentive plan.
Non-executive Directors’ remunerationThe remuneration for Non-executive Directors consists of feesfor services in connection with Board and Committee meetings.Fees for Non-executive Directors are determined by the Board,within the restrictions contained in the articles of association.Non-executive Directors’ fees are reviewed annually, taking advicefrom Towers Perrin on best practice and competitive levels.The levelsof remuneration for the Non-executive Directors reflect the timecommitment and responsibilities of the role.
The Non-executive Directors are not involved in deciding their fees.
Non-executive Directors are not eligible for pension schememembership or participation in the Company’s bonus, share optionor other incentive schemes.
Details of the fees paid to the Chairman and Non-executiveDirectors are shown on page 55.
By order of the Board
MichaelWemmsChairman of the Remuneration Committee19 March 2009
Governance
Remuneration report continued
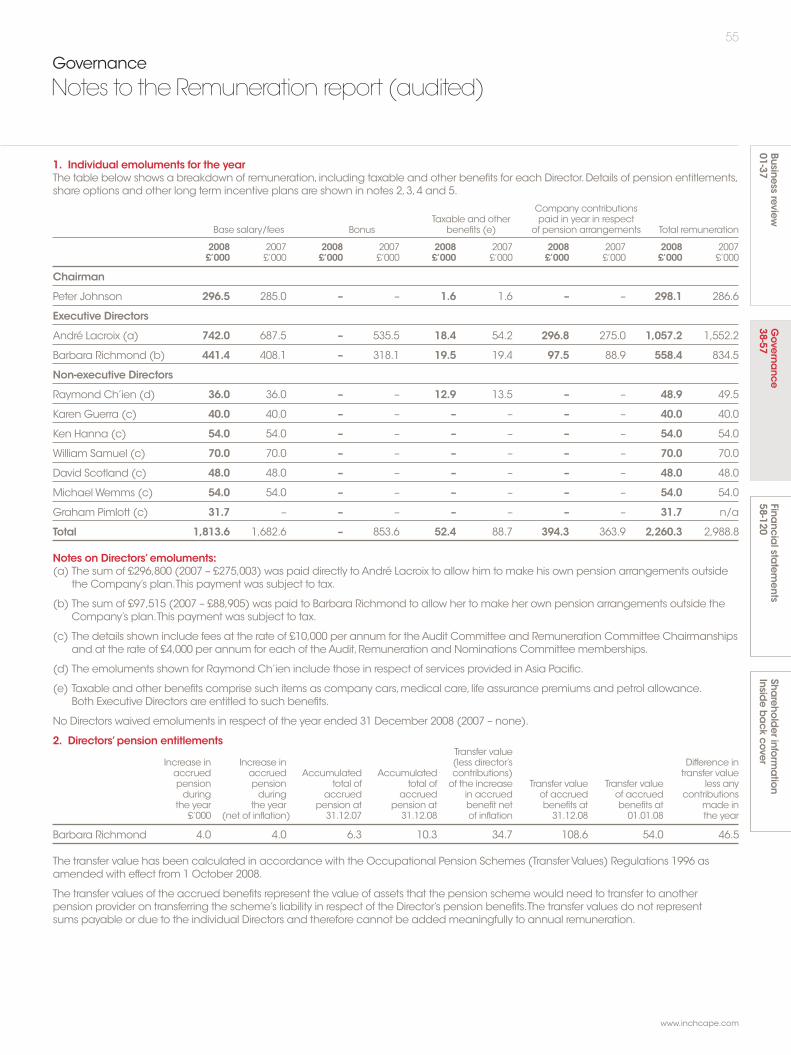
55
www.inchcape.com
Governance
Notes to the Remuneration report (audited)
1. Individual emoluments for the yearThe table below shows a breakdown of remuneration, including taxable and other benefits for each Director. Details of pension entitlements,share options and other long term incentive plans are shown in notes 2, 3, 4 and 5.
Company contributionsTaxable and other paid in year in respect
Base salary/fees Bonus benefits (e) of pension arrangements Total remuneration
2008 2007 2008 2007 2008 2007 2008 2007 2008 2007£’000 £’000 £’000 £’000 £’000 £’000 £’000 £’000 £’000 £’000
Chairman
Peter Johnson 296.5 285.0 – – 1.6 1.6 – – 298.1 286.6
Executive Directors
André Lacroix (a) 742.0 687.5 – 535.5 18.4 54.2 296.8 275.0 1,057.2 1,552.2
Barbara Richmond (b) 441.4 408.1 – 318.1 19.5 19.4 97.5 88.9 558.4 834.5
Non-executive Directors
Raymond Ch’ien (d) 36.0 36.0 – – 12.9 13.5 – – 48.9 49.5
Karen Guerra (c) 40.0 40.0 – – – – – – 40.0 40.0
Ken Hanna (c) 54.0 54.0 – – – – – – 54.0 54.0
William Samuel (c) 70.0 70.0 – – – – – – 70.0 70.0
David Scotland (c) 48.0 48.0 – – – – – – 48.0 48.0
Michael Wemms (c) 54.0 54.0 – – – – – – 54.0 54.0
Graham Pimlott (c) 31.7 – – – – – – – 31.7 n/a
Total 1,813.6 1,682.6 – 853.6 52.4 88.7 394.3 363.9 2,260.3 2,988.8
Notes on Directors’emoluments:(a) The sum of £296,800 (2007 – £275,003) was paid directly to André Lacroix to allow him to make his own pension arrangements outside
the Company’s plan.This payment was subject to tax.
(b) The sum of £97,515 (2007 – £88,905) was paid to Barbara Richmond to allow her to make her own pension arrangements outside theCompany’s plan.This payment was subject to tax.
(c) The details shown include fees at the rate of £10,000 per annum for the Audit Committee and Remuneration Committee Chairmanshipsand at the rate of £4,000 per annum for each of the Audit, Remuneration and Nominations Committee memberships.
(d) The emoluments shown for Raymond Ch’ien include those in respect of services provided in Asia Pacific.
(e) Taxable and other benefits comprise such items as company cars, medical care, life assurance premiums and petrol allowance.Both Executive Directors are entitled to such benefits.
No Directors waived emoluments in respect of the year ended 31 December 2008 (2007 – none).
2. Directors’pension entitlementsTransfer value
Increase in Increase in (less director’s Difference inaccrued accrued Accumulated Accumulated contributions) transfer valuepension pension total of total of of the increase Transfer value Transfer value less any
during during accrued accrued in accrued of accrued of accrued contributionsthe year the year pension at pension at benefit net benefits at benefits at made in
£’000 (net of inflation) 31.12.07 31.12.08 of inflation 31.12.08 01.01.08 the year
Barbara Richmond 4.0 4.0 6.3 10.3 34.7 108.6 54.0 46.5
The transfer value has been calculated in accordance with the Occupational Pension Schemes (Transfer Values) Regulations 1996 asamended with effect from 1 October 2008.
The transfer values of the accrued benefits represent the value of assets that the pension scheme would need to transfer to anotherpension provider on transferring the scheme’s liability in respect of the Director’s pension benefits.The transfer values do not representsums payable or due to the individual Directors and therefore cannot be added meaningfully to annual remuneration.
Businessreview
01-37Governa
nce38-57
Financia
lstatements
58-120Shareho
lderinfo
rmation
Insidebackcover

56
Inchcape plc Annual Report and Accounts 2008
Governance
Notes to the Remuneration report (audited) continued
3. Directors’share options
Exercised GrantedLapsed during the during
Held at 31.12.08 during year year the year Held at 01.01.08 Exercise price Exercise period
André Lacroix 346,362 (a) – – – 346,362 (a) 358.0p Sept 2008 – Sept 2015
278,442 (a) – – – 278,442 (a) 445.3p *Mar 2009 – Mar 2016
242,634 (a) – – – 242,634 (a) 577.0p Apr 2010 – Apr 2017
353,271 (a) – – 353,271 (a) – 428.0p Apr 2011 – Apr 2018
– 2,706 (b) – – 2,706 (b) 345.3p Jun 2009 – Dec 2009
4,729 (b) – – 4,729 (b) – 203.0p Nov 2011 – May 2012
Barbara Richmond 347,629 (a) – – – 347,629 (a) 443.0p *May 2009 – May 2016
144,124 (a) – – – 144,124 (a) 577.0p Apr 2010 – Apr 2017
210,280 (a) – – 210,280 (a) – 428.0p Apr 2011 – Apr 2018
2,540 (b) – – – 2,540 (b) 368.0p Nov 2009 – May 2010
* Options granted in 2006 did not meet the performance target set at the time of grant and will lapse in full.
Notes on share options:(a) Under the executive share option plan.
(b) Under the SAYE scheme.
Exercise prices are determined in accordance with the rules of the relevant share option scheme.
• All options were granted for nil consideration.
• The table shows Directors’ options over ordinary shares of 25.0p at 1 January 2008 and 31 December 2008.The mid-market pricefor shares at the close of business on 31 December was 36.75p.The price range during 2008 was 451.0p to 36.75p.
• Options under the executive share option plan are granted on a discretionary basis to certain full time senior executives basedwithin and outside the UK, including Executive Directors of the Company. Such options are normally exercisable between threeand ten years of grant.
• Options may normally be exercised if the performance target has been met. For all options granted between 1999 and 2003 underthe executive share option plan, growth in the Company’s earnings per share (EPS) over a three year period must exceed the increaseon the UK Retail Price Index (RPI) over the same period by 3.0% per annum. Options granted after the 2004 AGM vest according to asliding scale: 25% of the shares vest if EPS growth of RPI+3.0% per annum is achieved over the initial three year period with all the sharesvesting if EPS growth is RPI+8.0% per annum over three years. Shares will vest on a straight-line basis between these points and there isno opportunity to retest.
• The SAYE scheme is open to employees in the UK with at least three months’ service. Participants make monthly savings for a three yearperiod.At the end of the savings period options become exercisable within a six month period.
4. Deferred bonus planOrdinary Ordinary Ordinary
Awarded shares shares shares Awarded Marketordinary lapsed exercised awarded ordinary value of
shares during the during the during the shares shares31.12.08 year year year 01.01.08 awarded Exercise period
André Lacroix 13,825 – – – 13,825 434.0p *Jan 2009 – Jun 2009
88,636 – – – 88,636 578.0p Jan 2010 – Jun 2010
Barbara Richmond 30,303 – – – 30,303 578.0p Jan 2010 – Jun 2010
* Awards granted in 2006 did not meet the performance target set at the time of grant and will lapse in full.

57
www.inchcape.com
Businessreview
01-37Governa
nce38-57
Financia
lstatements
58-120Shareho
lderinfo
rmation
Insidebackcover
Notes on the deferred bonus plan:• Participants were able to invest a minimum of 10% and a maximum of 75% post-tax annual bonus to acquire ordinary shares in the
Company.The shares are matched on a one to one basis provided the Executive Directors remain employed by the Company forthree years and retain the shares purchased with their bonus throughout that period and the performance target is met. Growth in theCompany’s EPS over a three year period must exceed the increase on RPI over the same period by 3.0% per annum with no opportunityto retest in order for the awarded ordinary shares to vest. Special rules apply on termination of employment and change of control.
Co-investment planOrdinary Ordinary Ordinary
Awarded shares shares shares Awarded Marketordinary lapsed exercised awarded ordinary value of
shares during the during the during the shares shares31.12.08 year year year 01.01.08 awarded Exercise period
André Lacroix 190,524 – – 190,524 – 396.8p Jan 2011 – Jun 2011
Barbara Richmond 84,005 – – 84,005 – 396.8p Jan 2011 – Jun 2011
Notes on the co-investment plan:• Directors will be entitled to matching shares if they remain employed by the Company for three years, retain the shares they have
purchased under the plan throughout that period and the performance target is met.The Company’s Economic Profit (EP) mustexceed the increase on RPI over the same period by 3.0% per annum to receive a one for one match. If the Company’s EP exceedsthe increase on RPI over the same period by 12.0% per annum the match is two for one. Special rules apply on termination ofemployment and change of control.
• André Lacroix can invest up to 50% and Barbara Richmond can invest up to 40% of post-tax annual salary to obtain ordinary sharesin the co-investment plan.The shares purchased are held in trust for the Executives.Provided the performance target is met, the matchingshares will vest and the Executive may exercise his or her rights under the plan at any time during the six month exercise period.
5. Incentive plansAwarded ordinary Awarded ordinary
Awarded ordinary shares lapsed shares exercised Awarded ordinary Market value ofshares at 31.12.08 during year during year shares at 01.01.08 shares awarded Vesting period
AL incentive plan 39,000 – 39,000 78,000 357.5p 2008
BR incentive plan 59,612 – 21,996 81,608 428.7p 2008
Notes on the incentive plans:• As reported last year,André Lacroix is the sole participant in the AL incentive plan.The award is subject to his continuing employment
and the percentage growth in the Company’s EPS over the relevant performance period exceeding the rate of inflation over the sameperiod by at least 3.0% per annum.The final tranche of the AL incentive plan did not meet the performance target set at the time ofgrant and will therefore lapse in full.
• As reported last year, Barbara Richmond is the sole participant in the BR incentive plan.The award is subject to her continuingemployment and the percentage growth in the Company’s EPS over the relevant performance period exceeding the rate of inflationover the same period by at least 3.0% per annum.The final tranche of the BR incentive plan did not meet the performance target setat the time of grant and will therefore lapse in full.
By order of the Board
MichaelWemmsChairman of the Remuneration Committee19 March 2009
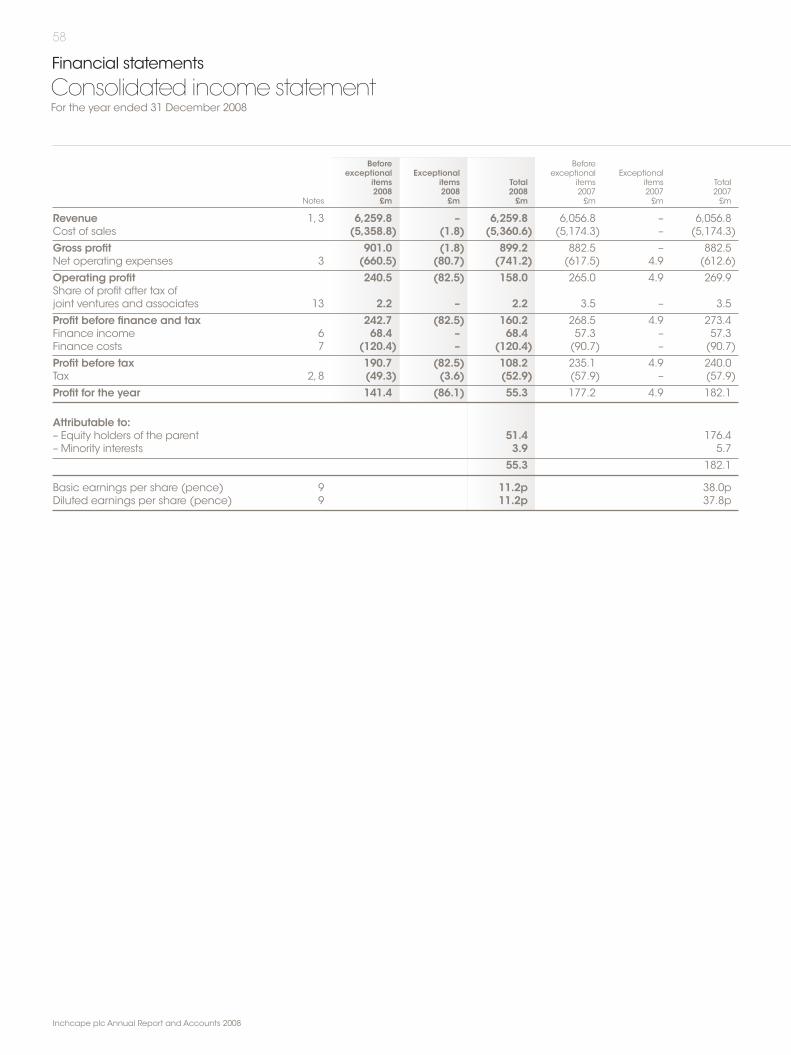
58
Inchcape plc Annual Report and Accounts 2008
Financial statements
Consolidated income statementFor the year ended 31 December 2008
Before Beforeexceptional Exceptional exceptional Exceptional
items items Total items items Total2008 2008 2008 2007 2007 2007
Notes £m £m £m £m £m £m
Revenue 1,3 6,259.8 – 6,259.8 6,056.8 – 6,056.8Cost of sales (5,358.8) (1.8) (5,360.6) (5,174.3) – (5,174.3)
Gross profit 901.0 (1.8) 899.2 882.5 – 882.5Net operating expenses 3 (660.5) (80.7) (741.2) (617.5) 4.9 (612.6)
Operating profit 240.5 (82.5) 158.0 265.0 4.9 269.9Share of profit after tax ofjoint ventures and associates 13 2.2 – 2.2 3.5 – 3.5
Profit before finance and tax 242.7 (82.5) 160.2 268.5 4.9 273.4Finance income 6 68.4 – 68.4 57.3 – 57.3Finance costs 7 (120.4) – (120.4) (90.7) – (90.7)
Profit before tax 190.7 (82.5) 108.2 235.1 4.9 240.0Tax 2,8 (49.3) (3.6) (52.9) (57.9) – (57.9)
Profit for the year 141.4 (86.1) 55.3 177.2 4.9 182.1
Attributable to:– Equity holders of the parent 51.4 176.4– Minority interests 3.9 5.7
55.3 182.1
Basic earnings per share (pence) 9 11.2p 38.0pDiluted earnings per share (pence) 9 11.2p 37.8p
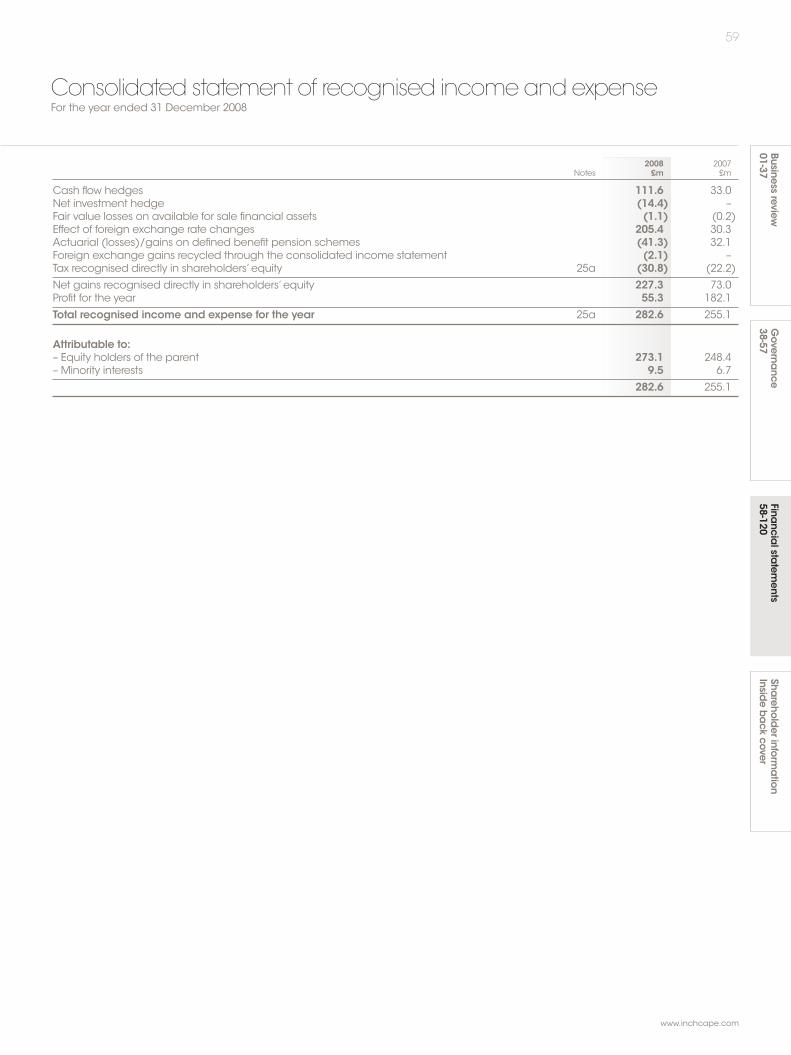
59
www.inchcape.com
Businessreview
01-37Sha
reholderinfo
rmation
Insidebackcover
Financia
lstatem
ents58-120
Governa
nce38-57
Consolidated statement of recognised income and expenseFor the year ended 31 December 2008
2008 2007Notes £m £m
Cash flow hedges 111.6 33.0Net investment hedge (14.4) –Fair value losses on available for sale financial assets (1.1) (0.2)Effect of foreign exchange rate changes 205.4 30.3Actuarial (losses)/gains on defined benefit pension schemes (41.3) 32.1Foreign exchange gains recycled through the consolidated income statement (2.1) –Tax recognised directly in shareholders’equity 25a (30.8) (22.2)
Net gains recognised directly in shareholders’equity 227.3 73.0Profit for the year 55.3 182.1
Total recognised income and expense for the year 25a 282.6 255.1
Attributable to:– Equity holders of the parent 273.1 248.4– Minority interests 9.5 6.7
282.6 255.1

60
Inchcape plc Annual Report and Accounts 2008
Financial statements
Consolidated balance sheetAs at 31 December 2008
2008 2007Notes £m £m
Non-current assetsIntangible assets 11 537.4 400.5Property,plant and equipment 12 708.1 519.3Investments in joint ventures and associates 13 21.3 15.3Available for sale financial assets 14 17.9 15.6Trade and other receivables 15 26.5 24.2Deferred tax assets 16 11.5 10.2Retirement benefit asset 5 49.4 51.9
1,372.1 1,037.0
Current assetsInventories 17 1,084.1 797.5Trade and other receivables 15 271.8 262.6Available for sale financial assets 14 2.0 1.1Derivative financial instruments 23 306.9 12.9Current tax assets 6.0 2.9Cash and cash equivalents 18 458.0 343.4
2,128.8 1,420.4Assets held for sale and disposal group 19 5.4 168.6
2,134.2 1,589.0
Total assets 3,506.3 2,626.0
Current liabilitiesTrade and other payables 20 (1,123.9) (940.2)Derivative financial instruments 23 – (8.3)Current tax liabilities (48.2) (42.2)Provisions 21 (50.6) (31.3)Borrowings 22 (165.3) (155.3)
(1,388.0) (1,177.3)
Non-current liabilitiesTrade and other payables 20 (78.1) (41.4)Provisions 21 (52.0) (39.4)Deferred tax liabilities 16 (69.1) (18.5)Borrowings 22 (856.1) (409.6)Retirement benefit liability 5 (43.4) (23.4)
(1,098.7) (532.3)Liabilities directly associated with the disposal group 19 – (78.6)
Total liabilities (2,486.7) (1,788.2)
Net assets 1,019.6 837.8
Shareholders’equityShare capital 24,25 121.9 121.6Share premium 25 126.1 123.4Capital redemption reserve 25 16.4 16.4Other reserves 25 273.1 12.7Retained earnings 25 458.0 539.5
Equity attributable to equity holders of the parent 995.5 813.6Minority interests 25 24.1 24.2
Total shareholders’equity 1,019.6 837.8
The Financial statements on pages 58 to 111 were approved by the Board of Directors on 19 March 2009 and were signed on its behalfby: André Lacroix, Director Barbara Richmond, Director

61
www.inchcape.com
Businessreview
01-37Sha
reholderinfo
rmation
Insidebackcover
Financia
lstatem
ents58-120
Governa
nce38-57
Consolidated cash flow statementFor the year ended 31 December 2008
2008 2007Notes £m £m
Cash flows from operating activitiesCash generated from operations 26a 183.7 293.0Tax paid (57.6) (49.8)Interest received 20.0 12.4Interest paid (74.0) (49.5)
Net cash generated from operating activities 72.1 206.1
Cash flows from investing activitiesAcquisition of businesses,net of cash and overdrafts acquired (135.4) (329.6)Net cash inflow from sale of businesses 27.3 85.5Purchase of property,plant and equipment (117.8) (72.0)Purchase of intangible assets (10.8) (8.1)Proceeds from disposal of property,plant and equipment 26.8 47.3Net disposal of available for sale financial assets 0.4 –Dividends received from joint ventures and associates 1.3 2.6
Net cash used in investing activities (208.2) (274.3)
Cash flows from financing activitiesProceeds from issue of ordinary shares 3.0 8.5Share buy back programme (16.0) (18.5)Net purchase of own shares by ESOP Trust (4.2) (2.0)Cash inflow from Private Placement – 277.1Net cash inflow/(outflow) from borrowings other than Private Placement 275.2 (95.5)Payment of capital element of finance leases (0.7) (0.6)Loans granted to joint ventures (1.7) –Settlement of derivatives 17.5 (4.3)Equity dividends paid (73.1) (71.1)Minority dividends paid (2.6) (1.8)
Net cash from financing activities 197.4 91.8
Net increase in cash and cash equivalents 26b 61.3 23.6Cash and cash equivalents at the beginning of the year 198.6 166.2Effect of foreign exchange rate changes 52.9 8.8
Cash and cash equivalents at the end of the year 312.8 198.6
Cash and cash equivalents consist of:Cash at bank and in hand 18 351.3 273.0Short-term bank deposits 18 106.7 70.4Bank overdrafts 22 (145.2) (144.8)
312.8 198.6

62
Inchcape plc Annual Report and Accounts 2008
Financial statements
Accounting policies
The consolidated Financial statements have been prepared in accordance with International Financial Reporting Standards (IFRS)as endorsed by the European Union and with those parts of the Companies Act 1985,applicable to companies reporting under IFRS.
Accounting conventionThe consolidated Financial statements have been prepared on a going concern basis and under the historical cost convention,except forthe retention of certain freehold properties and leasehold buildings at previously revalued amounts (which were treated as deemed coston transition to IFRS) and the measurement of certain balances at fair value as disclosed in the accounting policies below.
Going concernIn determining whether the Group is a going concern, the Directors have reviewed the Group’s current financial position and have prepareddetailed financial projections.These projections reflect the recent unprecedented downturn in economic conditions and credit availabilityacross the Group’s operations, the actions already taken to restructure the business and the plans in place to focus operations on thefive core priorities of growing market share,growing aftersales,managing working capital and reducing overheads and capital expenditure(see page 8).
The projections also assume that: new car sales will continue to decline in 2009 and not begin to recover until the second half of 2010;the service and parts business will be more resilient to the downturn; lower UK interest rates will continue; key brand partners will remain inproduction and supply on normal terms of trade;and there will be no further significant downturn in the global economic environment.
These projections,even after allowing for headroom to accommodate a reasonable downside scenario (including weaker trading andadverse movements in currency and interest rates), indicate that the Group would be able to manage its operations so as to remain withinits current facilities and in compliance with its banking covenant.
Accordingly,after making enquiries, the Directors have a reasonable expectation that the Group has adequate resources to continue asa going concern for the foreseeable future.As such, the Group continues to adopt the going concern basis in preparing the annual reportand accounts.
Changes in accounting standardsA number of new standards,amendments and interpretations are effective for the first time for 2008.The Group has adopted,with effectfrom 1 January 2008, the amendment to IAS 23‘Borrowing Costs’and the IFRIC interpretations noted below.
The amendment to IAS 23 removes the option of immediately expensing borrowing costs that are directly attributable to a qualifying asset.Under IAS 23,such costs are required to be capitalised as part of the cost of the relevant asset.The Group has adopted the amendedstandard on a prospective basis from 1 January 2008.The impact of adoption on the results for the year ended 31 December 2008 isdisclosed in notes 11 and 12 of the consolidated Financial statements.
IFRIC 14‘The Limit on a Defined Benefit Asset,Minimum Funding Requirements and their Interaction’has been adopted with effect from1 January 2008.This interpretation provides guidance on how to assess the limit on the amount of surplus in a defined benefit scheme thatcan be recognised as an asset under IAS 19 Employee Benefits.The application of this Standard has affected one of the defined benefitpension schemes of the Group,with the full effect being recognised in the consolidated statement of recognised income and expensein the year.This is disclosed in note 5 of the consolidated Financial statements.
In addition IFRIC 11‘Group andTreasury ShareTransactions’ is effective,but has not had amaterial impact on the results or financial positionof the Group.
IFRS 8‘Operating Segments’ replaces IAS 14‘Segmental Reporting’and requires operating segments to be disclosed on the same basisas that used for internal reporting. It is required to be implemented by the Group from 1 January 2009 and will not have an impact on theresults or financial position of the Group.
At the balance sheet date,a number of IFRSs, IAS and IFRS amendments and IFRIC interpretations were in issue but not yet effective.Effective for the Group’s financial years commencing on or after 1 January 2009 are: IAS 1‘Presentation of Financial Statements (2007)’;the amendment to IFRS 2‘Share-based Payment –Vesting Conditions and Cancellations’; amendments to IAS 32‘Financial Instruments:Presentation’and IAS 1‘Presentation of Financial Statements – Puttable Financial Instruments and Obligations Arising on Liquidation’;andIFRIC 13‘Customer Loyalty Programmes’.Effective for the Group’s financial years commencing on or after 1 January 2010 are IAS 27(Revised)‘Consolidated and Separate Financial Statements’and IFRS 3 (Revised)‘Business Combinations’.
These new and revised Standards and Interpretations have not been and will not be early adopted by the Group and,with the exceptionof the revised IFRS 3,are not expected to have amaterial impact on the financial position and results of the Group.
IFRS 3 (Revised),‘Business combinations’(effective from 1 July 2009) continues to apply the acquisition method to business combinations,with some significant changes.These include all payments to purchase a business being recorded at fair value at the acquisition date,withcontingent payments classified as debt subsequently remeasured through the consolidated income statement.There is a choice on anacquisition-by-acquisition basis to measure the non-controlling interest in the acquiree either at fair value or at the non-controlling interest’sproportionate share of the acquiree’s net assets.All acquisition-related costs should be expensed.The Group will apply IFRS 3 (Revised)prospectively to all business combinations from 1 January 2010.
Basis of consolidationThe consolidated Financial statements comprise the Financial statements of the parent Company (Inchcape plc) and all of its subsidiaryundertakings (defined as where the Group has control), together with the Group’s share of the results of its joint ventures (defined aswhere the Group has joint control) and associates (defined as where the Group has significant influence but not control).The results ofsubsidiaries, joint ventures and associates are consolidated as of the same reporting date as the parent Company,using consistentaccounting policies.
63
www.inchcape.com
Businessreview
01-37Sha
reholderinfo
rmation
Insidebackcover
Financia
lstatem
ents58-120
Governa
nce38-57
The results of subsidiaries are consolidated using the purchase method of accounting from the date on which control of the net assetsand operations of the acquired company are effectively transferred to the Group.Similarly, the results of subsidiaries disposed of cease tobe consolidated from the date on which control of the net assets and operations are transferred out of the Group.
Where the Group acquires the minority interest in a subsidiary, the excess of the purchase cost over the book value of the minority interestis recorded as an addition to goodwill.No fair value exercise is performed for the acquisition of the minority interest.
Where the Group acquires a controlling interest in a subsidiary with a contractual obligation to purchase the remaining minority, theacquired company is accounted for as a 100% subsidiary,with the liability for the purchase of the remaining minority interest recorded asdeferred consideration.Subsequent changes to estimates of the deferred consideration are recorded as additions/reductions to theamount of goodwill arising on acquisition.
Investments in joint ventures and associates are accounted for using the equity method,whereby the Group’s share of the post-acquisitionprofits or losses are recognised in the consolidated income statement,and its share of post-acquisition movements in shareholders’equityare recognised in shareholders’equity. If the Group’s share of losses in a joint venture or associate equals or exceeds its investment in thejoint venture or associate, the Group does not recognise further losses,unless it has contractual obligations or made payments on behalfof the joint venture or associate.
Foreign currency translationTransactions included in the results of each of the Group’s entities are measured using the currency of the primary economic environmentin which the entity operates (the functional currency).The consolidated Financial statements are presented in Sterling,which is Inchcapeplc’s functional and presentational currency.
In the individual entities, transactions in foreign currencies are translated into the functional currency at the rates of exchange prevailing atthe dates of the individual transactions.Monetary assets and liabilities denominated in foreign currencies are subsequently retranslated atthe rate of exchange ruling at the balance sheet date.All differences are taken to the consolidated income statement,except those arisingon long-term foreign currency borrowings used to finance or hedge foreign currency investments which on consolidation are taken directlyto shareholders’equity.
The assets and liabilities of foreign operations are translated into Sterling at the rate of exchange ruling at the balance sheet date.The income statements of foreign operations are translated into Sterling at the average rates of exchange for the period.Exchangedifferences arising from 1 January 2004 are recognised as a separate component of shareholders’equity.On disposal of a foreignoperation any cumulative exchange differences held in shareholders’equity are transferred to the consolidated income statement.
Revenue and cost of salesRevenue from the sale of goods and services is measured at the fair value of consideration receivable,net of rebates and any discountsand includes lease rentals as well as finance and insurance commission. It excludes sales-related taxes and intra-Group transactions.
Revenue is recognised to the extent that it is probable that economic benefits will flow to the Group and the revenue can be reliablymeasured. In practice this means that revenue is recognised when vehicles or parts are invoiced and physically dispatched or when theservice has been undertaken.Revenue from commission is recognised when receipt of payment can be assured.
Where a vehicle is sold to a leasing company,and a Group company retains a residual value commitment to buy back the vehicle for aspecified value at a specified date, the significant risks and rewards of ownership are not judged to have been transferred.These vehiclesare retained within property,plant and equipment on the consolidated balance sheet at cost,and are depreciated to their residual valueover the life of the lease.Total revenue on a leased vehicle comprises the difference between consideration received and residual value.This sits as deferred revenue on the consolidated balance sheet and is released to the consolidated income statement on a straight-linebasis over the life of the lease.The residual value commitment,which reflects the price at which the vehicle will be bought back, is heldwithin trade and other payables,according to the date of the commitment.
Dividend income is recognised when the right to receive payment is established.
Cost of sales includes the expense relating to the estimated cost of self-insured warranties offered to customers.These warranties form partof the package of goods and services provided to the customer when purchasing a vehicle and are not a separable product.
Share-based paymentsThe Group operates various share-based award schemes.The fair value at the date at which the share-based awards are granted isrecognised in the consolidated income statement (together with a corresponding increase in shareholders’equity) on a straight-line basisover the vesting period,based on an estimate of the number of shares that will eventually vest.For equity settled share-based awards, theservices received from employees are measured by reference to the fair value of the awards granted.With the exception of the Group‘Saveas you earn’scheme,the vesting of all share-based awards under all schemes is solely reliant upon non-market conditions therefore noexpense is recognised for awards that do not ultimately vest.Where an employee cancels a‘Save as you earn’award, the charge for thataward is recognised as an expense immediately,even though the award does not vest.
Finance costsBorrowing costs which are directly attributable to the acquisition,construction or production of a qualifying asset,are capitalised as partof the cost of that asset.All other borrowing costs are recognised as an expense in the period in which they are incurred.
Borrowing costs are capitalised from the first date on which the expenditure is incurred for the asset,borrowing costs are incurred andactivities are undertaken to prepare the asset for its intended use.A Group capitalisation rate is used to determine the magnitude ofborrowing costs capitalised on each qualifying asset.This rate is the weighted average of Group borrowing costs,excluding thoseborrowings made specifically for the purpose of obtaining a qualifying asset.

64
Inchcape plc Annual Report and Accounts 2008
Financial statements
Accounting policies continued
Income taxThe charge for current income tax is based on the results for the period as adjusted for items which are not taxed or disallowed. It iscalculated using tax rates that have been enacted or substantively enacted by the balance sheet date.
Deferred income tax is accounted for using the liability method in respect of temporary differences arising from differences between thetax bases of assets and liabilities and their carrying amounts in the consolidated Financial statements.
In principle,deferred tax liabilities are recognised for all taxable temporary differences and deferred tax assets are recognised to the extentthat it is probable that taxable profits will be available against which deductible temporary differences can be utilised.Such assets andliabilities are not recognised if the temporary difference is due to goodwill arising on a business combination,or to an asset or liability, theinitial recognition of which does not affect either taxable or accounting income.
Deferred tax liabilities are recognised for taxable temporary differences arising on investments in subsidiaries, joint ventures and associates,except where the Group is able to control the reversal of the temporary difference and it is probable that the temporary difference will notreverse in the foreseeable future.
Deferred tax is calculated at the tax rates that are expected to apply to the period when the asset is realised or the liability is settled usingrates enacted at the balance sheet date.Deferred tax is charged or credited in the consolidated income statement,except when it relatesto items credited or charged directly to shareholders’equity, in which case the deferred tax is also dealt with in shareholders’equity.
Deferred tax assets and liabilities are only offset where there is a legally enforceable right of offset and there is an intention to settlebalances net.
Exceptional itemsItems which are both material and non-recurring are presented as exceptional items within their relevant consolidated income statementcategory.The separate reporting of exceptional items helps provide a better indication of the Group’s underlying business performance.Examples of events which may give rise to the classification of items as exceptional include gains or losses on the disposal of businesses,restructuring of businesses, litigation,asset impairments and exceptional tax-related matters.
GoodwillGoodwill represents the excess of the cost of acquisition of a business combination over the Group’s share of the fair value of identifiablenet assets of the business acquired at the date of acquisition.Goodwill is initially recognised at cost and is held in the currency of theacquired entity and revalued at the closing exchange rate at each balance sheet date.
After initial recognition,goodwill is measured at cost less any accumulated impairment losses.At the date of acquisition the goodwill isallocated to cash-generating units for the purpose of impairment testing and is tested at least annually for impairment.
Gains and losses on disposal of a business include the carrying amount of goodwill relating to the business sold in determining the gainor loss on disposal,except for goodwill arising on business combinations on or before 31 December 1997 which has been deducted fromshareholders’equity and remains indefinitely in shareholders’equity.
Other intangible assetsIntangible assets,when acquired separately from a business (including computer software),are carried at cost less accumulatedamortisation and impairment losses.Amortisation is provided on a straight-line basis to allocate the cost of the asset over its estimateduseful life,which in the case of computer software is three to five years.Amortisation is recognised in the consolidated income statementwithin net operating expenses.
Intangible assets acquired as part of a business combination (including back orders and customer contracts) are capitalised separatelyfrom goodwill if the fair value can bemeasured reliably on initial recognition.These intangible assets are amortised over their estimateduseful life,which is generally less than a year.
Property,plant and equipmentProperty,plant and equipment is stated at cost less accumulated depreciation and impairment losses.Cost comprises the purchase priceand directly attributable costs of the asset and includes,where relevant,capitalised borrowing costs.Depreciation is based on cost lessestimated residual value and is provided,except for freehold land which is not depreciated,on a straight-line basis over the estimateduseful life of the asset.For the following categories, the annual rates used are:
Freehold buildings and long leasehold buildings 2.0%Short leasehold buildings shorter of lease term or useful lifePlant,machinery and equipment 5.0% – 33.3%Vehicles subject to residual value commitments over the lease term
The residual values and useful lives of all assets are reviewed at least at each balance sheet date.
ImpairmentAssets that are subject to amortisation or depreciation are reviewed for impairment whenever events or circumstances indicate that thecarrying amount may not be recoverable.
In addition,goodwill is not subject to amortisation but is tested at least annually for impairment.An impairment loss is recognised for theamount by which the asset’s carrying amount exceeds its recoverable amount, the latter being the higher of the asset’s fair value less coststo sell and value in use.Value in use calculations are performed using cash flow projections,discounted at a pre-tax rate which reflects theasset specific risks and the time value of money.
65
www.inchcape.com
Businessreview
01-37Sha
reholderinfo
rmation
Insidebackcover
Financia
lstatem
ents58-120
Governa
nce38-57
A provision for impairment of trade receivables is established when there is objective evidence that the Group will not be able to collect allamounts due according to the original terms of the receivables.The carrying amount of the asset is reduced through the use of an allowanceaccount,and the amount of the loss is recognised in the consolidated income statement within ‘net operating expenses’.When a tradereceivable is uncollectible, it is written off against the allowance account for trade receivables.Subsequent recoveries of amounts previouslywritten off are credited against ‘net operating expenses’ in the consolidated income statement.
InventoriesInventories are stated at the lower of cost and net realisable value.Cost comprises expenditure incurred in bringing inventories to theirpresent location and condition.Net realisable value represents the estimated selling price less all estimated costs of completion and coststo be incurred in marketing,selling and distribution.Used vehicles are carried at the lower of cost or fair value less costs to sell,generallybased on external market data available for used vehicles.
Vehicles held on consignment which are deemed in substance to be assets of the Group are included within inventories with thecorresponding liability included within trade and other payables.
Inventory can be held on deferred payment terms.All costs associated with this deferral are expensed in the period in which theyare incurred.
Pensions and other post-retirement benefitsThe Group operates a number of retirement benefit schemes.
The major schemes are defined benefit pension funds with assets held separately from the Group.The cost of providing benefits under theplans is determined separately for each plan using the projected unit credit actuarial valuation method.
The current service cost and gains and losses on settlements and curtailments are included in cost of sales or net operating expenses inthe consolidated income statement.Past service costs are similarly included where the benefits have vested,otherwise they are amortisedon a straight-line basis over the vesting period.The expected return on assets of funded defined benefit pension plans and the imputedinterest on pension plan liabilities comprise the post-retirement benefit element of finance costs and finance income in the consolidatedincome statement.
Differences between the actual and expected return on assets,changes in the retirement benefit obligation due to experience andchanges in actuarial assumptions are included in the consolidated statement of recognised income and expense in full in the periodin which they arise.
The Group’s contributions to defined contribution plans are charged to the consolidated income statement in the period to which thecontributions relate.
The Group also has a liability in respect of past employees under post-retirement healthcare schemes which have been closed to newentrants.These schemes are accounted for on a similar basis to that for defined benefit pension plans in accordance with the adviceof independent qualified actuaries.
ProvisionsProvisions are recognised when the Group has a present obligation in respect of a past event, it is more likely than not that an outflowof resources will be required to settle the obligation and where the amount can be reliably estimated.Provisions are discounted when thetime value of money is considered to be material,using an appropriate risk free rate on government bonds.
Disposal group and assets held for saleWhere the Group is actively marketing the disposal of a business within one year of the balance sheet date, the assets and liabilities ofthe associated businesses are separately disclosed on the consolidated balance sheet as a disposal group.Assets are classified as assetsheld for sale if their carrying amount is to be recovered principally through a sale transaction rather than through continuing use.Bothdisposal groups and assets held for sale are stated at the lower of their carrying amount and fair value less costs to sell.
Financial instrumentsThe Group classifies its financial instruments in the following categories: loans and receivables;available for sale;held at fair value;andamortised cost.The classification is determined at initial recognition and depends on the purpose for which the financial instrumentsare required.
Loans and receivables are non-derivative financial assets with fixed or determinable payments that are not quoted in an active market.They are included in current assets,except where the maturity date is more than 12 months after the balance sheet date.
Held at fair value includes derivative financial assets and liabilities,which are further explained below.They are classified accordingto maturity date,within current and non-current assets and liabilities respectively.
Available for sale financial assets are non-derivative financial assets,and comprise bonds and equity investments.They are classifiedas non-current assets unless management intends to dispose of them within 12 months of the balance sheet date.
Amortised cost is the residual category and includes non-derivative financial assets and liabilities which are held at original cost, lessamortisation or provision raised.
Cash and cash equivalentsCash and cash equivalents in the consolidated balance sheet comprise cash at bank and in hand and short-term bank deposits.
In the consolidated cash flow statement,cash and cash equivalents comprise cash and cash equivalents,as defined above,net of bank overdrafts.
66
Inchcape plc Annual Report and Accounts 2008
Financial statements
Accounting policies continued
LeasesFinance leases,which transfer to the Group substantially all the risks and rewards of ownership of the leased item,are capitalised at theinception of the lease at the fair value of the leased asset or, if lower,at the present value of the minimum lease payments.Lease paymentsare apportioned between the finance charges and reduction of the lease liability so as to achieve a constant rate of interest on theremaining balance of the liability.Finance charges are charged to the consolidated income statement.Capitalised leased assets aredepreciated over the shorter of the estimated useful life of the asset or the lease term.
Leases where the Group retains substantially all the risks and rewards of ownership of the asset are classified as operating leases.Operatinglease rental payments are recognised as an expense in the consolidated income statement on a straight-line basis over the lease term.
OffsettingBalance sheet netting only occurs to the extent that there is the legal ability and intention to settle net.As such,bank overdrafts arepresented in current liabilities to the extent that there is no intention to offset with the cash balance.
Derivative financial instrumentsAn outline of the objectives,policies and strategies pursued by the Group in relation to its financial instruments is set out in the Principalbusiness risk factors section of the Financial review.
Derivatives are initially recognised at fair value on the date a derivative contract is entered into and are subsequently re-measured at theirfair value.The method of recognising the resulting gain or loss depends on whether the derivative is designated as a hedging instrument,and if so, the nature of the item being hedged.The Group designates certain derivatives as:
• hedges of the fair value of recognised assets or liabilities or a firm commitment (fair value hedge);or
• hedges of a particular risk associated with a recognised asset or liability or a highly probable forecast transaction (cash flow hedge);or
• hedges of a net investment in a foreign operation (net investment hedge).
Fair value hedgeChanges in the fair value of derivatives that are designated and qualify as fair value hedges are recorded in the consolidated incomestatement, together with any changes in the fair value of the hedged asset or liability that are attributable to the hedged risk.The Grouponly applies fair value hedge accounting for hedging fixed interest risk on borrowings (on its cross-currency interest rate swaps) and futurefixed amount currency liabilities.The gain or loss relating to the effective portion of interest rate swaps hedging fixed rate borrowings andchanges in the fair value of those borrowings are recognised in the consolidated income statement within finance costs.The gain or lossrelating to the ineffective portion is also recognised in the consolidated income statement within finance costs.
Cash flow hedgeFor cash flow hedges that meet the conditions for hedge accounting, the portion of the gains or losses on the hedging instrument thatare determined to be an effective hedge are recognised directly in shareholders’equity and the ineffective portion is recognised in theconsolidated income statement.When the hedged forecast transaction results in the recognition of a non-financial asset or liability then,at the time the asset or liability is recognised,the associated gains or losses that had previously been recognised in shareholders’equity areincluded in the initial measurement of the acquisition cost or other carrying amount of the asset or liability.For all other cash flow hedges,the gains or losses that are recognised in shareholders’equity are transferred to the consolidated income statement in the same periodin which the hedged forecast transaction affects the consolidated income statement.
Net investment hedgeThe Group uses borrowings denominated in foreign currency to hedge net investments in foreign operations.These are accounted forsimilarly to cash flow hedges.Any gain or loss on the hedging instrument relating to the effective portion of the hedge is recognised inequity; the gain or loss relating to any ineffective portion is recognised immediately in the consolidated income statement in net operatingexpenses.Gains and losses accumulated in equity are included in the consolidated income statement when the foreign operation isdisposed of.
Hedge accounting is discontinued when the hedging instrument expires, is sold, terminated,exercised or no longer qualifies for hedgeaccounting.At that point in time any cumulative gains or losses on the hedging instrument which have been recognised in shareholders’equity are kept in shareholders’equity until the forecast transaction occurs. If a hedged transaction is no longer expected to occur,the cumulative gains or losses that have been recognised in shareholders’equity are transferred to the consolidated income statementfor the period.
For derivatives that do not qualify for hedge accounting,any gains or losses arising from changes in fair value are taken directly to theconsolidated income statement.
InvestmentsThe Group’s investments are classified as available for sale or held to maturity (where management has a positive intention and abilityto hold the asset to maturity).
Gains and losses on available for sale financial assets are recognised in shareholders’equity,until the investment is sold or is consideredto be impaired,at which time the cumulative gain or loss previously reported in shareholders’equity is included in the consolidated incomestatement as part of net operating expenses.
Held to maturity financial assets are carried at amortised cost.

67
www.inchcape.com
Businessreview
01-37Sha
reholderinfo
rmation
Insidebackcover
Financia
lstatem
ents58-120
Governa
nce38-57
Share capitalOrdinary shares are classified as equity.Where the Group purchases the Group’s equity share capital (treasury shares), the considerationpaid is deducted from shareholders’equity until the shares are cancelled, reissued or disposed of.Where such shares are subsequently soldor reissued,any consideration received is included in shareholders’equity.
DividendsFinal dividends proposed by the Board of Directors and unpaid at the year end are not recognised in the consolidated Financialstatements until they have been approved by the Shareholders at theAnnual General Meeting. Interim dividends are recognised whenthey are paid.
Significant accounting judgements and estimatesJudgementsIn the process of applying the Group’s accounting policies, the Directors have made the following judgements,apart from those involvingestimations,which have the most significant effect on the amounts recognised in the consolidated Financial statements.
Revenue recognition on vehicles subject to residual value commitmentsWhere the Group sells vehicles,sourced from within the Group,and retains a residual value commitment, the sale is not recognised on thebasis that the Group has determined that it retains the significant risks and rewards of ownership of these vehicles.
Consignment stockVehicles held on consignment have been included in finished goods inventories on the basis that the Group has determined that it holdsthe significant risks and rewards attached to these vehicles.
EstimatesThe key assumptions concerning the future and other sources of estimation uncertainty at the balance sheet date, that have a significantrisk of causing material adjustment to the carrying amounts of assets and liabilities within the next financial year are discussed below.
Product warranty provisionThe product warranty provision requires an estimation of the number of expected warranty claims,and the expected cost of labour andparts necessary to satisfy these warranty claims.
Pensions and other post-retirement benefitsThe net retirement benefit asset or liability is calculated based on a number of actuarial assumptions as detailed in note 5.A numberof these assumptions involve a considerable degree of estimation, including the rate of inflation and expected mortality rates.
TaxThe Group is subject to income taxes in a number of jurisdictions.Some degree of estimation is required in determining the worldwideprovision for income taxes.There are a number of transactions and calculations for which the ultimate tax determination is uncertain duringthe ordinary course of business.The Group recognises liabilities for anticipated tax audit issues based on estimates of whether additionaltaxes will be due.Where the final tax outcome of these matters is different from the amounts that were initially recorded,such differenceswill impact the current tax and deferred tax provisions in the period in which such determination is made.
In addition, the recognition of deferred tax assets is dependent upon an estimation of future taxable profits that will be available againstwhich deductible temporary differences can be utilised. In the event that actual taxable profits are different,such differences may impactthe carrying value of such deferred tax assets in future periods.
GoodwillGoodwill is tested at least annually for impairment in accordance with the accounting policy set out above.The recoverable amount ofcash-generating units is determined based on value in use calculations.These calculations require the use of estimates including projectedfuture cash flows.
Residual value commitmentsThe Group has residual value commitments on certain leased vehicles.These commitments are an estimate of future market valueat a specified point in time.The actual market value of vehicles bought back may vary from the committed purchase value.
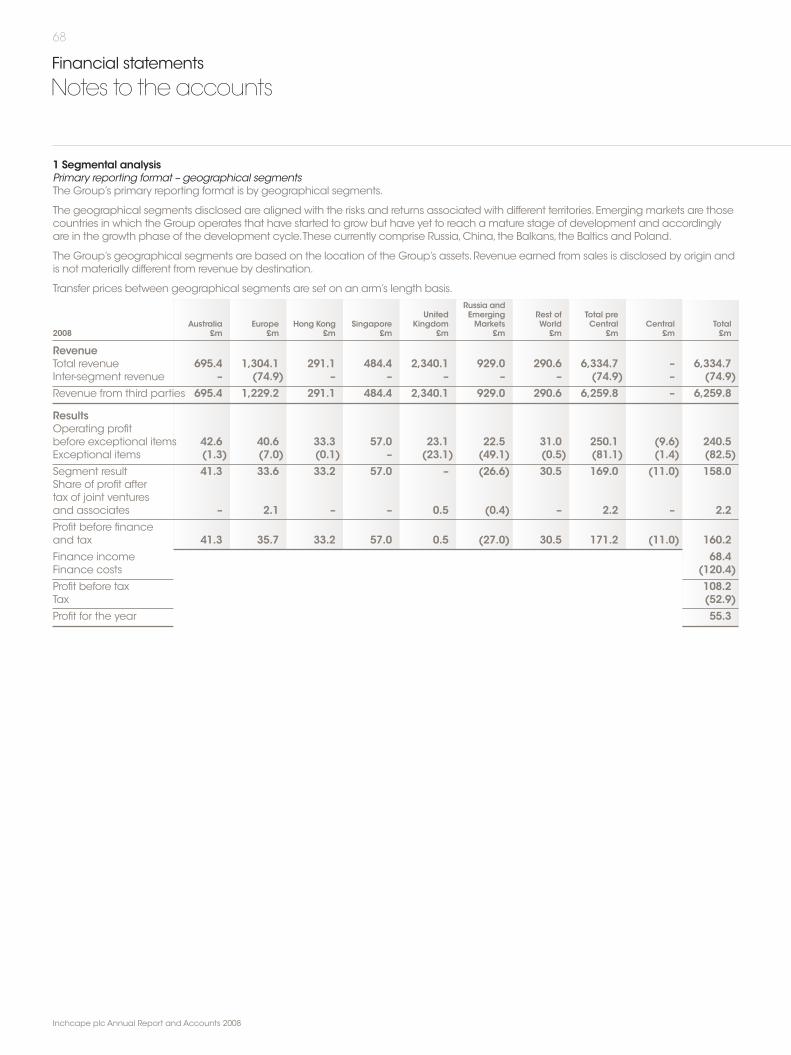
68
Inchcape plc Annual Report and Accounts 2008
Financial statements
Notes to the accounts
1 Segmental analysisPrimary reporting format – geographical segmentsThe Group’s primary reporting format is by geographical segments.
The geographical segments disclosed are aligned with the risks and returns associated with different territories.Emerging markets are thosecountries in which the Group operates that have started to grow but have yet to reach amature stage of development and accordinglyare in the growth phase of the development cycle.These currently comprise Russia,China, the Balkans, the Baltics and Poland.
The Group’s geographical segments are based on the location of the Group’s assets.Revenue earned from sales is disclosed by origin andis not materially different from revenue by destination.
Transfer prices between geographical segments are set on an arm’s length basis.Russia and
United Emerging Rest of Total preAustralia Europe Hong Kong Singapore Kingdom Markets World Central Central Total
2008 £m £m £m £m £m £m £m £m £m £m
RevenueTotal revenue 695.4 1,304.1 291.1 484.4 2,340.1 929.0 290.6 6,334.7 – 6,334.7Inter-segment revenue – (74.9) – – – – – (74.9) – (74.9)Revenue from third parties 695.4 1,229.2 291.1 484.4 2,340.1 929.0 290.6 6,259.8 – 6,259.8
ResultsOperating profitbefore exceptional items 42.6 40.6 33.3 57.0 23.1 22.5 31.0 250.1 (9.6) 240.5Exceptional items (1.3) (7.0) (0.1) – (23.1) (49.1) (0.5) (81.1) (1.4) (82.5)Segment result 41.3 33.6 33.2 57.0 – (26.6) 30.5 169.0 (11.0) 158.0Share of profit aftertax of joint venturesand associates – 2.1 – – 0.5 (0.4) – 2.2 – 2.2Profit before financeand tax 41.3 35.7 33.2 57.0 0.5 (27.0) 30.5 171.2 (11.0) 160.2Finance income 68.4Finance costs (120.4)Profit before tax 108.2Tax (52.9)Profit for the year 55.3
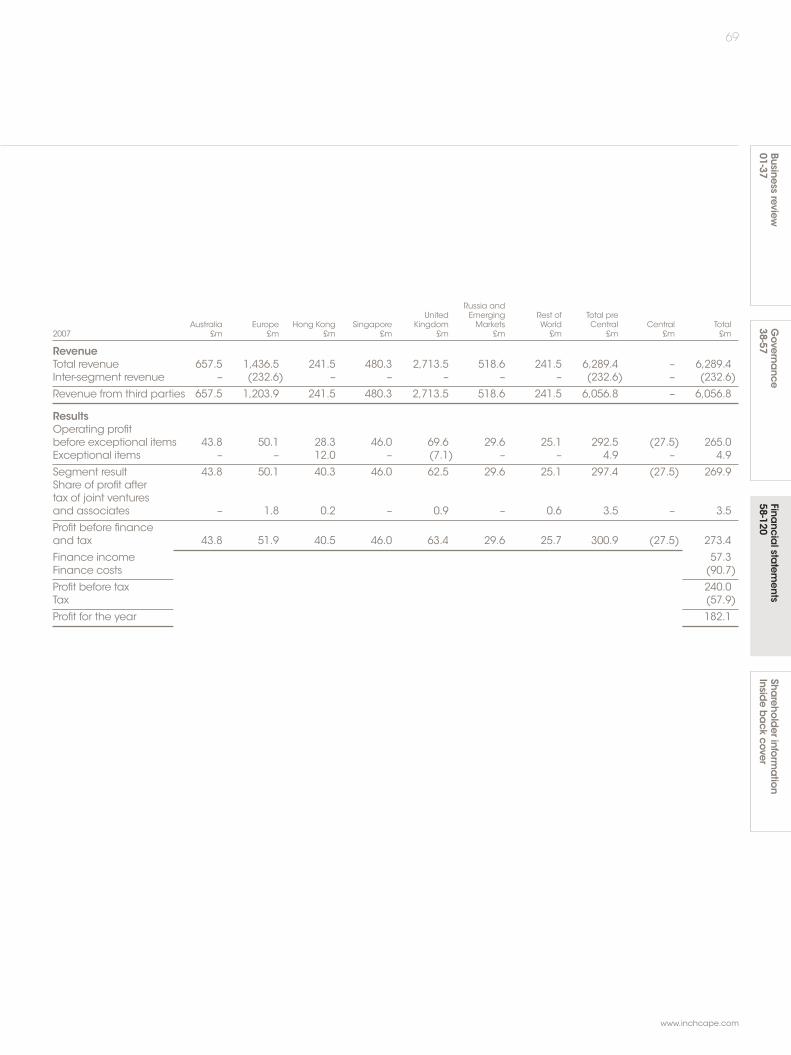
69
www.inchcape.com
Businessreview
01-37Sha
reholderinfo
rmation
Insidebackcover
Financia
lstatem
ents58-120
Governa
nce38-57
Russia andUnited Emerging Rest of Total pre
Australia Europe Hong Kong Singapore Kingdom Markets World Central Central Total2007 £m £m £m £m £m £m £m £m £m £m
RevenueTotal revenue 657.5 1,436.5 241.5 480.3 2,713.5 518.6 241.5 6,289.4 – 6,289.4Inter-segment revenue – (232.6) – – – – – (232.6) – (232.6)
Revenue from third parties 657.5 1,203.9 241.5 480.3 2,713.5 518.6 241.5 6,056.8 – 6,056.8
ResultsOperating profitbefore exceptional items 43.8 50.1 28.3 46.0 69.6 29.6 25.1 292.5 (27.5) 265.0Exceptional items – – 12.0 – (7.1) – – 4.9 – 4.9
Segment result 43.8 50.1 40.3 46.0 62.5 29.6 25.1 297.4 (27.5) 269.9Share of profit aftertax of joint venturesand associates – 1.8 0.2 – 0.9 – 0.6 3.5 – 3.5
Profit before financeand tax 43.8 51.9 40.5 46.0 63.4 29.6 25.7 300.9 (27.5) 273.4
Finance income 57.3Finance costs (90.7)
Profit before tax 240.0Tax (57.9)
Profit for the year 182.1

70
Inchcape plc Annual Report and Accounts 2008
Financial statements
Notes to the accounts continued
1 Segmental analysis continuedRussia and
United Emerging Rest of Total preAustralia Europe Hong Kong Singapore Kingdom Markets World Unallocated Unallocated Total
2008 £m £m £m £m £m £m £m £m £m £m
Segment assetsand liabilitiesSegment assets 342.2 367.3 79.8 109.7 1,077.5 662.2 117.9 2,756.6 – 2,756.6Investment in jointventures and associates – 11.1 – – 4.5 5.7 – 21.3 – 21.3Assets held for sale – 5.4 – – – – – 5.4 – 5.4Cash and cash equivalents – – – – – – – – 458.0 458.0Other unallocated assets* – – – – – – – – 265.0 265.0Total assets 342.2 383.8 79.8 109.7 1,082.0 667.9 117.9 2,783.3 723.0 3,506.3
Segment liabilities (215.6) (229.4) (18.1) (38.8) (475.2) (115.9) (60.3) (1,153.3) – (1,153.3)External borrowings – – – – – – – – (1,021.4) (1,021.4)Liabilities directlyassociated with thedisposal group – – – – – – – – – –Other unallocatedliabilities* – – – – – – – – (312.0) (312.0)Total liabilities (215.6) (229.4) (18.1) (38.8) (475.2) (115.9) (60.3) (1,153.3) (1,333.4) (2,486.7)
* Other unallocated assets and liabilities include central provisions, tax,cash and debt,dividends and assets and liabilities not directly related to operating activities.
Russia andUnited Emerging Rest of Total pre
Australia Europe Hong Kong Singapore Kingdom Markets World Central Central Total2008 £m £m £m £m £m £m £m £m £m £m
Other segment items
Capital expenditure:– Property,plantand equipment 2.4 4.4 3.0 2.4 37.8 55.7 7.1 112.8 5.0 117.8
– Vehicles subject to residualvalue commitments – 14.6 – – 38.8 10.1 – 63.5 – 63.5
– Intangible assets 0.2 0.3 – – 0.9 0.3 – 1.7 18.3 20.0Depreciation:– Property,plantand equipment 2.7 3.5 1.6 1.6 17.3 4.6 2.3 33.6 2.5 36.1
– Vehicles subject to residualvalue commitments 0.6 5.0 – – 10.7 3.3 – 19.6 – 19.6
Amortisation ofintangible assets 0.2 0.6 – 0.1 1.1 1.4 – 3.4 0.3 3.7Impairment of goodwill – – – – 7.4 46.8 – 54.2 – 54.2Net provisionscharged to theincome statement 6.0 18.9 2.1 3.3 24.2 10.5 1.3 66.3 1.1 67.4
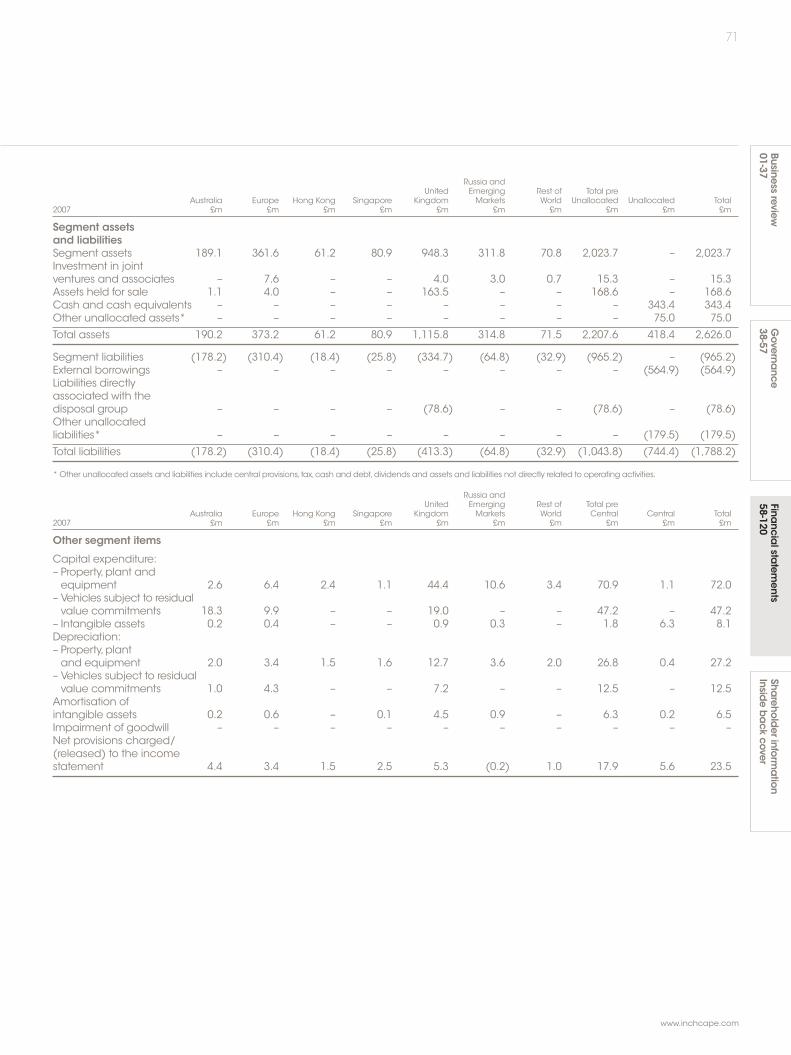
71
www.inchcape.com
Businessreview
01-37Sha
reholderinfo
rmation
Insidebackcover
Financia
lstatem
ents58-120
Governa
nce38-57
Russia andUnited Emerging Rest of Total pre
Australia Europe Hong Kong Singapore Kingdom Markets World Unallocated Unallocated Total2007 £m £m £m £m £m £m £m £m £m £m
Segment assetsand liabilitiesSegment assets 189.1 361.6 61.2 80.9 948.3 311.8 70.8 2,023.7 – 2,023.7Investment in jointventures and associates – 7.6 – – 4.0 3.0 0.7 15.3 – 15.3Assets held for sale 1.1 4.0 – – 163.5 – – 168.6 – 168.6Cash and cash equivalents – – – – – – – – 343.4 343.4Other unallocated assets* – – – – – – – – 75.0 75.0
Total assets 190.2 373.2 61.2 80.9 1,115.8 314.8 71.5 2,207.6 418.4 2,626.0
Segment liabilities (178.2) (310.4) (18.4) (25.8) (334.7) (64.8) (32.9) (965.2) – (965.2)External borrowings – – – – – – – – (564.9) (564.9)Liabilities directlyassociated with thedisposal group – – – – (78.6) – – (78.6) – (78.6)Other unallocatedliabilities* – – – – – – – – (179.5) (179.5)
Total liabilities (178.2) (310.4) (18.4) (25.8) (413.3) (64.8) (32.9) (1,043.8) (744.4) (1,788.2)
* Other unallocated assets and liabilities include central provisions, tax,cash and debt,dividends and assets and liabilities not directly related to operating activities.
Russia andUnited Emerging Rest of Total pre
Australia Europe Hong Kong Singapore Kingdom Markets World Central Central Total2007 £m £m £m £m £m £m £m £m £m £m
Other segment items
Capital expenditure:– Property,plant andequipment 2.6 6.4 2.4 1.1 44.4 10.6 3.4 70.9 1.1 72.0
– Vehicles subject to residualvalue commitments 18.3 9.9 – – 19.0 – – 47.2 – 47.2
– Intangible assets 0.2 0.4 – – 0.9 0.3 – 1.8 6.3 8.1Depreciation:– Property,plantand equipment 2.0 3.4 1.5 1.6 12.7 3.6 2.0 26.8 0.4 27.2
– Vehicles subject to residualvalue commitments 1.0 4.3 – – 7.2 – – 12.5 – 12.5
Amortisation ofintangible assets 0.2 0.6 – 0.1 4.5 0.9 – 6.3 0.2 6.5Impairment of goodwill – – – – – – – – – –Net provisions charged/(released) to the incomestatement 4.4 3.4 1.5 2.5 5.3 (0.2) 1.0 17.9 5.6 23.5

72
Inchcape plc Annual Report and Accounts 2008
Financial statements
Notes to the accounts continued
1 Segmental analysis continuedSecondary reporting format – business segmentsThe Group’s secondary reporting format is by business segments.
The disclosures comprise two key business segments – Distribution and Retail.Distribution comprisesVertically integrated import,distributionand retail as well as import and distribution. In addition,Distribution includes Financial Services and Other businesses.
The secondary disclosures below analyse Distribution and Retail by geographical region.Additional disclosure has also been provided onthe segmentation of profitability and operating assets and liabilities.
Transfer prices between business segments are set on an arm’s length basis.Distribution
Russia andUnited Emerging Rest of Total
Australia Europe Hong Kong Singapore Kingdom Markets World Distribution2008 £m £m £m £m £m £m £m £m
RevenueTotal revenue 575.5 1,014.5 291.1 484.4 20.7 382.1 283.3 3,051.6Inter-segment revenue (143.3) (176.6) – – – (77.0) – (396.9)Revenue from third parties 432.2 837.9 291.1 484.4 20.7 305.1 283.3 2,654.7
ResultsOperating profitbefore exceptional items 33.7 39.9 33.3 57.0 (5.7) 3.9 30.8 192.9Exceptional items (1.3) (4.0) (0.1) – – (47.3) (0.5) (53.2)Segment result 32.4 35.9 33.2 57.0 (5.7) (43.4) 30.3 139.7Share of profit after tax ofjoint ventures and associates – 2.1 – – 0.2 – – 2.3Profit before finance and tax 32.4 38.0 33.2 57.0 (5.5) (43.4) 30.3 142.0Finance incomeFinance costs
Profit before taxTax
Profit for the year

73
www.inchcape.com
Businessreview
01-37Sha
reholderinfo
rmation
Insidebackcover
Financia
lstatem
ents58-120
Governa
nce38-57
Retail
Russia andUnited Emerging Rest of Total Total pre
Australia Europe Kingdom Markets World Retail Central Central Total2008 £m £m £m £m £m £m £m £m £m
RevenueTotal revenue 263.2 391.3 2,319.4 623.9 7.3 3,605.1 6,656.7 – 6,656.7Inter-segment revenue – – – – – – (396.9) – (396.9)Revenue from third parties 263.2 391.3 2,319.4 623.9 7.3 3,605.1 6,259.8 – 6,259.8
ResultsOperating profitbefore exceptional items 8.9 0.7 28.8 18.6 0.2 57.2 250.1 (9.6) 240.5Exceptional items – (3.0) (23.1) (1.8) – (27.9) (81.1) (1.4) (82.5)Segment result 8.9 (2.3) 5.7 16.8 0.2 29.3 169.0 (11.0) 158.0Share of profit after tax ofjoint ventures and associates – – 0.3 (0.4) – (0.1) 2.2 – 2.2Profit before finance and tax 8.9 (2.3) 6.0 16.4 0.2 29.2 171.2 (11.0) 160.2Finance income 68.4Finance costs (120.4)Profit before tax 108.2Tax (52.9)Profit for the year 55.3

74
Inchcape plc Annual Report and Accounts 2008
Financial statements
Notes to the accounts continued
1 Segmental analysis continuedDistribution
Russia andUnited Emerging Rest of Total
Australia Europe Hong Kong Singapore Kingdom Markets World Distribution2008 £m £m £m £m £m £m £m £m
Segment assets and liabilitiesSegment assets 246.3 301.2 79.8 109.7 93.8 206.1 115.6 1,152.5Investment in joint venturesand associates – 11.1 – – 1.9 – – 13.0Assets held for sale – – – – – – – –Cash and cash equivalents – – – – – – – –Other unallocated assets* – – – – – – – –Total assets 246.3 312.3 79.8 109.7 95.7 206.1 115.6 1,165.5
Segment liabilities (180.1) (211.7) (18.1) (38.8) (76.4) (45.6) (60.0) (630.7)External borrowings – – – – – – – –Liabilities directly associatedwith the disposal group – – – – – – – –Other unallocated liabilities* – – – – – – – –Total liabilities (180.1) (211.7) (18.1) (38.8) (76.4) (45.6) (60.0) (630.7)
* Other unallocated assets and liabilities include central provisions, tax,cash and debt,dividends and assets and liabilities not directly related to operating activities.
Distribution
Russia andUnited Emerging Rest of Total
Australia Europe Hong Kong Singapore Kingdom Markets World Distribution2008 £m £m £m £m £m £m £m £m
Other segment itemsCapital expenditure:– Property,plant and equipment 1.9 0.7 3.0 2.4 0.9 5.3 7.1 21.3– Vehicles subject to residualvalue commitments – 13.7 – – 38.8 10.1 – 62.6
– Intangible assets 0.2 0.3 – – 0.4 0.2 – 1.1
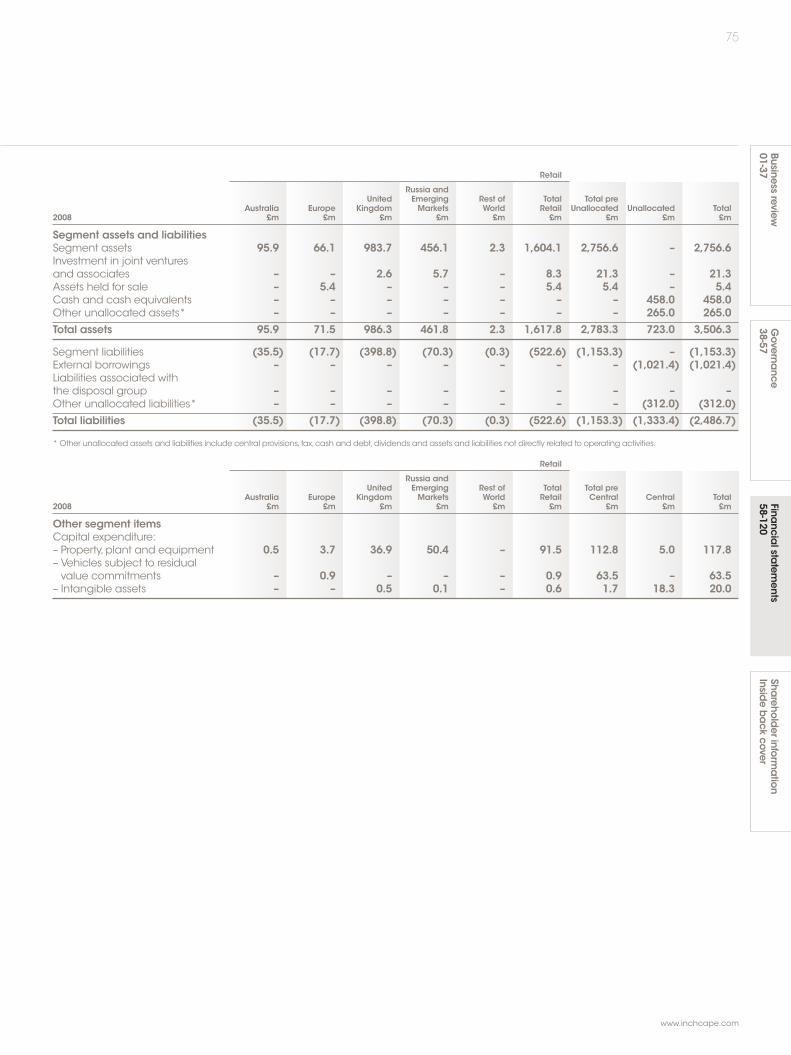
75
www.inchcape.com
Businessreview
01-37Sha
reholderinfo
rmation
Insidebackcover
Financia
lstatem
ents58-120
Governa
nce38-57
Retail
Russia andUnited Emerging Rest of Total Total pre
Australia Europe Kingdom Markets World Retail Unallocated Unallocated Total2008 £m £m £m £m £m £m £m £m £m
Segment assets and liabilitiesSegment assets 95.9 66.1 983.7 456.1 2.3 1,604.1 2,756.6 – 2,756.6Investment in joint venturesand associates – – 2.6 5.7 – 8.3 21.3 – 21.3Assets held for sale – 5.4 – – – 5.4 5.4 – 5.4Cash and cash equivalents – – – – – – – 458.0 458.0Other unallocated assets* – – – – – – – 265.0 265.0Total assets 95.9 71.5 986.3 461.8 2.3 1,617.8 2,783.3 723.0 3,506.3
Segment liabilities (35.5) (17.7) (398.8) (70.3) (0.3) (522.6) (1,153.3) – (1,153.3)External borrowings – – – – – – – (1,021.4) (1,021.4)Liabilities associated withthe disposal group – – – – – – – – –Other unallocated liabilities* – – – – – – – (312.0) (312.0)Total liabilities (35.5) (17.7) (398.8) (70.3) (0.3) (522.6) (1,153.3) (1,333.4) (2,486.7)
* Other unallocated assets and liabilities include central provisions, tax,cash and debt,dividends and assets and liabilities not directly related to operating activities.
Retail
Russia andUnited Emerging Rest of Total Total pre
Australia Europe Kingdom Markets World Retail Central Central Total2008 £m £m £m £m £m £m £m £m £m
Other segment itemsCapital expenditure:– Property,plant and equipment 0.5 3.7 36.9 50.4 – 91.5 112.8 5.0 117.8– Vehicles subject to residualvalue commitments – 0.9 – – – 0.9 63.5 – 63.5
– Intangible assets – – 0.5 0.1 – 0.6 1.7 18.3 20.0
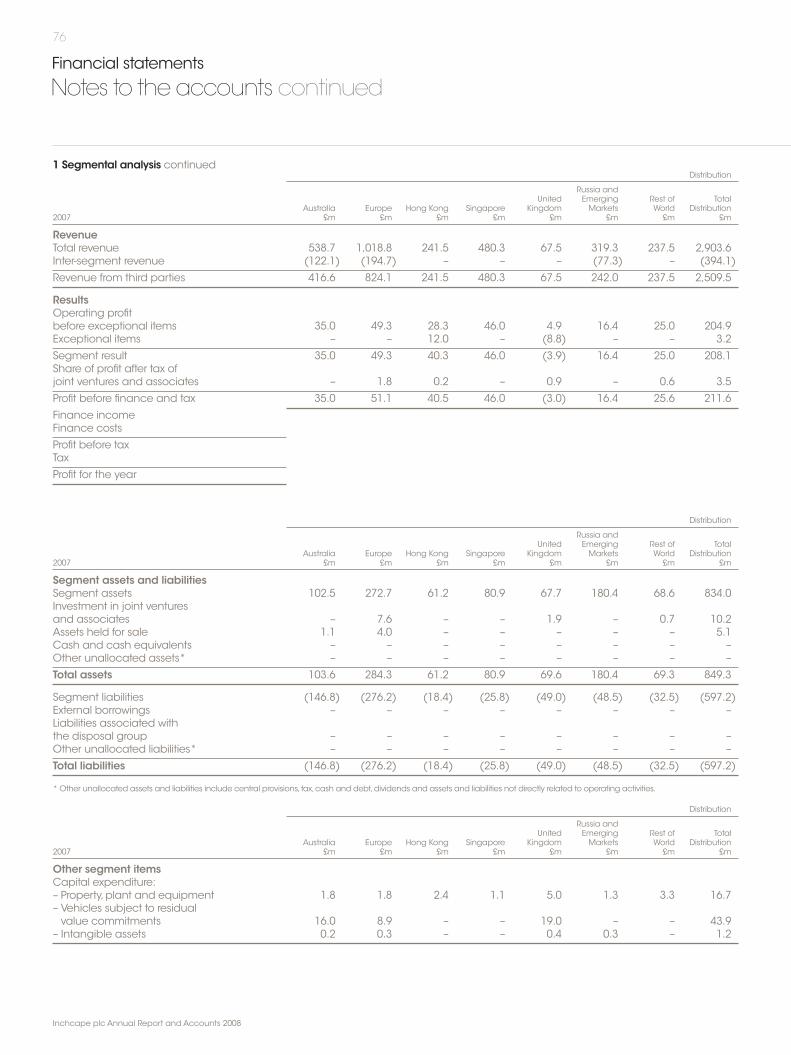
76
Inchcape plc Annual Report and Accounts 2008
Financial statements
Notes to the accounts continued
1 Segmental analysis continuedDistribution
Russia andUnited Emerging Rest of Total
Australia Europe Hong Kong Singapore Kingdom Markets World Distribution2007 £m £m £m £m £m £m £m £m
RevenueTotal revenue 538.7 1,018.8 241.5 480.3 67.5 319.3 237.5 2,903.6Inter-segment revenue (122.1) (194.7) – – – (77.3) – (394.1)
Revenue from third parties 416.6 824.1 241.5 480.3 67.5 242.0 237.5 2,509.5
ResultsOperating profitbefore exceptional items 35.0 49.3 28.3 46.0 4.9 16.4 25.0 204.9Exceptional items – – 12.0 – (8.8) – – 3.2
Segment result 35.0 49.3 40.3 46.0 (3.9) 16.4 25.0 208.1Share of profit after tax ofjoint ventures and associates – 1.8 0.2 – 0.9 – 0.6 3.5
Profit before finance and tax 35.0 51.1 40.5 46.0 (3.0) 16.4 25.6 211.6
Finance incomeFinance costs
Profit before taxTax
Profit for the year
Distribution
Russia andUnited Emerging Rest of Total
Australia Europe Hong Kong Singapore Kingdom Markets World Distribution2007 £m £m £m £m £m £m £m £m
Segment assets and liabilitiesSegment assets 102.5 272.7 61.2 80.9 67.7 180.4 68.6 834.0Investment in joint venturesand associates – 7.6 – – 1.9 – 0.7 10.2Assets held for sale 1.1 4.0 – – – – – 5.1Cash and cash equivalents – – – – – – – –Other unallocated assets* – – – – – – – –
Total assets 103.6 284.3 61.2 80.9 69.6 180.4 69.3 849.3
Segment liabilities (146.8) (276.2) (18.4) (25.8) (49.0) (48.5) (32.5) (597.2)External borrowings – – – – – – – –Liabilities associated withthe disposal group – – – – – – – –Other unallocated liabilities* – – – – – – – –
Total liabilities (146.8) (276.2) (18.4) (25.8) (49.0) (48.5) (32.5) (597.2)
* Other unallocated assets and liabilities include central provisions, tax,cash and debt,dividends and assets and liabilities not directly related to operating activities.
Distribution
Russia andUnited Emerging Rest of Total
Australia Europe Hong Kong Singapore Kingdom Markets World Distribution2007 £m £m £m £m £m £m £m £m
Other segment itemsCapital expenditure:– Property,plant and equipment 1.8 1.8 2.4 1.1 5.0 1.3 3.3 16.7– Vehicles subject to residualvalue commitments 16.0 8.9 – – 19.0 – – 43.9
– Intangible assets 0.2 0.3 – – 0.4 0.3 – 1.2

77
www.inchcape.com
Businessreview
01-37Sha
reholderinfo
rmation
Insidebackcover
Financia
lstatem
ents58-120
Governa
nce38-57
Retail
Russia andUnited Emerging Rest of Total Total pre
Australia Europe Kingdom Markets World Retail Central Central Total2007 £m £m £m £m £m £m £m £m £m
RevenueTotal revenue 240.9 379.8 2,646.0 276.6 4.0 3,547.3 6,450.9 – 6,450.9Inter-segment revenue – – – – – – (394.1) – (394.1)
Revenue from third parties 240.9 379.8 2,646.0 276.6 4.0 3,547.3 6,056.8 – 6,056.8
ResultsOperating profitbefore exceptional items 8.8 0.8 64.7 13.2 0.1 87.6 292.5 (27.5) 265.0Exceptional items – – 1.7 – – 1.7 4.9 – 4.9
Segment result 8.8 0.8 66.4 13.2 0.1 89.3 297.4 (27.5) 269.9Share of profit after tax ofjoint ventures and associates – – – – – – 3.5 – 3.5
Profit before finance and tax 8.8 0.8 66.4 13.2 0.1 89.3 300.9 (27.5) 273.4Finance income 57.3Finance costs (90.7)
Profit before tax 240.0Tax (57.9)
Profit for the year 182.1
Retail
Russia andUnited Emerging Rest of Total Total pre
Australia Europe Kingdom Markets World Retail Unallocated Unallocated Total2007 £m £m £m £m £m £m £m £m £m
Segment assets and liabilitiesSegment assets 86.6 88.9 880.6 131.4 2.2 1,189.7 2,023.7 – 2,023.7Investment in joint venturesand associates – – 2.1 3.0 – 5.1 15.3 – 15.3Assets held for sale – – 163.5 – – 163.5 168.6 – 168.6Cash and cash equivalents – – – – – – – 343.4 343.4Other unallocated assets* – – – – – – – 75.0 75.0
Total assets 86.6 88.9 1,046.2 134.4 2.2 1,358.3 2,207.6 418.4 2,626.0
Segment liabilities (31.4) (34.2) (285.7) (16.3) (0.4) (368.0) (965.2) – (965.2)External borrowings – – – – – – – (564.9) (564.9)Liabilities associated withthe disposal group – – (78.6) – – (78.6) (78.6) – (78.6)Other unallocated liabilities* – – – – – – – (179.5) (179.5)
Total liabilities (31.4) (34.2) (364.3) (16.3) (0.4) (446.6) (1,043.8) (744.4) (1,788.2)
* Other unallocated assets and liabilities include central provisions, tax,cash and debt,dividends and assets and liabilities not directly related to operating activities.
Retail
Russia andUnited Emerging Rest of Total Total pre
Australia Europe Kingdom Markets World Retail Central Central Total2007 £m £m £m £m £m £m £m £m £m
Other segment itemsCapital expenditure:– Property,plant and equipment 0.8 4.6 39.4 9.3 0.1 54.2 70.9 1.1 72.0– Vehicles subject to residualvalue commitments 2.3 1.0 – – – 3.3 47.2 – 47.2
– Intangible assets – 0.1 0.5 – – 0.6 1.8 6.3 8.1

78
Inchcape plc Annual Report and Accounts 2008
Financial statements
Notes to the accounts continued
2 Exceptional items2008 2007£m £m
Profit on disposal of Inchroy joint venture – 12.0Loss on disposal of Inchcape Automotive Limited – (5.8)Loss on disposal of other UK businesses – (1.3)Goodwill impairment (note 11) (54.2) –Restructuring costs (28.3) –
Operating exceptional items (82.5) 4.9Exceptional tax (3.6) –
Total exceptional items (86.1) 4.9
The charge for restructuring costs of £28.3m relates to the cost of restructuring the Group’s businesses in response to the downturn in theautomotive industry.The charge primarily represents the cost of reducing employee headcount and closing less profitable sites.
The exceptional tax charge represents a deferred tax charge of £6.0m in respect of the phased abolition of industrial buildings allowancesoffset by a tax credit of £2.4m in respect of the restructuring costs charged in the year.
3 Revenue and expensesa.Revenue
2008 2007An analysis of the Group’s revenue for the year is as follows: £m £m
Sale of goods 5,680.9 5,493.6Rendering of services 578.9 563.2
6,259.8 6,056.8
b.Analysis of net operating expensesNet operating Net operating
expenses expensesbefore Net before Net
exceptional Exceptional operating exceptional Exceptional operatingitems items expenses items items expenses2008 2008 2008 2007 2007 2007£m £m £m £m £m £m
Distribution costs 380.9 5.5 386.4 370.7 – 370.7Administrative expenses 280.6 13.8 294.4 247.9 – 247.9Other operating (income)/expense (1.0) 61.4 60.4 (1.1) (4.9) (6.0)
660.5 80.7 741.2 617.5 (4.9) 612.6
Other operating (income)/expense includes £54.2m related to goodwill impairment in 2008.
c.Profit before tax is stated after the following charges/(credits):2008 2007£m £m
Depreciation of property, plant and equipment:– Owned assets 35.9 26.9– Assets held under finance leases 0.2 0.3– Vehicles subject to residual value commitments 19.6 12.5Amortisation of intangible assets 3.7 6.5Impairment of goodwill 54.2 –Profit on sale of property, plant and equipment (2.6) (9.0)Operating lease rentals 41.7 33.6
The depreciation charge on owned assets includes £8.6m that has been included within exceptional items.
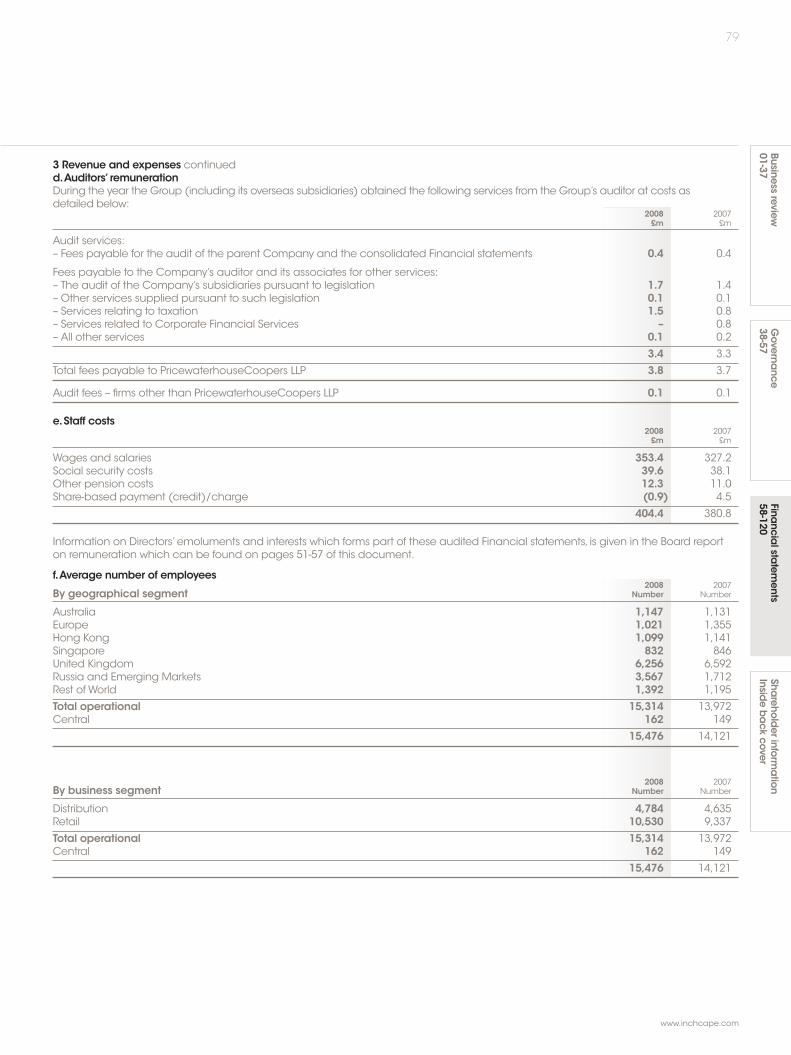
79
www.inchcape.com
Businessreview
01-37Sha
reholderinfo
rmation
Insidebackcover
Financia
lstatem
ents58-120
Governa
nce38-57
3 Revenue and expenses continuedd.Auditors’ remunerationDuring the year the Group (including its overseas subsidiaries) obtained the following services from the Group’s auditor at costs asdetailed below:
2008 2007£m £m
Audit services:– Fees payable for the audit of the parent Company and the consolidated Financial statements 0.4 0.4
Fees payable to the Company’s auditor and its associates for other services:– The audit of the Company’s subsidiaries pursuant to legislation 1.7 1.4– Other services supplied pursuant to such legislation 0.1 0.1– Services relating to taxation 1.5 0.8– Services related to Corporate Financial Services – 0.8– All other services 0.1 0.2
3.4 3.3
Total fees payable to PricewaterhouseCoopers LLP 3.8 3.7
Audit fees – firms other than PricewaterhouseCoopers LLP 0.1 0.1
e.Staff costs2008 2007£m £m
Wages and salaries 353.4 327.2Social security costs 39.6 38.1Other pension costs 12.3 11.0Share-based payment (credit)/charge (0.9) 4.5
404.4 380.8
Information on Directors’ emoluments and interests which forms part of these audited Financial statements, is given in the Board reporton remuneration which can be found on pages 51-57 of this document.
f.Average number of employees2008 2007
By geographical segment Number Number
Australia 1,147 1,131Europe 1,021 1,355Hong Kong 1,099 1,141Singapore 832 846United Kingdom 6,256 6,592Russia and Emerging Markets 3,567 1,712Rest of World 1,392 1,195
Total operational 15,314 13,972Central 162 149
15,476 14,121
2008 2007By business segment Number Number
Distribution 4,784 4,635Retail 10,530 9,337
Total operational 15,314 13,972Central 162 149
15,476 14,121
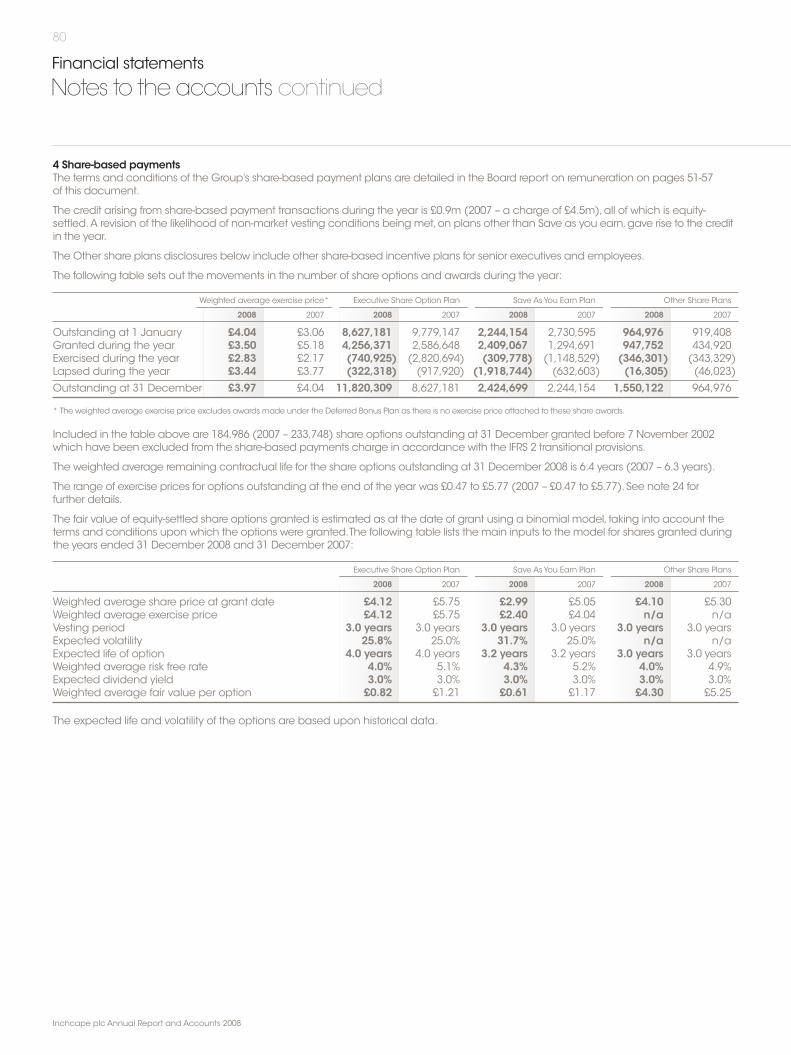
80
Inchcape plc Annual Report and Accounts 2008
Financial statements
Notes to the accounts continued
4 Share-based paymentsThe terms and conditions of the Group’s share-based payment plans are detailed in the Board report on remuneration on pages 51-57of this document.
The credit arising from share-based payment transactions during the year is £0.9m (2007 – a charge of £4.5m), all of which is equity-settled. A revision of the likelihood of non-market vesting conditions being met, on plans other than Save as you earn, gave rise to the creditin the year.
The Other share plans disclosures below include other share-based incentive plans for senior executives and employees.
The following table sets out the movements in the number of share options and awards during the year:
Weighted average exercise price* Executive Share Option Plan Save As You Earn Plan Other Share Plans
2008 2007 2008 2007 2008 2007 2008 2007
Outstanding at 1 January £4.04 £3.06 8,627,181 9,779,147 2,244,154 2,730,595 964,976 919,408Granted during the year £3.50 £5.18 4,256,371 2,586,648 2,409,067 1,294,691 947,752 434,920Exercised during the year £2.83 £2.17 (740,925) (2,820,694) (309,778) (1,148,529) (346,301) (343,329)Lapsed during the year £3.44 £3.77 (322,318) (917,920) (1,918,744) (632,603) (16,305) (46,023)
Outstanding at 31 December £3.97 £4.04 11,820,309 8,627,181 2,424,699 2,244,154 1,550,122 964,976
* The weighted average exercise price excludes awards made under the Deferred Bonus Plan as there is no exercise price attached to these share awards.
Included in the table above are 184,986 (2007 – 233,748) share options outstanding at 31 December granted before 7 November 2002which have been excluded from the share-based payments charge in accordance with the IFRS 2 transitional provisions.
The weighted average remaining contractual life for the share options outstanding at 31 December 2008 is 6.4 years (2007 – 6.3 years).
The range of exercise prices for options outstanding at the end of the year was £0.47 to £5.77 (2007 – £0.47 to £5.77). See note 24 forfurther details.
The fair value of equity-settled share options granted is estimated as at the date of grant using a binomial model, taking into account theterms and conditions upon which the options were granted.The following table lists the main inputs to the model for shares granted duringthe years ended 31 December 2008 and 31 December 2007:
Executive Share Option Plan Save As You Earn Plan Other Share Plans
2008 2007 2008 2007 2008 2007
Weighted average share price at grant date £4.12 £5.75 £2.99 £5.05 £4.10 £5.30Weighted average exercise price £4.12 £5.75 £2.40 £4.04 n/a n/aVesting period 3.0 years 3.0 years 3.0 years 3.0 years 3.0 years 3.0 yearsExpected volatility 25.8% 25.0% 31.7% 25.0% n/a n/aExpected life of option 4.0 years 4.0 years 3.2 years 3.2 years 3.0 years 3.0 yearsWeighted average risk free rate 4.0% 5.1% 4.3% 5.2% 4.0% 4.9%Expected dividend yield 3.0% 3.0% 3.0% 3.0% 3.0% 3.0%Weighted average fair value per option £0.82 £1.21 £0.61 £1.17 £4.30 £5.25
The expected life and volatility of the options are based upon historical data.
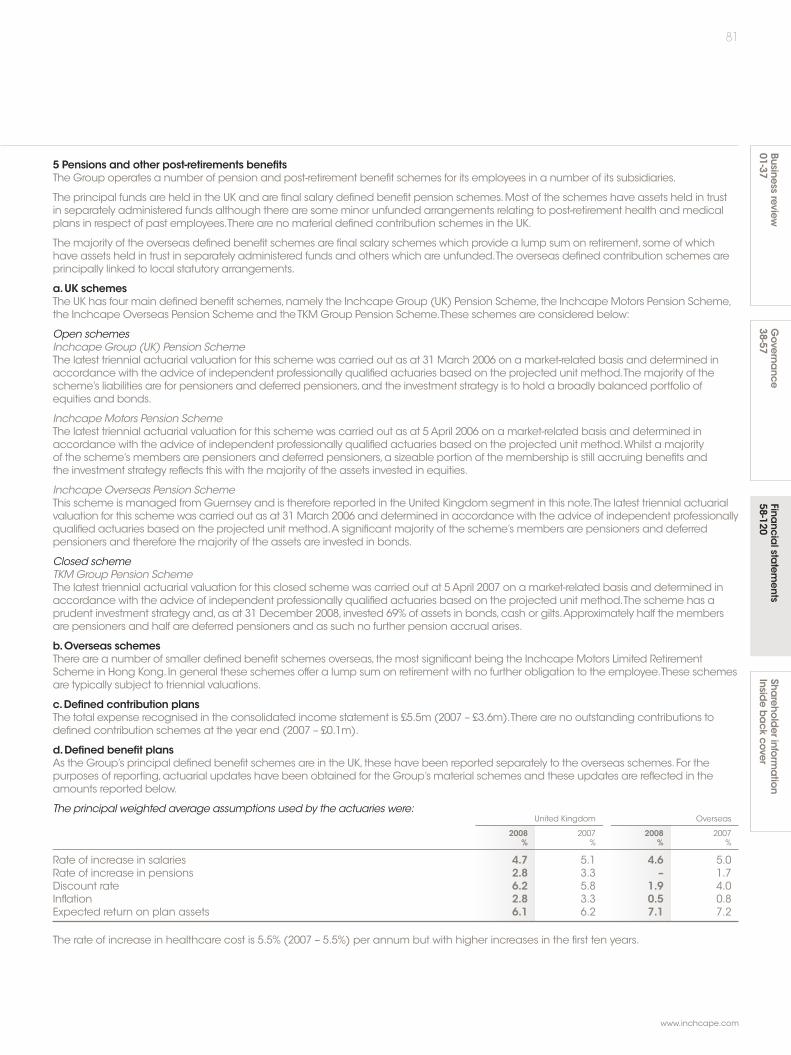
81
www.inchcape.com
Businessreview
01-37Sha
reholderinfo
rmation
Insidebackcover
Financia
lstatem
ents58-120
Governa
nce38-57
5 Pensions and other post-retirements benefitsThe Group operates a number of pension and post-retirement benefit schemes for its employees in a number of its subsidiaries.
The principal funds are held in the UK and are final salary defined benefit pension schemes. Most of the schemes have assets held in trustin separately administered funds although there are some minor unfunded arrangements relating to post-retirement health and medicalplans in respect of past employees.There are no material defined contribution schemes in the UK.
The majority of the overseas defined benefit schemes are final salary schemes which provide a lump sum on retirement, some of whichhave assets held in trust in separately administered funds and others which are unfunded.The overseas defined contribution schemes areprincipally linked to local statutory arrangements.
a.UK schemesThe UK has four main defined benefit schemes, namely the Inchcape Group (UK) Pension Scheme, the Inchcape Motors Pension Scheme,the Inchcape Overseas Pension Scheme and the TKM Group Pension Scheme.These schemes are considered below:
Open schemesInchcape Group (UK) Pension SchemeThe latest triennial actuarial valuation for this scheme was carried out as at 31 March 2006 on a market-related basis and determined inaccordance with the advice of independent professionally qualified actuaries based on the projected unit method.The majority of thescheme’s liabilities are for pensioners and deferred pensioners, and the investment strategy is to hold a broadly balanced portfolio ofequities and bonds.
Inchcape Motors Pension SchemeThe latest triennial actuarial valuation for this scheme was carried out as at 5 April 2006 on a market-related basis and determined inaccordance with the advice of independent professionally qualified actuaries based on the projected unit method.Whilst a majorityof the scheme’s members are pensioners and deferred pensioners, a sizeable portion of the membership is still accruing benefits andthe investment strategy reflects this with the majority of the assets invested in equities.
Inchcape Overseas Pension SchemeThis scheme is managed from Guernsey and is therefore reported in the United Kingdom segment in this note.The latest triennial actuarialvaluation for this scheme was carried out as at 31 March 2006 and determined in accordance with the advice of independent professionallyqualified actuaries based on the projected unit method.A significant majority of the scheme’s members are pensioners and deferredpensioners and therefore the majority of the assets are invested in bonds.
Closed schemeTKMGroup Pension SchemeThe latest triennial actuarial valuation for this closed scheme was carried out at 5 April 2007 on a market-related basis and determined inaccordance with the advice of independent professionally qualified actuaries based on the projected unit method.The scheme has aprudent investment strategy and, as at 31 December 2008, invested 69% of assets in bonds, cash or gilts.Approximately half the membersare pensioners and half are deferred pensioners and as such no further pension accrual arises.
b.Overseas schemesThere are a number of smaller defined benefit schemes overseas, the most significant being the Inchcape Motors Limited RetirementScheme in Hong Kong. In general these schemes offer a lump sum on retirement with no further obligation to the employee.These schemesare typically subject to triennial valuations.
c.Defined contribution plansThe total expense recognised in the consolidated income statement is £5.5m (2007 – £3.6m).There are no outstanding contributions todefined contribution schemes at the year end (2007 – £0.1m).
d.Defined benefit plansAs the Group’s principal defined benefit schemes are in the UK, these have been reported separately to the overseas schemes. For thepurposes of reporting, actuarial updates have been obtained for the Group’s material schemes and these updates are reflected in theamounts reported below.
The principal weighted average assumptions used by the actuaries were:United Kingdom Overseas
2008 2007 2008 2007% % % %
Rate of increase in salaries 4.7 5.1 4.6 5.0Rate of increase in pensions 2.8 3.3 – 1.7Discount rate 6.2 5.8 1.9 4.0Inflation 2.8 3.3 0.5 0.8Expected return on plan assets 6.1 6.2 7.1 7.2
The rate of increase in healthcare cost is 5.5% (2007 – 5.5%) per annum but with higher increases in the first ten years.
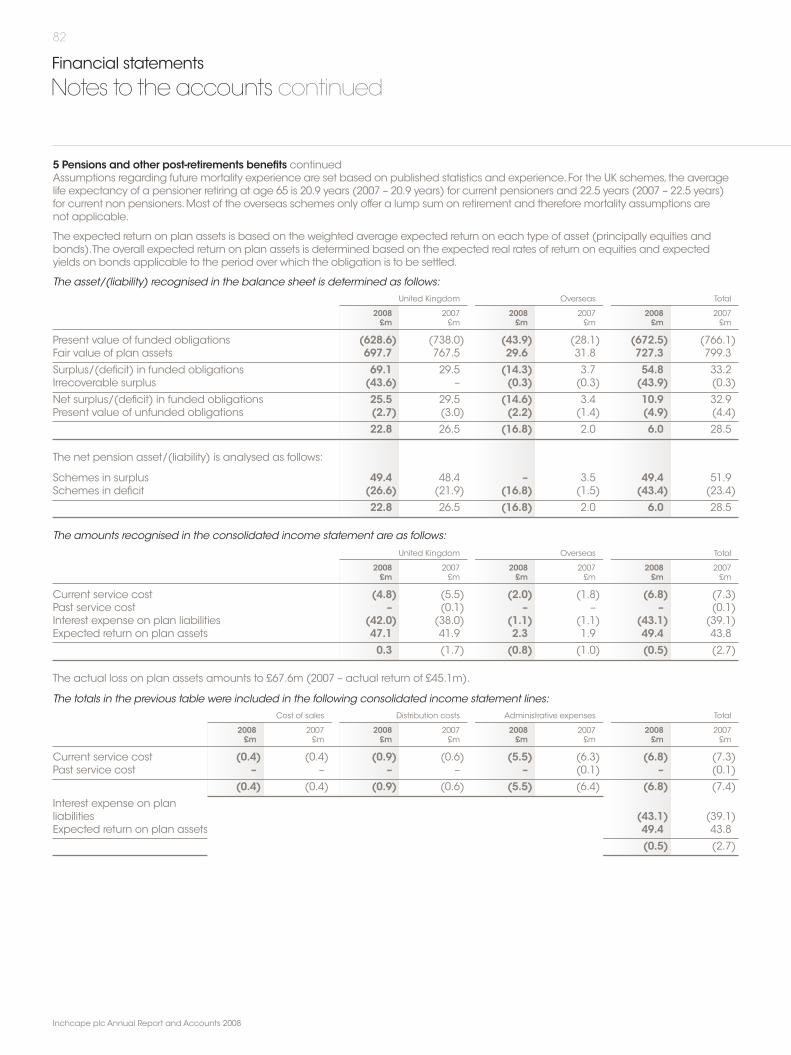
82
Inchcape plc Annual Report and Accounts 2008
Financial statements
Notes to the accounts continued
5 Pensions and other post-retirements benefits continuedAssumptions regarding future mortality experience are set based on published statistics and experience. For the UK schemes, the averagelife expectancy of a pensioner retiring at age 65 is 20.9 years (2007 – 20.9 years) for current pensioners and 22.5 years (2007 – 22.5 years)for current non pensioners. Most of the overseas schemes only offer a lump sum on retirement and therefore mortality assumptions arenot applicable.
The expected return on plan assets is based on the weighted average expected return on each type of asset (principally equities andbonds).The overall expected return on plan assets is determined based on the expected real rates of return on equities and expectedyields on bonds applicable to the period over which the obligation is to be settled.
The asset/(liability) recognised in the balance sheet is determined as follows:United Kingdom Overseas Total
2008 2007 2008 2007 2008 2007£m £m £m £m £m £m
Present value of funded obligations (628.6) (738.0) (43.9) (28.1) (672.5) (766.1)Fair value of plan assets 697.7 767.5 29.6 31.8 727.3 799.3
Surplus/(deficit) in funded obligations 69.1 29.5 (14.3) 3.7 54.8 33.2Irrecoverable surplus (43.6) – (0.3) (0.3) (43.9) (0.3)
Net surplus/(deficit) in funded obligations 25.5 29.5 (14.6) 3.4 10.9 32.9Present value of unfunded obligations (2.7) (3.0) (2.2) (1.4) (4.9) (4.4)
22.8 26.5 (16.8) 2.0 6.0 28.5
The net pension asset/(liability) is analysed as follows:
Schemes in surplus 49.4 48.4 – 3.5 49.4 51.9Schemes in deficit (26.6) (21.9) (16.8) (1.5) (43.4) (23.4)
22.8 26.5 (16.8) 2.0 6.0 28.5
The amounts recognised in the consolidated income statement are as follows:
United Kingdom Overseas Total
2008 2007 2008 2007 2008 2007£m £m £m £m £m £m
Current service cost (4.8) (5.5) (2.0) (1.8) (6.8) (7.3)Past service cost – (0.1) – – – (0.1)Interest expense on plan liabilities (42.0) (38.0) (1.1) (1.1) (43.1) (39.1)Expected return on plan assets 47.1 41.9 2.3 1.9 49.4 43.8
0.3 (1.7) (0.8) (1.0) (0.5) (2.7)
The actual loss on plan assets amounts to £67.6m (2007 – actual return of £45.1m).
The totals in the previous table were included in the following consolidated income statement lines:Cost of sales Distribution costs Administrative expenses Total
2008 2007 2008 2007 2008 2007 2008 2007£m £m £m £m £m £m £m £m
Current service cost (0.4) (0.4) (0.9) (0.6) (5.5) (6.3) (6.8) (7.3)Past service cost – – – – – (0.1) – (0.1)
(0.4) (0.4) (0.9) (0.6) (5.5) (6.4) (6.8) (7.4)
Interest expense on planliabilities (43.1) (39.1)Expected return on plan assets 49.4 43.8
(0.5) (2.7)
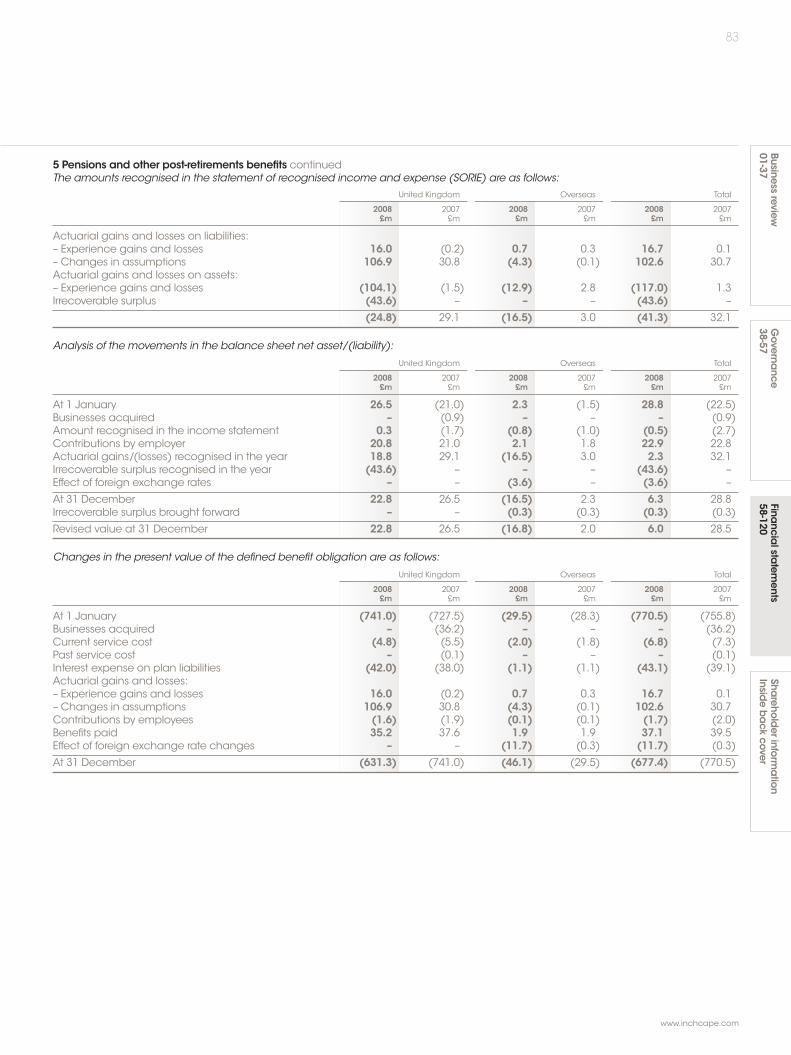
83
www.inchcape.com
Businessreview
01-37Sha
reholderinfo
rmation
Insidebackcover
Financia
lstatem
ents58-120
Governa
nce38-57
5 Pensions and other post-retirements benefits continuedThe amounts recognised in the statement of recognised income and expense (SORIE) are as follows:
United Kingdom Overseas Total
2008 2007 2008 2007 2008 2007£m £m £m £m £m £m
Actuarial gains and losses on liabilities:– Experience gains and losses 16.0 (0.2) 0.7 0.3 16.7 0.1– Changes in assumptions 106.9 30.8 (4.3) (0.1) 102.6 30.7Actuarial gains and losses on assets:– Experience gains and losses (104.1) (1.5) (12.9) 2.8 (117.0) 1.3Irrecoverable surplus (43.6) – – – (43.6) –
(24.8) 29.1 (16.5) 3.0 (41.3) 32.1
Analysis of the movements in the balance sheet net asset/(liability):
United Kingdom Overseas Total
2008 2007 2008 2007 2008 2007£m £m £m £m £m £m
At 1 January 26.5 (21.0) 2.3 (1.5) 28.8 (22.5)Businesses acquired – (0.9) – – – (0.9)Amount recognised in the income statement 0.3 (1.7) (0.8) (1.0) (0.5) (2.7)Contributions by employer 20.8 21.0 2.1 1.8 22.9 22.8Actuarial gains/(losses) recognised in the year 18.8 29.1 (16.5) 3.0 2.3 32.1Irrecoverable surplus recognised in the year (43.6) – – – (43.6) –Effect of foreign exchange rates – – (3.6) – (3.6) –
At 31 December 22.8 26.5 (16.5) 2.3 6.3 28.8Irrecoverable surplus brought forward – – (0.3) (0.3) (0.3) (0.3)
Revised value at 31 December 22.8 26.5 (16.8) 2.0 6.0 28.5
Changes in the present value of the defined benefit obligation are as follows:
United Kingdom Overseas Total
2008 2007 2008 2007 2008 2007£m £m £m £m £m £m
At 1 January (741.0) (727.5) (29.5) (28.3) (770.5) (755.8)Businesses acquired – (36.2) – – – (36.2)Current service cost (4.8) (5.5) (2.0) (1.8) (6.8) (7.3)Past service cost – (0.1) – – – (0.1)Interest expense on plan liabilities (42.0) (38.0) (1.1) (1.1) (43.1) (39.1)Actuarial gains and losses:– Experience gains and losses 16.0 (0.2) 0.7 0.3 16.7 0.1– Changes in assumptions 106.9 30.8 (4.3) (0.1) 102.6 30.7Contributions by employees (1.6) (1.9) (0.1) (0.1) (1.7) (2.0)Benefits paid 35.2 37.6 1.9 1.9 37.1 39.5Effect of foreign exchange rate changes – – (11.7) (0.3) (11.7) (0.3)
At 31 December (631.3) (741.0) (46.1) (29.5) (677.4) (770.5)
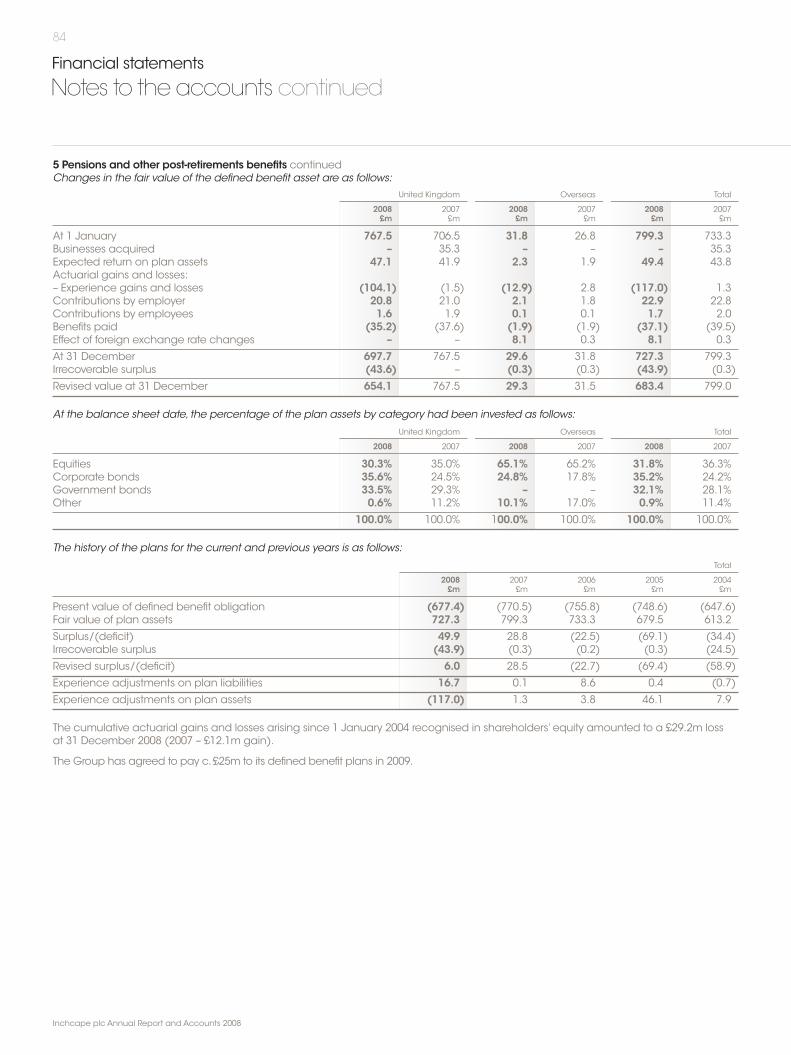
84
Inchcape plc Annual Report and Accounts 2008
Financial statements
Notes to the accounts continued
5 Pensions and other post-retirements benefits continuedChanges in the fair value of the defined benefit asset are as follows:
United Kingdom Overseas Total
2008 2007 2008 2007 2008 2007£m £m £m £m £m £m
At 1 January 767.5 706.5 31.8 26.8 799.3 733.3Businesses acquired – 35.3 – – – 35.3Expected return on plan assets 47.1 41.9 2.3 1.9 49.4 43.8Actuarial gains and losses:– Experience gains and losses (104.1) (1.5) (12.9) 2.8 (117.0) 1.3Contributions by employer 20.8 21.0 2.1 1.8 22.9 22.8Contributions by employees 1.6 1.9 0.1 0.1 1.7 2.0Benefits paid (35.2) (37.6) (1.9) (1.9) (37.1) (39.5)Effect of foreign exchange rate changes – – 8.1 0.3 8.1 0.3
At 31 December 697.7 767.5 29.6 31.8 727.3 799.3Irrecoverable surplus (43.6) – (0.3) (0.3) (43.9) (0.3)
Revised value at 31 December 654.1 767.5 29.3 31.5 683.4 799.0
At the balance sheet date, the percentage of the plan assets by category had been invested as follows:
United Kingdom Overseas Total
2008 2007 2008 2007 2008 2007
Equities 30.3% 35.0% 65.1% 65.2% 31.8% 36.3%Corporate bonds 35.6% 24.5% 24.8% 17.8% 35.2% 24.2%Government bonds 33.5% 29.3% – – 32.1% 28.1%Other 0.6% 11.2% 10.1% 17.0% 0.9% 11.4%
100.0% 100.0% 100.0% 100.0% 100.0% 100.0%
The history of the plans for the current and previous years is as follows:
Total
2008 2007 2006 2005 2004£m £m £m £m £m
Present value of defined benefit obligation (677.4) (770.5) (755.8) (748.6) (647.6)Fair value of plan assets 727.3 799.3 733.3 679.5 613.2
Surplus/(deficit) 49.9 28.8 (22.5) (69.1) (34.4)Irrecoverable surplus (43.9) (0.3) (0.2) (0.3) (24.5)
Revised surplus/(deficit) 6.0 28.5 (22.7) (69.4) (58.9)
Experience adjustments on plan liabilities 16.7 0.1 8.6 0.4 (0.7)
Experience adjustments on plan assets (117.0) 1.3 3.8 46.1 7.9
The cumulative actuarial gains and losses arising since 1 January 2004 recognised in shareholders’ equity amounted to a £29.2m lossat 31 December 2008 (2007 – £12.1m gain).
The Group has agreed to pay c. £25m to its defined benefit plans in 2009.

85
www.inchcape.com
Businessreview
01-37Sha
reholderinfo
rmation
Insidebackcover
Financia
lstatem
ents58-120
Governa
nce38-57
6 Finance income2008 2007£m £m
Bank and other interest receivable 16.9 11.6Expected return on post-retirement plan assets 49.4 43.8Other finance income 2.1 1.9
Total finance income 68.4 57.3
7 Finance costs2008 2007£m £m
Interest payable on bank borrowings 11.7 8.9Interest payable on Private Placement 18.2 11.3Interest payable on revolving credit facility 11.3 2.9Interest payable on other borrowings 3.2 6.4Fair value gain on cross-currency interest rate swaps (147.6) (8.0)Fair value adjustment on Private Placement 144.8 8.3Stock holding interest 21.5 18.2Interest expense on post-retirement plan liabilities 43.1 39.1Other finance costs 17.1 3.6Capitalised borrowing costs (2.9) –
Total finance costs 120.4 90.7
The Group capitalisation rate used for general borrowing costs in accordance with IAS 23 was a weighted average rate for the year of 6.58%.
8 Tax2008 2007£m £m
Current tax:– UK corporation tax 8.0 36.9– Double tax relief (11.6) (30.1)
(3.6) 6.8Overseas tax 56.8 54.6
53.2 61.4Adjustments to prior year liabilities:– UK 1.0 2.1– Overseas (1.0) (0.9)
Current tax 53.2 62.6Deferred tax (note 16) (3.9) (4.7)
Tax before exceptional tax 49.3 57.9
Exceptional tax – current tax (2.4) –Exceptional tax – deferred tax 6.0 –
Exceptional tax (note 2) 3.6 –
Total tax charge 52.9 57.9
The effective tax rate for the year of 25.9% before exceptional items (2007 – 24.6%) is higher than the standard rate of tax of 20.4%(2007 – 21.4%) as explained below.The standard rate comprises the average statutory rates across the Group, weighted in proportionto accounting profits.
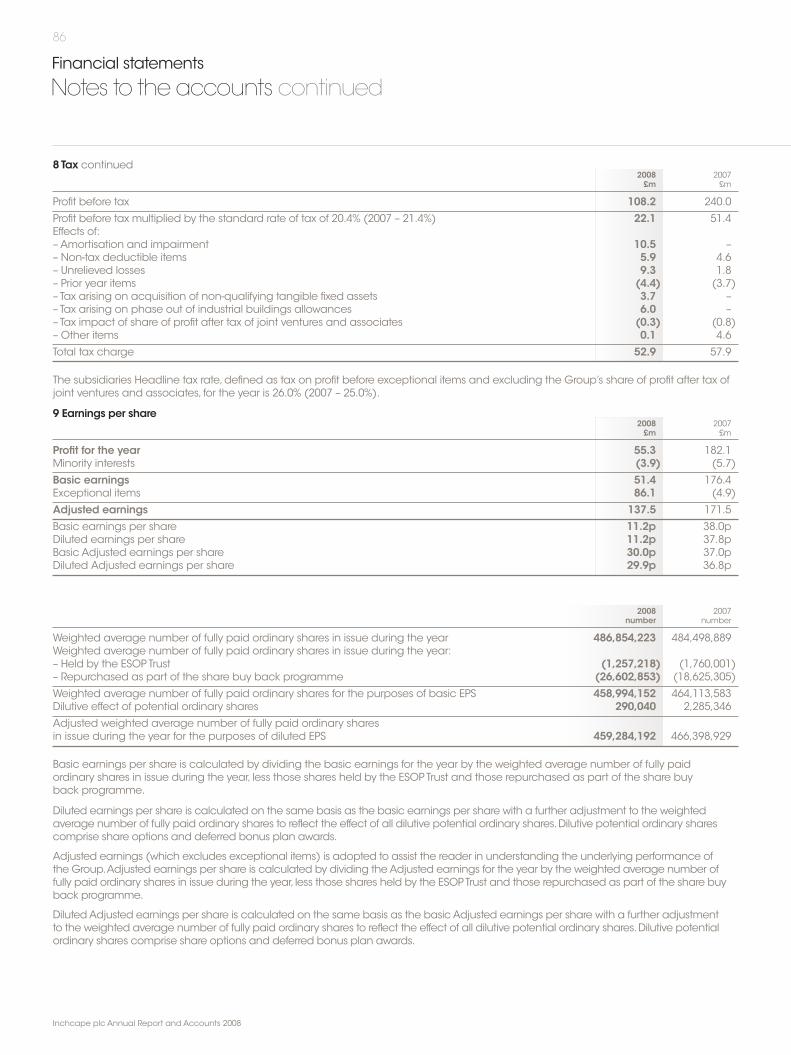
86
Inchcape plc Annual Report and Accounts 2008
Financial statements
Notes to the accounts continued
8 Tax continued2008 2007£m £m
Profit before tax 108.2 240.0
Profit before tax multiplied by the standard rate of tax of 20.4% (2007 – 21.4%) 22.1 51.4Effects of:– Amortisation and impairment 10.5 –– Non-tax deductible items 5.9 4.6– Unrelieved losses 9.3 1.8– Prior year items (4.4) (3.7)– Tax arising on acquisition of non-qualifying tangible fixed assets 3.7 –– Tax arising on phase out of industrial buildings allowances 6.0 –– Tax impact of share of profit after tax of joint ventures and associates (0.3) (0.8)– Other items 0.1 4.6
Total tax charge 52.9 57.9
The subsidiaries Headline tax rate, defined as tax on profit before exceptional items and excluding the Group’s share of profit after tax ofjoint ventures and associates, for the year is 26.0% (2007 – 25.0%).
9 Earnings per share2008 2007£m £m
Profit for the year 55.3 182.1Minority interests (3.9) (5.7)
Basic earnings 51.4 176.4Exceptional items 86.1 (4.9)
Adjusted earnings 137.5 171.5
Basic earnings per share 11.2p 38.0pDiluted earnings per share 11.2p 37.8pBasic Adjusted earnings per share 30.0p 37.0pDiluted Adjusted earnings per share 29.9p 36.8p
2008 2007number number
Weighted average number of fully paid ordinary shares in issue during the year 486,854,223 484,498,889Weighted average number of fully paid ordinary shares in issue during the year:– Held by the ESOP Trust (1,257,218) (1,760,001)– Repurchased as part of the share buy back programme (26,602,853) (18,625,305)
Weighted average number of fully paid ordinary shares for the purposes of basic EPS 458,994,152 464,113,583Dilutive effect of potential ordinary shares 290,040 2,285,346
Adjusted weighted average number of fully paid ordinary sharesin issue during the year for the purposes of diluted EPS 459,284,192 466,398,929
Basic earnings per share is calculated by dividing the basic earnings for the year by the weighted average number of fully paidordinary shares in issue during the year, less those shares held by the ESOP Trust and those repurchased as part of the share buyback programme.
Diluted earnings per share is calculated on the same basis as the basic earnings per share with a further adjustment to the weightedaverage number of fully paid ordinary shares to reflect the effect of all dilutive potential ordinary shares. Dilutive potential ordinary sharescomprise share options and deferred bonus plan awards.
Adjusted earnings (which excludes exceptional items) is adopted to assist the reader in understanding the underlying performance ofthe Group.Adjusted earnings per share is calculated by dividing the Adjusted earnings for the year by the weighted average number offully paid ordinary shares in issue during the year, less those shares held by the ESOP Trust and those repurchased as part of the share buyback programme.
Diluted Adjusted earnings per share is calculated on the same basis as the basic Adjusted earnings per share with a further adjustmentto the weighted average number of fully paid ordinary shares to reflect the effect of all dilutive potential ordinary shares. Dilutive potentialordinary shares comprise share options and deferred bonus plan awards.

87
www.inchcape.com
Businessreview
01-37Sha
reholderinfo
rmation
Insidebackcover
Financia
lstatem
ents58-120
Governa
nce38-57
10 DividendsThe following dividends were paid by the Group:
2008 2007£m £m
Interim dividend for the six months ended 30 June 2008 of 5.46p per share (2007 – 5.25p per share) 25.0 24.5Final dividend for the year ended 31 December 2007 of 10.5p per share (2006 – 10.0p per share) 48.1 46.6
73.1 71.1
There is no proposal to pay a final dividend for the year ending 31 December 2008.
Dividends paid above exclude £4.6m (2007 – £3.0m) payable on treasury shares and shares held by the ESOP Trust.
11 Intangible assetsOther
intangibleGoodwill assets Total
£m £m £m
CostAt 1 January 2007 171.4 30.9 202.3Businesses acquired – 4.1 4.1Additions 256.8 8.1 264.9Disposals (34.1) (6.6) (40.7)Reclassified to disposal group (11.1) – (11.1)Effect of foreign exchange rate changes 7.9 1.4 9.3
At 1 January 2008 390.9 37.9 428.8Businesses acquired – 1.0 1.0Additions 142.0 20.0 162.0Disposals (5.4) (1.3) (6.7)Reclassified from disposal group 5.9 – 5.9Effect of foreign exchange rate changes 41.1 5.2 46.3At 31 December 2008 574.5 62.8 637.3
Amortisation and impairmentAt 1 January 2007 (30.1) (24.3) (54.4)Amortisation charge for the year – (6.5) (6.5)Disposals 28.9 5.1 34.0Effect of foreign exchange rate changes (0.1) (1.3) (1.4)
At 1 January 2008 (1.3) (27.0) (28.3)Amortisation charge for the year – (3.7) (3.7)Impairment charge for the year (54.2) – (54.2)Disposals 0.2 1.4 1.6Effect of foreign exchange rate changes (10.3) (5.0) (15.3)At 31 December 2008 (65.6) (34.3) (99.9)
Net book value at 31 December 2008 508.9 28.5 537.4
Net book value at 31 December 2007 389.6 10.9 400.5
As at 31 December 2008, capitalised borrowing costs of £0.9m were included within other intangible assets, all of which was capitalisedin 2008.
For details of the disposal group see note 19.
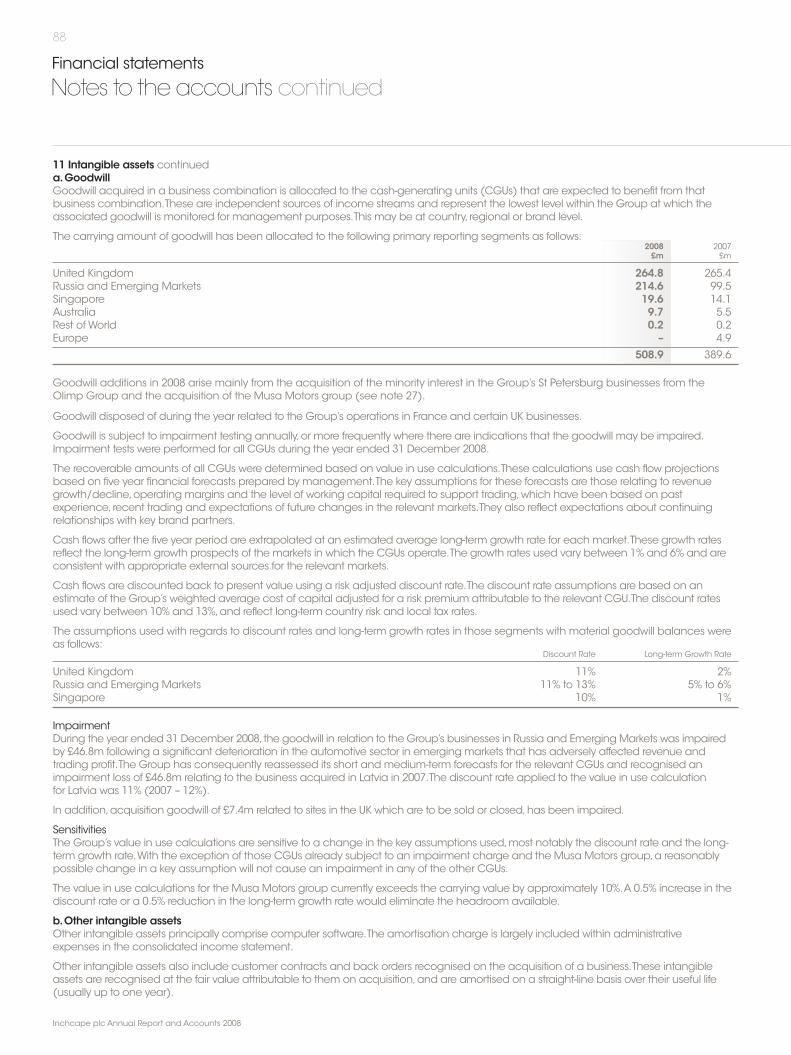
88
Inchcape plc Annual Report and Accounts 2008
Financial statements
Notes to the accounts continued
11 Intangible assets continueda.GoodwillGoodwill acquired in a business combination is allocated to the cash-generating units (CGUs) that are expected to benefit from thatbusiness combination.These are independent sources of income streams and represent the lowest level within the Group at which theassociated goodwill is monitored for management purposes.This may be at country, regional or brand level.
The carrying amount of goodwill has been allocated to the following primary reporting segments as follows:2008 2007£m £m
United Kingdom 264.8 265.4Russia and Emerging Markets 214.6 99.5Singapore 19.6 14.1Australia 9.7 5.5Rest of World 0.2 0.2Europe – 4.9
508.9 389.6
Goodwill additions in 2008 arise mainly from the acquisition of the minority interest in the Group’s St Petersburg businesses from theOlimp Group and the acquisition of the Musa Motors group (see note 27).
Goodwill disposed of during the year related to the Group’s operations in France and certain UK businesses.
Goodwill is subject to impairment testing annually, or more frequently where there are indications that the goodwill may be impaired.Impairment tests were performed for all CGUs during the year ended 31 December 2008.
The recoverable amounts of all CGUs were determined based on value in use calculations.These calculations use cash flow projectionsbased on five year financial forecasts prepared by management.The key assumptions for these forecasts are those relating to revenuegrowth/decline, operating margins and the level of working capital required to support trading, which have been based on pastexperience, recent trading and expectations of future changes in the relevant markets.They also reflect expectations about continuingrelationships with key brand partners.
Cash flows after the five year period are extrapolated at an estimated average long-term growth rate for each market.These growth ratesreflect the long-term growth prospects of the markets in which the CGUs operate.The growth rates used vary between 1% and 6% and areconsistent with appropriate external sources for the relevant markets.
Cash flows are discounted back to present value using a risk adjusted discount rate.The discount rate assumptions are based on anestimate of the Group’s weighted average cost of capital adjusted for a risk premium attributable to the relevant CGU.The discount ratesused vary between 10% and 13%, and reflect long-term country risk and local tax rates.
The assumptions used with regards to discount rates and long-term growth rates in those segments with material goodwill balances wereas follows:
Discount Rate Long-term Growth Rate
United Kingdom 11% 2%Russia and Emerging Markets 11% to 13% 5% to 6%Singapore 10% 1%
ImpairmentDuring the year ended 31 December 2008,the goodwill in relation to the Group’s businesses in Russia and Emerging Markets was impairedby £46.8m following a significant deterioration in the automotive sector in emerging markets that has adversely affected revenue andtrading profit.The Group has consequently reassessed its short and medium-term forecasts for the relevant CGUs and recognised animpairment loss of £46.8m relating to the business acquired in Latvia in 2007.The discount rate applied to the value in use calculationfor Latvia was 11% (2007 – 12%).
In addition, acquisition goodwill of £7.4m related to sites in the UK which are to be sold or closed, has been impaired.
SensitivitiesThe Group’s value in use calculations are sensitive to a change in the key assumptions used, most notably the discount rate and the long-term growth rate.With the exception of those CGUs already subject to an impairment charge and the Musa Motors group, a reasonablypossible change in a key assumption will not cause an impairment in any of the other CGUs.
The value in use calculations for the Musa Motors group currently exceeds the carrying value by approximately 10%.A 0.5% increase in thediscount rate or a 0.5% reduction in the long-term growth rate would eliminate the headroom available.
b.Other intangible assetsOther intangible assets principally comprise computer software.The amortisation charge is largely included within administrativeexpenses in the consolidated income statement.
Other intangible assets also include customer contracts and back orders recognised on the acquisition of a business.These intangibleassets are recognised at the fair value attributable to them on acquisition, and are amortised on a straight-line basis over their useful life(usually up to one year).
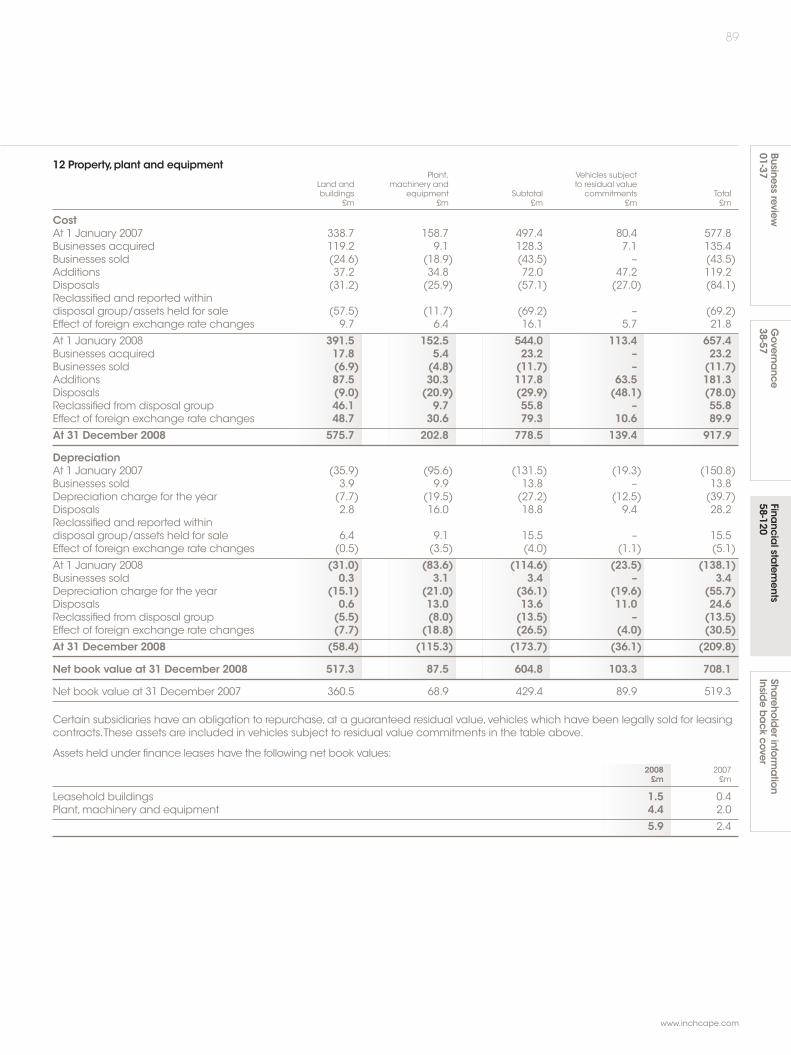
89
www.inchcape.com
Businessreview
01-37Sha
reholderinfo
rmation
Insidebackcover
Financia
lstatem
ents58-120
Governa
nce38-57
12 Property,plant and equipmentPlant, Vehicles subject
Land and machinery and to residual valuebuildings equipment Subtotal commitments Total
£m £m £m £m £m
CostAt 1 January 2007 338.7 158.7 497.4 80.4 577.8Businesses acquired 119.2 9.1 128.3 7.1 135.4Businesses sold (24.6) (18.9) (43.5) – (43.5)Additions 37.2 34.8 72.0 47.2 119.2Disposals (31.2) (25.9) (57.1) (27.0) (84.1)Reclassified and reported withindisposal group/assets held for sale (57.5) (11.7) (69.2) – (69.2)Effect of foreign exchange rate changes 9.7 6.4 16.1 5.7 21.8
At 1 January 2008 391.5 152.5 544.0 113.4 657.4Businesses acquired 17.8 5.4 23.2 – 23.2Businesses sold (6.9) (4.8) (11.7) – (11.7)Additions 87.5 30.3 117.8 63.5 181.3Disposals (9.0) (20.9) (29.9) (48.1) (78.0)Reclassified from disposal group 46.1 9.7 55.8 – 55.8Effect of foreign exchange rate changes 48.7 30.6 79.3 10.6 89.9At 31 December 2008 575.7 202.8 778.5 139.4 917.9
DepreciationAt 1 January 2007 (35.9) (95.6) (131.5) (19.3) (150.8)Businesses sold 3.9 9.9 13.8 – 13.8Depreciation charge for the year (7.7) (19.5) (27.2) (12.5) (39.7)Disposals 2.8 16.0 18.8 9.4 28.2Reclassified and reported withindisposal group/assets held for sale 6.4 9.1 15.5 – 15.5Effect of foreign exchange rate changes (0.5) (3.5) (4.0) (1.1) (5.1)
At 1 January 2008 (31.0) (83.6) (114.6) (23.5) (138.1)Businesses sold 0.3 3.1 3.4 – 3.4Depreciation charge for the year (15.1) (21.0) (36.1) (19.6) (55.7)Disposals 0.6 13.0 13.6 11.0 24.6Reclassified from disposal group (5.5) (8.0) (13.5) – (13.5)Effect of foreign exchange rate changes (7.7) (18.8) (26.5) (4.0) (30.5)At 31 December 2008 (58.4) (115.3) (173.7) (36.1) (209.8)
Net book value at 31 December 2008 517.3 87.5 604.8 103.3 708.1
Net book value at 31 December 2007 360.5 68.9 429.4 89.9 519.3
Certain subsidiaries have an obligation to repurchase, at a guaranteed residual value, vehicles which have been legally sold for leasingcontracts.These assets are included in vehicles subject to residual value commitments in the table above.
Assets held under finance leases have the following net book values:2008 2007£m £m
Leasehold buildings 1.5 0.4Plant, machinery and equipment 4.4 2.0
5.9 2.4
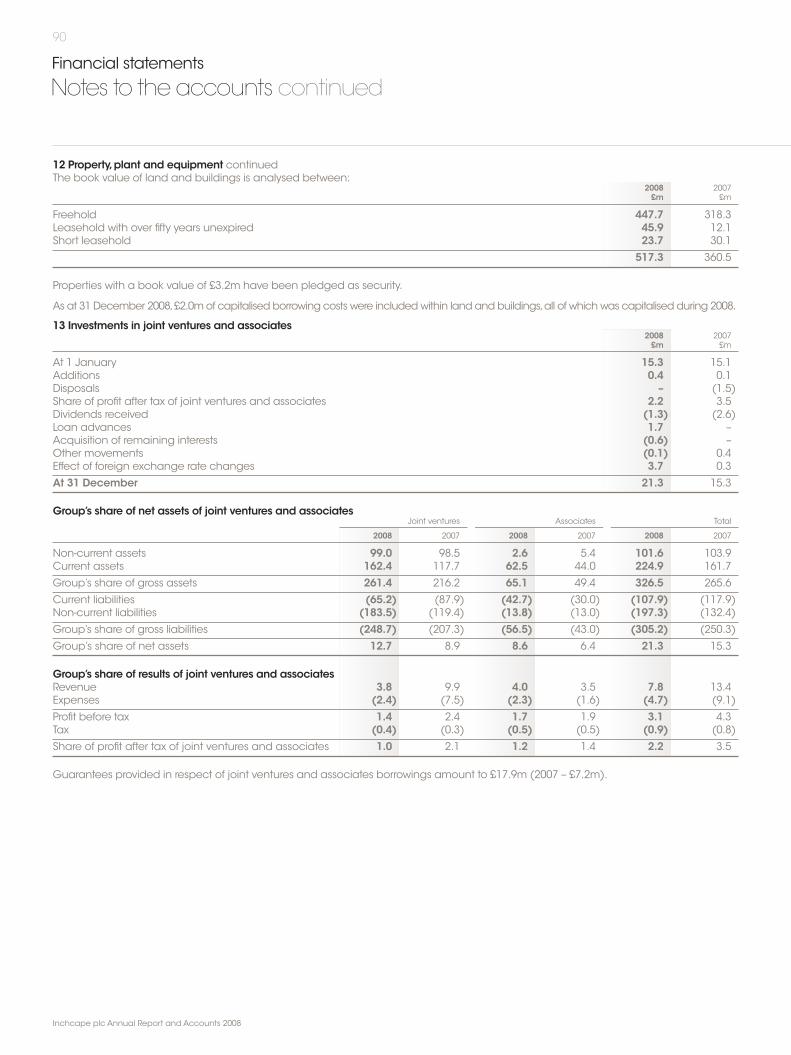
90
Inchcape plc Annual Report and Accounts 2008
Financial statements
Notes to the accounts continued
12 Property,plant and equipment continuedThe book value of land and buildings is analysed between:
2008 2007£m £m
Freehold 447.7 318.3Leasehold with over fifty years unexpired 45.9 12.1Short leasehold 23.7 30.1
517.3 360.5
Properties with a book value of £3.2m have been pledged as security.
As at 31 December 2008,£2.0m of capitalised borrowing costs were included within land and buildings,all of which was capitalised during 2008.
13 Investments in joint ventures and associates2008 2007£m £m
At 1 January 15.3 15.1Additions 0.4 0.1Disposals – (1.5)Share of profit after tax of joint ventures and associates 2.2 3.5Dividends received (1.3) (2.6)Loan advances 1.7 –Acquisition of remaining interests (0.6) –Other movements (0.1) 0.4Effect of foreign exchange rate changes 3.7 0.3
At 31 December 21.3 15.3
Group’s share of net assets of joint ventures and associatesJoint ventures Associates Total
2008 2007 2008 2007 2008 2007
Non-current assets 99.0 98.5 2.6 5.4 101.6 103.9Current assets 162.4 117.7 62.5 44.0 224.9 161.7
Group’s share of gross assets 261.4 216.2 65.1 49.4 326.5 265.6
Current liabilities (65.2) (87.9) (42.7) (30.0) (107.9) (117.9)Non-current liabilities (183.5) (119.4) (13.8) (13.0) (197.3) (132.4)
Group’s share of gross liabilities (248.7) (207.3) (56.5) (43.0) (305.2) (250.3)
Group’s share of net assets 12.7 8.9 8.6 6.4 21.3 15.3
Group’s share of results of joint ventures and associatesRevenue 3.8 9.9 4.0 3.5 7.8 13.4Expenses (2.4) (7.5) (2.3) (1.6) (4.7) (9.1)
Profit before tax 1.4 2.4 1.7 1.9 3.1 4.3Tax (0.4) (0.3) (0.5) (0.5) (0.9) (0.8)
Share of profit after tax of joint ventures and associates 1.0 2.1 1.2 1.4 2.2 3.5
Guarantees provided in respect of joint ventures and associates borrowings amount to £17.9m (2007 – £7.2m).
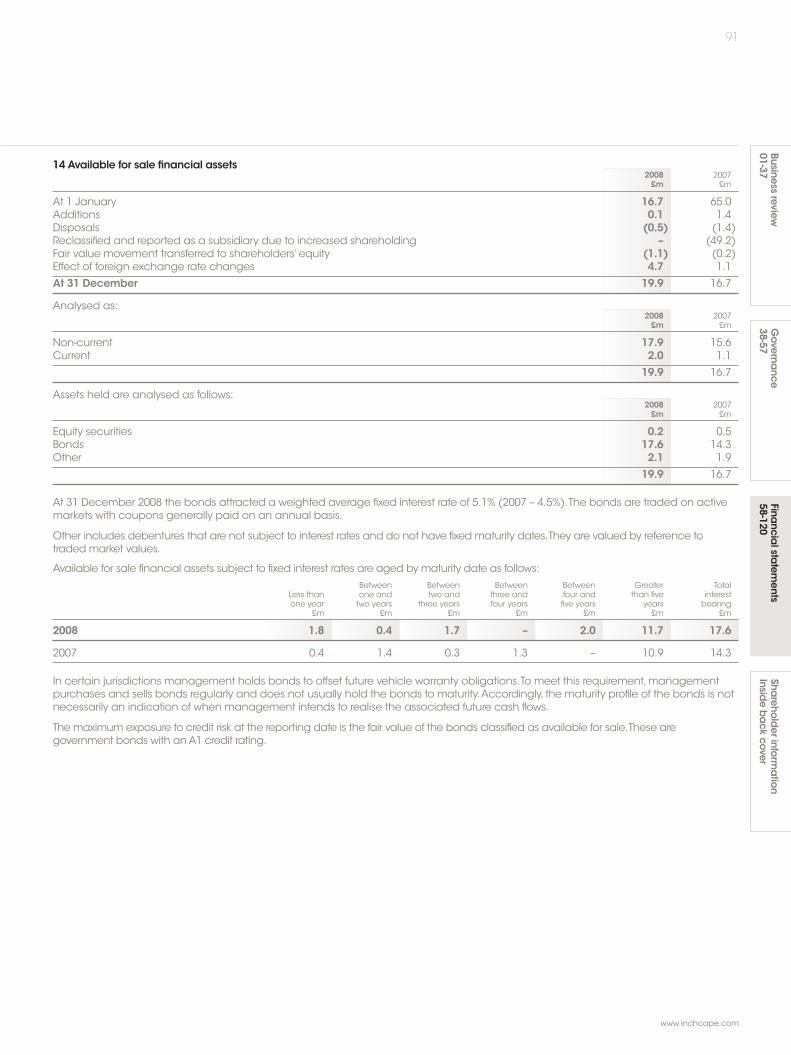
91
www.inchcape.com
Businessreview
01-37Sha
reholderinfo
rmation
Insidebackcover
Financia
lstatem
ents58-120
Governa
nce38-57
14 Available for sale financial assets2008 2007£m £m
At 1 January 16.7 65.0Additions 0.1 1.4Disposals (0.5) (1.4)Reclassified and reported as a subsidiary due to increased shareholding – (49.2)Fair value movement transferred to shareholders’ equity (1.1) (0.2)Effect of foreign exchange rate changes 4.7 1.1
At 31 December 19.9 16.7
Analysed as:2008 2007£m £m
Non-current 17.9 15.6Current 2.0 1.1
19.9 16.7
Assets held are analysed as follows:2008 2007£m £m
Equity securities 0.2 0.5Bonds 17.6 14.3Other 2.1 1.9
19.9 16.7
At 31 December 2008 the bonds attracted a weighted average fixed interest rate of 5.1% (2007 – 4.5%).The bonds are traded on activemarkets with coupons generally paid on an annual basis.
Other includes debentures that are not subject to interest rates and do not have fixed maturity dates.They are valued by reference totraded market values.
Available for sale financial assets subject to fixed interest rates are aged by maturity date as follows:Between Between Between Between Greater Total
Less than one and two and three and four and than five interestone year two years three years four years five years years bearing
£m £m £m £m £m £m £m
2008 1.8 0.4 1.7 – 2.0 11.7 17.6
2007 0.4 1.4 0.3 1.3 – 10.9 14.3
In certain jurisdictions management holds bonds to offset future vehicle warranty obligations.To meet this requirement, managementpurchases and sells bonds regularly and does not usually hold the bonds to maturity.Accordingly, the maturity profile of the bonds is notnecessarily an indication of when management intends to realise the associated future cash flows.
The maximum exposure to credit risk at the reporting date is the fair value of the bonds classified as available for sale.These aregovernment bonds with an A1 credit rating.
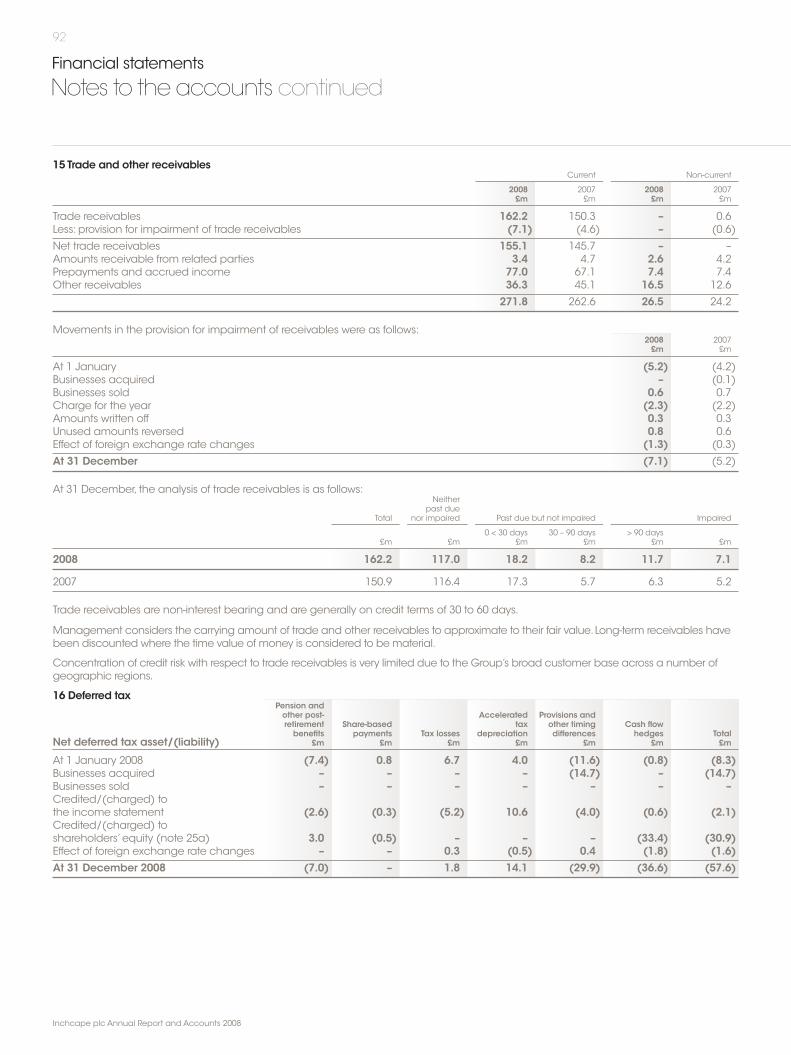
92
Inchcape plc Annual Report and Accounts 2008
Financial statements
Notes to the accounts continued
15 Trade and other receivablesCurrent Non-current
2008 2007 2008 2007£m £m £m £m
Trade receivables 162.2 150.3 – 0.6Less: provision for impairment of trade receivables (7.1) (4.6) – (0.6)
Net trade receivables 155.1 145.7 – –Amounts receivable from related parties 3.4 4.7 2.6 4.2Prepayments and accrued income 77.0 67.1 7.4 7.4Other receivables 36.3 45.1 16.5 12.6
271.8 262.6 26.5 24.2
Movements in the provision for impairment of receivables were as follows:2008 2007£m £m
At 1 January (5.2) (4.2)Businesses acquired – (0.1)Businesses sold 0.6 0.7Charge for the year (2.3) (2.2)Amounts written off 0.3 0.3Unused amounts reversed 0.8 0.6Effect of foreign exchange rate changes (1.3) (0.3)
At 31 December (7.1) (5.2)
At 31 December, the analysis of trade receivables is as follows:Neither
past dueTotal nor impaired Past due but not impaired Impaired
0 < 30 days 30 – 90 days > 90 days£m £m £m £m £m £m
2008 162.2 117.0 18.2 8.2 11.7 7.1
2007 150.9 116.4 17.3 5.7 6.3 5.2
Trade receivables are non-interest bearing and are generally on credit terms of 30 to 60 days.
Management considers the carrying amount of trade and other receivables to approximate to their fair value. Long-term receivables havebeen discounted where the time value of money is considered to be material.
Concentration of credit risk with respect to trade receivables is very limited due to the Group’s broad customer base across a number ofgeographic regions.
16 Deferred taxPension andother post- Accelerated Provisions andretirement Share-based tax other timing Cash flowbenefits payments Tax losses depreciation differences hedges Total
Net deferred tax asset/(liability) £m £m £m £m £m £m £m
At 1 January 2008 (7.4) 0.8 6.7 4.0 (11.6) (0.8) (8.3)Businesses acquired – – – – (14.7) – (14.7)Businesses sold – – – – – – –Credited/(charged) tothe income statement (2.6) (0.3) (5.2) 10.6 (4.0) (0.6) (2.1)Credited/(charged) toshareholders’ equity (note 25a) 3.0 (0.5) – – – (33.4) (30.9)Effect of foreign exchange rate changes – – 0.3 (0.5) 0.4 (1.8) (1.6)At 31 December 2008 (7.0) – 1.8 14.1 (29.9) (36.6) (57.6)
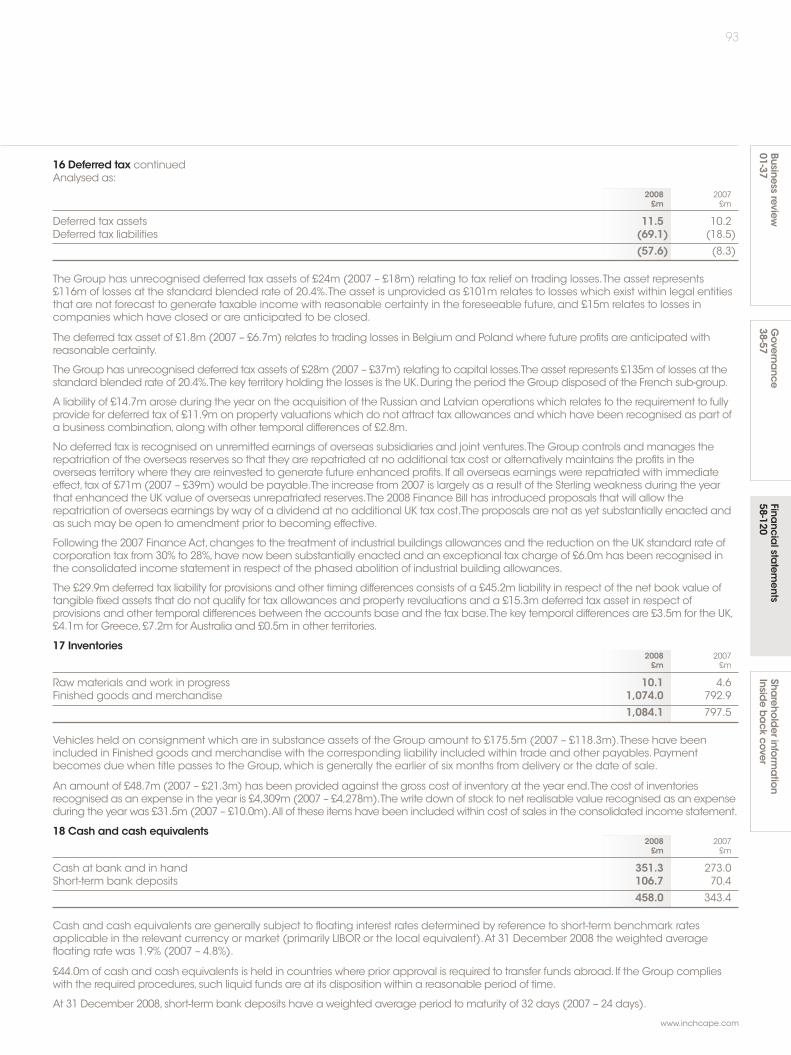
93
www.inchcape.com
Businessreview
01-37Sha
reholderinfo
rmation
Insidebackcover
Financia
lstatem
ents58-120
Governa
nce38-57
16 Deferred tax continuedAnalysed as:
2008 2007£m £m
Deferred tax assets 11.5 10.2Deferred tax liabilities (69.1) (18.5)
(57.6) (8.3)
The Group has unrecognised deferred tax assets of £24m (2007 – £18m) relating to tax relief on trading losses.The asset represents£116m of losses at the standard blended rate of 20.4%.The asset is unprovided as £101m relates to losses which exist within legal entitiesthat are not forecast to generate taxable income with reasonable certainty in the foreseeable future, and £15m relates to losses incompanies which have closed or are anticipated to be closed.
The deferred tax asset of £1.8m (2007 – £6.7m) relates to trading losses in Belgium and Poland where future profits are anticipated withreasonable certainty.
The Group has unrecognised deferred tax assets of £28m (2007 – £37m) relating to capital losses.The asset represents £135m of losses at thestandard blended rate of 20.4%.The key territory holding the losses is the UK.During the period the Group disposed of the French sub-group.
A liability of £14.7m arose during the year on the acquisition of the Russian and Latvian operations which relates to the requirement to fullyprovide for deferred tax of £11.9m on property valuations which do not attract tax allowances and which have been recognised as part ofa business combination, along with other temporal differences of £2.8m.
No deferred tax is recognised on unremitted earnings of overseas subsidiaries and joint ventures.The Group controls and manages therepatriation of the overseas reserves so that they are repatriated at no additional tax cost or alternatively maintains the profits in theoverseas territory where they are reinvested to generate future enhanced profits. If all overseas earnings were repatriated with immediateeffect, tax of £71m (2007 – £39m) would be payable.The increase from 2007 is largely as a result of the Sterling weakness during the yearthat enhanced the UK value of overseas unrepatriated reserves.The 2008 Finance Bill has introduced proposals that will allow therepatriation of overseas earnings by way of a dividend at no additional UK tax cost.The proposals are not as yet substantially enacted andas such may be open to amendment prior to becoming effective.
Following the 2007 Finance Act, changes to the treatment of industrial buildings allowances and the reduction on the UK standard rate ofcorporation tax from 30% to 28%, have now been substantially enacted and an exceptional tax charge of £6.0m has been recognised inthe consolidated income statement in respect of the phased abolition of industrial building allowances.
The £29.9m deferred tax liability for provisions and other timing differences consists of a £45.2m liability in respect of the net book value oftangible fixed assets that do not qualify for tax allowances and property revaluations and a £15.3m deferred tax asset in respect ofprovisions and other temporal differences between the accounts base and the tax base.The key temporal differences are £3.5m for the UK,£4.1m for Greece, £7.2m for Australia and £0.5m in other territories.
17 Inventories2008 2007£m £m
Raw materials and work in progress 10.1 4.6Finished goods and merchandise 1,074.0 792.9
1,084.1 797.5
Vehicles held on consignment which are in substance assets of the Group amount to £175.5m (2007 – £118.3m).These have beenincluded in Finished goods and merchandise with the corresponding liability included within trade and other payables. Paymentbecomes due when title passes to the Group, which is generally the earlier of six months from delivery or the date of sale.
An amount of £48.7m (2007 – £21.3m) has been provided against the gross cost of inventory at the year end.The cost of inventoriesrecognised as an expense in the year is £4,309m (2007 – £4,278m).The write down of stock to net realisable value recognised as an expenseduring the year was £31.5m (2007 – £10.0m).All of these items have been included within cost of sales in the consolidated income statement.
18 Cash and cash equivalents2008 2007£m £m
Cash at bank and in hand 351.3 273.0Short-term bank deposits 106.7 70.4
458.0 343.4
Cash and cash equivalents are generally subject to floating interest rates determined by reference to short-term benchmark ratesapplicable in the relevant currency or market (primarily LIBOR or the local equivalent).At 31 December 2008 the weighted averagefloating rate was 1.9% (2007 – 4.8%).
£44.0m of cash and cash equivalents is held in countries where prior approval is required to transfer funds abroad. If the Group complieswith the required procedures, such liquid funds are at its disposition within a reasonable period of time.
At 31 December 2008, short-term bank deposits have a weighted average period to maturity of 32 days (2007 – 24 days).
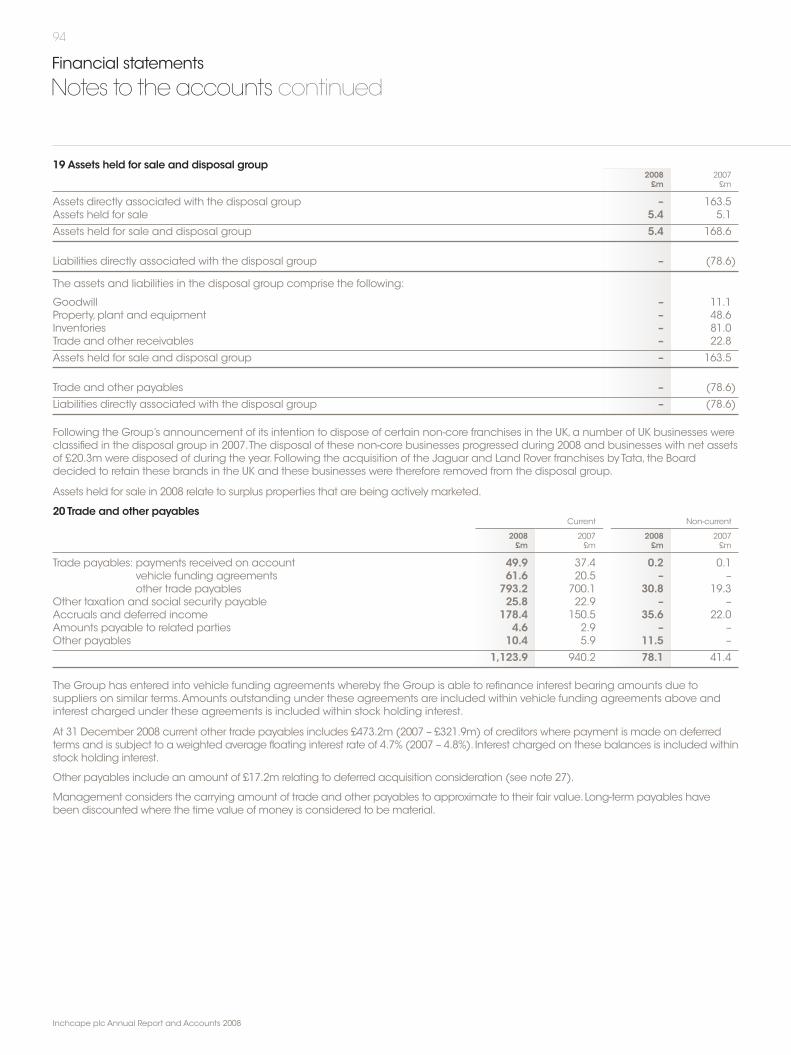
94
Inchcape plc Annual Report and Accounts 2008
Financial statements
Notes to the accounts continued
19 Assets held for sale and disposal group2008 2007£m £m
Assets directly associated with the disposal group – 163.5Assets held for sale 5.4 5.1
Assets held for sale and disposal group 5.4 168.6
Liabilities directly associated with the disposal group – (78.6)
The assets and liabilities in the disposal group comprise the following:
Goodwill – 11.1Property, plant and equipment – 48.6Inventories – 81.0Trade and other receivables – 22.8
Assets held for sale and disposal group – 163.5
Trade and other payables – (78.6)
Liabilities directly associated with the disposal group – (78.6)
Following the Group’s announcement of its intention to dispose of certain non-core franchises in the UK, a number of UK businesses wereclassified in the disposal group in 2007.The disposal of these non-core businesses progressed during 2008 and businesses with net assetsof £20.3m were disposed of during the year. Following the acquisition of the Jaguar and Land Rover franchises by Tata, the Boarddecided to retain these brands in the UK and these businesses were therefore removed from the disposal group.
Assets held for sale in 2008 relate to surplus properties that are being actively marketed.
20 Trade and other payablesCurrent Non-current
2008 2007 2008 2007£m £m £m £m
Trade payables: payments received on account 49.9 37.4 0.2 0.1vehicle funding agreements 61.6 20.5 – –other trade payables 793.2 700.1 30.8 19.3
Other taxation and social security payable 25.8 22.9 – –Accruals and deferred income 178.4 150.5 35.6 22.0Amounts payable to related parties 4.6 2.9 – –Other payables 10.4 5.9 11.5 –
1,123.9 940.2 78.1 41.4
The Group has entered into vehicle funding agreements whereby the Group is able to refinance interest bearing amounts due tosuppliers on similar terms.Amounts outstanding under these agreements are included within vehicle funding agreements above andinterest charged under these agreements is included within stock holding interest.
At 31 December 2008 current other trade payables includes £473.2m (2007 – £321.9m) of creditors where payment is made on deferredterms and is subject to a weighted average floating interest rate of 4.7% (2007 – 4.8%). Interest charged on these balances is included withinstock holding interest.
Other payables include an amount of £17.2m relating to deferred acquisition consideration (see note 27).
Management considers the carrying amount of trade and other payables to approximate to their fair value. Long-term payables havebeen discounted where the time value of money is considered to be material.
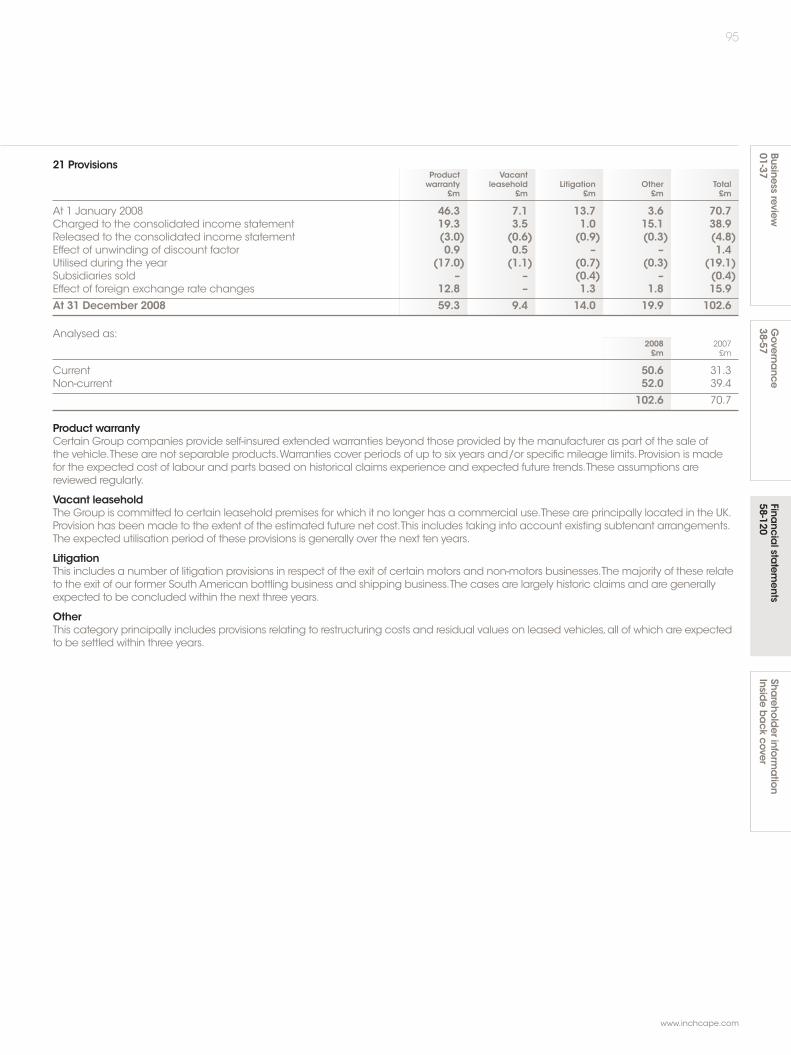
95
www.inchcape.com
Businessreview
01-37Sha
reholderinfo
rmation
Insidebackcover
Financia
lstatem
ents58-120
Governa
nce38-57
21 ProvisionsProduct Vacantwarranty leasehold Litigation Other Total
£m £m £m £m £m
At 1 January 2008 46.3 7.1 13.7 3.6 70.7Charged to the consolidated income statement 19.3 3.5 1.0 15.1 38.9Released to the consolidated income statement (3.0) (0.6) (0.9) (0.3) (4.8)Effect of unwinding of discount factor 0.9 0.5 – – 1.4Utilised during the year (17.0) (1.1) (0.7) (0.3) (19.1)Subsidiaries sold – – (0.4) – (0.4)Effect of foreign exchange rate changes 12.8 – 1.3 1.8 15.9At 31 December 2008 59.3 9.4 14.0 19.9 102.6
Analysed as:2008 2007£m £m
Current 50.6 31.3Non-current 52.0 39.4
102.6 70.7
Product warrantyCertain Group companies provide self-insured extended warranties beyond those provided by the manufacturer as part of the sale ofthe vehicle.These are not separable products.Warranties cover periods of up to six years and/or specific mileage limits. Provision is madefor the expected cost of labour and parts based on historical claims experience and expected future trends.These assumptions arereviewed regularly.
Vacant leaseholdThe Group is committed to certain leasehold premises for which it no longer has a commercial use.These are principally located in the UK.Provision has been made to the extent of the estimated future net cost.This includes taking into account existing subtenant arrangements.The expected utilisation period of these provisions is generally over the next ten years.
LitigationThis includes a number of litigation provisions in respect of the exit of certain motors and non-motors businesses.The majority of these relateto the exit of our former South American bottling business and shipping business.The cases are largely historic claims and are generallyexpected to be concluded within the next three years.
OtherThis category principally includes provisions relating to restructuring costs and residual values on leased vehicles, all of which are expectedto be settled within three years.
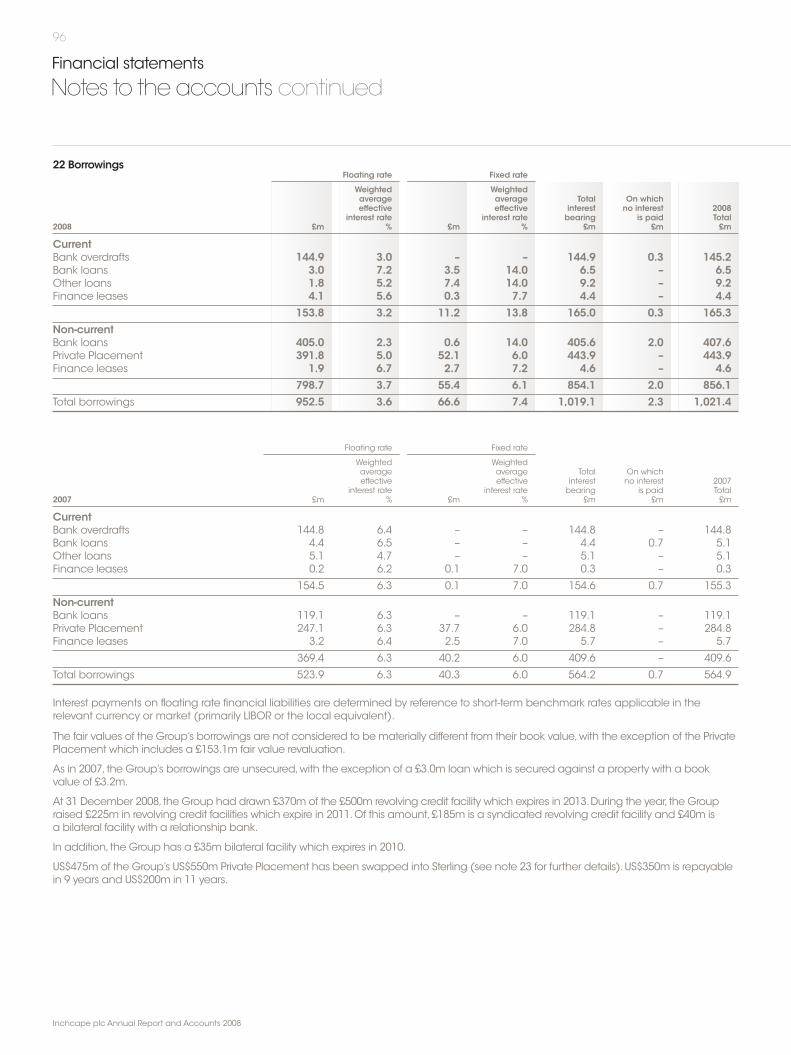
96
Inchcape plc Annual Report and Accounts 2008
Financial statements
Notes to the accounts continued
22 BorrowingsFloating rate Fixed rate
Weighted Weightedaverage average Total On whicheffective effective interest no interest 2008
interest rate interest rate bearing is paid Total2008 £m % £m % £m £m £m
CurrentBank overdrafts 144.9 3.0 – – 144.9 0.3 145.2Bank loans 3.0 7.2 3.5 14.0 6.5 – 6.5Other loans 1.8 5.2 7.4 14.0 9.2 – 9.2Finance leases 4.1 5.6 0.3 7.7 4.4 – 4.4
153.8 3.2 11.2 13.8 165.0 0.3 165.3Non-currentBank loans 405.0 2.3 0.6 14.0 405.6 2.0 407.6Private Placement 391.8 5.0 52.1 6.0 443.9 – 443.9Finance leases 1.9 6.7 2.7 7.2 4.6 – 4.6
798.7 3.7 55.4 6.1 854.1 2.0 856.1Total borrowings 952.5 3.6 66.6 7.4 1,019.1 2.3 1,021.4
Floating rate Fixed rate
Weighted Weightedaverage average Total On whicheffective effective interest no interest 2007
interest rate interest rate bearing is paid Total2007 £m % £m % £m £m £m
CurrentBank overdrafts 144.8 6.4 – – 144.8 – 144.8Bank loans 4.4 6.5 – – 4.4 0.7 5.1Other loans 5.1 4.7 – – 5.1 – 5.1Finance leases 0.2 6.2 0.1 7.0 0.3 – 0.3
154.5 6.3 0.1 7.0 154.6 0.7 155.3
Non-currentBank loans 119.1 6.3 – – 119.1 – 119.1Private Placement 247.1 6.3 37.7 6.0 284.8 – 284.8Finance leases 3.2 6.4 2.5 7.0 5.7 – 5.7
369.4 6.3 40.2 6.0 409.6 – 409.6
Total borrowings 523.9 6.3 40.3 6.0 564.2 0.7 564.9
Interest payments on floating rate financial liabilities are determined by reference to short-term benchmark rates applicable in therelevant currency or market (primarily LIBOR or the local equivalent).
The fair values of the Group’s borrowings are not considered to be materially different from their book value,with the exception of the PrivatePlacement which includes a £153.1m fair value revaluation.
As in 2007, the Group’s borrowings are unsecured,with the exception of a £3.0m loan which is secured against a property with a bookvalue of £3.2m.
At 31 December 2008,the Group had drawn £370m of the £500m revolving credit facility which expires in 2013.During the year, the Groupraised £225m in revolving credit facilities which expire in 2011.Of this amount,£185m is a syndicated revolving credit facility and £40m isa bilateral facility with a relationship bank.
In addition, the Group has a £35m bilateral facility which expires in 2010.
US$475m of the Group’s US$550m Private Placement has been swapped into Sterling (see note 23 for further details).US$350m is repayablein 9 years and US$200m in 11 years.
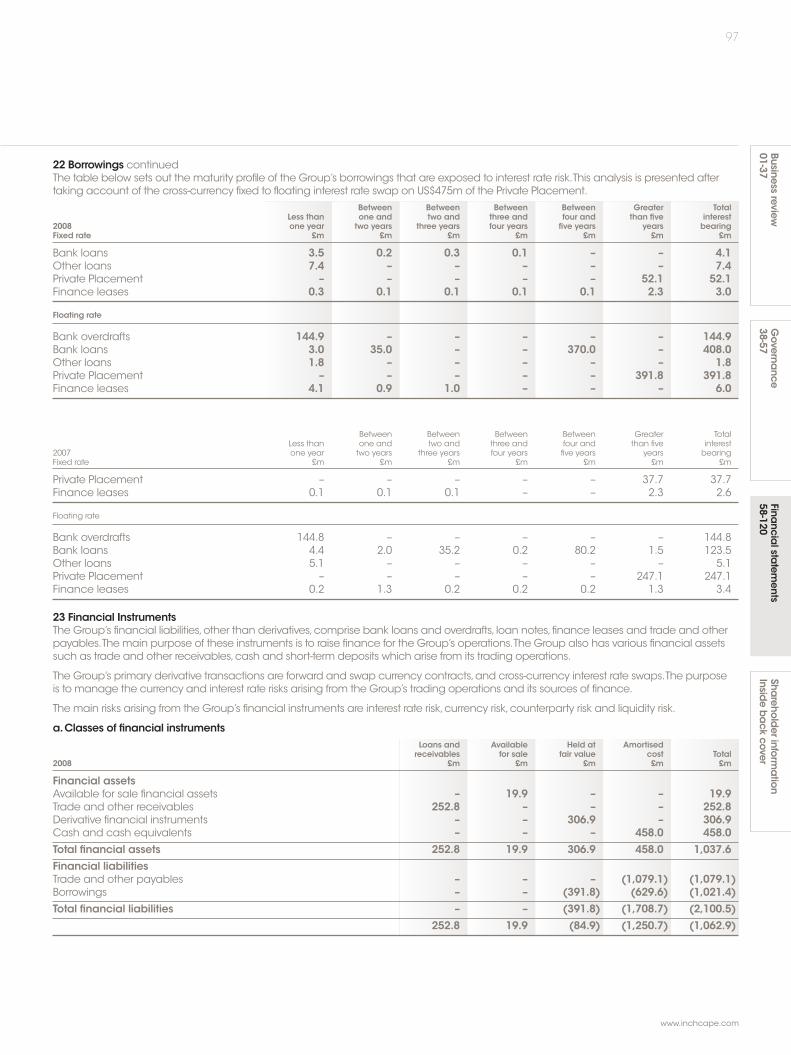
97
www.inchcape.com
Businessreview
01-37Sha
reholderinfo
rmation
Insideback
coverFina
ncialsta
tements
58-120Governa
nce38-57
22 Borrowings continuedThe table below sets out the maturity profile of the Group’s borrowings that are exposed to interest rate risk.This analysis is presented aftertaking account of the cross-currency fixed to floating interest rate swap on US$475m of the Private Placement.
Between Between Between Between Greater TotalLess than one and two and three and four and than five interest
2008 one year two years three years four years five years years bearingFixed rate £m £m £m £m £m £m £m
Bank loans 3.5 0.2 0.3 0.1 – – 4.1Other loans 7.4 – – – – – 7.4Private Placement – – – – – 52.1 52.1Finance leases 0.3 0.1 0.1 0.1 0.1 2.3 3.0
Floating rate
Bank overdrafts 144.9 – – – – – 144.9Bank loans 3.0 35.0 – – 370.0 – 408.0Other loans 1.8 – – – – – 1.8Private Placement – – – – – 391.8 391.8Finance leases 4.1 0.9 1.0 – – – 6.0
Between Between Between Between Greater TotalLess than one and two and three and four and than five interest
2007 one year two years three years four years five years years bearingFixed rate £m £m £m £m £m £m £m
Private Placement – – – – – 37.7 37.7Finance leases 0.1 0.1 0.1 – – 2.3 2.6
Floating rate
Bank overdrafts 144.8 – – – – – 144.8Bank loans 4.4 2.0 35.2 0.2 80.2 1.5 123.5Other loans 5.1 – – – – – 5.1Private Placement – – – – – 247.1 247.1Finance leases 0.2 1.3 0.2 0.2 0.2 1.3 3.4
23 Financial InstrumentsThe Group’s financial liabilities,other than derivatives,comprise bank loans and overdrafts, loan notes,finance leases and trade and otherpayables.The main purpose of these instruments is to raise finance for the Group’s operations.The Group also has various financial assetssuch as trade and other receivables,cash and short-term deposits which arise from its trading operations.
The Group’s primary derivative transactions are forward and swap currency contracts,and cross-currency interest rate swaps.The purposeis to manage the currency and interest rate risks arising from the Group’s trading operations and its sources of finance.
The main risks arising from the Group’s financial instruments are interest rate risk,currency risk,counterparty risk and liquidity risk.
a.Classes of financial instrumentsLoans and Available Held at Amortised
receivables for sale fair value cost Total2008 £m £m £m £m £m
Financial assetsAvailable for sale financial assets – 19.9 – – 19.9Trade and other receivables 252.8 – – – 252.8Derivative financial instruments – – 306.9 – 306.9Cash and cash equivalents – – – 458.0 458.0Total financial assets 252.8 19.9 306.9 458.0 1,037.6Financial liabilitiesTrade and other payables – – – (1,079.1) (1,079.1)Borrowings – – (391.8) (629.6) (1,021.4)Total financial liabilities – – (391.8) (1,708.7) (2,100.5)
252.8 19.9 (84.9) (1,250.7) (1,062.9)

98
Inchcape plc Annual Report and Accounts 2008
Financial statements
Notes to the accounts continued
23 Financial Instruments continuedLoans and Available Held at Amortisedreceivables for sale fair value cost Total
2007 £m £m £m £m £m
Financial assetsAvailable for sale financial assets – 16.7 – – 16.7Trade and other receivables 235.4 – – – 235.4Derivative financial instruments – – 12.9 – 12.9Cash and cash equivalents – – – 343.4 343.4
Total financial assets 235.4 16.7 12.9 343.4 608.4
Financial liabilitiesTrade and other payables – – – (868.6) (868.6)Derivative financial instruments – – (8.3) – (8.3)Borrowings – – (247.1) (317.8) (564.9)
Total financial liabilities – – (255.4) (1,186.4) (1,441.8)
235.4 16.7 (242.5) (843.0) (833.4)
b.Market risk and sensitivity analysisFinancial instruments affected by market risk include borrowings,deposits and derivative financial instruments.The Group is not exposedto commodity price risk.The following analysis, required by IFRS 7, is intended to illustrate the sensitivity to changes in market variables,beingprimarily UK interest rates and theAustralian Dollar to JapaneseYen exchange rate.
The following assumptions were made in calculating the sensitivity analysis:
• Changes in the carrying value of derivative financial instruments designated as cash flow hedges frommovements in interest rates areassumed to be recorded fully in equity.
• Changes in the carrying value of derivative financial instruments designated as fair value hedges frommovements in interest rates havean immaterial effect on the consolidated income statement and equity due to compensating adjustments in the carrying value of debt.
• Changes in the carrying value of financial instruments designated as net investment hedges frommovements in the US Dollar to Sterlingexchange rate are recorded directly in equity.
• Changes in the carrying value of financial instruments not in hedging relationships only affect the consolidated income statement.
• All other changes in the carrying value of derivative financial instruments designated as hedges are fully effective with no impact onthe consolidated income statement.
c.Interest rate risk and sensitivity analysisThe Group’s interest rate policy has the objective of minimising net interest expense,and protecting the Group frommaterial adversemovements in interest rates.Throughout 2008 the Group has borrowed at floating rates only (after taking into account existing interest ratehedging activities),with the exception of US$75m of debt in the UK and £11.5m in Russia.This approach reflects the continuing benigninterest rate environment. If hedging is deemed appropriate by management in the future, the Board has approved the fixing of up to 30%of gross borrowings. Instruments approved for this purpose include interest rate swaps, forward rate agreements and options.The Group’sexposure to the risk of changes in market interest rates arises primarily from the floating rate interest payable on the Group’s 10 and 12 yearloan notes,bank borrowings and supplier related finance.
Interest rate risk tableThe following table demonstrates the sensitivity to a reasonably possible change in interest rates,with all other variables held constant,of the Group’s profit before tax through the impact of floating rate borrowings.
Increase/ Effect on profit(decrease) before tax
in basis points £m
2008Sterling 75 8.2Euro 50 0.2Australian Dollar 100 (0.7)
2007Sterling 75 4.8Euro 50 0.6Australian Dollar 100 –
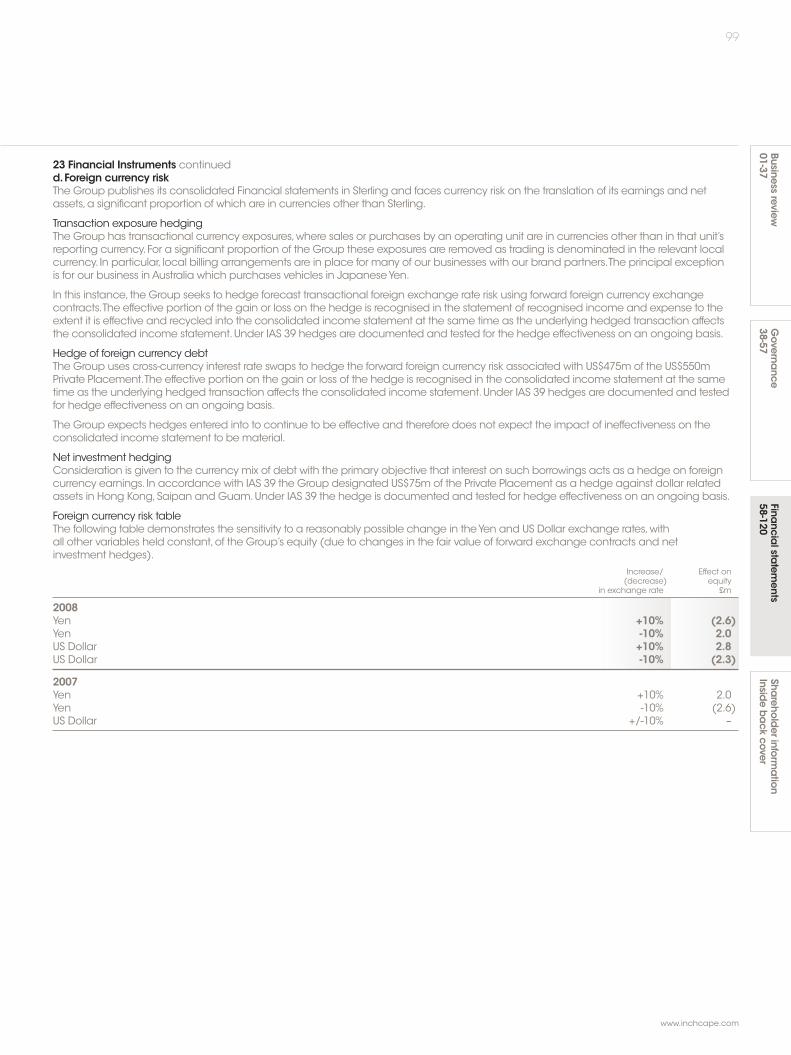
99
www.inchcape.com
Businessreview
01-37Sha
reholderinfo
rmation
Insideback
coverFina
ncialsta
tements
58-120Governa
nce38-57
23 Financial Instruments continuedd.Foreign currency riskThe Group publishes its consolidated Financial statements in Sterling and faces currency risk on the translation of its earnings and netassets,a significant proportion of which are in currencies other than Sterling.
Transaction exposure hedgingThe Group has transactional currency exposures,where sales or purchases by an operating unit are in currencies other than in that unit’sreporting currency.For a significant proportion of the Group these exposures are removed as trading is denominated in the relevant localcurrency. In particular, local billing arrangements are in place for many of our businesses with our brand partners.The principal exceptionis for our business in Australia which purchases vehicles in JapaneseYen.
In this instance, the Group seeks to hedge forecast transactional foreign exchange rate risk using forward foreign currency exchangecontracts.The effective portion of the gain or loss on the hedge is recognised in the statement of recognised income and expense to theextent it is effective and recycled into the consolidated income statement at the same time as the underlying hedged transaction affectsthe consolidated income statement.Under IAS 39 hedges are documented and tested for the hedge effectiveness on an ongoing basis.
Hedge of foreign currency debtThe Group uses cross-currency interest rate swaps to hedge the forward foreign currency risk associated with US$475m of the US$550mPrivate Placement.The effective portion on the gain or loss of the hedge is recognised in the consolidated income statement at the sametime as the underlying hedged transaction affects the consolidated income statement.Under IAS 39 hedges are documented and testedfor hedge effectiveness on an ongoing basis.
The Group expects hedges entered into to continue to be effective and therefore does not expect the impact of ineffectiveness on theconsolidated income statement to be material.
Net investment hedgingConsideration is given to the currency mix of debt with the primary objective that interest on such borrowings acts as a hedge on foreigncurrency earnings. In accordance with IAS 39 the Group designated US$75m of the Private Placement as a hedge against dollar relatedassets in Hong Kong,Saipan and Guam.Under IAS 39 the hedge is documented and tested for hedge effectiveness on an ongoing basis.
Foreign currency risk tableThe following table demonstrates the sensitivity to a reasonably possible change in theYen and US Dollar exchange rates,withall other variables held constant,of the Group’s equity (due to changes in the fair value of forward exchange contracts and netinvestment hedges).
Increase/ Effect on(decrease) equity
in exchange rate £m
2008Yen +10% (2.6)Yen -10% 2.0US Dollar +10% 2.8US Dollar -10% (2.3)
2007Yen +10% 2.0Yen -10% (2.6)US Dollar +/-10% –

100
Inchcape plc Annual Report and Accounts 2008
Financial statements
Notes to the accounts continued
23 Financial Instruments continuede.Credit riskThe amount due from counterparties arising from cash deposits and the use of financial instruments creates credit risk.The Groupmonitorsits credit exposure to its counterparties via their credit ratings (where applicable) and through its policy of limiting its exposure to any oneparty to ensure that they are within Board approved limits and that there are no significant concentrations of credit risk.
Group policy is to deposit cash and use financial instruments with counterparties with a long-term credit rating of A or better,whereavailable.The notional amounts of financial instruments used in interest rate and foreign exchangemanagement do not represent thecredit risk arising through the use of these instruments.The immediate credit risk of these instruments is generally estimated by the fair valueof contracts with a positive value.The maximum exposure to credit risk for receivables and other financial assets is represented by theircarrying amount.
Credit limits and appropriate limits are reviewed regularly.
The table below shows the credit rating and balances held with major counterparties at the balance sheet date.2008 2007
Derivative Derivativeassets Cash Credit assets Cash Credit
Counterparty £m £m Rating £m £m Rating
HSBC Bank plc 122 97 A-1+ 5 19 A-1+Lloyds TSB Bank 89 13 A-1+ 4 – A-1+Royal Bank of Scotland 38 – A-1 – 8 A-1+Westpac Banking Corporation 28 1 A-1+ – – –United Overseas Bank – 23 A-1 – 7 A-1ING Bank NV 15 3 A-1+ – 13 A-1+Commercial Bank of Ethiopia – 15 n/a – 11 n/aSumitomo Mitsui Banking Corporation 14 – A-1 – – –Hong Kong and Shanghai Banking Corp – 11 A-1+ – 21 A-1+Fortis Bank – 10 A-1+ – – –Svenska Handelsbanken – – – – 30 A-1+
No credit limits were exceeded during the reporting period and management does not expect any losses from non-performanceby these counterparties.
At 31 December 2008, total derivative asset balances included £306m which was held with six counterparties and total cash balancesincluded £173m which was held with eight counterparties.Total cash balances of £458m include cash in the Group’s regional poolingarrangements which is offset against borrowings for interest purposes.Balance sheet netting of cash and overdraft balances only occursto the extent that there is the legal ability and intention to settle net.As such,overdrafts are presented in current liabilities to the extent thatthere is no intention to offset with the cash balance.
Concentration of credit risk with respect to trade receivables is very limited due to the Group’s broad customer base.Trade receivablesinclude amounts due from a number of finance houses in respect of vehicles sold to customers on finance arranged through the Group.An independent credit rating agency is used to assess the credit standing of each finance house.Limits for the maximum outstandingwith each finance house are set accordingly.Title to the vehicles sold on finance resides with the Group until cleared funds are receivedfrom the finance house in respect of a given vehicle.
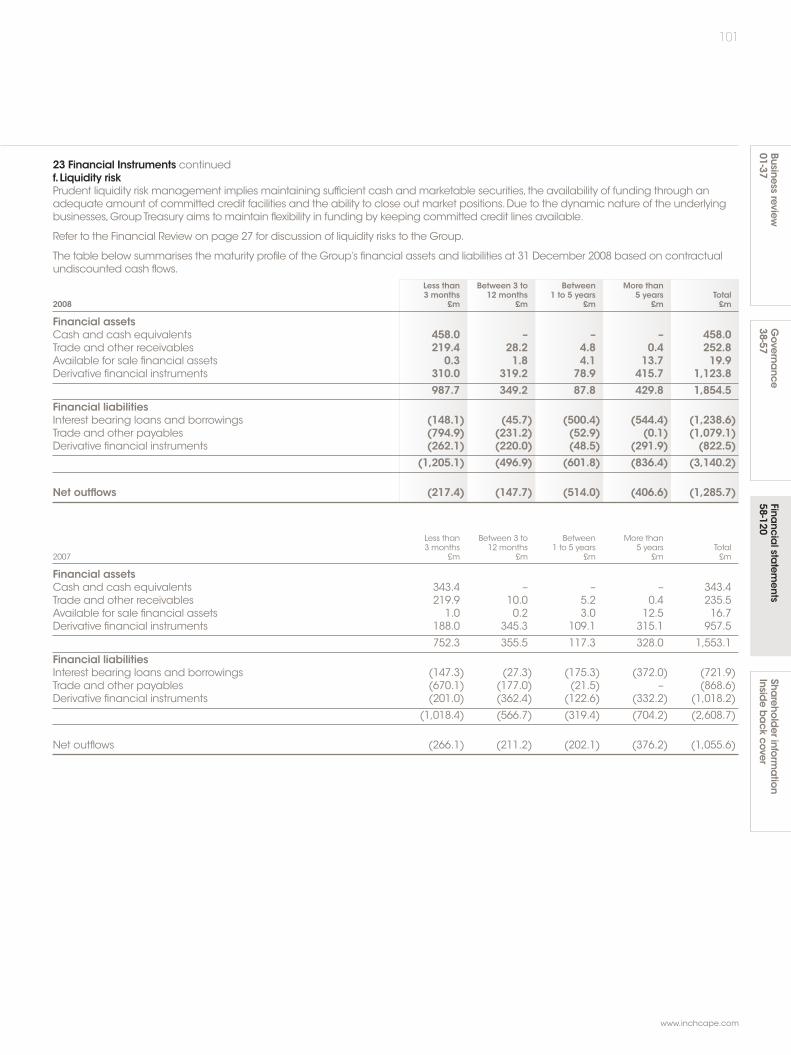
101
www.inchcape.com
Businessreview
01-37Sha
reholderinfo
rmation
Insideback
coverFina
ncialsta
tements
58-120Governa
nce38-57
23 Financial Instruments continuedf.Liquidity riskPrudent liquidity risk management implies maintaining sufficient cash andmarketable securities, the availability of funding through anadequate amount of committed credit facilities and the ability to close out market positions.Due to the dynamic nature of the underlyingbusinesses,GroupTreasury aims to maintain flexibility in funding by keeping committed credit lines available.
Refer to the Financial Review on page 27 for discussion of liquidity risks to the Group.
The table below summarises the maturity profile of the Group’s financial assets and liabilities at 31 December 2008 based on contractualundiscounted cash flows.
Less than Between 3 to Between More than3 months 12 months 1 to 5 years 5 years Total
2008 £m £m £m £m £m
Financial assetsCash and cash equivalents 458.0 – – – 458.0Trade and other receivables 219.4 28.2 4.8 0.4 252.8Available for sale financial assets 0.3 1.8 4.1 13.7 19.9Derivative financial instruments 310.0 319.2 78.9 415.7 1,123.8
987.7 349.2 87.8 429.8 1,854.5Financial liabilitiesInterest bearing loans and borrowings (148.1) (45.7) (500.4) (544.4) (1,238.6)Trade and other payables (794.9) (231.2) (52.9) (0.1) (1,079.1)Derivative financial instruments (262.1) (220.0) (48.5) (291.9) (822.5)
(1,205.1) (496.9) (601.8) (836.4) (3,140.2)
Net outflows (217.4) (147.7) (514.0) (406.6) (1,285.7)
Less than Between 3 to Between More than3 months 12 months 1 to 5 years 5 years Total
2007 £m £m £m £m £m
Financial assetsCash and cash equivalents 343.4 – – – 343.4Trade and other receivables 219.9 10.0 5.2 0.4 235.5Available for sale financial assets 1.0 0.2 3.0 12.5 16.7Derivative financial instruments 188.0 345.3 109.1 315.1 957.5
752.3 355.5 117.3 328.0 1,553.1
Financial liabilitiesInterest bearing loans and borrowings (147.3) (27.3) (175.3) (372.0) (721.9)Trade and other payables (670.1) (177.0) (21.5) – (868.6)Derivative financial instruments (201.0) (362.4) (122.6) (332.2) (1,018.2)
(1,018.4) (566.7) (319.4) (704.2) (2,608.7)
Net outflows (266.1) (211.2) (202.1) (376.2) (1,055.6)
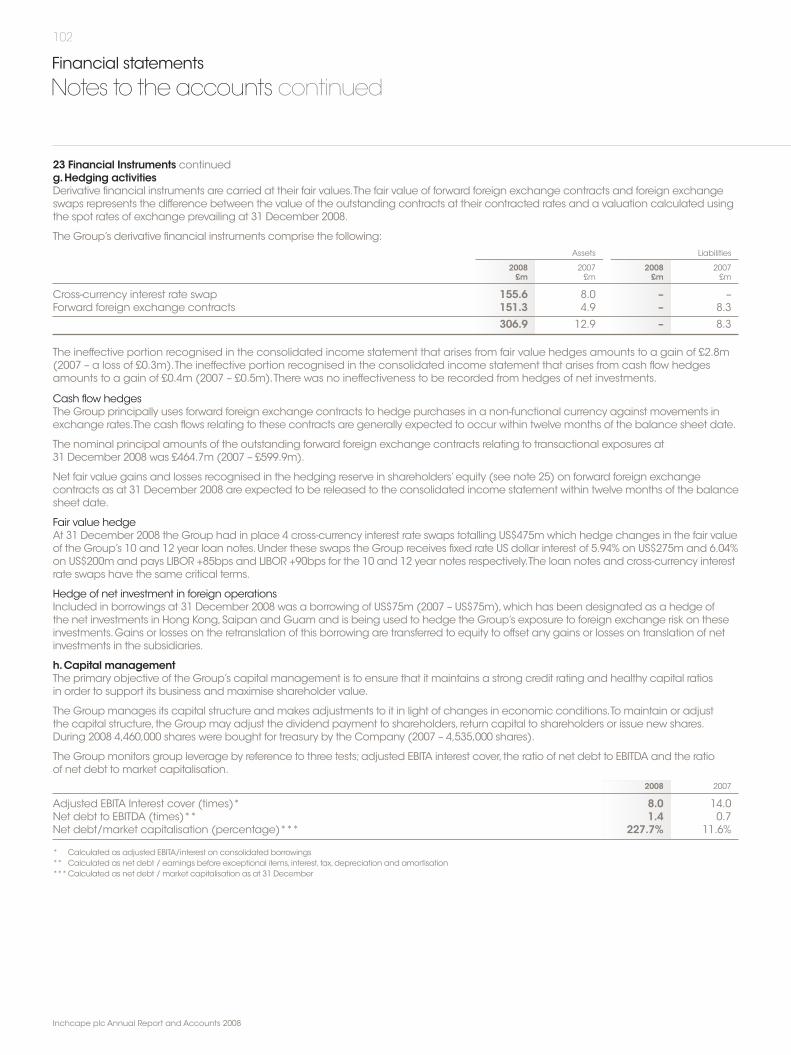
102
Inchcape plc Annual Report and Accounts 2008
Financial statements
Notes to the accounts continued
23 Financial Instruments continuedg.Hedging activitiesDerivative financial instruments are carried at their fair values.The fair value of forward foreign exchange contracts and foreign exchangeswaps represents the difference between the value of the outstanding contracts at their contracted rates and a valuation calculated usingthe spot rates of exchange prevailing at 31 December 2008.
The Group’s derivative financial instruments comprise the following:Assets Liabilities
2008 2007 2008 2007£m £m £m £m
Cross-currency interest rate swap 155.6 8.0 – –Forward foreign exchange contracts 151.3 4.9 – 8.3
306.9 12.9 – 8.3
The ineffective portion recognised in the consolidated income statement that arises from fair value hedges amounts to a gain of £2.8m(2007 – a loss of £0.3m).The ineffective portion recognised in the consolidated income statement that arises from cash flow hedgesamounts to a gain of £0.4m (2007 – £0.5m).There was no ineffectiveness to be recorded from hedges of net investments.
Cash flow hedgesThe Group principally uses forward foreign exchange contracts to hedge purchases in a non-functional currency against movements inexchange rates.The cash flows relating to these contracts are generally expected to occur within twelve months of the balance sheet date.
The nominal principal amounts of the outstanding forward foreign exchange contracts relating to transactional exposures at31 December 2008 was £464.7m (2007 – £599.9m).
Net fair value gains and losses recognised in the hedging reserve in shareholders’equity (see note 25) on forward foreign exchangecontracts as at 31 December 2008 are expected to be released to the consolidated income statement within twelve months of the balancesheet date.
Fair value hedgeAt 31 December 2008 the Group had in place 4 cross-currency interest rate swaps totalling US$475m which hedge changes in the fair valueof the Group’s 10 and 12 year loan notes.Under these swaps the Group receives fixed rate US dollar interest of 5.94% on US$275m and 6.04%on US$200m and pays LIBOR +85bps and LIBOR +90bps for the 10 and 12 year notes respectively.The loan notes and cross-currency interestrate swaps have the same critical terms.
Hedge of net investment in foreign operationsIncluded in borrowings at 31 December 2008 was a borrowing of US$75m (2007 – US$75m),which has been designated as a hedge ofthe net investments in Hong Kong,Saipan and Guam and is being used to hedge the Group’s exposure to foreign exchange risk on theseinvestments.Gains or losses on the retranslation of this borrowing are transferred to equity to offset any gains or losses on translation of netinvestments in the subsidiaries.
h.Capital managementThe primary objective of the Group’s capital management is to ensure that it maintains a strong credit rating and healthy capital ratiosin order to support its business andmaximise shareholder value.
The Groupmanages its capital structure andmakes adjustments to it in light of changes in economic conditions.To maintain or adjustthe capital structure, the Groupmay adjust the dividend payment to shareholders, return capital to shareholders or issue new shares.During 2008 4,460,000 shares were bought for treasury by the Company (2007 – 4,535,000 shares).
The Groupmonitors group leverage by reference to three tests;adjusted EBITA interest cover, the ratio of net debt to EBITDA and the ratioof net debt to market capitalisation.
2008 2007
Adjusted EBITA Interest cover (times)* 8.0 14.0Net debt to EBITDA (times)** 1.4 0.7Net debt/market capitalisation (percentage)*** 227.7% 11.6%
* Calculated as adjusted EBITA/interest on consolidated borrowings** Calculated as net debt / earnings before exceptional items, interest, tax,depreciation and amortisation***Calculated as net debt / market capitalisation as at 31 December
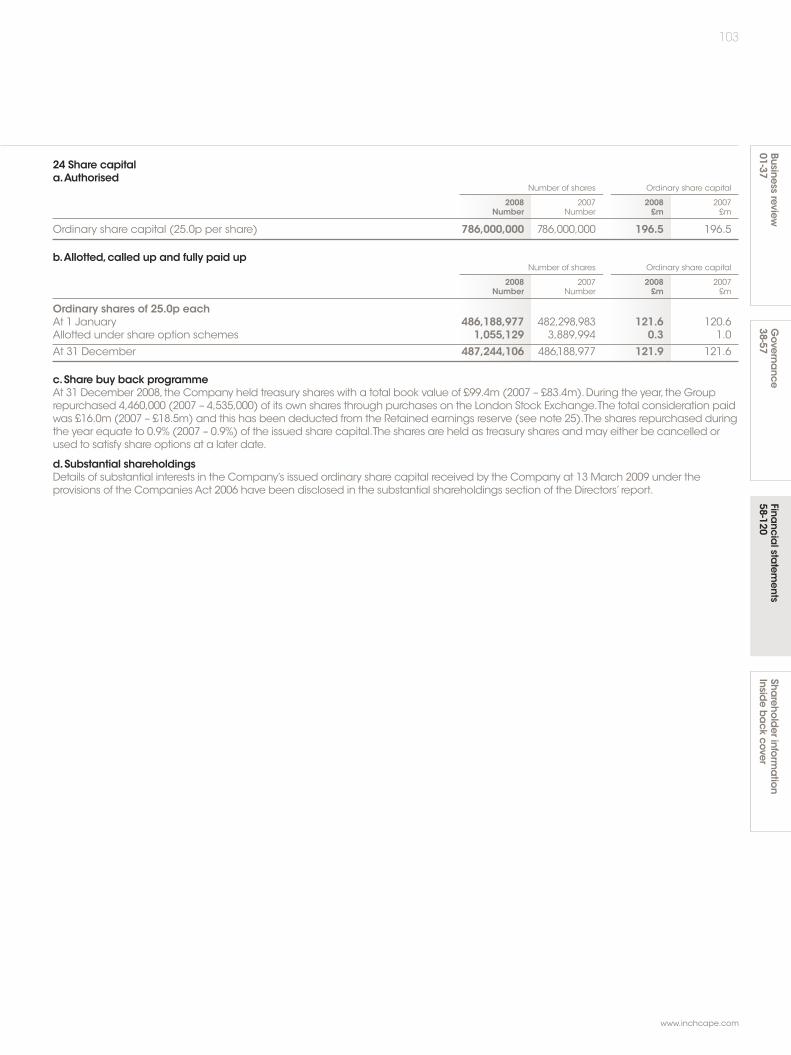
103
www.inchcape.com
Businessreview
01-37Sha
reholderinfo
rmation
Insideback
coverFina
ncialsta
tements
58-120Governa
nce38-57
24 Share capitala.Authorised
Number of shares Ordinary share capital
2008 2007 2008 2007Number Number £m £m
Ordinary share capital (25.0p per share) 786,000,000 786,000,000 196.5 196.5
b.Allotted,called up and fully paid upNumber of shares Ordinary share capital
2008 2007 2008 2007Number Number £m £m
Ordinary shares of 25.0p eachAt 1 January 486,188,977 482,298,983 121.6 120.6Allotted under share option schemes 1,055,129 3,889,994 0.3 1.0
At 31 December 487,244,106 486,188,977 121.9 121.6
c.Share buy back programmeAt 31 December 2008, the Company held treasury shares with a total book value of £99.4m (2007 – £83.4m).During the year, the Grouprepurchased 4,460,000 (2007 – 4,535,000) of its own shares through purchases on the London Stock Exchange.The total consideration paidwas £16.0m (2007 – £18.5m) and this has been deducted from the Retained earnings reserve (see note 25).The shares repurchased duringthe year equate to 0.9% (2007 – 0.9%) of the issued share capital.The shares are held as treasury shares andmay either be cancelled orused to satisfy share options at a later date.
d.Substantial shareholdingsDetails of substantial interests in the Company’s issued ordinary share capital received by the Company at 13 March 2009 under theprovisions of the Companies Act 2006 have been disclosed in the substantial shareholdings section of the Directors’ report.

104
Inchcape plc Annual Report and Accounts 2008
Financial statements
Notes to the accounts continued
24 Share capital continuede.Share optionsAt 31 December 2008,options to acquire ordinary shares of 25.0p each in the Company up to the following numbers under the schemesbelow were outstanding as follows:Number of Number ofordinary shares Exercisable Option ordinary shares Exercisable Optionof 25.0p each until price of 25.0p each until price
The Inchcape 1999 Share Option Plan The Inchcape SAYE Share Option Scheme– approved (Part II – UK) – approved8,748 17 March 2012 114.1p 2,346 1 December 2008 274.1p11,808 19 March 2013 127.0p 165,570 1 May 2009 282.5p29,244 31 August 2013 205.1p 160,986 1 December 2009 345.3p103,124 20 May 2014 262.0p 100,141 1 May 2010 368.0p33,180 29 September 2014 259.1p 123,223 1 December 2010 441.0p163,713 6 March 2015 342.6p 292,346 1 May 2011 383.0p36,282 11 September 2015 358.0p 267,961 1 December 2011 315.0p248,034 29 March 2016 445.3p 1,312,126 1 May 2012 203.0p6,772 21 May 2016 443.0p13,128 10 August 2016 457.0p217,545 12 April 2017 577.0p424,767 3 April 2018 428.0p11,764 31 July 2018 255.0p
– unapproved (Part I – UK)14,616 31 August 2013 205.1p157,680 20 May 2014 262.0p6,750 29 September 2014 259.1p426,720 6 March 2015 342.6p368,712 11 September 2015 358.0p1,127,322 29 March 2016 445.3p340,857 21 May 2016 443.0p29,539 10 August 2016 457.0p1,467,295 12 April 2017 577.0p1,954,698 3 April 2018 428.0p25,125 24 April 2018 398.0p145,098 31 July 2018 255.0p
– unapproved overseas (Part I – Overseas)15,462 7 September 2009 64.6p31,680 9 August 2010 47.3p54,684 21 March 2011 64.0p74,412 17 March 2012 114.1p153,648 19 March 2013 127.0p551,202 20 May 2014 262.0p640,210 6 March 2015 342.6p648,012 29 March 2016 445.3p720,783 12 April 2017 577.0p30,060 18 December 2017 369.0p1,343,905 3 April 2018 428.0p53,458 24 April 2018 398.0p130,272 5 October 2018 198.0p
Included within the Retained earnings reserve are 2,315,380 (2007 – 1,718,329) own ordinary shares held by the ESOP Trust,a generaldiscretionary trust whose beneficiaries include current and former employees of the Group and their dependants.The book value ofthese shares at 31 December 2008 was £9.3m (2007 – £6.8m).The market value of these shares at 31 December 2008 was £0.9m andat 18 March 2009 was £1.2m (31 December 2007 – £6.5m,25 February 2008 – £6.8m).
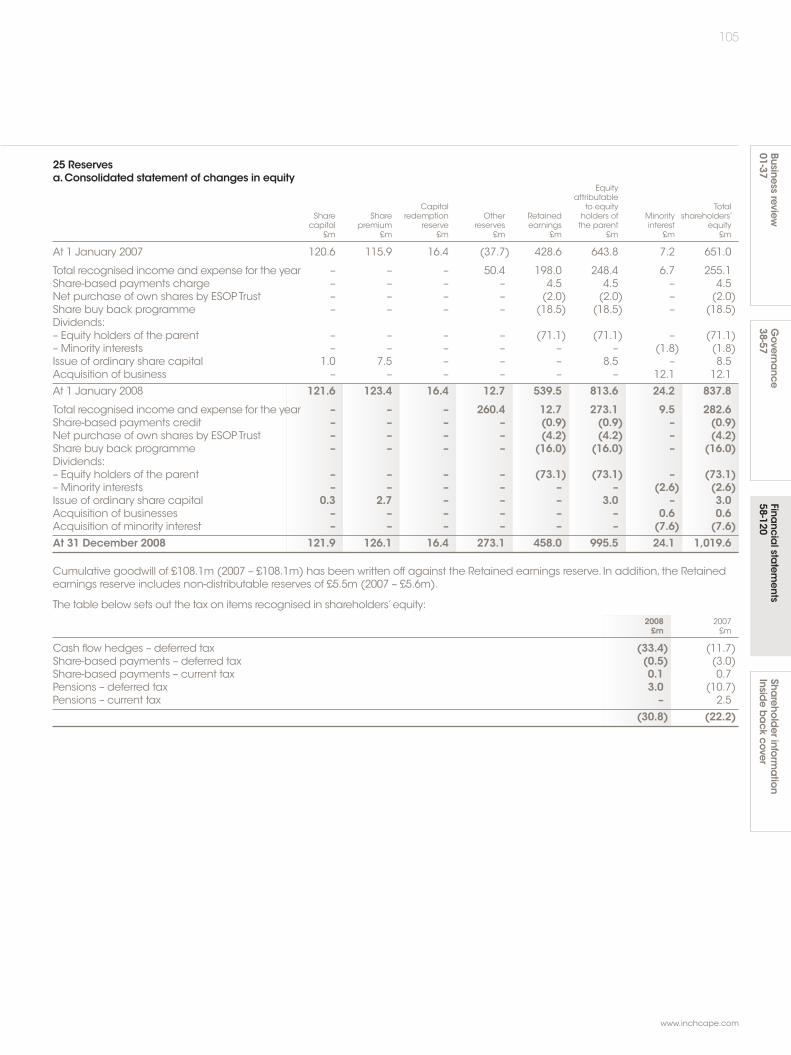
105
www.inchcape.com
Businessreview
01-37Sha
reholderinfo
rmation
Insideback
coverFina
ncialsta
tements
58-120Governa
nce38-57
25 Reservesa.Consolidated statement of changes in equity
Equityattributable
Capital to equity TotalShare Share redemption Other Retained holders of Minority shareholders’capital premium reserve reserves earnings the parent interest equity
£m £m £m £m £m £m £m £m
At 1 January 2007 120.6 115.9 16.4 (37.7) 428.6 643.8 7.2 651.0
Total recognised income and expense for the year – – – 50.4 198.0 248.4 6.7 255.1Share-based payments charge – – – – 4.5 4.5 – 4.5Net purchase of own shares by ESOP Trust – – – – (2.0) (2.0) – (2.0)Share buy back programme – – – – (18.5) (18.5) – (18.5)Dividends:– Equity holders of the parent – – – – (71.1) (71.1) – (71.1)– Minority interests – – – – – – (1.8) (1.8)Issue of ordinary share capital 1.0 7.5 – – – 8.5 – 8.5Acquisition of business – – – – – – 12.1 12.1
At 1 January 2008 121.6 123.4 16.4 12.7 539.5 813.6 24.2 837.8
Total recognised income and expense for the year – – – 260.4 12.7 273.1 9.5 282.6Share-based payments credit – – – – (0.9) (0.9) – (0.9)Net purchase of own shares by ESOP Trust – – – – (4.2) (4.2) – (4.2)Share buy back programme – – – – (16.0) (16.0) – (16.0)Dividends:– Equity holders of the parent – – – – (73.1) (73.1) – (73.1)– Minority interests – – – – – – (2.6) (2.6)Issue of ordinary share capital 0.3 2.7 – – – 3.0 – 3.0Acquisition of businesses – – – – – – 0.6 0.6Acquisition of minority interest – – – – – – (7.6) (7.6)At 31 December 2008 121.9 126.1 16.4 273.1 458.0 995.5 24.1 1,019.6
Cumulative goodwill of £108.1m (2007 – £108.1m) has been written off against the Retained earnings reserve. In addition, the Retainedearnings reserve includes non-distributable reserves of £5.5m (2007 – £5.6m).
The table below sets out the tax on items recognised in shareholders’equity:2008 2007£m £m
Cash flow hedges – deferred tax (33.4) (11.7)Share-based payments – deferred tax (0.5) (3.0)Share-based payments – current tax 0.1 0.7Pensions – deferred tax 3.0 (10.7)Pensions – current tax – 2.5
(30.8) (22.2)
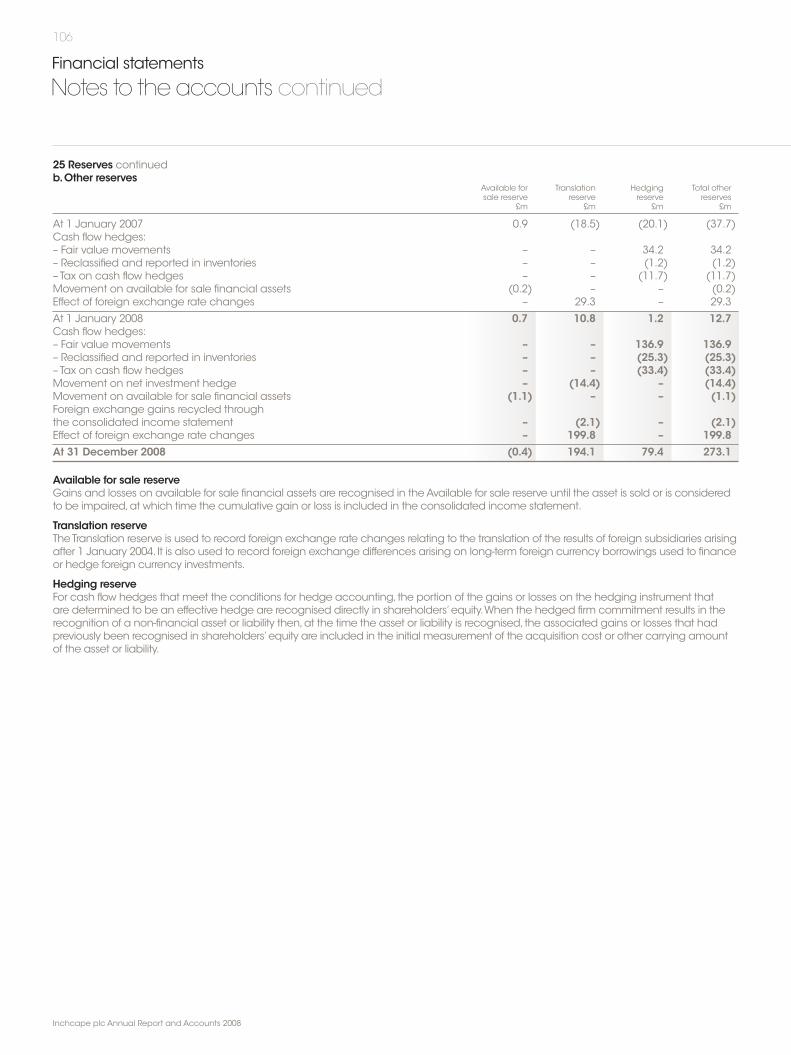
106
Inchcape plc Annual Report and Accounts 2008
Financial statements
Notes to the accounts continued
25 Reserves continuedb.Other reserves
Available for Translation Hedging Total othersale reserve reserve reserve reserves
£m £m £m £m
At 1 January 2007 0.9 (18.5) (20.1) (37.7)Cash flow hedges:– Fair value movements – – 34.2 34.2– Reclassified and reported in inventories – – (1.2) (1.2)– Tax on cash flow hedges – – (11.7) (11.7)Movement on available for sale financial assets (0.2) – – (0.2)Effect of foreign exchange rate changes – 29.3 – 29.3
At 1 January 2008 0.7 10.8 1.2 12.7Cash flow hedges:– Fair value movements – – 136.9 136.9– Reclassified and reported in inventories – – (25.3) (25.3)– Tax on cash flow hedges – – (33.4) (33.4)Movement on net investment hedge – (14.4) – (14.4)Movement on available for sale financial assets (1.1) – – (1.1)Foreign exchange gains recycled throughthe consolidated income statement – (2.1) – (2.1)Effect of foreign exchange rate changes – 199.8 – 199.8At 31 December 2008 (0.4) 194.1 79.4 273.1
Available for sale reserveGains and losses on available for sale financial assets are recognised in theAvailable for sale reserve until the asset is sold or is consideredto be impaired,at which time the cumulative gain or loss is included in the consolidated income statement.
Translation reserveTheTranslation reserve is used to record foreign exchange rate changes relating to the translation of the results of foreign subsidiaries arisingafter 1 January 2004. It is also used to record foreign exchange differences arising on long-term foreign currency borrowings used to financeor hedge foreign currency investments.
Hedging reserveFor cash flow hedges that meet the conditions for hedge accounting, the portion of the gains or losses on the hedging instrument thatare determined to be an effective hedge are recognised directly in shareholders’equity.When the hedged firm commitment results in therecognition of a non-financial asset or liability then,at the time the asset or liability is recognised, the associated gains or losses that hadpreviously been recognised in shareholders’equity are included in the initial measurement of the acquisition cost or other carrying amountof the asset or liability.
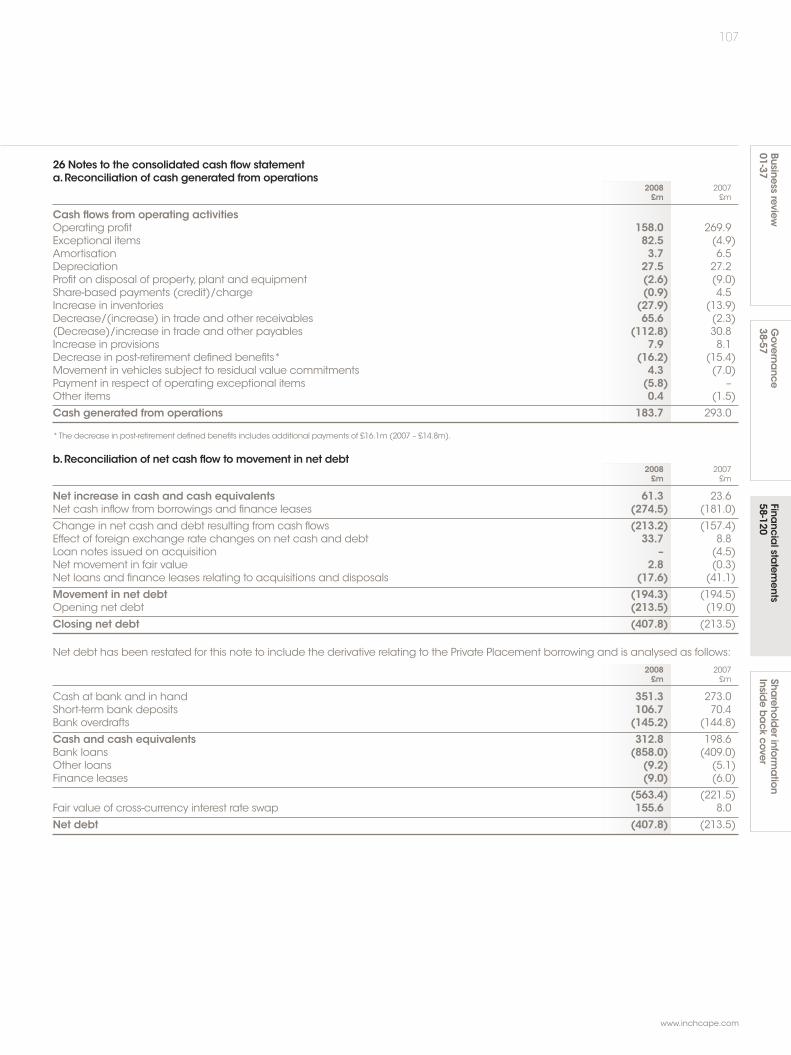
107
www.inchcape.com
Businessreview
01-37Sha
reholderinfo
rmation
Insideback
coverFina
ncialsta
tements
58-120Governa
nce38-57
26 Notes to the consolidated cash flow statementa.Reconciliation of cash generated from operations
2008 2007£m £m
Cash flows from operating activitiesOperating profit 158.0 269.9Exceptional items 82.5 (4.9)Amortisation 3.7 6.5Depreciation 27.5 27.2Profit on disposal of property,plant and equipment (2.6) (9.0)Share-based payments (credit)/charge (0.9) 4.5Increase in inventories (27.9) (13.9)Decrease/(increase) in trade and other receivables 65.6 (2.3)(Decrease)/increase in trade and other payables (112.8) 30.8Increase in provisions 7.9 8.1Decrease in post-retirement defined benefits* (16.2) (15.4)Movement in vehicles subject to residual value commitments 4.3 (7.0)Payment in respect of operating exceptional items (5.8) –Other items 0.4 (1.5)
Cash generated from operations 183.7 293.0
*The decrease in post-retirement defined benefits includes additional payments of £16.1m (2007 – £14.8m).
b.Reconciliation of net cash flow to movement in net debt2008 2007£m £m
Net increase in cash and cash equivalents 61.3 23.6Net cash inflow from borrowings and finance leases (274.5) (181.0)
Change in net cash and debt resulting from cash flows (213.2) (157.4)Effect of foreign exchange rate changes on net cash and debt 33.7 8.8Loan notes issued on acquisition – (4.5)Net movement in fair value 2.8 (0.3)Net loans and finance leases relating to acquisitions and disposals (17.6) (41.1)
Movement in net debt (194.3) (194.5)Opening net debt (213.5) (19.0)
Closing net debt (407.8) (213.5)
Net debt has been restated for this note to include the derivative relating to the Private Placement borrowing and is analysed as follows:
2008 2007£m £m
Cash at bank and in hand 351.3 273.0Short-term bank deposits 106.7 70.4Bank overdrafts (145.2) (144.8)
Cash and cash equivalents 312.8 198.6Bank loans (858.0) (409.0)Other loans (9.2) (5.1)Finance leases (9.0) (6.0)
(563.4) (221.5)Fair value of cross-currency interest rate swap 155.6 8.0
Net debt (407.8) (213.5)
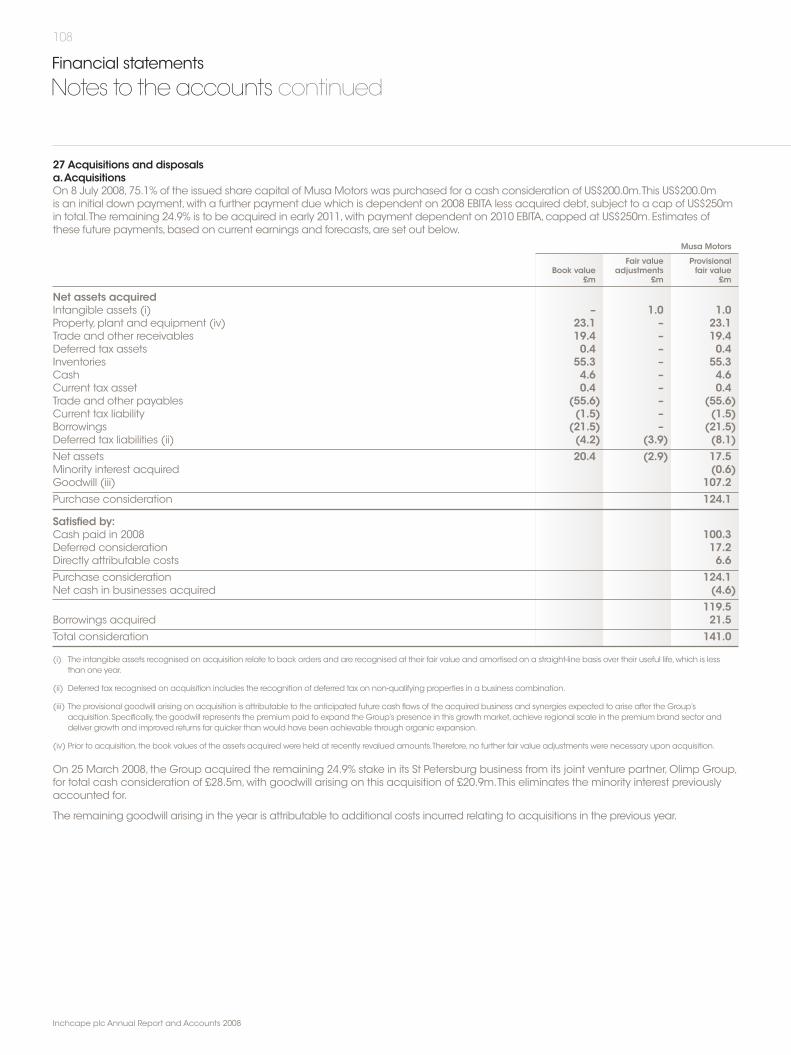
108
Inchcape plc Annual Report and Accounts 2008
Financial statements
Notes to the accounts continued
27 Acquisitions and disposalsa.AcquisitionsOn 8 July 2008,75.1% of the issued share capital of Musa Motors was purchased for a cash consideration of US$200.0m.This US$200.0mis an initial down payment,with a further payment due which is dependent on 2008 EBITA less acquired debt,subject to a cap of US$250min total.The remaining 24.9% is to be acquired in early 2011,with payment dependent on 2010 EBITA,capped at US$250m.Estimates ofthese future payments,based on current earnings and forecasts,are set out below.
Musa Motors
Fair value ProvisionalBook value adjustments fair value
£m £m £m
Net assets acquiredIntangible assets (i) – 1.0 1.0Property,plant and equipment (iv) 23.1 – 23.1Trade and other receivables 19.4 – 19.4Deferred tax assets 0.4 – 0.4Inventories 55.3 – 55.3Cash 4.6 – 4.6Current tax asset 0.4 – 0.4Trade and other payables (55.6) – (55.6)Current tax liability (1.5) – (1.5)Borrowings (21.5) – (21.5)Deferred tax liabilities (ii) (4.2) (3.9) (8.1)Net assets 20.4 (2.9) 17.5Minority interest acquired (0.6)Goodwill (iii) 107.2Purchase consideration 124.1
Satisfied by:Cash paid in 2008 100.3Deferred consideration 17.2Directly attributable costs 6.6Purchase consideration 124.1Net cash in businesses acquired (4.6)
119.5Borrowings acquired 21.5Total consideration 141.0
(i) The intangible assets recognised on acquisition relate to back orders and are recognised at their fair value and amortised on a straight-line basis over their useful life,which is lessthan one year.
(ii) Deferred tax recognised on acquisition includes the recognition of deferred tax on non-qualifying properties in a business combination.
(iii) The provisional goodwill arising on acquisition is attributable to the anticipated future cash flows of the acquired business and synergies expected to arise after the Group’sacquisition.Specifically, the goodwill represents the premium paid to expand the Group’s presence in this growth market,achieve regional scale in the premium brand sector anddeliver growth and improved returns far quicker than would have been achievable through organic expansion.
(iv) Prior to acquisition, the book values of the assets acquired were held at recently revalued amounts.Therefore,no further fair value adjustments were necessary upon acquisition.
On 25 March 2008, the Group acquired the remaining 24.9% stake in its St Petersburg business from its joint venture partner,Olimp Group,for total cash consideration of £28.5m,with goodwill arising on this acquisition of £20.9m.This eliminates the minority interest previouslyaccounted for.
The remaining goodwill arising in the year is attributable to additional costs incurred relating to acquisitions in the previous year.

109
www.inchcape.com
Businessreview
01-37Sha
reholderinfo
rmation
Insideback
coverFina
ncialsta
tements
58-120Governa
nce38-57
27 Acquisitions and disposals continuedb.Pro-forma full year informationIf the acquisition of Musa Motors had occurred on 1 January 2008, the approximate revenue and operating profit before exceptionalitems for the year of the Group would have been £6,690.0m and £259.1m respectively.This information has been estimated based on theunaudited management accounts as of the date of acquisition.The acquired business contributed revenues of £213.6m and operatingprofit before exceptional items of £6.8m to the Group for the period 8 July to 31 December 2008.
c.DisposalsThe Group disposed of a number of dealerships and operations during the year,with net disposal proceeds of £27.3m,and a loss ondisposal of businesses of £1.2m,which has not been disclosed as an exceptional item.These disposals include the disposal of the Group’sbusiness in France for a profit on disposal of £0.4m (after a £2.1m adjustment for historical foreign currency differences recycled to theconsolidated income statement on disposal),satisfied by a pre-completion reduction in capital of £18m and disposal proceeds of £7.6m,and the disposal of various retail outlets in the UK for £18.9m (loss on disposal £2.5m).Additionally,an asset swap in Australia during theperiod gave rise to a net gain of £0.8m,recognised in the consolidated income statement.
28 Guarantees and contingencies2008 2007£m £m
Guarantees,performance bonds and contingent liabilities 17.7 8.1
Guarantees and contingencies largely comprise letters of credit issued on behalf of the Group in the ordinary course of business.£7.9m (2007 – £nil) of these letters of credit resulted due to the acquisition in the year of the remaining interest in the Red SeaAutomotivebusiness. The Group also has, in the ordinary course of business,commitments under foreign exchange instruments relating to thehedging of transactional exposures (see note 23).
29 Commitmentsa.Capital commitmentsContracts placed for future capital expenditure at the balance sheet date but not yet incurred are as follows:
2008 2007£m £m
Property,plant and equipment 7.6 7.9Vehicles subject to residual value commitments* 108.5 103.7Intangible assets 0.1 –
* Residual value commitments comprise the total repurchase liability on all vehicles sold subject to a residual value commitment,of which £65.4m (2007 – £57.0m) has been includedwithin trade and other payables.These commitments are largely expected to be settled within the next 12 months,with a minority to be settled within three years.
b.Lease commitmentsOperating lease commitments – Group as lesseeThe Group has entered into non-cancellable operating leases for various offices,warehouses and dealerships.These leases have varyingterms,escalation clauses and renewal rights.
Future minimum lease payments under non-cancellable operating leases are as follows:2008 2007£m £m
Within one year 44.8 35.6In two to five years 110.4 87.8After five years 142.7 128.4
297.9 251.8
Operating lease commitments – Group as lessorThe Group has entered into non-cancellable operating leases on a number of its vehicles.These leases have varying terms,escalationclauses and renewal rights.
Future minimum lease payments receivable under non-cancellable operating leases are as follows:2008 2007£m £m
Within one year 5.1 3.3In two to five years 9.5 6.1After five years 8.1 3.4
22.7 12.8
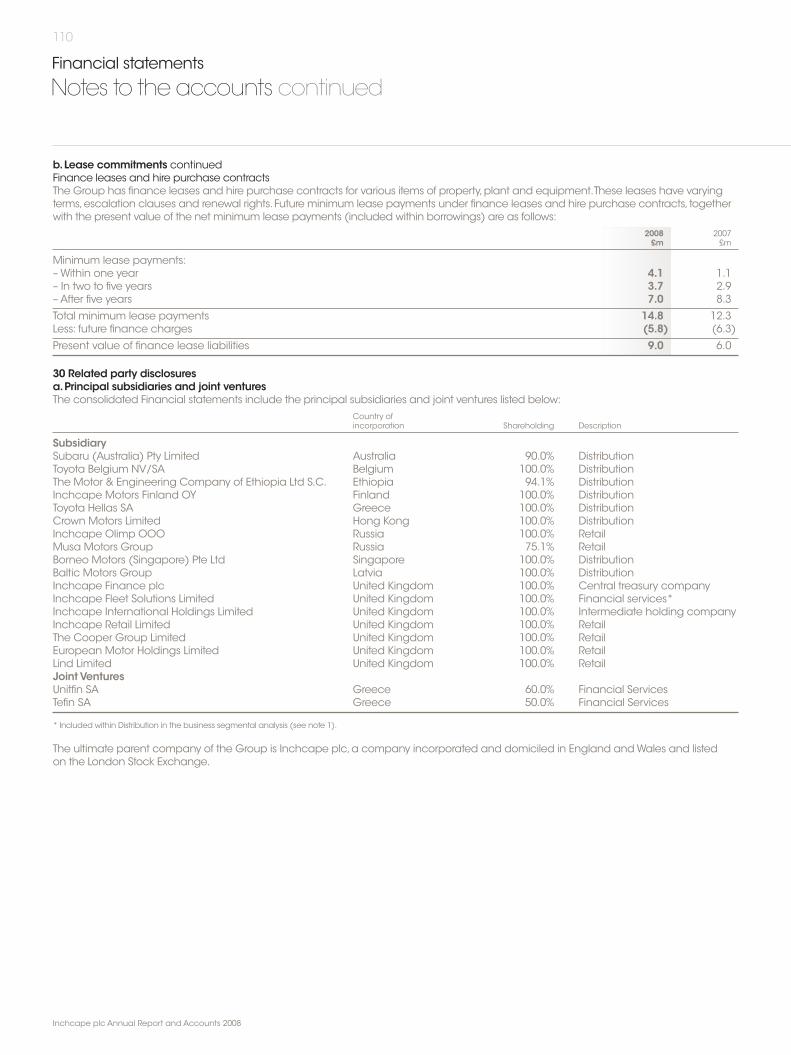
110
Inchcape plc Annual Report and Accounts 2008
Financial statements
Notes to the accounts continued
b.Lease commitments continuedFinance leases and hire purchase contractsThe Group has finance leases and hire purchase contracts for various items of property,plant and equipment.These leases have varyingterms,escalation clauses and renewal rights.Future minimum lease payments under finance leases and hire purchase contracts, togetherwith the present value of the net minimum lease payments (included within borrowings) are as follows:
2008 2007£m £m
Minimum lease payments:– Within one year 4.1 1.1– In two to five years 3.7 2.9– After five years 7.0 8.3
Total minimum lease payments 14.8 12.3Less: future finance charges (5.8) (6.3)
Present value of finance lease liabilities 9.0 6.0
30 Related party disclosuresa.Principal subsidiaries and joint venturesThe consolidated Financial statements include the principal subsidiaries and joint ventures listed below:
Country ofincorporation Shareholding Description
SubsidiarySubaru (Australia) Pty Limited Australia 90.0% DistributionToyota Belgium NV/SA Belgium 100.0% DistributionThe Motor & Engineering Company of Ethiopia Ltd S.C. Ethiopia 94.1% DistributionInchcape Motors Finland OY Finland 100.0% DistributionToyota Hellas SA Greece 100.0% DistributionCrown Motors Limited Hong Kong 100.0% DistributionInchcape Olimp OOO Russia 100.0% RetailMusa Motors Group Russia 75.1% RetailBorneo Motors (Singapore) Pte Ltd Singapore 100.0% DistributionBaltic Motors Group Latvia 100.0% DistributionInchcape Finance plc United Kingdom 100.0% Central treasury companyInchcape Fleet Solutions Limited United Kingdom 100.0% Financial services*Inchcape International Holdings Limited United Kingdom 100.0% Intermediate holding companyInchcape Retail Limited United Kingdom 100.0% RetailThe Cooper Group Limited United Kingdom 100.0% RetailEuropean Motor Holdings Limited United Kingdom 100.0% RetailLind Limited United Kingdom 100.0% RetailJoint VenturesUnitfin SA Greece 60.0% Financial ServicesTefin SA Greece 50.0% Financial Services
* Included within Distribution in the business segmental analysis (see note 1).
The ultimate parent company of the Group is Inchcape plc,a company incorporated and domiciled in England andWales and listedon the London Stock Exchange.
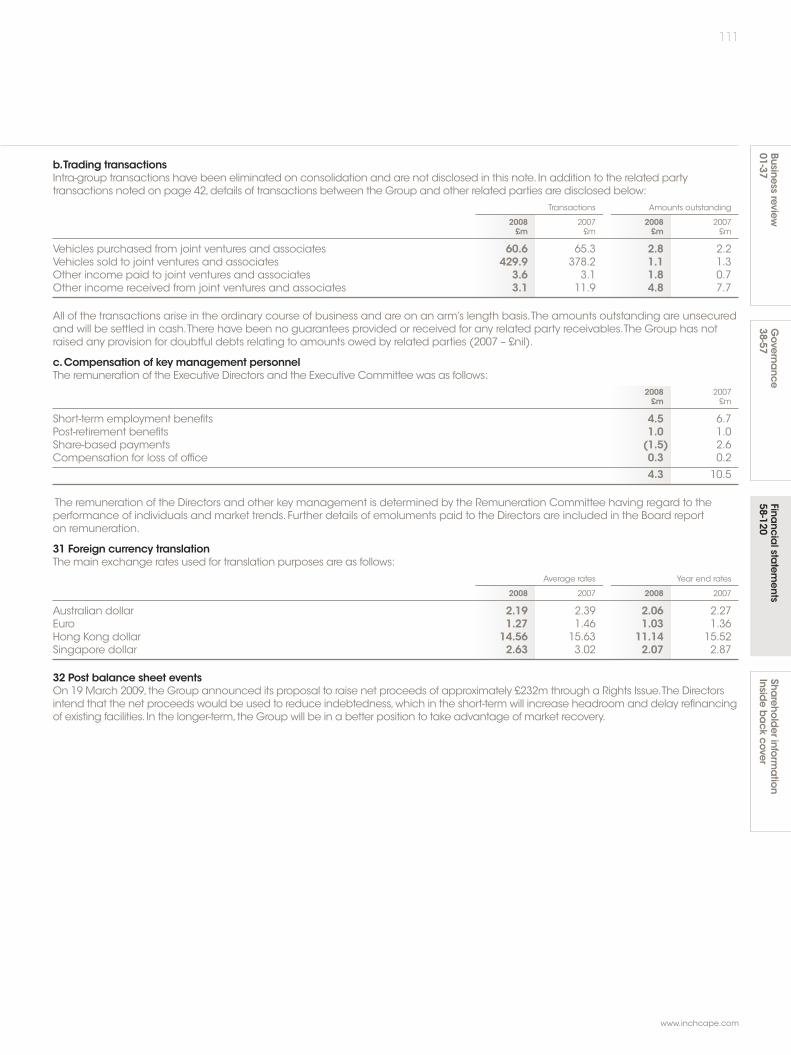
111
www.inchcape.com
Businessreview
01-37Sha
reholderinfo
rmation
Insideback
coverFina
ncialsta
tements
58-120Governa
nce38-57
b.Trading transactionsIntra-group transactions have been eliminated on consolidation and are not disclosed in this note. In addition to the related partytransactions noted on page 42,details of transactions between the Group and other related parties are disclosed below:
Transactions Amounts outstanding
2008 2007 2008 2007£m £m £m £m
Vehicles purchased from joint ventures and associates 60.6 65.3 2.8 2.2Vehicles sold to joint ventures and associates 429.9 378.2 1.1 1.3Other income paid to joint ventures and associates 3.6 3.1 1.8 0.7Other income received from joint ventures and associates 3.1 11.9 4.8 7.7
All of the transactions arise in the ordinary course of business and are on an arm’s length basis.The amounts outstanding are unsecuredand will be settled in cash.There have been no guarantees provided or received for any related party receivables.The Group has notraised any provision for doubtful debts relating to amounts owed by related parties (2007 – £nil).
c.Compensation of key management personnelThe remuneration of the Executive Directors and the Executive Committee was as follows:
2008 2007£m £m
Short-term employment benefits 4.5 6.7Post-retirement benefits 1.0 1.0Share-based payments (1.5) 2.6Compensation for loss of office 0.3 0.2
4.3 10.5
The remuneration of the Directors and other key management is determined by the Remuneration Committee having regard to theperformance of individuals and market trends. Further details of emoluments paid to the Directors are included in the Board reporton remuneration.
31 Foreign currency translationThe main exchange rates used for translation purposes are as follows:
Average rates Year end rates
2008 2007 2008 2007
Australian dollar 2.19 2.39 2.06 2.27Euro 1.27 1.46 1.03 1.36Hong Kong dollar 14.56 15.63 11.14 15.52Singapore dollar 2.63 3.02 2.07 2.87
32 Post balance sheet eventsOn 19 March 2009, the Group announced its proposal to raise net proceeds of approximately £232m through a Rights Issue.The Directorsintend that the net proceeds would be used to reduce indebtedness,which in the short-term will increase headroom and delay refinancingof existing facilities. In the longer-term, the Group will be in a better position to take advantage of market recovery.

112
Inchcape plc Annual Report and Accounts 2008
Financial statements
Five year record
The information presented in the table below is prepared in accordance with IFRS,as in issue and effective at that year end date.IFRS IFRS IFRS IFRS IFRS2008 2007 2006 2005 2004
Consolidated income statement £m £m £m £m £m
Revenue 6,259.8 6,056.8 4,842.1 4,488.1 4,119.5
Operating profit before exceptional items 240.5 265.0 213.9 189.4 172.1Exceptional items (82.5) 4.9 – (13.0) (10.6)
Operating profit 158.0 269.9 213.9 176.4 161.5Share of profit after tax of joint ventures and associates 2.2 3.5 5.9 6.2 7.8
Profit before finance and tax 160.2 273.4 219.8 182.6 169.3Net finance costs before exceptional finance income (52.0) (33.4) (5.9) (5.3) (10.3)Exceptional finance income – – – – 4.2
Profit before tax 108.2 240.0 213.9 177.3 163.2Tax before exceptional tax (49.3) (57.9) (45.1) (46.9) (43.1)Exceptional tax (3.6) – 8.0 – (0.5)
Profit after tax 55.3 182.1 176.8 130.4 119.6Minority interests (3.9) (5.7) (2.9) (3.8) (3.2)
Profit for the year 51.4 176.4 173.9 126.6 116.4
Basic:– Profit before tax 108.2 240.0 213.9 177.3 163.2– Earnings per share (pence) 11.2p 38.0p 37.5p 27.0p 24.8pAdjusted (before exceptional items):– Profit before tax 190.7 235.1 213.9 190.3 168.4– Earnings per share (pence) 30.0p 37.0p 35.7p 29.8p 26.0pDividends per share – interim paid and final proposed (pence) 5.46p 15.75p 15.0p 9.5p 8.3p
Consolidated balance sheetNon-current assets 1,372.1 1,037.0 666.0 521.7 468.4Other assets less (liabilities) excluding cash (borrowings) 55.3 14.3 4.0 (88.5) (105.6)
1,427.4 1,051.3 670.0 433.2 362.8Net (debt)/funds (407.8) (213.5) (19.0) 158.0 151.9
Net assets 1,019.6 837.8 651.0 591.2 514.7
Equity attributable to equity holders of the parent 995.5 813.6 643.8 581.7 506.4Minority interests 24.1 24.2 7.2 9.5 8.3
Total shareholders’equity 1,019.6 837.8 651.0 591.2 514.7

113
www.inchcape.com
Report of theAuditors
Independent Auditors’ report to the members of Inchcape plcWe have audited the Group Financial statements of Inchcape plcfor the year ended 31 December 2008 which comprise theconsolidated income statement, the consolidated balancesheet, the consolidated cash flow statement, the consolidatedstatement of recognised income and expense, the Accountingpolicies and the related notes.These Group Financial statementshave been prepared under the accounting policies set out therein.
We have reported separately on the parent Company Financialstatements of Inchcape plc for the year ended 31 December 2008and on the information in the Remuneration report that is describedas having been audited.
Respective responsibilities of Directors and auditorsThe Directors’ responsibilities for preparing theAnnual Report andthe Group Financial statements in accordance with applicable lawand International Financial Reporting Standards (IFRSs) as adoptedby the European Union are set out in the Statement of Directors’responsibilities section of the Corporate Governance report.
Our responsibility is to audit the Group Financial statements inaccordance with relevant legal and regulatory requirements andInternational Standards onAuditing (UK and Ireland).This report,including the opinion,has been prepared for and only for theCompany’s members as a body in accordance with Section 235of the Companies Act 1985 and for no other purpose.We do not,in giving this opinion,accept or assume responsibility for any otherpurpose or to any other person to whom this report is shown or intowhose hands it may come save where expressly agreed by our priorconsent in writing.
We report to you our opinion as to whether the Group Financialstatements give a true and fair view and whether the GroupFinancial statements have been properly prepared in accordancewith the Companies Act 1985 andArticle 4 of the IAS Regulation.We also report to you whether in our opinion the information givenin the Directors’ report is consistent with the Group Financialstatements.The information given in the Directors’ report includesthat specific information presented in the Operating review andthe Financial review that is cross-referred from the Business reviewsection of the Directors’ report.
In addition we report to you if, in our opinion,we have not receivedall the information and explanations we require for our audit,or ifinformation specified by law regarding Director’s remuneration andother transactions is not disclosed.
We review whether the Corporate governance report reflects theCompany’s compliance with the nine provisions of the CombinedCode (2006) specified for our review by the Listing Rules of theFinancial Services Authority,and we report if it does not.We are notrequired to consider whether the Board’s statements on internalcontrol cover all risks and controls,or form an opinion on theeffectiveness of the Group’s corporate governance proceduresor its risk and control procedures.
We read other information contained in theAnnual Report andconsider whether it is consistent with the audited Group Financialstatements.The other information comprises only the Directors’report, the Chairman’s statement, the Group Chief Executive’sreview, the Operating review, the Financial review, the Corporateresponsibility, the Board of Directors, the Executive Committee, theCorporate Governance report, the Remuneration report, the Fiveyear record and Company details.We consider the implicationsfor our report if we become aware of any apparent misstatementsor material inconsistencies with the Group Financial statements.Our responsibilities do not extend to any other information.
Basis of audit opinionWe conducted our audit in accordance with InternationalStandards onAuditing (UK and Ireland) issued by the AuditingPractices Board.An audit includes examination,on a test basis,of evidence relevant to the amounts and disclosures in the GroupFinancial statements. It also includes an assessment of thesignificant estimates and judgements made by the Directors in thepreparation of the Group Financial statements,and of whether theaccounting policies are appropriate to the Group’s circumstances,consistently applied and adequately disclosed.
We planned and performed our audit so as to obtain all theinformation and explanations which we considered necessaryin order to provide us with sufficient evidence to give reasonableassurance that the Group Financial statements are free frommaterial misstatement,whether caused by fraud or otherirregularity or error. In forming our opinion we also evaluated theoverall adequacy of the presentation of information in the GroupFinancial statements.
OpinionIn our opinion:
• the Group Financial statements give a true and fair view,in accordance with IFRSs as adopted by the European Union,of the state of the Group’s affairs as at 31 December 2008and of its profit and cash flows for the year then ended;
• the Group Financial statements have been properly preparedin accordance with the Companies Act 1985 andArticle 4 ofthe IAS Regulation;and
• the information given in the Directors’ report is consistent withthe Group Financial statements.
PricewaterhouseCoopers LLPCharteredAccountants and RegisteredAuditorsLondon
19 March 2009
Businessreview
01-37Sha
reholderinfo
rmatio
nInsid
eback
coverFina
ncialsta
tements
58-120Governa
nce38-57

114
Inchcape plc Annual Report and Accounts 2008
Financial statements
Company balance sheetAs at 31 December 2008
2008 2007Notes £m £m
Fixed assetsInvestment in subsidiaries 3 1,870.9 1,847.3
Current assetsAvailable for sale financial assets 4 – –Debtors:– Amounts due within one year 5 233.1 29.5– Amounts due after more than one year 5 153.0 144.0Cash at bank and in hand 6 14.4 54.2
400.5 227.7
Creditors – amounts falling due within one year 7 (25.7) (13.1)
Net current assets 374.8 214.6
Total assets less current liabilities 2,245.7 2,061.9
Creditors – amounts falling due after more than one year 8 (1,712.6) (1,637.2)
Provisions for liabilities and charges 10 (9.5) (8.5)
Net assets 523.6 416.2
Capital and reservesShare capital 12,14 121.9 121.6Share premium 14 126.1 123.4Capital redemption reserve 14 16.4 16.4Profit and loss account 14 259.2 154.8
Total shareholders’ funds 523.6 416.2
The Financial statements on pages 114 to 119 were approved by the Board of Directors on 19 March 2009 and were signed on itsbehalf by:
André Lacroix, Director Barbara Richmond, Director
115
www.inchcape.com
Businessreview
01-37Sha
reholderinfo
rmatio
nInsid
eback
coverFina
ncialsta
tements
58-120Governa
nce38-57
Accounting policies
Basis of preparationThese Financial statements are prepared for Inchcape plc (the Company) for the year ended 31 December 2008.The Companyis the ultimate parent entity of the Inchcape Group (the Group).
Accounting conventionThese Financial statements have been prepared on the historical cost basis in accordance with the Companies Act 1985 andapplicable UK accounting standards.As permitted by Section 230 of the Companies Act 1985,no separate profit and loss accountis presented for the Company. In addition, the Company is not required to prepare a cash flow statement under the terms of FRS 1–Cash Flow Statements (revised).
Going ConcernIn determining whether the Company is a going concern, the Directors have reviewed the Company’s current financial position and haveprepared detailed financial projections.These projections reflect the recent unprecedented downturn in economic conditions and creditavailability across the Company’s operations, the actions already taken to restructure the business and the plans in place to focusoperations on the five core priorities of growing market share,growing aftersales,managing working capital and reducing overheadsand capital expenditure (see page 8).
The projections also assume that: new car sales will continue to decline in 2009 and will not begin to recover until the second half of 2010;the service and parts business will be more resilient to the downturn; lower UK interest rates will continue; key brand partners will remain inproduction and supply on normal terms of trade;and there will be no further significant downturn in the global economic environment.
These projections,even after allowing for headroom to accommodate a reasonable downside scenario (including weaker trading andadverse movements in currency and interest rates), indicate that the Company would be able to manage its operations so as to remainwithin its current facilities and in compliance with its banking covenants.
Accordingly,after making enquiries, the Directors have a reasonable expectation that the Company has adequate resources to continueas a going concern for the foreseeable future.As such, the Company continues to adopt the going concern basis in preparing theFinancial statements.
Foreign currenciesAssets and liabilities in foreign currencies are translated into Sterling at closing rates of exchange and are taken to the profit and loss account.
InvestmentsInvestments in subsidiaries are stated at cost, less provisions for impairment.
Deferred taxDeferred tax is provided in full (without discounting) based on current tax rates and law,on timing differences that result in an obligationat the balance sheet date to pay more tax,or a right to pay less tax in the future except as otherwise required by FRS 19 – DeferredTax.Deferred tax is not provided on timing differences arising from the revaluation of fixed assets where there is no binding commitment tosell the asset.
ProvisionsProvisions are recognised when the Company has a present obligation in respect of a past event, it is more likely than not that an outflowof resources will be required to settle the obligation and where the amount can be reliably estimated.Provisions are discounted when thetime value of money is considered material.
Share capitalOrdinary shares are classified as equity.
Where the Company purchases its own equity share capital (treasury shares), the consideration paid is deducted from shareholders’funds until the shares are cancelled, reissued or disposed of.Where such shares are subsequently sold or reissued,any considerationreceived is included in shareholders’ funds.
DividendsFinal dividends proposed by the Board of Directors and unpaid at the year end are not recognised in the Financial statements untilthey have been approved by the shareholders at theAnnual General Meeting. Interim dividends are recognised when they are paid.
Share-based paymentsThe Company operates various share-based award schemes.The fair value at the date at which the share-based awards are grantedis recognised in the profit and loss account (together with a corresponding increase in shareholders’equity) on a straight-line basisover the vesting period,based on an estimate of the number of shares that will eventually vest.For equity settled share-based awards,the services received from employees are measured by reference to the fair value of the awards granted.With the exception of the‘Save as you earn’scheme,the vesting of all share-based awards under all schemes is solely reliant upon non-market conditions thereforeno expense is recognised for awards that do not ultimately vest.Where an employee cancels a‘Save as you earn’award, the charge forthat award is recognised as an expense immediately,even though the award does not vest. In accordance with the transitional provisionsof FRS 20 – Share-based Payment,no charge has been recognised for grants of equity instruments made before 7 November 2002.
Financial instrumentsThe adoption by the Company of FRS 29 – Financial Instruments: Disclosures has had no impact as the Company has takenadvantage of the exemption not to apply FRS 29 in its own Financial statements.The Group’s policies on the recognition,measurementand presentation of financial instruments under IFRS 7 are set out in the Group’s accounting policies on pages 62 to 67.

116
Inchcape plc Annual Report and Accounts 2008
Financial statements
Notes to the accounts
1 Auditors’ remunerationThe Company incurred £0.1m (2007 – £0.1m) in relation to UK statutory audit fees for the year ended 31 December 2008.
2 Executive Directors’ remuneration 2008 2007£m £m
Wages and salaries 1.2 2.1Social security costs 0.2 0.3Pension costs 0.4 0.4Other employment costs (0.9) 0.9
0.9 3.7
Further information on Executive Directors’emoluments and interests is given in the Board report on remuneration which can be foundon pages 51-57 in the Group’s Financial statements for the year ended 31 December 2008.
3 Investment in subsidiaries 2008 2007£m £m
CostAt 1 January 1,868.3 1,221.1Additions 56.1 684.2Disposals (12.1) (37.0)
At 31 December 1,912.3 1,868.3
ProvisionsAt 1 January (21.0) (50.0)Disposals – 29.0Provisions for impairment (32.1) –Reversal of provision for impairment 11.7 –
At 31 December (41.4) (21.0)
Net book value 1,870.9 1,847.3
Additions include £56.1m in respect of additional investments in existing Group companies.
4 Available for sale financial assets 2008 2007£m £m
Equity securitiesAt 1 January – 49.2Transfer to investment in subsidiaries – (49.2)
At 31 December – –
5 Debtors 2008 2007£m £m
Amounts due within one yearOther debtors 1.9 2.1Amounts owed by Group undertakings 231.2 27.4
233.1 29.5
Amounts due after more than one yearDeferred tax asset (note 9) 1.5 1.6Amounts owed by Group undertakings 151.5 142.4
153.0 144.0
6 Cash at bank and in hand 2008 2007£m £m
Cash at bank and in hand 14.4 54.2
7 Creditors – amounts falling due within one year 2008 2007£m £m
Amounts owed to Group undertakings 20.1 9.8Other taxation and social security payable 0.1 0.4Other creditors 5.5 2.9
25.7 13.1

117
www.inchcape.com
Businessreview
01-37Sha
reholderinfo
rmatio
nInsid
eback
coverFina
ncialsta
tements
58-120Governa
nce38-57
8 Creditors – amounts falling due after more than one year 2008 2007£m £m
Amounts owed to Group undertakings 1,330.0 1,348.0Private Placement 381.4 284.8Other loans 1.2 4.4
1,712.6 1,637.2
The Company raised US$550m in a Private Placement: US$350m is repayable in 9 years and bears interest at a fixed rate of 5.94% perannum;and US$200m is repayable in 11 years and bears interest at a fixed rate of 6.04% per annum.
Other loans are loan notes issued in connection with the acquisition of EuropeanMotor Holdings plc and bear interest at rates linked to LIBOR.
Amounts owed to Group undertakings bear interest at rates linked to LIBOR.
9 Deferred tax Share-based Other timingpayments differences Total
£m £m £m
At 1 January 2008 1.2 0.4 1.6(Charged)/credited to the profit and loss account (0.8) 1.0 0.2Charged to the profit and loss account reserve (0.3) – (0.3)At 31 December 2008 0.1 1.4 1.5
10 Provisions for liabilities and charges 2008£m
At 1 January 8.5Charged to the profit and loss account 1.0At 31 December 9.5
Provision has been made for warranties, indemnities and other litigation issues in relation to motors and non-motors business exits,basedon expected outcomes.These provisions are expected to be settled within the next three years.
11 Guarantees and contingencies 2008 2007£m £m
Guarantees of various subsidiaries’borrowings(against which £405.0m has been drawn at 31 December 2008, 2007 – £115.0m) 535.0 535.0
The Company is party to composite cross guarantees between banks and its subsidiaries.The Company’s contingent liability underthese guarantees at 31 December 2008 was £178.4m (2007 – £81.9m).
12 Share capital
a.Authorised Number of shares Ordinary share capital
2008 2007 2008 2007Number Number £m £m
Ordinary share capital (25.0p per share) 786,000,000 786,000,000 196.5 196.5
b.Allotted,called up and fully paid up Number of shares Ordinary share capital
2008 2007 2008 2007Number Number £m £m
Ordinary shares of 25.0p eachAt 1 January 486,188,977 482,298,983 121.6 120.6Allotted under share option schemes 1,055,129 3,889,994 0.3 1.0
At 31 December 487,244,106 486,188,977 121.9 121.6
c.Share buy back programmeAt 31 December 2008, the Company held treasury shares with a book value of £99.4m (2007 – £83.4m).During the year, the Companyrepurchased 4,460,000 (2007 – 4,535,000) of its own shares through purchases on the London Stock Exchange.The total consideration paidwas £16.0m (2007 – £18.5m) and this has been deducted from the Profit and loss account reserve.The shares repurchased during the yearequate to 0.9% (2007 – 0.9%) of the issued share capital.The shares are held as treasury shares andmay either be cancelled or used tosatisfy share options at a later date.
d.Substantial shareholdingsDetails of substantial interests in the Company’s issued ordinary share capital received by the Company at 13 March 2009 under theprovisions of the Companies Act 2006 have been disclosed in the substantial shareholdings section of the Directors’ report.

118
Inchcape plc Annual Report and Accounts 2008
Financial statements
Notes to the accounts continued
12 Share capital continuede.Share optionsAt 31 December 2008,options to acquire ordinary shares of 25.0p each in the Company up to the following numbers under the schemesbelow were outstanding as follows:Number of Number ofordinary shares Exercisable Option ordinary shares Exercisable Optionof 25.0p each until price of 25.0p each until price
The Inchcape 1999 Share Option Plan The Inchcape SAYE Share Option Scheme– approved (Part II – UK) – approved8,748 17 March 2012 114.1p 2,346 1 December 2008 274.1p11,808 19 March 2013 127.0p 165,570 1 May 2009 282.5p29,244 31 August 2013 205.1p 160,986 1 December 2009 345.3p103,124 20 May 2014 262.0p 100,141 1 May 2010 368.0p33,180 29 September 2014 259.1p 123,223 1 December 2010 441.0p163,713 6 March 2015 342.6p 292,346 1 May 2011 383.0p36,282 11 September 2015 358.0p 267,961 1 December 2011 315.0p248,034 29 March 2016 445.3p 1,312,126 1 May 2012 203.0p6,772 21 May 2016 443.0p13,128 10 August 2016 457.0p217,545 12 April 2017 577.0p424,767 3 April 2018 428.0p11,764 31 July 2018 255.0p
– unapproved (Part I – UK)14,616 31 August 2013 205.1p157,680 20 May 2014 262.0p6,750 29 September 2014 259.1p426,720 6 March 2015 342.6p368,712 11 September 2015 358.0p1,127,322 29 March 2016 445.3p340,857 21 May 2016 443.0p29,539 10 August 2016 457.0p1,467,295 12 April 2017 577.0p1,954,698 3 April 2018 428.0p25,125 24 April 2018 398.0p145,098 31 July 2018 255.0p
– unapproved overseas (Part I – Overseas)15,462 7 September 2009 64.6p31,680 9 August 2010 47.3p54,684 21 March 2011 64.0p74,412 17 March 2012 114.1p153,648 19 March 2013 127.0p551,202 20 May 2014 262.0p640,210 6 March 2015 342.6p648,012 29 March 2016 445.3p720,783 12 April 2017 577.0p30,060 18 December 2017 369.0p1,343,905 3 April 2018 428.0p53,458 24 April 2018 398.0p130,272 5 October 2018 198.0p
Included within the Profit and loss account reserve are 2,315,380 (2007 – 1,718,739 ) own ordinary shares held by the ESOP Trust,ageneral discretionary trust whose beneficiaries include current and former employees of the Group and their dependants.The bookvalue of these shares at 31 December 2008 was £9.3m (2007 – £6.8m).The market value of these shares at 31 December 2008 was£0.9m and at 18 March 2009 was £1.2m (31 December 2007 – £6.5m,25 February 2008 – £6.8m).

119
www.inchcape.com
Businessreview
01-37Sha
reholderinfo
rmatio
nInsid
eback
coverFina
ncialsta
tements
58-120Governa
nce38-57
13 DividendsThe following dividends were paid by the Company:
2008 2007£m £m
Interim dividend for the six months ended 30 June 2008 of 5.46p per share (2007 – 5.25p per share) 25.0 24.5Final dividend for the year ended 31 December 2007 of 10.5p per share (2006 – 10.0p per share ) 48.1 46.6
73.1 71.1
There is no proposal to pay a final dividend for the year ended 31 December 2008.
Dividends paid above exclude £4.6m (2007 – £3.0m) payable on treasury shares and shares held by the ESOPTrust.
14 ReservesCapital
Share Share redemption Profit and losscapital premium reserve account Total
£m £m £m £m £m
At 1 January 2007 120.6 115.9 16.4 301.1 554.0Loss for the financial year – – – (57.4) (57.4)Dividends – – – (71.1) (71.1)Issue of ordinary share capital 1.0 7.5 – – 8.5Net purchase of own shares by ESOP Trust – – – (2.0) (2.0)Share-based payments charge (net of tax) – – – 2.7 2.7Share buy back programme – – – (18.5) (18.5)
At 1 January 2008 121.6 123.4 16.4 154.8 416.2Profit for the financial year – – – 198.8 198.8Dividends – – – (73.1) (73.1)Issue of ordinary share capital 0.3 2.7 – – 3.0Net purchase of own shares by ESOP Trust – – – (4.2) (4.2)Share-based payments credit (net of tax) – – – (1.1) (1.1)Share buy back programme – – – (16.0) (16.0)At 31 December 2008 121.9 126.1 16.4 259.2 523.6
15 Principal subsidiaries at 31 December 2008The Company is a limited company incorporated in England andWales whose shares are publicly traded on the London Stock Exchange.The principal subsidiaries in which the Company holds an investment are as follows:
Country ofincorporation Shareholding Description
European Motor Holdings Limited United Kingdom 100.0% Intermediate holding companyInchcape Finance plc United Kingdom 100.0% Central treasury companyInchcape International Holdings Limited United Kingdom 100.0% Intermediate holding companyInchcape Overseas Limited United Kingdom 100.0% Intermediate holding company
16 Post balance sheet eventsOn 19 March 2009, the Company announced its proposal to raise net proceeds of approximately £232m through a Rights Issue.TheDirectors intend that the net proceeds would be used to reduce indebtedness which in the short-term will increase headroom and delayrefinancing of existing facilities. In the longer-term, the Company will be in a better position to take advantage of market recovery.

120
Inchcape plc Annual Report and Accounts 2008
Financial statements
Report of theAuditors
Independent Auditors’ report to the members of Inchcape plcWe have audited the parent Company Financial statementsof Inchcape plc for the year ended 31 December 2008 whichcomprise the Company balance sheet, theAccounting policiesand the related notes.These parent Company Financial statementshave been prepared under the accounting policies set out therein.We have also audited the information in the Remuneration reportthat is described as having been audited.
We have reported separately on the Group Financial statementsof Inchcape plc for the year ended 31 December 2008.
Respective responsibilities of Directors and auditorsThe Directors’ responsibilities for preparing theAnnual Report,the Remuneration report and the parent Company Financialstatements in accordance with applicable law and UnitedKingdomAccounting Standards (United KingdomGenerallyAcceptedAccounting Practice) are set out in the Directors’responsibilities section of the Corporate governance report.
Our responsibility is to audit the parent Company Financialstatements and the part of the Remuneration report to be auditedin accordance with relevant legal and regulatory requirements andInternational Standards onAuditing (UK and Ireland).This report,including the opinion,has been prepared for and only for theCompany’s members as a body in accordance with Section 235of the Companies Act 1985 and for no other purpose.We do not,in giving this opinion,accept or assume responsibility for any otherpurpose or to any other person to whom this report is shown or intowhose hands it may come save where expressly agreed by our priorconsent in writing.
We report to you our opinion as to whether the parent CompanyFinancial statements give a true and fair view and whether theparent Company Financial statements and the part of theRemuneration report to be audited have been properly preparedin accordance with the Companies Act 1985.We also report toyou whether in our opinion the information given in the Directors’report is consistent with the parent Company Financial statements.The information given in the Directors’ report includes that specificinformation presented in the Operating review and the Financialreview that is cross-referred from the Business Review section of theDirectors’ report.
In addition we report to you if, in our opinion, the Company hasnot kept proper accounting records, if we have not received allthe information and explanations we require for our audit,or ifinformation specified by law regarding Directors’ remunerationand other transactions is not disclosed.
We read other information contained in theAnnual Report andconsider whether it is consistent with the audited parent CompanyFinancial statements.The other information comprises only theDirectors’ report, the unaudited part of the Remuneration report,the Chairman’s statement, the Group Chief Executive’s review, theOperating review and the Financial review,the Corporate responsibility,the Board of Directors, the Executive Committee, the Corporategovernance report, the Remuneration report, the Five year recordand Company details.We consider the implications for our reportif we become aware of any apparent misstatements or materialinconsistencies with the parent Company Financial statements.Our responsibilities do not extend to any other information.
Basis of audit opinionWe conducted our audit in accordance with InternationalStandards onAuditing (UK and Ireland) issued by theAuditingPractices Board.An audit includes examination,on a test basis,of evidence relevant to the amounts and disclosures in the parentCompany Financial statements and the part of the Remunerationreport to be audited. It also includes an assessment of thesignificant estimates and judgements made by the Directors in thepreparation of the parent Company Financial statements,and ofwhether the accounting policies are appropriate to the Company’scircumstances,consistently applied and adequately disclosed.
We planned and performed our audit so as to obtain all theinformation and explanations which we considered necessaryin order to provide us with sufficient evidence to give reasonableassurance that the parent Company Financial statements and thepart of the Remuneration report to be audited are free frommaterialmisstatement,whether caused by fraud or other irregularity or error.In forming our opinion we also evaluated the overall adequacy ofthe presentation of information in the parent Company Financialstatements and the part of the Remuneration report to be audited.
OpinionIn our opinion:
• the parent Company Financial statements give a true and fairview, in accordance with United KingdomGenerally AcceptedAccounting Practice,of the state of the Company’s affairs as at31 December 2008;
• the parent Company Financial statements and the part ofthe Remuneration report to be audited have been properlyprepared in accordance with the Companies Act 1985;and
• the information given in the Directors’ report is consistent withthe parent Company Financial statements.
PricewaterhouseCoopers LLPCharteredAccountants and RegisteredAuditorsLondon
19 March 2009
Registered officeInchcape plc22a St James’s SquareLondon SW1Y 5LP.Tel: +44 (0) 20 7546 0022Fax: +44 (0) 20 7546 0010Registered number 609782
AdvisorsAuditorsPricewaterhouseCoopers LLPCharteredAccountants andRegisteredAuditors
Share registrarsComputershare Investor Services PLCRegistrar’s Department,PO Box No 82Bristol BS99 7NH.Tel: +44 (0) 870 707 1076
SolicitorsSlaughter and May
Financial advisorsDresdner Kleinwort
Corporate brokersMerrill Lynch
Inchcape PEPSIndividual Savings Accounts (ISAs)replaced Personal Equity Plans (PEPs)as the vehicle for tax efficient savings.Existing PEPs may be retained. InchcapePEPs are managed byThe Share CentreLtd,who can be contacted at PO Box2000,Oxford House,Oxford Road,Aylesbury,Buckinghamshire HP21 8ZB.Tel: +44 (0) 1296 414144
Inchcape ISAInchcape has established a CorporateIndividual Savings Account (ISA).This is managed by Equiniti FinancialServices Limited,Aspect House,SpencerRoad, Lancing,West Sussex BN99 6DA.Tel: 0870 300 0430International callers:+44 121 441 7560
More information is available atwww.shareview.com
Financial calendarAnnual General Meeting14 May 2009
Announcement of 2009 interim resultsJuly 2009
This Report is printed on Hello Silk paper.This paper has been independentlycertified as meeting the standards of theForest Stewardship Council (FSC),and wasmanufactured at a mill that is certified tothe ISO14001 and EMAS environmentalstandards.The inks used are all vegetableoil based.
Produced by Black Sun Plc
Brand partner information
www.toyota.com
www.lexus.com
www.landrover.com
www.mazda.com
www.volkswagen.com
www.volvo.com
www.audi.com
www.bmw.com
www.suzuki.com
www.subaru.com
www.kia.com
www.jeep.com
www.rolls-roycemotorcars.com
www.renault.com
www.mitsubishi.com
www.jaguar.com
www.mini.com
www.hyundai.com
www.dodge.com
www.porsche.com
www.smart.com
www.chrysler.com
www.hino.com www.mercedes.com
www.honda.com
www.peugeot.com
www.daihatsu.com
Shareholder information
Company details
Businessreview
01-37G
overnance
38-57Fina
ncialsta
tements
58-120Sha
rehold
erinform
atio
nInsid
eb
ack
cover

Inchcape plc22a St James’s SquareLondon SW1Y 5LPT +44 (0) 20 7546 0022F +44 (0) 20 7546 0010www.inchcape.comRegistered number 609782