![PDF] Forecast TNUoS Tariffs for 2019/20 - National Grid plc2019/20 June Change Average (p/kWh) 6.374706 6.557159 0.182453 Zone Zone Name HH Demand Tariff (£/kW) NHH Demand Tariff](https://static.fdocuments.us/doc/165x107/612d4d961ecc515869421aef/-forecast-tnuos-tariffs-for-201920-national-grid-plc201920-june-change-average.jpg)
Final TNUoS Tariffs for 2018/19 - National Grid · Annual Load Factors 29 ... 3 Recognition of...
48
NGET: Forecast TNUoS Tariffs for 2018/19 June 2017 1 Final TNUoS Tariffs for 2018/19 January 2018
Transcript of Final TNUoS Tariffs for 2018/19 - National Grid · Annual Load Factors 29 ... 3 Recognition of...
NGET: Forecast TNUoS Tariffs for 2018/19 June 2017 1
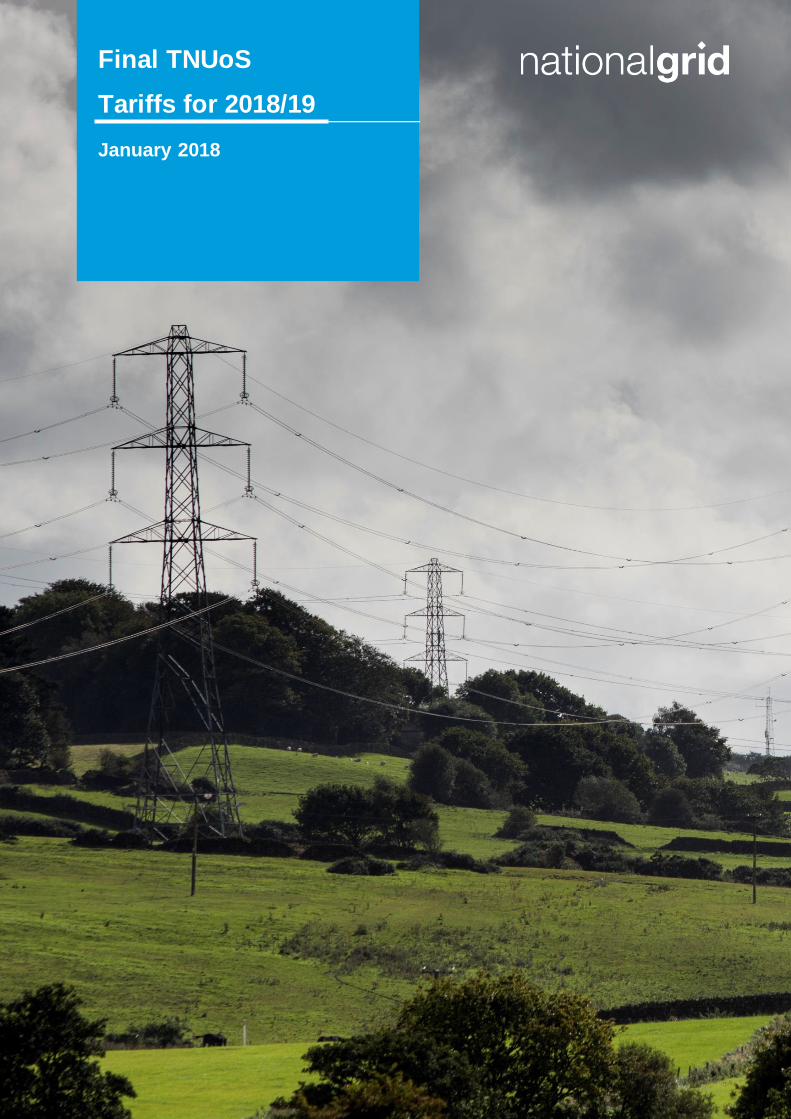
Final TNUoS
Tariffs for 2018/19
January 2018
January 2018
Final TNUoS tariffs for 2018/19
This information paper provides National Grid’s Final Transmission Network Use of System (TNUoS) tariffs for 2018/19, applicable to transmission connected Generators and Suppliers, effective from 1 April 2018. January 2018

NGET: Final TNUoS Tariffs for 2018/19 January 2018 3
Contents
Contact Us 4
Executive Summary 5
Demand tariffs 8
Changes since the previous demand tariffs forecast 9
Gross half hourly demand tariffs 9
Embedded export tariff 10
NHH demand tariffs 11
Generation tariffs 12
Generation wider tariffs 12
Changes since the last generation tariffs forecast 13
Generation wider zonal tariffs 13
Onshore local tariffs for generation 16
Onshore local substation tariffs 16
Onshore local circuit tariffs 16
Offshore local tariffs for generation 18
Offshore local generation tariffs 18
Background to TNUoS charging 19
Generation charging principles 19
Demand charging principles 23
HH gross demand tariffs 23
Embedded export tariffs 23
NHH demand tariffs 24
Updates to revenue & the charging
model since the last forecast 25
Changes affecting the locational element of tariffs 25
Changes to the Network Model 25
Contracted and modelled TEC 25
Adjustments for interconnectors 26
Transport Model Demand Data 26
RPI 26
Expansion Constant 26
Local substation and offshore substation tariffs 27
Allowed revenues 27
Generation / Demand (G/D) Split 28
Exchange Rate 28
Generation Output 28
Error Margin 28
NGET: Final TNUoS Tariffs for 2018/19 January 2018 4
Charging bases for 2018/19 29
Generation 29
Demand 29
Annual Load Factors 29
Generation and Demand Residuals 29
Small generators’ discount 31
Tools and Supporting Information 33
Appendices 34
Appendix A: Locational demand tariff charges 35
Appendix B: Locational demand profiles 36
Appendix C: Annual Load Factors 37
ALFs 37
Appendix D: Transmission company
revenues 43
National Grid revenue forecast 43
Scottish Power Transmission revenue forecast 45
SHE Transmission revenue forecast 45
Offshore Transmission Owner revenues 45
Interconnectors under Cap and Floor Revenue Adjustment 45
Appendix E: Generation zones map 47
Appendix F: Demand zones map 48
48
Contact Us
If you have any comments or questions on the contents or format of this report, please don’t hesitate to get in touch with us.
Team Email & Phone [email protected] 01926 654633

NGET: Final TNUoS Tariffs for 2018/19 January 2018 5
Executive Summary
This document contains the Transmission Network Use of System
(TNUoS) Final tariffs for 2018/19, which will become effective on 1 April 2018. TNUoS charges are paid by transmission connected generators and suppliers for use of the GB Transmission networks.
Total Revenues to be recovered Total Transmission Owner (TO) allowed revenue to be recovered from TNUoS charges will be £2,670.3m in
2018/19, an increase of £0.1m from the forecast published in Draft tariffs. This is due to a small increase in revenues for TOs offset by a
reduction in the value of the Network Innovation Competition fund as allowed by Ofgem.
Generation Tariffs Generation tariffs have been set to recover £430.1m to ensure average annual generation tariffs remain
below the €2.5/MWh limit set by European Commission Regulation (EU) No. 838/2010. There is no change to total generation revenue
compared to the Draft tariffs. The chargeable TEC has increased by just 16MW. The average
generation tariff is unchanged from the Draft tariffs at £5.98/kW. Demand tariffs
Demand tariffs have been set to recover £2240.2m of revenue, an increase of £0.1m from the Draft tariffs. The Embedded Export tariff is
forecast to pay £175.4m to eligible
embedded export volumes and this is recovered from other demand tariffs. The Demand Charging Base remains
the same as the Draft tariffs. We are forecasting average system gross triad demand of 52.5GW, average HH gross triad demand of 19.8GW,
embedded export generation of 6.5GW and NHH demand of 24.2TWh.
The average gross demand Half Hourly (HH) tariff is £46.17/kW; the average Embedded Export Tariff (EET) is £26.91/kW; and the average
Non Half Hourly (NHH) demand tariff is 6.21p/kWh. Demand tariffs have changed only very slightly since Draft tariffs.
Changes to the Methodology affecting 2018/19 tariffs There have been various CUSC
changes implemented in the methodology used to calculate tariffs for 2018/19. These have all previously been reflected in our Draft
tariffs, and there have been no further methodology changes. These Final tariffs include changes introduced1 by
1 See:
https://www.nationalgrid.com/uk/electricity/codes/conne
ction-and-use-system-code?mods
NGET: Final TNUoS Tariffs for 2018/19 January 2018 6
CMP264/2652, CMP2683, CMP2824
and CMP2835,
2 Embedded generation Triad avoidance standstill
and Gross charging of TNUoS for HH demand where
embedded generation is in Capacity Market 3 Recognition of sharing by Conventional Carbon plant of
Not-Shared Year-Round circuits 4 The effect negative demand has on zonal locational
demand tariffs 5 Consequential changes to enable the interconnector Cap
and Floor regime
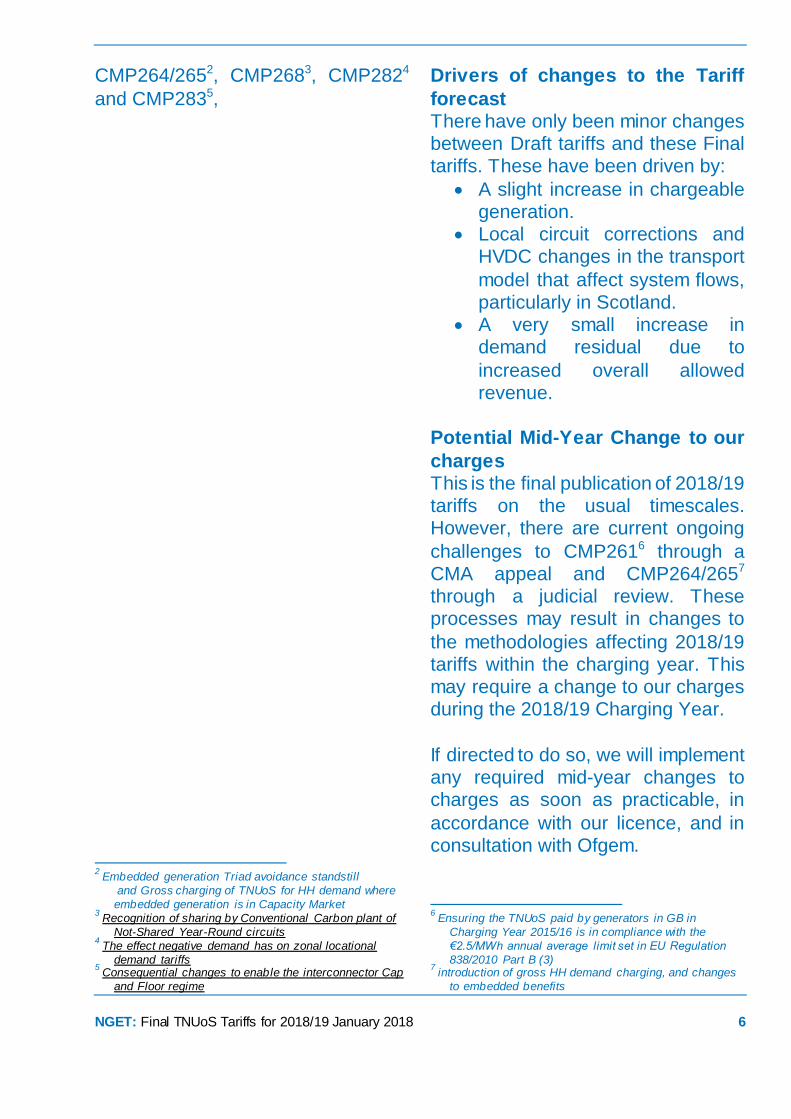
Drivers of changes to the Tariff
forecast There have only been minor changes between Draft tariffs and these Final tariffs. These have been driven by:
A slight increase in chargeable generation.
Local circuit corrections and HVDC changes in the transport
model that affect system flows, particularly in Scotland.
A very small increase in demand residual due to
increased overall allowed revenue.
Potential Mid-Year Change to our
charges This is the final publication of 2018/19 tariffs on the usual timescales. However, there are current ongoing
challenges to CMP2616 through a CMA appeal and CMP264/2657 through a judicial review. These processes may result in changes to
the methodologies affecting 2018/19 tariffs within the charging year. This may require a change to our charges during the 2018/19 Charging Year.
If directed to do so, we will implement any required mid-year changes to charges as soon as practicable, in
accordance with our licence, and in consultation with Ofgem.
6 Ensuring the TNUoS paid by generators in GB in
Charging Year 2015/16 is in compliance with the
€2.5/MWh annual average limit set in EU Regulation
838/2010 Part B (3) 7 introduction of gross HH demand charging, and changes
to embedded benefits

NGET: Final TNUoS Tariffs for 2018/19 January 2018 7
We intend to publish guidance on the
potential impact of mid-year changes to charges during February. 2019/20 TNUoS Tariffs
Our next publication of TNUoS tariffs will be the forecast of 2019/20 tariffs in April 2018.
The latest tariff forecast timetable can be found on our website.8 Feedback
We welcome feedback on any aspect of this document and the tariff setting process. Do let us know if you have any further suggestions as to how we
can better work with you to improve the tariff forecasting process, whether you have any questions on this document or whether you still
welcome webinar sessions following each forecast.
8 Our forecast publication timetable is available on our
website: http://www.nationalgrid.com/tnuos
NGET: Final TNUoS Tariffs for 2018/19 January 2018 8
Demand Tariffs
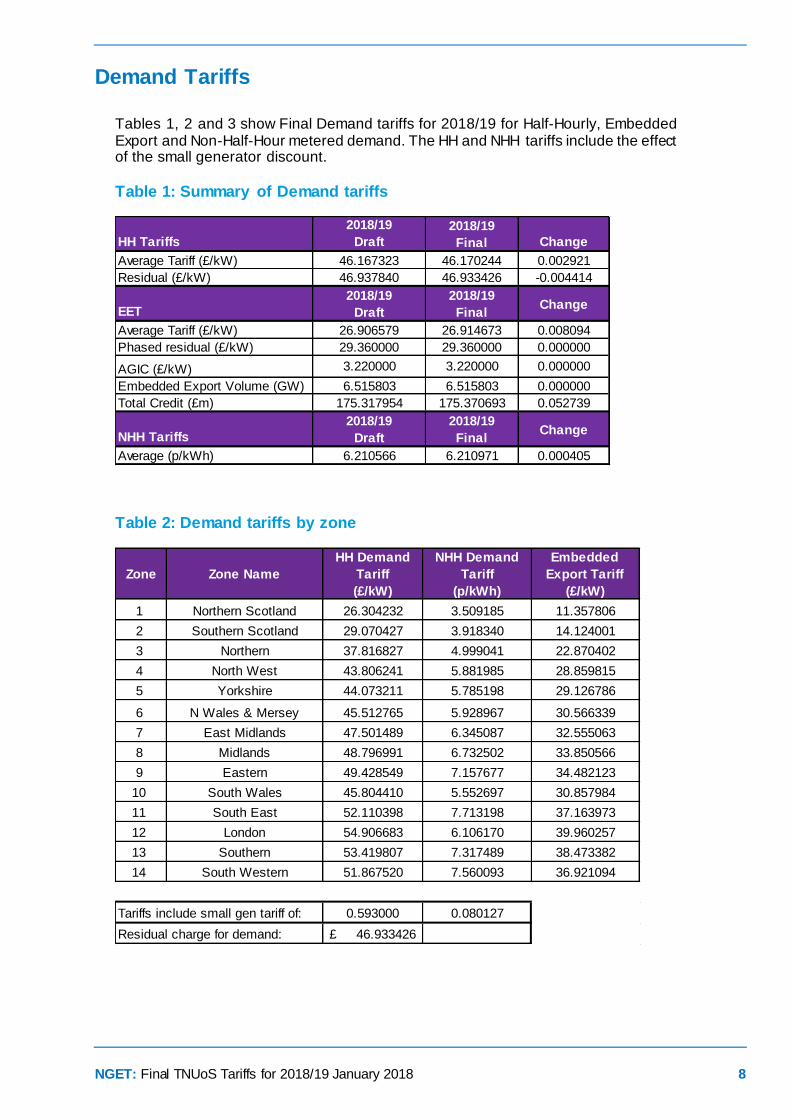
Tables 1, 2 and 3 show Final Demand tariffs for 2018/19 for Half-Hourly, Embedded Export and Non-Half-Hour metered demand. The HH and NHH tariffs include the effect of the small generator discount.
Table 1: Summary of Demand tariffs
Table 2: Demand tariffs by zone
HH Tariffs
2018/19
Draft
2018/19
Final Change
Average Tariff (£/kW) 46.167323 46.170244 0.002921
Residual (£/kW) 46.937840 46.933426 -0.004414
EET
2018/19
Draft
2018/19
FinalChange
Average Tariff (£/kW) 26.906579 26.914673 0.008094
Phased residual (£/kW) 29.360000 29.360000 0.000000
AGIC (£/kW) 3.220000 3.220000 0.000000
Embedded Export Volume (GW) 6.515803 6.515803 0.000000
Total Credit (£m) 175.317954 175.370693 0.052739
NHH Tariffs
2018/19
Draft
2018/19
FinalChange
Average (p/kWh) 6.210566 6.210971 0.000405
Zone Zone Name
HH Demand
Tariff
(£/kW)
NHH Demand
Tariff
(p/kWh)
Embedded
Export Tariff
(£/kW)
1 Northern Scotland 26.304232 3.509185 11.357806
2 Southern Scotland 29.070427 3.918340 14.124001
3 Northern 37.816827 4.999041 22.870402
4 North West 43.806241 5.881985 28.859815
5 Yorkshire 44.073211 5.785198 29.126786
6 N Wales & Mersey 45.512765 5.928967 30.566339
7 East Midlands 47.501489 6.345087 32.555063
8 Midlands 48.796991 6.732502 33.850566
9 Eastern 49.428549 7.157677 34.482123
10 South Wales 45.804410 5.552697 30.857984
11 South East 52.110398 7.713198 37.163973
12 London 54.906683 6.106170 39.960257
13 Southern 53.419807 7.317489 38.473382
14 South Western 51.867520 7.560093 36.921094
Tariffs include small gen tariff of: 0.593000 0.080127
Residual charge for demand: 46.933426£

NGET: Final TNUoS Tariffs for 2018/19 January 2018 9
Changes since the previous demand tariffs forecast
There has been very minimal change in all demand tariffs since our Draft tariffs. A slight change to the network model including parameters of the HVDC has caused some very minor changes to demand tariffs in Scotland. Changes in some of the local circuit tariffs as well as the increase in revenue to be recovered from demand have also contributed to these tariff variations. Overall, the average demand tariff for HH has increased by less than £0.01/kW. The average NHH tariff has only changed in the fourth decimal place. The average EET is £26.91/kW, also increasing by less than £0.01/kW since Draft tariffs. Our forecast predicts that this will result in £175.4m to be paid to embedded generators and suppliers, a very small increase of less than £0.1m since Draft tariffs. Gross half hourly demand tariffs
Table 3 show the gross HH demand 2018/19 Final tariffs, compared to the Draft tariffs with the CMP264/265 methodology applied in both.
Table 3 – Gross HH demand tariffs
The breakdown of the HH tariff into the peak and year-round components can be found in Appendix A.
The largest tariff change has been in Zone 2 (Southern Scotland) where the tariff has increased by £0.012/kW. This is a 0.04% change since Draft tariffs. The HH charging base remains unchanged since the Draft tariffs. The small change in the residual is due to slightly more revenue being recovered from locational tariffs and the marginal increase in credit from the embedded export tariff , as well as a £0.1m increase in overall revenue to be recovered from demand.
Zone Zone Name2018/19 Draft
(£/kW)
2018/19 Final
(£/kW)
Change
(£/kW)
Change in
Residual (£/kW)
1 Northern Scotland 26.298678 26.304232 0.005554 -0.004414
2 Southern Scotland 29.058761 29.070427 0.011666 -0.004414
3 Northern 37.816645 37.816827 0.000182 -0.004414
4 North West 43.804081 43.806241 0.002160 -0.004414
5 Yorkshire 44.071351 44.073211 0.001860 -0.004414
6 N Wales & Mersey 45.509619 45.512765 0.003146 -0.004414
7 East Midlands 47.499335 47.501489 0.002154 -0.004414
8 Midlands 48.794504 48.796991 0.002487 -0.004414
9 Eastern 49.426516 49.428549 0.002033 -0.004414
10 South Wales 45.802151 45.804410 0.002259 -0.004414
11 South East 52.108295 52.110398 0.002103 -0.004414
12 London 54.904610 54.906683 0.002073 -0.004414
13 Southern 53.417644 53.419807 0.002163 -0.004414
14 South Western 51.865303 51.867520 0.002217 -0.004414
NGET: Final TNUoS Tariffs for 2018/19 January 2018 10
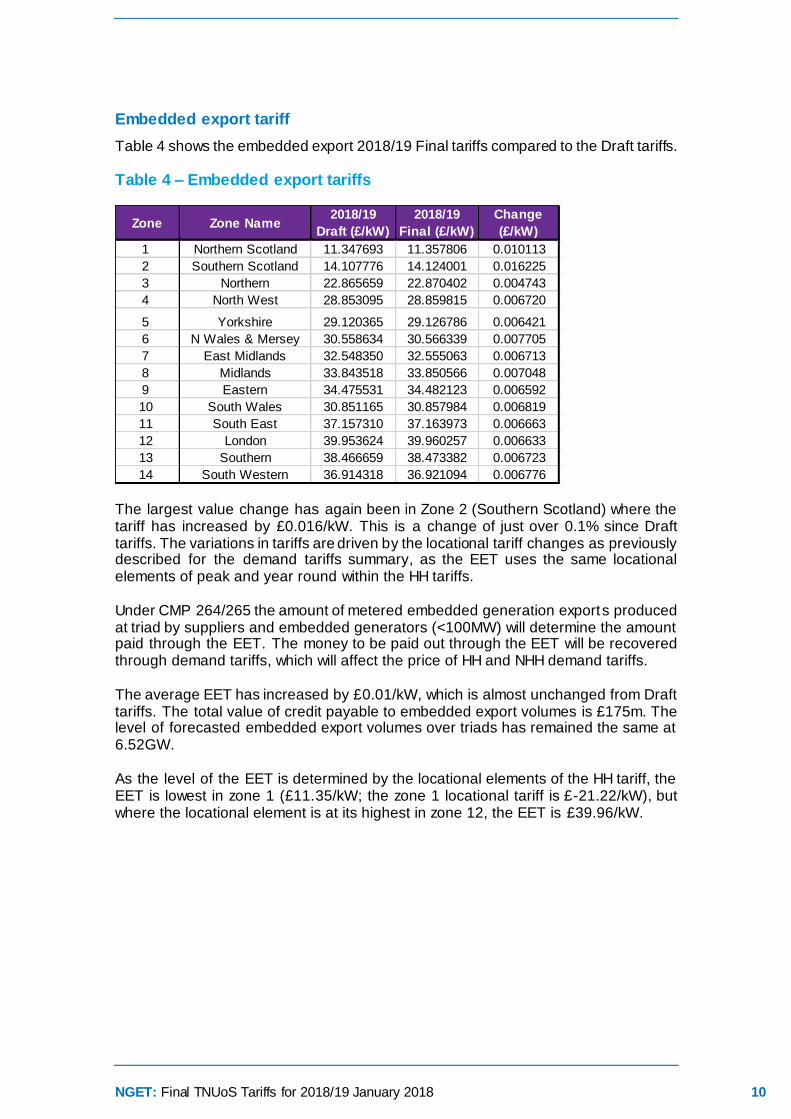
Embedded export tariff
Table 4 shows the embedded export 2018/19 Final tariffs compared to the Draft tariffs.
Table 4 – Embedded export tariffs
The largest value change has again been in Zone 2 (Southern Scotland) where the tariff has increased by £0.016/kW. This is a change of just over 0.1% since Draft tariffs. The variations in tariffs are driven by the locational tariff changes as previously described for the demand tariffs summary, as the EET uses the same locational elements of peak and year round within the HH tariffs. Under CMP 264/265 the amount of metered embedded generation exports produced at triad by suppliers and embedded generators (<100MW) will determine the amount paid through the EET. The money to be paid out through the EET will be recovered through demand tariffs, which will affect the price of HH and NHH demand tariffs. The average EET has increased by £0.01/kW, which is almost unchanged from Draft tariffs. The total value of credit payable to embedded export volumes is £175m. The level of forecasted embedded export volumes over triads has remained the same at 6.52GW. As the level of the EET is determined by the locational elements of the HH tariff, the EET is lowest in zone 1 (£11.35/kW; the zone 1 locational tariff is £-21.22/kW), but where the locational element is at its highest in zone 12, the EET is £39.96/kW.
Zone Zone Name2018/19
Draft (£/kW)
2018/19
Final (£/kW)
Change
(£/kW)
1 Northern Scotland 11.347693 11.357806 0.010113
2 Southern Scotland 14.107776 14.124001 0.016225
3 Northern 22.865659 22.870402 0.004743
4 North West 28.853095 28.859815 0.006720
5 Yorkshire 29.120365 29.126786 0.006421
6 N Wales & Mersey 30.558634 30.566339 0.007705
7 East Midlands 32.548350 32.555063 0.006713
8 Midlands 33.843518 33.850566 0.007048
9 Eastern 34.475531 34.482123 0.006592
10 South Wales 30.851165 30.857984 0.006819
11 South East 37.157310 37.163973 0.006663
12 London 39.953624 39.960257 0.006633
13 Southern 38.466659 38.473382 0.006723
14 South Western 36.914318 36.921094 0.006776
NGET: Final TNUoS Tariffs for 2018/19 January 2018 11
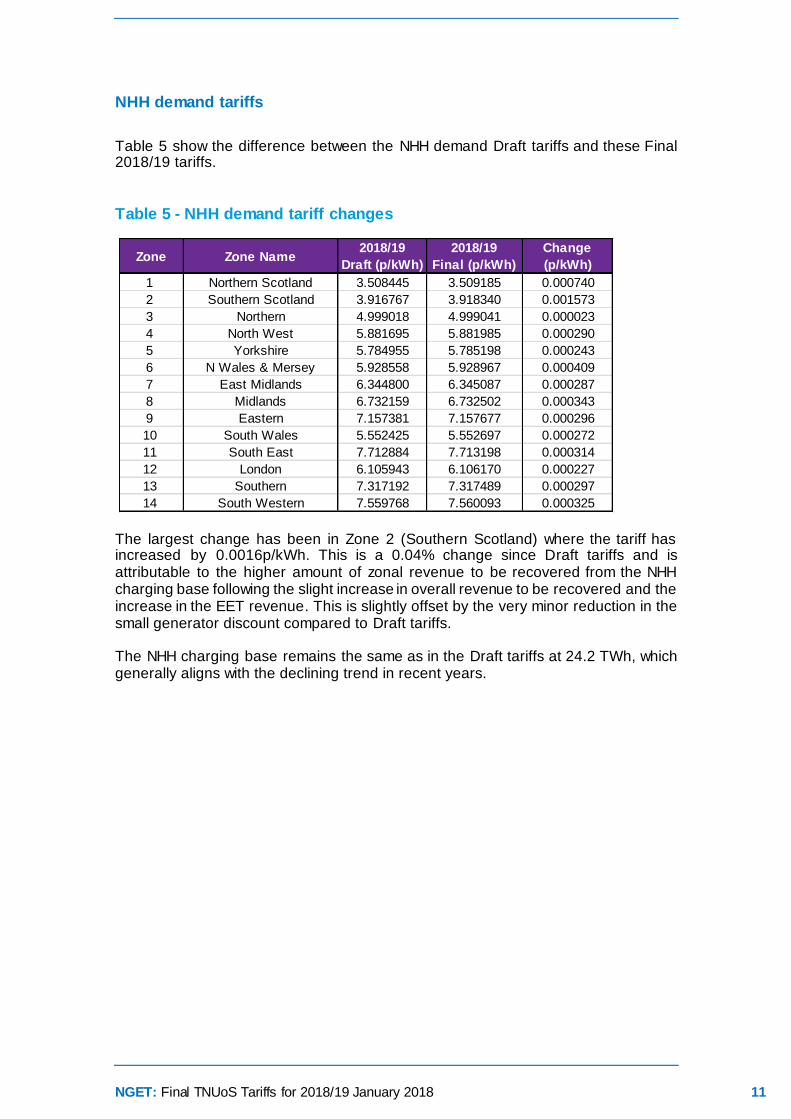
NHH demand tariffs
Table 5 show the difference between the NHH demand Draft tariffs and these Final 2018/19 tariffs.
Table 5 - NHH demand tariff changes
The largest change has been in Zone 2 (Southern Scotland) where the tariff has increased by 0.0016p/kWh. This is a 0.04% change since Draft tariffs and is attributable to the higher amount of zonal revenue to be recovered from the NHH charging base following the slight increase in overall revenue to be recovered and the increase in the EET revenue. This is slightly offset by the very minor reduction in the small generator discount compared to Draft tariffs. The NHH charging base remains the same as in the Draft tariffs at 24.2 TWh, which generally aligns with the declining trend in recent years.
Zone Zone Name2018/19
Draft (p/kWh)
2018/19
Final (p/kWh)
Change
(p/kWh)
1 Northern Scotland 3.508445 3.509185 0.000740
2 Southern Scotland 3.916767 3.918340 0.001573
3 Northern 4.999018 4.999041 0.000023
4 North West 5.881695 5.881985 0.000290
5 Yorkshire 5.784955 5.785198 0.000243
6 N Wales & Mersey 5.928558 5.928967 0.000409
7 East Midlands 6.344800 6.345087 0.000287
8 Midlands 6.732159 6.732502 0.000343
9 Eastern 7.157381 7.157677 0.000296
10 South Wales 5.552425 5.552697 0.000272
11 South East 7.712884 7.713198 0.000314
12 London 6.105943 6.106170 0.000227
13 Southern 7.317192 7.317489 0.000297
14 South Western 7.559768 7.560093 0.000325

NGET: Final TNUoS Tariffs for 2018/19 January 2018 12
Generation Tariffs
This section summarises the Final generation tariffs for 2018/19, how these tariffs were calculated and how they have changed from the Draft tariffs.
Table 6 – Summary of generation tariffs
On average, generation tariffs are only slightly changed since Draft tariffs, as there have only been HVDC and local circuit changes. An increase of 16MW of chargeable generation since Draft tariffs results in a small decrease in the residual.
Generation wider tariffs
The following section provides a summary of how the wider generation tariffs have changed between the Draft tariffs and this Final tariffs report, by comparing the example tariffs for Conventional Carbon generators with an ALF of 80%, Conventional Low Carbon generators with an ALF of 80%, and Intermittent generators with an ALF of 40%. Under the current methodology each generator has its own load factor as listed in Appendix C. These ALFs were published in December 2017 and are unchanged.
The classifications for different technology types are shown below:
Conventional Carbon Conventional Low Carbon Intermittent
Biomass
CCGT/CHP
Coal
OCGT/Oil
Pumped storage
Nuclear
Hydro
Offshore wind
Onshore wind
Tidal
The 80% and 40% load factors used in this table are for illustration only.
Generation Tariffs2018/19
Draft
2018/19
Final
Change since
last forecast
Residual -2.517938 -2.524518 -0.006580
Average Generation Tariff 5.980623 5.979268 -0.001355

NGET: Final TNUoS Tariffs for 2018/19 January 2018 13
Table 7 - Generation wider tariffs
Changes since the last generation tariffs forecast
The following section provides details of the wider and local generation tariffs for
2018/19 and how these have changed compared with the Draft tariffs.
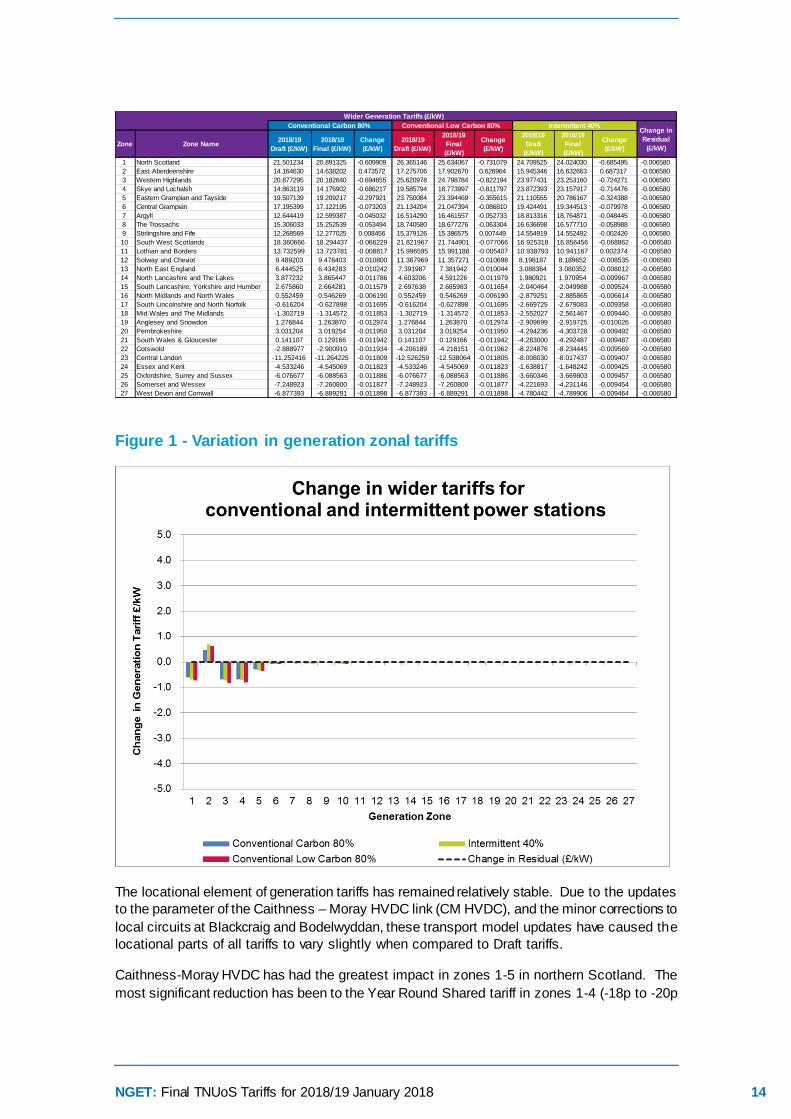
Generation wider zonal tariffs
Table 8 and Figure 4 show the changes in generation wider TNUoS tariffs between the Draft tariffs and these Final 2018/19 tariffs.
Table 8 – Generation tariff changes
The table and graph below show the change in the example Conventional Carbon, Conventional Low Carbon and Intermittent tariffs. The Conventional tariffs use a n illustrative load factor of 80%, and the Intermittent tariff uses a 40% load factor as an example.
System
Peak
Shared
Year Round
Not Shared
Year RoundResidual
Conventional
Carbon 80%
Conventional Low
Carbon 80%Intermittent 40%
Zone Zone NameTariff
(£/kW)
Tariff
(£/kW)
Tariff
(£/kW)
Tariff
(£/kW)
Tariff
(£/kW)
Tariff
(£/kW)
Tariff
(£/kW)
1 North Scotland -1.224803 7.087100 23.713708 -2.524518 20.891325 25.634067 24.024030
2 East Aberdeenshire -1.564833 7.087100 16.322341 -2.524518 14.638202 17.902670 16.632663
3 Western Highlands -1.151336 6.742400 23.080718 -2.524518 20.182640 24.798784 23.253160
4 Skye and Lochalsh -7.080880 6.742400 22.985475 -2.524518 14.176902 18.773997 23.157917
5 Eastern Grampian and Tayside 0.223873 5.961071 20.926257 -2.524518 19.209217 23.394469 20.786167
6 Central Grampian -0.540154 5.607589 19.625995 -2.524518 17.122195 21.047394 19.344513
7 Argyll -4.281853 4.946349 19.310849 -2.524518 12.599387 16.461557 18.764871
8 The Trossachs 0.121027 4.946349 17.123688 -2.524518 15.252539 18.677276 16.577710
9 Stirlingshire and Fife -0.695178 3.823151 15.547750 -2.524518 12.277025 15.386575 14.552492
10 South West Scotlands 2.759793 5.321630 17.252322 -2.524518 18.294437 21.744901 16.856456
11 Lothian and Borders 2.921369 5.321630 11.337033 -2.524518 13.723781 15.991188 10.941167
12 Solway and Cheviot 1.847792 3.299568 9.394343 -2.524518 9.478403 11.357271 8.189652
13 North East England 3.435017 2.166433 4.738297 -2.524518 6.434283 7.381942 3.080352
14 North Lancashire and The Lakes 1.753699 2.166433 3.628899 -2.524518 3.865447 4.591226 1.970954
15 South Lancashire, Yorkshire and Humber 4.369952 0.915048 0.108511 -2.524518 2.664281 2.685983 -2.049988
16 North Midlands and North Wales 3.793481 -0.903367 0.000000 -2.524518 0.546269 0.546269 -2.885865
17 South Lincolnshire and North Norfolk 2.205750 -0.386413 0.000000 -2.524518 -0.627898 -0.627898 -2.679083
18 Mid Wales and The Midlands 1.283844 -0.092373 0.000000 -2.524518 -1.314572 -1.314572 -2.561467
19 Anglesey and Snowdon 4.578802 -0.988018 0.000000 -2.524518 1.263870 1.263870 -2.919725
20 Pembrokeshire 9.102191 -4.448024 0.000000 -2.524518 3.019254 3.019254 -4.303728
21 South Wales & Gloucester 6.189622 -4.419923 0.000000 -2.524518 0.129166 0.129166 -4.292487
22 Cotswold 3.140018 2.190690 -6.586203 -2.524518 -2.900910 -4.218151 -8.234445
23 Central London -5.396903 2.190690 -6.369195 -2.524518 -11.264225 -12.538064 -8.017437
24 Essex and Kent -3.773103 2.190690 0.000000 -2.524518 -4.545069 -4.545069 -1.648242
25 Oxfordshire, Surrey and Sussex -1.273475 -2.863212 0.000000 -2.524518 -6.088563 -6.088563 -3.669803
26 Somerset and Wessex -1.323025 -4.266571 0.000000 -2.524518 -7.260800 -7.260800 -4.231146
27 West Devon and Cornwall 0.166003 -5.663470 0.000000 -2.524518 -6.889291 -6.889291 -4.789906
11.102227Small Generation Discount (£/kW)
Example tariffs for a generator of each technology type:
NGET: Final TNUoS Tariffs for 2018/19 January 2018 14
Figure 1 - Variation in generation zonal tariffs
The locational element of generation tariffs has remained relatively stable. Due to the updates
to the parameter of the Caithness – Moray HVDC link (CM HVDC), and the minor corrections to
local circuits at Blackcraig and Bodelwyddan, these transport model updates have caused the
locational parts of all tariffs to vary slightly when compared to Draft tariffs.
Caithness-Moray HVDC has had the greatest impact in zones 1-5 in northern Scotland. The
most significant reduction has been to the Year Round Shared tariff in zones 1-4 (-18p to -20p
Zone Zone Name2018/19
Draft (£/kW)
2018/19
Final (£/kW)
Change
(£/kW)
2018/19
Draft (£/kW)
2018/19
Final
(£/kW)
Change
(£/kW)
2018/19
Draft
(£/kW)
2018/19
Final
(£/kW)
Change
(£/kW)
1 North Scotland 21.501234 20.891325 -0.609909 26.365146 25.634067 -0.731079 24.709525 24.024030 -0.685495 -0.006580
2 East Aberdeenshire 14.164630 14.638202 0.473572 17.275706 17.902670 0.626964 15.945346 16.632663 0.687317 -0.006580
3 Western Highlands 20.877295 20.182640 -0.694655 25.620978 24.798784 -0.822194 23.977431 23.253160 -0.724271 -0.006580
4 Skye and Lochalsh 14.863119 14.176902 -0.686217 19.585794 18.773997 -0.811797 23.872393 23.157917 -0.714476 -0.006580
5 Eastern Grampian and Tayside 19.507139 19.209217 -0.297921 23.750084 23.394469 -0.355615 21.110555 20.786167 -0.324388 -0.006580
6 Central Grampian 17.195399 17.122195 -0.073203 21.134204 21.047394 -0.086810 19.424491 19.344513 -0.079978 -0.006580
7 Argyll 12.644419 12.599387 -0.045032 16.514290 16.461557 -0.052733 18.813316 18.764871 -0.048445 -0.006580
8 The Trossachs 15.306033 15.252539 -0.053494 18.740580 18.677276 -0.063304 16.636698 16.577710 -0.058988 -0.006580
9 Stirlingshire and Fife 12.268569 12.277025 0.008456 15.379126 15.386575 0.007449 14.554919 14.552492 -0.002426 -0.006580
10 South West Scotlands 18.360666 18.294437 -0.066229 21.821967 21.744901 -0.077066 16.925318 16.856456 -0.068862 -0.006580
11 Lothian and Borders 13.732599 13.723781 -0.008817 15.996595 15.991188 -0.005407 10.938793 10.941167 0.002374 -0.006580
12 Solway and Cheviot 9.489203 9.478403 -0.010800 11.367969 11.357271 -0.010698 8.198187 8.189652 -0.008535 -0.006580
13 North East England 6.444525 6.434283 -0.010242 7.391987 7.381942 -0.010044 3.088364 3.080352 -0.008012 -0.006580
14 North Lancashire and The Lakes 3.877232 3.865447 -0.011786 4.603206 4.591226 -0.011979 1.980921 1.970954 -0.009967 -0.006580
15 South Lancashire, Yorkshire and Humber 2.675860 2.664281 -0.011579 2.697638 2.685983 -0.011654 -2.040464 -2.049988 -0.009524 -0.006580
16 North Midlands and North Wales 0.552459 0.546269 -0.006190 0.552459 0.546269 -0.006190 -2.879251 -2.885865 -0.006614 -0.006580
17 South Lincolnshire and North Norfolk -0.616204 -0.627898 -0.011695 -0.616204 -0.627898 -0.011695 -2.669725 -2.679083 -0.009358 -0.006580
18 Mid Wales and The Midlands -1.302719 -1.314572 -0.011853 -1.302719 -1.314572 -0.011853 -2.552027 -2.561467 -0.009440 -0.006580
19 Anglesey and Snowdon 1.276844 1.263870 -0.012974 1.276844 1.263870 -0.012974 -2.909699 -2.919725 -0.010026 -0.006580
20 Pembrokeshire 3.031204 3.019254 -0.011950 3.031204 3.019254 -0.011950 -4.294236 -4.303728 -0.009492 -0.006580
21 South Wales & Gloucester 0.141107 0.129166 -0.011942 0.141107 0.129166 -0.011942 -4.283000 -4.292487 -0.009487 -0.006580
22 Cotswold -2.888977 -2.900910 -0.011934 -4.206189 -4.218151 -0.011962 -8.224876 -8.234445 -0.009569 -0.006580
23 Central London -11.252416 -11.264225 -0.011809 -12.526259 -12.538064 -0.011805 -8.008030 -8.017437 -0.009407 -0.006580
24 Essex and Kent -4.533246 -4.545069 -0.011823 -4.533246 -4.545069 -0.011823 -1.638817 -1.648242 -0.009425 -0.006580
25 Oxfordshire, Surrey and Sussex -6.076677 -6.088563 -0.011886 -6.076677 -6.088563 -0.011886 -3.660346 -3.669803 -0.009457 -0.006580
26 Somerset and Wessex -7.248923 -7.260800 -0.011877 -7.248923 -7.260800 -0.011877 -4.221693 -4.231146 -0.009454 -0.006580
27 West Devon and Cornwall -6.877393 -6.889291 -0.011898 -6.877393 -6.889291 -0.011898 -4.780442 -4.789906 -0.009464 -0.006580
Wider Generation Tariffs (£/kW)
Conventional Carbon 80% Intermittent 40%Change in
Residual
(£/kW)
Conventional Low Carbon 80%

NGET: Final TNUoS Tariffs for 2018/19 January 2018 15
per kW) and to the Year Round Not Shared tariff (zones 1, 3 and 4 reduce by 60p-64p; zone 2
increases by 77p, zone 5 reduces by 29p per kW).
Elsewhere, the Peak tariff has increased in zone 12 onwards by 0.03p to 0.05p per kW, this is
offset by the Year Round Shared tariff which has reduced by 0.01p to 0.7p per kW.
NGET: Final TNUoS Tariffs for 2018/19 January 2018 16
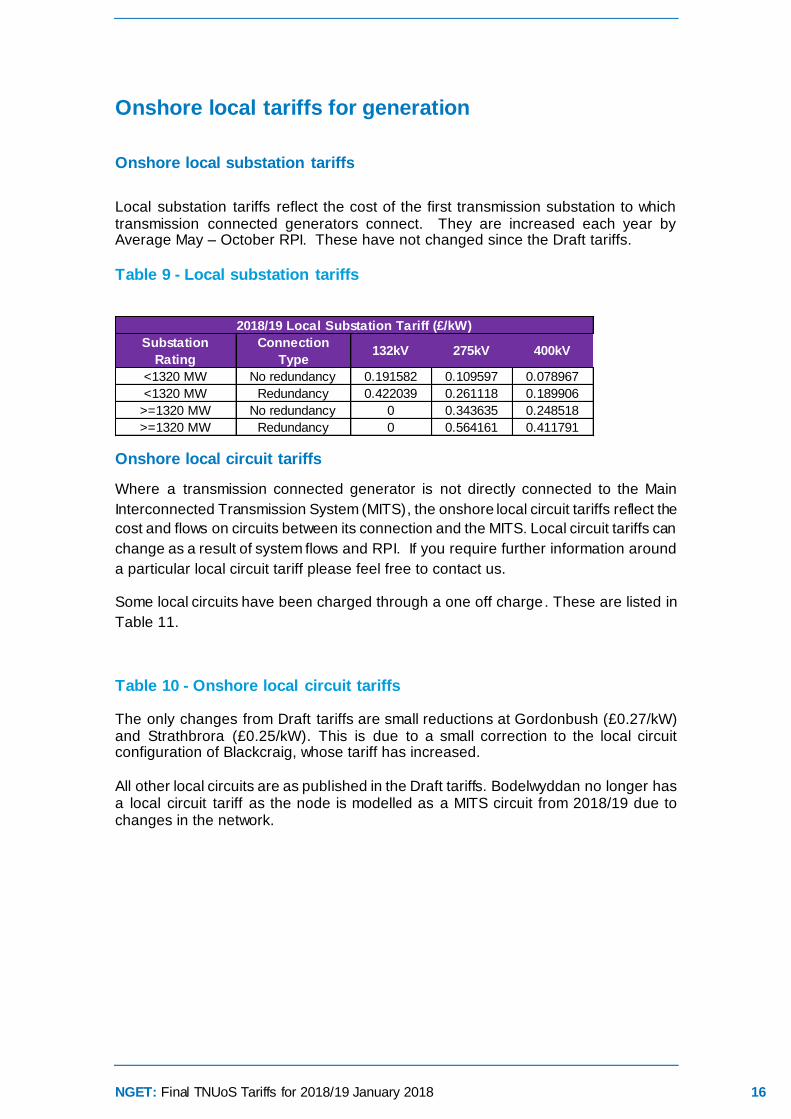
Onshore local tariffs for generation
Onshore local substation tariffs
Local substation tariffs reflect the cost of the first transmission substation to which transmission connected generators connect. They are increased each year by Average May – October RPI. These have not changed since the Draft tariffs.
Table 9 - Local substation tariffs
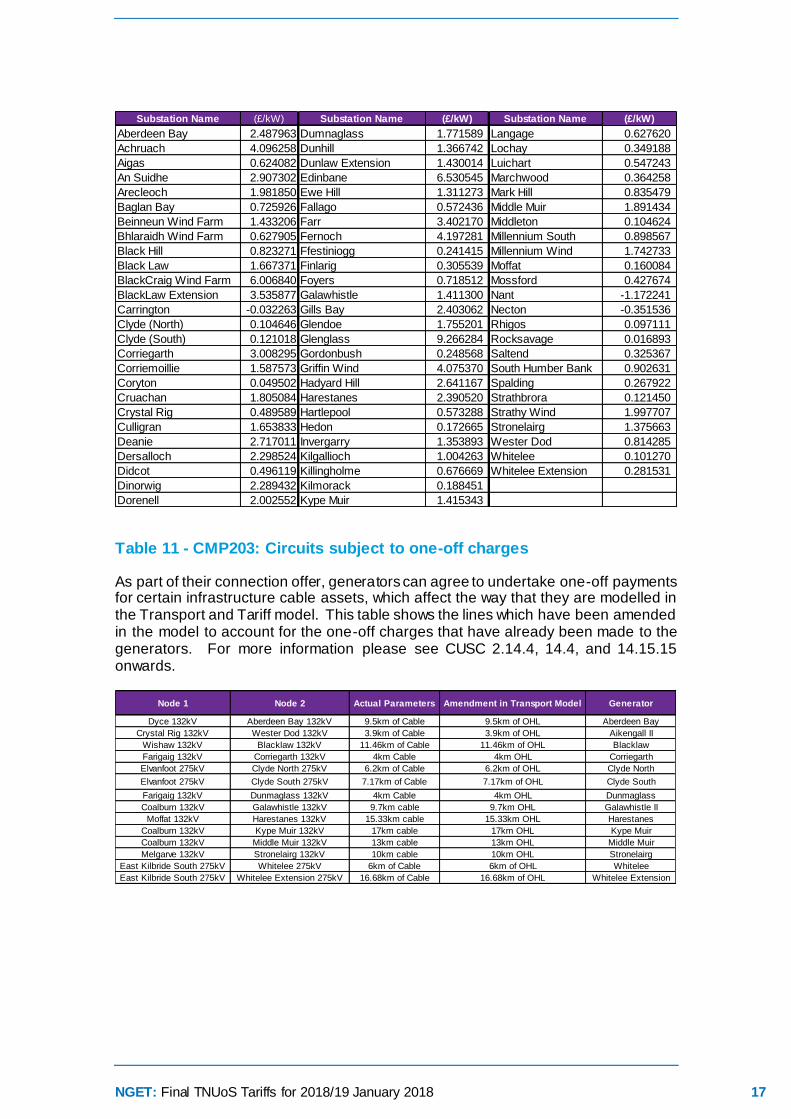
Onshore local circuit tariffs
Where a transmission connected generator is not directly connected to the Main
Interconnected Transmission System (MITS), the onshore local circuit tariffs reflect the
cost and flows on circuits between its connection and the MITS. Local circuit tariffs can
change as a result of system flows and RPI. If you require further information around
a particular local circuit tariff please feel free to contact us.
Some local circuits have been charged through a one off charge. These are listed in
Table 11.
Table 10 - Onshore local circuit tariffs
The only changes from Draft tariffs are small reductions at Gordonbush (£0.27/kW) and Strathbrora (£0.25/kW). This is due to a small correction to the local circuit configuration of Blackcraig, whose tariff has increased. All other local circuits are as published in the Draft tariffs. Bodelwyddan no longer has a local circuit tariff as the node is modelled as a MITS circuit from 2018/19 due to changes in the network.
<1320 MW No redundancy 0.191582 0.109597 0.078967
<1320 MW Redundancy 0.422039 0.261118 0.189906
>=1320 MW No redundancy 0 0.343635 0.248518
>=1320 MW Redundancy 0 0.564161 0.411791
Substation
Rating
Connection
Type
2018/19 Local Substation Tariff (£/kW)
132kV 275kV 400kV
NGET: Final TNUoS Tariffs for 2018/19 January 2018 17
Table 11 - CMP203: Circuits subject to one-off charges
As part of their connection offer, generators can agree to undertake one-off payments for certain infrastructure cable assets, which affect the way that they are modelled in the Transport and Tariff model. This table shows the lines which have been amended in the model to account for the one-off charges that have already been made to the generators. For more information please see CUSC 2.14.4, 14.4, and 14.15.15 onwards.
Substation Name (£/kW) Substation Name (£/kW) Substation Name (£/kW)
Aberdeen Bay 2.487963 Dumnaglass 1.771589 Langage 0.627620
Achruach 4.096258 Dunhill 1.366742 Lochay 0.349188
Aigas 0.624082 Dunlaw Extension 1.430014 Luichart 0.547243
An Suidhe 2.907302 Edinbane 6.530545 Marchwood 0.364258
Arecleoch 1.981850 Ewe Hill 1.311273 Mark Hill 0.835479
Baglan Bay 0.725926 Fallago 0.572436 Middle Muir 1.891434
Beinneun Wind Farm 1.433206 Farr 3.402170 Middleton 0.104624
Bhlaraidh Wind Farm 0.627905 Fernoch 4.197281 Millennium South 0.898567
Black Hill 0.823271 Ffestiniogg 0.241415 Millennium Wind 1.742733
Black Law 1.667371 Finlarig 0.305539 Moffat 0.160084
BlackCraig Wind Farm 6.006840 Foyers 0.718512 Mossford 0.427674
BlackLaw Extension 3.535877 Galawhistle 1.411300 Nant -1.172241
Carrington -0.032263 Gills Bay 2.403062 Necton -0.351536
Clyde (North) 0.104646 Glendoe 1.755201 Rhigos 0.097111
Clyde (South) 0.121018 Glenglass 9.266284 Rocksavage 0.016893
Corriegarth 3.008295 Gordonbush 0.248568 Saltend 0.325367
Corriemoillie 1.587573 Griffin Wind 4.075370 South Humber Bank 0.902631
Coryton 0.049502 Hadyard Hill 2.641167 Spalding 0.267922
Cruachan 1.805084 Harestanes 2.390520 Strathbrora 0.121450
Crystal Rig 0.489589 Hartlepool 0.573288 Strathy Wind 1.997707
Culligran 1.653833 Hedon 0.172665 Stronelairg 1.375663
Deanie 2.717011 Invergarry 1.353893 Wester Dod 0.814285
Dersalloch 2.298524 Kilgallioch 1.004263 Whitelee 0.101270
Didcot 0.496119 Killingholme 0.676669 Whitelee Extension 0.281531
Dinorwig 2.289432 Kilmorack 0.188451
Dorenell 2.002552 Kype Muir 1.415343
Node 1 Node 2 Actual Parameters Amendment in Transport Model Generator
Dyce 132kV Aberdeen Bay 132kV 9.5km of Cable 9.5km of OHL Aberdeen Bay
Crystal Rig 132kV Wester Dod 132kV 3.9km of Cable 3.9km of OHL Aikengall II
Wishaw 132kV Blacklaw 132kV 11.46km of Cable 11.46km of OHL Blacklaw
Farigaig 132kV Corriegarth 132kV 4km Cable 4km OHL Corriegarth
Elvanfoot 275kV Clyde North 275kV 6.2km of Cable 6.2km of OHL Clyde North
Elvanfoot 275kV Clyde South 275kV 7.17km of Cable 7.17km of OHL Clyde South
Farigaig 132kV Dunmaglass 132kV 4km Cable 4km OHL Dunmaglass
Coalburn 132kV Galawhistle 132kV 9.7km cable 9.7km OHL Galawhistle II
Moffat 132kV Harestanes 132kV 15.33km cable 15.33km OHL Harestanes
Coalburn 132kV Kype Muir 132kV 17km cable 17km OHL Kype Muir
Coalburn 132kV Middle Muir 132kV 13km cable 13km OHL Middle Muir
Melgarve 132kV Stronelairg 132kV 10km cable 10km OHL Stronelairg
East Kilbride South 275kV Whitelee 275kV 6km of Cable 6km of OHL Whitelee
East Kilbride South 275kV Whitelee Extension 275kV 16.68km of Cable 16.68km of OHL Whitelee Extension

NGET: Final TNUoS Tariffs for 2018/19 January 2018 18
Offshore local tariffs for generation
Offshore local generation tariffs
The local offshore tariffs (substation, circuit and ETUoS) reflect the cost of offshore networks connecting offshore generation. They are calculated at the beginning of price review or on transfer to the offshore transmission owner (OFTO) and indexed by average May to October RPI each year. These tariffs have not changed since the Draft tariffs in December. Offshore local generation tariffs associated with OFTOs yet to be appointed will be calculated following their appointment.
Table 12 - Offshore Local tariffs 2018/19
Substation Circuit ETUoS
Barrow 7.720148 40.391807 1.002984
Greater Gabbard 14.474370 33.260677 0.000000
Gunfleet 16.708070 15.339316 2.867007
Gwynt Y Mor 17.627466 17.365232 0.000000
Lincs 14.427677 56.487653 0.000000
London Array 9.821298 33.450796 0.000000
Ormonde 23.866552 44.461150 0.354318
Robin Rigg East -0.441499 29.245531 9.064537
Robin Rigg West -0.441499 29.245531 9.064537
Sheringham Shoal 23.059225 27.043069 0.587837
Thanet 17.560438 32.721373 0.787719
Walney 1 20.597966 41.020795 0.000000
Walney 2 20.448162 41.382190 0.000000
West of Duddon Sands 7.948192 39.219404 0.000000
Westermost Rough 16.736222 28.310526 0.000000
Humber Gateway 14.027433 31.650564 0.000000
Offshore GeneratorTariff Component (£/kW)
NGET: Final TNUoS Tariffs for 2018/19 January 2018 19
Background to TNUoS charging
National Grid sets Transmission Network Use of System (TNUoS) tariffs for generators
and suppliers. These tariffs serve two purposes: to reflect the transmission cost of
connecting at different locations and to recover the total allowed revenues of the
onshore and offshore transmission owners.
To reflect the cost of connecting in different parts of the network, National Grid
determines a locational component of TNUoS tariffs using two models of power flows
on the transmission system: peak demand and year round. Where a change in
demand or generation increases power flows, tariffs increase to reflect the need to
invest. Similarly, if a change reduces flows on the network, tariffs are reduced. To
calculate flows on the network, information about the generation and demand
connected to the network is required in conjunction with the electrical characteristics of
the circuits that link these.
The charging model includes information about the cost of investing in transmission
circuits based on different types of generic construction, e.g. voltage and cable /
overhead line, and the costs incurred in different TO regions. Onshore, these costs
are based on ‘standard’ conditions, which means that they reflect the cost of replacing
assets at current rather than historical cost, so they do not necessarily reflect the
actual cost of investment to connect a specific generator or demand site.
The locational component of TNUoS tariffs does not recover the full revenue that
onshore and offshore transmission owners have been allowed in their price controls.
Therefore, to ensure the correct revenue recovery, separate non-locational “residual”
tariff elements are included in the generation and demand tariffs. The residual is also
used to ensure the correct proportion of revenue is collected from generation and
demand. The locational and residual tariff elements are combined into a zonal tariff,
referred to as the wider zonal generation tariff or demand tariff, as appropriate.
For generation customers, local tariffs are also calculated. These reflect the cost
associated with the transmission substation they connect to and, where a generator is
not connected to the main interconnected transmission system (MITS), the cost of
local circuits that the generator uses to export onto the MITS. This allows the charges
to reflect the cost and design of local connections and vary from project to project. For
offshore generators, these local charges reflect OFTO revenue allowances.
Generation charging principles
Generators pay TNUoS (Transmission Network Use of System) tariffs to allow National
Grid as System Operator to recover the capital costs of building and maintaining the
transmission network on behalf of the transmission asset owners (TOs).
The TNUoS tariff specific to each generator depends on many factors, including the
location, type of connection, connection voltage, plant type and volume of TEC
NGET: Final TNUoS Tariffs for 2018/19 January 2018 20
(Transmission Entry Capacity) held by the generator. The TEC figure is equal to the
maximum volume of MW the generator is allowed to output onto the transmission
network.
Under the current methodology there are 27 generation zones, and each zone has
four tariffs. Liability for each tariff component is shown below:
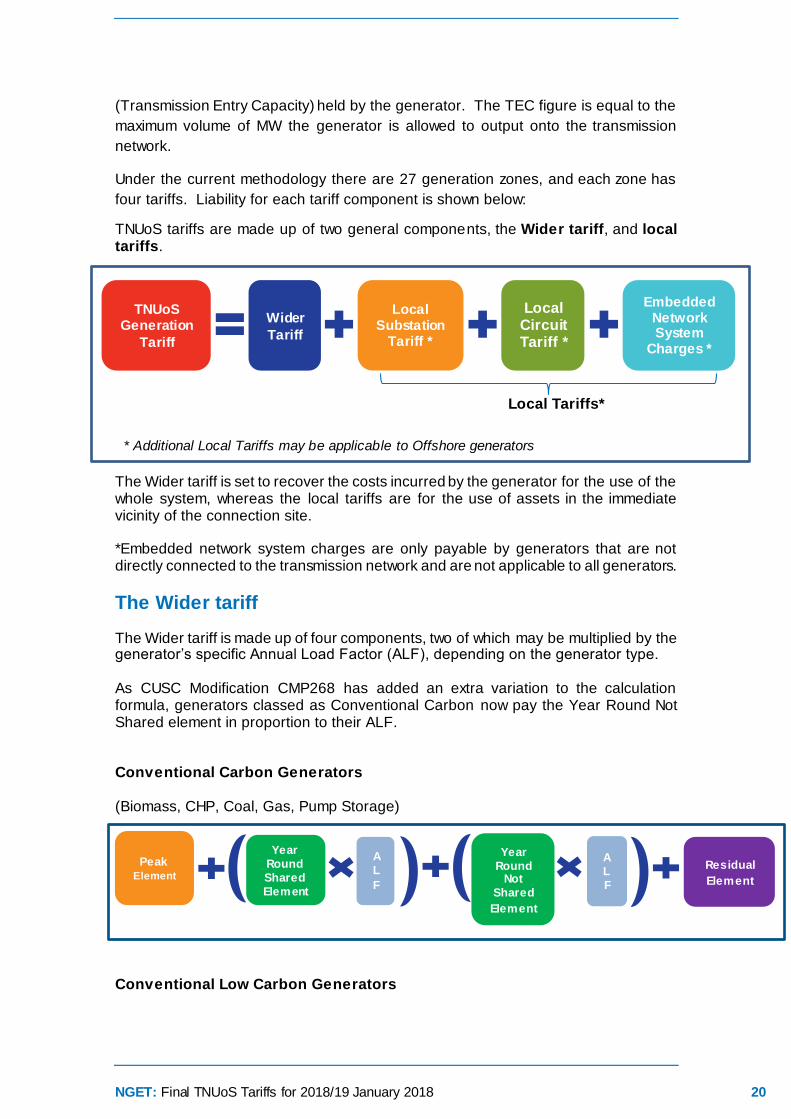
TNUoS tariffs are made up of two general components, the Wider tariff, and local tariffs. The Wider tariff is set to recover the costs incurred by the generator for the use of the whole system, whereas the local tariffs are for the use of assets in the immediate vicinity of the connection site. *Embedded network system charges are only payable by generators that are not directly connected to the transmission network and are not applicable to all generators.
The Wider tariff The Wider tariff is made up of four components, two of which may be multiplied by the generator’s specific Annual Load Factor (ALF), depending on the generator type. As CUSC Modification CMP268 has added an extra variation to the calculation formula, generators classed as Conventional Carbon now pay the Year Round Not Shared element in proportion to their ALF. Conventional Carbon Generators (Biomass, CHP, Coal, Gas, Pump Storage)
Conventional Low Carbon Generators
Peak
Element
Year
Round
Shared
Element
Year
Round Not
Shared
Element
Residual
Element
A
L
F
Wider
Tariff
TNUoS Generation
Tariff
Local Substation
Tariff *
Local Circuit Tariff *
Embedded Network System
Charges *
Local Tariffs*
* Additional Local Tariffs may be applicable to Offshore generators
A
L
F
NGET: Final TNUoS Tariffs for 2018/19 January 2018 21
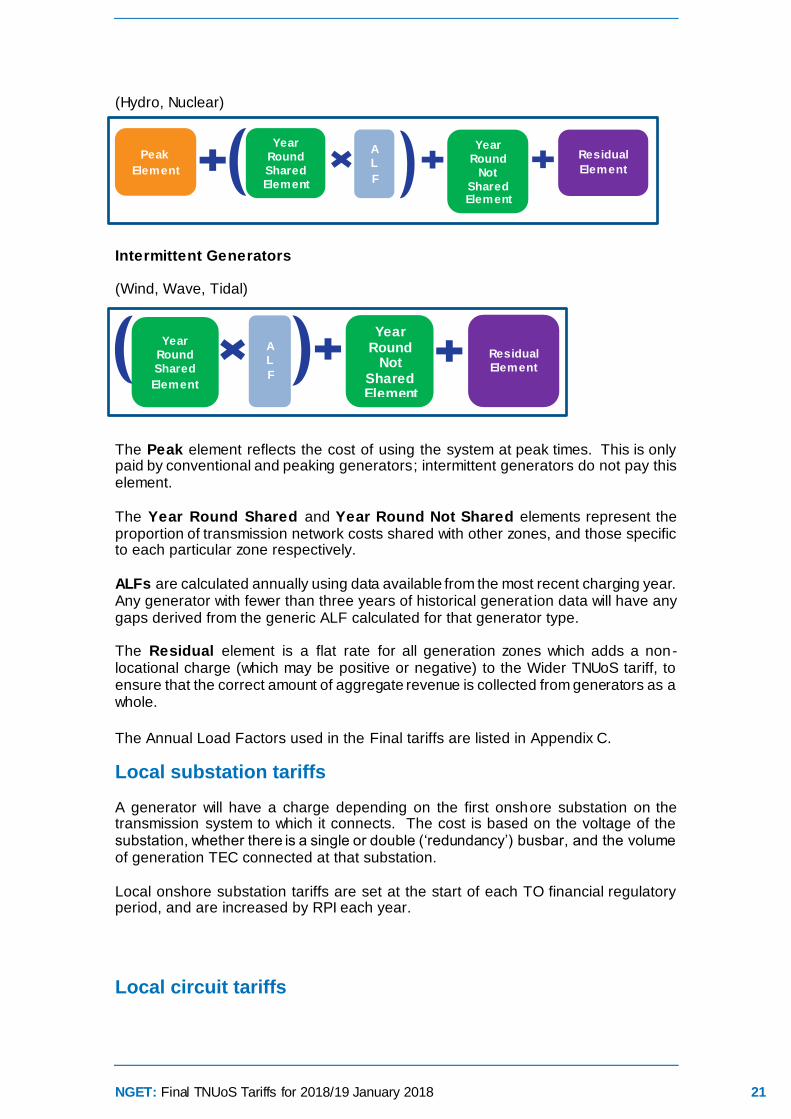
(Hydro, Nuclear)
Intermittent Generators (Wind, Wave, Tidal)
The Peak element reflects the cost of using the system at peak times. This is only paid by conventional and peaking generators; intermittent generators do not pay this element. The Year Round Shared and Year Round Not Shared elements represent the proportion of transmission network costs shared with other zones, and those specific to each particular zone respectively. ALFs are calculated annually using data available from the most recent charging year. Any generator with fewer than three years of historical generat ion data will have any gaps derived from the generic ALF calculated for that generator type. The Residual element is a flat rate for all generation zones which adds a non-locational charge (which may be positive or negative) to the Wider TNUoS tariff, to ensure that the correct amount of aggregate revenue is collected from generators as a whole.
The Annual Load Factors used in the Final tariffs are listed in Appendix C.
Local substation tariffs A generator will have a charge depending on the first onshore substation on the transmission system to which it connects. The cost is based on the voltage of the substation, whether there is a single or double (‘redundancy’) busbar, and the volume of generation TEC connected at that substation. Local onshore substation tariffs are set at the start of each TO financial regulatory period, and are increased by RPI each year.
Local circuit tariffs
Peak
Element
Year
Round
Shared
Element
Year
Round
Not
Shared Element
Residual
Element
A
L
F
Year
Round
Shared
Element
Year Round
Not Shared Element
Residual
Element
A
L
F

NGET: Final TNUoS Tariffs for 2018/19 January 2018 22
If the first onshore substation which the generator connects to is categorised as a MITS (Main Interconnected Transmission System) in accordance with CUSC 14.15.33, then there is no Local Circuit charge. Where the first onshore substation is not classified as MITS, there will be a specific circuit charge for generators connected at that location.
Embedded network system charges If a generator is not connected directly to the transmission network, they will have a BEGA*** allowing them to export power onto the transmission system from the distribution network. Generators will incur local DUoS charges to be paid directly to the DNO (Distribution Network Owner) in that region, which do not form part of TNUoS. Embedded-connected offshore generators will need to pay an estimated DUoS charge to NGET through TNUoS tariffs to cover DNO charges, called ETUoS (Embedded Transportation Use of System). Click here to find out more about DNO regions.
Offshore local tariffs Where an offshore generator’s connection assets have been transferred to the ownership of an OFTO (Offshore Transmission Owner), there will be additional Offshore substation and Offshore circuit tariffs specific to that OFTO.†††
Billing TNUoS is charged annually and costs are calculated on the highest level of TEC held by the generator during the year. (A TNUoS charging year runs from 1 April to 31 March). This means that if a generator holds 100MW in TEC from 1 April to 31 January, then 350MW from 1 February to 31 March, the generator will be charged for 350MW of TEC for that charging year.
The calculation for TNUoS generator liability is as follows:
( (TEC * TNUoS Tariff) - TNUoS charges already paid) Number of months remaining in the charging year
All tariffs are in £/kW of TEC held by the generator. TNUoS charges are billed each month, for the month ahead.
Generators with negative TNUoS tariffs
Where a generator’s specific tariff is negative, the generator will be paid during the year based on their highest TEC for that year. After the end of the year, there is reconciliation, when the true amount to be paid to the generator is recalculated. The value used for this reconciliation is the average output of the generator over the three settlement periods of highest output between 1 November and the end of
***
For more information about connections, please visit our website:
https://www.nationalgrid.com/uk/electricity/connections/applying-connection †††
These specific charges include any onshore local circuit and substation charges.

NGET: Final TNUoS Tariffs for 2018/19 January 2018 23
February of the relevant charging year. Each settlement period must be separated by at least ten clear days. Each peak is capped at the amount of TEC held by the generator, so this number cannot be exceeded. For more details, please see CUSC 14.18.13–17. Demand charging principles
Demand is charged in different ways depending on how the consumption is settled. HH demand customers now have two specific tariffs following the implementation of CMP264/265, which are for gross HH demand and embedded export volumes; NHH customers have another specific tariff. HH gross demand tariffs
HH gross demand tariffs are charged to customers on their metered output during the triads. Triads are the three half hour settlement periods of highest net system demand between November and February inclusive each year. They can occur on any day at any time, but each peak must be separated by at least ten full days. The final triads are usually confirmed at the end of March once final Elexon data is available, via the NGET website.‡‡‡ The tariff is charged on a £/kW basis. On triads, HH customers are charged the HH gross demand tariff against their gross demand volumes. HH metered customers tend to be large industrial users, however as the rollout of smart meters progresses, more domestic demand will become HH metered. Embedded export tariffs
The EET is a new tariff under CMP 264/265 and is paid to customers based on the HH metered export volume during the triads (the same triad periods as explained in detail above). This tariff is payable to exporting HH demand customers and embedded generators (<100MW CVA registered). This tariff contains the locational demand elements, a phased residual over 3 years (reaching £0/kW in 2020/21) and an Avoided GSP Infrastructure Credit. The final zonal EET is floored at £0/kW for the avoidance of negative tariffs and is applied to the metered triad volumes of embedded exports for each demand zone. The money to be paid out through the EET will be recovered through demand tariffs. Customers must now submit forecasts for both HH gross demand and embedded export volumes as to what their expected demand volumes will be. Customers are billed against these forecast volumes, and a reconciliation of the amounts paid against their actual metered output is performed once the final metering data is available from Elexon up to 16 months after the financial year in question. For suppliers any embedded export payment will be fed into a net demand charge (gross demand – payment for embedded export) which will be capped at the level of the total demand charge so not to exceed the demand charge. Embedded generators (<100MW CVA registered) will receive payment following the final reconciliation process for the amount of embedded export during triads.
‡‡‡
http://www2.nationalgrid.com/UK/Industry-information/System-charges/Electricity-transmission/Transmission-Network-Use-of-System-Charges/Transmission-Charges-Triad-Data/
NGET: Final TNUoS Tariffs for 2018/19 January 2018 24
Note: HH demand and embedded export is charged at the GSP, where the transmission network connects to the distribution network, or directly to the customer in question. NHH demand tariffs
NHH metered customers are charged based on their demand usage between 16:00 – 19:00 on every day of the year. Suppliers must submit forecasts throughout the year as to what their expected demand volumes will be in each demand zone. The tariff is charged on a p/kWh basis. The NHH methodology remains the same under CMP264/265. Suppliers are billed against these forecast volumes, and a reconciliation of the amounts paid against their actual metered output is performed once the final metering data is available from Elexon up to 16 months after the financial year in question.

NGET: Final TNUoS Tariffs for 2018/19 January 2018 25
Updates to revenue & the charging model since the last
forecast
Since the Draft tariffs were published, we have updated the allowed revenue for onshore and offshore Transmission Owners, the transport model circuits, the local circuits model and the generation charging bases. There have been no changes to the, transport model demand (the week 24 demand), RPI or the error margin that is used to calculate the proportion of revenue to be recovered from generation and demand (G/D split). Changes affecting the locational element of tariffs
The locational element of generation and demand tariffs is based upon:
The network model;
Contracted generation as of 31 October 2017;
Demand data provided under the Grid Code, which includes week 24 demand
forecast data provided by the Distribution Network Operators (DNO), forecasts
of demand at directly connected demand sites (such as steelworks and
railways and the effect of some embedded generation); and
RPI (which increases the expansion constant).
Of the above elements, only the network model has changed since Draft tariffs.
Changes to the Network Model
The Caithness-Moray HVDC link is expected to be commissioned by the end of 2018, and has therefore been included in the TNUoS transport model for Fina l tariffs. This link allows the transmission of large volumes of electricity between Spittal in Caithness and Blackhillock in Moray. The HVDC converter station at Spittal is rated at 800MW, while the HVDC converter station at Blackhillock is rated at 1200MW. For the TNUoS charging year of 2018/19, only 800MW of the capacity can be fully utilised, therefore we have revised the capacity of the HVDC link from 1200MW (in the draft tariff calculation) to 800MW (in the final tariff calculation). The capacity of the Caithness-Moray link has an impact on wider tariffs, particularly around North Scotland. No further changes have been made to the network model. Contracted and modelled TEC
This was fixed based on the TEC register from 31 October 2017. This has not changed in the Final tariffs compared to the December Draft tariffs. Chargeable TEC has increased by 16MW.

NGET: Final TNUoS Tariffs for 2018/19 January 2018 26
Table 13 – Contracted and modelled TEC
Adjustments for interconnectors
When modelling flows on the transmission system, interconnector flows are not included in the Peak model but are included in the Year Round model. Since interconnectors are not liable for generation or demand TNUoS charges, they are not included in the calculations of chargeable TEC for either the generation or demand charging bases.
Table 14 – Interconnectors
The table below reflects the contracted position of interconnectors in the interconnector register as of 31 October 2017; there has been no change since the June forecast.
Transport Model Demand Data
The transport model uses demand data provided under the Grid Code, which includes week 24 demand forecast data provided by the Distribution Network Operators (DNO), and forecasts of demand at directly connected demand sites (such as steelworks and railways and the effect of some embedded generation). There have been no changes to these forecasts since Draft tariffs. RPI
The RPI index for the components detailed below is calculated based on the average May – October RPI for 2017/18.
Expansion Constant The expansion constant was calculated for the Draft tariffs as £14.08310011. This has not been recalculated in this Final tariffs report.
(GW) 2017/18
2018/19
Initial
Forecast
2018/19
June
Forecast
2018/19
Oct
Forecast
2018/19
Draft
Tariffs
2018/19
Final
Tariffs
Contracted
TEC72.2 79.6 78.8 82.4 79.0 79.0
Modelled
Best View
TEC
72.2 72.6 75.5 79.7 79.0 79.0
Chargeable
TEC67.6 66.8 69.7 75.0 71.9 71.9
Interconnector SiteInterconnected
System
Generation
Zone
Transport Model
(Generation
MW) Peak
Transport Model
(Generation MW)
Year Round
Charging Base
(Generation
MW)
IFA Interconnector Sellindge 400kV France 24 0 2000 0
ElecLink Sellindge 400kV France 24 0 1000 0
Britned Grain 400kV Netherlands 24 0 1200 0
East - West Deesside 400kV Republic of Ireland 16 0 505 0
Moyle Auchencrosh 275kV Northern Ireland 10 0 80 0

NGET: Final TNUoS Tariffs for 2018/19 January 2018 27
Local substation and offshore substation tariffs
Local onshore substation tariffs are indexed by May - October RPI as are offshore local circuit tariffs. These have not changed since the Draft tariffs.
Allowed revenues
National Grid recovers revenue on behalf of all onshore and offshore Transmission Owners (TOs & OFTOs) in Great Britain. Compared to the Draft tariffs, tariffs have now been calculated to recover £2,670.3m of revenue. This is an increase of £0.1m from the Draft tariffs of £2670.2m. Revenue has increased by £0.1m since we calculated the Draft tariffs in December. This is a net effect of an increase of TO Revenues o f £8.7m, a reduction of Ofgem’s Network Innovation Competition funding of £7.8m and other pass-through items such as termination adjustments totalling -£0.8m. Table 15 – Allowed revenues
2017/18
TNUoS
Revenue
Jan
2017
Final
Feb 2017
Initial
View
June
2017
Update
Oct
2017
Update
Dec
2017
Draft
Jan
2018 Final
National Grid
Price controlled revenue 1,748.8 1,727.8 1,719.0 1,647.1 1,652.5 1,653.9
Less income from connections 41.9 41.9 41.9 41.9 41.9 44.0
Income from TNUoS 1,706.9 1,685.9 1,677.2 1,605.2 1,610.7 1,609.9
Scottish Power Transmission
Price controlled revenue 333.7 390.5 377.7 360.5 361.2 364.8
Less income from connections 12.8 26.8 14.0 14.2 14.2 14.9
Income from TNUoS 321.0 363.8 363.8 346.3 347.0 350.0
SHE Transmission
Price controlled revenue 304.7 366.5 366.7 358.6 366.4 369.8
Less income from connections 3.4 3.2 3.6 3.5 3.4 3.4
Income from TNUoS 301.4 363.2 363.1 355.1 363.0 366.4
Offshore 270.2 380.2 373.2 312.1 315.8 318.1
Network Innovation Competition 32.1 40.5 40.5 40.5 40.5 32.7
EDR 2.0 2.0
Interconnectors (Cap & Floor) (6.8) (6.8)
Total to Collect from TNUoS 2,631.5 2,833.6 2,819.8 2,661.3 2,670.2 2,670.3
£m Nominal Value
2018/19 TNUoS Revenue
NGET: Final TNUoS Tariffs for 2018/19 January 2018 28
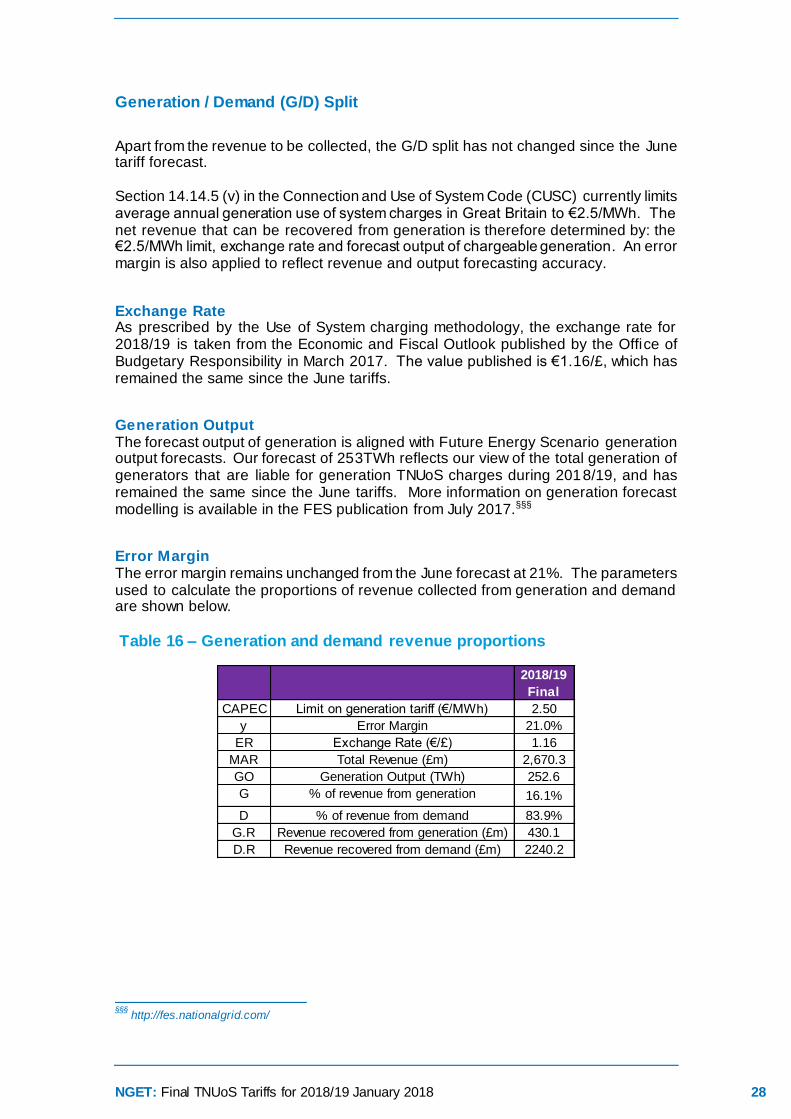
Generation / Demand (G/D) Split
Apart from the revenue to be collected, the G/D split has not changed since the June tariff forecast. Section 14.14.5 (v) in the Connection and Use of System Code (CUSC) currently limits average annual generation use of system charges in Great Britain to €2.5/MWh. The net revenue that can be recovered from generation is therefore determined by: the €2.5/MWh limit, exchange rate and forecast output of chargeable generation. An error margin is also applied to reflect revenue and output forecasting accuracy.
Exchange Rate As prescribed by the Use of System charging methodology, the exchange rate for 2018/19 is taken from the Economic and Fiscal Outlook published by the Office of Budgetary Responsibility in March 2017. The value published is €1.16/£, which has remained the same since the June tariffs.
Generation Output The forecast output of generation is aligned with Future Energy Scenario generation output forecasts. Our forecast of 253TWh reflects our view of the total generation of generators that are liable for generation TNUoS charges during 2018/19, and has remained the same since the June tariffs. More information on generation forecast modelling is available in the FES publication from July 2017.§§§
Error Margin The error margin remains unchanged from the June forecast at 21%. The parameters used to calculate the proportions of revenue collected from generation and demand are shown below.
Table 16 – Generation and demand revenue proportions
§§§
http://fes.nationalgrid.com/
2018/19
Final
CAPEC Limit on generation tariff (€/MWh) 2.50
y Error Margin 21.0%
ER Exchange Rate (€/£) 1.16
MAR Total Revenue (£m) 2,670.3
GO Generation Output (TWh) 252.6
G % of revenue from generation 16.1%
D % of revenue from demand 83.9%
G.R Revenue recovered from generation (£m) 430.1
D.R Revenue recovered from demand (£m) 2240.2
NGET: Final TNUoS Tariffs for 2018/19 January 2018 29
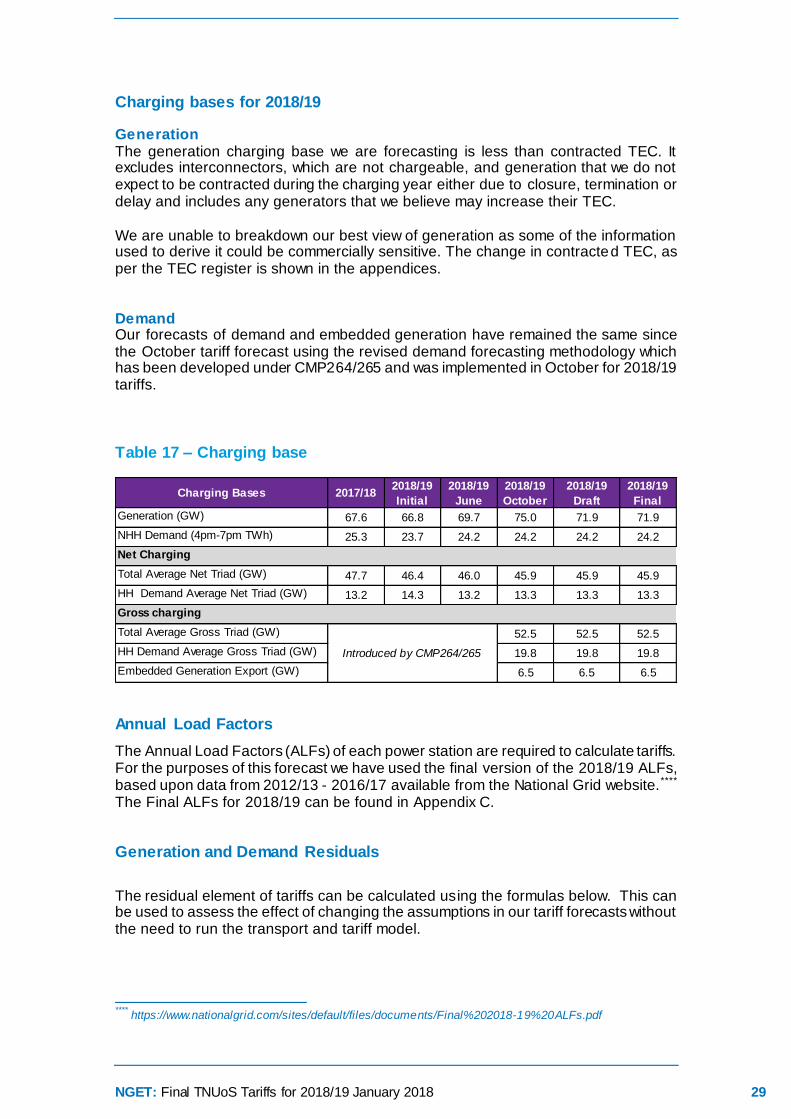
Charging bases for 2018/19
Generation The generation charging base we are forecasting is less than contracted TEC. It excludes interconnectors, which are not chargeable, and generation that we do not expect to be contracted during the charging year either due to closure, termination or delay and includes any generators that we believe may increase their TEC. We are unable to breakdown our best view of generation as some of the information used to derive it could be commercially sensitive. The change in contracted TEC, as per the TEC register is shown in the appendices.
Demand Our forecasts of demand and embedded generation have remained the same since the October tariff forecast using the revised demand forecasting methodology which has been developed under CMP264/265 and was implemented in October for 2018/19 tariffs.
Table 17 – Charging base
Annual Load Factors
The Annual Load Factors (ALFs) of each power station are required to calculate tariffs. For the purposes of this forecast we have used the final version of the 2018/19 ALFs, based upon data from 2012/13 - 2016/17 available from the National Grid website.**** The Final ALFs for 2018/19 can be found in Appendix C. Generation and Demand Residuals
The residual element of tariffs can be calculated using the formulas below. This can be used to assess the effect of changing the assumptions in our tariff forecasts without the need to run the transport and tariff model.
****
https://www.nationalgrid.com/sites/default/files/documents/Final%202018-19%20ALFs.pdf
Charging Bases 2017/182018/19
Initial
2018/19
June
2018/19
October
2018/19
Draft
2018/19
Final
Generation (GW) 67.6 66.8 69.7 75.0 71.9 71.9
NHH Demand (4pm-7pm TWh) 25.3 23.7 24.2 24.2 24.2 24.2
Net Charging
Total Average Net Triad (GW) 47.7 46.4 46.0 45.9 45.9 45.9
HH Demand Average Net Triad (GW) 13.2 14.3 13.2 13.3 13.3 13.3
Gross charging
Total Average Gross Triad (GW) 52.5 52.5 52.5
HH Demand Average Gross Triad (GW) 19.8 19.8 19.8
Embedded Generation Export (GW) 6.5 6.5 6.5
Introduced by CMP264/265
NGET: Final TNUoS Tariffs for 2018/19 January 2018 30
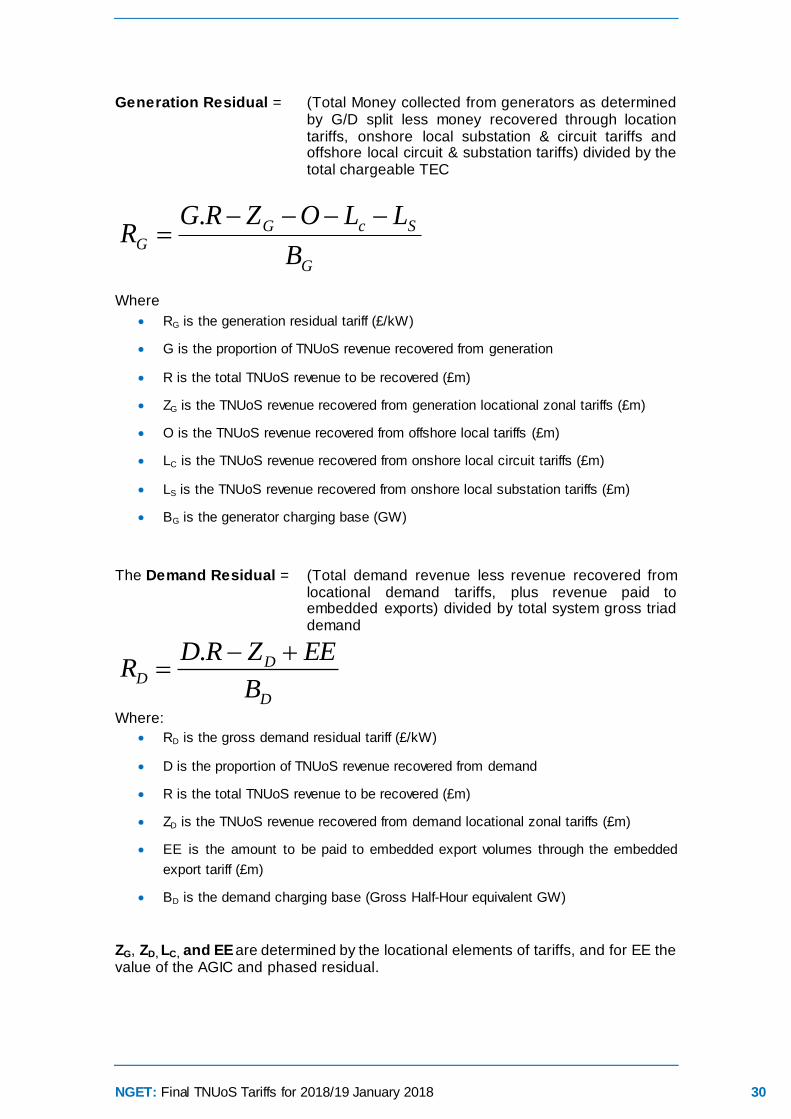
Generation Residual = (Total Money collected from generators as determined by G/D split less money recovered through location tariffs, onshore local substation & circuit tariffs and offshore local circuit & substation tariffs) divided by the total chargeable TEC
G
ScGG
B
LLOZRGR
.
Where
RG is the generation residual tariff (£/kW)
G is the proportion of TNUoS revenue recovered from generation
R is the total TNUoS revenue to be recovered (£m)
ZG is the TNUoS revenue recovered from generation locational zonal tariffs (£m)
O is the TNUoS revenue recovered from offshore local tariffs (£m)
LC is the TNUoS revenue recovered from onshore local circuit tariffs (£m)
LS is the TNUoS revenue recovered from onshore local substation tariffs (£m)
BG is the generator charging base (GW)
The Demand Residual = (Total demand revenue less revenue recovered from
locational demand tariffs, plus revenue paid to embedded exports) divided by total system gross triad demand
D
DD
B
EEZRDR
.
Where:
RD is the gross demand residual tariff (£/kW)
D is the proportion of TNUoS revenue recovered from demand
R is the total TNUoS revenue to be recovered (£m)
ZD is the TNUoS revenue recovered from demand locational zonal tariffs (£m)
EE is the amount to be paid to embedded export volumes through the embedded
export tariff (£m)
BD is the demand charging base (Gross Half-Hour equivalent GW)
ZG, ZD, LC, and EE are determined by the locational elements of tariffs, and for EE the value of the AGIC and phased residual.
NGET: Final TNUoS Tariffs for 2018/19 January 2018 31
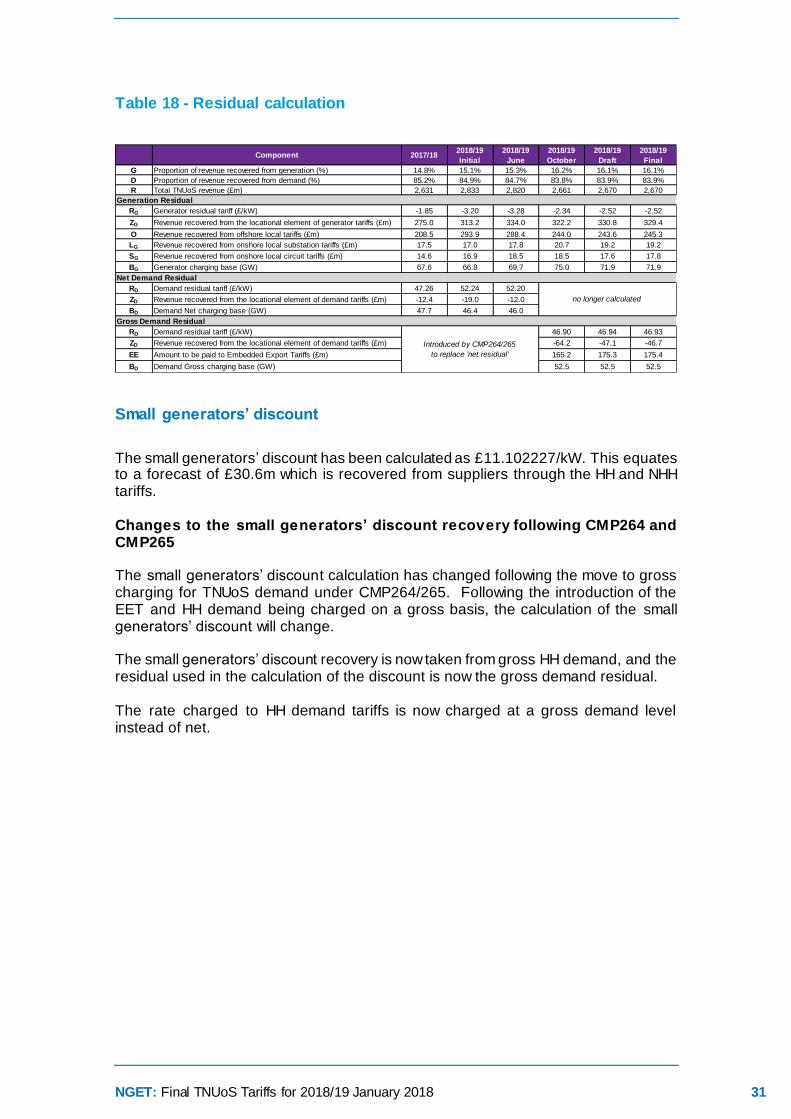
Table 18 - Residual calculation
Small generators’ discount
The small generators’ discount has been calculated as £11.102227/kW. This equates to a forecast of £30.6m which is recovered from suppliers through the HH and NHH tariffs. Changes to the small generators’ discount recovery following CMP264 and CMP265 The small generators’ discount calculation has changed following the move to gross charging for TNUoS demand under CMP264/265. Following the introduction of the EET and HH demand being charged on a gross basis, the calculation of the small generators’ discount will change. The small generators’ discount recovery is now taken from gross HH demand, and the residual used in the calculation of the discount is now the gross demand residual. The rate charged to HH demand tariffs is now charged at a gross demand level instead of net.
Component 2017/182018/19
Initial
2018/19
June
2018/19
October
2018/19
Draft
2018/19
Final
G Proportion of revenue recovered from generation (%) 14.8% 15.1% 15.3% 16.2% 16.1% 16.1%
D Proportion of revenue recovered from demand (%) 85.2% 84.9% 84.7% 83.8% 83.9% 83.9%
R Total TNUoS revenue (£m) 2,631 2,833 2,820 2,661 2,670 2,670
Generation Residual
RG Generator residual tariff (£/kW) -1.85 -3.20 -3.28 -2.34 -2.52 -2.52
ZG Revenue recovered from the locational element of generator tariffs (£m) 275.0 313.2 334.0 322.2 330.8 329.4
O Revenue recovered from offshore local tariffs (£m) 208.5 293.9 288.4 244.0 243.6 245.3
LG Revenue recovered from onshore local substation tariffs (£m) 17.5 17.0 17.8 20.7 19.2 19.2
SG Revenue recovered from onshore local circuit tariffs (£m) 14.6 16.9 18.5 18.5 17.6 17.8
BG Generator charging base (GW) 67.6 66.8 69.7 75.0 71.9 71.9
Net Demand Residual
RD Demand residual tariff (£/kW) 47.26 52.24 52.20
ZD Revenue recovered from the locational element of demand tariffs (£m) -12.4 -19.0 -12.0
BD Demand Net charging base (GW) 47.7 46.4 46.0
Gross Demand Residual
RD Demand residual tariff (£/kW) 46.90 46.94 46.93
ZD Revenue recovered from the locational element of demand tariffs (£m) -64.2 -47.1 -46.7
EE Amount to be paid to Embedded Export Tariffs (£m) 165.2 175.3 175.4
BD Demand Gross charging base (GW) 52.5 52.5 52.5
Introduced by CMP264/265
to replace 'net residual'
no longer calculated
NGET: Final TNUoS Tariffs for 2018/19 January 2018 32
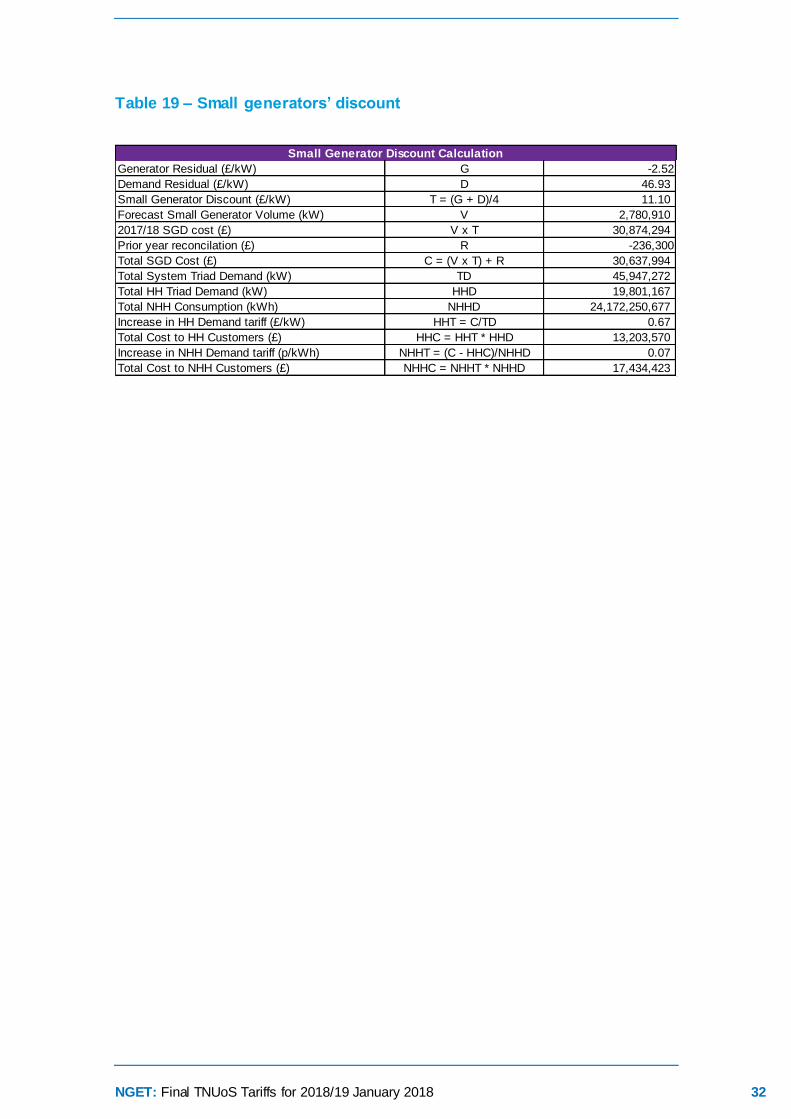
Table 19 – Small generators’ discount
Generator Residual (£/kW) G -2.52
Demand Residual (£/kW) D 46.93
Small Generator Discount (£/kW) T = (G + D)/4 11.10
Forecast Small Generator Volume (kW) V 2,780,910
2017/18 SGD cost (£) V x T 30,874,294
Prior year reconcilation (£) R -236,300
Total SGD Cost (£) C = (V x T) + R 30,637,994
Total System Triad Demand (kW) TD 45,947,272
Total HH Triad Demand (kW) HHD 19,801,167
Total NHH Consumption (kWh) NHHD 24,172,250,677
Increase in HH Demand tariff (£/kW) HHT = C/TD 0.67
Total Cost to HH Customers (£) HHC = HHT * HHD 13,203,570
Increase in NHH Demand tariff (p/kWh) NHHT = (C - HHC)/NHHD 0.07
Total Cost to NHH Customers (£) NHHC = NHHT * NHHD 17,434,423
Small Generator Discount Calculation

NGET: Final TNUoS Tariffs for 2018/19 January 2018 33
Tools and Supporting Information
Further information
We are keen to ensure that customers understand the current charging arrangements and the reason why tariffs change. If you have specific queries on this forecast please contact us using the details below. Feedback on the content and format of this forecast is also welcome. We are particularly interested to hear how accessible you find the report and if it provides the right level of detail. Webinar on These tariffs
We will hold a webinar for the Final tariffs on Friday 2 February 2018 from 10:30 to 11:30. If you wish to join the webinar, please contact us using the details below. We always welcome questions and are happy to discuss specific aspects of the material contained in the Final Tariffs report should you wish to do so.
Charging models
We can provide a copy of our charging model. If you would like a copy of the model to be emailed to you, together with a user guide, please contact us using the details below. Please note that, while the model is available free of charge, it is provided under licence to restrict, among other things, its distribution and commercial use.
Numerical data
All tables in this document can be downloaded as an Excel spreadsheet from our website: https://www.nationalgrid.com/tnuos/
Team Email & Phone [email protected] 01926 654633
NGET: Final TNUoS Tariffs for 2018/19 January 2018 34
Appendices
Appendix A: Locational demand tariff charges
Appendix B: Locational demand profiles
Appendix C: Annual Load Factors
Appendix D: Transmission company revenues
Appendix E: Generation zones map
Appendix F: Demand zones map

NGET: Final TNUoS Tariffs for 2018/19 January 2018 35
Appendix A: Locational demand tariff charges
The table below shows the locational demand tariff elements used in the gross HH demand tariff and the EET and the associated changes from the October forecast to the Draft tariffs. The zonal variations for both the peak security and year round tariffs have been driven by the changes to the HVDC parameters and local circuits. This can be seen largely in zones 1, 2 (Scotland) which along with the slight increase in overall revenue has resulted in the average demand tariff increase.
Table 20 – Locational tariffs
ZonePeak
(£/kW)
Year Round
(£/kW)
Peak
(£/kW)
Year Round
(£/kW)
Peak
(£/kW)
Year Round
(£/kW)
1 3.065285 -24.297592 3.074137 -24.296330 0.008851 0.001262
2 0.134686 -18.606910 0.134735 -18.590734 0.000049 0.016176
3 -3.097681 -6.616660 -3.098072 -6.611526 -0.000391 0.005133
4 -1.214669 -2.512235 -1.215101 -2.505084 -0.000431 0.007152
5 -2.902127 -0.557508 -2.902564 -0.550650 -0.000437 0.006858
6 -2.334653 0.313286 -2.335129 0.321468 -0.000476 0.008182
7 -2.257707 2.226057 -2.258156 2.233219 -0.000449 0.007162
8 -1.800712 3.064231 -1.801172 3.071737 -0.000459 0.007507
9 1.140503 0.755028 1.140058 0.762065 -0.000445 0.007038
10 -6.151443 4.422608 -6.151896 4.429880 -0.000452 0.007271
11 3.869828 0.707482 3.869380 0.714592 -0.000447 0.007110
12 5.119155 2.254470 5.118708 2.261549 -0.000446 0.007079
13 1.637860 4.248799 1.637411 4.255971 -0.000449 0.007172
14 -1.028052 5.362369 -1.028503 5.369597 -0.000451 0.007227
2018/19 Draft 2018/19 Final Changes

NGET: Final TNUoS Tariffs for 2018/19 January 2018 36
Appendix B: Locational demand profiles
The table below shows the latest demand forecast used in the Final tariffs. All values are unchanged from the Draft tariffs. The locational model demand profiles were updated for the Draft tariffs following the submission of week 24 data from the DNOs and directly connected demand (DCC) . HH demand is now calculated on a gross basis rather than net, which removes the negative demand caused by embedded generation.
Table 21 – Demand profiles
Locational
Model
Demand (MW)
GROSS Tariff
model Peak
Demand (MW)
GROSS Tariff
Model HH
Demand (MW)
Tariff model
NHH Demand
(TWh)
Tariff model
Embedded
Export (MW)
Locational
Model Demand
(MW)
GROSS Tariff
model Peak
Demand (MW)
GROSS Tariff
Model HH
Demand (MW)
Tariff model
NHH Demand
(TWh)
Tariff model
Embedded
Export (MW)
1 Northern Scotland 640 1,477 489 0.74 1,001 640 1,477 489 0.74 1,001
2 Southern Scotland 2,724 3,500 1,259 1.66 670 2,724 3,500 1,259 1.66 670
3 Northern 2,649 2,664 1,078 1.20 581 2,649 2,664 1,078 1.20 581
4 North West 3,169 4,117 1,523 1.93 343 3,169 4,117 1,523 1.93 343
5 Yorkshire 4,388 3,920 1,610 1.76 635 4,388 3,920 1,610 1.76 635
6 N Wales & Mersey 2,394 2,678 1,085 1.22 538 2,394 2,678 1,085 1.22 538
7 East Midlands 5,296 4,763 1,878 2.16 477 5,296 4,763 1,878 2.16 477
8 Midlands 4,410 4,371 1,617 2.00 211 4,410 4,371 1,617 2.00 211
9 Eastern 6,097 6,605 2,133 3.09 624 6,097 6,605 2,133 3.09 624
10 South Wales 1,666 1,843 839 0.83 331 1,666 1,843 839 0.83 331
11 South East 3,813 3,999 1,169 1.91 318 3,813 3,999 1,169 1.91 318
12 London 5,380 4,323 2,286 1.84 149 5,380 4,323 2,286 1.84 149
13 Southern 6,220 5,584 2,072 2.56 437 6,220 5,584 2,072 2.56 437
14 South Western 2,244 2,621 764 1.27 200 2,244 2,621 764 1.27 200
51,090 52,463 19,801 24.17 6,516 51,090 52,463 19,801 24.17 6,516
2018/19 Draft 2018/19 Final
Total
Zone Zone Name

NGET: Final TNUoS Tariffs for 2018/19 January 2018 37
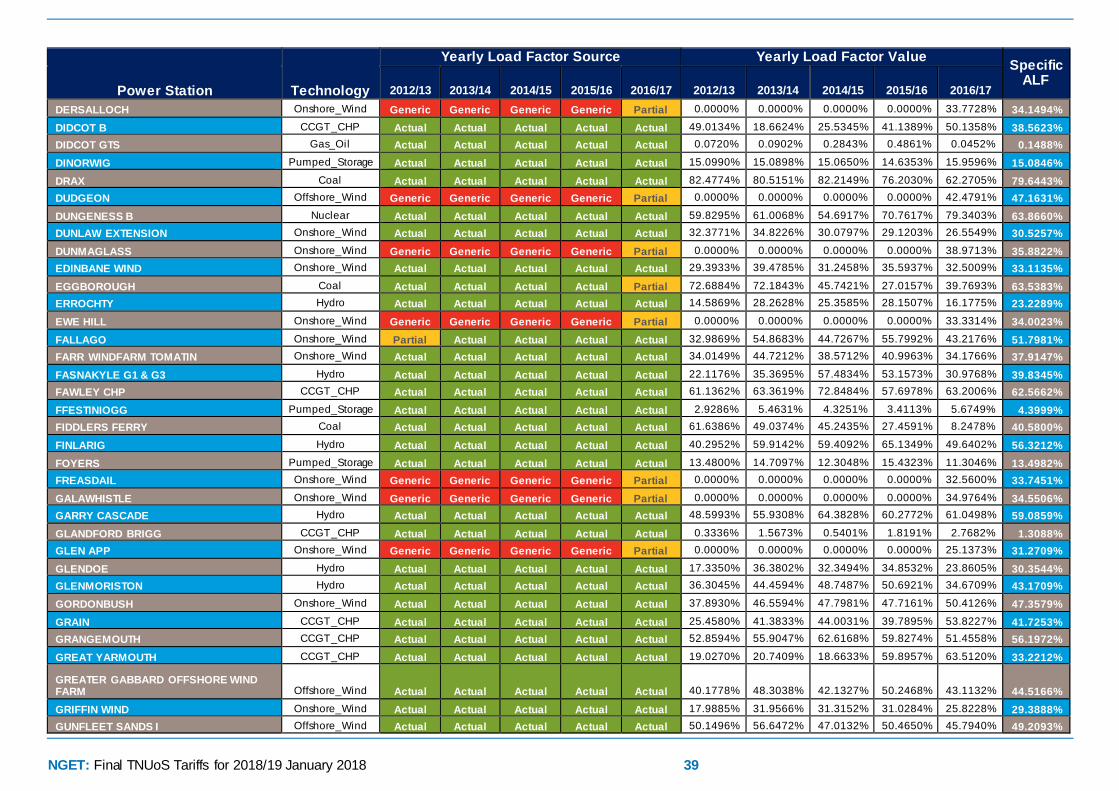
Appendix C: Annual Load Factors
ALFs
Table 23 lists the Annual Load Factors (ALFs) of generators expected to be liable for generator charges during 2018/19. ALFs are used to scale the Shared Year Round element of tariffs for each generator, and the Year Round Not Shared for Conventional Carbon generators, so that each has a tariff appropriate to its historical load factor. ALFs have been calculated using Transmission Entry Capacity, Metered Output and Final Physical Notifications from charging years 2012/13 to 2016/17. Generators which commissioned after 1 April 2014 will have fewer than three complete years of data so the Generic ALF listed below are added to create three complete years from which the ALF can be calculated. Generators expected to commission during 2018/19 also use the Generic ALF. These were finalised for the Five-year forecast tariffs published on 1 December 2017.††††
††††
https://www.nationalgrid.com/sites/default/files/documents/Final%202018-19%20ALFs.pdf
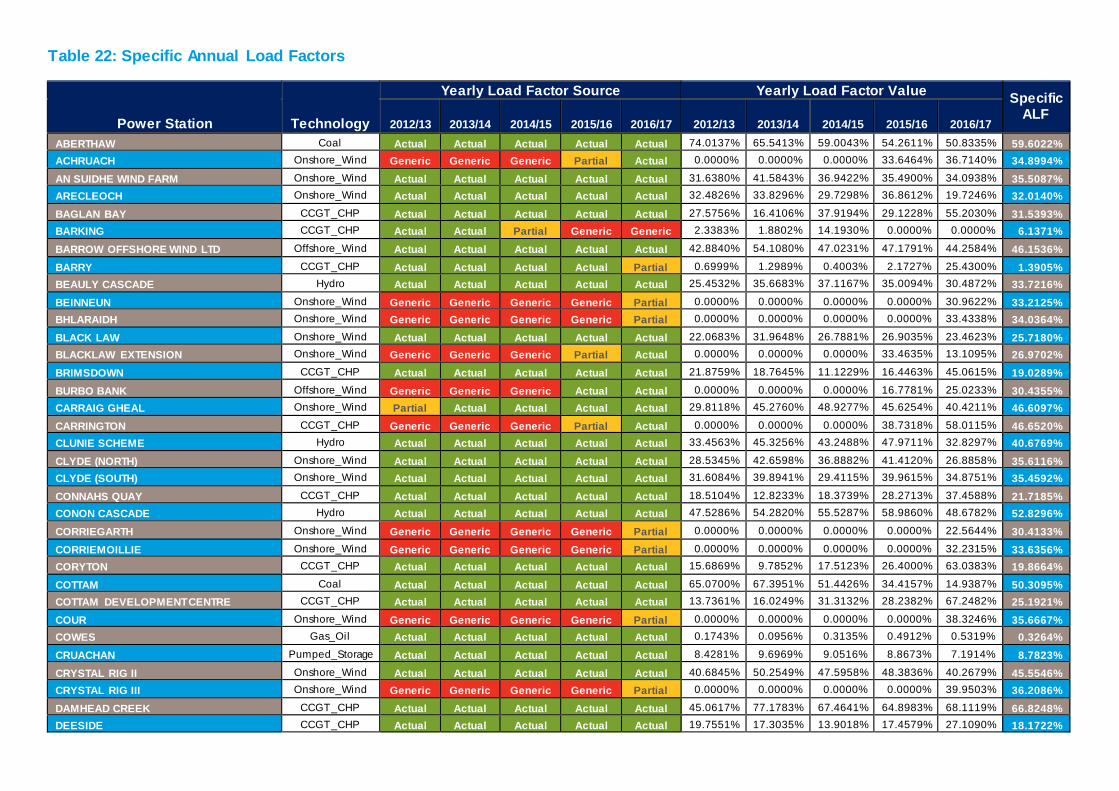
Table 22: Specific Annual Load Factors
Power Station Technology
Yearly Load Factor Source Yearly Load Factor Value Specific
ALF 2012/13 2013/14 2014/15 2015/16 2016/17 2012/13 2013/14 2014/15 2015/16 2016/17
ABERTHAW Coal Actual Actual Actual Actual Actual 74.0137% 65.5413% 59.0043% 54.2611% 50.8335% 59.6022%
ACHRUACH Onshore_Wind Generic Generic Generic Partial Actual 0.0000% 0.0000% 0.0000% 33.6464% 36.7140% 34.8994%
AN SUIDHE WIND FARM Onshore_Wind Actual Actual Actual Actual Actual 31.6380% 41.5843% 36.9422% 35.4900% 34.0938% 35.5087%
ARECLEOCH Onshore_Wind Actual Actual Actual Actual Actual 32.4826% 33.8296% 29.7298% 36.8612% 19.7246% 32.0140%
BAGLAN BAY CCGT_CHP Actual Actual Actual Actual Actual 27.5756% 16.4106% 37.9194% 29.1228% 55.2030% 31.5393%
BARKING CCGT_CHP Actual Actual Partial Generic Generic 2.3383% 1.8802% 14.1930% 0.0000% 0.0000% 6.1371%
BARROW OFFSHORE WIND LTD Offshore_Wind Actual Actual Actual Actual Actual 42.8840% 54.1080% 47.0231% 47.1791% 44.2584% 46.1536%
BARRY CCGT_CHP Actual Actual Actual Actual Partial 0.6999% 1.2989% 0.4003% 2.1727% 25.4300% 1.3905%
BEAULY CASCADE Hydro Actual Actual Actual Actual Actual 25.4532% 35.6683% 37.1167% 35.0094% 30.4872% 33.7216%
BEINNEUN Onshore_Wind Generic Generic Generic Generic Partial 0.0000% 0.0000% 0.0000% 0.0000% 30.9622% 33.2125%
BHLARAIDH Onshore_Wind Generic Generic Generic Generic Partial 0.0000% 0.0000% 0.0000% 0.0000% 33.4338% 34.0364%
BLACK LAW Onshore_Wind Actual Actual Actual Actual Actual 22.0683% 31.9648% 26.7881% 26.9035% 23.4623% 25.7180%
BLACKLAW EXTENSION Onshore_Wind Generic Generic Generic Partial Actual 0.0000% 0.0000% 0.0000% 33.4635% 13.1095% 26.9702%
BRIMSDOWN CCGT_CHP Actual Actual Actual Actual Actual 21.8759% 18.7645% 11.1229% 16.4463% 45.0615% 19.0289%
BURBO BANK Offshore_Wind Generic Generic Generic Actual Actual 0.0000% 0.0000% 0.0000% 16.7781% 25.0233% 30.4355%
CARRAIG GHEAL Onshore_Wind Partial Actual Actual Actual Actual 29.8118% 45.2760% 48.9277% 45.6254% 40.4211% 46.6097%
CARRINGTON CCGT_CHP Generic Generic Generic Partial Actual 0.0000% 0.0000% 0.0000% 38.7318% 58.0115% 46.6520%
CLUNIE SCHEME Hydro Actual Actual Actual Actual Actual 33.4563% 45.3256% 43.2488% 47.9711% 32.8297% 40.6769%
CLYDE (NORTH) Onshore_Wind Actual Actual Actual Actual Actual 28.5345% 42.6598% 36.8882% 41.4120% 26.8858% 35.6116%
CLYDE (SOUTH) Onshore_Wind Actual Actual Actual Actual Actual 31.6084% 39.8941% 29.4115% 39.9615% 34.8751% 35.4592%
CONNAHS QUAY CCGT_CHP Actual Actual Actual Actual Actual 18.5104% 12.8233% 18.3739% 28.2713% 37.4588% 21.7185%
CONON CASCADE Hydro Actual Actual Actual Actual Actual 47.5286% 54.2820% 55.5287% 58.9860% 48.6782% 52.8296%
CORRIEGARTH Onshore_Wind Generic Generic Generic Generic Partial 0.0000% 0.0000% 0.0000% 0.0000% 22.5644% 30.4133%
CORRIEMOILLIE Onshore_Wind Generic Generic Generic Generic Partial 0.0000% 0.0000% 0.0000% 0.0000% 32.2315% 33.6356%
CORYTON CCGT_CHP Actual Actual Actual Actual Actual 15.6869% 9.7852% 17.5123% 26.4000% 63.0383% 19.8664%
COTTAM Coal Actual Actual Actual Actual Actual 65.0700% 67.3951% 51.4426% 34.4157% 14.9387% 50.3095%
COTTAM DEVELOPMENT CENTRE CCGT_CHP Actual Actual Actual Actual Actual 13.7361% 16.0249% 31.3132% 28.2382% 67.2482% 25.1921%
COUR Onshore_Wind Generic Generic Generic Generic Partial 0.0000% 0.0000% 0.0000% 0.0000% 38.3246% 35.6667%
COWES Gas_Oil Actual Actual Actual Actual Actual 0.1743% 0.0956% 0.3135% 0.4912% 0.5319% 0.3264%
CRUACHAN Pumped_Storage Actual Actual Actual Actual Actual 8.4281% 9.6969% 9.0516% 8.8673% 7.1914% 8.7823%
CRYSTAL RIG II Onshore_Wind Actual Actual Actual Actual Actual 40.6845% 50.2549% 47.5958% 48.3836% 40.2679% 45.5546%
CRYSTAL RIG III Onshore_Wind Generic Generic Generic Generic Partial 0.0000% 0.0000% 0.0000% 0.0000% 39.9503% 36.2086%
DAMHEAD CREEK CCGT_CHP Actual Actual Actual Actual Actual 45.0617% 77.1783% 67.4641% 64.8983% 68.1119% 66.8248%
DEESIDE CCGT_CHP Actual Actual Actual Actual Actual 19.7551% 17.3035% 13.9018% 17.4579% 27.1090% 18.1722%
NGET: Final TNUoS Tariffs for 2018/19 January 2018 39
Power Station Technology
Yearly Load Factor Source Yearly Load Factor Value Specific
ALF 2012/13 2013/14 2014/15 2015/16 2016/17 2012/13 2013/14 2014/15 2015/16 2016/17
DERSALLOCH Onshore_Wind Generic Generic Generic Generic Partial 0.0000% 0.0000% 0.0000% 0.0000% 33.7728% 34.1494%
DIDCOT B CCGT_CHP Actual Actual Actual Actual Actual 49.0134% 18.6624% 25.5345% 41.1389% 50.1358% 38.5623%
DIDCOT GTS Gas_Oil Actual Actual Actual Actual Actual 0.0720% 0.0902% 0.2843% 0.4861% 0.0452% 0.1488%
DINORWIG Pumped_Storage Actual Actual Actual Actual Actual 15.0990% 15.0898% 15.0650% 14.6353% 15.9596% 15.0846%
DRAX Coal Actual Actual Actual Actual Actual 82.4774% 80.5151% 82.2149% 76.2030% 62.2705% 79.6443%
DUDGEON Offshore_Wind Generic Generic Generic Generic Partial 0.0000% 0.0000% 0.0000% 0.0000% 42.4791% 47.1631%
DUNGENESS B Nuclear Actual Actual Actual Actual Actual 59.8295% 61.0068% 54.6917% 70.7617% 79.3403% 63.8660%
DUNLAW EXTENSION Onshore_Wind Actual Actual Actual Actual Actual 32.3771% 34.8226% 30.0797% 29.1203% 26.5549% 30.5257%
DUNMAGLASS Onshore_Wind Generic Generic Generic Generic Partial 0.0000% 0.0000% 0.0000% 0.0000% 38.9713% 35.8822%
EDINBANE WIND Onshore_Wind Actual Actual Actual Actual Actual 29.3933% 39.4785% 31.2458% 35.5937% 32.5009% 33.1135%
EGGBOROUGH Coal Actual Actual Actual Actual Partial 72.6884% 72.1843% 45.7421% 27.0157% 39.7693% 63.5383%
ERROCHTY Hydro Actual Actual Actual Actual Actual 14.5869% 28.2628% 25.3585% 28.1507% 16.1775% 23.2289%
EWE HILL Onshore_Wind Generic Generic Generic Generic Partial 0.0000% 0.0000% 0.0000% 0.0000% 33.3314% 34.0023%
FALLAGO Onshore_Wind Partial Actual Actual Actual Actual 32.9869% 54.8683% 44.7267% 55.7992% 43.2176% 51.7981%
FARR WINDFARM TOMATIN Onshore_Wind Actual Actual Actual Actual Actual 34.0149% 44.7212% 38.5712% 40.9963% 34.1766% 37.9147%
FASNAKYLE G1 & G3 Hydro Actual Actual Actual Actual Actual 22.1176% 35.3695% 57.4834% 53.1573% 30.9768% 39.8345%
FAWLEY CHP CCGT_CHP Actual Actual Actual Actual Actual 61.1362% 63.3619% 72.8484% 57.6978% 63.2006% 62.5662%
FFESTINIOGG Pumped_Storage Actual Actual Actual Actual Actual 2.9286% 5.4631% 4.3251% 3.4113% 5.6749% 4.3999%
FIDDLERS FERRY Coal Actual Actual Actual Actual Actual 61.6386% 49.0374% 45.2435% 27.4591% 8.2478% 40.5800%
FINLARIG Hydro Actual Actual Actual Actual Actual 40.2952% 59.9142% 59.4092% 65.1349% 49.6402% 56.3212%
FOYERS Pumped_Storage Actual Actual Actual Actual Actual 13.4800% 14.7097% 12.3048% 15.4323% 11.3046% 13.4982%
FREASDAIL Onshore_Wind Generic Generic Generic Generic Partial 0.0000% 0.0000% 0.0000% 0.0000% 32.5600% 33.7451%
GALAWHISTLE Onshore_Wind Generic Generic Generic Generic Partial 0.0000% 0.0000% 0.0000% 0.0000% 34.9764% 34.5506%
GARRY CASCADE Hydro Actual Actual Actual Actual Actual 48.5993% 55.9308% 64.3828% 60.2772% 61.0498% 59.0859%
GLANDFORD BRIGG CCGT_CHP Actual Actual Actual Actual Actual 0.3336% 1.5673% 0.5401% 1.8191% 2.7682% 1.3088%
GLEN APP Onshore_Wind Generic Generic Generic Generic Partial 0.0000% 0.0000% 0.0000% 0.0000% 25.1373% 31.2709%
GLENDOE Hydro Actual Actual Actual Actual Actual 17.3350% 36.3802% 32.3494% 34.8532% 23.8605% 30.3544%
GLENMORISTON Hydro Actual Actual Actual Actual Actual 36.3045% 44.4594% 48.7487% 50.6921% 34.6709% 43.1709%
GORDONBUSH Onshore_Wind Actual Actual Actual Actual Actual 37.8930% 46.5594% 47.7981% 47.7161% 50.4126% 47.3579%
GRAIN CCGT_CHP Actual Actual Actual Actual Actual 25.4580% 41.3833% 44.0031% 39.7895% 53.8227% 41.7253%
GRANGEMOUTH CCGT_CHP Actual Actual Actual Actual Actual 52.8594% 55.9047% 62.6168% 59.8274% 51.4558% 56.1972%
GREAT YARMOUTH CCGT_CHP Actual Actual Actual Actual Actual 19.0270% 20.7409% 18.6633% 59.8957% 63.5120% 33.2212%
GREATER GABBARD OFFSHORE WIND FARM Offshore_Wind Actual Actual Actual Actual Actual 40.1778% 48.3038% 42.1327% 50.2468% 43.1132% 44.5166%
GRIFFIN WIND Onshore_Wind Actual Actual Actual Actual Actual 17.9885% 31.9566% 31.3152% 31.0284% 25.8228% 29.3888%
GUNFLEET SANDS I Offshore_Wind Actual Actual Actual Actual Actual 50.1496% 56.6472% 47.0132% 50.4650% 45.7940% 49.2093%

NGET: Final TNUoS Tariffs for 2018/19 January 2018 40
Power Station Technology
Yearly Load Factor Source Yearly Load Factor Value Specific
ALF 2012/13 2013/14 2014/15 2015/16 2016/17 2012/13 2013/14 2014/15 2015/16 2016/17
GUNFLEET SANDS II Offshore_Wind Actual Actual Actual Actual Actual 45.0132% 52.2361% 44.7211% 49.0521% 43.9893% 46.2622%
GWYNT Y MOR Offshore_Wind Partial Actual Actual Actual Actual 18.8535% 8.0036% 61.6185% 63.1276% 44.8323% 56.5262%
HADYARD HILL Onshore_Wind Actual Actual Actual Actual Actual 27.6927% 31.9488% 27.7635% 36.6527% 31.4364% 30.3829%
HARESTANES Onshore_Wind Generic Partial Actual Actual Actual 0.0000% 22.2448% 28.6355% 27.8093% 22.5464% 26.3304%
HARTLEPOOL Nuclear Actual Actual Actual Actual Actual 80.2632% 73.7557% 56.2803% 53.8666% 78.0390% 69.3583%
HEYSHAM Nuclear Actual Actual Actual Actual Actual 83.3828% 73.3628% 68.8252% 72.7344% 79.6169% 75.2380%
HINKLEY POINT B Nuclear Actual Actual Actual Actual Actual 61.7582% 68.8664% 70.1411% 67.6412% 71.2265% 68.8829%
HUMBER GATEWAY OFFSHORE WIND FARM Offshore_Wind Generic Generic Generic Actual Actual 0.0000% 0.0000% 0.0000% 62.9631% 59.7195% 57.3959%
HUNTERSTON Nuclear Actual Actual Actual Actual Actual 73.5984% 84.7953% 79.1368% 82.1786% 83.2939% 81.5365%
IMMINGHAM CCGT_CHP Actual Actual Actual Actual Actual 50.1793% 37.8219% 56.8316% 69.4686% 71.9550% 58.8265%
INDIAN QUEENS Gas_Oil Actual Actual Actual Actual Actual 0.3423% 0.2321% 0.0876% 0.0723% 0.0847% 0.1348%
KEADBY CCGT_CHP Actual Actual Generic Partial Actual 4.6125% 0.0001% 0.0000% 35.1858% 28.6076% 11.0734%
KILBRAUR Onshore_Wind Actual Actual Actual Actual Actual 45.2306% 51.3777% 54.3550% 50.3807% 46.5342% 49.4309%
KILGALLIOCH Onshore_Wind Generic Generic Generic Generic Partial 0.0000% 0.0000% 0.0000% 0.0000% 25.2739% 31.3164%
KILLIN CASCADE Hydro Actual Actual Actual Actual Actual 32.3429% 45.5356% 44.8205% 53.2348% 27.4962% 40.8997%
KILLINGHOLME (NP) CCGT_CHP Actual Actual Actual Generic Generic 10.6552% 7.4217% 11.6191% 0.0000% 0.0000% 9.8987%
KILLINGHOLME (POWERGEN) Gas_Oil Generic Generic Generic Generic Generic 0.0000% 0.0000% 0.0000% 0.0000% 0.0000% 0.0000%
KINGS LYNN A CCGT_CHP Actual Actual Actual Generic Generic 0.0003% 0.0000% 0.0000% 0.0000% 0.0000% 0.0001%
LANGAGE CCGT_CHP Actual Actual Actual Actual Actual 41.9115% 40.8749% 34.8629% 16.5310% 44.5413% 39.2164%
LINCS WIND FARM Offshore_Wind Partial Actual Actual Actual Actual 20.3244% 46.5987% 43.8178% 49.1306% 44.5192% 46.7495%
LITTLE BARFORD CCGT_CHP Actual Actual Actual Actual Actual 16.3807% 33.6286% 49.6644% 39.9829% 64.8597% 41.0920%
LOCHLUICHART Onshore_Wind Generic Partial Actual Actual Actual 0.0000% 24.9397% 20.2103% 29.2663% 31.6897% 27.0554%
LONDON ARRAY Offshore_Wind Partial Actual Actual Actual Actual 38.9520% 51.2703% 64.0880% 66.8682% 53.6245% 61.5269%
LYNEMOUTH Coal Generic Generic Generic Partial Generic 0.0000% 0.0000% 0.0000% 68.0196% 0.0000% 58.6875%
MARCHWOOD CCGT_CHP Actual Actual Actual Actual Actual 43.3537% 48.6845% 66.4021% 55.0879% 75.4248% 56.7248%
MARK HILL Onshore_Wind Actual Actual Actual Actual Actual 30.1675% 30.2863% 26.7942% 34.0227% 21.9653% 29.0827%
MEDWAY CCGT_CHP Actual Actual Actual Actual Actual 1.0718% 14.5545% 28.0962% 34.1799% 35.1505% 25.6102%
MILLENNIUM Onshore_Wind Actual Actual Actual Actual Actual 42.1318% 52.6618% 53.2636% 48.4038% 44.9764% 48.6806%
NANT Hydro Actual Actual Actual Actual Actual 20.8965% 35.5883% 36.4040% 37.3788% 30.6350% 34.2091%
ORMONDE Offshore_Wind Partial Actual Actual Actual Actual 48.8406% 49.6561% 42.8711% 47.1986% 41.2188% 46.5753%
PEMBROKE CCGT_CHP Actual Actual Actual Actual Actual 61.5434% 60.3928% 67.5346% 64.5596% 77.6478% 64.5459%
PEN Y CYMOEDD Onshore_Wind Generic Generic Generic Generic Partial 0.0000% 0.0000% 0.0000% 0.0000% 26.9446% 31.8733%
PETERBOROUGH CCGT_CHP Actual Actual Actual Partial Actual 0.9506% 1.8311% 1.0929% 4.1032% 1.7914% 1.5718%
PETERHEAD CCGT_CHP Actual Actual Actual Actual Actual 31.3766% 41.8811% 0.4858% 23.3813% 42.2292% 32.2130%
RACE BANK Offshore_Wind Generic Generic Generic Generic Partial 0.0000% 0.0000% 0.0000% 0.0000% 45.3062% 48.1055%
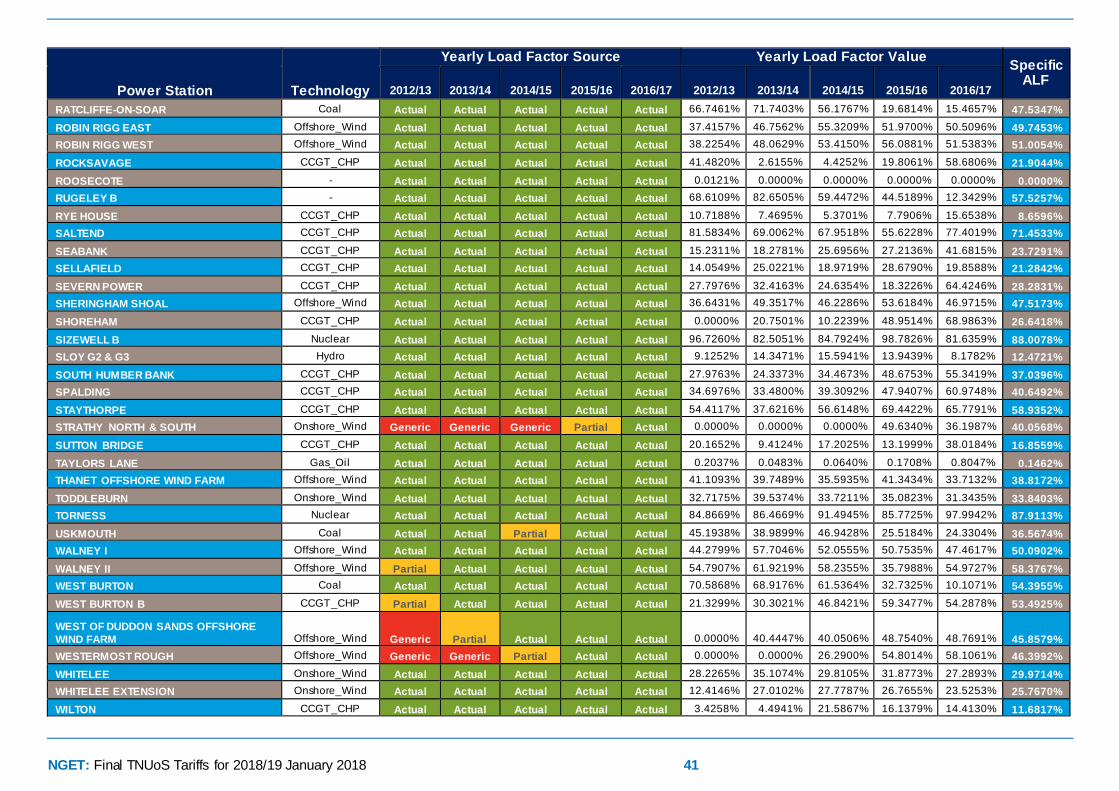
NGET: Final TNUoS Tariffs for 2018/19 January 2018 41
Power Station Technology
Yearly Load Factor Source Yearly Load Factor Value Specific
ALF 2012/13 2013/14 2014/15 2015/16 2016/17 2012/13 2013/14 2014/15 2015/16 2016/17
RATCLIFFE-ON-SOAR Coal Actual Actual Actual Actual Actual 66.7461% 71.7403% 56.1767% 19.6814% 15.4657% 47.5347%
ROBIN RIGG EAST Offshore_Wind Actual Actual Actual Actual Actual 37.4157% 46.7562% 55.3209% 51.9700% 50.5096% 49.7453%
ROBIN RIGG WEST Offshore_Wind Actual Actual Actual Actual Actual 38.2254% 48.0629% 53.4150% 56.0881% 51.5383% 51.0054%
ROCKSAVAGE CCGT_CHP Actual Actual Actual Actual Actual 41.4820% 2.6155% 4.4252% 19.8061% 58.6806% 21.9044%
ROOSECOTE - Actual Actual Actual Actual Actual 0.0121% 0.0000% 0.0000% 0.0000% 0.0000% 0.0000%
RUGELEY B - Actual Actual Actual Actual Actual 68.6109% 82.6505% 59.4472% 44.5189% 12.3429% 57.5257%
RYE HOUSE CCGT_CHP Actual Actual Actual Actual Actual 10.7188% 7.4695% 5.3701% 7.7906% 15.6538% 8.6596%
SALTEND CCGT_CHP Actual Actual Actual Actual Actual 81.5834% 69.0062% 67.9518% 55.6228% 77.4019% 71.4533%
SEABANK CCGT_CHP Actual Actual Actual Actual Actual 15.2311% 18.2781% 25.6956% 27.2136% 41.6815% 23.7291%
SELLAFIELD CCGT_CHP Actual Actual Actual Actual Actual 14.0549% 25.0221% 18.9719% 28.6790% 19.8588% 21.2842%
SEVERN POWER CCGT_CHP Actual Actual Actual Actual Actual 27.7976% 32.4163% 24.6354% 18.3226% 64.4246% 28.2831%
SHERINGHAM SHOAL Offshore_Wind Actual Actual Actual Actual Actual 36.6431% 49.3517% 46.2286% 53.6184% 46.9715% 47.5173%
SHOREHAM CCGT_CHP Actual Actual Actual Actual Actual 0.0000% 20.7501% 10.2239% 48.9514% 68.9863% 26.6418%
SIZEWELL B Nuclear Actual Actual Actual Actual Actual 96.7260% 82.5051% 84.7924% 98.7826% 81.6359% 88.0078%
SLOY G2 & G3 Hydro Actual Actual Actual Actual Actual 9.1252% 14.3471% 15.5941% 13.9439% 8.1782% 12.4721%
SOUTH HUMBER BANK CCGT_CHP Actual Actual Actual Actual Actual 27.9763% 24.3373% 34.4673% 48.6753% 55.3419% 37.0396%
SPALDING CCGT_CHP Actual Actual Actual Actual Actual 34.6976% 33.4800% 39.3092% 47.9407% 60.9748% 40.6492%
STAYTHORPE CCGT_CHP Actual Actual Actual Actual Actual 54.4117% 37.6216% 56.6148% 69.4422% 65.7791% 58.9352%
STRATHY NORTH & SOUTH Onshore_Wind Generic Generic Generic Partial Actual 0.0000% 0.0000% 0.0000% 49.6340% 36.1987% 40.0568%
SUTTON BRIDGE CCGT_CHP Actual Actual Actual Actual Actual 20.1652% 9.4124% 17.2025% 13.1999% 38.0184% 16.8559%
TAYLORS LANE Gas_Oil Actual Actual Actual Actual Actual 0.2037% 0.0483% 0.0640% 0.1708% 0.8047% 0.1462%
THANET OFFSHORE WIND FARM Offshore_Wind Actual Actual Actual Actual Actual 41.1093% 39.7489% 35.5935% 41.3434% 33.7132% 38.8172%
TODDLEBURN Onshore_Wind Actual Actual Actual Actual Actual 32.7175% 39.5374% 33.7211% 35.0823% 31.3435% 33.8403%
TORNESS Nuclear Actual Actual Actual Actual Actual 84.8669% 86.4669% 91.4945% 85.7725% 97.9942% 87.9113%
USKMOUTH Coal Actual Actual Partial Actual Actual 45.1938% 38.9899% 46.9428% 25.5184% 24.3304% 36.5674%
WALNEY I Offshore_Wind Actual Actual Actual Actual Actual 44.2799% 57.7046% 52.0555% 50.7535% 47.4617% 50.0902%
WALNEY II Offshore_Wind Partial Actual Actual Actual Actual 54.7907% 61.9219% 58.2355% 35.7988% 54.9727% 58.3767%
WEST BURTON Coal Actual Actual Actual Actual Actual 70.5868% 68.9176% 61.5364% 32.7325% 10.1071% 54.3955%
WEST BURTON B CCGT_CHP Partial Actual Actual Actual Actual 21.3299% 30.3021% 46.8421% 59.3477% 54.2878% 53.4925%
WEST OF DUDDON SANDS OFFSHORE
WIND FARM Offshore_Wind Generic Partial Actual Actual Actual 0.0000% 40.4447% 40.0506% 48.7540% 48.7691% 45.8579%
WESTERMOST ROUGH Offshore_Wind Generic Generic Partial Actual Actual 0.0000% 0.0000% 26.2900% 54.8014% 58.1061% 46.3992%
WHITELEE Onshore_Wind Actual Actual Actual Actual Actual 28.2265% 35.1074% 29.8105% 31.8773% 27.2893% 29.9714%
WHITELEE EXTENSION Onshore_Wind Actual Actual Actual Actual Actual 12.4146% 27.0102% 27.7787% 26.7655% 23.5253% 25.7670%
WILTON CCGT_CHP Actual Actual Actual Actual Actual 3.4258% 4.4941% 21.5867% 16.1379% 14.4130% 11.6817%
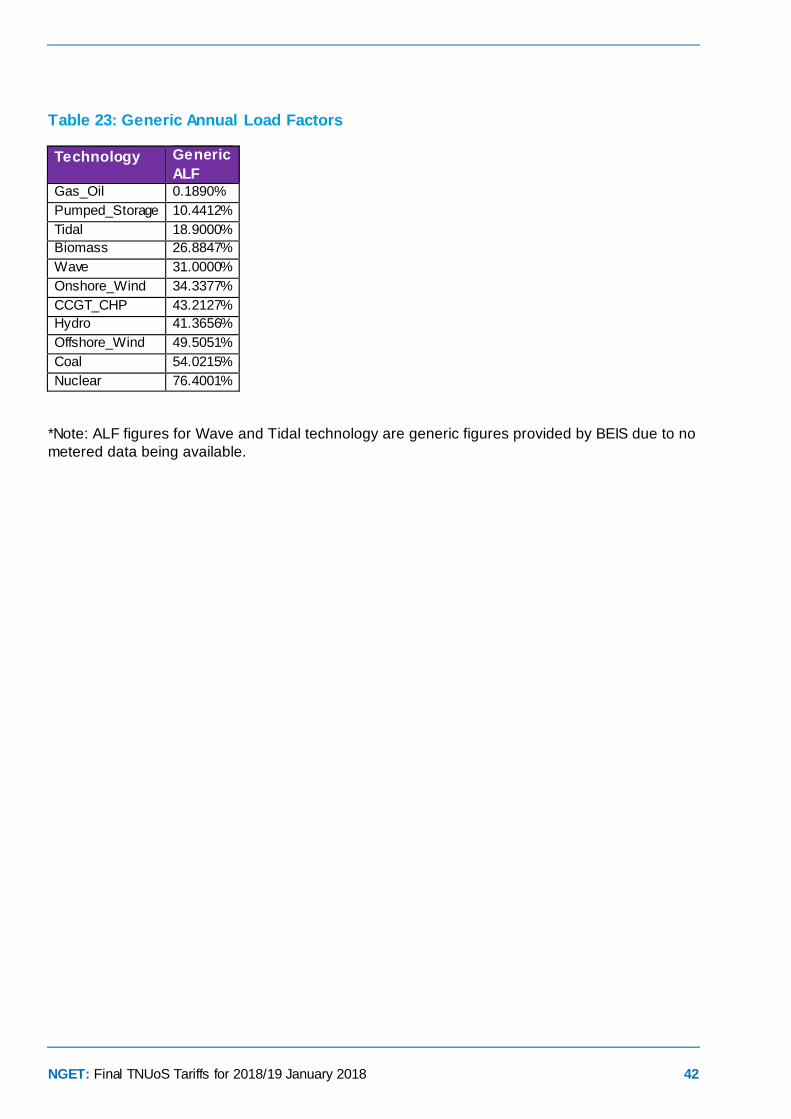
NGET: Final TNUoS Tariffs for 2018/19 January 2018 42
Table 23: Generic Annual Load Factors
Technology Generic
ALF Gas_Oil 0.1890%
Pumped_Storage 10.4412%
Tidal 18.9000%
Biomass 26.8847%
Wave 31.0000%
Onshore_Wind 34.3377%
CCGT_CHP 43.2127%
Hydro 41.3656%
Offshore_Wind 49.5051%
Coal 54.0215%
Nuclear 76.4001%
*Note: ALF figures for Wave and Tidal technology are generic figures provided by BEIS due to no
metered data being available.

NGET: Final TNUoS Tariffs for 2018/19 January 2018 43
Appendix D: Transmission company revenues
National Grid revenue forecast
We seek to provide the detail behind price control revenue forecasts for National Grid, Scottish Power Transmission and SHE Transmission, however, the contractual position between NGSO and TOs does not presently require a breakdown to the TO final position. Revenue for offshore networks is included with forecasts by National Grid where the Offshore Transmission Owner has yet to be appointed. Notes: All monies are quoted in millions of pounds, accurate to one decimal place and are in nominal ‘money of the day’ prices unless stated otherwise. Greyed out cells are either calculated or not applicable in the year concerned due to the way the licence formula are constructed. Network Innovation Competition (NIC) Funding is included in the National Grid price control but is additional to the price controls of onshore and offshore Transmission Owners who receive funding. NIC funding is therefore only shown in the National Grid table. All reasonable care has been taken in the preparation of these illustrative tables and the data therein. National Grid and other Transmission Owners offer this data without prejudice and cannot be held responsible for any loss that might be attributed to the use of this data. Neither National Grid nor other Transmission Owners accept or assume responsibility for the use of this information by any person or any person to whom this information is shown or any person to whom this information otherwise becomes available. The base revenue forecasts reflect the figures authorised by Ofgem in the RIIO-T1 or offshore price controls. Under the relevant STC (System Operator Transmission Owner Code) procedures, the Transmission Owners’ revenue forecast was finalised by 25 January 2018. In addition, the interconnector cap & floor revenue adjustment term was also finalised by 25 January 2018, under the relevant CUSC clauses.

NGET: Final TNUoS Tariffs for 2018/19 January 2018 44
Table 24 – Indicative National Grid revenue forecast
Description Notes
Regulatory Year 2014/15 2015/16 2016/17 2017/18 2018/19
Actual RPI 264.99 April to March average
RPI Actual RPIAt 1.228 Office of National Statistics
Assumed Interest Rate It 0.50% 0.70% 0.34% 0.29% 0.71% Bank of England Base Rate
Opening Base Revenue Allowance (2009/10 prices) A1 PUt 1443.83 1475.59 1571.39 1554.94 1587.63 From Licence
Price Control Financial Model Iteration Adjustment A2 MODt -5.50 -114.40 -185.40 -253.30 -310.24 Forecast
RPI True Up A3 TRUt -0.53 4.70 -19.92 -31.40 -6.08 Forecast
Prior Calendar Year RPI Forecast GRPIFc-1 0.03 0.03 0.01 0.02 0.04 HM Treasury Forecast
Current Calendar Year RPI Forecast GRPIFc 0.03 0.02 0.02 0.04 0.03 HM Treasury Forecast
Next Calendar Year RPI forecast GRPIFc+1 0.03 0.03 0.03 0.03 0.03 HM Treasury Forecast
RPI Forecast A4 RPIFt 1.21 1.23 1.23 1.27 1.31 Using HM Treasury Forecast
Base Revenue [A=(A1+A2+A3)*A4] A BRt 1732.69 1675.48 1684.36 1614.48 1670.49
Pass-Through Business Rates B1 RBt 1.2 1.5 2.7 1.6 Forecast
Temporary Physical Disconnection B2 TPDt 0.1 0.0 0.1 0.0 0.7 Forecast
Licence Fee B3 LFt 2.0 2.7 3.2 -0.4 Forecast
Inter TSO Compensation B4 ITCt 3.8 2.7 0.5 1.3 Forecast
Termination of Bilateral Connection Agreements B5 TERMt 0.00 0.00 0.00 0.00 0.00 Forecast
SP Transmission Pass-Through B6 TSPt 312.2 295.7 294.6 321.0 350.0 Forecast
SHE Transmission Pass-Through B7 TSHt 214.0 338.2 322.8 301.4 366.4 Forecast
Offshore Transmission Pass-Through B8 TOFTOt 218.4 248.4 260.8 270.2 318.1 Forecast
Embedded Offshore Pass-Through B9 OFETt 0.4 0.6 0.7 0.5 0.5 Forecast
Interconnectors Cap&Floor Revenue Adjustment B10 TICFt -6.8 Forecast
Pass-Through Items [B=B1+B2+B3+B4+B5+B6+B7+B8+B9+B10] B PTt 745.10 889.97 885.86 899.43 1031.51
Reliability Incentive Adjustment C1 RIt 2.4 3.9 4.0 4.1 Forecast
Stakeholder Satisfaction Adjustment C2 SSOt 8.7 10.1 8.6 9.3 Forecast
Sulphur Hexafluoride (SF6) Gas Emissions Adjustment C3 SFIt 2.8 2.7 2.6 1.4 Forecast
Awarded Environmental Discretionary Rewards C4 EDRt 0.0 2.0 0.0 0.0 Forecast
Outputs Incentive Revenue [C=C1+C2+C3+C4] C OIPt 0.00 13.86 18.73 15.26 14.85
Network Innovation Allowance D NIAt 10.9 10.6 10.6 10.2 10.5 Forecast
Network Innovation Competition E NICFt 17.8 18.8 44.9 32.1 32.7 Forecast
Future Environmental Discretionary Rewards F EDRt 0.0 0.0 0.0 0.0 0.0 Forecast
Transmission Investment for Renewable Generation G TIRGt 16.0 15.7 0.0 0.0 0.0 Forecast
Scottish Site Specific Adjustment H DISt 2.0 0.8 2.9 6.1 6.6 Forecast
Scottish Terminations Adjustment I TSt -0.3 0.1 0.1 -1.1 3.1 Forecast
Correction Factor K -Kt 0.0 56.4 104.0 97.0 -55.5 Calculated by Licensee
Maximum Revenue [M= A+B+C+D+E+F+G+H+I+K] M TOt 2524.3 2681.6 2751.3 2673.4 2714.3
Pre-vesting connection charges P 47.0 45.0 42.7 41.9 44.0 Forecast
TNUoS Collected Revenue [T=M-B5-P] T 2477.3 2636.7 2708.7 2631.5 2670.3
Licence
TermYr t+1
26/01/2018

NGET: Final TNUoS Tariffs for 2018/19 January 2018 45
Scottish Power Transmission revenue forecast
The indicative SPT revenue to be collected via TNUoS for 2018/19 is £350m.
SHE Transmission revenue forecast
The indicative SHET Transmission revenue to be collected via TNUoS for 2018/19 is £366.4m.
Offshore Transmission Owner revenues
Collectively, the indicative OFTOs’ Transmission revenue to be collected via TNUoS for 2018/19 is £318.1m. Interconnectors under Cap and Floor Revenue Adjustment
Under CMP283, TNUoS charges can be adjusted by an amount determined by Ofgem to enable recovery and/or redistribution of interconnector revenue in accordance with the Cap and Floor regime. The indicative total Interconnector revenue adjustment is -6.8m. This means 6.8m is to be reduced from TNUoS charge for 2018/19.

NGET: Final TNUoS Tariffs for 2018/19 January 2018 46
Table 25 - Offshore Transmission Owner revenues (indicative)
Offshore Transmission Revenue Forecast
Regulatory Year 2014/15 2015/16 2016/17 2017/18 2018/19
Barrow 5.5 5.6 5.7 5.9 6.3 Current revenues plus indexation
Gunfleet 6.9 7.0 7.1 7.4 7.8 Current revenues plus indexation
Walney 1 12.5 12.8 12.9 13.1 13.6 Current revenues plus indexation
Robin Rigg 7.7 7.9 8.0 8.4 8.7 Current revenues plus indexation
Walney 2 12.9 13.2 12.5 12.3 16.3 Current revenues plus indexation
Sheringham Shoal 18.9 19.5 19.7 20.0 20.7 Current revenues plus indexation
Ormonde 11.6 11.8 12.0 12.2 12.6 Current revenues plus indexation
Greater Gabbard 26.0 26.6 26.9 27.3 28.4 Current revenues plus indexation
London Array 37.6 39.2 39.5 39.5 41.8 Current revenues plus indexation
Thanet 17.5 15.7 19.5 18.6 Current revenues plus indexation
Lincs 25.6 26.7 27.2 28.2 Current revenues plus indexation
Gwynt y mor 26.3 23.6 29.3 32.7 Current revenues plus indexation
West of Duddon Sands 21.3 22.0 22.6 Current revenues plus indexation
Humber Gateway 9.7 12.1 Current revenues plus indexation
Westermost Rough 11.6 13.2 Current revenues plus indexation
Forecast to asset transfer to OFTO 4.7 34.5 National Grid Forecast
Forecast to asset transfer to OFTO in 2019/20 National Grid Forecast
Forecast to asset transfer to OFTO in 2020/21 National Grid Forecast
Forecast to asset transfer to OFTO in 2021/22 National Grid Forecast
Offshore Transmission Pass-Through (B7) 218.4 248.4 260.8 270.2 318.1
26/01/2018
Notes
78.9
35.3 29.3
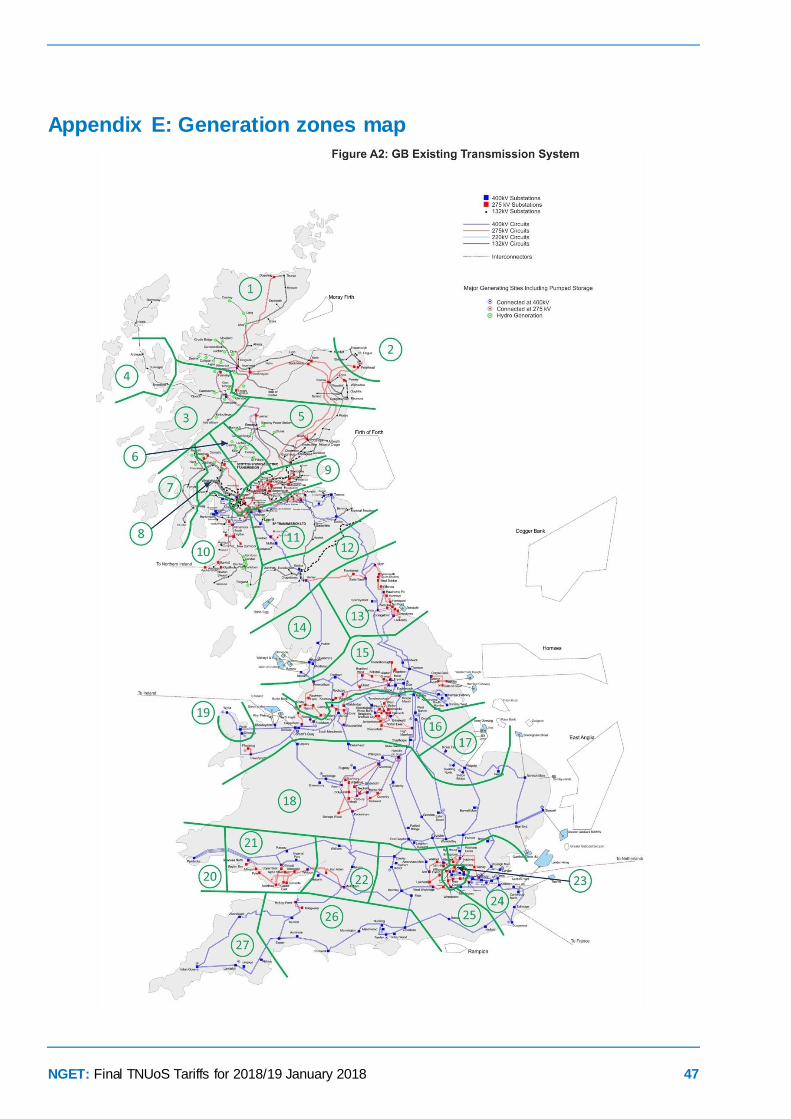
NGET: Final TNUoS Tariffs for 2018/19 January 2018 47
Appendix E: Generation zones map
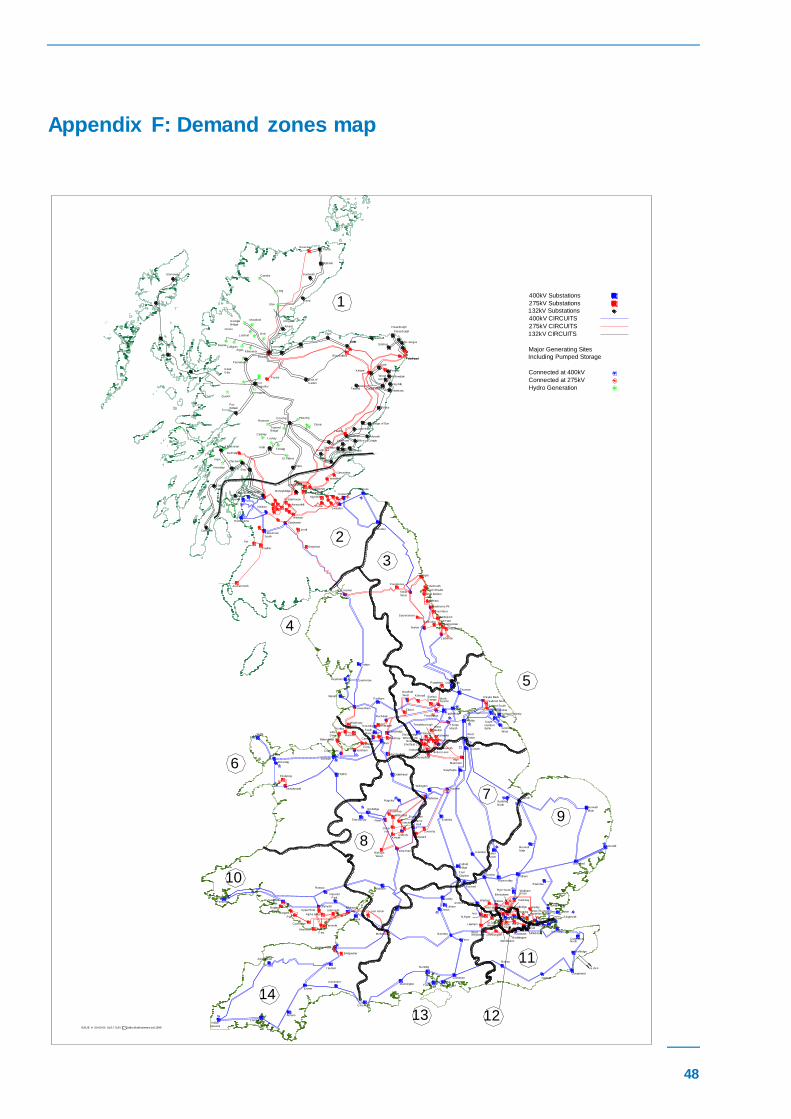
NGET: Final TNUoS Tariffs for 2018/19 January 2018 48
Appendix F: Demand zones map
Baglan
Bay
Leighton
Buzzard
Patford
Bridge
Northfleet EastS inglewell
Fourstones
Humber Refinery
Spald ing
North
West Thurrock
ISSUE A 04-03-05 41/177145 C Collins Bartholomew Ltd 1999
Dingwall
Dounreay
Newarthill
Easterhouse
Kincard ine
Wishaw
Strathaven
Kilmarnock
South
Ayr
Coylton
Saltend South
Hackney
Coryton
RatcliffeWillington
Drakelow
Shrewsbury
Cross
Weybridge
Cross
Wood
North
West
FrystonGrange
Ferry
Winco Bank
Norton Lees
Creyke Beck
Saltend North
Grimsby
West
Drax
Lackenby
Greystones
GrangetownSaltholme
Norton
Spennymoor
Tod Point
Hartlepool
Hart Moor
Hawthorne Pit
Offerton
West Boldon
South Shields
Tynemouth
Ste lla
West
Harker
Eccles
Blyth
Indian
Queens
Landulph
Abham
Exeter
Axminster
Chickerell
Mannington
Taunton
Alverdiscott
Hinkley Point
Bridgwater
Aberthaw
Cowbridge
Pyle
Margam
Swansea
North
Card iff
East
Tremorfa
Alpha Steel
UskmouthUpper Boat
Cilfynydd
Imperia l
Park
Rassau
Whitson
Seabank
Iron Acton
Walham
Melksham
Minety DidcotCulham
Cowley
Bramley
Fleet
Nursling
Fawley Botley Wood
Lovedean
Bolney
Ninfield
Dungeness
Sellindge
Canterbury
E de F
Kemsley
Grain
Kingsnorth
Rayle igh Main
Northfleet
L ittlebrook
Tilbury
Warley
Barking
Redbridge
W.HamCity Rd
Tottenham
Brimsdown
Waltham
Ealing
Mill HillWillesden
Watford
St Johns
Wimbledon
New Hurst
E lstree
Rye House
N.Hyde
Sundon
Laleham
Iver
Amersham Main
Wymondley
Pelham
Braintree
Burwell
Main
Bramford
Eaton
Socon
Grendon
East
Claydon
Enderby
Walpole
Norwich
Main
Coventry
Berkswell
Rugeley
Cellarhead
IronbridgeBushbury
Penn
Willenhall
Ocker
Hill
K itwellO ldbury
Bustleholm
NechellsHams
Hall
B ishops
Wood
Feckenham
Legacy
Trawsfynydd
Ffestin iog
Dinorwig
Pentir
Wylfa
Deeside
Capenhurst Frodsham
Fiddlers
Rainhill
K irkby
Lister
Drive
Birkenhead
Washway
Farm
Penwortham
Carrington
South
Manchester
Daines
Macclesfield
Bredbury
Sta lybridge
Rochdale
WhitegateKearsley
Elland
Stocksbridge
West
Melton
Aldwarke
Thurcroft
BrinsworthJordanthorpe
Chesterfield
Sheffie ld City
Neepsend
Pitsmoor
Templeborough Thorpe
Marsh
Keadby
West
Burton
Cottam
High
Marnham
Staythorpe
Stanah
Heysham
Padiham
Hutton
Bradford
West K irkstall Skelton
Poppleton
Thornton
Quernmore
Monk
EggboroughFerrybridge
Killingholme
South
Humber Bank
Sizewell
Pembroke
Osbaldwick
Rowdown
BeddingtonChessington
West
Inveraray
Auchencrosh
400kV Substations
275kV Substations
132kV Substations
400kV CIRCUITS
275kV CIRCUITS
132kV CIRCUITS
Major Generating Sites
Including Pumped Storage
Connected at 400kV
Connected at 275kV
Hydro Generation
11
12
Fasnakyle
Beauly
Deanie
Lairg
Shin
Nairn
Kintore
Blackhillock
Elg in
Keith
Peterhead
Persley
Fraserburgh
Invergarry
Quoich
CulligranAlgas
Kilmorack
Grudgie
Bridge
Mossford
OrrinLuichart
A lness
Brora
Cassley Dunbeath
Mybster
St. FergusStrichen
Macduff
Boat of
Garten
Redmoss
Willowdale
Clayhills
Dyce
Craig iebuckler
Wood
Hill
Tarland
Dalmally
K illin
Errochty
Tealing
Braco
GlenagnesDudhope
Milton of Cra ig ie
Dudhope
Lyndhurst
CharlstonBurghmuir
Arbroath
Fiddes
Bridge of Dun
Luna Head
St. Fillans
Fin larig
Lochay
Cashley
Rannoch
Tummel Bridge
Clunie
Kilchrennan
NantClachan
Port
Ann
Carradale
1
2
3
4
5
6
7
8
9
10
13
14
Windyhill
Dunoon
Inverkip
Devol
Moor
Hunterstone
Sloy
Fort
William
Bonnybridge
Neilson
Great
Glen
Conon
Fort
Augustus
Foyers
Inverness
Stornoway
Elvanfoot
Smeaton
Glenrothes
Westfie ld
Cume
Grangemouth
Longannet
L inmill
S ighthill
P itiochry
Torness
Cockenzie
Keith
Peterhead
Fraserburgh
Thurso
![NGET An.nn [document title] - National Grid](https://static.fdocuments.us/doc/165x107/617c027f1d7b0172d27b341b/nget-annn-document-title-national-grid.jpg)


![NGET An.nn [document title] - National Grid plc](https://static.fdocuments.us/doc/165x107/623fdf194029604cc2040bbc/nget-annn-document-title-national-grid-plc.jpg)