Final TNUoS tariffs for 2017/18 - National Grid · generation revenue compared to last year,...
40
1 Final TNUoS tariffs for 2017/18 This information paper provides National Grid’s Final Transmission Network Use of System (TNUoS) tariffs for 2017/18, applicable to Generators and Suppliers, effective from 01 April 2017. 31 January 2017 Tariff Information Paper
Transcript of Final TNUoS tariffs for 2017/18 - National Grid · generation revenue compared to last year,...

1
Final TNUoS tariffs for 2017/18
This information paper provides National Grid’s Final Transmission Network Use of System (TNUoS) tariffs for 2017/18, applicable to Generators and Suppliers, effective from 01 April 2017.
31 January 2017
Tariff Information Paper

2
Contents
1 Executive Summary ............................................................... 4
2 Final 2017/18 Tariffs Summary .............................................. 6
2.1 Final Generation Tariffs 2017/18 .......................................................... 6
2.2 Final Demand Tariffs 2017/18 .............................................................. 8
3 Introduction .......................................................................... 10
3.1 Background ........................................................................................ 10
3.2 Charging Principles ............................................................................ 10
3.3 P272 ................................................................................................... 11
4 Updates to the Charging Model for 2017/18 ....................... 12
4.1 Changes affecting the locational element of tariffs ............................ 12
4.2 Changes affecting the residual element of tariffs ............................... 13
5 Comparison of final generation tariffs 2016/17 vs 2017/18 19
5.1 Wider zonal generation tariffs ............................................................. 19
5.2 Onshore local circuit tariffs ................................................................. 21
5.3 Onshore local substation tariffs .......................................................... 21
5.4 Offshore local generation tariffs ......................................................... 21
6 Comparison of final demand tariffs 2016/17 vs 2017/18 ... 22
6.1 Half Hour Demand Tariffs ................................................................... 22
6.2 Non Half-hourly demand tariffs ........................................................... 23
7 Tools and Supporting Information ...................................... 25
7.1 Further information ............................................................................. 25
7.2 Charging forums ................................................................................. 25
7.3 Charging models ................................................................................ 25
7.4 Numerical data ................................................................................... 25
Appendix A : Revenue Tables ............................................. 27
Appendix B : Locational Demand Changes ....................... 31
Appendix C : Annual Load Factors ..................................... 32
Appendix D : Demand tariffs ............................................... 38
Appendix E : Generation Zones .......................................... 39
Any Questions?
Contact: Kathy Heard,
Katharine Clench, Jo Zhou
or Tom Selby
kathryn.heard@nationalgri
d.com
katharine.clench@national
grid.com
thomas.selby@nationalgri
d.com
Kathy 01926 656281
Katharine 01926 656036
Tom 01926 656450
Jo 01926 654184

3
Appendix F : Demand Zones ............................................... 40
4
1 Executive Summary
This document contains the Final Transmission Network Use of System (TNUoS) tariffs for
2017/18, which will become effective on 1 April 2017. TNUoS charges are paid by generators
and suppliers for use of the GB Transmission networks.
Total Transmission Owner (TO) allowed revenue to be recovered from TNUoS charges will be
£2,631.5m in 2017/18, a decrease of £77.2m from 2016/17. Generation tariffs have been set to
recover £390.3m to ensure average annual generation tariffs remain below the €2.5/MWh limit
set by European Commission Regulation (EU) No 838/2010. This is a £63.1m reduction in
generation revenue compared to last year, reflecting reductions in forecast generation output
and the Euro exchange rate, and results in an average decrease of £1.44/kW in generation
tariffs from 2016/17. Demand tariffs have therefore been set to recover £2,241.23m of revenue,
a decrease of £14m from 2016/17. This reflects the above reduction in overall revenue for GB
Transmission Owners.
During 2016/17 National Grid has been further improving its demand forecasting capability to
model not only the significant increase in distributed generation in recent years, but also the
significant potential variability. Consequently, we are forecasting average triad demand of
47.7GW, average Half-Hour (HH) triad demand of 13.2GW and Non-Half-Hour (NHH) demand
of 25.3TWh. These numbers have not changed from our Draft tariff forecast published in
December 2016.
These chargeable demand numbers and updated TO revenues mean that the average HH
demand tariff has increased by £3.33/kW and the average NHH demand tariff has decreased
by 0.04p/kWh compared to 2016/17.
Changes to the Final tariffs in relation to our Draft tariff forecast have predominantly been
influenced by updates to TO revenue inputs to the charging models. TO revenues have been
updated based on the final revenue submissions from each of the onshore and offshore TOs,
which has decreased the total TO revenue input by £34.5m since the Draft tariffs.
We have also made some very minor changes to the Annual Load Factors for generation, in
accordance with the CUSC Charging Methodology*. These reflect the final Annual Load Factors
that were published on our website on 25 January 2017 which take into account comments
from generators on the draft Annual Load Factors published in December 2016.
The Error Margin element of the tariff forecast which is used to calculate the split of revenue to
be recovered from generation and demand (the G/D split) remains fixed from our June forecast
at 21%.
Please note that this tariff forecast has been undertaken in accordance with the current CUSC
charging methodology and therefore no current charging modifications are taken into account in
these tariffs. We recognise however that there are a number of ongoing modifications which
* Please see paragraph 14.15.100 onwards for information within the Charging Methodology on Annual
Load Factors (ALFs).

5
could impact tariffs but unless a mid-year tariff change process is initiated these are very
unlikely to impact 2017/18 tariffs. More details on ongoing charging modifications can be found
on the National Grid website†.
We welcome feedback on any aspect of this document and related processes. Do let us know if
you have any further suggestions as to how we can better work with you to improve the tariff
forecasting process or if you have any questions on this document. Given that there has been
little change to the assumptions used to calculate these Final tariffs since our Draft tariff
forecast, we are minded not to hold a tariff webinar on this occasion but please let us know if
you would still welcome a webinar session.
† Please find further information here: http://www2.nationalgrid.com/UK/Industry-information/Electricity-
codes/CUSC/Modifications/Current/
6
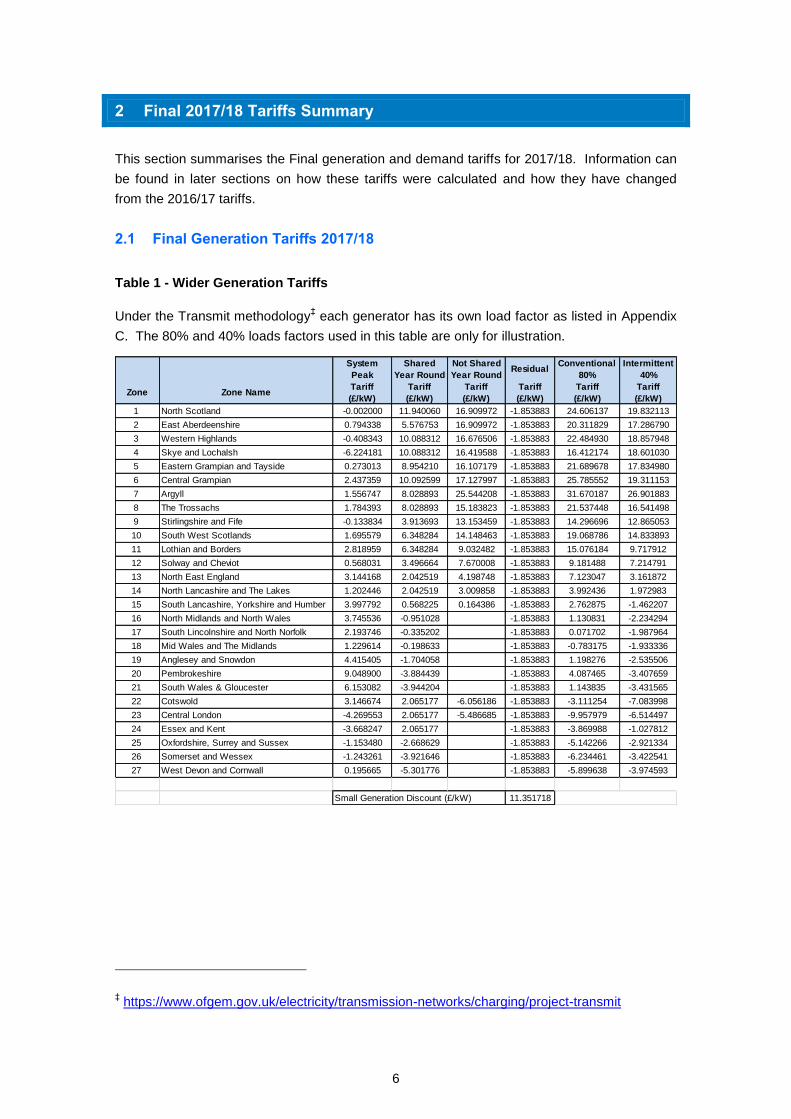
2 Final 2017/18 Tariffs Summary
This section summarises the Final generation and demand tariffs for 2017/18. Information can
be found in later sections on how these tariffs were calculated and how they have changed
from the 2016/17 tariffs.
2.1 Final Generation Tariffs 2017/18
Table 1 - Wider Generation Tariffs
Under the Transmit methodology‡ each generator has its own load factor as listed in Appendix
C. The 80% and 40% loads factors used in this table are only for illustration.
‡ https://www.ofgem.gov.uk/electricity/transmission-networks/charging/project-transmit
System
Peak
Shared
Year Round
Not Shared
Year RoundResidual
Conventional
80%
Intermittent
40%
Zone Zone NameTariff
(£/kW)
Tariff
(£/kW)
Tariff
(£/kW)
Tariff
(£/kW)
Tariff
(£/kW)
Tariff
(£/kW)
1 North Scotland -0.002000 11.940060 16.909972 -1.853883 24.606137 19.832113
2 East Aberdeenshire 0.794338 5.576753 16.909972 -1.853883 20.311829 17.286790
3 Western Highlands -0.408343 10.088312 16.676506 -1.853883 22.484930 18.857948
4 Skye and Lochalsh -6.224181 10.088312 16.419588 -1.853883 16.412174 18.601030
5 Eastern Grampian and Tayside 0.273013 8.954210 16.107179 -1.853883 21.689678 17.834980
6 Central Grampian 2.437359 10.092599 17.127997 -1.853883 25.785552 19.311153
7 Argyll 1.556747 8.028893 25.544208 -1.853883 31.670187 26.901883
8 The Trossachs 1.784393 8.028893 15.183823 -1.853883 21.537448 16.541498
9 Stirlingshire and Fife -0.133834 3.913693 13.153459 -1.853883 14.296696 12.865053
10 South West Scotlands 1.695579 6.348284 14.148463 -1.853883 19.068786 14.833893
11 Lothian and Borders 2.818959 6.348284 9.032482 -1.853883 15.076184 9.717912
12 Solway and Cheviot 0.568031 3.496664 7.670008 -1.853883 9.181488 7.214791
13 North East England 3.144168 2.042519 4.198748 -1.853883 7.123047 3.161872
14 North Lancashire and The Lakes 1.202446 2.042519 3.009858 -1.853883 3.992436 1.972983
15 South Lancashire, Yorkshire and Humber 3.997792 0.568225 0.164386 -1.853883 2.762875 -1.462207
16 North Midlands and North Wales 3.745536 -0.951028 0.000000 -1.853883 1.130831 -2.234294
17 South Lincolnshire and North Norfolk 2.193746 -0.335202 0.000000 -1.853883 0.071702 -1.987964
18 Mid Wales and The Midlands 1.229614 -0.198633 0.000000 -1.853883 -0.783175 -1.933336
19 Anglesey and Snowdon 4.415405 -1.704058 0.000000 -1.853883 1.198276 -2.535506
20 Pembrokeshire 9.048900 -3.884439 0.000000 -1.853883 4.087465 -3.407659
21 South Wales & Gloucester 6.153082 -3.944204 0.000000 -1.853883 1.143835 -3.431565
22 Cotswold 3.146674 2.065177 -6.056186 -1.853883 -3.111254 -7.083998
23 Central London -4.269553 2.065177 -5.486685 -1.853883 -9.957979 -6.514497
24 Essex and Kent -3.668247 2.065177 0.000000 -1.853883 -3.869988 -1.027812
25 Oxfordshire, Surrey and Sussex -1.153480 -2.668629 0.000000 -1.853883 -5.142266 -2.921334
26 Somerset and Wessex -1.243261 -3.921646 0.000000 -1.853883 -6.234461 -3.422541
27 West Devon and Cornwall 0.195665 -5.301776 0.000000 -1.853883 -5.899638 -3.974593
11.351718Small Generation Discount (£/kW)

7
Table 2 - Local Substation Tariffs
Table 3 - Local Circuit Tariffs
More details on local circuit changes can be found in section 5.2 below.
132kV 275kV 400kV
<1320 MW No redundancy 0.184663 0.105639 0.076115
<1320 MW Redundancy 0.406797 0.251688 0.183048
>=1320 MW No redundancy 0.331225 0.239543
>=1320 MW Redundancy 0.543787 0.396919
Substation Rating Connection Type
Local Substation Tariff (£/kW)
Substation Name (£/kW) Substation Name (£/kW) Substation Name (£/kW)
Achruach 3.939872 Dinorwig 2.206750 Kilmorack 0.181645
Aigas 0.601544 Dunlaw Extension 1.379173 Langage 0.604792
An Suidhe 2.819601 Brochlock 1.317382 Lochay 0.336577
Arecleoch 1.910276 Dumnaglass 1.707609 Luichart 0.527938
Baglan Bay 0.699507 Edinbane -6.291543 Mark Hill 0.805306
Beinneun Wind Farm 1.381894 Earlshaugh Wind Farm 3.464522 Margree 5.537474
Bhlaraidh Wind Farm 0.593841 Ewe Hill 1.263917 Marchwood 0.351279
Black Hill 0.793539 Farr Windfarm 2.065880 Millennium Wind 1.680242
BlackCraig Wind Farm 5.789906 Fallago 0.905483 Moffat 0.155042
Black Law 1.607155 Carraig Gheal 4.045828 Mossford 2.648705
BlackLaw Extension 3.408181 Ffestiniogg 0.232696 Nant 2.308346
Bodelwyddan 0.105826 Finlarig 0.294505 Necton 1.034410
Carrington -0.032882 Foyers 0.692563 Rhigos 0.093347
Clyde (North) 0.100867 Galawhistle 0.778413 Rocksavage 0.016271
Clyde (South) 0.116647 Glendoe 1.691813 Saltend 0.313585
Corriegarth 3.466566 Ulziside 8.931637 South Humber Bank 0.867492
Corriemoillie 1.530696 Gordonbush 0.376037 Spalding 0.255407
Coryton 0.047815 Griffin Wind -0.845619 Kilbraur 0.237471
Cruachan 1.676790 Hadyard Hill 2.545783 Stronelairg 1.332406
Crystal Rig 0.334929 Harestanes 2.304928 Strathy Wind 2.018352
Culligran 1.594105 Hartlepool 0.552782 Wester Dodds 0.647899
Deanie 2.618888 Hedon 0.166412 Whitelee 0.097613
Dersalloch 2.215514 Invergarry 1.305184 Whitelee Extension 0.271364
Didcot 0.476938 Kilgallioch 0.967994

8
Table 4 - Offshore Local Tariffs
2.2 Final Demand Tariffs 2017/18
Table 5 - Demand Tariffs
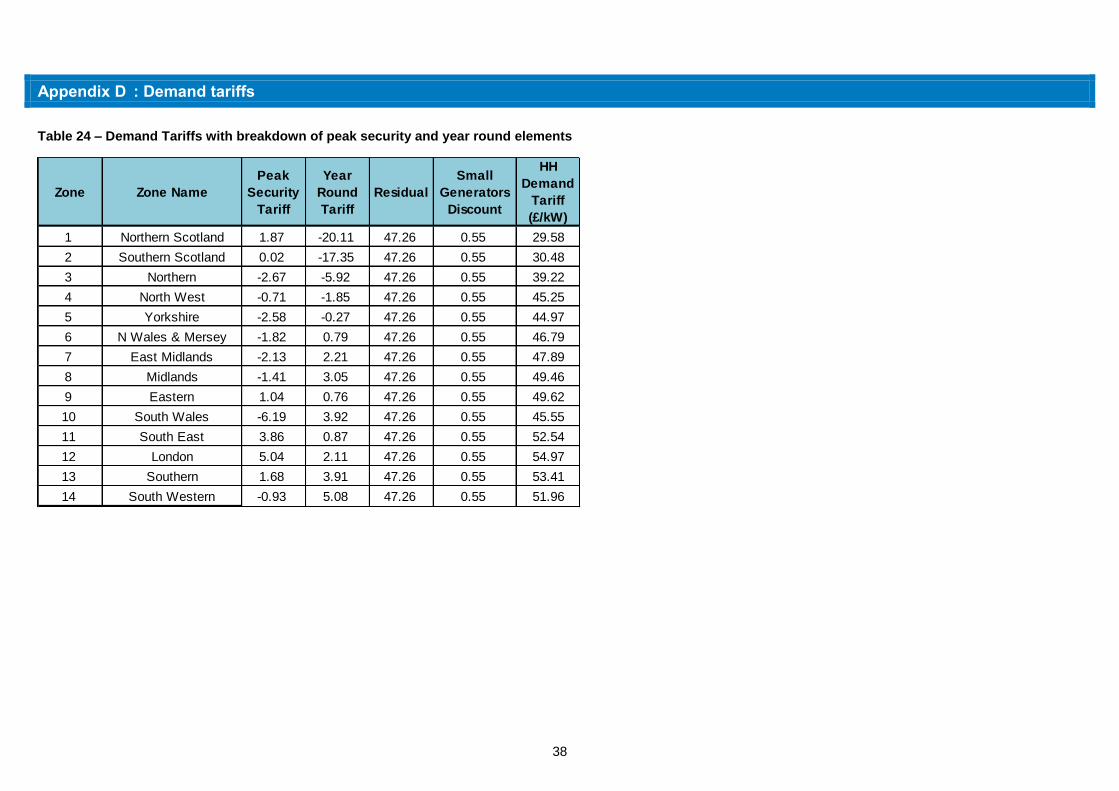
The breakdown of the HH tariff into the peak and year round components are found in
Appendix D.
Substation Circuit ETUoS
Barrow 7.441339 38.933077 0.966762
Greater Gabbard 13.951635 32.059484 0.000000
Gunfleet 16.104666 14.785345 2.763466
Gwynt Y Mor 16.990859 16.738095 0.000000
Lincs 13.906629 54.447630 0.000000
London Array 9.466607 32.242737 0.000000
Ormonde 23.004623 42.855458 0.341522
Robin Rigg East -0.425554 28.189344 8.737175
Robin Rigg West -0.425554 28.189344 8.737175
Sheringham Shoal 22.226453 26.066423 0.566607
Thanet 16.926252 31.539657 0.759271
Walney 1 19.854080 39.539350 0.000000
Walney 2 19.709687 39.887693 0.000000
West of Duddon Sands 7.661147 37.803015 0.000000
Westermost Rough 16.131802 27.288105 0.000000
Humber Gateway 13.520839 30.507520 0.000000
Offshore GeneratorTariff Component (£/kW)
Zone Zone Name
HH Demand
Tariff (£/kW)
NHH Demand
Tariff (p/kWh)
1 Northern Scotland 29.577679 6.215608
2 Southern Scotland 30.480981 4.262747
3 Northern 39.223189 5.943493
4 North West 45.245665 5.878185
5 Yorkshire 44.967107 5.978783
6 N Wales & Mersey 46.791119 6.607274
7 East Midlands 47.889103 6.248796
8 Midlands 49.457444 6.426317
9 Eastern 49.617070 7.095134
10 South Wales 45.551887 5.775370
11 South East 52.537577 7.475220
12 London 54.969649 5.487378
13 Southern 53.405080 7.047920
14 South Western 51.955583 7.464813

9
These tariffs include a small generators discount revenue recovery of £0.552245/kW and
0.0751737p/kWh.
10
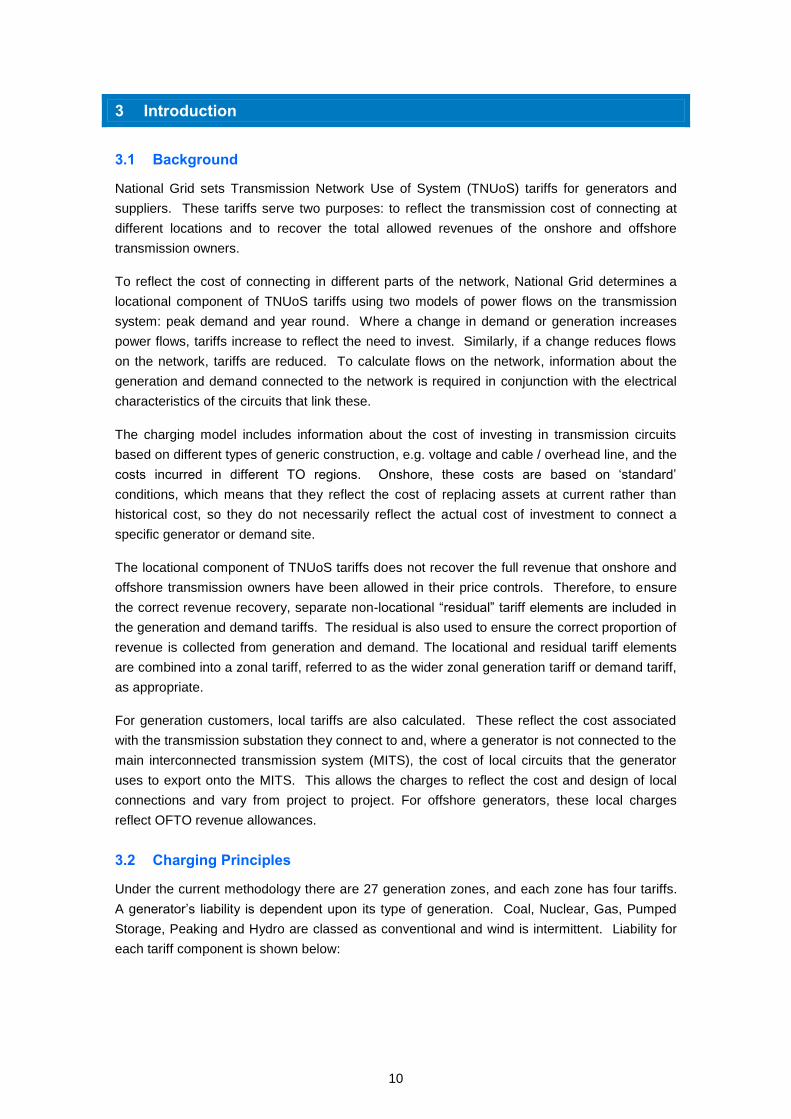
3 Introduction
3.1 Background
National Grid sets Transmission Network Use of System (TNUoS) tariffs for generators and
suppliers. These tariffs serve two purposes: to reflect the transmission cost of connecting at
different locations and to recover the total allowed revenues of the onshore and offshore
transmission owners.
To reflect the cost of connecting in different parts of the network, National Grid determines a
locational component of TNUoS tariffs using two models of power flows on the transmission
system: peak demand and year round. Where a change in demand or generation increases
power flows, tariffs increase to reflect the need to invest. Similarly, if a change reduces flows
on the network, tariffs are reduced. To calculate flows on the network, information about the
generation and demand connected to the network is required in conjunction with the electrical
characteristics of the circuits that link these.
The charging model includes information about the cost of investing in transmission circuits
based on different types of generic construction, e.g. voltage and cable / overhead line, and the
costs incurred in different TO regions. Onshore, these costs are based on ‘standard’
conditions, which means that they reflect the cost of replacing assets at current rather than
historical cost, so they do not necessarily reflect the actual cost of investment to connect a
specific generator or demand site.
The locational component of TNUoS tariffs does not recover the full revenue that onshore and
offshore transmission owners have been allowed in their price controls. Therefore, to ensure
the correct revenue recovery, separate non-locational “residual” tariff elements are included in
the generation and demand tariffs. The residual is also used to ensure the correct proportion of
revenue is collected from generation and demand. The locational and residual tariff elements
are combined into a zonal tariff, referred to as the wider zonal generation tariff or demand tariff,
as appropriate.
For generation customers, local tariffs are also calculated. These reflect the cost associated
with the transmission substation they connect to and, where a generator is not connected to the
main interconnected transmission system (MITS), the cost of local circuits that the generator
uses to export onto the MITS. This allows the charges to reflect the cost and design of local
connections and vary from project to project. For offshore generators, these local charges
reflect OFTO revenue allowances.
3.2 Charging Principles
Under the current methodology there are 27 generation zones, and each zone has four tariffs.
A generator’s liability is dependent upon its type of generation. Coal, Nuclear, Gas, Pumped
Storage, Peaking and Hydro are classed as conventional and wind is intermittent. Liability for
each tariff component is shown below:

11
Conventional Generator (Coal, Nuclear, Gas, Pumped Storage, Peaking and Hydro)
Intermittent Generator (wind)
Each generator has a specific Annual Load Factor based on its performance over the last five
years. Where new plant does not have at least three complete charging year’s history then
generic load factors specific to the technology are also used. The Annual Load Factors used in
the Final tariffs are listed in Appendix C.
3.3 P272
Balancing and Settlement Code amendment P272 makes it mandatory that Non-Half-Hour
(NHH) profile classes 5-8 move to metering classes E, F and G Half-Hour (HH) settlement. The
subsequent amendment P322 revised the completion date for P272 to 1 April 2017, so P272
will take full effect in 2017/18.
Wider
Tariff Peak
Security element
Year Round Shared
Element
Year Round
Not shared
element
Residual
element
Annual Load
Factor
Wider
Tariff
Year Round Shared
Element
Year Round
Not shared
element
Residual
element
Annual Load
Factor
12
4 Updates to the Charging Model for 2017/18
Since the Draft tariffs were published in December we have updated allowed revenue using
final revenue submissions from onshore and offshore Transmission Owners, made adjustments
to Annual Load Factors and corrected an error in October actual RPI (with relation to expansion
constant and local substation tariffs).
There have been no changes to the charging methodology, transport model demand,
generation and circuits, chargeable demand, or the error margin that is used to calculate the
proportion of revenue to be recovered from generation and demand (G/D split).
4.1 Changes affecting the locational element of tariffs
The locational element of generation and demand tariffs is based upon:
Contracted generation as at 31 October 2016;
The network model;
Demand data provided under the Grid Code, which includes week 24 demand forecast
data provided by the Distribution Network Operators (DNO), forecasts of demand at
directly connected demand sites such as steelworks and railways and the effect of
some embedded generation; and
RPI (which increases the expansion constant).
These inputs would have all remained unchanged since the Draft tariffs, however an error was
found in the actual RPI for October. This has changed the expansion factor from
£13.575354/MWkm to £13.57449607/MWkm.
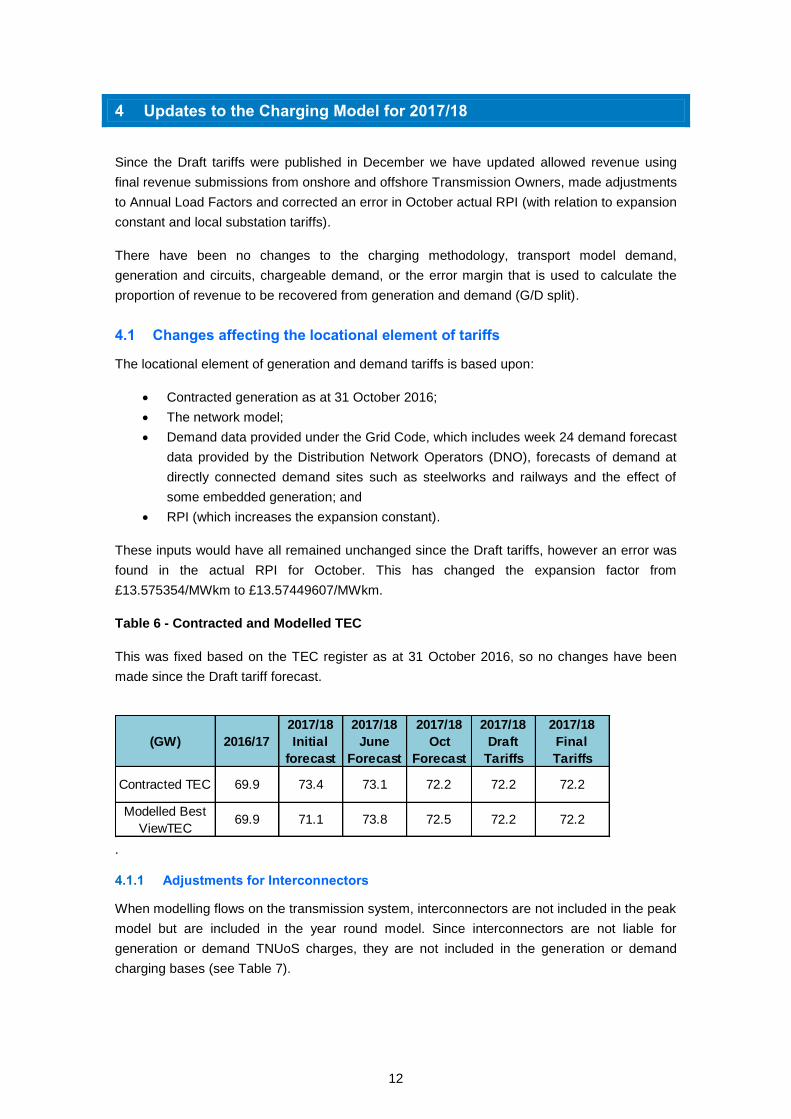
Table 6 - Contracted and Modelled TEC
This was fixed based on the TEC register as at 31 October 2016, so no changes have been
made since the Draft tariff forecast.
.
4.1.1 Adjustments for Interconnectors
When modelling flows on the transmission system, interconnectors are not included in the peak
model but are included in the year round model. Since interconnectors are not liable for
generation or demand TNUoS charges, they are not included in the generation or demand
charging bases (see Table 7).
(GW) 2016/17
2017/18
Initial
forecast
2017/18
June
Forecast
2017/18
Oct
Forecast
2017/18
Draft
Tariffs
2017/18
Final
Tariffs
Contracted TEC 69.9 73.4 73.1 72.2 72.2 72.2
Modelled Best
ViewTEC69.9 71.1 73.8 72.5 72.2 72.2

13
Table 7 – Interconnectors
The table below reflects the contracted position of interconnectors on 31 October 2016 and
thus there has been no change since the Draft forecast.
4.1.2 RPI
The RPI index for the components detailed below is derived as the percentage increase of the
average May – October RPI for 2016/17 compared to 2015/16.
Expansion Constant
The expansion constant has decreased to £13.57449607MWkm from £13.575354/MWkm in
the Draft tariffs, to reflect marginally lower actual RPI. This has had a very small impact on
tariffs in all zones, decreasing the stretch of the system circuit lengths and so decreasing the
magnitude of locational tariffs, i.e. positive tariffs less positive and negative tariffs less negative.
Local substation and offshore substation tariffs
Local onshore substation tariffs are indexed by May - October RPI as are offshore local circuit
tariffs. The RPI has been reflected in the tariffs.
4.2 Changes affecting the residual element of tariffs
4.2.1 Allowed Revenues
National Grid recovers revenue on behalf of all onshore and offshore Transmission Owners
(TOs & OFTOs) in Great Britain. Table 8 shows the forecast 2017/18 revenues that have been
used in calculating the Final tariffs.
The Scottish Hydro Electricity Transmission revenue has decreased by £25.8m following final
submission of revenue information in January. Whilst we were not privy to the detail, it is known
that this is predominantly due to correction of an error in how connection charges are reported.
Scottish Power Transmission revenue has decreased by £0.9m since the Draft forecast.
The OFTO revenue has reduced by £4m due to updates provided in the final revenue
submissions by OFTOs. This is mainly due to increases to RPI and refunds for tender fees.
National Grid Electricity Transmission revenue has increased by £5m. The revenue recovered
in 15/16 has reduced and hence increased through the licence ‘K’ factor the NGET revenue for
17/18.

14
Ofgem published its funding decision on the 2016 Network Innovation Competition which
awards £33.1m to four projects.§ This has since been amended by Ofgem to £32.1m following
the decision that previously awarded money should be refunded.
Tariffs have therefore been calculated to recover £2,631.5m of revenue. This is a reduction of
£34.5m from the December Draft forecast of £2,666.0m. This update is based on TO
submissions of revenue requirements to NGSO by 25 January 2017, on which they are
invoiced.
Table 8 – Allowed Revenues
4.2.2 Demand: Generation Split
Section 14.14.5 (v) in the Connection and Use of System Code (CUSC) currently limits average
annual generation use of system charges in Great Britain to €2.5/MWh. The net revenue that
can be recovered from generation is therefore determined by: the €2.5/MWh limit, exchange
rate and forecast output of chargeable generation. An error margin is also applied to reflect
revenue and output forecasting accuracy.
Exchange Rate
§https://www.ofgem.gov.uk/network-regulation-riio-model/network-innovation/electricity-
network-innovation-competition
2016/17
TNUoS
Revenue
Jan
2016
Final
Feb 2016
Initial
View
June
2016
Update
Oct
2016
Update
Dec
2016
Draft
Jan
2017 Final
National Grid
Price controlled revenue 1,828.2 1,806.4 1,811.2 1,750.4 1,753.4 1,748.8
Less income from connections 42.7 46.5 46.5 44.1 44.0 41.9
Income from TNUoS 1,785.5 1,760.0 1,764.7 1,706.3 1,709.5 1,706.9
Scottish Power Transmission
Price controlled revenue 306.4 347.1 341.0 327.7 333.5 333.7
Less income from connections 11.8 13.9 14.0 11.4 11.4 12.8
Income from TNUoS 294.6 333.1 327.0 316.3 322.1 321.0
SHE Transmission
Price controlled revenue 326.2 328.5 327.3 305.8 312.6 304.7
Less income from connections 3.4 3.6 3.6 (13.6) (14.6) 3.4
Income from TNUoS 322.8 324.9 323.7 319.4 327.2 301.4
Offshore 260.8 276.5 279.2 293.0 274.1 270.2
Network Innovation Competition 44.9 40.5 40.5 40.5 33.1 32.1
Total to Collect from TNUoS 2,708.7 2,735.0 2,735.1 2,675.6 2,666.0 2,631.5
£m Nominal Value
2017/18 TNUoS Revenue

15
As prescribed by the Use of System charging methodology, the exchange rate for 2017/18 is
taken from the Economic and Fiscal Outlook published by the Office of Budgetary
Responsibility in March 2016. The value published is €1.27/£, which has not changed since the
Draft tariffs.
Generation Output
The forecast output of generation is aligned with Future Energy Scenario Generation output
forecasts. Our forecast of 251TWh reflects our view of the total generation of generators that
are liable for generation TNUoS charges during 2017/18, and has not changed since the Draft
tariffs.
Error Margin
The error margin remains unchanged from the June forecast at 21%.
The parameters used to calculate the proportions of revenue collected from generation and
demand are shown in Table 9.
Table 9 - Generation and Demand revenue proportions
4.2.3 Charging bases for 2017/18
Generation
The generation charging base we are forecasting is less than contracted TEC. It excludes
interconnectors, which are not chargeable, and generation that we do not expect to be
contracted during the charging year either due to closure, termination or delay and includes any
generators that we believe may increase their TEC.
We are unable to breakdown our best view of generation as some of the information used to
derive it could be commercially sensitive. The change in contracted TEC, as per the TEC
register is shown in the appendices.
Demand
Our forecast of system demand at Triad in Winter 2017/18 is 47.7GW. Our forecast of Half-
Hour metered demand at triad is 13.2GW. The forecast of Non Half-Hour demand during
2017/18 is 25.3TWh. These numbers remain unchanged from the Draft tariff forecast in
December.
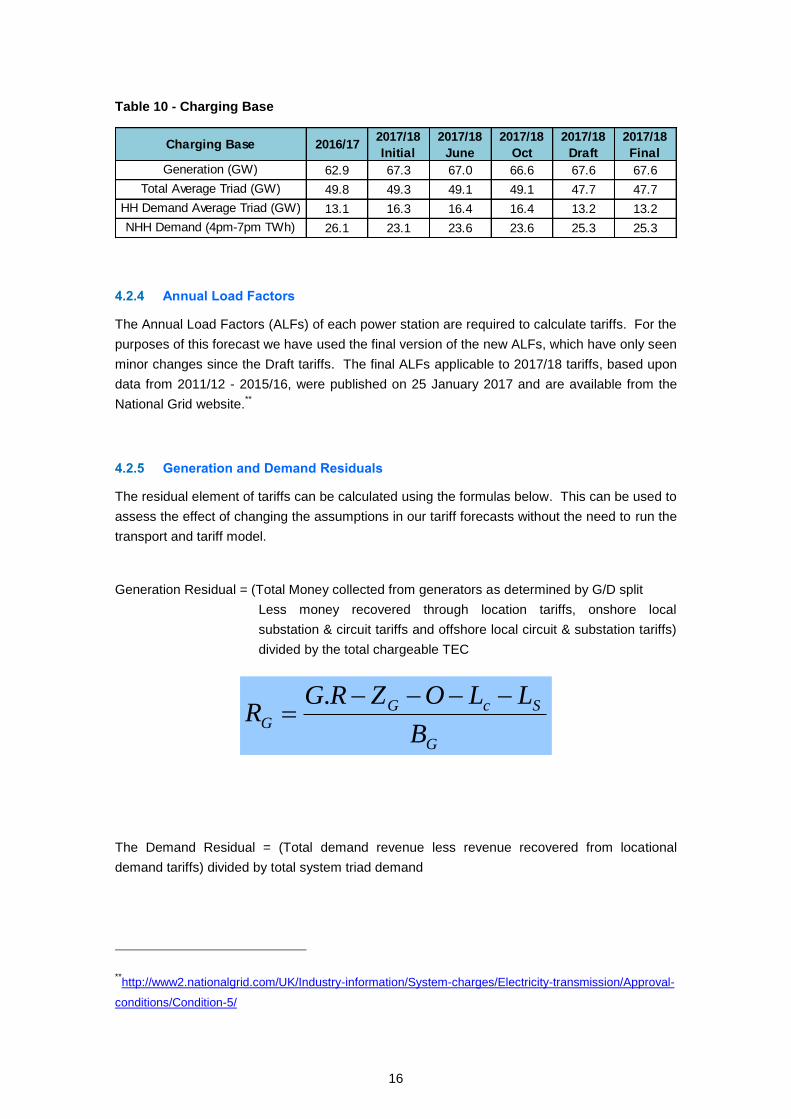
16
Table 10 - Charging Base
4.2.4 Annual Load Factors
The Annual Load Factors (ALFs) of each power station are required to calculate tariffs. For the
purposes of this forecast we have used the final version of the new ALFs, which have only seen
minor changes since the Draft tariffs. The final ALFs applicable to 2017/18 tariffs, based upon
data from 2011/12 - 2015/16, were published on 25 January 2017 and are available from the
National Grid website.**
4.2.5 Generation and Demand Residuals
The residual element of tariffs can be calculated using the formulas below. This can be used to
assess the effect of changing the assumptions in our tariff forecasts without the need to run the
transport and tariff model.
Generation Residual = (Total Money collected from generators as determined by G/D split
Less money recovered through location tariffs, onshore local
substation & circuit tariffs and offshore local circuit & substation tariffs)
divided by the total chargeable TEC
G
ScGG
B
LLOZRGR
.
The Demand Residual = (Total demand revenue less revenue recovered from locational
demand tariffs) divided by total system triad demand
**http://www2.nationalgrid.com/UK/Industry-information/System-charges/Electricity-transmission/Approval-
conditions/Condition-5/
Charging Base 2016/172017/18
Initial
2017/18
June
2017/18
Oct
2017/18
Draft
2017/18
Final
Generation (GW) 62.9 67.3 67.0 66.6 67.6 67.6
Total Average Triad (GW) 49.8 49.3 49.1 49.1 47.7 47.7
HH Demand Average Triad (GW) 13.1 16.3 16.4 16.4 13.2 13.2
NHH Demand (4pm-7pm TWh) 26.1 23.1 23.6 23.6 25.3 25.3

17
D
DD
B
ZRDR
.
Where:
RG is the Generation residual tariff (£/kW)
RD is the Demand residual tariff (£/kW)
G is the proportion of TNUoS revenue recovered from Generation
D is the proportion of TNUoS revenue recovered from Demand
R is the total TNUoS revenue to be recovered (£m)
ZG is the TNUoS revenue recovered from Generation locational zonal tariffs (£m)
ZD is the TNUoS revenue recovered from Demand locational zonal tariffs (£m)
O is the TNUoS revenue recovered from offshore local tariffs (£m)
LC is the TNUoS revenue recovered from onshore local circuit tariffs (£m)
LS is the TNUoS revenue recovered from onshore local substation tariffs (£m)
BG is the generator charging base (GW)
BD is the Demand charging base (Half-hour equivalent GW)
ZG, ZD and LC are determined by the locational elements of tariffs.
Table 11 - Residual Calculation
4.2.6 Small Generators Discount
2016/172017/18
Initial
2017/18
June
2017/18
October
2017/18
Draft
2017/18
Final
RG Generator residual tariff (£/kW) 0.51 -0.92 -2.09 -1.89 -1.85 -1.85
RD Demand residual tariff (£/kW) 45.33 46.34 47.95 46.61 47.98 47.26
G Proportion of revenue recovered from generation (%) 16.7% 16.4% 14.3% 14.6% 14.6% 14.8%
D Proportion of revenue recovered from demand (%) 83.3% 83.6% 85.7% 85.4% 85.4% 85.2%
R Total TNUoS revenue (£m) 2,709 2,735 2,735 2,676 2,666 2,631
ZG Revenue recovered from the locational element of generator tariffs (£m) 191.9 266.3 275.3 258.9 272.8 275.0
ZD Revenue recovered from the locational element of demand tariffs (£m) -2.4 0.6 -9.7 -3.1 -12.4 -12.4
O Revenue recovered from offshore local tariffs (£m) 200.6 212.9 223.4 225.1 210.2 208.5
LG Revenue recovered from onshore local substation tariffs (£m) 15.9 17.0 17.6 17.6 17.5 17.5
SG Revenue recovered from onshore local circuit tariffs (£m) 13.3 15.6 14.0 14.6 14.7 14.6
BG Generator charging base (GW) 62.9 67.3 67.0 66.6 67.6 67.6
BD Demand charging base (GW) 49.8 49.3 49.1 49.1 47.7 47.7

18
Table 12 – Small Generator Discount
The small generators discount has been calculated as £11.351718/kW. This equates to a
forecast of £26.3m which is recovered from Suppliers through the HH and NHH tariffs.
Generator Residual (£/kW) G -1.85
Demand Residual (£/kW) D 47.26
Small Generator Discount (£/kW) T = (G + D)/4 11.35
Forecast Small Generator Volume (kW) V 2,395,260
2017/18 SGD cost (£) V x T 27,190,316
Prior year reconcilation (£) R 856,870-
Total SGD Cost (£) C = (V x T) + R 26,333,446
Total System Triad Demand (kW) TD 47,684,351
Total HH Triad Demand (kW) HHD 13,227,055
Total NHH Consumption (kWh) NHHD 25,313,203,316
Increase in HH Demand tariff (£/kW) HHT = C/TD 0.55
Total Cost to HH Customers (£) HHC = HHT * HHD 7,304,575
Increase in NHH Demand tariff (p/kWh) NHHT = (C - HHC)/NHHD 0.08
Total Cost to NHH Customers (£) NHHC = NHHT * NHHD 19,028,870
Small Generator Discount Calculation

19
5 Comparison of final generation tariffs 2016/17 vs 2017/18
The following section provides details of the wider and local generation tariffs for 2017/18 and
how these have changed compared with the 2016/17 tariffs.
5.1 Wider zonal generation tariffs
Table and Figure 1 show the changes in generation wider TNUoS tariffs between 2016/17 and
2017/18.
The key changes between the two years are due to several factors. Plant closures and TEC
reductions in zones south of Central England have decreased generation in the South which
has the effect of increasing national North to South flows, primarily affecting Peak tariffs. The
inclusion of the Western HVDC link has increased Year Round tariffs in Scotland in the zones
close to the Northern end of the cable. Similarly, the generation tariffs in the zones at the
Southern end have decreased as a result of the local effect of the HVDC flows.
As an example, Table and Figure 1 show how the tariffs change for a conventional generator
with an 80% load factor and an intermittent generator with a 40% load factor. Under the
Transmit methodology each generator has its own load factor and the 80% and 40% load
factors used here are only for illustration.
On average generation tariffs have reduced because lower total forecast generation output
(TWh) combined with a weaker Euro have reduced the revenue to be recovered from
generation within the €2.5/MWh cap on average annual generator charges.
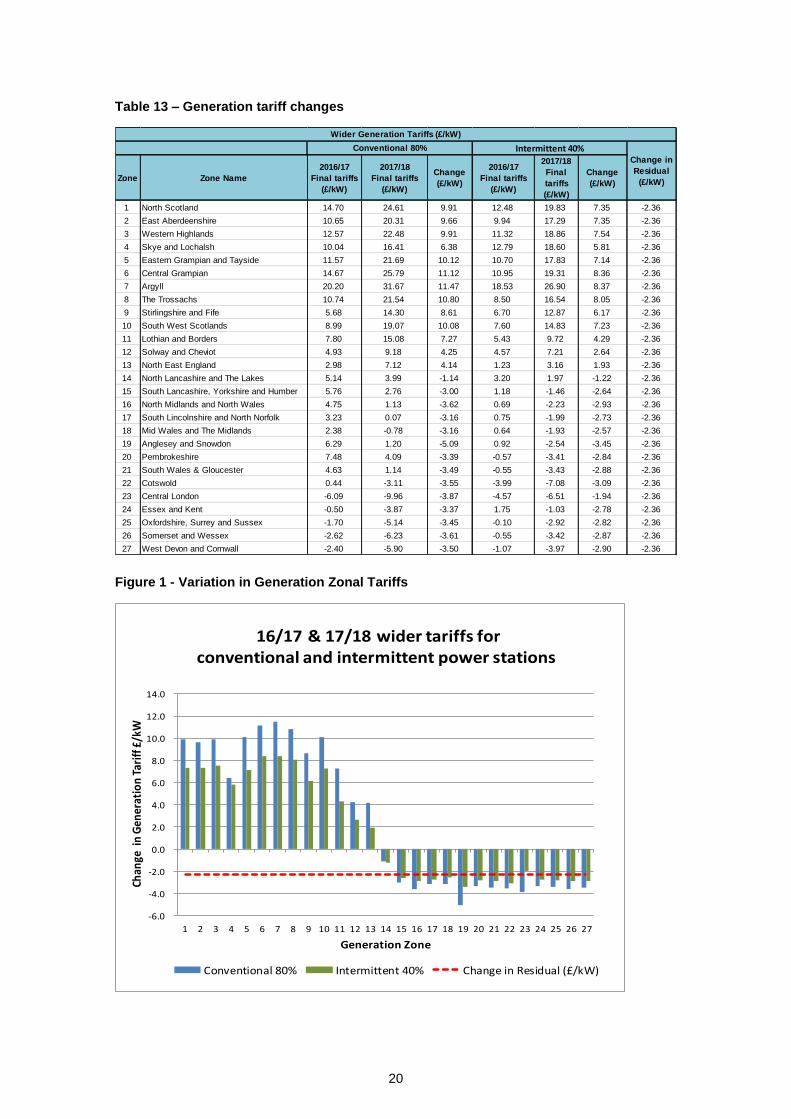
20
Table 13 – Generation tariff changes
Figure 1 - Variation in Generation Zonal Tariffs
Zone Zone Name
2016/17
Final tariffs
(£/kW)
2017/18
Final tariffs
(£/kW)
Change
(£/kW)
2016/17
Final tariffs
(£/kW)
2017/18
Final
tariffs
(£/kW)
Change
(£/kW)
1 North Scotland 14.70 24.61 9.91 12.48 19.83 7.35 -2.36
2 East Aberdeenshire 10.65 20.31 9.66 9.94 17.29 7.35 -2.36
3 Western Highlands 12.57 22.48 9.91 11.32 18.86 7.54 -2.36
4 Skye and Lochalsh 10.04 16.41 6.38 12.79 18.60 5.81 -2.36
5 Eastern Grampian and Tayside 11.57 21.69 10.12 10.70 17.83 7.14 -2.36
6 Central Grampian 14.67 25.79 11.12 10.95 19.31 8.36 -2.36
7 Argyll 20.20 31.67 11.47 18.53 26.90 8.37 -2.36
8 The Trossachs 10.74 21.54 10.80 8.50 16.54 8.05 -2.36
9 Stirlingshire and Fife 5.68 14.30 8.61 6.70 12.87 6.17 -2.36
10 South West Scotlands 8.99 19.07 10.08 7.60 14.83 7.23 -2.36
11 Lothian and Borders 7.80 15.08 7.27 5.43 9.72 4.29 -2.36
12 Solway and Cheviot 4.93 9.18 4.25 4.57 7.21 2.64 -2.36
13 North East England 2.98 7.12 4.14 1.23 3.16 1.93 -2.36
14 North Lancashire and The Lakes 5.14 3.99 -1.14 3.20 1.97 -1.22 -2.36
15 South Lancashire, Yorkshire and Humber 5.76 2.76 -3.00 1.18 -1.46 -2.64 -2.36
16 North Midlands and North Wales 4.75 1.13 -3.62 0.69 -2.23 -2.93 -2.36
17 South Lincolnshire and North Norfolk 3.23 0.07 -3.16 0.75 -1.99 -2.73 -2.36
18 Mid Wales and The Midlands 2.38 -0.78 -3.16 0.64 -1.93 -2.57 -2.36
19 Anglesey and Snowdon 6.29 1.20 -5.09 0.92 -2.54 -3.45 -2.36
20 Pembrokeshire 7.48 4.09 -3.39 -0.57 -3.41 -2.84 -2.36
21 South Wales & Gloucester 4.63 1.14 -3.49 -0.55 -3.43 -2.88 -2.36
22 Cotswold 0.44 -3.11 -3.55 -3.99 -7.08 -3.09 -2.36
23 Central London -6.09 -9.96 -3.87 -4.57 -6.51 -1.94 -2.36
24 Essex and Kent -0.50 -3.87 -3.37 1.75 -1.03 -2.78 -2.36
25 Oxfordshire, Surrey and Sussex -1.70 -5.14 -3.45 -0.10 -2.92 -2.82 -2.36
26 Somerset and Wessex -2.62 -6.23 -3.61 -0.55 -3.42 -2.87 -2.36
27 West Devon and Cornwall -2.40 -5.90 -3.50 -1.07 -3.97 -2.90 -2.36
Wider Generation Tariffs (£/kW)
Conventional 80% Intermittent 40%Change in
Residual
(£/kW)
-6.0
-4.0
-2.0
0.0
2.0
4.0
6.0
8.0
10.0
12.0
14.0
1 2 3 4 5 6 7 8 9 10 11 12 13 14 15 16 17 18 19 20 21 22 23 24 25 26 27
Chan
ge i
n G
ener
atio
n T
arif
f £/k
W
Generation Zone
16/17 & 17/18 wider tariffs for conventional and intermittent power stations
Conventional 80% Intermittent 40% Change in Residual (£/kW)
21
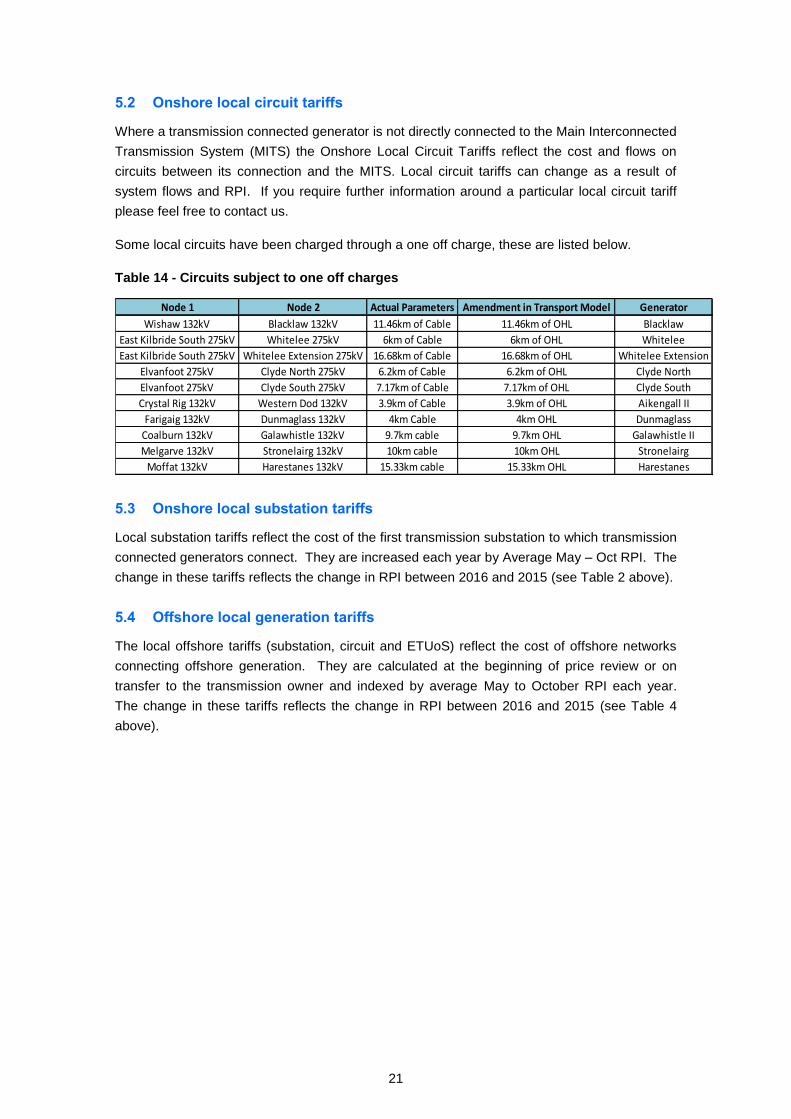
5.2 Onshore local circuit tariffs
Where a transmission connected generator is not directly connected to the Main Interconnected
Transmission System (MITS) the Onshore Local Circuit Tariffs reflect the cost and flows on
circuits between its connection and the MITS. Local circuit tariffs can change as a result of
system flows and RPI. If you require further information around a particular local circuit tariff
please feel free to contact us.
Some local circuits have been charged through a one off charge, these are listed below.
Table 14 - Circuits subject to one off charges
5.3 Onshore local substation tariffs
Local substation tariffs reflect the cost of the first transmission substation to which transmission
connected generators connect. They are increased each year by Average May – Oct RPI. The
change in these tariffs reflects the change in RPI between 2016 and 2015 (see Table 2 above).
5.4 Offshore local generation tariffs
The local offshore tariffs (substation, circuit and ETUoS) reflect the cost of offshore networks
connecting offshore generation. They are calculated at the beginning of price review or on
transfer to the transmission owner and indexed by average May to October RPI each year.
The change in these tariffs reflects the change in RPI between 2016 and 2015 (see Table 4
above).
Node 1 Node 2 Actual Parameters Amendment in Transport Model Generator
Wishaw 132kV Blacklaw 132kV 11.46km of Cable 11.46km of OHL Blacklaw
East Kilbride South 275kV Whitelee 275kV 6km of Cable 6km of OHL Whitelee
East Kilbride South 275kV Whitelee Extension 275kV 16.68km of Cable 16.68km of OHL Whitelee Extension
Elvanfoot 275kV Clyde North 275kV 6.2km of Cable 6.2km of OHL Clyde North
Elvanfoot 275kV Clyde South 275kV 7.17km of Cable 7.17km of OHL Clyde South
Crystal Rig 132kV Western Dod 132kV 3.9km of Cable 3.9km of OHL Aikengall II
Farigaig 132kV Dunmaglass 132kV 4km Cable 4km OHL Dunmaglass
Coalburn 132kV Galawhistle 132kV 9.7km cable 9.7km OHL Galawhistle II
Melgarve 132kV Stronelairg 132kV 10km cable 10km OHL Stronelairg
Moffat 132kV Harestanes 132kV 15.33km cable 15.33km OHL Harestanes
22
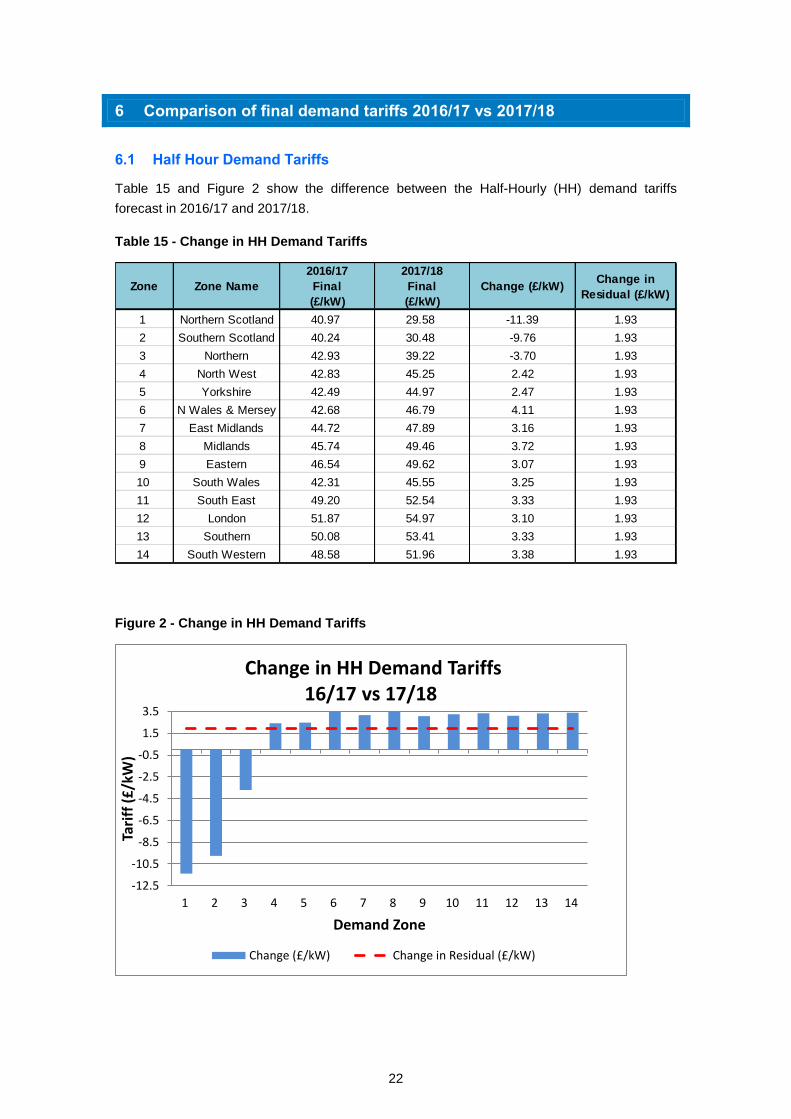
6 Comparison of final demand tariffs 2016/17 vs 2017/18
6.1 Half Hour Demand Tariffs
Table 15 and Figure 2 show the difference between the Half-Hourly (HH) demand tariffs
forecast in 2016/17 and 2017/18.
Table 15 - Change in HH Demand Tariffs
Figure 2 - Change in HH Demand Tariffs
Zone Zone Name
2016/17
Final
(£/kW)
2017/18
Final
(£/kW)
Change (£/kW)Change in
Residual (£/kW)
1 Northern Scotland 40.97 29.58 -11.39 1.93
2 Southern Scotland 40.24 30.48 -9.76 1.93
3 Northern 42.93 39.22 -3.70 1.93
4 North West 42.83 45.25 2.42 1.93
5 Yorkshire 42.49 44.97 2.47 1.93
6 N Wales & Mersey 42.68 46.79 4.11 1.93
7 East Midlands 44.72 47.89 3.16 1.93
8 Midlands 45.74 49.46 3.72 1.93
9 Eastern 46.54 49.62 3.07 1.93
10 South Wales 42.31 45.55 3.25 1.93
11 South East 49.20 52.54 3.33 1.93
12 London 51.87 54.97 3.10 1.93
13 Southern 50.08 53.41 3.33 1.93
14 South Western 48.58 51.96 3.38 1.93
-12.5
-10.5
-8.5
-6.5
-4.5
-2.5
-0.5
1.5
3.5
1 2 3 4 5 6 7 8 9 10 11 12 13 14
Tari
ff (
£/k
W)
Demand Zone
Change in HH Demand Tariffs16/17 vs 17/18
Change (£/kW) Change in Residual (£/kW)

23
The average HH demand tariff has increased by £3.33/kW due to an increase in revenue being
recovered by the HH sector between 2016/17 and 2017/18 to be charged over a similar sized
charging base. The increase in revenue to be recovered from HH is due to the reduction in the
amount of revenue that can be collected from generation due to the €2.5/MWh cap on average
annual generation tariffs.
We also see a reduction in HH demand tariffs in Scotland due to the expected commissioning
of the Western HVDC link in 17/18.
6.2 Non Half-hourly demand tariffs
Table 16 and Figure 3 show the difference between the Non-Half-Hourly (NHH) demand tariffs
forecast in 2016/17 and 2017/18.
Table 16 - NHH Demand Tariff Changes
Zone Zone Name
2016/17
Final
(p/kWh)
2017/18
Final
(p/kWh)
Change
(p/kWh)
1 Northern Scotland 5.77 6.22 0.45
2 Southern Scotland 6.21 4.26 -1.94
3 Northern 6.77 5.94 -0.82
4 North West 5.69 5.88 0.19
5 Yorkshire 6.54 5.98 -0.56
6 N Wales & Mersey 6.48 6.61 0.13
7 East Midlands 6.38 6.25 -0.13
8 Midlands 6.35 6.43 0.07
9 Eastern 6.35 7.10 0.74
10 South Wales 6.40 5.78 -0.63
11 South East 6.65 7.48 0.82
12 London 6.51 5.49 -1.02
13 Southern 6.49 7.05 0.56
14 South Western 6.88 7.46 0.59

24
Figure 3 - NHH Tariff Demand Changes
The weighted average Non Half Hour tariff is 0.04p/kWh lower than in 2016/17. This slight
reduction is attributable to a lower amount of revenue to be recovered from the NHH sector
which has been largely offset by a decrease in the charging base compared to 2016/17. The
variations year on year across the zones are attributable to changes in our demand forecast
modelling approach which seeks, in particular, to more accurately capture variations in
embedded renewable generation across GB.
-2.0
-1.5
-1.0
-0.5
0.0
0.5
1.0
1.5
2.0
1 2 3 4 5 6 7 8 9 10 11 12 13 14
Tari
ff (p
/kW
h)
Demand Zone
Change in NHH Demand Tariffs16/17 v 17/18

25
7 Tools and Supporting Information
7.1 Further information
We are keen to ensure that customers understand the current charging arrangements and the
reason why tariffs change. If you have specific queries on this forecast please contact us using
the details below. Feedback on the content and format of this forecast is also welcome. We are
particularly interested to hear how accessible you find the report and if it provides the right level
of detail.
7.2 Charging forums
As there have been very few changes since the Draft tariffs in December 2016, we do not
currently plan to hold a webinar for the Final tariffs. However, we welcome questions and are
happy to discuss specific aspects of the material contained in the Final tariffs report should you
wish to do so.
7.3 Charging models
We can provide a copy of our charging model. If you would like a copy of the model to be
emailed to you, together with a user guide, please contact us using the details below. Please
note that, while the model is available free of charge, it is provided under licence to restrict,
among other things, its distribution and commercial use.
7.4 Numerical data
All tables in this document can be downloaded as an Excel spreadsheet from our website:
http://www2.nationalgrid.com/UK/Industry-information/System-charges/Electricity-
transmission/Approval-conditions/Condition-5/
Team Email & Phone [email protected] 01926 654633
Katharine Clench [email protected] 01926 656036
Mary Owen [email protected] 01926 653845
Kathy Heard [email protected] 01926 656281
Jo Zhou [email protected] 01926 654184
Tom Selby [email protected] 01926 656450

26
Appendices
Appendix A: Revenue Tables
Appendix B: Locational Demand
Appendix C: Annual Load Factors
Appendix D: Demand Tariffs
Appendix E: Generation Zones
Appendix F: Demand Zones

27
Appendix A : Revenue Tables
We seek to provide the detail behind price control revenue forecasts for National Grid, Scottish
Power Transmission and SHE Transmission, however, the contractual position between NGSO
and TOs does not presently require a breakdown to the TO final position.
Revenue for offshore networks is included with forecasts by National Grid where the Offshore
Transmission Owner has yet to be appointed.
Notes:
All monies are quoted in millions of pounds, accurate to one decimal place and are in nominal
‘money of the day’ prices unless stated otherwise.
Greyed out cells are either calculated or not applicable in the year concerned due to the way
the licence formula are constructed.
Network Innovation Competition Funding is included in the National Grid price control but is
additional to the price controls of onshore and offshore Transmission Owners who receive
funding. NIC funding is therefore only shown in the National Grid table.
All reasonable care has been taken in the preparation of these illustrative tables and the data
therein. National Grid and other Transmission Owners offer this data without prejudice and
cannot be held responsible for any loss that might be attributed to the use of this data. Neither
National Grid nor other Transmission Owners accept or assume responsibility for the use of this
information by any person or any person to whom this information is shown or any person to
whom this information otherwise becomes available.
The base revenue forecasts reflect the figures authorised by Ofgem in the RIIO-T1 or offshore
price controls.
Within the bounds of commercial confidentiality these forecasts provide as much information as
possible. Generally allowances determined by Ofgem are shown, whilst those for which Ofgem
determinations are expected are not. This respects commercial confidentiality and disclosure
considerations and actual revenues may vary for these forecasts.
It is assumed that there is only one set of price changes each year on 1 April.

28
Table 17 - National Grid Revenue Forecast
Description Licence Yr t-1 Yr t Yr t+1 Yr t+2
Regulatory Year 2014/15 2015/16 2016/17 2017/18Actual RPI 256.67 April to March average
RPI Actual RPIAt 1.190 Office of National Statistics
Assumed Interest Rate It 0.50% 0.70% 95.00% 0.20% Bank of England Base Rate
Opening Base Revenue Allowance (2009/10 prices) A1 PUt 1,443.8 1,475.6 1,571.4 1554.9 From Licence
Price Control Financial Model Iteration Adjustment A2 MODt -5.5 -114.4 -185.4 -253.3 Deterined by Ofgem
RPI True Up A3 TRUt -0.5 4.7 -19.9 -31.4 Licensee Actual/Forecast
Prior Calendar Year RPI Forecast GRPIFc-1 3.1% 2.5% 1.0% 0.0 HM Treasury Actual/Forecast
Current Calendar Year RPI Forecast GRPIFc 3.1% 2.4% 2.1% 0.0 HM Treasury Actual/Forecast
Next Calendar Year RPI forecast GRPIFc+1 3.0% 3.2% 3.0% 0.0 HM Treasury Actual/Forecast
RPI Forecast A4 RPIFt 1.2051 1.2267 1.2330 1.3 HM Treasury Actual/Forecast
Base Revenue [A=(A1+A2+A3)*A4] A BRt 1732.7 1675.5 1684.4 1614.5
Pass-Through Business Rates B1 RBt 1.2 1.5 2.7 Actual
Temporary Physical Disconnection B2 TPDt 0.1 0.0 0.1 0.0 Actual
Licence Fee B3 LFt 2.0 2.7 3.2 Actual
Inter TSO Compensation B4 ITCt 3.8 2.7 0.5 Actual
Termination of Bilateral Connection Agreements B5 TERMt 0.0 0.0 0.0 0.0 Does not affect TNUoS
SP Transmission Pass-Through B6 TSPt 312.2 295.7 294.6 321.0 TSP submission for invoicing
SHE Transmission Pass-Through B7 TSHt 214.0 338.2 322.8 301.4 TSH submission for invoicing
Offshore Transmission Pass-Through B8 TOFTOt 218.4 248.4 260.8 270.2 OFTO invoicing submissions plus NGSO forecast of expected transfers
Embedded Offshore Pass-Through B9 OFETt 0.4 0.6 0.7 0.5 Forecast
Pass-Through Items [B=B1+B2+B3+B4+B5+B6+B7+B8+B9] B PTt 745.1 890.0 885.9 899.4
Reliability Incentive Adjustment C1 RIt 2.4 3.9 4.0 Actual
Stakeholder Satisfaction Adjustment C2 SSOt 8.7 10.1 8.6 Actual
Sulphur Hexafluoride (SF6) Gas Emissions Adjustment C3 SFIt 2.8 2.7 2.6 Actual
Awarded Environmental Discretionary Rewards C4 EDRt 0.0 2.0 0.0 Actual
Outputs Incentive Revenue [C=C1+C2+C3+C4] C OIPt 0.0 13.9 18.7 15.3
Network Innovation Allowance D NIAt 10.9 10.6 10.6 10.2 Forecast
Network Innovation Competition E NICFt 17.8 18.8 44.9 32.1 Determined by Ofgem
Future Environmental Discretionary Rewards F EDRt 0.0 Actual
Transmission Investment for Renewable Generation G TIRGt 16.0 15.7 0.0 0.0 Determined by Ofgem
Scottish Site Specific Adjustment H DISt 2.0 0.8 2.9 6.1 Licensee Actual/Forecast
Scottish Terminations Adjustment I TSt -0.3 0.1 0.1 -1.1 Licensee Actual/Forecast
Correction Factor K -Kt 56.4 104.0 97.0 Calculated by Licensee
Maximum Revenue [M= A+B+C+D+E+F+G+H+I+K] M TOt 2524.3 2681.6 2751.3 2673.4
Termination Charges B5 0.0 0.0 0.0 0.0
Pre-vesting connection charges P 47.0 45.0 42.7 41.9 Licensee Actual/Forecast
TNUoS Collected Revenue [T=M-B5-P] T 2477.3 2636.7 2708.7 2631.5
Final Collected Revenue U TNRt 2375.9 2592.7 Actual
Forecast percentage change to Maximum Revenue M 0.0% 6.2% 2.6% -1.5%
Forecast percentage change to TNUoS Collected Revenue T 0.0% 6.4% 2.7% -1.6%
27/01/2017
Notes

29
Table 18 - Scottish Power Revenue Forecast
A breakdown of Scottish Power Revenue has not been made available to NGET.
Table 19 - SHE Transmission Revenue Forecast
A breakdown of SHE Transmission Revenue has not been made available to NGET.

30
Table 20 - Offshore Transmission Owner Revenues

31
Appendix B : Locational Demand Changes
Table 21 - Demand Profiles
There is no change to demand profiles between the Draft and Final tariffs.
Zone Zone Name
Locational
Model
Demand (MW)
Tariff model
Peak Demand
(MW)
Tariff Model
HH Demand
(MW)
Tariff model
NHH Demand
(TWh)
Locational
Model
Demand (MW)
Tariff model
Peak Demand
(MW)
Tariff Model
HH Demand
(MW)
Tariff model
NHH Demand
(TWh)
1 Northern Scotland 623 574 -461 0.73 683 923 -668 0.75
2 Southern Scotland 3,226 3,187 474 1.76 3,070 3,109 642 1.76
3 Northern 2,609 2,216 137 1.32 2,609 2,267 314 1.29
4 North West 4,005 3,682 909 2.09 3,504 3,854 1,175 2.06
5 Yorkshire 4,559 3,897 972 1.90 4,651 3,566 1,107 1.85
6 N Wales & Mersey 2,092 2,981 990 1.31 2,688 2,350 520 1.30
7 East Midlands 4,967 4,797 1,537 2.29 5,137 4,360 1,456 2.23
8 Midlands 4,414 4,225 1,226 2.16 4,498 4,125 1,400 2.10
9 Eastern 5,581 6,046 1,455 3.36 5,850 6,036 1,473 3.19
10 South Wales 1,920 2,252 925 0.88 1,968 1,657 554 0.87
11 South East 3,609 3,631 819 2.08 3,626 3,711 870 2.00
12 London 4,730 4,436 1,763 2.13 5,317 4,112 2,194 1.93
13 Southern 5,814 5,595 1,977 2.80 5,936 5,179 1,650 2.68
14 South Western 2,699 2,282 378 1.35 2,604 2,436 540 1.32
50,848 49,800 13,101 26.15 52,141 47,684 13,227 25.31Total
2016/17 Final 2017/18 Final
32
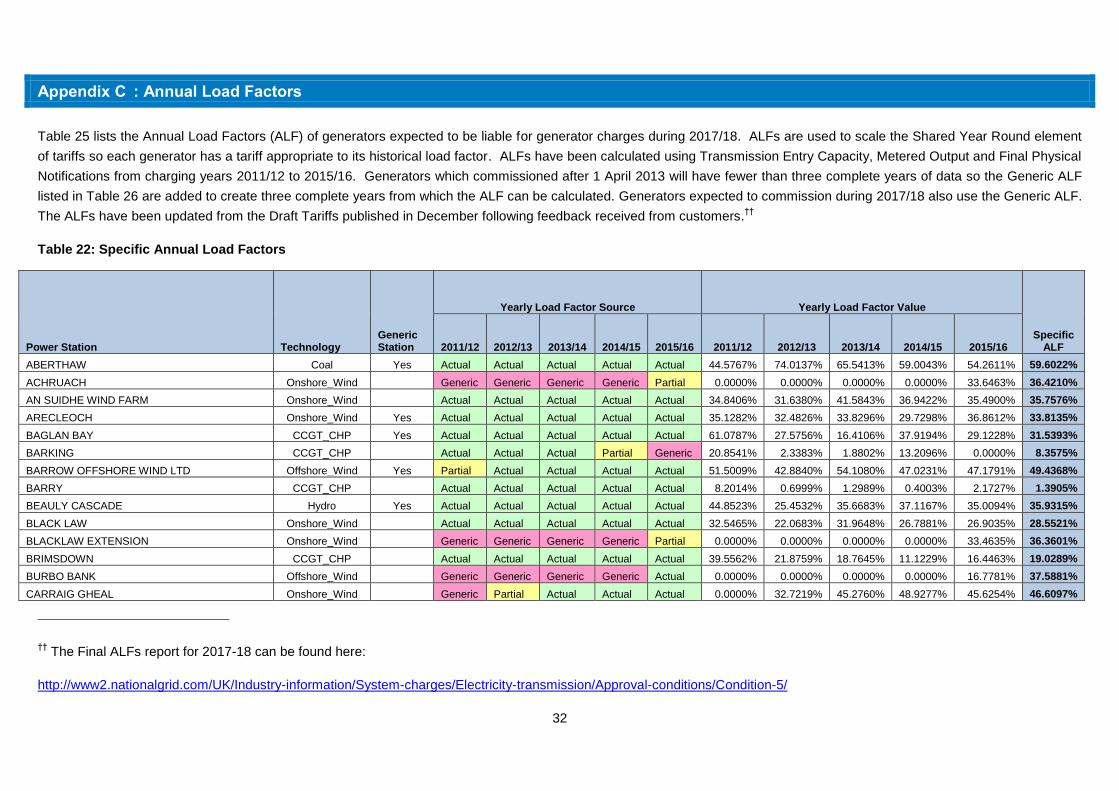
Appendix C : Annual Load Factors
Table 25 lists the Annual Load Factors (ALF) of generators expected to be liable for generator charges during 2017/18. ALFs are used to scale the Shared Year Round element
of tariffs so each generator has a tariff appropriate to its historical load factor. ALFs have been calculated using Transmission Entry Capacity, Metered Output and Final Physical
Notifications from charging years 2011/12 to 2015/16. Generators which commissioned after 1 April 2013 will have fewer than three complete years of data so the Generic ALF
listed in Table 26 are added to create three complete years from which the ALF can be calculated. Generators expected to commission during 2017/18 also use the Generic ALF.
The ALFs have been updated from the Draft Tariffs published in December following feedback received from customers.††
Table 22: Specific Annual Load Factors
Power Station Technology Generic Station
Yearly Load Factor Source Yearly Load Factor Value
Specific ALF 2011/12 2012/13 2013/14 2014/15 2015/16 2011/12 2012/13 2013/14 2014/15 2015/16
ABERTHAW Coal Yes Actual Actual Actual Actual Actual 44.5767% 74.0137% 65.5413% 59.0043% 54.2611% 59.6022%
ACHRUACH Onshore_Wind Generic Generic Generic Generic Partial 0.0000% 0.0000% 0.0000% 0.0000% 33.6463% 36.4210%
AN SUIDHE WIND FARM Onshore_Wind Actual Actual Actual Actual Actual 34.8406% 31.6380% 41.5843% 36.9422% 35.4900% 35.7576%
ARECLEOCH Onshore_Wind Yes Actual Actual Actual Actual Actual 35.1282% 32.4826% 33.8296% 29.7298% 36.8612% 33.8135%
BAGLAN BAY CCGT_CHP Yes Actual Actual Actual Actual Actual 61.0787% 27.5756% 16.4106% 37.9194% 29.1228% 31.5393%
BARKING CCGT_CHP Actual Actual Actual Partial Generic 20.8541% 2.3383% 1.8802% 13.2096% 0.0000% 8.3575%
BARROW OFFSHORE WIND LTD Offshore_Wind Yes Partial Actual Actual Actual Actual 51.5009% 42.8840% 54.1080% 47.0231% 47.1791% 49.4368%
BARRY CCGT_CHP Actual Actual Actual Actual Actual 8.2014% 0.6999% 1.2989% 0.4003% 2.1727% 1.3905%
BEAULY CASCADE Hydro Yes Actual Actual Actual Actual Actual 44.8523% 25.4532% 35.6683% 37.1167% 35.0094% 35.9315%
BLACK LAW Onshore_Wind Actual Actual Actual Actual Actual 32.5465% 22.0683% 31.9648% 26.7881% 26.9035% 28.5521%
BLACKLAW EXTENSION Onshore_Wind Generic Generic Generic Generic Partial 0.0000% 0.0000% 0.0000% 0.0000% 33.4635% 36.3601%
BRIMSDOWN CCGT_CHP Actual Actual Actual Actual Actual 39.5562% 21.8759% 18.7645% 11.1229% 16.4463% 19.0289%
BURBO BANK Offshore_Wind Generic Generic Generic Generic Actual 0.0000% 0.0000% 0.0000% 0.0000% 16.7781% 37.5881%
CARRAIG GHEAL Onshore_Wind Generic Partial Actual Actual Actual 0.0000% 32.7219% 45.2760% 48.9277% 45.6254% 46.6097%
†† The Final ALFs report for 2017-18 can be found here:
http://www2.nationalgrid.com/UK/Industry-information/System-charges/Electricity-transmission/Approval-conditions/Condition-5/

33
Power Station Technology Generic Station
Yearly Load Factor Source Yearly Load Factor Value
Specific ALF 2011/12 2012/13 2013/14 2014/15 2015/16 2011/12 2012/13 2013/14 2014/15 2015/16
CARRINGTON CCGT_CHP Generic Generic Generic Generic Partial 0.0000% 0.0000% 0.0000% 0.0000% 38.7318% 38.8663%
CLUNIE SCHEME Hydro Actual Actual Actual Actual Actual 50.3272% 33.4563% 45.3256% 43.2488% 47.9711% 45.5152%
CLYDE (NORTH) Onshore_Wind Partial Actual Actual Actual Actual 23.1890% 28.5345% 42.6598% 36.8882% 41.4120% 40.3200%
CLYDE (SOUTH) Onshore_Wind Yes Actual Actual Actual Actual Actual 21.1154% 31.6084% 39.8941% 29.4115% 39.9615% 33.6380%
CONNAHS QUAY CCGT_CHP Actual Actual Actual Actual Actual 33.6741% 18.5104% 12.8233% 18.3739% 28.2713% 21.7185%
CONON CASCADE Hydro Yes Actual Actual Actual Actual Actual 62.1102% 47.5286% 54.2820% 55.5287% 58.9860% 56.2656%
CORBY CCGT_CHP Actual Actual Actual Actual Actual 8.1854% 3.4375% 8.0834% 9.6755% 4.5411% 6.9366%
CORYTON CCGT_CHP Yes Actual Actual Actual Actual Actual 40.7480% 15.6869% 9.7852% 17.5123% 26.4000% 19.8664%
COTTAM Coal Yes Actual Actual Actual Actual Actual 61.2151% 65.0700% 67.3951% 51.4426% 34.4157% 59.2426%
COTTAM DEVELOPMENT CENTRE CCGT_CHP Actual Actual Actual Actual Actual 46.0664% 13.7361% 16.0249% 31.3132% 28.2382% 25.1921%
COWES Gas_Oil Yes Actual Actual Actual Actual Actual 0.2783% 0.1743% 0.0956% 0.3135% 0.4912% 0.2554%
CRUACHAN Pumped_Storage Yes Actual Actual Actual Actual Actual 8.9462% 8.4281% 9.6969% 9.0516% 8.8673% 8.9550%
CRYSTAL RIG II Onshore_Wind Yes Actual Actual Actual Actual Actual 49.3600% 40.6845% 50.2549% 47.5958% 48.3836% 48.4464%
DAMHEAD CREEK CCGT_CHP Actual Actual Actual Actual Actual 77.3504% 45.0617% 77.1783% 67.4641% 64.8983% 69.8469%
DEESIDE CCGT_CHP Actual Actual Actual Actual Actual 35.4538% 19.7551% 17.3035% 13.9018% 17.4579% 18.1722%
DIDCOT B CCGT_CHP Actual Actual Actual Actual Actual 56.8079% 49.0134% 18.6624% 25.5345% 41.1389% 38.5623%
DIDCOT GTS Gas_Oil Yes Actual Actual Actual Actual Actual 0.1401% 0.0720% 0.0902% 0.2843% 0.4861% 0.1715%
DINORWIG Pumped_Storage Yes Actual Actual Actual Actual Actual 15.0985% 15.0990% 15.0898% 15.0650% 14.6353% 15.0844%
DRAX Coal Yes Actual Actual Actual Actual Actual 81.1523% 82.4774% 80.5151% 82.2149% 76.2030% 81.2941%
DUNGENESS B Nuclear Yes Actual Actual Actual Actual Actual 11.6712% 59.8295% 61.0068% 54.6917% 70.7617% 58.5094%
DUNLAW EXTENSION Onshore_Wind Yes Actual Actual Actual Actual Actual 37.7664% 32.3771% 34.8226% 30.0797% 29.1203% 32.4265%
EDINBANE WIND Onshore_Wind Yes Actual Actual Actual Actual Actual 52.8496% 29.3933% 39.4785% 31.2458% 35.5937% 35.4393%
EGGBOROUGH Coal Yes Actual Actual Actual Actual Actual 41.4851% 72.6884% 72.1843% 45.7421% 27.0157% 53.1372%
ERROCHTY Hydro Yes Actual Actual Actual Actual Actual 25.1643% 14.5869% 28.2628% 25.3585% 28.1507% 26.2245%
FALLAGO Onshore_Wind Generic Partial Actual Actual Actual 0.0000% 35.7448% 54.8683% 44.7267% 55.7992% 51.7981%
FARR WINDFARM TOMATIN Onshore_Wind Actual Actual Actual Actual Actual 43.3953% 34.0149% 44.7212% 38.5712% 40.9963% 40.9876%
FASNAKYLE G1 & G3 Hydro Yes Actual Actual Actual Actual Actual 39.9896% 22.1176% 35.3695% 57.4834% 53.1573% 42.8388%
FAWLEY CHP CCGT_CHP Actual Actual Actual Actual Actual 71.5686% 61.1362% 63.3619% 72.8484% 57.6978% 65.3556%
FFESTINIOGG Pumped_Storage Yes Actual Actual Actual Actual Actual 3.3676% 2.9286% 5.4631% 4.3251% 3.4113% 3.7013%
FIDDLERS FERRY Coal Yes Actual Actual Actual Actual Actual 52.0973% 61.6386% 49.0374% 45.2435% 27.4591% 48.7927%
FINLARIG Hydro Yes Actual Actual Actual Actual Actual 67.9805% 40.2952% 59.9142% 59.4092% 65.1349% 61.4861%

34
Power Station Technology Generic Station
Yearly Load Factor Source Yearly Load Factor Value
Specific ALF 2011/12 2012/13 2013/14 2014/15 2015/16 2011/12 2012/13 2013/14 2014/15 2015/16
FOYERS Pumped_Storage Yes Actual Actual Actual Actual Actual 18.9885% 13.4800% 14.7097% 12.3048% 15.4323% 14.5407%
GARRY CASCADE Hydro Yes Actual Actual Actual Actual Actual 70.4039% 48.5993% 55.9308% 64.3828% 60.2772% 60.1969%
GLANDFORD BRIGG CCGT_CHP Actual Actual Actual Actual Actual 0.9617% 0.3336% 1.5673% 0.5401% 1.8191% 1.0230%
GLENDOE Hydro Yes Actual Actual Actual Actual Actual 0.0000% 17.3350% 36.3802% 32.3494% 34.8532% 28.1792%
GLENMORISTON Hydro Yes Actual Actual Actual Actual Actual 58.0412% 36.3045% 44.4594% 48.7487% 50.6921% 47.9668%
GORDONBUSH Onshore_Wind Partial Actual Actual Actual Actual 33.5929% 37.8930% 46.5594% 47.7981% 47.7161% 47.3579%
GRAIN CCGT_CHP Yes Actual Actual Actual Actual Actual 29.4910% 25.4580% 41.3833% 44.0031% 39.7895% 36.8879%
GRANGEMOUTH CCGT_CHP Yes Actual Actual Actual Actual Actual 67.5783% 52.8594% 55.9047% 62.6168% 59.8274% 59.4496%
GREAT YARMOUTH CCGT_CHP Yes Actual Actual Actual Actual Actual 45.0785% 19.0270% 20.7409% 18.6633% 59.8957% 28.2821%
GREATER GABBARD OFFSHORE WIND FARM Offshore_Wind Yes Actual Actual Actual Actual Actual 17.8601% 40.1778% 48.3038% 42.1327% 50.2468% 43.5381%
GRIFFIN WIND Onshore_Wind Partial Actual Actual Actual Actual 14.0338% 17.9885% 31.9566% 31.3152% 31.0284% 31.4334%
GUNFLEET SANDS I Offshore_Wind Yes Actual Actual Actual Actual Actual 43.7552% 50.1496% 56.6472% 47.0132% 50.4650% 49.2093%
GUNFLEET SANDS II Offshore_Wind Yes Actual Actual Actual Actual Actual 41.4244% 45.0132% 52.2361% 44.7211% 49.0521% 46.2622%
GWYNT Y MOR Offshore_Wind Yes Generic Partial Actual Actual Actual 0.0000% 18.2777% 8.0036% 61.6185% 63.1276% 44.2499%
HADYARD HILL Onshore_Wind Actual Actual Actual Actual Actual 38.9802% 27.6927% 31.9488% 27.7635% 36.6527% 32.1217%
HARESTANES Onshore_Wind Generic Generic Partial Actual Actual 0.0000% 0.0000% 23.8423% 28.6355% 27.8093% 26.7624%
HARTLEPOOL Nuclear Yes Actual Actual Actual Actual Actual 71.1712% 80.2632% 73.7557% 56.2803% 53.8666% 67.0691%
HEYSHAM Nuclear Yes Actual Actual Actual Actual Actual 83.7012% 83.3828% 73.3628% 68.8252% 72.7344% 76.4933%
HINKLEY POINT B Nuclear Yes Actual Actual Actual Actual Actual 56.9291% 61.7582% 68.8664% 70.1411% 67.6412% 66.0886%
HUMBER GATEWAY OFFSHORE WIND FARM Offshore_Wind Generic Generic Generic Generic Actual 0.0000% 0.0000% 0.0000% 0.0000% 62.9631% 52.9831%
HUNTERSTON Nuclear Yes Actual Actual Actual Actual Actual 75.3474% 73.5984% 84.7953% 79.1368% 82.1786% 78.8876%
IMMINGHAM CCGT_CHP Yes Actual Actual Actual Actual Actual 73.3041% 50.1793% 37.8219% 56.8316% 69.4686% 58.8265%
INDIAN QUEENS Gas_Oil Yes Actual Actual Actual Actual Actual 1.3382% 0.3423% 0.2321% 0.0876% 0.0723% 0.2207%
IRONBRIDGE Biomass Yes Generic Generic Actual Actual Actual 0.0000% 0.0000% 11.0838% 30.9006% 38.6698% 26.8847%
KEADBY CCGT_CHP Actual Actual Actual Generic Partial 49.8412% 4.6125% 0.0001% 0.0000% 35.1858% 18.1513%
KILBRAUR Onshore_Wind Yes Actual Actual Actual Actual Actual 45.1817% 45.2306% 51.3777% 54.3550% 50.3807% 48.9964%
KILLIN CASCADE Hydro Yes Actual Actual Actual Actual Actual 53.0410% 32.3429% 45.5356% 44.8205% 53.2348% 47.7990%
KINGS LYNN A CCGT_CHP Actual Actual Actual Actual Generic 15.6080% 0.0003% 0.0000% 0.0000% 0.0000% 5.2027%
LANGAGE CCGT_CHP Yes Actual Actual Actual Actual Actual 60.7905% 41.9115% 40.8749% 34.8629% 16.5310% 39.2164%
LINCS WIND FARM Offshore_Wind Yes Generic Partial Actual Actual Actual 0.0000% 19.8148% 46.5987% 43.8178% 49.1306% 46.5157%
LITTLE BARFORD CCGT_CHP Actual Actual Actual Actual Actual 11.8210% 16.3807% 33.6286% 49.6644% 39.9829% 29.9974%

35
Power Station Technology Generic Station
Yearly Load Factor Source Yearly Load Factor Value
Specific ALF 2011/12 2012/13 2013/14 2014/15 2015/16 2011/12 2012/13 2013/14 2014/15 2015/16
LITTLEBROOK D Gas_Oil Yes Actual Actual Actual Actual Actual 0.1055% 0.0588% 0.0201% 0.1394% 0.0000% 0.0615%
LOCHLUICHART Onshore_Wind Generic Generic Partial Actual Actual 0.0000% 0.0000% 6.4399% 20.2103% 29.2663% 18.6388%
LONDON ARRAY Offshore_Wind Yes Generic Partial Actual Actual Actual 0.0000% 47.9931% 51.2703% 64.0880% 66.8682% 60.7422%
LYNEMOUTH Coal Generic Generic Generic Generic Partial 0.0000% 0.0000% 0.0000% 0.0000% 83.7381% 65.8960%
MARCHWOOD CCGT_CHP Yes Actual Actual Actual Actual Actual 66.1953% 43.3537% 48.6845% 66.4021% 55.0879% 56.6559%
MARK HILL Onshore_Wind Yes Actual Actual Actual Actual Actual 26.3795% 30.1675% 30.2863% 26.7942% 34.0227% 29.0827%
MEDWAY CCGT_CHP Actual Actual Actual Actual Actual 42.4273% 1.0718% 14.5545% 28.0962% 34.1799% 25.6102%
MILLENNIUM Onshore_Wind Yes Actual Actual Actual Actual Actual 47.2065% 42.1318% 52.6618% 53.2636% 48.4038% 49.4240%
NANT Hydro Yes Actual Actual Actual Actual Actual 42.4480% 20.8965% 35.5883% 36.4040% 37.3788% 36.4571%
ORMONDE Offshore_Wind Yes Generic Partial Actual Actual Actual 0.0000% 48.5898% 49.6561% 42.8711% 47.1986% 46.5753%
PEMBROKE CCGT_CHP Generic Actual Actual Actual Actual 0.0000% 61.5434% 60.3928% 67.5346% 64.5596% 64.5459%
PETERBOROUGH CCGT_CHP Actual Actual Actual Actual Partial 3.4546% 0.9506% 1.8311% 1.0929% 0.9933% 2.1262%
PETERHEAD CCGT_CHP Actual Actual Actual Actual Actual 66.1917% 31.3766% 41.8811% 0.4858% 23.3813% 32.2130%
RATCLIFFE-ON-SOAR Coal Yes Actual Actual Actual Actual Actual 53.5677% 66.7461% 71.7403% 56.1767% 19.6814% 58.8302%
ROBIN RIGG EAST Offshore_Wind Yes Actual Actual Actual Actual Actual 41.4118% 37.4157% 46.7562% 55.3209% 51.9700% 46.7127%
ROBIN RIGG WEST Offshore_Wind Yes Actual Actual Actual Actual Actual 44.4918% 38.2254% 48.0629% 53.4150% 56.0881% 48.6565%
ROCKSAVAGE CCGT_CHP Actual Actual Actual Actual Actual 47.7376% 41.4820% 2.6155% 4.4252% 19.8061% 21.9044%
RYE HOUSE CCGT_CHP Actual Actual Actual Actual Actual 20.4253% 10.7188% 7.4695% 5.3701% 7.7906% 8.6596%
SALTEND CCGT_CHP Actual Actual Actual Actual Actual 90.6801% 81.5834% 69.0062% 67.9518% 55.6228% 72.8471%
SEABANK CCGT_CHP Actual Actual Actual Actual Actual 34.5669% 15.2311% 18.2781% 25.6956% 27.2136% 23.7291%
SELLAFIELD CCGT_CHP Actual Actual Actual Actual Actual 4.1046% 14.0549% 25.0221% 18.9719% 28.6790% 19.3496%
SEVERN POWER CCGT_CHP Yes Actual Actual Actual Actual Actual 32.2421% 27.7976% 32.4163% 24.6354% 18.3226% 28.2250%
SHERINGHAM SHOAL Offshore_Wind Yes Partial Actual Actual Actual Actual 3.2831% 36.6431% 49.3517% 46.2286% 53.6184% 49.7329%
SHOREHAM CCGT_CHP Actual Actual Actual Actual Actual 65.7100% 0.0000% 20.7501% 10.2239% 48.9514% 26.6418%
SIZEWELL B Nuclear Yes Actual Actual Actual Actual Actual 77.3818% 96.7260% 82.5051% 84.7924% 98.7826% 88.0078%
SLOY G2 & G3 Hydro Actual Actual Actual Actual Actual 15.0995% 9.1252% 14.3471% 15.5941% 13.9439% 14.4635%
SOUTH HUMBER BANK CCGT_CHP Actual Actual Actual Actual Actual 33.8760% 27.9763% 24.3373% 34.4673% 48.6753% 32.1065%
SPALDING CCGT_CHP Yes Actual Actual Actual Actual Actual 65.1849% 34.6976% 33.4800% 39.3092% 47.9407% 40.6492%
STAYTHORPE CCGT_CHP Yes Actual Actual Actual Actual Actual 58.4594% 54.4117% 37.6216% 56.6148% 69.4422% 56.4953%
STRATHY NORTH & SOUTH Onshore_Wind Generic Generic Generic Generic Partial 0.0000% 0.0000% 0.0000% 0.0000% 53.5472% 43.0546%
SUTTON BRIDGE CCGT_CHP Actual Actual Actual Actual Actual 64.8794% 20.1652% 9.4124% 17.2025% 13.1999% 16.8559%

36
Power Station Technology Generic Station
Yearly Load Factor Source Yearly Load Factor Value
Specific ALF 2011/12 2012/13 2013/14 2014/15 2015/16 2011/12 2012/13 2013/14 2014/15 2015/16
TAYLORS LANE Gas_Oil Yes Actual Actual Actual Actual Actual 0.1048% 0.2037% 0.0483% 0.0640% 0.1708% 0.1132%
THANET OFFSHORE WIND FARM Offshore_Wind Yes Actual Actual Actual Actual Actual 32.4868% 41.1093% 39.7489% 35.5935% 41.3434% 38.8172%
TODDLEBURN Onshore_Wind Yes Actual Actual Actual Actual Actual 38.1923% 32.7175% 39.5374% 33.7211% 35.0823% 35.6652%
TORNESS Nuclear Yes Actual Actual Actual Actual Actual 90.0662% 84.8669% 86.4669% 91.4945% 85.7725% 87.4352%
USKMOUTH Coal Yes Actual Actual Actual Partial Actual 19.2655% 45.1938% 38.9899% 6.1403% 25.5184% 36.5674%
WALNEY I Offshore_Wind Yes Actual Actual Actual Actual Actual 45.6003% 44.2799% 57.7046% 52.0555% 50.7535% 49.4697%
WALNEY II Offshore_Wind Yes Generic Partial Actual Actual Actual 0.0000% 60.2829% 61.9219% 58.2355% 35.7988% 51.9854%
WEST BURTON Coal Yes Actual Actual Actual Actual Actual 44.5447% 70.5868% 68.9176% 61.5364% 32.7325% 58.3329%
WEST BURTON B CCGT_CHP Generic Partial Actual Actual Actual 0.0000% 38.9336% 30.3021% 46.8421% 59.3477% 45.4973%
WEST OF DUDDON SANDS OFFSHORE WIND FARM Offshore_Wind Generic Generic Partial Actual Actual 0.0000% 0.0000% 47.9931% 40.0506% 48.7540% 45.5992%
WESTERMOST ROUGH Offshore_Wind Generic Generic Generic Partial Actual 0.0000% 0.0000% 0.0000% 13.1278% 54.8014% 38.6408%
WHITELEE Onshore_Wind Yes Actual Actual Actual Actual Actual 31.7670% 28.2265% 35.1074% 29.8105% 31.8773% 31.1516%
WHITELEE EXTENSION Onshore_Wind Partial Actual Actual Actual Actual 0.3067% 12.4146% 27.0102% 27.7787% 26.7655% 27.1848%
WILTON CCGT_CHP Yes Actual Actual Actual Actual Actual 12.6949% 3.4258% 4.4941% 21.5867% 16.1379% 11.1090%
WYLFA Nuclear Yes Actual Actual Actual Actual Actual 79.4968% 60.0463% 84.4883% 83.5566% 86.5533% 82.5139%
37
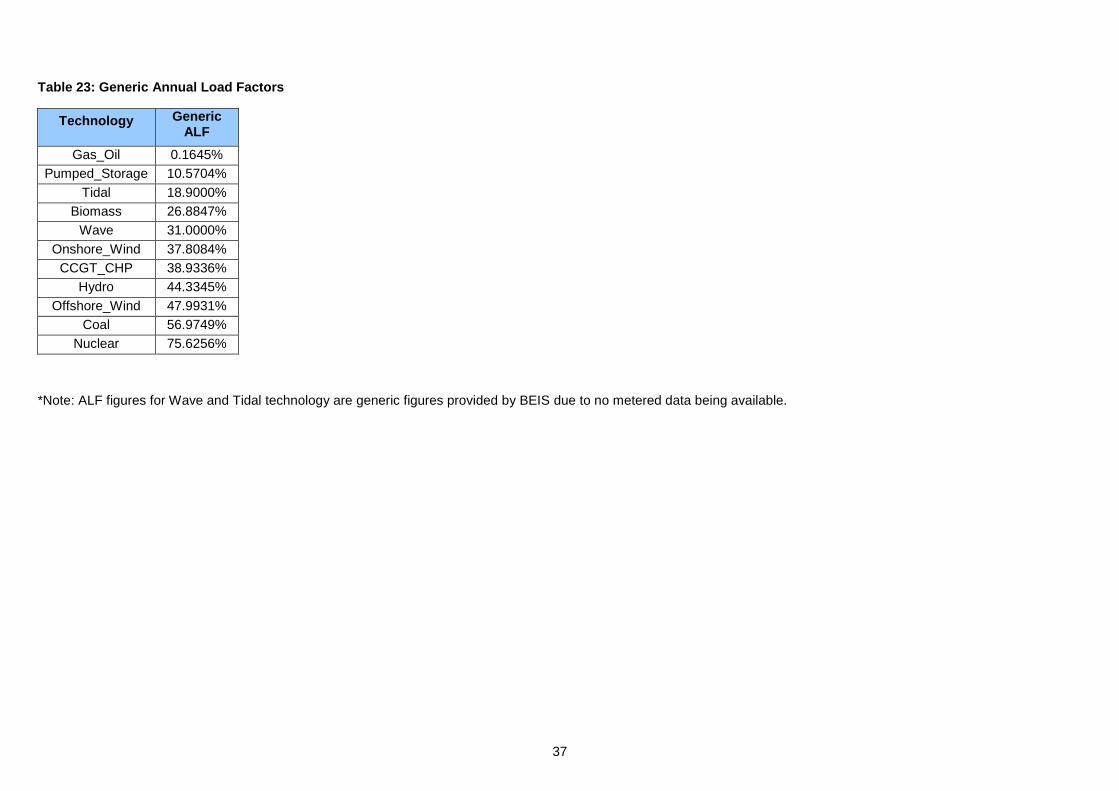
Table 23: Generic Annual Load Factors
Technology Generic ALF
Gas_Oil 0.1645%
Pumped_Storage 10.5704%
Tidal 18.9000%
Biomass 26.8847%
Wave 31.0000%
Onshore_Wind 37.8084%
CCGT_CHP 38.9336%
Hydro 44.3345%
Offshore_Wind 47.9931%
Coal 56.9749%
Nuclear 75.6256%
*Note: ALF figures for Wave and Tidal technology are generic figures provided by BEIS due to no metered data being available.
38
Appendix D : Demand tariffs
Table 24 – Demand Tariffs with breakdown of peak security and year round elements
Zone Zone Name
Peak
Security
Tariff
Year
Round
Tariff
Residual
Small
Generators
Discount
HH
Demand
Tariff
(£/kW)
1 Northern Scotland 1.87 -20.11 47.26 0.55 29.58
2 Southern Scotland 0.02 -17.35 47.26 0.55 30.48
3 Northern -2.67 -5.92 47.26 0.55 39.22
4 North West -0.71 -1.85 47.26 0.55 45.25
5 Yorkshire -2.58 -0.27 47.26 0.55 44.97
6 N Wales & Mersey -1.82 0.79 47.26 0.55 46.79
7 East Midlands -2.13 2.21 47.26 0.55 47.89
8 Midlands -1.41 3.05 47.26 0.55 49.46
9 Eastern 1.04 0.76 47.26 0.55 49.62
10 South Wales -6.19 3.92 47.26 0.55 45.55
11 South East 3.86 0.87 47.26 0.55 52.54
12 London 5.04 2.11 47.26 0.55 54.97
13 Southern 1.68 3.91 47.26 0.55 53.41
14 South Western -0.93 5.08 47.26 0.55 51.96

39
Appendix E : Generation Zones
4
2
1
3
9
5
76
8
13
11
10
1415
12
19
18
16
17
24
25
22
2120
2627
23
4
2
1
3
9
5
76
8
13
11
10
1415
12
19
18
16
17
24
25
22
2120
2627
23
40
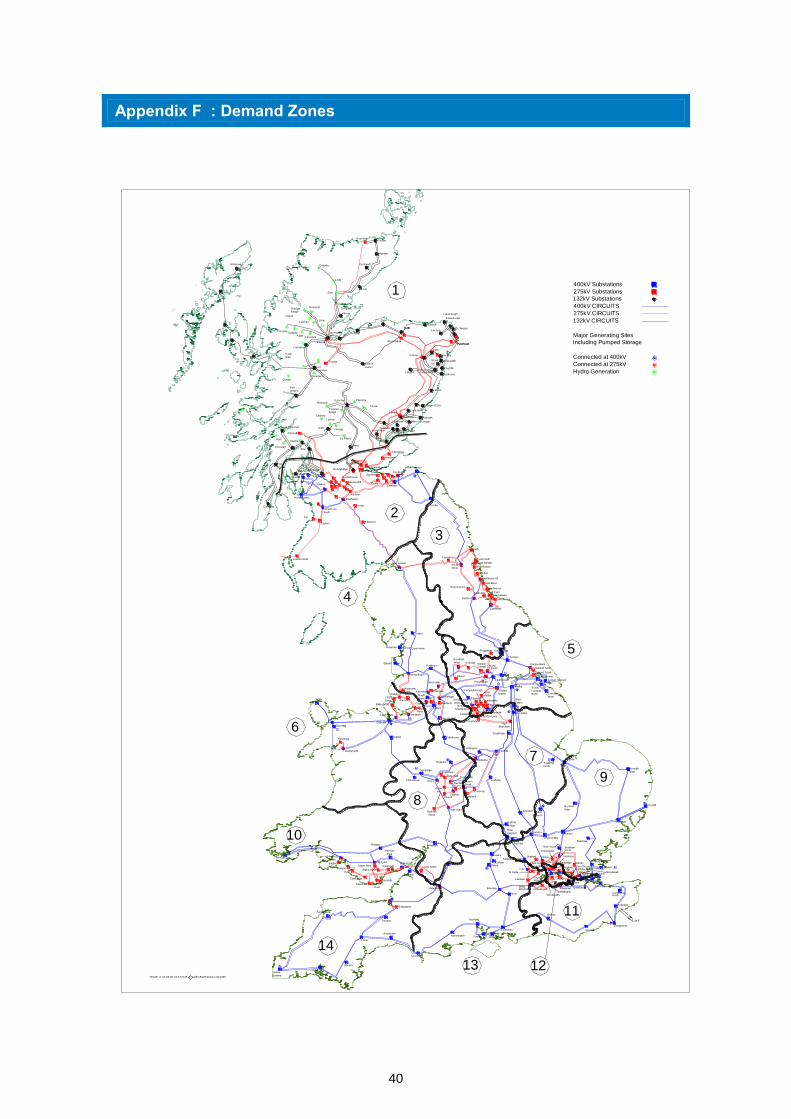
Appendix F : Demand Zones
Baglan
Bay
Leighton
Buzzard
Patford
Bridge
Northfleet EastS inglewell
Fourstones
Humber Refinery
Spald ing
North
West Thurrock
ISSUE A 04-03-05 41/177145 C Collins Bartholomew Ltd 1999
Dingwall
Dounreay
Newarthill
Easterhouse
Kincard ine
Wishaw
Strathaven
Kilmarnock
South
Ayr
Coylton
Saltend South
Hackney
Coryton
RatcliffeWillington
Drakelow
Shrewsbury
Cross
Weybridge
Cross
Wood
North
West
FrystonGrange
Ferry
Winco Bank
Norton Lees
Creyke Beck
Saltend North
Grimsby
West
Drax
Lackenby
Greystones
GrangetownSaltholme
Norton
Spennymoor
Tod Point
Hartlepool
Hart Moor
Hawthorne Pit
Offerton
West Boldon
South Shields
Tynemouth
Ste lla
West
Harker
Eccles
Blyth
Indian
Queens
Landulph
Abham
Exeter
Axminster
Chickerell
Mannington
Taunton
Alverdiscott
Hinkley Point
Bridgwater
Aberthaw
Cowbridge
Pyle
Margam
Swansea
North
Card iff
East
Tremorfa
Alpha Steel
UskmouthUpper Boat
Cilfynydd
Imperia l
Park
Rassau
Whitson
Seabank
Iron Acton
Walham
Melksham
Minety DidcotCulham
Cowley
Bramley
Fleet
Nursling
Fawley Botley Wood
Lovedean
Bolney
Ninfield
Dungeness
Sellindge
Canterbury
E de F
Kemsley
Grain
Kingsnorth
Rayle igh Main
Northfleet
L ittlebrook
Tilbury
Warley
Barking
Redbridge
W.HamCity Rd
Tottenham
Brimsdown
Waltham
Ealing
Mill HillWillesden
Watford
St Johns
Wimbledon
New Hurst
E lstree
Rye House
N.Hyde
Sundon
Laleham
Iver
Amersham Main
Wymondley
Pelham
Braintree
Burwell
Main
Bramford
Eaton
Socon
Grendon
East
Claydon
Enderby
Walpole
Norwich
Main
Coventry
Berkswell
Rugeley
Cellarhead
IronbridgeBushbury
Penn
Willenhall
Ocker
Hill
K itwellO ldbury
Bustleholm
NechellsHams
Hall
B ishops
Wood
Feckenham
Legacy
Trawsfynydd
Ffestin iog
Dinorwig
Pentir
Wylfa
Deeside
Capenhurst Frodsham
Fiddlers
Rainhill
K irkby
Lister
Drive
Birkenhead
Washway
Farm
Penwortham
Carrington
South
Manchester
Daines
Macclesfield
Bredbury
Sta lybridge
Rochdale
WhitegateKearsley
Elland
Stocksbridge
West
Melton
Aldwarke
Thurcroft
BrinsworthJordanthorpe
Chesterfield
Sheffie ld City
Neepsend
Pitsmoor
Templeborough Thorpe
Marsh
Keadby
West
Burton
Cottam
High
Marnham
Staythorpe
Stanah
Heysham
Padiham
Hutton
Bradford
West K irkstall Skelton
Poppleton
Thornton
Quernmore
Monk
EggboroughFerrybridge
Killingholme
South
Humber Bank
Sizewell
Pembroke
Osbaldwick
Rowdown
BeddingtonChessington
West
Inveraray
Auchencrosh
400kV Substations
275kV Substations
132kV Substations
400kV CIRCUITS
275kV CIRCUITS
132kV CIRCUITS
Major Generating Sites
Including Pumped Storage
Connected at 400kV
Connected at 275kV
Hydro Generation
11
12
Fasnakyle
Beauly
Deanie
Lairg
Shin
Nairn
Kintore
Blackhillock
Elg in
Keith
Peterhead
Persley
Fraserburgh
Invergarry
Quoich
CulligranAlgas
Kilmorack
Grudgie
Bridge
Mossford
OrrinLuichart
A lness
Brora
Cassley Dunbeath
Mybster
St. FergusStrichen
Macduff
Boat of
Garten
Redmoss
Willowdale
Clayhills
Dyce
Craig iebuckler
Wood
Hill
Tarland
Dalmally
K illin
Errochty
Tealing
Braco
GlenagnesDudhope
Milton of Cra ig ie
Dudhope
Lyndhurst
CharlstonBurghmuir
Arbroath
Fiddes
Bridge of Dun
Luna Head
St. Fillans
Fin larig
Lochay
Cashley
Rannoch
Tummel Bridge
Clunie
Kilchrennan
NantClachan
Port
Ann
Carradale
1
2
3
4
5
6
7
8
9
10
13
14
Windyhill
Dunoon
Inverkip
Devol
Moor
Hunterstone
Sloy
Fort
William
Bonnybridge
Neilson
Great
Glen
Conon
Fort
Augustus
Foyers
Inverness
Stornoway
Elvanfoot
Smeaton
Glenrothes
Westfie ld
Cume
Grangemouth
Longannet
L inmill
S ighthill
P itiochry
Torness
Cockenzie
Keith
Peterhead
Fraserburgh
Thurso


![PDF] Forecast TNUoS Tariffs for 2019/20 - National Grid plc2019/20 June Change Average (p/kWh) 6.374706 6.557159 0.182453 Zone Zone Name HH Demand Tariff (£/kW) NHH Demand Tariff](https://static.fdocuments.us/doc/165x107/612d4d961ecc515869421aef/-forecast-tnuos-tariffs-for-201920-national-grid-plc201920-june-change-average.jpg)