Chapter 24: Comparing Means (when groups are independent) AP Statistics.
SARI/Energy program South Asia Generation Pricing Study Final Report
United States Agency for International Development
-FINAL REPORT-
Comparing Independent Power Wholesale Electricity Prices In South Asia
Work Order # 113
April, 2003
Submitted by:
Advanced Engineering Associates International, Inc (AEAI) 1666 K Street NW, Suite 620
Washington, DC 20006
202-955-9080 phone, 202-955-9082 fax
www.aeaiinc.com
Deloitte Touche Tohmatsu 555 12 Street, NW, Suite 500
Washington, DC 20004-1207202-879-5394 phone, 202-879-5607 fax

SARI/Energy program South Asia Generation Pricing Study Final Report
TABLE OF CONTENTS
SECTION 1: STUDY PURPOSE AND APPROACH 1
SECTION 2: BACKGROUND ON INDEPENDENT POWER PRODUCTION IN EMERGING MARKETS 3
SECTION 3. METHODOLOGY OF THE SARI/E IPP STUDY 4 Data Collection Procedures 6
SECTION 4: SUMMARY OF TYPICAL SOUTH ASIAN PPA TERMS 10
SECTION 5: LEVELIZED PRICES IN THE SARI/ENERGY GENERATION PRICING STUDY 12
SECTION 6: FINDINGS OF THE SARI/E GENERATION PRICING STUDY 14 Summary of Study Findings 14 Summary of Overall Conclusions 17
SECTION 7: DETAILS ON CONCLUSIONS 19
SECTION 8: BROADER IMPLICATIONS OF THE SARI/E GENERATION STUDY FINDINGS 33
ANNEX 1: RESULTS 39

SARI/Energy program South Asia Generation Pricing Study Final Report
ACRONYMS
CEB Ceylon Electricity Board
CERC Central Electricity Regulatory Commission (India)
ERC Electricity Regulatory Commission (Indian states)
FSA Fuel Supply Agreement
IA Implementation Agreement
IDFC Infrastructure Development Finance Corporation
IPP Independent Power Producer
GW Gigawatt
KWh Kilowatt hour
MW Megawatt
MWh Megawatt hour
MEMR Ministry of Energy & Mineral Resources (Bangladesh)
NTPC National Thermal Power Corporation of India
NEA Nepal Electricity Authority
O&M Operations and Maintenance
PPA Power Purchase Agreement
PTC Power Trading Corporation of India Limited
ROE Return on Equity
ROI Return on Investment
SARI/E USAID South Asia Regional Initiative /Energy Program
USD U.S. Dollar

SARI/Energy program South Asia Generation Pricing Study Final Report
SECTION 1: STUDY PURPOSE AND APPROACH
This study compares wholesale electricity prices charged by Independent Power Producers (IPPs) in South Asia. The study examines twenty privately owned IPPs in Bangladesh, Bhutan, India, Nepal, Sri Lanka, and Pakistan. We also included in the study nine public sector generation projects that are similar to IPPs in terms of technology, output, age and financing arrangements. We included both IPPs and public sector generation projects so that we can compare public and private sector generation prices.1
The SARI/Energy Generation Pricing Study was commissioned by the U.S. Agency for International Development (USAID) South Asia Regional Initiative / Energy (SARI/E) Program. This program is implemented and funded by the USAID Asia and Near East Bureau.
The primary purpose of the study is to help electricity sector professionals and policy makers compare IPP wholesale electricity prices in a fair and transparent manner. This could increase public understanding of generation pricing and strengthen commitment to transparency in comparisons of wholesale electricity prices. Our results will also help policy makers examine issues related to international electricity trade and promotion of private generation in South Asia.
In addition to providing a basis for comparison of generation prices, this paper contributes to a larger dialogue on the role of private power generation in South Asia’s electricity sector. We hope that the analysis of IPP pricing and comparison of IPP prices with generation prices of public facilities helps to answer a number of questions about the role of private generation in South Asia’s energy market development.
This study was initially designed to compare prices for energy bought from IPPs in South Asia. As the study progressed, it became apparent that there were other questions of importance that could be addressed with slight changes in the scope of the study. For example, it became clear that there was an opportunity to compare public and private generation projects. It was also possible to examine the feasibility of mutually beneficial bilateral electricity trade in the region. USAID therefore widened the scope of the study to examine whether price differences are structural and sustainable, and thus provide a basis for cross border trade. The possible sources of structural differences include, for example:
•
•
•
Technology advantages, such as Nepal’s hydro resources;
Indigenous fuel supply, such as Bangladesh’s gas;
A combination of procurement methods and country risk, leading to lower bid prices and lower required equity and debt return.
1 In most of the public sector generation projects included in this study, the projects were designed following similar terms and using similar technologies as IPPs in the same country. In several cases, the public projects were actually set up as independent government-owned generation companies using PPAs and FSAs modeled after the country’s previous private IPPs. This makes most of the projects selected for this study generally comparable in terms of pricing, scale and technology to specific IPPs in the study.
Advanced Engineering Associates International (AEAI) 1

SARI/Energy program South Asia Generation Pricing Study Final Report
While the study data cannot be used to quantify all of these effects, the results lead to interesting conclusions about the potential for regional electricity trade. In addition, to the extent possible, we look at the study’s data to assess the role of private generation in the region more generally.
The study began in March 2001. Data were collected between September 2001 and July 2002. The results of the study have been presented at four different regional seminars, training programs and conferences in Colombo, Dhaka and Kathmandu. During each presentation, the study team received useful comments that influenced our analysis. In particular, we were asked to ensure that we examine the following:
What are the possibilities for regional electricity trade; •
•
•
Whether public generation is cheaper or more expensive than private generation;
How can the role of private generation in South Asia’s energy development be improved?
Our conclusions on these larger issues are presented in Sections 7 and 8.
We wish to give credit for the insightful, hard work carried out in selecting the sample and calculating levelized prices. The following consultants did a large share of the work:
Mian Shahid Ahmad, who worked on the Pakistan cases
Vinayak Mavinkurve of IDFC, who worked on the India cases
Gowlam Mowla, former Director of the Power Cell of the Ministry of Energy and Mineral Resources in Bangladesh, who worked on the Bangladesh cases
Ron Leasburg, Senior Associate of AEAI, who advised on the Pakistan cases and provided valuable comments on the final report.
Jayandra Shrestha of the Nepal Electricity Authority, who worked on the Nepal cases
Tilak Siyambalapitiya, who worked on Sri Lanka, Pakistan and Bhutan
Advanced Engineering Associates International (AEAI) 2

SARI/Energy program South Asia Generation Pricing Study Final Report
SECTION 2: BACKGROUND ON INDEPENDENT POWER PRODUCTION IN EMERGING MARKETS
In the past 20 years, many countries have turned to IPPs to obtain predictable supplies of wholesale electricity. IPPs are recognized as an important means of expanding generation capacity, introducing competition into the generation business, and transferring some risks from the public sector to the private sector.
IPPs have been established throughout the world, in both developed and developing countries. The most rapid period of IPP development occurred from 1992 to 1996, when the financial value of private power projects financed was three times that in all previous years.
Asia has the largest number of IPP projects, with an estimated 103 IPP contracts signed between 1990 and 1997. These projects had a total value of US $54 billion.2 Most of the 21 South Asian projects included in this study were contracted after 1996, the IPP “boom years.”
Based on available data, a majority of the IPP plants in emerging markets were project financed. Most were granted 20 to 30 year power purchase agreements (PPAs). Our literature survey indicates that approximately 50% of IPP plants worldwide were financed on a competitive tendering basis. The remainder were negotiated without competition. Most PPAs were entered into with a single buyer, typically a vertically integrated utility with captive retail customers.
The terms of the PPAs usually specify a take-or-pay obligation by the Single Buyer. In our survey of South Asian IPPs, we found only one “merchant” IPP, the Malana plant in Himachal Pradesh, India.3 There is a much higher percentage of merchant IPPs in developed countries due to deregulation and establishment of energy markets.
There has been an active debate on the pros and cons of IPPs. On the one hand, many developing countries continue to rely on IPPs as a main source of new generation capacity. At the same time, many officials and policy makers have expressed concern that IPPs are expensive and inflexible in terms of pricing, technology and offtake obligations. In Section 8, we summarize key points raised in the debate, and assess the implications of this study for these points.
2 The Impact of IPPs in Developing Countries, World Bank Private Sector Note 162, December 1998. 3 The Malana plant was initially set up as an IPP with a firm agreement to supply a single buyer. Problems with this offtake agreement led the plant’s owners to operate the plant on a “merchant” basis.
Advanced Engineering Associates International (AEAI) 3

SARI/Energy program South Asia Generation Pricing Study Final Report
SECTION 3. METHODOLOGY OF THE SARI/E IPP STUDY
To compare wholesale prices across projects, for each project we calculated a levelized per kilowatt hour (kWh) charge payable under the terms of a PPA and Fuel Supply Agreement (FSA). Our methodology calculated five different levelized prices for thirty generation projects:
•
•
•
•
•
Bid Price: The levelized price based on all specifications in the PPA and Fuel Supply Agreement using prices on the date tender offers were submitted.4 With appropriate fuel price and exchange rate adjustments, this is the price that the offtaker actually would pay on the date of execution of the PPA assuming the plant was commissioned.5 This is also the levelized price that would be evaluated in a competitive bidding situation.
Adjusted Bid Price: The levelized price on date of tender submission based on all specifications in the PPA but using the international fuel price equivalent. This effectively adjusts for subsidies or surcharges on fuel prices.
August 2001 Levelized Price: The levelized price based on all specifications in the PPA and Fuel Supply Agreement using prices applicable in August 2001.
Adjusted August 2001 Levelized Price: The levelized price based on all specifications in the PPA but using the international fuel price equivalents in August 2001. This effectively adjusts for subsidies or surcharges on fuel prices.
Levelized Price Corrected for Special Project Features: The levelized price that builds into the price various “special” features of the project, such as the cost equivalent of in-kind government contributions of land, tax and duty holidays, and capital subsidies provided by governments. This price is calculated using August 2001 domestic fuel prices.
These five different levelized prices were used to answer specific questions. In Section 6, we explain which levelized price was used to answer each research question.
The most important comparison is between levelized prices using domestic fuel prices in August 2001. This price compares projects at the same point in time using the fuel prices that are actually used for calculating payment to the plant’s owners. This levelized price provides a comparable basis for asking questions such as “Which country has the lowest IPP prices?” and “Are public sector prices lower than private sector prices?”
We believe that levelized prices calculated using a common methodology and assumptions are an adequate basis for comparative purposes. We accept that changes in the evolution of input parameters such as foreign exchange rates, inflation, and fuel prices have a large impact on relative prices over time. This is an inevitable result of the complexity of levelized prices.
4 In a some cases, we had to use the date of contract execution as a basis for our price information. This was necessary because some projects did not have tendering processes. 5 There will, of course, be adjustments made to prices due to change in input prices, foreign exchange rates and other factors between the time bids are submitted and contract execution. From the point of view of this study, these adjustments would not generally result in significant changes in the levelized prices.
Advanced Engineering Associates International (AEAI) 4

SARI/Energy program South Asia Generation Pricing Study Final Report
Levelized prices are not a completely satisfactory metric when comparing various technologies. In particular, levelized prices do not account for the underlying volatility of fuel input costs. This is particularly important when comparing fossil-fuel technology with hydro generation. The significant rise in natural gas prices over the past two years illustrates this problem. As an example, if the levelized price of a gas-based combined cycle plant were to be compared with a coal-based plant in the US for 1999, the effect of the 67% increase in average natural gas prices to utilities would not have been reflected in the comparison. 6
In some cases, it would be reasonable to account for expected volatility of fuel input costs in the comparison. One option would be to use a different levelizing discount rate for each technology to account for this. Alternatively one could use the certainty equivalent method to make a more fair comparison. However, for the purposes of this study, the same discount rate was used for all projects, and no adjustment for input price variability was made. This results in well understood issues related to the validity of comparisons. It is our opinion that these issues may not have a material impact on the conclusions reached in the SARI/E generation pricing study.
Finally, there is an issue related to the valuation of the “options” features of PPAs. By this we refer to the following features of PPA contracts:
•
•
•
•
Shorter duration PPAs (generally 7 to 10 years) allow the offtaker to contract cheaper supply sooner if cheaper sources become available. This means that a shorter contract has a financial advantage related to technological improvements compared to longer contracts.
Shorter duration PPAs, however, do not “lock in” the operational efficiency that is available in longer term contracts.
Shorter duration PPAs allow generation competition to be introduced more easily than long duration PPAs. The economic cost of this is that the economic gains associated with generation competition are deferred under long duration PPAs. In this sense, short duration PPAs should be more valuable to the offtaker.
There is considerable variation in the termination provisions of PPAs. The standard provision for termination is that the owner of the IPP is compensated for lost earnings for life of contract. This can be very expensive if an offtaker wishes to terminate before the end of the contract. There are also examples of PPAs that may be terminated with only a small (10%) premium payment on book value of equity in the plant. This allows relatively low cost “buy-out” of PPAs when governments wish to introduce generation competition. This would make the contracts with less expensive termination provisions “cheaper” to the offtaker than others with more expensive provisions.
Due to the high degree of complexity associated with valuing and pricing these “options” features of PPAs, we have not included any of these factors in our levelized price models. This appears to be a reasonable approach given the complexity of issues involved here.
6 Source: US Department of Energy, http://www.eia.doe.gov/oil_gas/natural_gas/info_glance/prices.html
Advanced Engineering Associates International (AEAI) 5

SARI/Energy program South Asia Generation Pricing Study Final Report
Data Collection Procedures
We constructed levelized prices by using data obtained from the projects’ actual Implementation Agreements (IAs), Power Purchase Agreements (PPAs) and Fuel Supply Agreements (FSAs). We used the following steps:
1. We reviewed the full range of existing IPPs throughout South Asia Through discussions with experts and review of documents, we identified the full range of IPPs in each of the six countries of the study. We reviewed available databases and public records to identify projects commissioned in the past 10 years in Bangladesh, Bhutan, India, Nepal, Pakistan, and Sri Lanka. In addition, we asked consultants in each country to advise which projects will be representative of the “universe” of IPPs in each country. At this inception phase, we also conducted a review of several previous studies carried out on IPPs in Asia.
2. We selected a sample of 30 projects. We selected a sample of thirty (30) projects for the study. The rules for sample selection were designed to ensure that a representative sample was selected. The sample represents the types of technologies, scale, location and procurement conditions used in each country during the past decade. Easy access to data concerning pricing terms was an important consideration. Our consultants advised us on which projects may be easiest to include in the study.
NAME OF IPP
Target Generation
in 2002 (MU) 2002 2001
GIPCL 3,970 2,754 2,534Gujarat Torrent 4,165 727 2,482Dabhol Power Corporation 6,100 304 2,465
VK Industries 1,590 1,616 1,658trum Power 1,575 1,489 1,567
Kondapalli 2,000 1,727 679am 0 53 0
LVS Power 0 85 0Bellary 260 189 13
anir Bavi 1,430 938 0Belgaum DG 0 417 0Kasargod 0 88 0Kochi CCGT 1,100 240 154
umanallur 2,460 1,041 0MR Vasavi 1,000 1,235 1,281
Samalpatti 200 646 91Samayanallur 150 274 0DLF Assam 212 147 131
otal Private IPP 26,212 13,970 13,055Source: Power Line April 2002
Actual GenerationPRIVATE IPPS IN INDIA AS OF APRIL 2002
We note that in Sri Lanka, Bangladesh, Bhutan and Nepal, we selected almost all the large-scale IPPs in the country. In these four countries, the study is close to a “census.” Therefore, the study should be considered to be highly representative of IPP pricing and terms in these countries.
GSpec
Peddapur
T
PillaiperG
T
In India there are too many IPPs (18 in 2002, as summarized in the table on the right) to select a truly representative sample, so we identified seven projects that were considered by our consultants to be representative of Indian IPPs. In India, we selected projects in Andhra Pradesh, Himachal Pradesh, Karnataka, and Tamil Nadu. In Pakistan, we selected four out of 12 IPPs. In Bhutan, we selected the two large government financed projects that have been developed with Indian Government assistance. These are the only large scale stand alone generation projects in Bhutan.
Advanced Engineering Associates International (AEAI) 6

SARI/Energy program South Asia Generation Pricing Study Final Report
3. We contacted government representatives for each project and obtained permission to include the project in our study. In coordination with the SARI/E country coordinators, we identified government representatives familiar with the selected projects. In Bangladesh, Bhutan, Nepal and Sri Lanka, to protect confidentiality of information, we worked directly with the public authority concerned with electricity. These included the Power Cell in Bangladesh and the Nepal Electricity Authority in Nepal. In India and Pakistan, we worked with institutions and individual consultants who were instrumental in developing IPP projects.
For each country, a large portion of the modeling was carried out by an in-country consultant who was familiar with the development of the IPP program in that country. In most cases, our financial modeling was carried out jointly by the government agency concerned with IPPs, our local consultant, and Deloitte Emerging Markets staff.
In the case of India, we subcontracted the calculation of levelized prices to the Infrastructure Development Finance Corporation, IDFC, a leading investment bank that is partially government owned. IDFC arranged verbal permissions to review PPAs and FSAs.
4. We obtained permission from both PPA signatories for a consultant to review the agreement and extract selected data. Working with both private sector and government representatives, we obtained verbal permission to obtain information related to each PPA. In most cases, developers and government agencies stated that verbal permission was adequate for participation in the study. In two cases, we were asked to obtain written permission. We obtained written permission in these cases.
To obtain permission, we submitted to key contract representatives a study protocol describing the purpose, procedures, methods, and outputs of the study. It was agreed in all cases that information concerning a specific project’s pricing would not be disclosed to any party outside Deloitte Touch Tohmatsu.
As part of our study protocol, we agreed that information about PPAs, FSAs, the plant location in the country, capacity, and plant name and owner would not be included in any public report. Therefore, this report will not disclose any information about the terms and pricing of any specific plant unless we are reporting information that is already stated in the public record.
We note that in almost all cases, there was already publicly available information on the levelized price for each plant in the study. This information had been previously disclosed by the government or the press as part of the procurement process, in press releases, or in publicly available government documents. We did not use these “headline” levelized prices. Instead, we constructed levelized prices for each plant by using a common methodology and the original contract documents. This provides a high degree of comparability in the prices used in this study.
5. For each generating plant, we calculated five levelized prices. Based on the information collected for each project, and using the specific terms in each PPA and FSA, we calculated the wholesale levelized prices for each project. These levelized prices used two fuel prices:
One price applying on the date on which the PPA was signed or the plant was commissioned, and
•
Advanced Engineering Associates International (AEAI) 7

SARI/Energy program South Asia Generation Pricing Study Final Report
•
•
•
•
•
The second using the August 2001 fuel price according to the Fuel Supply Agreement.
Capacity was set at the minimum availability requirement stated in the PPA.7 We assumed that there was no inflation or change in foreign exchange rates. The discount rate that we used was 12% for all projects.
In all cases, we constructed “real” rather than “nominal” price models. Real price models include no inflation, fuel price or foreign exchange rate fluctuations. This is a common approach in price modeling. However, we note that the use of real rather than nominal price models will tend to make countries with high rates of inflation and currency depreciation look less expensive than they will be under actual conditions. In addition, this approach does not allow us to highlight the effects of different treatments of foreign exchange and inflation risk on electricity prices over the long term.
For hydro projects, we calculated only three prices: a “bid date” price, an August 2001 price, and an adjusted price including “special” project features.
Some PPAs offer incentives to the IPP for performance beyond specified limits. Usually these are easy to meet factors such as availability. These do not depend on dispatch, but only on whether or not the owner makes the plant available as required. For the purpose of calculating levelized tariffs, we included any payments associated with availability, but did not include other incentive payments stated in the PPAs.
To calculate the cost of financing in the projects, we used the actual financing terms, as stated in project documentation.
6. We identified the special project elements in that affect the “all in” cost of electricity.
When data were available, we created a list of special project features that would affect project cost. This list includes features of any project that might cause prices to be higher or lower than comparators because of these features. Special features included:
Inclusion of transmission facilities in the price;
Land on which the plant is sited that is gifted or loaned without fee by the government;
Tax and duty exemptions;
Debt or equity financing that is significantly below market.
We did not attempt to determine the value of financial guarantees provided by government or multilateral agencies. This feature of some contracts was not included because of the difficulty in assigning a value to a guarantee.
We also did not include the value of grants and technical assistance activities paid by donor agencies in the “special” project components. In some projects, these could be significant costs. For example, in Pakistan, USAID paid for the environmental study of the Hub River Oil
7 We recognize that setting the capacity at the minimum capacity requirement in the PPA will cause some difficulties in comparing prices. We considered the alternative of setting capacity at the same percentage level for all plants, and decided that this makes it more difficult to compare prices across plants. The rationale for this decision is that the minimum offtake price is the level of generation that the government expects to be the actual level of dispatch during a reasonable part of the life of the PPA.
Advanced Engineering Associates International (AEAI) 8

SARI/Energy program South Asia Generation Pricing Study Final Report
Pipeline, rebuilt the meteorological tower, and supported the analysis of data for over two years to plot plume discharges from the Hub plant. None of these costs were incorporated in our levelized tariff calculations. These costs were excluded because of the large effort that would have been required to obtain complete data on donor expenditures.
Advanced Engineering Associates International (AEAI) 9

SARI/Energy program South Asia Generation Pricing Study Final Report
SECTION 4: SUMMARY OF TYPICAL SOUTH ASIAN PPA TERMS
The South Asian PPAs are generally based on the same terms as other PPAs in Asia. There are two main components:
1.
2.
Capacity charges. Capacity charges compensate the plant owner for the fixed costs associated with making the facility available to the system. Capacity charges are generally set based on a specified minimum available capacity. Owners must provide the minimum availability or they do not get paid. As long as they maintain the available capacity, they are paid their capacity charge whether they generate or not. This is often called the “take or pay” feature of the PPA. The capacity charge includes: A. Capital Cost Recovery Component: This covers the debt and equity costs, and coverts
these costs to a per kW annual charge. The bidder has to submit rates for each of the years of the contract. This element is not escalable.
B. Fixed O&M costs incurred in US dollars: This is an annual USD/kW charge to cover fixed dollar denominated O&M charges. This is escalated at some measure of foreign inflation, such as the U.S. Consumer Price Index.
C. Fixed O&M costs incurred in local currency: This is an annual USD/kW charge to cover fixed local currency denominated O&M charges. This is escalated according to a local inflation index.
Energy Charges: Energy charges are paid for the quantum of energy delivered. These charges have no ceiling. These are usually escalable in accordance with input costs. These are also broken into three components. A. Fuel charges: These are the costs of the supply of fuel, such as diesel oil, gas or coal.
Charges are governed by a separate Fuel Supply Agreement. These charges may be at cost, or based on some reference to a market price.
B. Variable O&M, US$ component: This component is the annual USD/kW variable costs. It is escalated according to some foreign inflation index, such as US CPI.
C. Variable O&M, local currency costs: This component is the annual local currency / kW cost of O&M. It is generally inflated at the rate of local inflation, or using a custom index of O&M costs in local markets.
The standard termination provisions require that the offtaker pay the plant owner the book value of equity plus the Present Value of lost profits if the contract is terminated early. There are variations among contracts in the percentage of lost earnings that must be paid. A few PPAs found in the study allow termination with far lower costs to the offtaker. In several cases, the PPAs may be terminated with payment of the book value of equity plus a 10% premium. In Sri Lanka, the termination procedure includes a buy-out option and the buy-out price in each year of the PPA is part of the financial proposal in the bid.
In competitive procurements, the IPP contracts are awarded to the bidder that offers the lowest levelized price. Price levelization is determined by having bidders forecast all six components on an annual basis for the life of PPA, and then discounting the total price at a specified discount rate. The discounted prices are then averaged to produce a levelized price.
Advanced Engineering Associates International (AEAI) 10

SARI/Energy program South Asia Generation Pricing Study Final Report
It is important to point out that many IPPs would not have been financed without supportive financing from multilateral lending institutions such as the World Bank and International Finance Corporation. This financing was possible for these projects because of the Implementation Agreements (IAs) that were signed between the developer and the concerned government. In many IAs, the government guaranteed the performance of the power purchaser, and in some cases, also the fuel supplier if it was government owned.
Advanced Engineering Associates International (AEAI) 11

SARI/Energy program South Asia Generation Pricing Study Final Report
SECTION 5: LEVELIZED PRICES IN THE SARI/ENERGY GENERATION PRICING STUDY
Levelized models were completed for 30 projects. This includes 21 private sector IPPs and 9 government projects that are priced similarly to IPPs. Dhabol Phase I was dropped from the study because the source of its data was incomplete and it was impossible to verify some assumptions concerning the levelized prices. Annex 1 summarizes the levelized prices for the 29 projects that were retained in the study. We note that in Sri Lanka, we did not include the largest IPP in the country because the owners of the project did not want to participate. In Sri Lanka, we also did not include the most expensive private generator in the country because the owners did not want to participate. Therefore, Sri Lanka’s results may not be as fully representative of the universe of IPPs as other countries in the study.
The sample includes the major technologies used in all countries, including liquid fuel steam turbine and diesel engine, gas open and combined cycle, run-of-river hydro, and coal.
TOTAL PROJECTS INCLUDED IN SARI/E PRICING STUDY
COUNTRY GOVERNMENT PRIVATE TOTAL Bangladesh 2 4 6 Bhutan 2 0 2 India 1 6 7 Nepal 2 4 6 Pakistan 0 4 4 Sri Lanka 2 2 4 All Countries 9 20 29
PROJECTS INCLUDED IN SARI/E GENERATION PRICING STUDY BY TECHNOLOGY AND OWNERSHIP
TECHNOLOGY GOVERNMENT PRIVATE TOTAL Combined Cycle Gas 1 8 9 Combined Cycle Liquid 2 1 3 Diesel Engine 1 5 6 Gas Engine 0 1 1 Coal 1 0 1 Hydro 3 6 9 Total 8 21 29
In terms of the representativeness of this sample to the universe of IPPs in South Asia, the following table summarizes the sample relative to the universe of IPPs in each country:
Advanced Engineering Associates International (AEAI) 12

SARI/Energy program South Asia Generation Pricing Study Final Report
SUMMARY OF THE SARI/E SAMPLE OF IPPS COMPARED TO ALL IPPS IN COUNTRY AS OF THE BEGINNING OF 2001
COUNTRY NUMBER OF IPPS IN SARI/E STUDY SAMPLE
TOTAL NUMBER OF OPERATIONAL IPPS IN COUNTRY AS OF JANUARY, 2001
Bangladesh 4 14 Bhutan 0 0 India 6 18 Nepal8 4 3 Pakistan 4 12 Sri Lanka 2 4 All Countries 20 51 Source: Platts International Private Power Quarterly, First Quarter 2001.
This table indicates that the SARI/E study sample of IPPs includes the majority of IPPs that were operational by early 2001. In this sense, the sample should be considered fully representative of the full universe of IPPs in the region for the period beginning in the first quarter of 2001.
8 In Nepal, the number of IPPs in the study exceeds the number of operational IPPs in 2001. This is due to the fact that we included one IPP that had been awarded but not commissioned in the study.
Advanced Engineering Associates International (AEAI) 13
SARI/Energy program South Asia Generation Pricing Study Final Report
SECTION 6: FINDINGS OF THE SARI/E GENERATION PRICING STUDY
Summary of Study Findings
The SARI/E Generation Pricing Study provides valuable insight into the role of private power generation in electricity markets. The findings and conclusions of this study should help policy makers rethink the role of private generation in their systems. In addition, there are important preliminary indications of the potential benefits associated with bilateral trade in wholesale electricity in the South Asia region.
It is well known that many factors contribute to the cost of generated electricity. Examples include fuel costs and characteristics, fuel type, cost of equipment, type of technology, type of financing, level of competition for the project, risks transferred to the developer, taxes and duties, and financial condition of the offtaker. It is generally considered difficult to compare IPP prices across projects and countries because conditions vary so widely. However, we found that comparable prices can be developed, and that specific differences between projects can be identified to explain price differences.
A summary of our findings is discussed below. For a complete statement of the prices found in our analysis, please see Section 7, Detailed Results, and Annex 1, Summary of Levelized Prices.
Cost of Private Sector Power
ource: Government of Bangladesh Ministry of Energy
MW Capacity
Levelized Tariff Total, US cents
AES Haripur CC 360 2.73450 2.79
Khulna Power Company Ltd 108 4.31estmont Power CT (Bhanghabari Barge Mounted) CC 90 4.31
ortium (Haripur Barge Mounted) 110 4.41al Power Company (CT) 10 4.3
Cost of Power for Different Bangladesh IPPsS
AES Meghnaghat CC
WNEPC ConsRur
Bangladesh’s prices are low by both regional and international standards.9 Bangladesh’s prices are low in large part because the government has run highly competitive tendering processes with clear specifications and attractive procurement designs. Even when we adjust for the gas price that the government has allowed for the electricity generation industry, Bangladesh’s IPP rates are very low.
1.
9 This table is copied from a publicly available Government of Bangladesh source. The prices obtained here are similar, but not exactly equal to the results of our study. Any differences are due to the fact that we used the actual contract documents but calculated the prices at a slightly different time than was used for the above calculations. The differences are insignificant with respect to our study findings.
Advanced Engineering Associates International (AEAI) 14

SARI/Energy program South Asia Generation Pricing Study Final Report
2.
3.
4.
5.
6.
7.
8.
Bhutan’s prices are also low, but a significant cause for the low prices are the capital subsidies provided by the Government of India under the terms of bilateral agreements. If we adjust for the capital subsidies, the Bhutan hydro IPP prices approach the average levels of the Nepal hydro IPPs. See Section 7 for further details on the impact of capital subsidies on Bhutan’s wholesale prices.
We did not find conclusive evidence that competitive procurements led to cheaper prices than negotiated procurements. However, the evidence on the difference between competitive and non-competitive procurements is not conclusive because there were so few competitive procurements. We did find that competitive procurements in Bangladesh achieved very low prices. 10
We did not find that IPPs procured in the early and mid-1990s were cheaper than the IPPs procured at the end of the 1990s or 2000. There is little evidence, except in Nepal, that “earlier” IPPs are more expensive than “later” IPPs due to a “learning curve.”
New public sector projects using comparable technologies are not significantly cheaper than private sector IPPs. If one takes into account expected cost and time overruns and capital subsidies, there does not appear to be a price advantage for the public sector to develop new generation facilities. Private IPPs appear to be a competitively priced means of developing new generation facilities. It appears common that the full costs of public sector generation are not included in wholesale offtake prices calculated for government-owned plants.
There is large price variation within countries for plants of similar scale and technology. Technology alone does not determine price. It appears that other factors, such as the effectiveness of the procurement process, are influential. This suggests that effective competition under well-designed procurements with good project structures can obtain much lower prices for IPP electricity.
Projects with similar scale and technology in different countries have widely varying wholesale prices. There does not seem to be a strong correlation between IPP levelized price and the technology used. Again, the effectiveness of the procurement process and competitive pressures seem to influence prices significantly.
We found that major “special” features that had a significant affect on prices were (1) capital subsidies provided by governments, (2) tax and duty holidays, and (3) in a few cases, transmission costs. In several cases, capital subsidies significantly reduced IPP prices. In a number of cases, the grant of tax and duty holidays by the government caused a significant reduction in IPP prices. And finally, in a few cases, the costs of transmission facilities were added to the IPP prices, and this significantly raised IPP prices.
10 It was difficult to determine how to classify many of the procurements in terms of competition versus negotiation. For example, in Sri Lanka, IPP procurements were conducted on an apparently competitive basis, but in many instances extensive negotiations followed the initial competitive phase of the procurements.
Advanced Engineering Associates International (AEAI) 15

SARI/Energy program South Asia Generation Pricing Study Final Report
Possibility for Regional Electricity Trade
1.
2.
3.
4.
•
•
•
•
•
It is not clear that export of hydropower from Nepal to India as base load supply is commercially feasible. Nepal’s IPP prices are not among the cheapest electricity prices compared with other IPPs in the region. They are in the mid-range of prices. If the necessary transmission charges were added to Nepal’s IPPs, most IPPs would not be competitive as exporters to the Indian base load market. However, there are some specific IPPs in Nepal that may have a competitive pricing advantage in the Indian market. We have been told that some of the new larger scale plants may offer significantly lower prices. If this is true, then the older, earlier IPPs would apparently not be competitive for exporting to India at present PPA prices, but future large-scale plants might be competitive.
Sri Lanka has the highest average cost for projects in the study. It is worth Sri Lanka carrying out further feasibility analysis on importing power from India. Given the costs of Sri Lanka’s thermal generation, India’s thermal power would be comparatively cheap.
The choice of scale, technology and procurement methodology has driven Sri Lankan IPP prices toward the highest end of the price range. In addition, if we compare the Sri Lankan projects to an international benchmark project using the same technology, the Sri Lankan projects would be considered very expensive. This appears to reflect the high cost of fuel purchased from the government owned fuel supplier, and the lack of competition in the IPP procurements. It would appear to be worth investigating the feasibility of importing electricity to Sri Lanka from India.
Pakistan IPP prices are somewhat more expensive than Indian IPP prices. This has implications for export of surplus Pakistani IPP power to India. Given the transmission costs, it would appear not to be commercially feasible to export surplus electricity from Pakistan’s IPPs to India.
There is an emerging electricity trading “system” in India. This system consists of a number of building blocks that are forming the basis for domestic electricity trade in India. This could potentially support bilateral and multilateral electricity trade among countries in the region. During our discussions with IPP developers and public sector officials in South Asia, we noted that there are developments in India that are setting a foundation for domestic electricity trade. These include:
The Availability Based Price, a procedure for setting prices of electricity traded that came into effect in India in July 2002.
Pending regulations at both CERC and state ERC levels regarding transmission access and pricing that facilitate trade.
Established NTPC pricing and sales practices for power sold by NTPC-owned generating plants.
Full commercial operation of a trading platform set up by Power Trading Corporation of India.
Emergence of generation surplus and deficit states in India.
Advanced Engineering Associates International (AEAI) 16

SARI/Energy program South Asia Generation Pricing Study Final Report
We believe that these building blocks, although they do not constitute an integrated power trading system, show great promise for bilateral trading between India and all other countries in the region.
Summary of Overall Conclusions
In Section 7 below we present more detailed analysis and data from the study. Our overall conclusions relative to private power generation and electricity trade potential in South Asia would emphasize the following:
First, there is significant evidence that private power generation is no more expensive, and often cheaper, than power generation by public sector generating plants. We noted that public officials in many countries believe that IPPs produce expensive electricity. In general, we found this is not a correct representation of the cost of private power.
Second, our study indicates that new power plants are considerably more expensive than older power in the system, regardless of whether the new power comes from IPPs or from public plants. In other words, IPPs are not “expensive;” new generation is expensive. The rise in wholesale generation costs is not due to the cost of private power; it is due to the cost of new plants. This may seem like an obvious fact about generation pricing. However, it suggests that the criticism of IPPs as expensive is not correct.
Third, we have identified high variations in the cost of IPP generation across countries in South Asia. This leads to a number of important, but tentative, conclusions about electricity trade in the region. Among the conclusions identified by the study concerning power trade are the following:
Nepal’s hydroelectricity is too expensive to be exported to India as base load. In addition, the volumes available from individual plants appear to be uneconomic to export from Nepal on a plant-by-plant basis. It appears reasonable for Nepal to consider exporting larger blocks of hydropower through some mechanism that aggregates the exportable volume, and to sell this as mid- and peaking power.
•
•
•
•
It does not appear financially desirable for India to import electricity from Pakistan. Pakistan’s IPPs are not significantly cheaper than India’s IPPs. Pakistan’s IPPs are, however, far more expensive than the average generation cost in India.
Bhutan’s hydroelectricity is not significantly cheaper than Nepal’s hydroelectricity if capital subsidies provided by India are taken into account. Bhutan has low generation prices, with an average price of 4.07 cents per kWh. This is lower than Nepal’s average of 5.8 cents per kWh. However, Bhutan’s plants were both developed using loans and equity provided by the Indian Government. The return on capital for both debt and equity for the Bhutan projects is significantly below the private costs of capital in both India and Nepal. We calculated an adjusted price for the Bhutan projects using the same equity and lending rates that we found in the Indian private sector projects. The result is 5.51 cents per kWh.
Both Sri Lanka and Nepal may benefit from wholesale electricity trade with India. In both cases, it would appear to be economically advantageous for Nepal to be able to buy Indian wholesale electricity. In Nepal’s case, it may be economically advantageous to sell mid-merit and peaking power to the Indian grid, while buying base load from India.
Advanced Engineering Associates International (AEAI) 17

SARI/Energy program South Asia Generation Pricing Study Final Report
There has been strong debate over the role of private generation in South Asia over the past several years. These conclusions provide important information relevant to the debate on the role of IPPs.
In Nepal, Sri Lanka, India, Pakistan and Bangladesh, influential parties have suggested that public sector generation is cheaper than private IPPs. These parties have suggested that all new generation should be financed and implemented by the public sector. It has even been suggested by some that the government should force unilateral changes in the terms of PPAs. Our study suggests that arguments that private power is more expensive then public power do not seem to be correct.
Similarly, IPP advocates have suggested that IPP output is competitively priced, and therefore the “generation gap” should be filled by public sector integrated utilities contracting large amounts of new IPP generation. We heard this argument specifically in Nepal and Sri Lanka. Our assessment is that all new projects, whether public or private, put considerable pressure on the liquidity of the public sector integrated utilities. The issue is not public versus private. The issues are multiple, including:
New generation is more expensive than old generation; •
•
•
•
Public sector utilities simply are not escalating their retail prices fast enough to keep up with rising costs and declining distribution efficiency;
Unless there are major changes in the incentives for efficiency and rules for setting retail prices, most public electricity utilities in South Asia will be increasingly financially stressed, and in some cases, insolvent, if they continue to contract new thermal generation;
Efficiency in generation appears be influenced by competition for the market or competition in the market. Although competition in the market is beyond the scope of this study, it is important to consider opportunities for price-based competition among generators
Advanced Engineering Associates International (AEAI) 18

SARI/Energy program South Asia Generation Pricing Study Final Report
SECTION 7: DETAILS ON CONCLUSIONS
This section presents the details of the data from the study, along with a discussion of the conclusions that we draw from the data. We note that this is not a “statistical” study of the data on our 30 cases. The size of the sample is too small to test a set of hypotheses using common statistical practices. Similarly, the number of “independent variables” is too large to allow statistical analysis methodologies to be used. In fact, to our knowledge, none of the previous studies of IPP pricing in emerging markets has used statistical analysis methods. Similarly, even if the scope of the study were expanded to include a larger number of IPPs (i.e., IPPs from around the world instead of only one region), it may still be difficult to apply traditional statistical techniques. Again, this relates to the small sample size relative to the number of potential independent and dependent variables.
To draw conclusions from our data set, we proposed eleven “study issues” to be examined. These are roughly equivalent to hypotheses in a statistical study. Each study issue is listed below, along with the corresponding data analysis. In each case, we use best professional judgment to reach our conclusion. However, we note that our conclusions are based only on our professional judgment and not on application of any statistical analysis methods beyond simple descriptive statistics.
As a concluding point on the methodology of the study, no published study conducted on emerging market IPP pricing prior to this one drew upon prices as accurate as the ones used herein. For this reason, the authors of this study believe that our use of “real” IPP prices constructed from primary contract documents produce conclusions that are particularly valid. In addition, our sample is large enough to be considered “externally valid” or representative of the universe of IPPs in South Asia. This is because in several cases we have included practically all of the IPPs in the country.
Study Issue 1: Bhutan and Bangladesh’s prices are low by both regional standards
Study Issue 2: Sri Lanka has the highest average cost for projects in the study To compare prices across countries in the SARI region, it was necessary to use a similarly priced fuel price input at a fixed date. To examine hypotheses 1 and 2, international fuel equivalent prices in August 2001 were used to generate the levelized prices.11
An average price was then calculated for each country from each power plant in the study. By comparing the average prices it was determined that Bangladesh does indeed have some of the lowest average prices in the SARI region. Bhutan’s hydro generation prices are also very low by regional standards. Nepal’s prices are comparatively high. At the highest end of the spectrum is Sri Lanka.
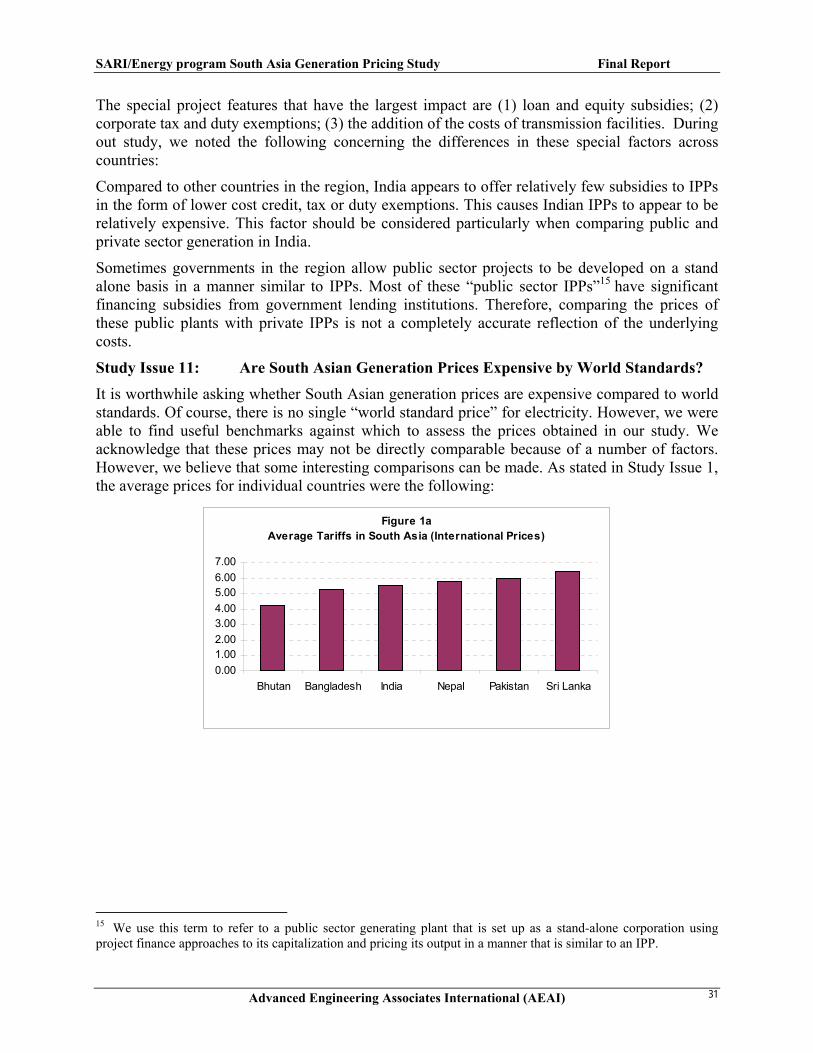
Figure 1a shows the average prices for all six countries in the region based on international fuel prices at August 2001. It also shows that the range from lowest price to highest is relatively high, ranging from 4.22 US cents/kWh in Bhutan to 6.40 US cents/kWh, a difference of more than 50
11 For hydro plants, there is no fuel equivalent price that was calculated. Therefore, for these plants, we used the August 2001 offtake prices.
Advanced Engineering Associates International (AEAI) 19

SARI/Energy program South Asia Generation Pricing Study Final Report
percent. Nepal, which we initially thought would be one of the cheapest countries in the region, in fact falls roughly in the middle, with average prices equaling 5.90 US cents/kWh.
Figure 1aAverage Tariffs in South Asia (International Prices)
0.001.002.003.004.005.006.007.00
Bhutan Bangladesh India Nepal Pakistan Sri Lanka
Using domestic fuel prices for price comparisons sheds light on conditions specific to each country. Figure 1b below does not compare across countries in the region, but it does demonstrate that average prices in Sri Lanka, in absolute terms, are the highest in the region, while Bangladesh and Bhutan have the lowest prices. The variation is more pronounced in this example, as the highest prices in the region are nearly three times greater than the lowest.
Figure 1bAverage Tariffs in South Asia (Domestic Prices)
0.001.002.003.004.005.006.007.008.00
Bangladesh Bhutan Pakistan India Nepal Sri Lanka
Study Issue 3: Pakistan’s Generation Prices are More Expensive than India’s. In Pakistan during the 1990s, IPP developers responded to a Government of Pakistan offer to sell power at set prices that were favorable to the developers. Developers with “bankable” projects were able to sign PPAs at the government-set prices with no negotiation on price. As a result, the prices of IPP output tended to be higher than in surrounding countries in South Asia. In addition, the excess capacity signed up during the 1990s led to a situation where Pakistan currently has capacity that could, theoretically, be sold to other countries in the region. Therefore, our study sought to test the idea that it may be economically feasible for Pakistan to export surplus electricity to India.
Advanced Engineering Associates International (AEAI) 20

SARI/Energy program South Asia Generation Pricing Study Final Report
As presented in Figure 3a below, average prices in Pakistan are higher than in India but only 8 percent higher. Transmission costs would add to this price difference.12 However, there may be some specific locations and plants in Pakistan that would have a competitive advantage for sales to India. Nonetheless, there does not appear to be a strong argument in favor of Pakistan’s export potential.
Figure 3aAverage Tariffs in India and Pakistan (International Prices)
5.205.305.405.505.605.705.805.906.006.10
India Pakistan
When domestic fuel prices are used to compare wholesale prices in the two countries, as in Figure 3b below, prices in India are 9 percent higher than in Pakistan.
Figure 3bAverage Tariffs in India and Pakistan (Domestic Prices)
5.005.105.205.305.405.505.605.705.80
India Pakistan
Our conclusion is that it may be worthwhile to continue to examine the economic feasibility of exporting electricity from Pakistan to India from specific plants and locations. There may be opportunities arising from the different load profiles of the Indian and Pakistan markets.
Study Issue 4: Public sector generation projects are not cheaper than private IPPs. To determine whether public sector levelized prices are similar to private projects, we examined three countries in which very similar public and private sector projects were set up. We used a “pairs” approach to examine the hypothesis that public generation is cheaper than private
12 The cost of transmission was not estimated in this study. For other projects in the study, transmission facilities that were included in levelized prices added between 3% and 17% to the total levelized price.
Advanced Engineering Associates International (AEAI) 21

SARI/Energy program South Asia Generation Pricing Study Final Report
generation. Under the pairs approach, we compared three pairs of generation projects in Bangladesh, Sri Lanka and Nepal. Each pair included one public generation plant and one private plant. In all three cases, the public and private plants in each country used the same technology and were similar in scale. In all three pairs, the public projects were developed after the private project, using the private project as a technical and financial model.
We calculated prices based on domestic fuel prices for each project. Figure 4 below presents the findings. In Bangladesh, private generation is 10.5% cheaper than public generation. In Sri Lanka, public generation is 12% cheaper than private prices. In Nepal, public generation is 21% cheaper than private generation.
Figure 4Tariffs in Private versus Public Sector Projects
0.00
2.00
4.00
6.00
8.00
Bangladesh Sri Lanka Nepal
Private Public
One pair suggests that private generation is cheaper than public, while two pairs suggest that public generation is cheaper. What can we conclude from this? We suggest the following:
In the Bangladesh pair, a low private generation price was achieved in large part because the procurement of the private IPP was transparent, competitive, and well designed. This led to an outcome in which similar plants in terms of scale and technology resulted in private generation being cheaper than public generation.
•
•
•
•
•
In Nepal, procurement of the private IPP was negotiated. This may have added costs. In addition, the public project experienced cost and time overruns that were not reflected in the offtake price. The Nepali public generation plant also used loans from the public employee pension fund. Interest rates were lower than commercial rates. This could be viewed as a capital subsidy that would account for a large portion of the price differential.
Our conclusion is that the three cases do not demonstrate that public generation is cheaper than private generation. The following factors must be considered when comparing public and private generation prices:
Degree of competition used in procuring private power;
Capital cost differentials between private and public projects;
Whether or not cost and time overruns are incorporated in public sector prices.
Advanced Engineering Associates International (AEAI) 22

SARI/Energy program South Asia Generation Pricing Study Final Report
Although evidence from our three cases does not fully support our conclusion, we believe the following is true:
Public generation prices in our study would be higher if the full development costs of public projects were reflected in the offtake prices. This was true in most public projects examined here.
•
•
•
Competition can lead to lower prices in private projects.
Subsidized debt and equity are a major factor causing public projects to appear to be “cheaper.”
Advanced Engineering Associates International (AEAI) 23

SARI/Energy program South Asia Generation Pricing Study Final Report
Study Issue 5: There is no significant difference in price between negotiated and competitive procurements.
To determine whether negotiated power purchase agreements (PPAs) have higher prices than competitively awarded PPAs, we again used a “pairs” approach. We selected similar fuel-powered plants in countries in which both negotiated and competitively awarded PPAs existed (Bangladesh, Sri Lanka and India). Then we calculated averages of prices within each pair based on domestic fuel prices in August 2001 to determine average prices for negotiated and competitively awarded pairs in each country. In the case of India, where both negotiated and competitively awarded plants powered by both diesel and gas existed, each was examined separately. The results are presented in Figure 5 below.
Figure 5Tariffs from Negotiated and Competitively Awarded PPAs
0.002.004.006.008.00
10.0012.00
Bangladesh Sri Lanka India (Gas) India (Diesel)
Competitive Negotiated
As demonstrated by the figure above, no definite conclusion can be drawn concerning whether negotiated PPAs produce higher prices than competitively awarded PPAs. Prices from negotiated plants were higher in two of the four examples and prices from competitively awarded plants were higher in the other two examples.
In many instances competitive procurements can lead to lower prices. This view is supported by the theory of “competition for the market.” There may, however, be methodologies for non-competitive procurement that are both transparent and that lead to low price outcomes. It is reported that in the Chinese IPP program, the government representatives used an effective negotiating process to reduce both the equity returns and the costs associated with their IPP plants.
Advanced Engineering Associates International (AEAI) 24

SARI/Energy program South Asia Generation Pricing Study Final Report
Study Issue 6: Power Offtake Prices have Not Become Cheaper over Time
We sorted 28 of the power plants by price based on timing of contract signature. In all cases, we used the price calculated using domestic fuel prices.13 We wanted to determine whether project output prices have become cheaper as countries “move up a learning curve” in IPP development.
As demonstrated by Figure 6 below, it is evident that no such relationship between date of contract execution and price exists.
Figure 6Relationship between Date and Levelized Tariff
0.001.002.003.004.005.006.007.008.00
Sep-91
Jan-93 Jun-94 Oct-95 Mar-97 Jul-98 Dec-99
Apr-01 Sep-02
Jan-04
Our conclusion is that there is no relationship between when the contract was signed and the offtake price for wholesale electricity.
Study Issue 7: New generation project output prices are higher than average generation price in each country.
COMPARISON OF NATIONAL AVERAGE GENERATION PRICES WITH SARI/E STUDY AVERAGE
GENERATION PRICES AVERAGE GENERATION COST
IN US CENTS/KWH FOR ALL GENERATION IN THE COUNTRY
2001
SARI GENERATION STUDY AVERAGE GENERATION COST IN US CENTS/KWH USING DOMESTIC FUEL PRICES FOR AUGUST 2001
Bangladesh 3.07 2.30 India 3.0 to 4.014 5.74 Sri Lanka (hydro only) 0.1 6.80 Sri Lanka (only thermal plants) 7.51 6.80
13 One plant was omitted because it is scheduled to be built in 2001 and would thus confuse the results. Commercial operations date was used for three plants because bid date was not available. 14 We found a number of different estimates of the average cost of generation in India, ranging from 3 to 4 US cents/kWh.
Advanced Engineering Associates International (AEAI) 25

SARI/Energy program South Asia Generation Pricing Study Final Report
There is no clear pattern indicating that older plants are cheaper than more recently built generation plants indicated. It is well known that older hydro plants are cheaper than new thermal plants. Our study found that new hydro plants are not necessarily cheaper than new thermal plants. A major cause for price differences between older and newer plants is that older plants are heavily depreciated and often have little or no capital costs built into the electricity price.
The table below provides additional evidence about the costs of older Indian generation plants. Most of these plants were built before 1990, and most have average generation prices lower than the IPPs in our study, with their average price of 5.74 US cents/kWh.
FY 00 paise/unit Amarkantak Korba E Korba W Satpura Birsinghpur MPEB MPSEB CSEB Farakka Kahalgaon TSTPS TTPS
Fixed Charges 46.82 45.38 33.42 29.43 108.51 48.06 54.27 37.18 88.97 109.39 133.12 65.19Variable Charges 66.71 58.72 42.71 94.98 104.68 77.77 94.89 47.75 83.59 82.34 39.61 59.95Total Cost (paise) 113.53 104.1 76.13 124.41 213.19 125.83 149.16 84.93 172.56 191.73 172.73 125.14Total Cost (US cents) 2.33 2.14 1.56 2.55 4.38 2.58 3.06 1.74 3.54 3.94 3.55 2.57
Units of Plant Were Commissioned in 1965, 1978
1966 - 68, 1981 1983-86
1967, 1980, 1983 1993, 1999
GENERATION PRICES FOR SELECTED INDIAN GENERATION PLANTS
Study Issue 8: Projects using similar technologies within countries have similar price levels We tested whether projects with similar technologies have similar prices. To do this, we looked at plants using the same fuel types within individual countries. Since prices would be examined within countries rather than across them, prices using domestic fuel prices were used. If more than one plant using the same fuel existed in a country, an average price for the plants was calculated. Using this method, we looked at plants powered by four fuel types in six countries.
As threshold of ten percent difference was set as a basis for a test of “similarity.” If only two plants existed in the scenario (as in Figure 8b and Figure 8f below), then a percentage change was examined to test if they are “similar.” If, however, more than two plants existed, the threshold was used to test individual plant prices versus an average. If no price exceeded 10 percent of the average for that fuel type, then all plants could be deemed similar. Based on this methodology, we concluded that projects with similar technologies (i.e., similar fuels) do not necessarily have similar prices.
Advanced Engineering Associates International (AEAI) 26

SARI/Energy program South Asia Generation Pricing Study Final Report
Fi gur e 8 aTa r i f f s i n Ba ngl a de sh f or Ga s- P owe r e d P l a nt s
-
0.50
1.00
1.50
2.00
2.50
3.00
BA1 BA2 BA4 BA5 BA6
Fi gur e 8 bTa r i f f s i n P a k i st a n f or Combi ne d Cy c l e P l a nt s
4.60
4.70
4.80
4.90
5.00
5.10
5.20
5.30
5.40
PA2 PA3
Fi gur e 8 cTa r i f f s i n S r i La nk a f or Li qui d Fue l - P owe r e d P l a nt s
-
1.00
2.00
3.00
4.00
5.00
6.00
7.00
8.00
9.00
SL1 SL2 SL3
Fi gur e 8 dTa r i f f s i n Ne pa l f or Hy dr o- P owe r e d P l a nt s
-
1.00
2.00
3.00
4.00
5.00
6.00
7.00
8.00
NE1 NE2 NE3 NE4 NE5 NE6
Fi gur e 8 eTa r i f f s i n I ndi a f or Ga s- P owe r e d P l a nt s
-
1.00
2.00
3.00
4.00
5.00
6.00
7.00
8.00
IN1 IN3 IN4
Fi gur e 8 fP r i c e s i n Bhut a n f or Hy dr o- P owe r e d P l a nt s
-
1.00
2.00
3.00
4.00
5.00
6.00
BH1 BH2
Except for Figure 8b, where the difference between the two plants was only 9 percent, the other five comparisons showed large differences between plants. In the case of gas-powered plants in Bangladesh (Figure 8a), a smaller barge mounted combined cycle gas plant, the most expensive plant in the group, was 40 percent more expensive than a larger combined cycle gas plant. A similar situation was found among hydro plants in Nepal (Figure 8d) where one of the early IPPs was 80 percent more expensive than a hydro plant developed by NEA. Four of the six Nepali hydro plants showed more than 10 percent deviation from the mean.
Advanced Engineering Associates International (AEAI) 27

SARI/Energy program South Asia Generation Pricing Study Final Report
Study Issue 9: Similar plants (in terms of technology and fuel in different countries) do not have similar wholesale prices. Our next test was whether similar plants in terms of technology and fuel in different countries have similar offtake prices. We grouped plants from all countries into the three most common fuel types - gas, liquid and hydro. Since plants would be compared across counties, prices based on international fuel prices were used.
Figure 9aTariffs in Gas-Powered Plants
-1.002.003.004.005.006.007.008.00
BA1 BA2 BA4 BA5 BA6 PA2 PA3 IN1 IN2 IN3
Figure 9bTariffs in Liquid Fuel-Powered Plants
-1.002.003.004.005.006.007.008.00
BA3 PA1 PA4 SL1 SL2 SL3 SL4 IN2 IN6
Advanced Engineering Associates International (AEAI) 28

SARI/Energy program South Asia Generation Pricing Study Final Report
Figure 9cTariffs in Hydro-Powered Plants
0.00
1.00
2.00
3.00
4.00
5.00
6.00
7.00
8.00
BH2 BH1 NE1 NE2 NE3 NE4 NE5 NE6
The prices of gas-powered plants ranged from 3.92 US cents/kWh to 7.52 US cents/kWh. This is a difference of over 90 percent. We consider this to be a significant different between prices.
One half of the liquid-fuel plants are more than 10 percent more expensive than the average liquid-fueled plant, and one third of the hydro plants are also more than 10 percent more expensive than the average hydro plant. In the case of liquid-fuel plants, prices range from 4.68 US cents/kWh to 7.44 US cents/kWh, a difference of 60 percent. Prices among hydro plants range from 3.64 US cents/kWh to 7.19 US cents/kWh.
Advanced Engineering Associates International (AEAI) 29

SARI/Energy program South Asia Generation Pricing Study Final Report
Study Issue 10: Do special features of projects – such as tax holidays, inclusion of transmission costs, and capital subsidies – have a significant impact on generation prices? The chart below summarizes our findings regarding the percentage increase in levelized price that results from adding “special” project features into the price model. The table indicates that capital subsidies, corporate tax and duty exemptions and transmission facilities add a significant amount to the wholesale electricity cost.
PERCENTAGE ADDED TO LEVELIZED PRICE DUE TOO “SPECIAL” PROJECT FEATURES
EXAMINED IN GENERATING PLANTS IN THE SARI/E STUDY Reduce the 60% capital grant to no capital grant 51.56% Add Increase/Decrease in Financing Cost with 72/25 Debt to Equity Ratio 34.83% Add - Corporate taxes and custom duties and GST on plant, equipment and spare parts 16.11% Add corporate tax, customs duty on spares and equipment 20.00% Add transmission related capital components 17.33% Add major applicable taxes for which holidays have been granted in PPA or legislation 13.27% Add Transmission Line 14.40% Add - Corporate taxes and custom duties and VAT on plant, equipment and spare parts 6.29% Add major applicable taxes for which holidays have been granted in PPA or legislation 11.05% Effect of raising interest rate from 8% to 10.8% 11.70% Add transmission related capital components 11.70% Add – Cost of transmission facilities 7.95% Add corporate tax, customs duty on spares and equipment 10.53% Add major applicable taxes for which holidays have been granted in PPA or legislation 7.74% Add Corporate Taxes 9.17% Add Corporate Taxes 8.74% Add Corporate Taxes 8.70% Add Corporate Taxes 8.63% Add major applicable taxes for which holidays have been granted in PPA or legislation 6.54% Effect of raising ROE to 16% 8.19% Add NEA Equity Contribution for Cost Overun 8.03% Add Corporate Taxes 6.67% Add Transmission Line 6.29% Add Royalty Payment to Government 3.40% Add – Cost of land development 1.51% Add – Cost of purchasing land 0.68% Add - Opportunity cost of providing letter of credit 0.41% Add Cost of Providing Letter of Credit 0.65% Add – Purchase of land 0.37% Add Cost of Providing Letter of Credit 0.43% Add Cost of Providing Letter of Credit 0.08%
We find that a correct economic comparisons of wholesale prices should either include the “special” project features of all projects, or it should exclude all these special project features. A significant portion of the price variation between projects is due to the treatment of “special” project features.
Advanced Engineering Associates International (AEAI) 30
SARI/Energy program South Asia Generation Pricing Study Final Report
The special project features that have the largest impact are (1) loan and equity subsidies; (2) corporate tax and duty exemptions; (3) the addition of the costs of transmission facilities. During out study, we noted the following concerning the differences in these special factors across countries:
Compared to other countries in the region, India appears to offer relatively few subsidies to IPPs in the form of lower cost credit, tax or duty exemptions. This causes Indian IPPs to appear to be relatively expensive. This factor should be considered particularly when comparing public and private sector generation in India.
Sometimes governments in the region allow public sector projects to be developed on a stand alone basis in a manner similar to IPPs. Most of these “public sector IPPs”15 have significant financing subsidies from government lending institutions. Therefore, comparing the prices of these public plants with private IPPs is not a completely accurate reflection of the underlying costs.
Study Issue 11: Are South Asian Generation Prices Expensive by World Standards? It is worthwhile asking whether South Asian generation prices are expensive compared to world standards. Of course, there is no single “world standard price” for electricity. However, we were able to find useful benchmarks against which to assess the prices obtained in our study. We acknowledge that these prices may not be directly comparable because of a number of factors. However, we believe that some interesting comparisons can be made. As stated in Study Issue 1, the average prices for individual countries were the following:
Figure 1aAverage Tariffs in South Asia (International Prices)
0.001.002.003.004.005.006.007.00
Bhutan Bangladesh India Nepal Pakistan Sri Lanka
15 We use this term to refer to a public sector generating plant that is set up as a stand-alone corporation using project finance approaches to its capitalization and pricing its output in a manner that is similar to an IPP.
Advanced Engineering Associates International (AEAI) 31
SARI/Energy program South Asia Generation Pricing Study Final Report
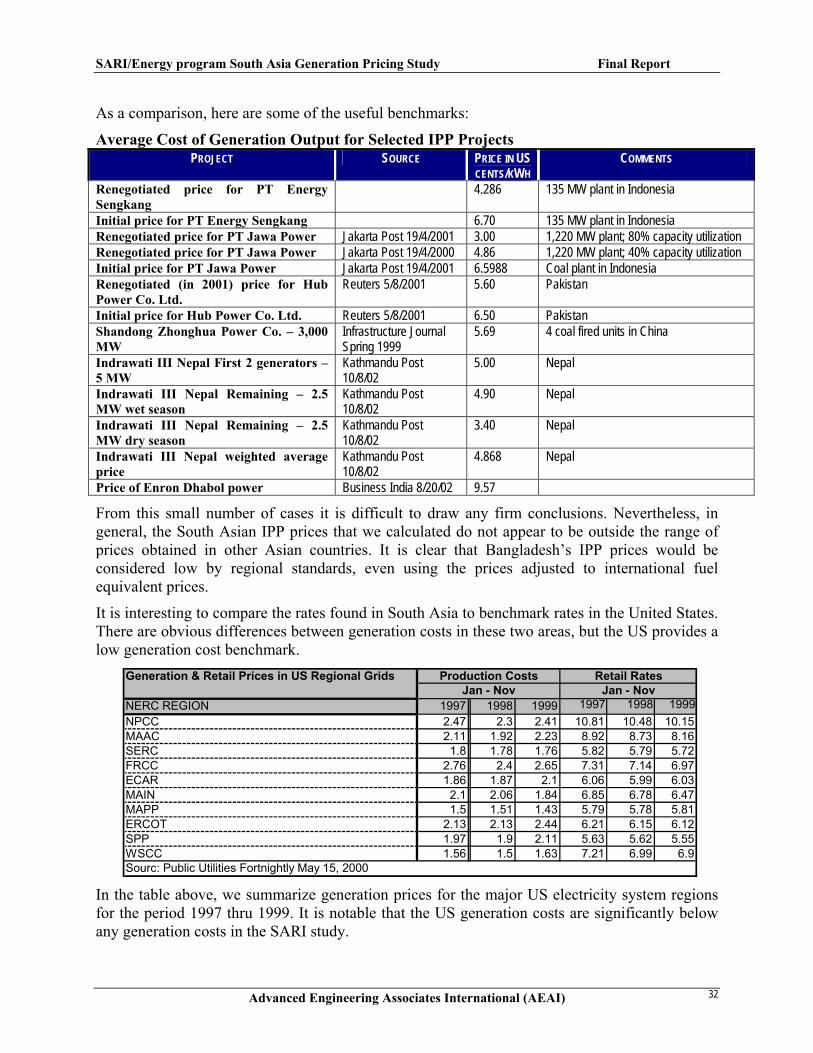
As a comparison, here are some of the useful benchmarks:
Average Cost of Generation Output for Selected IPP Projects PROJECT SOURCE PRICE IN US
CENTS/KWH COMMENTS
Renegotiated price for PT Energy Sengkang
4.286 135 MW plant in Indonesia
Initial price for PT Energy Sengkang 6.70 135 MW plant in Indonesia Renegotiated price for PT Jawa Power Jakarta Post 19/4/2001 3.00 1,220 MW plant; 80% capacity utilization Renegotiated price for PT Jawa Power Jakarta Post 19/4/2000 4.86 1,220 MW plant; 40% capacity utilization Initial price for PT Jawa Power Jakarta Post 19/4/2001 6.5988 Coal plant in Indonesia Renegotiated (in 2001) price for Hub Power Co. Ltd.
Reuters 5/8/2001 5.60 Pakistan
Initial price for Hub Power Co. Ltd. Reuters 5/8/2001 6.50 Pakistan Shandong Zhonghua Power Co. – 3,000 MW
Infrastructure Journal Spring 1999
5.69 4 coal fired units in China
Indrawati III Nepal First 2 generators – 5 MW
Kathmandu Post 10/8/02
5.00 Nepal
Indrawati III Nepal Remaining – 2.5 MW wet season
Kathmandu Post 10/8/02
4.90 Nepal
Indrawati III Nepal Remaining – 2.5 MW dry season
Kathmandu Post 10/8/02
3.40 Nepal
Indrawati III Nepal weighted average price
Kathmandu Post 10/8/02
4.868 Nepal
Price of Enron Dhabol power Business India 8/20/02 9.57
From this small number of cases it is difficult to draw any firm conclusions. Nevertheless, in general, the South Asian IPP prices that we calculated do not appear to be outside the range of prices obtained in other Asian countries. It is clear that Bangladesh’s IPP prices would be considered low by regional standards, even using the prices adjusted to international fuel equivalent prices.
It is interesting to compare the rates found in South Asia to benchmark rates in the United States. There are obvious differences between generation costs in these two areas, but the US provides a low generation cost benchmark.
Generation & Retail Prices in US Regional Grids
NERC REGION 1997 1998 1999 1997 1998 1999NPCC 2.47 2.3 2.41 10.81 10.48 10.15MAAC 2.11 1.92 2.23 8.92 8.73 8.16SERC 1.8 1.78 1.76 5.82 5.79 5.72FRCC 2.76 2.4 2.65 7.31 7.14 6.97ECAR 1.86 1.87 2.1 6.06 5.99 6.03MAIN 2.1 2.06 1.84 6.85 6.78 6.47MAPP 1.5 1.51 1.43 5.79 5.78 5.81ERCOT 2.13 2.13 2.44 6.21 6.15 6.12SPP 1.97 1.9 2.11 5.63 5.62 5.55WSCC 1.56 1.5 1.63 7.21 6.99 6.9Sourc: Public Utilities Fortnightly May 15, 2000
Production Costs Retail RatesJan - Nov Jan - Nov
In the table above, we summarize generation prices for the major US electricity system regions for the period 1997 thru 1999. It is notable that the US generation costs are significantly below any generation costs in the SARI study.
Advanced Engineering Associates International (AEAI) 32

SARI/Energy program South Asia Generation Pricing Study Final Report
SECTION 8: BROADER IMPLICATIONS OF THE SARI/E GENERATION STUDY FINDINGS
The World Bank’s paper titled “The Impact of IPPs in Developing Countries” published in December 1998 was one of the first comprehensive examinations of the impact of IPPs in emerging markets. This section summarizes the conclusions of the World Bank study, and reviews our study findings against each major conclusion.
1. Has risk been transferred to the private sector? It is well established that the majority of government-financed generation projects have significant cost and time overruns.16 For many government-financed projects, these costs are not included in the offtake price. Therefore, public sector generation prices include costs that are ultimately borne by taxpayers, but are not reflected in the offtake price. In the case of private IPPs, the cost of time and cost overruns is absorbed by the developer, and is not priced into the wholesale electricity. These cost overruns are not passed to taxpayers in the case of private IPPs. The result of this risk transfer is that IPPs provide strong incentives to private developers to manage construction and financing risks associated with generation.
According to the World Bank Paper, IPPs have accepted construction and operating risks, and they share fuel availability risks for 52% of the IPP market. Most IPPs are compensated for fuel price variations. Their recovery of fixed costs is protected against market risks by take or pay contracts or capacity charges. Except in Malaysia, currency risks are covered by stating prices in local currencies and indexing prices to foreign currencies. IPPs are also protected against political and regulatory risks in many cases by government guarantees.
We found that the South Asian IPPs accepted construction and operating risks, and they share fuel availability risks in almost all cases in the study. All IPPs are compensated for fuel price variations. Their recovery of fixed costs is protected against market risks by capacity charges. Except in India, currency risks are covered by indexing prices to foreign currencies. IPPs are also protected against political and regulatory risks in Bangladesh and Pakistan by government guarantees. India and Nepal did not have government guarantees. Bhutan’s projects are effectively government projects.
Given the large construction cost and time overruns that are common in emerging markets projects, and the relatively low operating efficiency that is common for government-owned plants in South Asia, the transfer of these two risks – construction and operating – represents a large risk transfer.
It appears that given the fact that all countries in the study have a generation supply deficit; the risk associated with the offtaker not needing the capacity but having to pay the capacity charge is currently rather small.
16 Robert W. Bacon, John Besant-Jones and Jamshid Heidarian. Estimating Construction Costs and Schedules: Experience with Power Generation Projects in Developing Countries, World Bank Technical Paper No. 325.
Advanced Engineering Associates International (AEAI) 33

SARI/Energy program South Asia Generation Pricing Study Final Report
2. Have IPPs increased sector exposure to foreign exchange risk? The World Bank Paper found that IPP projects are moderately highly leveraged, with an average debt/equity ratio of 76 to 24. For many state-owned utilities, internally generated cash accounted for 25 to 40 percent of the investment funding. For the IPPs, most debt is in foreign currency, with 80% on the average being in foreign currency. Local capital markets provided sizable debt finance only in China, Malaysia and Thailand. Equity is held mostly by a few global developers (30 percent), engineering, procurement and construction contractors (22 percent) and local industry (20 percent). IPPs rely overwhelmingly on fossil fuel, which usually accounts for 50 to 70 percent of total operating costs. Imported petroleum-based fuels account for 11 percent of IPP capacity. For Pakistan, which has indigenous gas and hydro resources, this share is 74 percent, a serious departure from least-cost plant mix even at favorable exchange rates.
The World Bank study concluded that sector exposure to foreign exchange risk has increased or stayed the same as a result of IPPs. In a few countries, the sector’s foreign exposure is likely to be higher with IPPs than under expansion plans carried out by state-owned utilities. This exposure can be risky if the IPP program is large, as is the case in Pakistan and Indonesia.
The South Asia study found that foreign exchange exposure of the sector appears to have increased in all countries except India. In Sri Lanka, Bangladesh, Pakistan and Nepal, most debt and equity was raised from foreign sources in foreign currencies. In all cases, indexing provisions pass foreign exchange risk to the offtaker. In India, the proportion of foreign debt is very small. Foreign exchange risk is in most cases passed to the offtaker.
3. Have IPPs relieved capacity shortages? Reviewing 52 projects in ten countries, for a total capacity of 24GW, the World Bank note concluded that most of these reduced or eliminated shortages. Without the IPPs, state-owned utilities would have been able to finance and build less capacity. In three countries, too much capacity was signed to quickly, with the result that the IPP capacity was surplus. In Indonesia and Malaysia IPPs displaced expensive generation and brought fuel savings (US $10 to $20 per MWh), which the authors concluded was too small to justify the investment. They also concluded that in many countries, the new capacity meets wasteful demand induced by poor cost recovery, mostly in agriculture. Without IPPs, most of the overcapacity would not exist.
The SARI study did not look specifically at the utilitization of the IPPs or at the addition to capacity that they represent. Clearly, the projects included in the SARI study have added capacity to the system and in most cases, this capacity is being used to generate electricity for which there is demand in the system. We note the following:
In Bangladesh, India, and Sri Lanka, there were reports by IPP plant managers and lending institutions that although specific IPP plants lower in marginal cost than government-owned plants, government-owned plants were being dispatched before the concerned IPPs. There were reports of IPPs not being dispatched even though they were higher in the merit order than plants that were being dispatched.
There are important questions about the concept of “capacity shortage” in electricity systems that charge retail prices substantially below average cost or marginal cost to supply. In Pakistan, India, Sri Lanka, Nepal and Bangladesh, the average system cost per unit supplied is higher than the average system realization. We believe that if the system were to implement a cost-based pricing policy that effectively charged full cost to serve, a significant reduction in demand would
Advanced Engineering Associates International (AEAI) 34

SARI/Energy program South Asia Generation Pricing Study Final Report
occur. If some form of time of day pricing were used, the need for capacity would probably drop significantly in many countries.
3. Have IPPs Increased the Price of Electricity? The World Bank note concluded that the true picture is not clear because the opening of the market to IPPs has reduced capital cost subsidies in the sector. IPPs generally use more expensive private sector financing. In this sense, their output price is not fully comparable to public sector generation plants. In addition, the study notes that the state-owned utilities cost that is reflected in prices is often only a fraction of what a regulator would allow in a market-friendly environment, and it is unclear whether development costs are accounted for and internalized in capital costs.
The World Bank concludes that it appears that IPPs have often inflated supply prices for utilities. In the Philippines, the average generating cost for IPPs in 1996 was US $ 76 per MWh, compared with US $ 57 for the state-owned utility.
The SARI study indicates the following:
1.
2.
3.
4.
New generating plants are more expensive than old ones because of the effect of depreciation on capital costs.
State-owned plants in our study had access to concessional capital, as did the government-owned generating plants that were set up by the integrated state-owned utilities. We noted several cases where lower prices charged by government-owned plants were principally a result of the capital subsidies available to the government-owned generators.
We found evidence that state-owned plants do not incorporate the cost of their cost and time overruns in their generation price. In the case of private IPPs, these costs associated with cost and time overruns are passed back to shareholders. In the public sector, they are passed either to the government-owned utility, to government, or to consumers.
Our study provided evidence that over the long term, the IPPs will be more effective in controlling cost increases than the government generating plants. This is due to the nature of the PPA terms regarding operating efficiency.
Our conclusion is that IPPs have not “hiked” the price of electricity. We conclude that electricity is often more expensive in economic terms than the prices charged by government generators, and that these real economic prices are not being charged by the government generators. Therefore, the comparison with IPPs that concludes that IPPs are more expensive is not correct.
One area of cost that is very difficult to assess is the additional cost associated with the take-or-pay provisions of the IPP charges. These provisions may increase the cost of electricity because they reduce the financial benefits to the offtaker when they idle the plant when power is not needed. In addition, they make it expensive to transition the system to a competitive market. We believe that the long-term take-or-pay conditions of the IPP contracts do have an economic cost to the system, but they are not priced in to the wholesale charge. In addition, there is no commonly accepted methodology for pricing this “inflexibility.”17
17 During the study, we considered the possibility of estimating the value of the loss of flexibility due to the take or pay provisions of long-term PPAs. It appears that some application of an option valuation method would be useful.
Advanced Engineering Associates International (AEAI) 35

SARI/Energy program South Asia Generation Pricing Study Final Report
4. Have IPPs Improved Sector Institutions? In the World Bank’s study, IPPs accounted for between 5 and 60 percent of the host grids’ peak demand. In these cases, they have broken the monopoly – and in Malaysia, Pakistan and the Philippines – the dominance of state-owned utilities in the generation market. IPPs have led governments to become more familiar with private sector approaches to development and operation of generating plants. Legal frameworks, insurance systems, and accounting rules have been modernized. An additional benefit is that the risks and costs of IPP investment have been more realistically assessed, more efficiently allocated by government agencies.
Projects have also introduced new technologies for plant regulation and environmental management, for improving efficiency and for using low-quality fuels. In many cases efficiency and transparency have been wanting in project development. The development of the IPP market has been accompanied by allegations of corruption and price padding. Rules for solicitation, award and close of contracts have been unclear and onerous, have allowed opportunities for graft and have been perceived as unfair by sponsors losing out to competitors.
The study also concluded that PPAs could hamper efficiency in system operation and sector liberalization. In the long run PPA prices and contractual rigidities may prove costly whenever IPPs lose competitiveness following technical progress and access to new fuels.
The SARI study found that IPP transaction structures had been copied for selected new government-owned generating projects in Bangladesh, Nepal and Sri Lanka. In fact, in these countries, government projects had been implemented using similar contractual terms as under the private projects. 18
There is clear evidence of competition between government-owned plants and private IPPs on factors such as plant operating efficiency and wholesale price. There were also useful “benchmarks” established for environmental management and plant maintenance.
The World Bank’s conclusion that in the long run contractual rigidities may prove costly was supported in our study. It is clear that many of the South Asian countries are going to have difficulty establishing competitive generation markets if they continue to expand their generation capacity using 20 to 30 year PPAs with fixed capacity charges and high costs to terminate the contracts. This will be an issue as countries decide to introduce generation competition, as current technologies become superseded by better technologies, and as relative fuel prices change.
5. Did Bidding Reduce PPA Prices? The World Bank review concluded that bidding seems to have reduced PPA prices by 25 percent on the average, but the exceptions are numerous and important. Capacity costs are lower in China without bidding than they were in the other ten countries, even for imported technologies. Bidding tended to be neutral on lead times and to reduce corruption allegations.
However, we did not pursue this estimation due to the time required to develop and apply this type of valuation approach. 18 These four projects are the ones that we used to make direct comparison of public projects modeled as IPPs and private IPPs.
Advanced Engineering Associates International (AEAI) 36

SARI/Energy program South Asia Generation Pricing Study Final Report
The SARI study did not find conclusive evidence that bidding reduced IPP prices. The Bangladesh case provides powerful evidence that effectively designed procurements achieve low prices.
In addition to the World Bank study cited above, there is frequent discussion of other pros and cons associated with IPPs. In this final section, we review a number of commonly suggested issues related to IPPs, and ask whether our study provides any evidence related to the issues.
6. IPPs “lock in” a specific high level of operational efficiency for a long period of time. It is commonly observed that government plants are not maintained at peak efficiency. In numerous cases, government plants operate well below their rated efficiency, and in some cases, government plants are inoperational due to poor maintenance.
For private IPPs, the PPA specifies the minimum efficiency at which the plant must operate. If the plant falls below this level, the private operator bears the additional cost. The result is that operating risk is transferred under PPAs from the government offtaker to developers.19
7. IPPs transfer financing risk to the private sector. The capacity charge for an IPP is generally fixed for the life of the contract. There may be adjustment clauses for interest rates and foreign exchange. However, it is also common for private developers to bear all of the interest rate risk. In addition, since the Asian financial crisis of 1997-8, governments have required that developers bear a significant share of foreign exchange risk. This is not the case in government owned and financed plants. Under these conditions, government bears the financing risk.
8. IPPs allow access to capital to build new plants when the government does not have capital funds. Governments and government-owned utilities have limited capital available for investment in new generation facilities. In some cases, where the government-owned utility has operating losses, there is very little, if any, capital available in the utility to pay for new generating plants. In these cases, the utility often relies on the central government to raise funds through taxes and multilateral loans. It is common that the funds available from these sources are not sufficient to pay for necessary generation capacity. This is effectively a “rationing” situation, where there is simply not enough capital available in the public sector to pay for all the new facilities needed. When the limits of public sector capital are reached, it is necessary to raise capital through the private sector. IPPs are a means of raising private capital.20
There are also a number of arguments against using IPPs. A brief discussion of these follows.
9. Limited incentives for sustained efficiency gains. IPPs may be operated more efficiently than government-owned generation plants due to the fixed efficiency standards in PPAs. However, compared to a situation where true generation competition exists, the incentives for continuous improvements in efficiency are relatively weak. Competition for the market clearly does not offer the strength of incentive that is available through full scale generation
19 The costs associated with declines in operational efficiency during life of plant are, of course, not generally reflected in the offtake prices. Hence, this difference between public and private plants would not be identifiable in our study. 20 Although this argument is correct in the sense that public sector access to capital is limited, it may actually be more efficient for the public sector electricity utility to rationalize prices and commercial policies than to build more generating capacity. Demand for electricity from public sector-owned utilities is often high in part because
Advanced Engineering Associates International (AEAI) 37
SARI/Energy program South Asia Generation Pricing Study Final Report
competition. It is worth noting that IPPs with fixed long-term offtake obligations are used both when generation competition exists and in situations where there is no competition.
10. The contract terms of PPAs and the associated finance and security packages are in some cases expensive. IPPs lock the offtaker into a financing and security package for long durations even when capital market and risk conditions may result in possibilities for declining financing charges. There are two alternatives to this condition. One is to require periodic review of the capacity charges associated with an IPP. The second is to use a competitive generation market to incentivise operators to continuously seek to minimize the cost of financing.
11. Cheaper power on more flexible terms may become available through the market at a later date. In other words, the availability of cheaper power may create stranded costs reflecting their above-market pricing. IPPs “lock” the offtaker into a specific technology and scale regardless of technological progress and obsolescence. For example, if an offtaker enters into a PPA with a relatively low efficiency coal combustion plant, he would be locked into the contract and would not be able to benefit from a new technology such as supercritical combustion, if it were to become technically and financially feasible.
12. PPAs can make it difficult to introduce generation competition. This would appear to be one of the most serious problems associated with IPPs in emerging markets. Many countries have decided to introduce generation competition following the unbundling of the public sector integrated electricity utility. Generation competition requires multiple independent generators that compete against one another to sell into a competitive electricity market. IPPs generally have contracts that include take or pay provisions. The costs associated with terminating an IPP can be prohibitively high. This may impede the introduction of generation markets, which would otherwise dramatically improve the efficiency of the generation sector.
Because the IPPs are protected from market risk by their long-term PPAs they have little incentive to participate in a market. In some countries, their lack of participation would seriously affect competitive pressures in the market, particularly where the size of the IPP plant is a significant share of total capacity of the system.
13. Renegotiation is both difficult and costly. IPP contracts usually have binding terms related to damages and arbitration. If the government or government-owned single buyer decides to unilaterally break a contract, it is likely that damages will ordered by the concerned court or arbitration panel. In addition, if the local courts are perceived to treat private investors in a manner that is both unfair and inconsistent with contract obligations, there will be a future cost to the country in the form of higher risk premiums imposed for both domestic and international borrowings. The same is true of a non-observance or breach of the IPP contracts by the power purchaser (whether actual or threatened) designed to result in renegotiation.
Their relatively long duration; •
•
•
•
The fixed prices which are designed to create a stable and certain revenue stream for the IPP;
Lack of requirement for the IPP to assume any market risk;
Contract provisions that are less demanding than the much more detailed approach of market rules which are designed to promote increased efficiency and competition;
Advanced Engineering Associates International (AEAI) 38

SARI/Energy program South Asia Generation Pricing Study Final Report
ANNEX 1: RESULTS
STANDARDIZED LEVELIZED PRICE
PLANT TYPE OF PLANT FUEL
INSTALLED CAPACITY
ASSUMED DISPATCH TYPE OF AWARD PRICE
LOCAL CURRENCY /
KWH US CENTS /
KWH Domestic Fuel Price at August 2001 1.07 1.88 Domestic Fuel Price at Bidding Date 0.82 1.94
BA1 Combined Cycle
Gas Medium 85% Competitive
International Fuel Price at August 2001 2.55 4.47 Domestic Fuel Price at August 2001 1.46 2.57 Domestic Fuel Price at Bidding Date 1.09 2.60
BA2 Combined Cycle
Gas High 85% Competitive
International Fuel Price at August 2001 3.44 6.03 Domestic Fuel Price at August 2001 1.47 2.58 Domestic Fuel Price at Bidding Date 1.34 2.56
BA3 Steam Turbine
Liquid Medium 85% Developed by PDB
International Fuel Price at August 2001 2.83 4.97 Domestic Fuel Price at August 2001 1.24 2.18 Domestic Fuel Price at Bidding Date 1.14 2.11
BA4 Gas Turbine
Gas Medium 85% Developed by PDB
International Fuel Price at August 2001 4.04 7.09 Domestic Fuel Price at August 2001 1.14 2.01 Domestic Fuel Price at Bidding Date 1.05 2.23
BA5 Gas Fired Engine
Gas Low 85% Competitive
International Fuel Price at August 2001 2.50 4.39 Domestic Fuel Price at August 2001 1.47 2.59 Domestic Fuel Price at Bidding Date 1.34 3.15
BA6 Barge Mounted Combined Cycle
Gas Medium 85% Competitive
International Fuel Price at August 2001 2.75 4.82 Domestic Fuel Price at August 2001 3.56 5.65 Domestic Fuel Price at Bidding Date 3.16 5.01
PA1 Steam Turbine
Liquid Medium 85% Negotiated
International Fuel Price at August 2001 3.16 5.01 Domestic Fuel Price at August 2001 3.35 5.32 Domestic Fuel Price at Bidding Date 1.36 4.48
PA2 Combined Cycle
Gas High 85% Negotiated
International Fuel Price at August 2001 4.26 6.76 Domestic Fuel Price at August 2001 3.07 4.88 Domestic Fuel Price at Bidding Date 1.31 4.37
PA3 Combined Cycle / Steam Turbines
Gas Medium 85% Negotiated
International Fuel Price at August 2001 4.74 7.52 Domestic Fuel Price at August 2001 3.31 5.25 Domestic Fuel Price at Bidding Date 1.43 4.75
PA4 Diesel Engines
Liquid Medium 85% Negotiated
International Fuel Price at August 2001 2.95 4.68 Domestic Fuel Price at August 2001 7.34 8.15 Domestic Fuel Price at Bidding Date 3.79 6.42
SL1 Diesel Fired Engine
Liquid Low 85% Competitive
International Fuel Price at August 2001 6.55 7.28 Domestic Fuel Price at August 2001 6.06 6.73 Domestic Fuel Price at Bidding Date 4.18 8.04
SL2 Diesel Fired Engine
Liquid Low 85% Negotiated
International Fuel Price at August 2001 5.70 6.34 Domestic Fuel Price at August 2001 5.41 6.02 Domestic Fuel Price at Bidding Date 3.62 7.38
SL3 Diesel Fired Engine
Liquid Low 85% Developed by CEB
International Fuel Price at August 2001 5.09 5.65 Domestic Fuel Price at August 2001 5.68 6.31 Domestic Fuel Price at Bidding Date 4.71 6.64
SL4 Naphtha/ Combined Cycle
Liquid Medium 85% Developed by CEB
International Fuel Price at August 2001 5.68 6.31
Advanced Engineering Associates International (AEAI) 39

SARI/Energy program South Asia Generation Pricing Study Final Report
STANDARDIZED LEVELIZED PRICE
PLANT TYPE OF PLANT FUEL INSTALLED CAPACITY
ASSUMED DISPATCH
TYPE OF AWARD PRICE
LOCAL CURRENCY /
KWH
US CENTS /
KWH NE1 Hydro / Pondage for
four hours - Run-of-river (PROR)
Hydro Low 100% Negotiated Domestic Fuel Price at August 2001 3.00 4.01
NE2 Hydro / Run-of-River Hydro Low 100% Negotiated Domestic Fuel Price at August 2001 5.37 7.19 NE3 Hydro / Run-of-River Hydro Low Developed
by NEA Domestic Fuel Price at August 2001 4.78 6.39
NE4 Hydro / Run-of-River Hydro Low 100% Negotiated Domestic Fuel Price at August 2001 4.46 5.96 NE5 Hydro / Run-of-River Hydro Low 100% Negotiated Domestic Fuel Price at August 2001 3.91 5.23 NE6 Hydro / Run-of-River Hydro Low 100% Negotiated Domestic Fuel Price at August 2001 5.06 6.77 BH1 Hydro; developed
under MoU between GoI and GoB
Hydro Low Negotiated Domestic Fuel Price at August 2001 2.25 4.80
BH2 Hydro; developed under MoU between GoI and GoB
Hydro Medium Negotiated Domestic Fuel Price at August 2001 1.71 3.64
Domestic Fuel Price at August 2001 2.46 5.21 Domestic Fuel Price at Bidding Date 2.20 5.47
IN1 Combined Cycle Gas Medium Competitive - 2 yr negotiation International Fuel Price at August 2001 1.85 3.92
Domestic Fuel Price at August 2001 3.79 8.03 Domestic Fuel Price at Bidding Date 2.99 7.43
IN2 DG Set (Low Sulphur Heavy Set)
Liquid Low 75% Competitive - 2 yr negotiation International Fuel Price at August 2001 2.79 5.91
Domestic Fuel Price at August 2001 3.28 6.95 Domestic Fuel Price at Bidding Date 2.97 7.38
IN3 Naphtha/Natural Gas Gas Medium 72% Negotiated with MoU
International Fuel Price at August 2001 3.13 6.63 Domestic Fuel Price at August 2001 2.37 5.02 Domestic Fuel Price at Bidding Date 1.98 4.92
IN4 Combined Cycle Gas Medium 87% Negotiated with MoU
International Fuel Price at August 2001 1.87 3.96 Domestic Fuel Price at August 2001 2.31 4.90 Domestic Fuel Price at Bidding Date 2.31 5.74
IN5 Coal Coal Very High 79% Mixed - 123 GoK; 567 IPP negotiated International Fuel Price at August 2001
2.17 4.60
Domestic Fuel Price at August 2001 4.61 9.77 Domestic Fuel Price at Bidding Date 3.82 9.49
IN6 DG Set (Low Sulphur Heavy Set)
Liquid Medium 72% Negotiated with MoU
International Fuel Price at August 2001 3.51 7.44 IN7 Hydro Hydro Low Negotiated Domestic Fuel Price at August 2001 2.45 5.19
COUNTRY/PLANT KEY
BA Bangladesh PA Pakistan SL Sri Lanka NE Nepal BH Bhutan IN India
INSTALLED CAPACITY KEY
Low < 100 MW Medium 101 MW – 400 MW High 401 MW – 700 MW Very High > 700 MW
Advanced Engineering Associates International (AEAI) 40