Chapter 13 Comparing Two Populations: Independent Samples.
47
Chapter 13 Comparing Two Populations: Independent Samples
-
Upload
alyssa-prophet -
Category
Documents
-
view
221 -
download
1
Transcript of Chapter 13 Comparing Two Populations: Independent Samples.

Chapter 13
Comparing Two Populations: Independent Samples
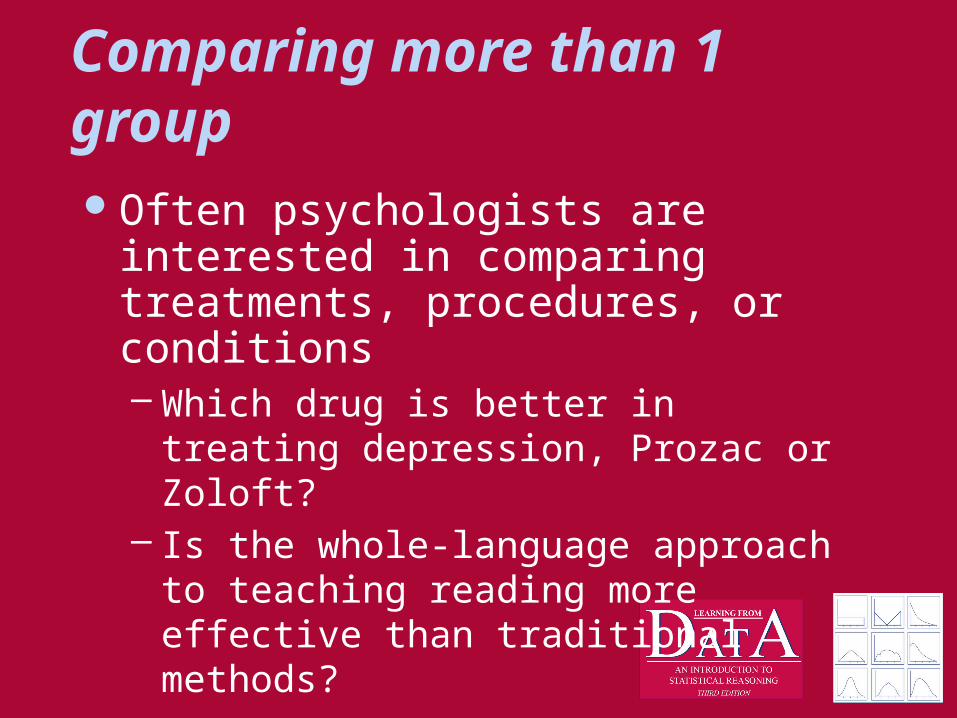
Comparing more than 1 groupOften psychologists are interested in
comparing treatments, procedures, or conditions– Which drug is better in treating
depression, Prozac or Zoloft?– Is the whole-language approach to
teaching reading more effective than traditional methods?
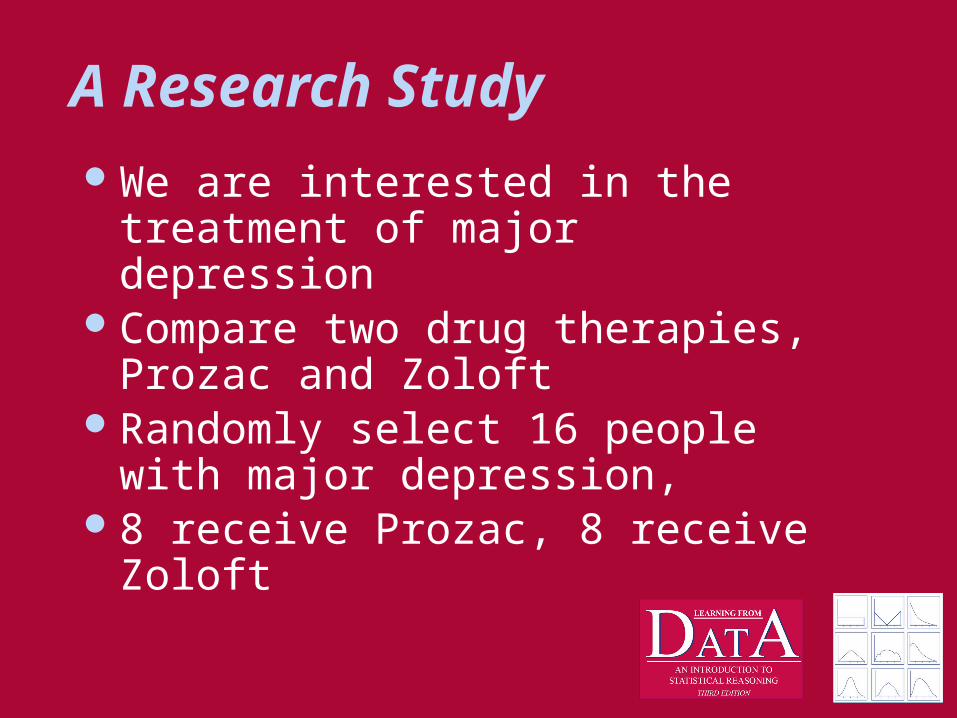
A Research StudyWe are interested in the treatment of
major depressionCompare two drug therapies, Prozac
and ZoloftRandomly select 16 people with major
depression, 8 receive Prozac, 8 receive Zoloft

Measuring DepressionBeck Depression Inventory (BDI)
developed by Aaron Beck and his colleagues
An “inventory” is a series of questions that are answered by the patient and the patient’s doctor
Each answer contributes to an overall score
That score is a “measure” of depression
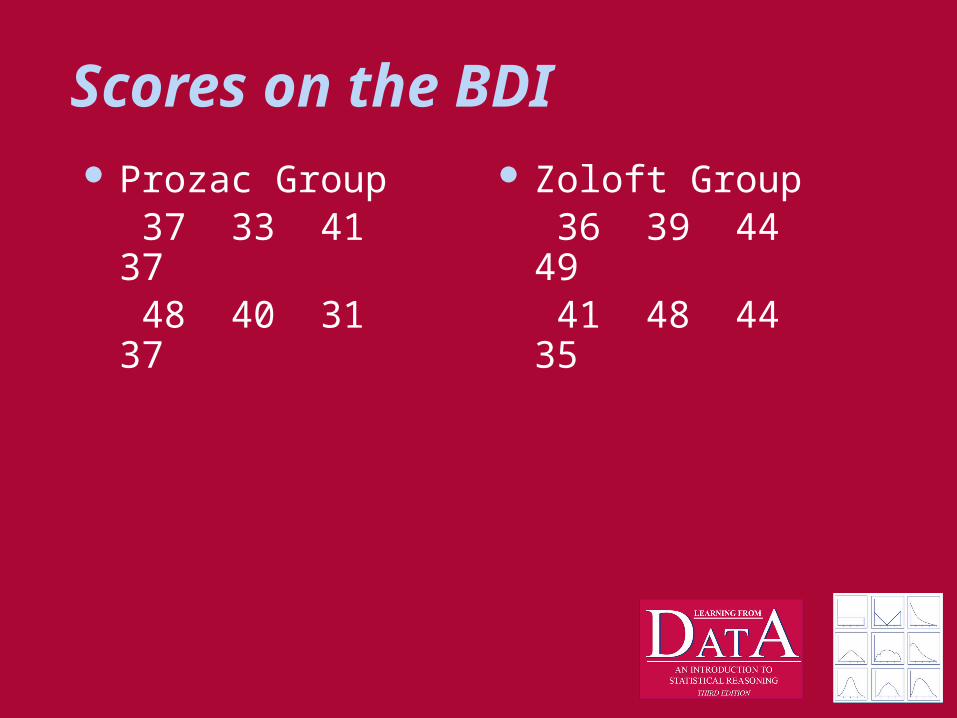
Scores on the BDI Prozac Group
37 33 41 37 48 40 31 37
Zoloft Group 36 39 44 49
41 48 44 35
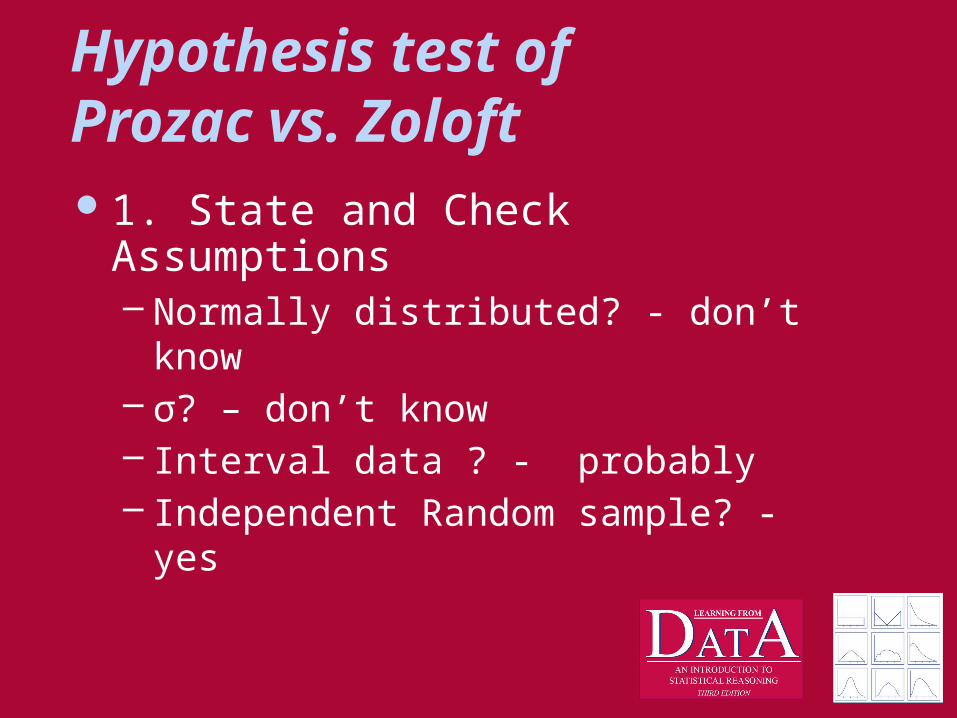
Hypothesis test of Prozac vs. Zoloft1. State and Check Assumptions
– Normally distributed? - don’t know– σ? – don’t know– Interval data ? - probably – Independent Random sample? - yes
Hypothesis test of Prozac vs. Zoloft
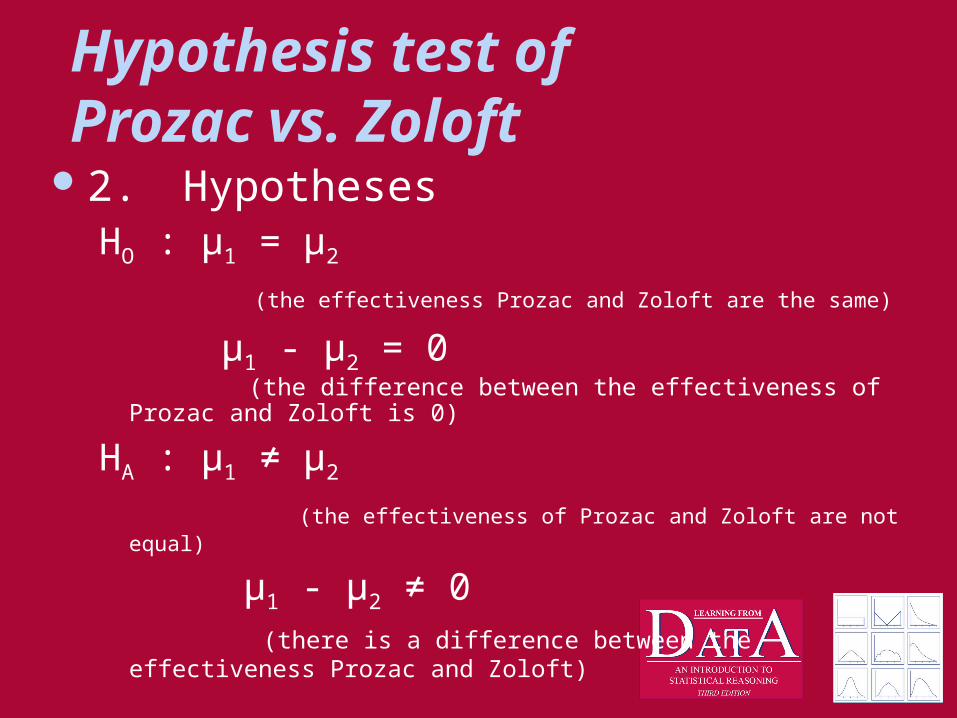
2. HypothesesHO : μ1 = μ2
(the effectiveness Prozac and Zoloft are the same)
μ1 - μ2 = 0 (the difference between the effectiveness of Prozac and
Zoloft is 0)
HA : μ1 ≠ μ2
(the effectiveness of Prozac and Zoloft are not equal)
μ1 - μ2 ≠ 0 (there is a difference between the effectiveness Prozac and Zoloft)

Hypothesis test of Prozac vs. Zoloft
3. Choose test statistic– parameter of interest - μ– 2 groups
independent samples
– Not sure about Normal Distribution– Don’t know Population Standard
Deviation
Hmm…
What do we know about μ1 – μ2?What do we know about M1 – M2 ?
Since we don’t know μ1 or μ2, we’ll concentrate on M1 – M2

Sampling Distribution The sampling distribution of M1 – M2 would
help us predict values from random samples Three facts:
– 1. The mean of the M1 – M2 sampling distribution is equal to the mean of the sampling distribution of μ1 – μ2
– 2. When the 2 populations have the same variance, then the standard deviation of the sampling distribution is
– 3. CLT
1 2
2
1 2
1 1M M n n
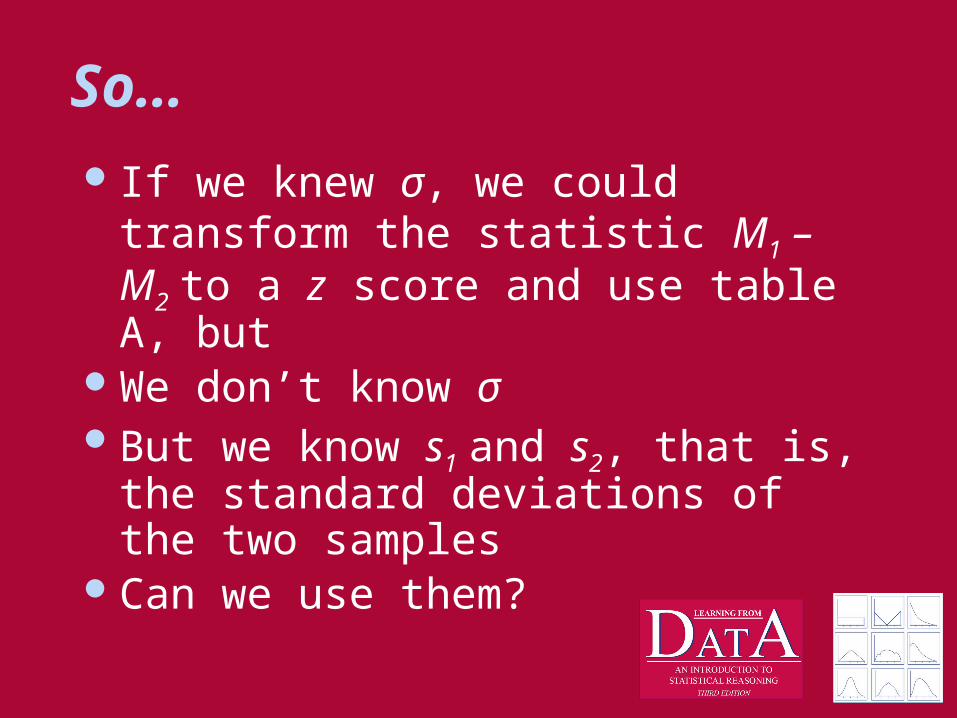
So… If we knew σ, we could transform the
statistic M1 – M2 to a z score and use table A, but
We don’t know σBut we know s1 and s2, that is, the
standard deviations of the two samplesCan we use them?

NONot with a z,But we can use a t distribution
That is to say: the differences in sample means, divided by the estimated SEM, is distributed as a t

t-test for 2 independent samples
1 2
1 2
-
-
M M
M Mt
s
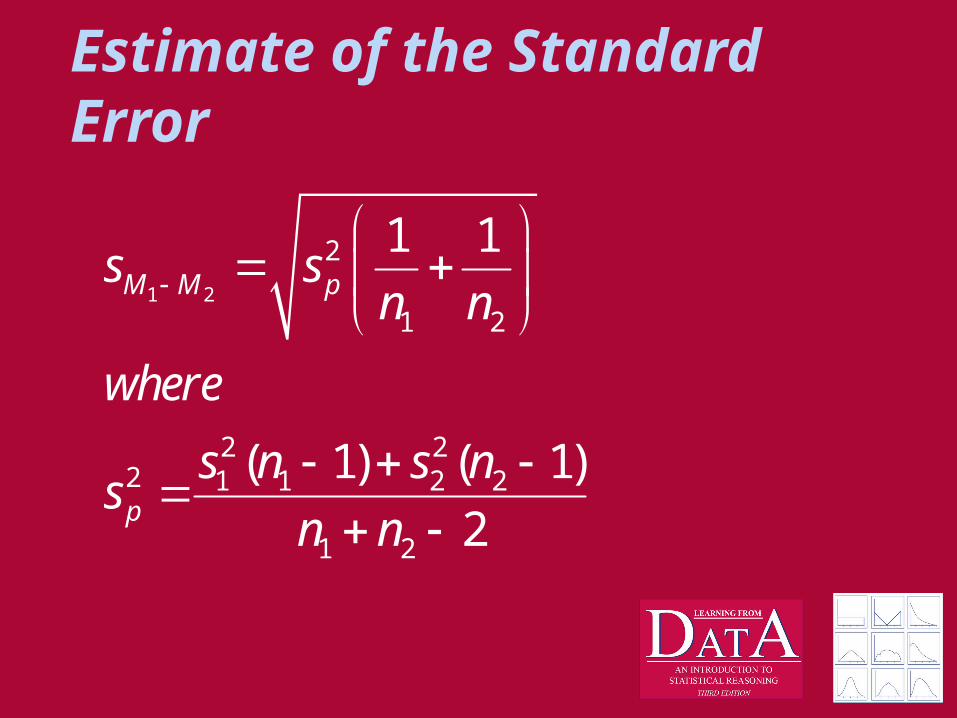
Estimate of the Standard Error
1 2
2
1 2
2 22 1 1 2 2
1 2
1 1
( 1) ( 1)
2
M M p
p
s sn n
where
s n s ns
n n

Sampling Distribution The sampling distribution of M1 – M2 would
help us predict values from random samples Three facts:
– 1. The mean of the M1 – M2 sampling distribution is equal to the mean of the sampling distribution of μ1 – μ2
– 2. When the 2 populations have the same variance, then the standard deviation of the sampling distribution is
– 3. CLT
1 2
2
1 2
1 1M M n n

Hypothesis test of Prozac vs. Zoloft1. State and Check Assumptions
– Normally distributed? - don’t know– σ? – don’t know– Interval data ? - probably – Independent Random sample? – yes– Homogeneity of Variance (HoV): are the
variances of the two population equal? – don’t know, but we’ll assume they are (can we check this out?)

Estimate of the Standard Error
1 2
2
1 2
2 22 1 1 2 2
1 2
1 1
( 1) ( 1)
2
M M p
p
s sn n
where
s n s ns
n n
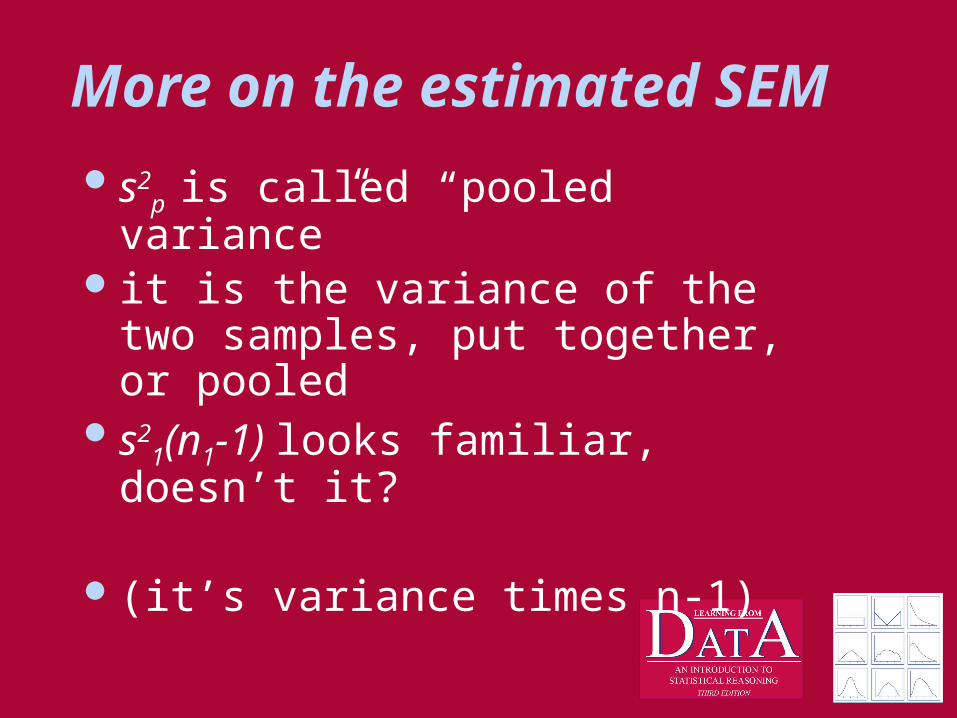
More on the estimated SEM
s2p
is called “pooled variance” it is the variance of the two samples,
put together, or pooleds2
1(n1-1) looks familiar, doesn’t it?
(it’s variance times n-1)
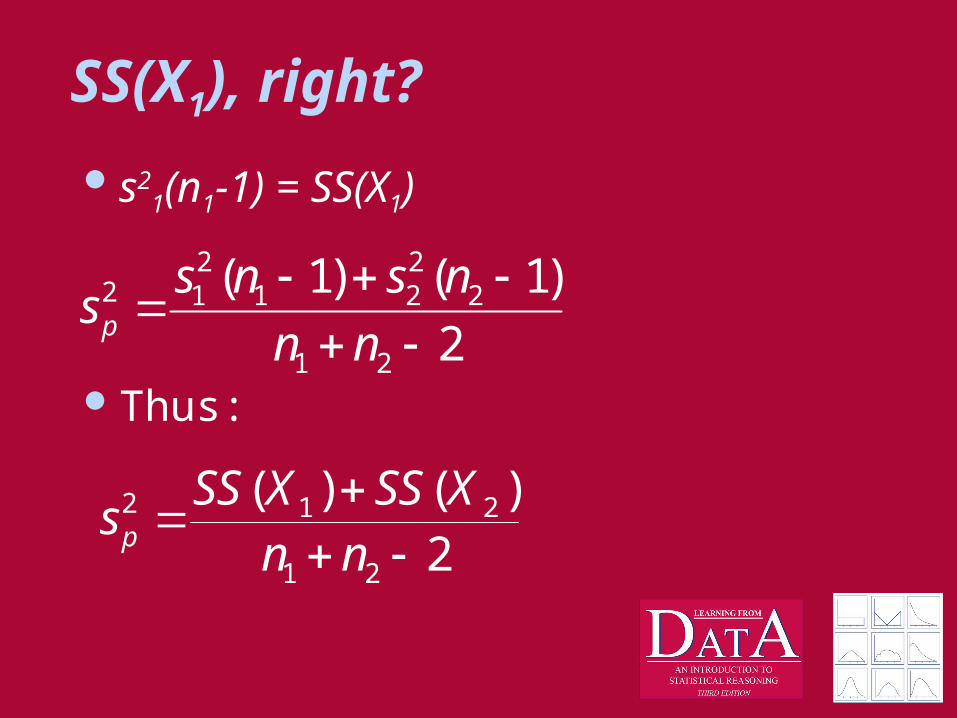
SS(X1), right?
s21(n1-1) = SS(X1)
Thus:
2 22 1 1 2 2
1 2
( 1) ( 1)
2p
s n s ns
n n
2 1 2
1 2
( ) ( )2p
SS X SS Xs
n n
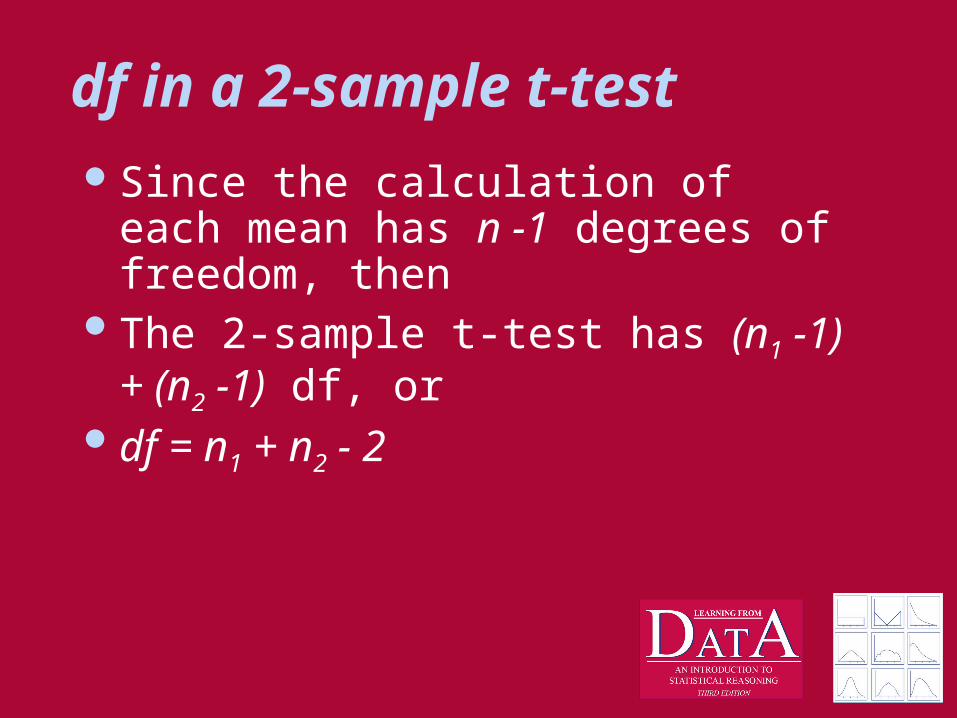
df in a 2-sample t-testSince the calculation of each mean
has n -1 degrees of freedom, thenThe 2-sample t-test has (n1 -1) + (n2 -1)
df, ordf = n1 + n2 - 2
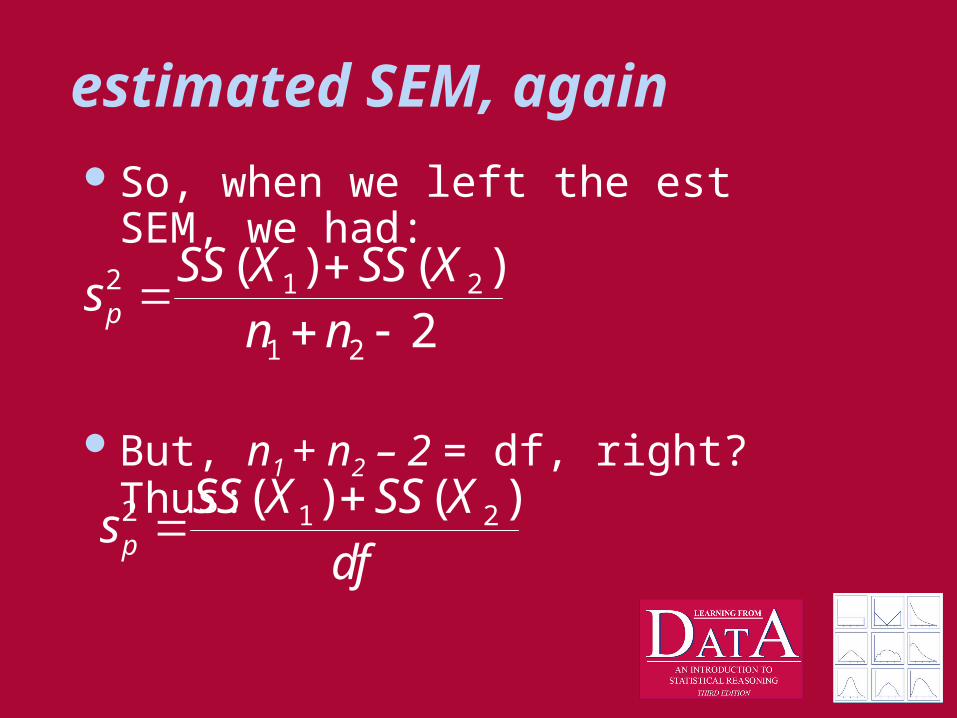
estimated SEM, againSo, when we left the est SEM, we had:
But, n1 + n2 – 2 = df, right? Thus:
2 1 2
1 2
( ) ( )2p
SS X SS Xs
n n
2 1 2( ) ( )p
SS X SS Xs
df
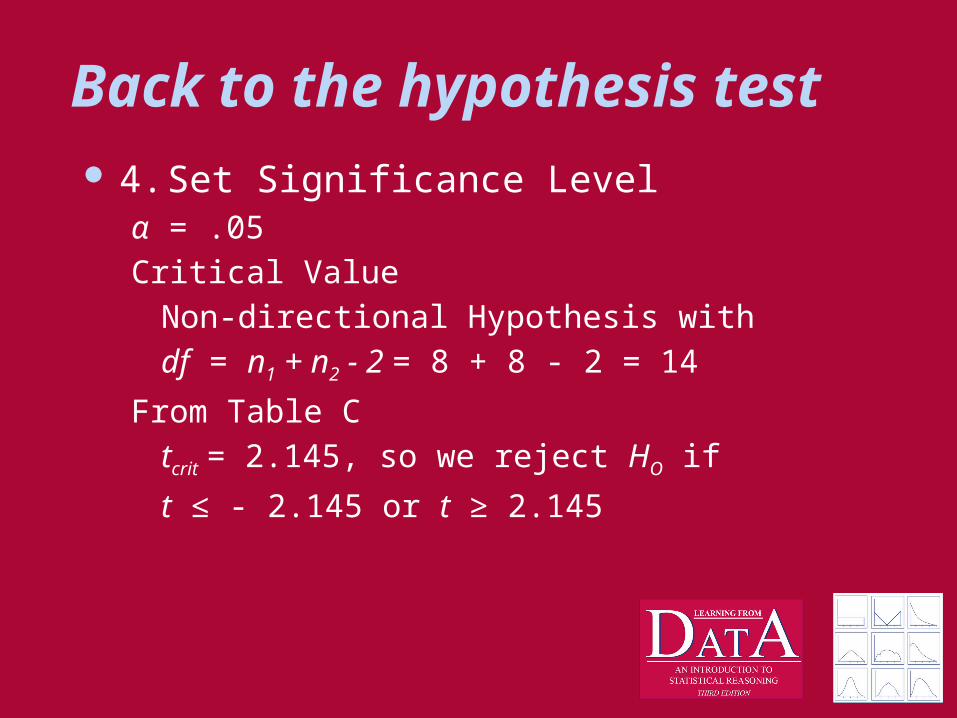
Back to the hypothesis test 4. Set Significance Level
α = .05
Critical Value
Non-directional Hypothesis with
df = n1 + n2 - 2 = 8 + 8 - 2 = 14
From Table C
tcrit = 2.145, so we reject HO if
t ≤ - 2.145 or t ≥ 2.145
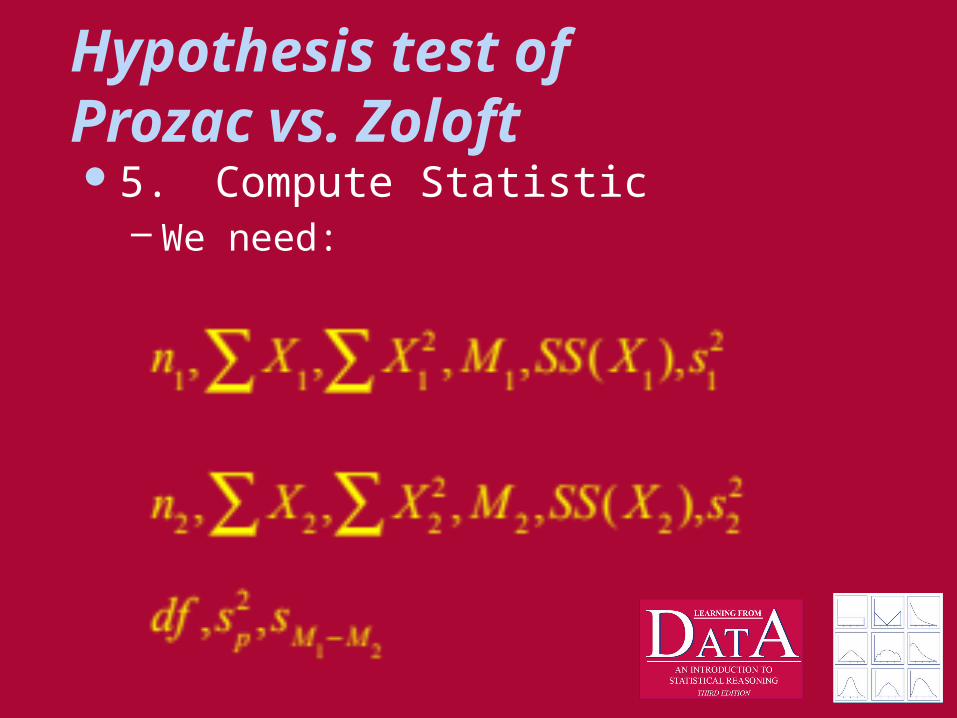
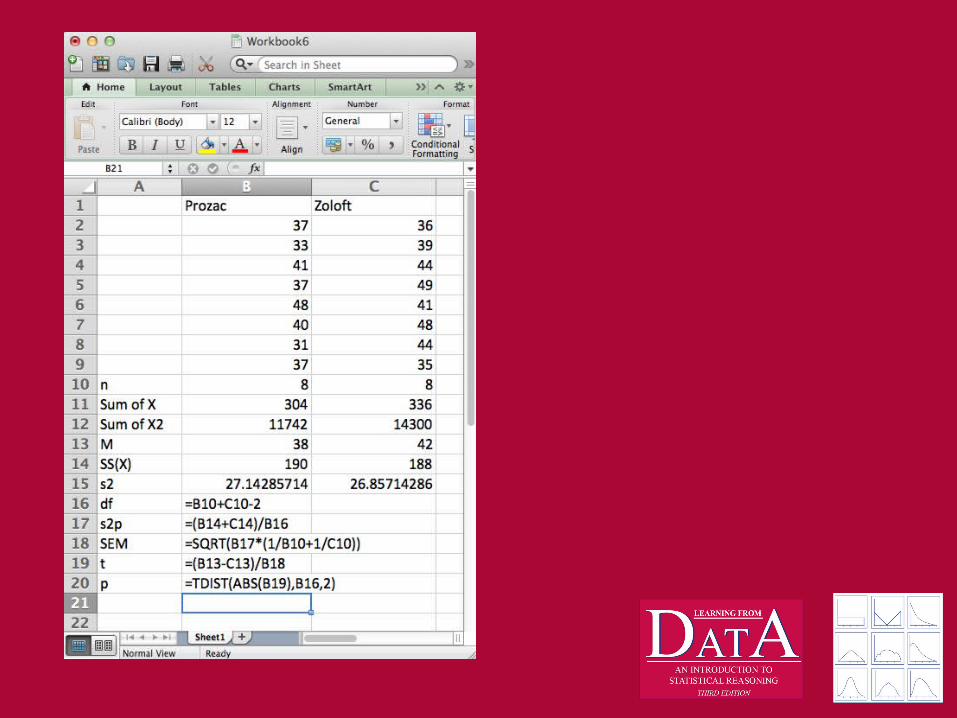
Hypothesis test of Prozac vs. Zoloft5. Compute Statistic
– We need:

Scores on the BDI Prozac Group
37 33 41 37 48 40 31 37
Zoloft Group 36 39 44 49
41 48 44 35

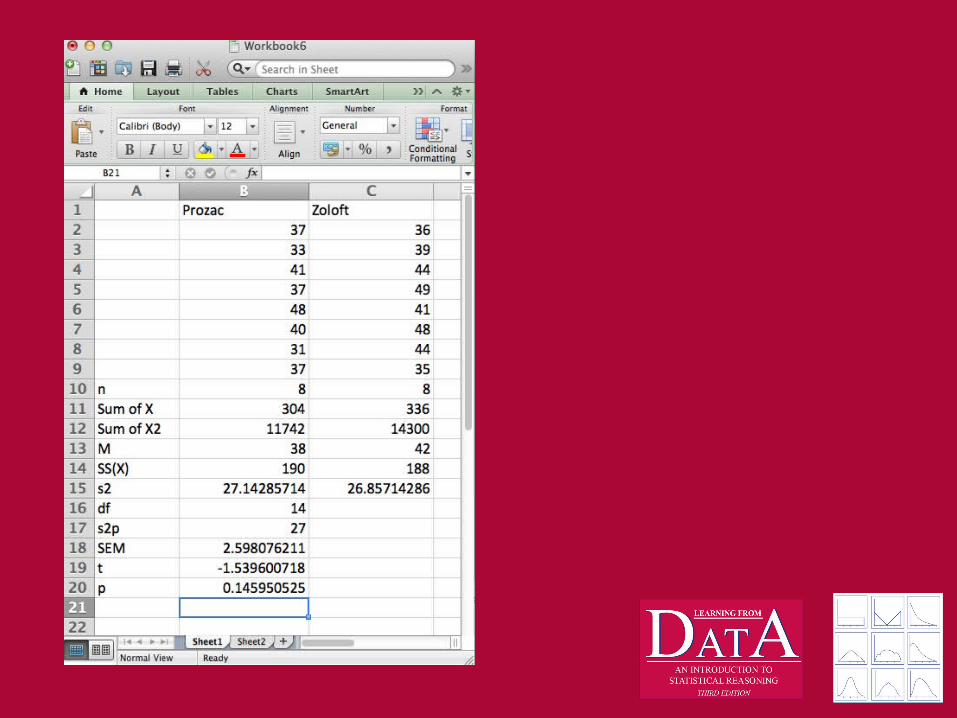
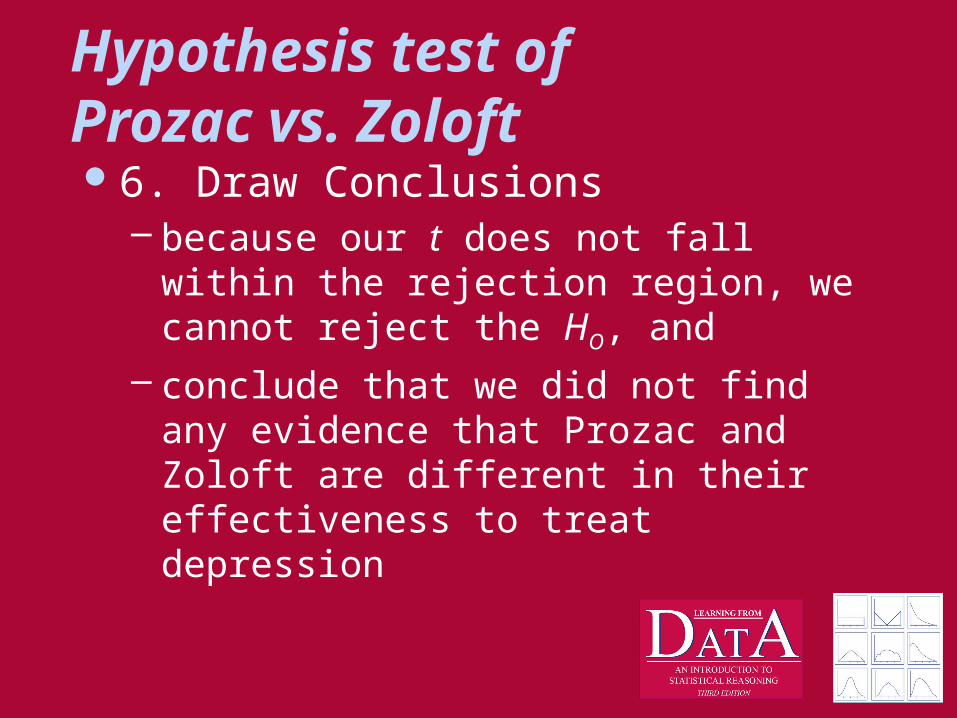
Hypothesis test of Prozac vs. Zoloft6. Draw Conclusions
– because our t does not fall within the rejection region, we cannot reject the HO, and
– conclude that we did not find any evidence that Prozac and Zoloft are different in their effectiveness to treat depression
What if?What if we have unequal sample
sizes?
Unequal Sample Sizes
In the previous example, n1 = n2 = 8, but
What if n1 ≠ n2? In this case we make an adjustment to
the calculation of the SEM But, since we calculate the pooled
variance (a weighted mean), we’re OK
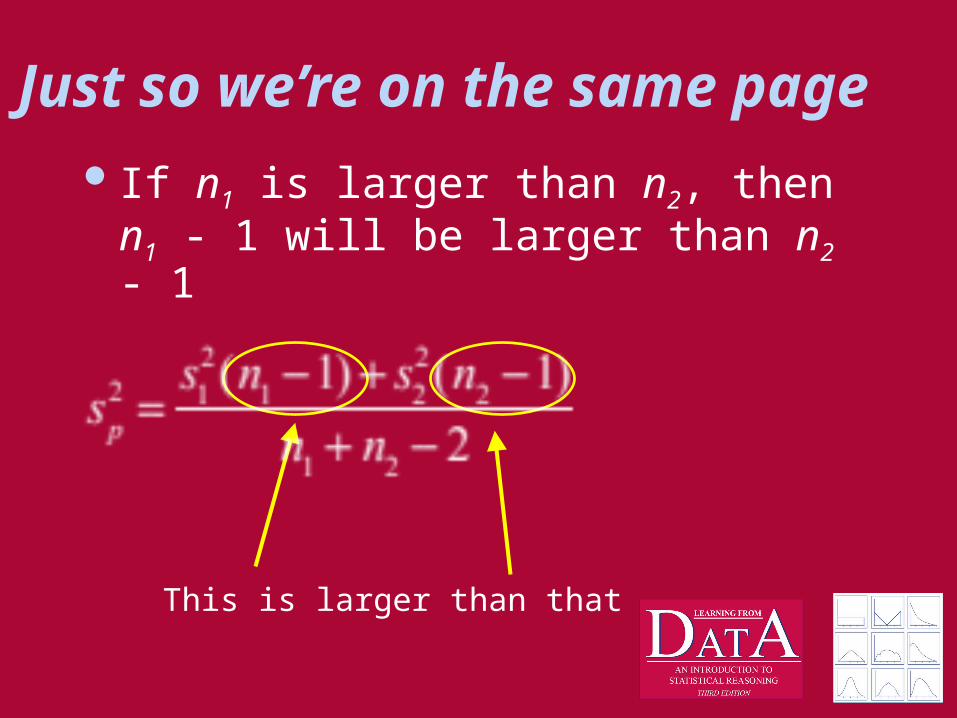
Just so we’re on the same page If n1 is larger than n2, then n1 - 1 will be
larger than n2 - 1
This is larger than that

So…
If n1 is larger than n2, then s12 (n1 - 1)
will be weighted more than s22(n2 - 1)
2 22 1 1 2 2
1 2
( 1) ( 1)
2p
s n s ns
n n
This is weighted more than that
This makes sense If we make the homogeneity of variance
assumption (the sampled populations have the same variance), then
The best estimate of the population standard deviation will use information from both samples,
But when we have more observations in one sample than the other, than we have more information from that sample than the other
We should use that additional information, which is precisely what weighting accomplishes
Effect size estimatesAfter conducting a t-test, you should
report:– t – df– p
But, it is becoming a standard practice to report effect size as well (Cohen’s d is a good measure)

Effect Size reviewEffect size – the strength of the
relationship (between IV and DV) in the population, or, the degree of departure from the null hypothesis
Important points:– rejecting the null hypothesis doesn’t
imply a large effect, and – failing to reject the null does not mean
a small effect

Example (from Rosenthal and Rosnow, 1991 – a great book on research methodology)
Smith conducts an experiment with 40 learning disabled children – half undergo special training (“experimental group”)
and– half receive no special training (“control group”)
She reports that the experimental group improved more than the control group (p < .05)

ButJones is skeptical about Smith’s results
and attempts to repeat (replicate) the experiment with 20 children, – half in the experimental and– half in the control group
He reports a p > .10, and claims that Smith’s results are not-replicable
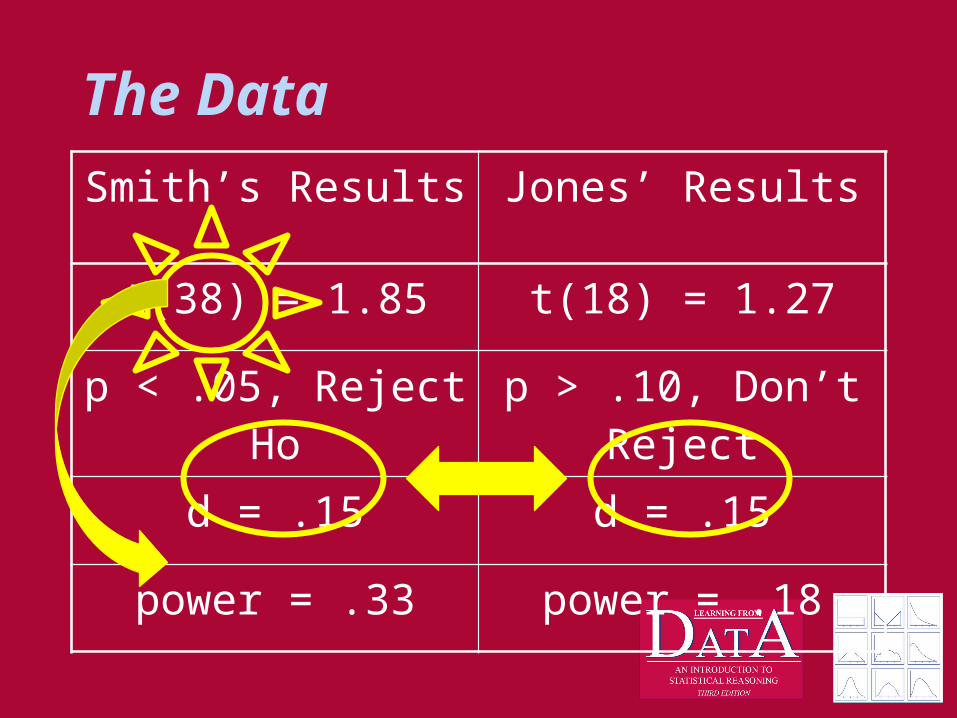
The DataSmith’s Results Jones’ Results
t(38) = 1.85 t(18) = 1.27
p < .05, Reject Ho p > .10, Don’t Reject
d = .15 d = .15
power = .33 power = .18

As you can seeEven though Jones did not reject the
null hypothesis, he had the same effect size as Smith
Jones lacked power (but Smith had pretty low power as well)

Statistic = Effect Size X Size of Study
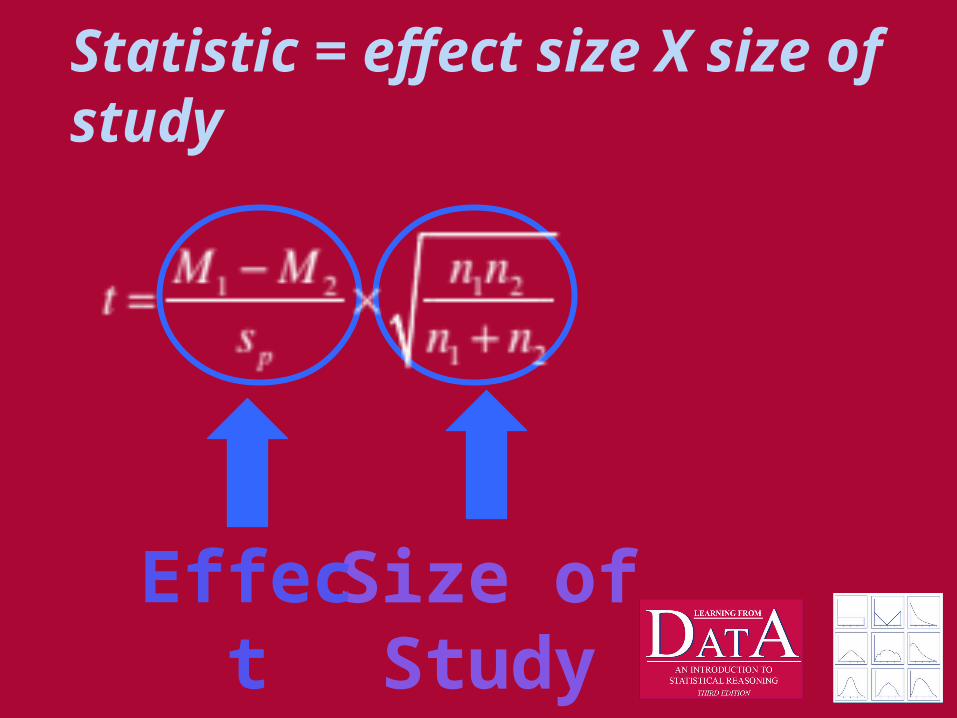
Statistic = effect size X size of study
Size ofStudy
Effect Size

And, if

What if one or more of the assumptions are violated?
Gross, meaning large, violations may cause the real α to be different from the stated significance level
Gross violations of the normality and H of V assumptions will cause these problems with a t-test
Alternative TestWhen gross violations of the
assumptions of normality or variance with a 2-independent samples t-test becomes apparent,
Use a Rank Sum T test
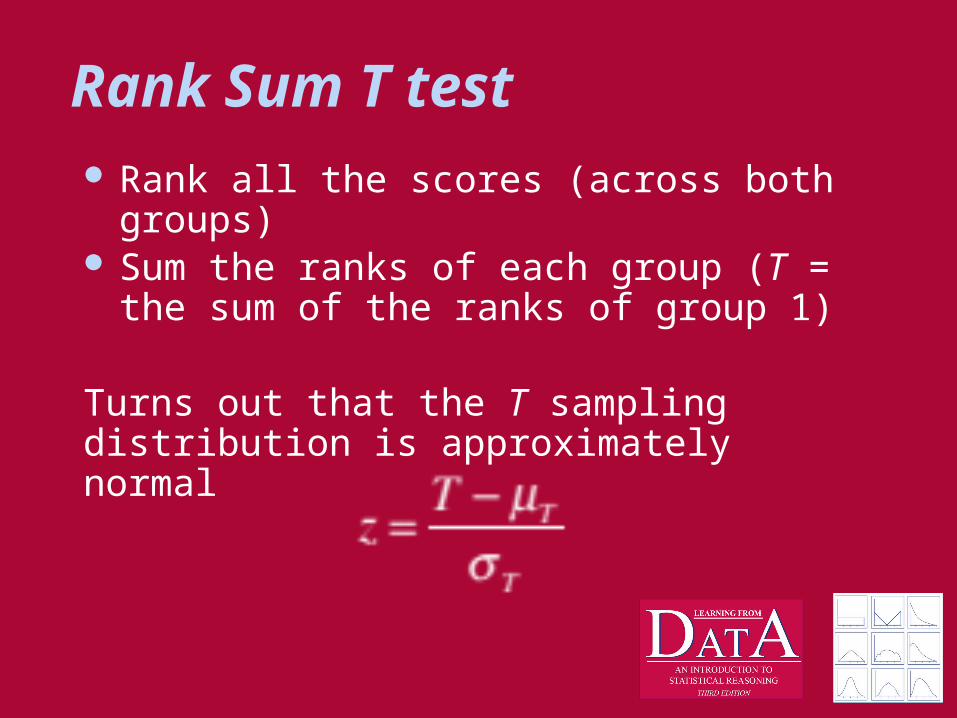
Rank Sum T test Rank all the scores (across both groups) Sum the ranks of each group (T = the sum
of the ranks of group 1)
Turns out that the T sampling distribution is approximately normal
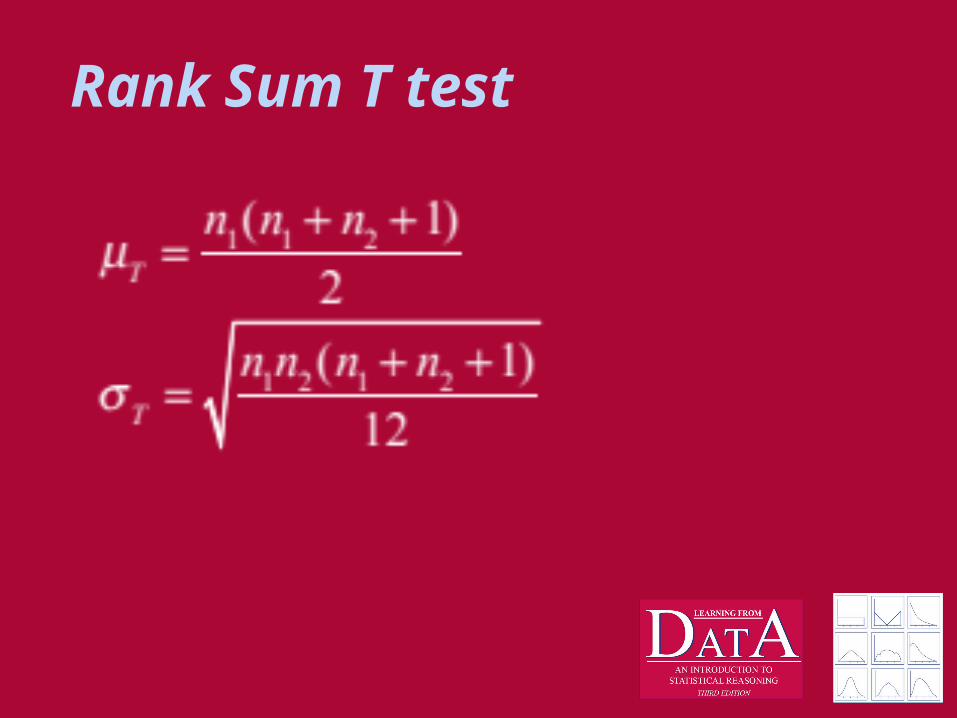
Rank Sum T test
When to use Rank Sum TTurns out, the t-test is fairly ROBUST
to violations of HoV.But not large violations…
What is a large violation of HoV?Recommendation: greater than 10x,
use Rank Sum…