Comparing Proportions between Two Independent...
49
North South University School of Life Sciences Comparing Proportions between Two Independent Populations Obaidur Rahman, PhD. NSU 1 OrR_NSU_School of life science 1
Transcript of Comparing Proportions between Two Independent...
North South UniversitySchool of Life Sciences
Comparing Proportions between Two Independent Populations
Obaidur Rahman, PhD.NSU
1OrR_NSU_School of life science 1

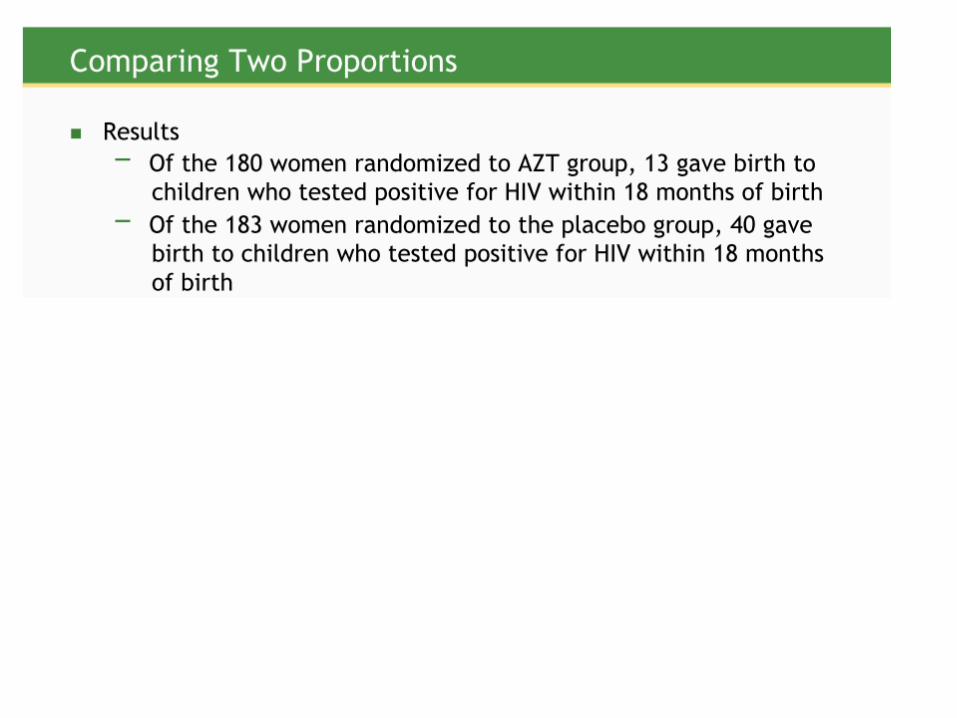

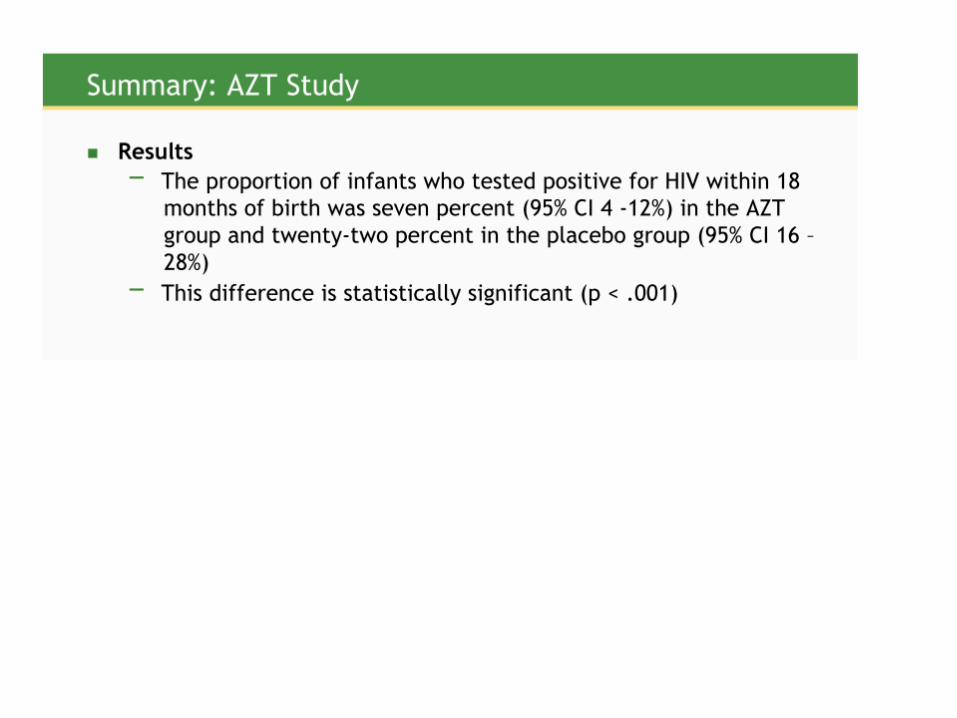
SE(pAZT)= 0.01924
SE(pPLAC)= 0.0305507


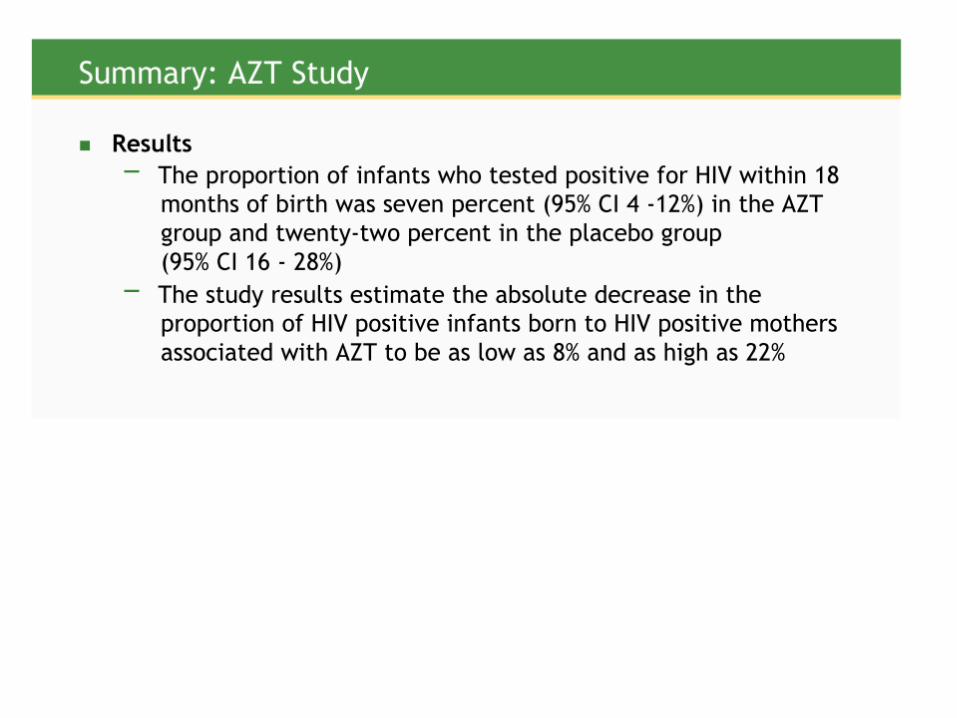
Estimated 95% CI based on a single sample of size 180 for AZT
0.07 + 2 SE(pAZT) = 0.07 + 0.01924 = (0.0390137, 0.1203358)
Estimated 95% CI based on a single sample of size 180 for Placebo
0.22 + 2 SE(pPLAC) = 0.22 + 0.0305507 = (0.160984, 0.2855248)


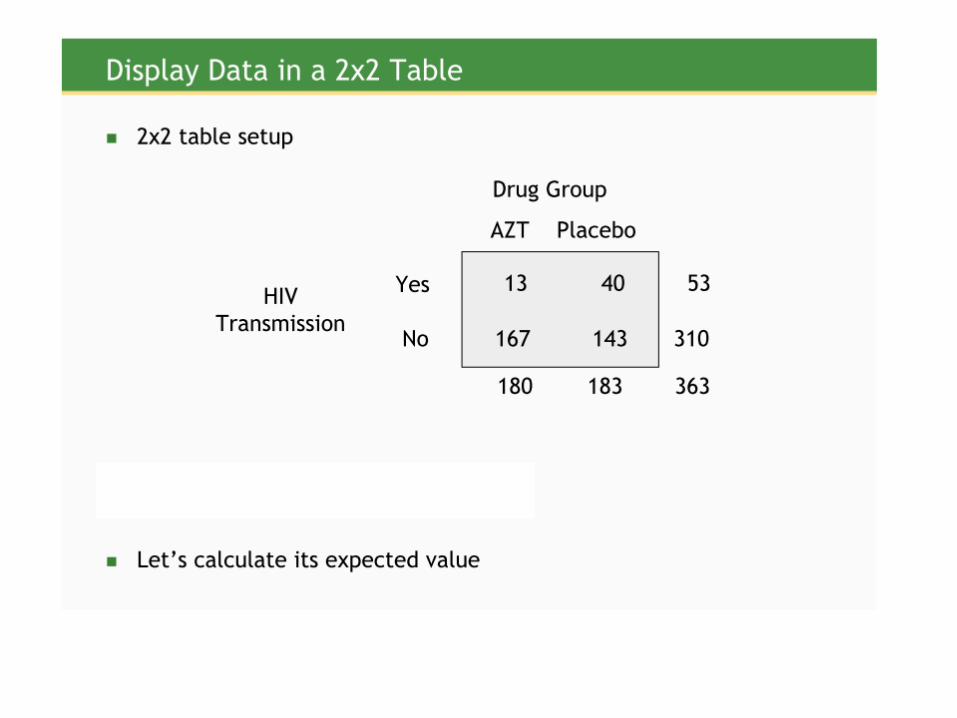


E(1,1) = (53*180)/363 = 26.3
E(1,2) = (53*183)/363 = 26.72
E(2,1) = (310*180)/363 = 153.7
E(2,2) = (310*183)/363 = 156.3


X2 = (13-26.3)2/26.3 + (40-26.7)2/26.7 + (167-153.7)2/153.7 + (143-156.3)2/156.3
= 6.72 + 6.625 + 1.15 + 1.13
= 15.6

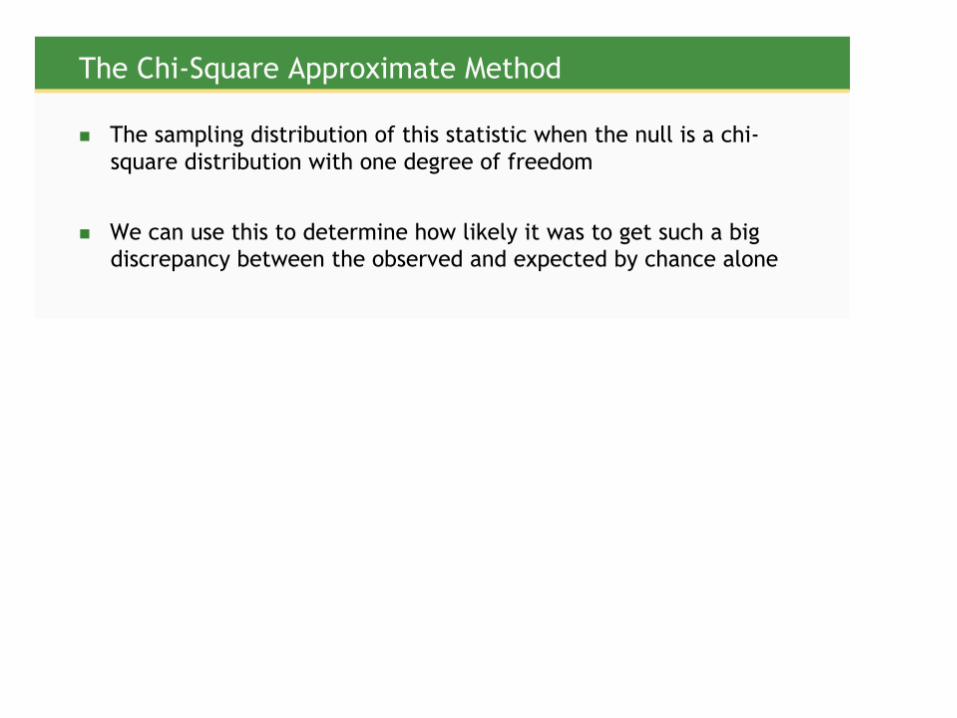
Degree of freedom = (2-1) * (2-1) = 1
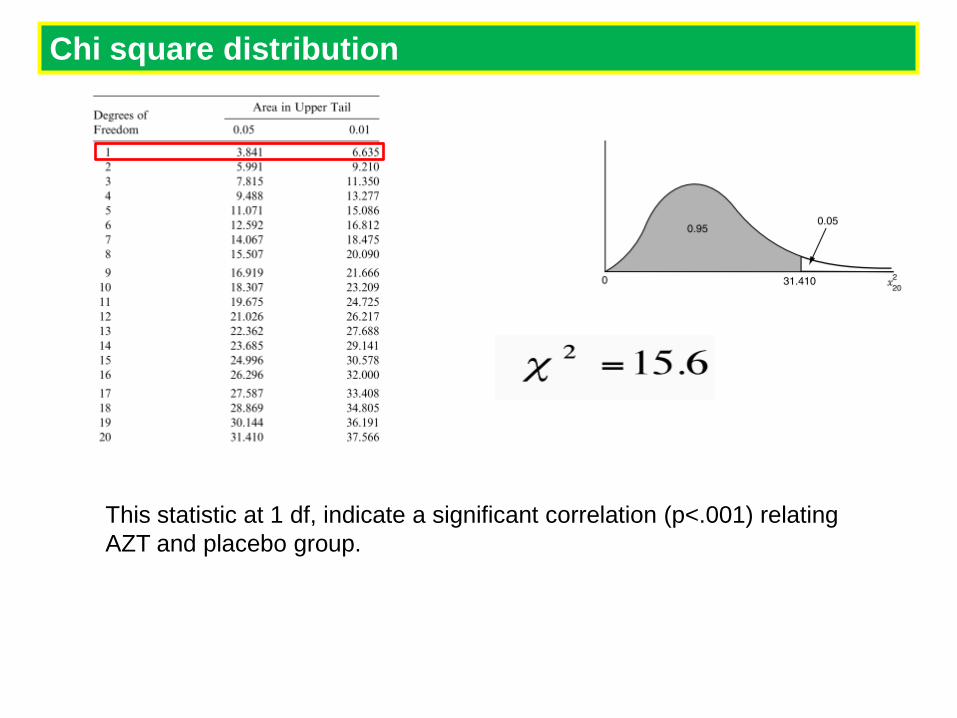
Chi square distribution
This statistic at 1 df, indicate a significant correlation (p<.001) relating
AZT and placebo group.

Chi square distribution
In 1979 the U.S. Veterans Administration conducted a health survey of 11,230
veterans. The advantages of this survey are that it includes a large random
sample with a high interview response rate, and it was done before the public
controversy surrounding the issue of the health effects of possible exposure to
Agent Orange. The data shown in Table relate Vietnam service to having sleep
problems among the 1787 veterans who entered the military service between
1965 and 1975.

Chi square distribution