Final Budget Outcome 2020-21
121
Final Budget Outcome 2020–21 September 2021 Statement by The Honourable Josh Frydenberg MP Treasurer of the Commonwealth of Australia and Senator the Hon Simon Birmingham Minister for Finance of the Commonwealth of Australia For the information of honourable members
Transcript of Final Budget Outcome 2020-21

Final Budget Outcome 2020–21
September 2021
Statement by
The Honourable Josh Frydenberg MP Treasurer of the Commonwealth of Australia
and
Senator the Hon Simon Birmingham Minister for Finance of the Commonwealth of Australia
For the information of honourable members
© Commonwealth of Australia 2021
ISSN: 2205 6750 (Print) 2205 6769 (Online)
This publication is available for your use under a Creative Commons BY Attribution 3.0
Australia licence, with the exception of the Commonwealth Coat of Arms, third party
content and where otherwise stated. The full licence terms are available from
http://creativecommons.org/licenses/by/3.0/au/legalcode.
Use of Commonwealth of Australia material under a Creative Commons BY Attribution
3.0 Australia licence requires you to attribute the work (but not in any way that suggests
that the Commonwealth of Australia endorses you or your use of the work).
Commonwealth of Australia material used ‘as supplied’
Provided you have not modified or transformed Commonwealth of Australia material
in any way including, for example, by changing the Commonwealth of Australia text;
calculating percentage changes; graphing or charting data; or deriving new statistics
from published Commonwealth of Australia statistics – then Commonwealth of
Australia prefers the following attribution:
Source: The Commonwealth of Australia.
Derivative material
If you have modified or transformed Commonwealth of Australia material, or derived
new material from those of the Commonwealth of Australia in any way, then
Commonwealth of Australia prefers the following attribution:
Based on Commonwealth of Australia data.
Use of the Coat of Arms
The terms under which the Coat of Arms can be used are set out on the Department of
the Prime Minister and Cabinet website (see www.pmc.gov.au/government/
commonwealth-coat-arms).
Other uses
Enquiries regarding this licence and any other use of this document are welcome at:
Manager
Communications
The Treasury
Langton Crescent
Parkes ACT 2600
Email: [email protected]
Internet
A copy of this document is available on the central Budget website at:
www.budget.gov.au.
Printed by CanPrint Communications Pty Ltd.

iii
Notes
(a) The following definitions are used in this Budget Paper:
– ‘real’ means adjusted for the effect of inflation
– real growth in expenses and payments is calculated using the Consumer Price
Index (CPI) as the deflator
– one billion is equal to one thousand million.
(b) Figures in tables and generally in the text have been rounded. Discrepancies in
tables between totals and sums of components are due to rounding:
– figures under $100,000 are rounded to the nearest thousand
– figures $100,000 and over are generally rounded to the nearest tenth of a million
– figures midway between rounding points are rounded up
– the percentage changes in statistical tables are calculated using unrounded data.
(c) For the budget balance, a negative sign indicates a deficit while no sign indicates a
surplus.
(d) The following notations are used:
nil
na not applicable (unless otherwise specified)
.. not zero, but rounded to zero
$m millions of dollars
$b billions of dollars
NEC/nec not elsewhere classified

iv
(e) The Australian Capital Territory and the Northern Territory are referred to as ‘the
territories’. References to the ‘states’ or ‘each state’ include the territories. The
following abbreviations are used for the names of the states, where appropriate:
NSW New South Wales
VIC Victoria
QLD Queensland
WA Western Australia
SA South Australia
TAS Tasmania
ACT Australian Capital Territory
NT Northern Territory
(f) In this paper the term Commonwealth refers to the Commonwealth of Australia.
The term is used when referring to the legal entity of the Commonwealth of
Australia.
The term Australian Government is used when referring to the Government and the
decisions and activities made by the Government on behalf of the Commonwealth
of Australia.

v
Contents
Preface .......................................................................................................... vii
Part 1: Australian Government Budget Outcome 2020–21 .......................... 1 Overview ......................................................................................................................... 1 Budget aggregates .......................................................................................................... 4 Underlying cash balance ................................................................................................. 5 Net operating balance ..................................................................................................... 9 Headline cash balance .................................................................................................. 15 Net debt, net financial worth and net worth ................................................................... 16
Part 2: Australian Government Financial Statements ................................ 19 Australian Government Financial Statements ............................................................... 20 Financial reporting standards and budget concepts ..................................................... 51
Part 3: Australia’s Federal Financial Relations .......................................... 59 Overview of payments to the states .............................................................................. 59 Payments for specific purposes .................................................................................... 60 General revenue assistance ......................................................................................... 65 Payments to the states .................................................................................................. 70
Appendix A: Expenses by Function and Sub-function .............................. 87
Appendix B: Historical Australian Government Data ................................ 91


vii
Preface
The Final Budget Outcome for 2020-21 has been prepared in a manner consistent with
the Charter of Budget Honesty Act 1998 (the Charter). The Charter requires that the
Government provide a final budget outcome report no later than three months after the
end of the financial year. Consistent with these requirements, this report encompasses
Australian Government general government sector fiscal outcomes for the
2020-21 financial year and is based on external reporting standards.
• Part 1 provides the general government sector budget aggregates for 2020-21
together with an analysis of the Final Budget Outcome for 2020-21. This includes
summary analysis of cash flows, revenue, expenses, net capital investment and the
balance sheet (net debt, net financial worth and net worth).
• Part 2 presents the Australian Government financial statements for 2020-21 with the
Australian Bureau of Statistics’ (ABS) Government Finance Statistics (GFS) as the
basis for accounting policy, except for where the Government has decided to depart
because Australian Accounting Standards provide a better conceptual treatment for
presenting information of relevance to users of public sector financial reports. This
data covers the general government sector as well as the Australian Government
public corporations sectors.
• Part 3 provides details for 2020-21 on Australia’s Federal Financial Relations,
updated from that contained in the 2021-22 Budget Paper No. 3, Federal Financial
Relations.
Appendix A contains expenses data on a functional and sub-functional basis. Historical
Australian Government data are presented in Appendix B.


1
Part 1: Australian Government Budget Outcome 2020–21
Overview
In 2020-21, the Australian Government general government sector recorded an
underlying cash deficit of $134.2 billion (6.5 per cent of gross domestic product (GDP)).
Since the start of the pandemic, the Government has committed more than $311 billion
in economic and health support. In 2020-21, unprecedented levels of economic support
were provided to protect lives and livelihoods through the JobKeeper Payment, the
Boosting Cash Flow for Employers, Coronavirus Supplement, the bring forward of
Stage 2 of the Government’s Personal Income Tax Plan and business investment
incentives (Table 2). The Government’s decisive actions have been central to Australia’s
stronger-than-expected economic recovery, which resulted in the deficit in 2020-21 being
significantly smaller than expected at the time of the 2020-21 and 2021-22 Budgets.
The Final Budget Outcome for 2020-21 is an improvement of $26.8 billion compared with
the underlying cash deficit estimated in the 2021-22 Budget. This improvement was
primarily due to the stronger-than-expected economic recovery from the early effects of
the COVID-19 pandemic which is reflected in higher total receipts ($20.1 billion) and
lower total payments ($6.7 billion).
The improvement in the underlying cash deficit from what was estimated at the time of
the 2020-21 Budget is even larger at $79.5 billion. This improvement was the result of
higher total receipts ($56.1 billion) and lower total payments ($23.3 billion) compared to
the estimates in the 2020-21 Budget.

Final Budget Outcome 2020–21
2
Table 1: Overview of key Australian Government general government sector budget aggregates 2020-21 2020-21 2020-21 Change on Change on
Estimates at Estimate at Outcome 2020-21 2021-22
2020-21 2021-22 Budget Budget
Budget Budget
$b $b $b $b $b
Receipts 463.8 499.8 519.9 56.1 20.1
Per cent of GDP 23.8 24.3 25.1
Payments(a) 677.4 660.8 654.1 -23.3 -6.7
Per cent of GDP 34.8 32.1 31.6
Underlying cash balance -213.7 -161.0 -134.2 79.5 26.8
Per cent of GDP -11.0 -7.8 -6.5
Net debt(b) 703.2 617.5 592.2 -111.0 -25.3
Per cent of GDP 36.1 30.0 28.6
(a) Equivalent to cash payments for operating activities, purchases of non-financial assets and net cash flows from financing activities for leases.
(b) Net debt is the sum of interest bearing liabilities less the sum of selected financial assets (cash and deposits, advances paid, and investments, loans and placements).
Table 2: Summary of key economic and health support payment measures in 2020-21(a)
2020-21 Outcome
$b
JobKeeper Payment 68.2
Boosting cash flow for employers 20.9
Coronavirus supplement 14.8
Economic support payments 6.1
Aviation measures 1.8
Supporting apprentices and trainees 1.2
HomeBuilder 0.6
Health measures 10.6
(a) Figures are based on cash payments made during the period 1 July 2020 to 30 June 2021
The improvement in the underlying cash deficit primarily reflects the
stronger-than-expected economic recovery following the early COVID-19 outbreaks,
with economic activity improving and rising above pre-pandemic levels in the first half
of 2021.
Real GDP grew by 1.4 per cent in 2020-21, stronger than the 1¼ per cent forecast at the
2021-22 Budget and significantly stronger than the 1½ per cent fall in GDP forecast at
the 2020-21 Budget. This growth was largely driven by an increase in household activity
and public consumption. Growth in household consumption was underpinned by
strong household balance sheets supported by the Government’s economic support and
eased restrictions. Dwelling investment increased in late 2020 driven by low interest

Part 1: Australian Government Budget Outcome 2020–21
3
rates and government incentives. The increase in public consumption reflects continuing
direct economic and health support provided by the Commonwealth as well as State,
Territory and local governments. This was partially offset by a fall in net exports due to
increasing demand for imported goods from businesses and households, and lower
goods exports. Nominal GDP grew by 4.1 per cent in 2020-21, partially owing to a sharp
increase in the price of non-rural commodities, in particular iron ore prices.
Labour market conditions continued to strengthen in the first half of calendar year 2021,
with employment exceeding pre-pandemic levels by March 2021. The employment to
population ratio and the participation rate reached record highs, while the
unemployment rate fell below 5 per cent for the first time since 2011, which at the
2021-22 Budget was not expected until late 2022. The wage price index increased
1.7 per cent through the year to the June quarter of 2021 while compensation of
employees rose by 3.3 per cent in 2020-21. The consumer price index (CPI) rose by
3.8 per cent through the year to the June quarter of 2021, reflecting a bounce back in
childcare prices following ending of the Government’s free childcare policy in June 2020,
alongside the continued recovery in oil prices. The underlying inflation rate, as
measured by the trimmed mean, was 1.6 per cent through the year to the June quarter
of 2021.
Australian Government general government sector net debt was $592.2 billion
(28.6 per cent of GDP) at the end of 2020-21, which was $25.3 billion lower than
estimated at the time of the 2021-22 Budget, and $111.0 billion lower than estimated in
the 2020-21 Budget. This primarily reflects the decreased borrowing requirement due to
the improvement in the underlying cash balance. Australian Government general
government sector net financial worth was negative $905.9 billion and net worth was
negative $725.2 billion at the end of 2020-21.

Final Budget Outcome 2020–21
4
Budget aggregates
Table 3: Australian Government general government sector budget aggregates
2019-20 2020-21 2020-21 Change on
Outcome Estimate at Outcome 2021-22
2021-22 Budget
Budget
$b $b $b $b
Receipts 469.4 499.8 519.9 20.1
Per cent of GDP 23.6 24.3 25.1
Payments(a) 549.6 660.8 654.1 -6.7
Per cent of GDP 27.7 32.1 31.6
Net Future Fund earnings(b) 5.0 na na na
Underlying cash balance(c) -85.3 -161.0 -134.2 26.8
Per cent of GDP -4.3 -7.8 -6.5
Revenue 486.3 504.9 523.0 18.1
Per cent of GDP 24.5 24.5 25.3
Expenses 578.5 659.4 651.9 -7.5
Per cent of GDP 29.2 32.0 31.5
Net operating balance -92.3 -154.5 -128.9 25.6
Per cent of GDP -4.7 -7.5 -6.2
Net capital investment 4.0 8.6 7.2 -1.4
Fiscal balance -96.3 -163.2 -136.1 27.1
Per cent of GDP -4.9 -7.9 -6.6
Memorandum item:
Net Future Fund earnings(b) 5.0 5.5 6.6 1.1
Headline cash balance -93.9 -168.2 -137.5 30.7
(a) Equivalent to cash payments for operating activities, purchases of non-financial assets and net cash flows from financing activities for leases.
(b) Under the Future Fund Act 2006, net Future Fund earnings will be available to meet the Australian Government’s superannuation liability from 2020-21. From this time, the underlying cash balance includes expected net Future Fund earnings.
(c) Excludes net Future Fund earnings before 2020-21.

Part 1: Australian Government Budget Outcome 2020–21
5
Underlying cash balance
In 2020-21, the underlying cash deficit was $134.2 billion, an improvement of
$26.8 billion since the 2021-22 Budget. This improvement was the result of higher total
receipts by $20.1 billion and lower total payments by $6.7 billion.
Table 4: Summary of Australian Government general government sector cash flows 2020-21 2020-21 Change on
Estimate at Outcome 2021-22
2021-22 Budget
Budget
$b $b $b
Cash receipts
Operating cash receipts 499.6 519.6 20.0
Capital cash receipts(a) 0.2 0.3 0.1
Total cash receipts 499.8 519.9 20.1
Cash payments
Operating cash payments 642.3 637.3 -5.0
Capital cash payments(b) 16.1 14.3 -1.8
Total cash payments 658.4 651.6 -6.8
GFS cash surplus(+)/deficit(-) -158.5 -131.6 26.9
Per cent of GDP -7.7 -6.4
plus Net cash flows from financing activities for leases(c) -2.4 -2.5 -0.1
Underlying cash balance -161.0 -134.2 26.8
Per cent of GDP -7.8 -6.5
Memorandum items:
Net cash flows from investments in financial
assets for policy purposes -7.3 -3.4 3.9
Headline cash balance -168.2 -137.5 30.7
(a) Equivalent to cash receipts from the sale of non-financial assets in the cash flow statement. (b) Equivalent to cash payments for purchases of non-financial assets in the cash flow statement. (c) Principal payments on lease liabilities, which are financing cash payments, are deducted in the calculation
of the underlying cash balance to maintain consistency of measure following the implementation of AASB 16.
Receipts
Total receipts for 2020-21 were $519.9 billion, $20.1 billion higher than forecast in the
2021-22 Budget.
Tax receipts were $14.4 billion higher than the estimate at the 2021-22 Budget. This
outcome reflects the strength in tax collections across almost all revenue heads, driven
by stronger-than-expected economic outcomes and higher-than-expected commodity
prices.
• Company tax receipts were $5.5 billion above the 2021-22 Budget profile, largely on
the back of higher-than-expected collections from large companies. Collections from
the mining sector continued to be strong, partially owing to a sharp increase in iron
ore prices. There were also higher-than-expected payments from companies who

Final Budget Outcome 2020–21
6
report on a calendar year basis and pay their balances related to the 2020 income year
in June.
• Receipts from total individuals and other withholding taxes were around $5.0 billion
above the 2021-22 Budget profile. This largely reflects higher-than-expected
collections across small, medium and large withholders, in line with
stronger-than-expected growth in compensation of employees over the second half
of the year.
• Receipts from the GST were $3.1 billion above the 2021-22 Budget profile, mostly
reflecting stronger-than-expected tax collections relating to April and May (paid in
May and June). There was strong growth in household consumption in 2020-21
reflecting a rebound in consumer spending as health outcomes improved and
restrictions were lifted.
• Superannuation fund tax receipts were $1.3 billion above the 2021-22 Budget profile.
This result was driven by stronger-than-expected collections from APRA-regulated
funds, particularly due to significant foreign exchange gains observed in the second
half of 2020-21.
• Taxation receipts from excise and customs duty were $0.2 billion below the
2021-22 Budget profile. Stronger-than-expected collections for petrol and alcohol
excise were more than offset by weaker-than-expected collections for tobacco excise.
Non-tax receipts were $46.1 billion in 2020-21, $5.7 billion higher than estimated at the
time of the 2021-22 Budget. This increase largely reflects higher-than-estimated receipts
for the Public Sector Superannuation programs ($2.4 billion), higher-than-estimated
receipts under the Unclaimed Superannuation Monies program ($1.3 billion) and
higher-than-estimated Future Fund investment earnings ($1.2 billion).
Part 1: Australian Government Budget Outcome 2020–21
7
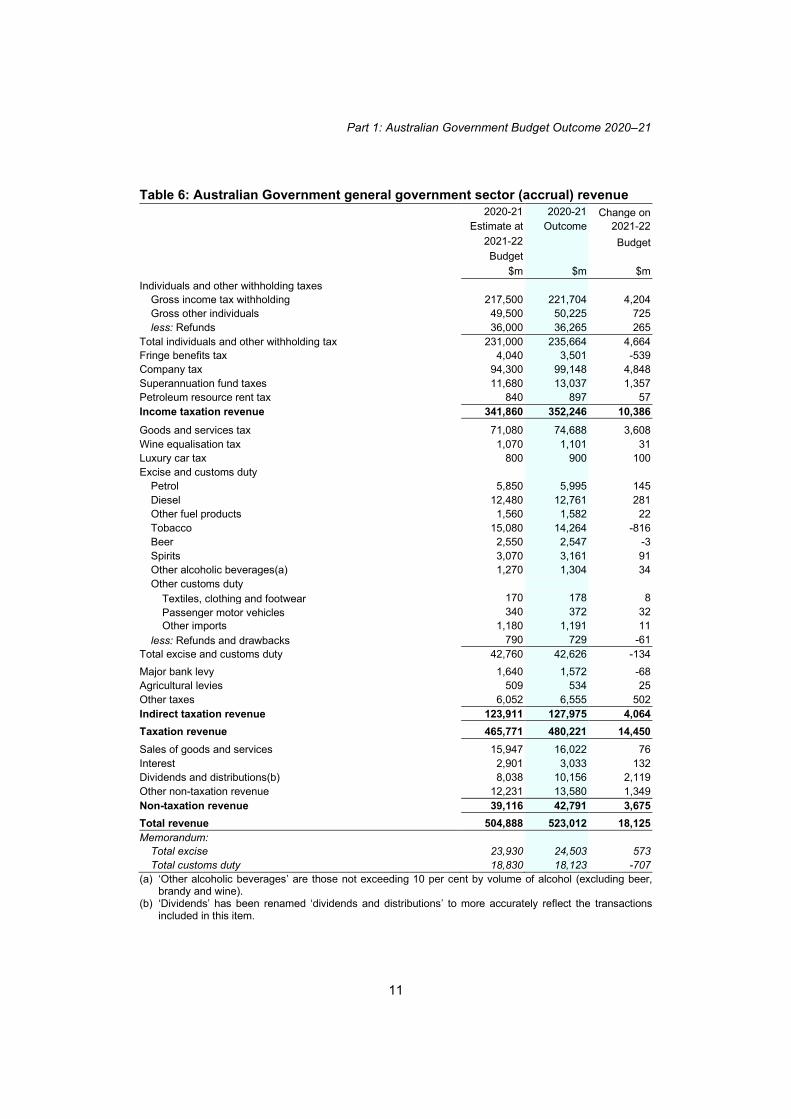
Table 5: Australian Government general government (cash) receipts 2020-21 2020-21 Change on
Estimate at Outcome 2021-22
2021-22 Budget
Budget
$m $m $m
Individuals and other withholding taxes
Gross income tax withholding 216,500 220,457 3,957
Gross other individuals 47,500 48,769 1,269
less: Refunds 36,000 36,265 265
Total individuals and other withholding tax 228,000 232,961 4,961
Fringe benefits tax 3,900 3,569 -331
Company tax 93,300 98,786 5,486
Superannuation fund taxes 11,670 12,956 1,286
Petroleum resource rent tax 800 786 -14
Income taxation receipts 337,670 349,058 11,388
Goods and services tax 69,782 72,932 3,150
Wine equalisation tax 1,050 1,119 69
Luxury car tax 800 914 114
Excise and customs duty
Petrol 5,850 5,985 135
Diesel 12,530 12,740 210
Other fuel products 1,550 1,580 30
Tobacco 15,060 14,264 -796
Beer 2,560 2,543 -17
Spirits 3,070 3,160 90
Other alcoholic beverages(a) 1,270 1,301 31
Other customs duty
Textiles, clothing and footwear 170 178 8
Passenger motor vehicles 340 372 32
Other imports 1,180 1,189 9
less: Refunds and drawbacks 790 729 -61
Total excise and customs duty 42,790 42,582 -208
Major bank levy 1,650 1,619 -31
Agricultural levies 509 525 16
Other taxes 5,219 5,101 -118
Indirect taxation receipts 121,800 124,792 2,992
Taxation receipts 459,470 473,850 14,380

Final Budget Outcome 2020–21
8
Table 5: Australian Government general government (cash) receipts (continued) 2020-21 2020-21 Change on
Estimate at Outcome 2021-22
2021-22 Budget
Budget
$m $m $m
Sales of goods and services 16,381 16,390 9
Interest received 2,995 2,812 -183
Dividends and distributions(b) 8,493 9,757 1,264
Other non-taxation receipts 12,494 17,105 4,611
Non-taxation receipts 40,361 46,063 5,702
Total receipts 499,831 519,913 20,082
Memorandum:
Total excise 23,980 24,462 482
Total customs duty 18,810 18,120 -690
(a) Other alcoholic beverages’ are those not exceeding 10 per cent by volume of alcohol (excluding beer, brandy and wine).
(b) ‘Dividends’ has been renamed ‘dividends and distributions’ to more accurately reflect the transactions included in this item.
Payments
Total payments in 2020-21 were $654.1 billion, $6.7 billion lower than estimated at the
time of the 2021-22 Budget. Key changes since the 2021-22 Budget include:
• Lower-than-estimated payments under the JobSeeker Income Support program,
largely reflecting reduced demand for unemployment benefits due to improved
labour market conditions ($1.2 billion).
• Lower-than-estimated payments under the Medical Benefits program, largely
reflecting lower-than-anticipated payments for professional attendances due to
lower-than-anticipated payments for after-hours services, partially offset by
higher-than-anticipated payments for GP attendance in business hours and
telehealth services, and lower-than-anticipated payments for pathology services due
to ongoing COVID-19 social distancing and disease control measures reducing the
spread of other communicable diseases ($0.9 billion).
• Lower-than-estimated payments under the Aged Care Services program, largely
reflecting lower-than-expected occupancy rates for residential aged care facilities
($0.7 billion).

Part 1: Australian Government Budget Outcome 2020–21
9
• Lower-than-estimated payments from the DisabilityCare Australia Fund, as
agreement has yet to be finalised between the Commonwealth and
Western Australia, with those funds to be made available in subsequent years
($0.6 billion).
• Lower-than-estimated payments under the Air Transport program, largely reflecting
the near normal return of the domestic aviation sector prior to May 2021 reducing
payments under the Domestic Aviation Network Support program and reduced
payments under the Tourism Aviation Network Support program as a result of the
May 2021 lockdowns ($0.6 billion).
• Lower-than-estimated payments under the Employment Services program, largely
reflecting the lower-than-expected take-up of wage subsidies and other payments
due to improved labour market conditions ($0.5 billion).
The outcome also reflects an increase in payments for the Public Sector Superannuation
programs ($2.0 billion), largely reflecting a change in accounting policy to report the
pass-through of defined benefit member superannuation receipts and payments on a
gross basis. These amounts were previously reported on a net basis. This change has no
net impact on the underlying cash balance as it increases both payments and receipts.
Net operating balance
The 2020-21 net operating deficit was $128.9 billion compared with a deficit of
$154.5 billion estimated at the time of the 2021-22 Budget. The 2020-21 fiscal balance was
a deficit of $136.1 billion compared with a deficit of $163.2 billion estimated at the time
of the 2021-22 Budget.
Revenue
Total revenue was $523.0 billion in 2020-21, $18.1 billion higher than estimated at the
time of the 2021-22 Budget. In comparison, total cash receipts were $519.9 billion,
$20.1 billion higher than estimated at the time of the 2021-22 Budget.
Taxation revenue was $480 billion in 2020-21, $14.4 billion higher than the estimate at
the 2021-22 Budget. The revenue estimates are the accrual accounting equivalent of the
cash-based receipts estimates. Changes in taxation revenue are generally driven by the
same factors as receipts.
The differences between the results for taxation receipts and taxation revenue therefore
generally reflect timing differences between the recognition of revenue when receipts
are owed and receiving the corresponding revenue when receipts are paid.
Total non-tax revenue was $42.8 billion in 2020-21, $3.7 billion higher than estimated at
the time of the 2021-22 Budget. Non-tax receipts were $46.1 billion in 2020-21, $5.7 billion

Final Budget Outcome 2020–21
10
higher than estimated at the time of the 2021-22 Budget. The $2.0 billion difference in
the variance for non-tax revenue and non-tax receipts largely reflects a change in
accounting policy to report the pass-through of defined benefit member superannuation
receipts and payments on a gross basis with no corresponding change to non-tax
revenue.
Part 1: Australian Government Budget Outcome 2020–21
11
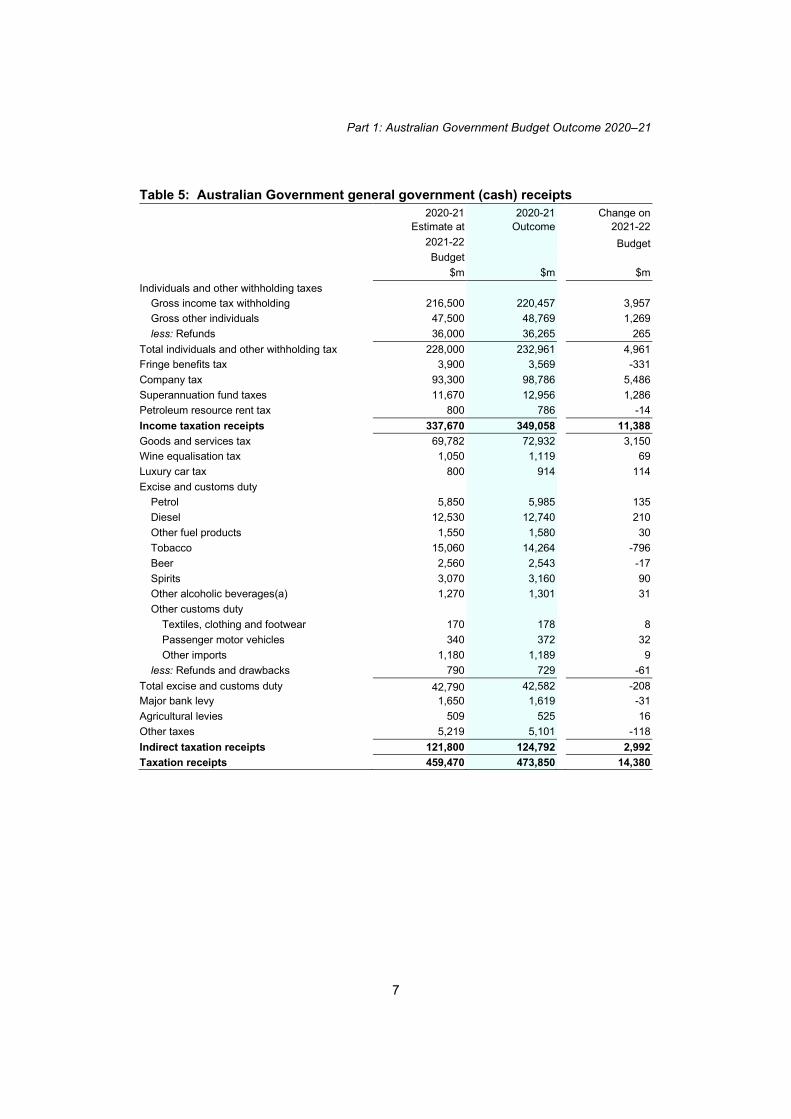
Table 6: Australian Government general government sector (accrual) revenue 2020-21 2020-21 Change on
Estimate at Outcome 2021-22
2021-22 Budget
Budget
$m $m $m
Individuals and other withholding taxes
Gross income tax withholding 217,500 221,704 4,204
Gross other individuals 49,500 50,225 725
less: Refunds 36,000 36,265 265
Total individuals and other withholding tax 231,000 235,664 4,664
Fringe benefits tax 4,040 3,501 -539
Company tax 94,300 99,148 4,848
Superannuation fund taxes 11,680 13,037 1,357
Petroleum resource rent tax 840 897 57
Income taxation revenue 341,860 352,246 10,386
Goods and services tax 71,080 74,688 3,608
Wine equalisation tax 1,070 1,101 31
Luxury car tax 800 900 100
Excise and customs duty
Petrol 5,850 5,995 145
Diesel 12,480 12,761 281
Other fuel products 1,560 1,582 22
Tobacco 15,080 14,264 -816
Beer 2,550 2,547 -3
Spirits 3,070 3,161 91
Other alcoholic beverages(a) 1,270 1,304 34
Other customs duty
Textiles, clothing and footwear 170 178 8
Passenger motor vehicles 340 372 32
Other imports 1,180 1,191 11
less: Refunds and drawbacks 790 729 -61
Total excise and customs duty 42,760 42,626 -134
Major bank levy 1,640 1,572 -68
Agricultural levies 509 534 25
Other taxes 6,052 6,555 502
Indirect taxation revenue 123,911 127,975 4,064
Taxation revenue 465,771 480,221 14,450
Sales of goods and services 15,947 16,022 76
Interest 2,901 3,033 132
Dividends and distributions(b) 8,038 10,156 2,119
Other non-taxation revenue 12,231 13,580 1,349
Non-taxation revenue 39,116 42,791 3,675
Total revenue 504,888 523,012 18,125
Memorandum:
Total excise 23,930 24,503 573
Total customs duty 18,830 18,123 -707
(a) ‘Other alcoholic beverages’ are those not exceeding 10 per cent by volume of alcohol (excluding beer, brandy and wine).
(b) ‘Dividends’ has been renamed ‘dividends and distributions’ to more accurately reflect the transactions included in this item.

Final Budget Outcome 2020–21
12
Expenses and net capital investment
Total expenses were $651.9 billion in 2020-21, $7.5 billion lower than estimated at the
time of the 2021-22 Budget. Total net capital investment for 2020-21 was $7.2 billion,
$1.4 billion lower than the estimate of $8.6 billion at the time of the 2021-22 Budget. This
results in an $8.9 billion lower-than-estimated net outcome for expenses and net capital
investment of $659.1 billion compared to the 2021-22 Budget.
In comparison, cash payments were $654.1 billion in 2020-21, $6.7 billion lower than
estimated at the time of the 2021-22 Budget.
The difference of $5.0 billion between the net outcome for expenses and net capital
investment and the outcome for cash payments is primarily due to timing differences in
the accounting treatment of expenses and the associated cash flow, including for the
payment of GST revenue to the states and territories under the General Revenue
Assistance program and for the Government superannuation programs.
Further information on expenses by function and sub-function is provided in
Appendix A.

Part 1: Australian Government Budget Outcome 2020–21
13
Table 7: Australian Government general government sector expenses by function 2020-21 2020-21 Change on
Estimate at Outcome 2021-22
2021-22 Budget
Budget
$m $m $m
General public services
Legislative and executive affairs 1,446 1,371 -75
Financial and fiscal affairs 9,013 8,848 -165
Foreign affairs and economic aid 6,949 6,470 -479
General research 3,238 3,069 -169
General services 1,237 1,283 46
Government superannuation benefits 11,153 10,900 -253
Defence 33,375 34,007 633
Public order and safety 6,712 6,655 -58
Education 42,604 42,331 -272
Health 94,533 92,740 -1,793
Social security and welfare 225,394 220,360 -5,034
Housing and community amenities 6,953 6,291 -662
Recreation and culture 4,405 4,096 -309
Fuel and energy 9,090 8,242 -848
Agriculture, forestry and fishing 4,014 3,165 -849
Mining, manufacturing and construction 4,394 4,034 -360
Transport and communication 13,828 12,804 -1,025
Other economic affairs
Tourism and area promotion 227 210 -16
Labour and employment affairs 6,546 5,260 -1,286
Immigration 3,622 3,419 -204
Other economic affairs nec 73,424 73,179 -246
Other purposes
Public debt interest 17,123 17,123 0
Nominal superannuation interest 7,004 7,177 173
General purpose inter-government transactions 75,250 78,538 3,288
Natural disaster relief 748 344 -404
Contingency reserve -2,845 0 2,845
Total expenses 659,437 651,916 -7,521

Final Budget Outcome 2020–21
14
Table 8: Australian Government general government sector net capital investment by function 2020-21 2020-21 Change on
Estimate at Outcome 2021-22
2021-22 Budget
Budget
$m $m $m
General public services 421 -229 -650
Defence 5,868 6,511 644
Public order and safety 312 233 -79
Education 34 8 -26
Health 1,991 1,580 -411
Social security and welfare -390 -406 -16
Housing and community amenities -242 -424 -182
Recreation and culture 111 -13 -124
Fuel and energy 21 17 -3
Agriculture, forestry and fishing 41 -53 -94
Mining, manufacturing and construction -22 -26 -4
Transport and communication -4 -33 -29
Other economic affairs 478 37 -441
Other purposes 2 1 -1
Total net capital investment 8,620 7,204 -1,416
Table 9: Australian Government general government sector purchases of non-financial assets by function 2020-21 2020-21 Change on
Estimate at Outcome 2021-22
2021-22 Budget
Budget
$m $m $m
General public services 1,951 1,352 -599
Defence 11,951 11,906 -46
Public order and safety 1,105 1,087 -19
Education 74 57 -17
Health 268 254 -14
Social security and welfare 444 478 34
Housing and community amenities 336 211 -125
Recreation and culture 544 437 -108
Fuel and energy 15 12 -3
Agriculture, forestry and fishing 134 55 -79
Mining, manufacturing and construction 16 11 -5
Transport and communication 123 84 -38
Other economic affairs 1,353 990 -363
Other purposes 3 2 -1
Total Government purchases of non-financial assets 18,318 16,936 -1,382

Part 1: Australian Government Budget Outcome 2020–21
15
Headline cash balance
The headline cash balance consists of the underlying cash balance and net cash flows
from investments in financial assets for policy purposes (for example, student loans and
a loan to NBN Co).
In 2020-21, the headline cash deficit was $137.5 billion compared with an estimated
deficit of $168.2 billion in the 2021-22 Budget. The improvement in the headline cash
balance was primarily driven by the change in the underlying cash balance reflecting
the stronger-than-expected economic recovery from the COVID-19 pandemic.
Net cash flows from investments in financial assets for policy purposes have also
improved by $3.9 billion since the 2021-22 Budget. This is primarily driven by
lower-than-expected outlays for drought and rural assistance loans, reflecting
lower-than-estimated farm business concessional loans through the Regional
Investment Corporation, and lower-than-expected outlays for the Structured Finance
Support Fund, reflecting improved conditions in the securitisation market resulting in
reduced demand for financial support.
Table 10 provides further detail between the underlying and headline cash balance
estimates of the Australian Government general government sector in 2020-21.

Final Budget Outcome 2020–21
16
Table 10: Australian Government general government sector reconciliation of underlying and headline cash balance 2020-21 2020-21 Change on
Estimate at Outcome 2021-22
2021-22 Budget
Budget
$m $m $m
2020-21 Underlying cash balance -160,952 -134,171 26,781
plus Net cash flows from investments in financial assets
for policy purposes
Student loans -3,524 -3,869 -345
NBN loan(a) 5,550 6,258 708
Trade support loans -75 -99 -24
CEFC loans and investments -517 -477 40
Northern Australia Infrastructure Facility -229 -190 39
Australian Business Securitisation Fund -235 -88 147
Structured Finance Support Fund -1,186 -64 1,122
Drought and rural assistance loans -2,714 -763 1,951
Official Development Assistance – Multilateral Replenishment -78 -78 0
National Housing Finance and Investment Corporation -91 -25 66
COVID-19 Support for Indonesia – loan -1,450 -1,450 0
Financial Assistance to Papua New Guinea – loan -539 -558 -19
Net other(b) -2,199 -1,962 237
Total net cash flows from investments in financial assets
for policy purposes -7,286 -3,364 3,922
2020-21 Headline cash balance -168,238 -137,535 30,703
(a) This financial profile represents the actual repayments for 2020-21. As the loan agreement between the Government and NBN Co allows some flexibility in relation to the timing of the repayment, the remaining amount is included in 2023-24.
(b) Net other includes amounts that have not been itemised for commercial-in-confidence reasons.
Net debt, net financial worth and net worth
At the end of 2020-21, net debt was $592.2 billion (28.6 per cent of GDP), $25.3 billion
lower than estimated at the time of the 2021-22 Budget. This primarily reflects the
decreased borrowing requirement stemming from the stronger-than-expected economic
outcomes, partly offset by the effect of decreasing yields since the 2021-22 Budget on the
market value of Australian Government Securities.
Net financial worth was negative $905.9 billion at the end of 2020-21, compared with
negative $769.8 billion estimated at the 2021-22 Budget.
Net worth was negative $725.2 billion at the end of 2020-21, compared with negative
$586.5 billion estimated at the 2021-22 Budget.
The changes in net financial worth and net worth since the 2021-22 Budget primarily
reflect an increase in the Government’s reported superannuation liability, partially offset
by the improvement in the underlying cash balance. The reported increase in the

Part 1: Australian Government Budget Outcome 2020–21
17
superannuation liability is consistent with previous years and is the result of the
difference between the discount rates used to value the Government’s defined benefit
superannuation liability at the 2021-22 Budget and at the 2020-21 Final Budget Outcome.
At the 2021-22 Budget, the unfunded superannuation liabilities were estimated using an
actuarially determined long-term discount rate. This rate reflected the average annual
rate estimated to apply over the remainder of the term to maturity of the liability and
the actuaries’ views that short-term deviations are expected to be smoothed out in the
longer term. This approach also reduces the volatility in reported liabilities that would
occur from year to year if the long-term government bond rate were used.
For the Final Budget Outcome, the Australian Accounting Standards require the use of
the long-term government bond rate as at 30 June 2021 that best matches each individual
scheme’s liability duration. This results in differences in the superannuation liability
from one Final Budget Outcome to the next, and between Budgets and Final Budget
Outcomes. At the 2020-21 Final Budget Outcome, the bond rates used were between
1.6 and 2.3 per cent per annum depending on the defined benefit scheme.
The variance in the reported superannuation liability between the 2021-22 Budget and
2020-21 Final Budget Outcome was an increase of $163.5 billion. By way of comparison,
the variance between the 2019-20 MYEFO and the 2019-20 Final Budget Outcome was
an increase of $199.3 billion.
Table 11: Australian Government general government sector net worth, net financial worth, net debt and net interest payments 2020-21 2020-21 Change on
Estimate at Outcome 2021-22
2021-22 Budget
Budget
$b $b $b
Financial assets 509.9 547.0 37.1
Non-financial assets 183.3 180.7 -2.6
Total assets 693.2 727.7 34.5
Total liabilities 1,279.7 1,453.0 173.3
Net worth -586.5 -725.2 -138.7
Net financial worth(a) -769.8 -905.9 -136.1
Per cent of GDP -37.4 -43.8
Net debt(b) 617.5 592.2 -25.3
Per cent of GDP 30.0 28.6
Net interest payments 14.1 14.3 0.2
Per cent of GDP 0.7 0.7
(a) Net financial worth equals total financial assets minus total liabilities. (b) Net debt is the sum of interest bearing liabilities less the sum of selected financial assets (cash and
deposits, advances paid and investments, loans and placements).


19
Part 2: Australian Government Financial Statements
Consistent with the Charter of Budget Honesty Act 1998 (the Charter), the Government has
produced a single set of financial statements for the Australian Government general
government sector (GGS), the public non-financial corporations (PNFC) sector, the total
non-financial public sector (NFPS) and the public financial corporations (PFC) sector.
The financial statements comply with both the Australian Bureau of Statistics’ (ABS)
accrual Government Finance Statistics (GFS) and Australian Accounting Standards
(AAS), with departures disclosed. These statements are:
• an operating statement, including other economic flows, which shows net operating
balance and net lending/borrowing (fiscal balance)
• a balance sheet, which shows net worth, net financial worth, net financial liabilities
and net debt
• a cash flow statement, which includes the calculation of the underlying cash balance.
In addition to these general purpose statements, notes to the financial statements are
required. These notes include a summary of accounting policies, disaggregated
information and other disclosures required by AAS.
The financial statements for the Final Budget Outcome for 2020-21 have been prepared
on a basis consistent with the 2021-22 Budget. This enables comparison of the 2020-21
revised estimates published at the 2021-22 Budget and the outcome.
The statements reflect the Government’s policy that the ABS GFS remains the basis of
budget accounting policy, except where AAS is applied because it provides a better
conceptual basis for presenting information of relevance to users of public sector
financial reports.
The Australian, state and territory governments have an agreed framework – the
Uniform Presentation Framework (UPF) – for the presentation of government financial
information on a basis broadly consistent with the Australian Accounting Standard
AASB 1049. The financial statements are consistent with the requirements of the UPF.
Final Budget Outcome 2020–21
20
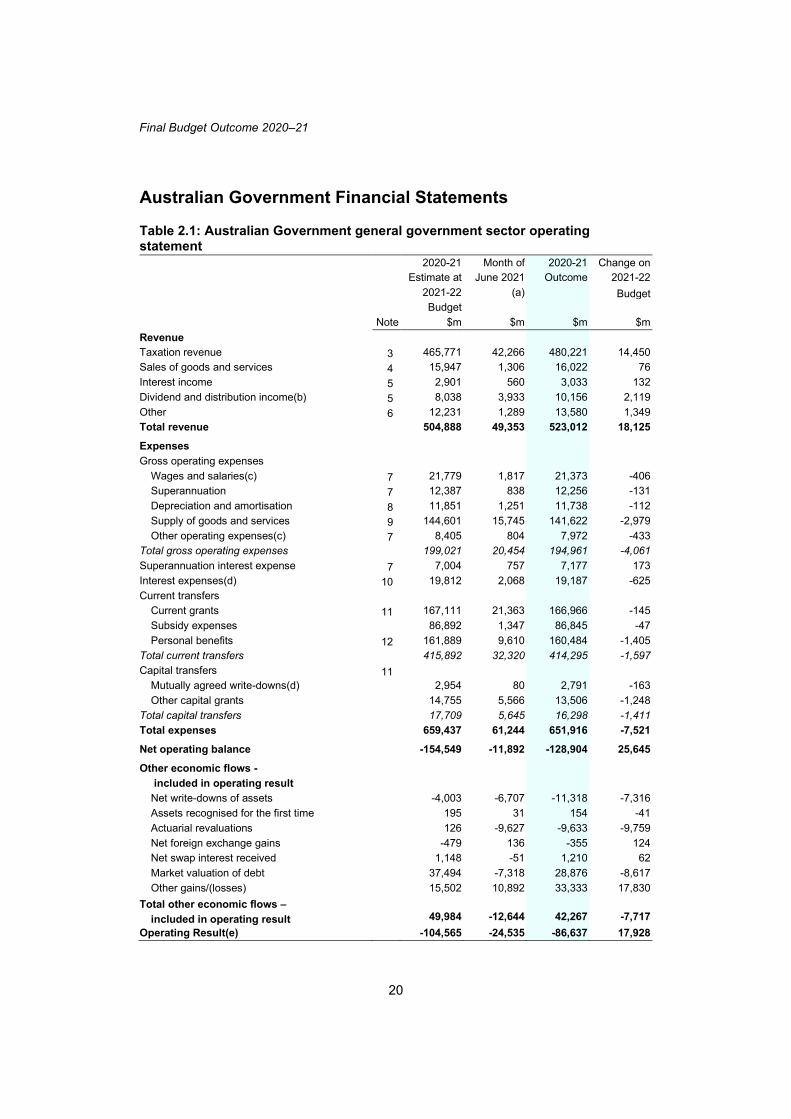
Australian Government Financial Statements
Table 2.1: Australian Government general government sector operating statement 2020-21 Month of 2020-21 Change on Estimate at June 2021 Outcome 2021-22 2021-22 (a) Budget
Budget
Note $m $m $m $m
Revenue
Taxation revenue 3 465,771 42,266 480,221 14,450
Sales of goods and services 4 15,947 1,306 16,022 76
Interest income 5 2,901 560 3,033 132
Dividend and distribution income(b) 5 8,038 3,933 10,156 2,119
Other 6 12,231 1,289 13,580 1,349
Total revenue 504,888 49,353 523,012 18,125
Expenses
Gross operating expenses
Wages and salaries(c) 7 21,779 1,817 21,373 -406
Superannuation 7 12,387 838 12,256 -131
Depreciation and amortisation 8 11,851 1,251 11,738 -112
Supply of goods and services 9 144,601 15,745 141,622 -2,979
Other operating expenses(c) 7 8,405 804 7,972 -433
Total gross operating expenses 199,021 20,454 194,961 -4,061
Superannuation interest expense 7 7,004 757 7,177 173
Interest expenses(d) 10 19,812 2,068 19,187 -625
Current transfers
Current grants 11 167,111 21,363 166,966 -145
Subsidy expenses 86,892 1,347 86,845 -47
Personal benefits 12 161,889 9,610 160,484 -1,405
Total current transfers 415,892 32,320 414,295 -1,597
Capital transfers 11
Mutually agreed write-downs(d) 2,954 80 2,791 -163
Other capital grants 14,755 5,566 13,506 -1,248
Total capital transfers 17,709 5,645 16,298 -1,411
Total expenses 659,437 61,244 651,916 -7,521
Net operating balance -154,549 -11,892 -128,904 25,645
Other economic flows -
included in operating result
Net write-downs of assets -4,003 -6,707 -11,318 -7,316
Assets recognised for the first time 195 31 154 -41
Actuarial revaluations 126 -9,627 -9,633 -9,759
Net foreign exchange gains -479 136 -355 124
Net swap interest received 1,148 -51 1,210 62
Market valuation of debt 37,494 -7,318 28,876 -8,617
Other gains/(losses) 15,502 10,892 33,333 17,830
Total other economic flows –
included in operating result 49,984 -12,644 42,267 -7,717
Operating Result(e) -104,565 -24,535 -86,637 17,928

Part 2: Australian Government Financial Statements
21
Table 2.1: Australian Government general government sector operating statement (continued)
2020-21 Month of 2020-21 Change on Estimate at June 2021 Outcome 2021-22 2021-22 (a) Budget
Budget
Note $m $m $m $m
Non-owner movements in equity
Revaluation of equity investments -10,149 -3,721 -3,728 6,420
Actuarial revaluations -1,242 -22,072 -22,072 -20,830
Other economic revaluations -2,614 -438 -2,290 324
Total other economic flows –
included in equity -14,005 -26,232 -28,090 -14,086
Comprehensive result –
Total change in net worth -118,570 -50,767 -114,727 3,842
Net operating balance -154,549 -11,892 -128,904 25,645
Net acquisition
of non-financial assets
Purchases of non-financial assets 18,318 3,962 16,936 -1,382
less Sales of non-financial assets 228 116 302 74
less Depreciation 11,851 1,251 11,738 -112
plus Change in inventories 2,381 71 2,305 -76
plus Other movements in
non-financial assets 0 -16 3 3
Total net acquisition of
non-financial assets 8,620 2,650 7,204 -1,416
Fiscal balance
(Net lending/borrowing)(f) -163,169 -14,542 -136,108 27,061
(a) The month of June is derived by deducting May year-to-date published data from the annual outcome. Statistically, June movements in some series relate to earlier published months that are not reissued; this can result in negative movements.
(b) ‘Dividend income’ has been renamed ‘dividend and distribution income’ to more accurately reflect the transactions included in this item.
(c) Consistent with the ABS GFS classification, other employee related expenses are classified separately from wages and salaries under other operating expenses. Total employee expenses equal wages and salaries plus other operating expenses.
(d) From the 2021-22 Budget, the value of debt not expected to be repaid (DNER) on initial recognition of income contingent concessional loans is reported as a mutually agreed write-down, which is a form of capital transfer. It was previously reported as other financing costs.
(e) Operating result under AAS. (f) The term fiscal balance is not used by the ABS.

Final Budget Outcome 2020–21
22
Table 2.2: Australian Government general government sector balance sheet 2020-21 2020-21 Change on
Estimate at Outcome 2021-22
2021-22 Budget
Budget
Note $m $m $m
Assets
Financial assets
Cash and deposits(a) 46,693 62,412 15,719
Advances paid 13 82,235 81,404 -832
Investments, loans and placements(a) 14 181,717 188,815 7,098
Other receivables 13 67,065 66,855 -210
Equity investments
Investments in other public sector entities 55,821 61,341 5,520
Equity accounted investments 3,528 3,642 114
Investments – shares 72,829 82,561 9,732
Total financial assets 509,888 547,029 37,141
Non-financial assets 15
Land 11,817 12,068 251
Buildings 43,970 43,314 -656
Plant, equipment and infrastructure 93,468 92,183 -1,286
Inventories 11,710 10,605 -1,105
Intangibles 9,821 9,809 -12
Investment properties 210 191 -19
Biological assets 28 35 7
Heritage and cultural assets 11,979 11,860 -119
Assets held for sale 250 589 340
Other non-financial assets 37 40 3
Total non-financial assets 183,290 180,694 -2,596
Total assets 693,178 727,724 34,546
Liabilities
Interest bearing liabilities
Deposits held 484 598 114
Government securities 891,811 888,419 -3,391
Loans 16 16,345 16,394 49
Lease liabilities 19,527 19,441 -87
Total interest bearing liabilities 928,166 924,851 -3,315

Part 2: Australian Government Financial Statements
23
Table 2.2: Australian Government general government sector balance sheet (continued) 2020-21 2020-21 Change on
Estimate at Outcome 2021-22
2021-22 Budget
Budget
Note $m $m $m
Provisions and payables
Superannuation liability 17 243,455 406,940 163,485
Other employee liabilities 17 33,124 37,778 4,654
Suppliers payables 18 8,507 9,894 1,387
Personal benefits payables 18 3,137 3,015 -122
Subsidies payables 18 1,090 989 -101
Grants payables 18 4,332 6,800 2,467
Other payables 18 3,302 4,782 1,480
Provisions 18 54,560 57,904 3,344
Total provisions and payables 351,507 528,102 176,596
Total liabilities 1,279,673 1,452,953 173,280
Net worth(b) -586,495 -725,230 -138,734
Net financial worth(c) -769,785 -905,924 -136,139
Net financial liabilities(d) 825,606 967,265 141,659
Net debt(e) 617,521 592,221 -25,300
(a) In the 2021-22 Budget, Australian Office of Financial Management moved from primarily using term deposits to a cash management account for investing cash for short-term liquidity management. This resulted in a decrease in investments, loans and placements and an increase in cash and deposits.
(b) Net worth equals total assets minus total liabilities. (c) Net financial worth equals total financial assets minus total liabilities. (d) Net financial liabilities equals total liabilities less financial assets other than investments in other public
sector entities. (e) Net debt is the sum of interest bearing liabilities less the sum of selected financial assets (cash and
deposits, advances paid and investments, loans and placements).

Final Budget Outcome 2020–21
24
Table 2.3: Australian Government general government sector cash flow statement(a) 2020-21 Month of 2020-21 Change on
Estimate at June 2021 Outcome 2021-22
2021-22 (b) Budget
Budget
$m $m $m $m
Cash receipts from operating activities
Taxes received 459,470 44,084 473,850 14,380
Receipts from sales of goods and services 16,381 220 16,390 9
Interest receipts 2,995 332 2,812 -183
Dividends, distributions and income tax equivalents(c) 8,493 1,005 9,757 1,264
Other receipts(d) 12,259 4,367 16,755 4,496
Total operating receipts 499,596 50,008 519,563 19,967
Cash payments for operating activities
Payments to employees(d)(e) -32,100 -5,015 -34,134 -2,034
Payments for goods and services -140,017 -12,934 -137,436 2,581
Grants and subsidies paid -281,234 -25,224 -277,677 3,558
Interest paid -17,121 -1,022 -17,102 18
Personal benefit payments -163,952 -11,453 -163,747 205
Other payments(e) -7,873 -406 -7,178 695
Total operating payments -642,297 -56,054 -637,274 5,023
Net cash flows from operating activities -142,701 -6,047 -117,711 24,990
Cash flows from investments in
non-financial assets
Sales of non-financial assets 235 172 350 115
Purchases of non-financial assets -16,056 -2,690 -14,283 1,773
Net cash flows from investments in
non-financial assets -15,821 -2,518 -13,933 1,888
Net cash flows from investments in
financial assets for policy purposes -7,286 305 -3,364 3,922
Net cash flows from investments in
financial assets for liquidity purposes 60,898 -1,290 57,614 -3,285
Cash receipts from financing activities
Borrowing 345,507 12,871 309,085 -36,422
Other financing 1,142 489 5,351 4,209
Total cash receipts from financing activities 346,649 13,359 314,436 -32,212
Cash payments for financing activities
Borrowing -197,595 -8,524 -173,144 24,451
Other financing -6,904 -781 -10,939 -4,035
Total cash payments for financing activities -204,499 -9,305 -184,083 20,416
Net cash flows from financing activities 142,150 4,055 130,353 -11,796
Net increase/(decrease) in cash held 37,240 -5,494 52,959 15,719

Part 2: Australian Government Financial Statements
25
Table 2.3: Australian Government general government sector cash flow statement (continued)(a) 2020-21 Month of 2020-21 Change on
Estimate at June 2021 Outcome 2021-22
2021-22 (b) Budget
Budget
$m $m $m $m
GFS cash surplus(+)/deficit(-)(f) -158,522 -8,564 -131,644 26,878
plus Net cash flows from financing activities for leases(g) -2,430 -235 -2,526 -96
Equals underlying cash balance(h) -160,952 -8,799 -134,171 26,781
plus Net cash flows from investments in
financial assets for policy purposes -7,286 305 -3,364 3,922
Equals headline cash balance -168,238 -8,494 -137,535 30,703
(a) A positive number denotes a cash inflow; a negative number denotes a cash outflow. (b) The month of June is derived by deducting May year-to-date published data from the annual outcome.
Statistically, June movements in some series relate to earlier published months that are not reissued; this can result in negative movements.
(c) ‘Dividends and income tax equivalents’ has been renamed to ‘dividends, distributions and income tax equivalents’ to more accurately reflect the types of receipts included in this item.
(d) As result of a voluntary accounting policy change, the pass-through of defined benefit member superannuation receipts and payments are reported on a gross basis in the cash flow statement. It was previously reported on a net basis. This change has no net impact to the underlying cash balance for 2020-21.
(e) Consistent with the ABS GFS classification, other employee related payments are classified separately from wages and salaries under other payments.
(f) GFS cash surplus/deficit equals net cash flows from operating activities and investments in non-financial assets.
(g) Principal payments on lease liabilities, which are financing cash payments, are deducted in the calculation of the underlying cash balance to maintain consistency of measure following the implementation of AASB 16.
(h) The term underlying cash balance is not used by the ABS.

Final Budget Outcome 2020–21
26
Table 2.4: Australian Government public non-financial corporations sector operating statement 2020-21 2020-21 Change on
Estimate at Outcome 2021-22
2021-22 Budget
Budget
$m $m $m
Revenue
Grants and subsidies 874 1,422 548
Sales of goods and services 17,075 17,652 577
Interest income 21 20 -2
Other 53 71 18
Total revenue 18,024 19,166 1,142
Expenses
Gross operating expenses
Wages and salaries(a) 4,603 4,504 -99
Superannuation 506 538 32
Depreciation and amortisation 4,761 4,878 117
Supply of goods and services 9,304 9,927 623
Other operating expenses(a) 825 728 -97
Total gross operating expenses 19,999 20,575 576
Interest expenses 1,788 1,783 -5
Other property expenses 241 258 17
Current transfers
Tax expenses 134 326 191
Total current transfers 134 326 191
Total expenses 22,162 22,941 779
Net operating balance -4,139 -3,775 363
Other economic flows -398 1,179 1,577
Comprehensive result – Total change in net worth
excluding contribution from owners -4,536 -2,596 1,940
Net acquisition of non-financial assets
Purchases of non-financial assets 7,101 6,354 -747
less Sales of non-financial assets 1 17 16
less Depreciation 4,761 4,878 117
plus Change in inventories 27 30 2
plus Other movements in non-financial assets 0 0 0
Total net acquisition of non-financial assets 2,366 1,488 -878
Fiscal balance (Net lending/borrowing)(b) -6,505 -5,264 1,241
(a) Consistent with the ABS GFS classification, other employee related expenses are classified separately from wages and salaries under other operating expenses. Total employee expenses equal wages and salaries plus other operating expenses.
(b) The term fiscal balance is not used by the ABS.

Part 2: Australian Government Financial Statements
27
Table 2.5: Australian Government public non-financial corporations sector balance sheet 2020-21 2020-21 Change on
Estimate at Outcome 2021-22
2021-22 Budget
Budget
$m $m $m
Assets
Financial assets
Cash and deposits 1,690 2,167 477
Investments, loans and placements 596 1,030 433
Other receivables 3,166 3,314 148
Equity investments 195 244 49
Total financial assets 5,646 6,754 1,108
Non-financial assets
Land and other fixed assets 57,614 57,488 -125
Other non-financial assets(a) 4,091 3,892 -199
Total non-financial assets 61,705 61,381 -324
Total assets 67,351 68,135 784
Liabilities
Interest bearing liabilities
Deposits held 13 18 5
Advances received and loans 28,684 28,392 -291
Lease liabilities 12,625 12,507 -118
Total interest bearing liabilities 41,322 40,917 -405
Provisions and payables
Superannuation liability 19 26 8
Other employee liabilities 2,203 1,965 -238
Other payables 5,460 5,047 -412
Other provisions(a) 679 1,101 422
Total provisions and payables 8,360 8,140 -221
Total liabilities 49,682 49,057 -625
Shares and other contributed capital 17,669 19,078 1,409
Net worth(b) 17,669 19,078 1,409
Net financial worth(c) -44,035 -42,303 1,733
Net debt(d) 39,036 37,721 -1,315
(a) Excludes the impact of commercial taxation adjustments. (b) Under AASB 1049, net worth equals total assets minus total liabilities. Under the ABS GFS, net worth
equals total assets minus total liabilities minus shares and other contributed capital. The AASB 1049 method is used in this table.
(c) Under AASB 1049, net financial worth equals total financial assets minus total liabilities. Under the ABS GFS, net financial worth equals total financial assets minus total liabilities minus shares and other contributed capital. The AASB 1049 method is used in this table.
(d) Net debt is the sum of interest bearing liabilities less the sum of selected financial assets (cash and deposits and investments, loans and placements).

Final Budget Outcome 2020–21
28
Table 2.6: Australian Government public non-financial corporations sector cash flow statement(a) 2020-21 2020-21 Change on
Estimate at Outcome 2021-22
2021-22 Budget
Budget
$m $m $m
Cash receipts from operating activities
Receipts from sales of goods and services 18,785 19,547 762
Grants and subsidies received 1,043 1,374 331
GST input credit receipts 1,237 279 -957
Other receipts 31 45 14
Total operating receipts 21,096 21,245 149
Cash payments for operating activities
Payments to employees(b) -5,011 -4,958 53
Payment for goods and services -12,091 -11,905 186
Interest paid -1,783 -1,657 126
GST payments to taxation authority -751 -351 400
Distributions paid -246 -258 -13
Other payments(b) -882 -879 3
Total operating payments -20,763 -20,009 754
Net cash flows from operating activities 333 1,236 903
Cash flows from investments in non-financial assets
Sales of non-financial assets 3 19 15
Purchases of non-financial assets -6,306 -6,189 118
Net cash flows from
investments in non-financial assets -6,303 -6,170 133
Net cash flows from investments in financial assets
for policy purposes -4 -1 3
Net cash flows from investments in financial assets
for liquidity purposes -442 -190 252
Net cash flows from financing activities
Borrowing (net) 3,622 3,226 -395
Other financing (net) 2,223 1,805 -419
Net cash flows from financing activities 5,845 5,031 -814
Net increase/(decrease) in cash held -571 -94 477
Cash at the beginning of the year 2,261 2,261 0
Cash at the end of the year 1,690 2,167 477
GFS cash surplus(+)/deficit(-)(c) -5,970 -4,934 1,036
plus Net cash flows from financing activities for leases(d) -389 -437 -48
Adjusted GFS cash surplus(+)/deficit(-)(d) -6,360 -5,371 988
(a) A positive number denotes a cash inflow; a negative number denotes a cash outflow. (b) Consistent with the ABS GFS classification, other employee related payments are classified separately
from wages and salaries under other payments. (c) GFS cash surplus/deficit equals net cash flows from operating activities and investments in non-financial
assets. (d) To retain a consistent measure of the GFS cash surplus/deficit following the implementation of AASB 16,
its calculation is adjusted to include the principal payments on lease liabilities.

Part 2: Australian Government Financial Statements
29
Table 2.7: Australian Government total non-financial public sector operating statement 2020-21 2020-21 Change on
Estimate at Outcome 2021-22
2021-22 Budget
Budget
$m $m $m
Revenue
Taxation revenue 465,236 479,757 14,521
Sales of goods and services 32,121 32,765 644
Interest income 2,222 2,353 131
Dividend and distribution income(a) 7,797 9,899 2,101
Other 12,170 13,577 1,407
Total revenue 519,545 538,350 18,805
Expenses
Gross operating expenses
Wages and salaries(b) 26,382 25,877 -505
Superannuation 12,893 12,789 -104
Depreciation and amortisation 16,612 16,617 5
Supply of goods and services 152,874 150,522 -2,352
Other operating expenses(b) 9,230 8,700 -530
Total gross operating expenses 217,990 214,504 -3,485
Superannuation interest expense 7,004 7,177 173
Interest expenses(c) 20,899 20,270 -630
Current transfers
Current grants 167,111 166,966 -145
Subsidy expenses 85,338 85,389 51
Personal benefits 161,889 160,484 -1,405
Total current transfers 414,337 412,838 -1,499
Capital transfers(c) 17,497 16,059 -1,438
Total expenses 677,727 670,849 -6,879
Net operating balance -158,182 -132,499 25,683
Other economic flows 38,293 14,640 -23,654
Comprehensive result – Total change in net worth -119,889 -117,860 2,030
Net acquisition of non-financial assets
Purchases of non-financial assets 25,418 23,286 -2,132
less Sales of non-financial assets 230 319 90
less Depreciation 16,612 16,617 5
plus Change in inventories 2,409 2,335 -74
plus Other movements in non-financial assets 0 3 3
Total net acquisition of non-financial assets 10,986 8,688 -2,298
Fiscal balance (Net lending/borrowing)(d) -169,168 -141,187 27,981
(a) ‘Dividend income’ has been renamed ‘dividend and distribution income’ to more accurately reflect the transactions included in this item.
(b) Consistent with the ABS GFS classification, other employee related expenses are classified separately from wages and salaries under other operating expenses. Total employee expenses equal wages and salaries plus other operating expenses.
(c) From the 2021-22 Budget, the value of debt not expected to be repaid (DNER) on initial recognition of income contingent concessional loans is reported as a mutually agreed write-down, which is a form of capital transfer. It was previously reported as other financing costs.
(d) The term fiscal balance is not used by the ABS.

Final Budget Outcome 2020–21
30
Table 2.8: Australian Government total non-financial public sector balance sheet 2020-21 2020-21 Change on
Estimate at Outcome 2021-22
2021-22 Budget
Budget
$m $m $m
Assets
Financial assets
Cash and deposits(a) 48,383 64,576 16,193
Advances paid 68,047 67,931 -116
Investments, loans and placements(a) 182,293 189,829 7,536
Other receivables 69,606 69,612 6
Equity investments 97,852 110,372 12,519
Total financial assets 466,181 502,320 36,138
Non-financial assets
Land and other fixed assets 230,549 227,506 -3,044
Other non-financial assets 14,487 14,608 120
Total non-financial assets 245,037 242,113 -2,923
Total assets 711,218 744,433 33,215
Liabilities
Interest bearing liabilities
Deposits held 496 613 116
Government securities 891,811 888,419 -3,391
Advances received and loans 30,820 31,298 478
Lease liabilities 32,145 31,939 -207
Total interest bearing liabilities 955,273 952,269 -3,004
Provisions and payables
Superannuation liability 243,474 406,967 163,493
Other employee liabilities 35,327 39,743 4,416
Other payables 24,751 30,370 5,620
Other provisions 55,233 58,471 3,238
Total provisions and payables 358,784 535,551 176,766
Total liabilities 1,314,057 1,487,819 173,762
Net worth(b) -602,839 -743,386 -140,547
Net financial worth(c) -847,876 -985,499 -137,624
Net debt(d) 656,550 629,933 -26,617
(a) In the 2021-22 Budget, Australian Office of Financial Management moved from primarily using term deposits to a cash management account for investing cash for short-term liquidity management. This resulted in a decrease in investments, loans and placements and an increase in cash and deposits.
(b) Under AASB 1049, net worth equals total assets minus total liabilities. Under the ABS GFS, net worth equals total assets minus total liabilities minus shares and other contributed capital. The AASB 1049 method is used in this table.
(c) Under AASB 1049, net financial worth equals total financial assets minus total liabilities. Under the ABS GFS, net financial worth equals total financial assets minus total liabilities minus shares and other contributed capital. The AASB 1049 method is used in this table.
(d) Net debt is the sum of interest bearing liabilities less the sum of selected financial assets (cash and deposits, advances paid and investments, loans and placements).

Part 2: Australian Government Financial Statements
31
Table 2.9: Australian Government total non-financial public sector cash flow statement(a) 2020-21 2020-21 Change on
Estimate at Outcome 2021-22
2021-22 Budget
Budget
$m $m $m
Cash receipts from operating activities
Taxes received 459,369 473,762 14,393
Receipts from sales of goods and services 32,245 33,477 1,232
Interest receipts 2,327 2,131 -196
Dividends, distributions and income tax equivalents(b) 8,252 9,500 1,248
Other receipts(c) 12,082 16,702 4,620
Total operating receipts 514,275 535,572 21,297
Cash payments for operating activities
Payments to employees(c)(d) -37,111 -39,088 -1,977
Payments for goods and services -149,162 -146,951 2,210
Grants and subsidies paid -279,608 -276,309 3,300
Interest paid -18,212 -18,069 143
Personal benefit payments -163,952 -163,747 205
Other payments(d) -8,576 -7,885 692
Total operating payments -656,621 -652,049 4,573
Net cash flows from operating activities -142,347 -116,477 25,870
Cash flows from investments in non-financial assets
Sales of non-financial assets 238 369 130
Purchases of non-financial assets -22,362 -20,472 1,891
Net cash flows from
investments in non-financial assets -22,124 -20,103 2,021
Net cash flows from investments in financial assets
for policy purposes -10,224 -7,533 2,692
Net cash flows from investments in financial assets
for liquidity purposes 60,460 57,424 -3,035
Net cash flows from financing activities
Borrowing (net) 157,076 145,422 -11,654
Other financing (net) -6,167 -5,868 300
Net cash flows from financing activities 150,908 139,554 -11,354
Net increase/(decrease) in cash held 36,672 52,865 16,193
Cash at the beginning of the year 11,711 11,711 0
Cash at the end of the year 48,383 64,576 16,193

Final Budget Outcome 2020–21
32
Table 2.9: Australian Government total non-financial public sector cash flow statement (continued)(a) 2020-21 2020-21 Change on
Estimate at Outcome 2021-22
2021-22 Budget
Budget
$m $m $m
GFS cash surplus(+)/deficit(-)(e) -164,471 -136,580 27,891
plus Net cash flows from financing activities for leases(f) -2,817 -2,963 -146
Adjusted GFS cash surplus(+)/deficit(-)(f) -167,289 -139,544 27,745
(a) A positive number denotes a cash inflow; a negative number denotes a cash outflow. (b) ‘Dividends and income tax equivalents’ has been renamed to ‘dividends, distributions and income tax
equivalents’ to more accurately reflect the types of receipts included in this item. (c) As result of a voluntary accounting policy change, the pass-through of defined benefit member
superannuation receipts and payments are reported on a gross basis in the cash flow statement. It was previously reported on a net basis. This change has no net impact to the underlying cash balance for 2020-21.
(d) Consistent with the ABS GFS classification, other employee related payments are classified separately from wages and salaries under other payments.
(e) GFS cash surplus/deficit equals net cash flows from operating activities and investments in non-financial assets.
(f) To retain a consistent measure of the GFS cash surplus/deficit following the implementation of AASB 16, its calculation is adjusted to include the principal payments on lease liabilities.

Part 2: Australian Government Financial Statements
33
Table 2.10: Australian Government public financial corporations sector operating statement
2020-21 2020-21 Change on
Estimate at Outcome 2021-22
2021-22 Budget
Budget
$m $m $m
Revenue
Grants and subsidies 156 158 2
Sales of goods and services 768 776 8
Interest income 4,735 4,505 -230
Other 94 109 15
Total revenue 5,753 5,548 -206
Expenses
Gross operating expenses
Wages and salaries(a) 209 233 24
Superannuation 77 105 29
Depreciation and amortisation 69 79 10
Supply of goods and services 513 428 -85
Other operating expenses(a) 56 50 -7
Total gross operating expenses 923 895 -28
Interest expenses 378 316 -63
Other property expenses 2,116 2,687 571
Current transfers
Tax expenses 6 7 1
Total current transfers 6 7 1
Total expenses 3,424 3,905 481
Net operating balance 2,329 1,643 -686
Other economic flows -11,968 -8,374 3,593
Comprehensive result – Total change in net worth
excluding contribution from owners -9,638 -6,732 2,907
Net acquisition of non-financial assets
Purchases of non-financial assets 2 76 74
less Sales of non-financial assets 0 1 1
less Depreciation 69 79 10
plus Change in inventories -42 18 60
plus Other movements in non-financial assets 0 0 0
Total net acquisition of non-financial assets -109 14 123
Fiscal balance (Net lending/borrowing)(b) 2,438 1,629 -809
(a) Consistent with the ABS GFS classification, other employee related expenses are classified separately from wages and salaries under other operating expenses. Total employee expenses equal wages and salaries plus other operating expenses.
(b) The term fiscal balance is not used by the ABS.

Final Budget Outcome 2020–21
34
Table 2.11: Australian Government public financial corporations sector balance sheet 2020-21 2020-21 Change on
Estimate at Outcome 2021-22
2021-22 Budget
Budget
$m $m $m
Assets
Financial assets
Cash and deposits 664 896 233
Investments, loans and placements(a) 405,291 544,956 139,665
Other receivables 164 252 88
Equity investments 726 818 91
Total financial assets 406,845 546,922 140,077
Non-financial assets
Land and other fixed assets 913 939 26
Other non-financial assets(b) 92 93 1
Total non-financial assets 1,005 1,032 27
Total assets 407,850 547,954 140,104
Liabilities
Interest bearing liabilities
Deposits held(a) 371,800 511,095 139,294
Borrowing 8,666 6,693 -1,973
Total interest bearing liabilities 380,466 517,788 137,322
Provisions and payables
Superannuation liability 944 539 -405
Other employee liabilities 216 227 11
Other payables 3,179 3,409 230
Other provisions(b) 1,786 1,772 -14
Total provisions and payables 6,125 5,947 -178
Total liabilities 386,591 523,734 137,144
Shares and other contributed capital 21,260 24,220 2,960
Net worth(c) 21,260 24,220 2,960
Net financial worth(d) 20,254 23,188 2,933
Net debt(e) -25,489 -28,065 -2,576
(a) Reserve Bank of Australia budget estimates are based on assumptions subject to greater variability due to the nature of the business and exposure to external factors, such as foreign exchange and yield movements.
(b) Excludes the impact of commercial taxation adjustments. (c) Under AASB 1049, net worth equals total assets minus total liabilities. Under the ABS GFS, net worth
equals total assets minus total liabilities minus shares and other contributed capital. The AASB 1049 method is used in this table.
(d) Under AASB 1049, net financial worth equals total financial assets minus total liabilities. Under the ABS GFS, net financial worth equals total financial assets minus total liabilities minus shares and other contributed capital. The AASB 1049 method is used in this table.
(e) Net debt is the sum of interest bearing liabilities less the sum of selected financial assets (cash and deposits and investments, loans and placements).
Part 2: Australian Government Financial Statements
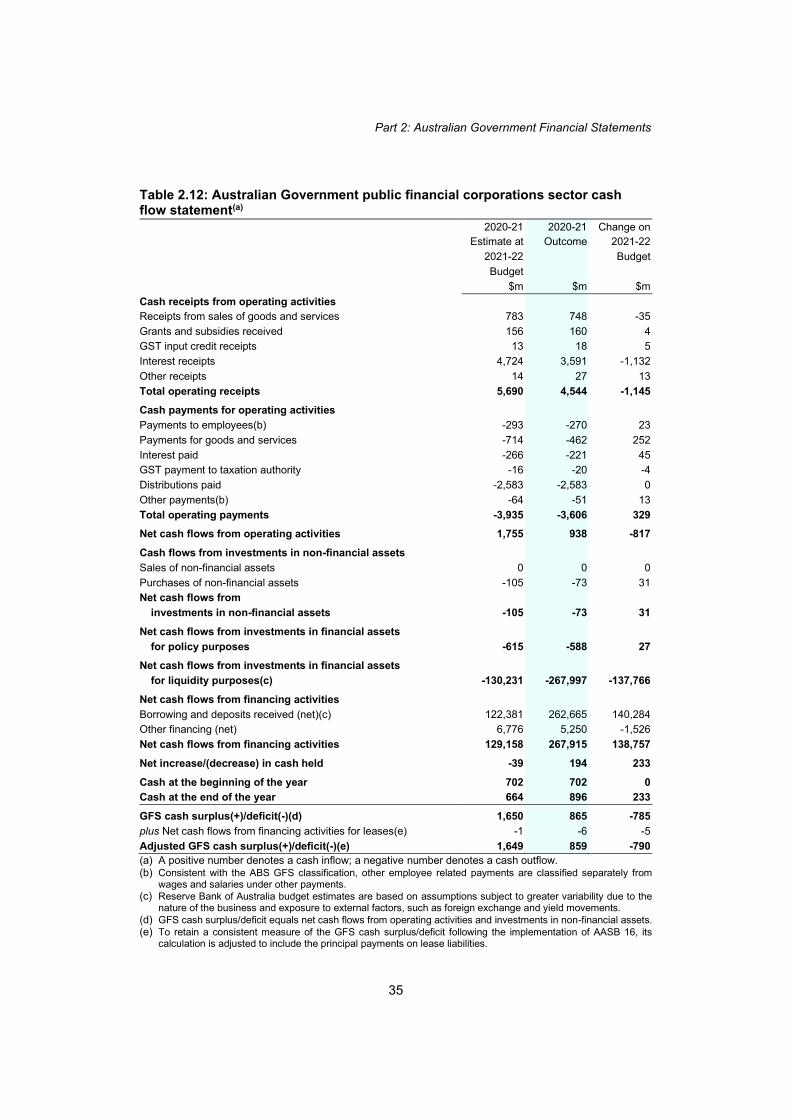
35
Table 2.12: Australian Government public financial corporations sector cash flow statement(a) 2020-21 2020-21 Change on
Estimate at Outcome 2021-22
2021-22 Budget
Budget
$m $m $m
Cash receipts from operating activities
Receipts from sales of goods and services 783 748 -35
Grants and subsidies received 156 160 4
GST input credit receipts 13 18 5
Interest receipts 4,724 3,591 -1,132
Other receipts 14 27 13
Total operating receipts 5,690 4,544 -1,145
Cash payments for operating activities
Payments to employees(b) -293 -270 23
Payments for goods and services -714 -462 252
Interest paid -266 -221 45
GST payment to taxation authority -16 -20 -4
Distributions paid -2,583 -2,583 0
Other payments(b) -64 -51 13
Total operating payments -3,935 -3,606 329
Net cash flows from operating activities 1,755 938 -817
Cash flows from investments in non-financial assets
Sales of non-financial assets 0 0 0
Purchases of non-financial assets -105 -73 31
Net cash flows from
investments in non-financial assets -105 -73 31
Net cash flows from investments in financial assets
for policy purposes -615 -588 27
Net cash flows from investments in financial assets
for liquidity purposes(c) -130,231 -267,997 -137,766
Net cash flows from financing activities
Borrowing and deposits received (net)(c) 122,381 262,665 140,284
Other financing (net) 6,776 5,250 -1,526
Net cash flows from financing activities 129,158 267,915 138,757
Net increase/(decrease) in cash held -39 194 233
Cash at the beginning of the year 702 702 0
Cash at the end of the year 664 896 233
GFS cash surplus(+)/deficit(-)(d) 1,650 865 -785
plus Net cash flows from financing activities for leases(e) -1 -6 -5
Adjusted GFS cash surplus(+)/deficit(-)(e) 1,649 859 -790
(a) A positive number denotes a cash inflow; a negative number denotes a cash outflow. (b) Consistent with the ABS GFS classification, other employee related payments are classified separately from
wages and salaries under other payments.
(c) Reserve Bank of Australia budget estimates are based on assumptions subject to greater variability due to the nature of the business and exposure to external factors, such as foreign exchange and yield movements.
(d) GFS cash surplus/deficit equals net cash flows from operating activities and investments in non-financial assets.
(e) To retain a consistent measure of the GFS cash surplus/deficit following the implementation of AASB 16, its calculation is adjusted to include the principal payments on lease liabilities.

Final Budget Outcome 2020–21
36
Notes to the general government sector financial statements
Note 1: External reporting standards and accounting policies
The Charter of Budget Honesty Act 1998 (the Charter) requires that the Final Budget
Outcome (FBO) be based on external reporting standards and that departures from
applicable external reporting standards be identified.
The external standards used for the FBO reporting purposes are:
• the Australian Bureau of Statistics’ (ABS) accrual Government Finance Statistics
(GFS) publication, Australian System of Government Finance Statistics: Concepts, Sources
and Methods, 2015 (cat. no. 5514.0), which is based on the International Monetary
Fund (IMF) accrual GFS framework
• the Australian Accounting Standards (AAS), issued by the Australian Accounting
Standards Board (AASB), which includes International Financial Reporting
Standards as adopted in Australia for use by the not-for-profit sector and specific
standards such as AASB 1049 Whole of Government and General Government Sector
Financial Reporting (AASB 1049).
The financial statements have been prepared on an accrual basis that complies with both
the ABS GFS and AAS, except for departures disclosed at Note 2. A more detailed
description of the AAS and the ABS GFS frameworks, in addition to definitions of key
terms used in these frameworks, can be found in Attachment A. Detailed accounting
policies, as well as a set of notes and other disclosures as required by AAS, are disclosed
in the Australian Government Consolidated Financial Statements (CFS).
Fiscal reporting focuses on the general government sector (GGS). The GGS provides
public services that are mainly non-market in nature and for the collective consumption
of the community, or involve the transfer or redistribution of income. These services are
largely financed through taxes and other compulsory levies. This sector comprises all
government departments, offices and some other bodies. In preparing financial
statements for the GGS, all material transactions and balances between entities within
the GGS have been eliminated.
The statements for the GGS are based on audit-cleared financial statements for material
entities with the exception of the Department of Defence.
The Government’s key fiscal aggregates are based on the ABS GFS concepts and
definitions, including the ABS GFS cash surplus/deficit and net financial worth.
AASB 1049 requires the disclosure of other ABS GFS fiscal aggregates, including the net
operating balance, net lending/borrowing (fiscal balance) and net worth. In addition to
these ABS GFS aggregates, the Uniform Presentation Framework (UPF) requires
disclosure of net debt, net financial worth and net financial liabilities.
Part 2: Australian Government Financial Statements
37
AASB 1049 and the UPF also provide a basis for reporting the public non-financial
corporations (PNFC) and public financial corporations (PFC) sectors and the total
non-financial public sector (NFPS).
AASB 1049 requires disaggregated information, by ABS GFS function, for expenses and
total assets to be disclosed where they are reliably attributable. The ABS GFS does not
require total assets to be attributed to functions. In accordance with the ABS GFS,
disaggregated information for expenses and net acquisition of non-financial assets by
function is disclosed in Part 1. In accordance with the UPF, purchases of non-financial
assets by function are also disclosed in Part 1.
AASB 1049 also requires the FBO and CFS to be released at the same time. The Charter
requires the FBO to be released before the end of three months after the end of the
financial year, whereas the CFS is not released until it is audit cleared, generally around
December each year.
AASB 1055 Budgetary Reporting requires major variances between original budget
estimates and outcomes to be explained in the financial statements. Explanations of
variances in fiscal balance, revenue, expenses, net capital investment, cash flows, net
debt, net financial worth and net worth for the 2020-21 year from the 2020-21 Budget to
the Mid-Year Economic and Fiscal Outlook 2020-21 (MYEFO) are discussed in Part 3 of the
2020-21 MYEFO. Explanations of variances for the 2020-21 year from MYEFO to the
2021-22 Budget are disclosed in Statement 3 of 2021-22 Budget Paper No.1, Budget
Strategy and Outlook. Explanations of variances from the 2021-22 Budget to the
Final Budget Outcome for 2020-21 are disclosed in Part 1.
Note 2: Departures from external reporting standards
The Charter requires that departures from applicable external reporting standards be
identified. The major differences between AAS and the ABS GFS treatments of
transactions are outlined in Table 2.13.
AASB 1049 requires AAS measurement of items to be disclosed on the face of the
financial statements with reconciliation to the ABS GFS measurement of key fiscal
aggregates, where different, in notes to the financial statements. Only one measure of
each aggregate has been included on the face statements to avoid confusion.
Further information on the differences between the two systems is provided in the ABS
publication Australian System of Government Finance Statistics: Concepts, Sources and
Methods, 2015 (cat. no. 5514.0).

Final Budget Outcome 2020–21
38
Table 2.13: Major differences between AAS and ABS GFS
Issue AAS treatment ABS GFS treatment Treatment adopted
Circulating coins – seigniorage
The profit between the cost and sale of circulating coins (seigniorage) is treated as revenue.
Circulating coins is treated as a liability, and the cost of producing the coins is treated as an expense.
AAS
Valuation of loans Changes in the valuation of loans are treated as a revenue or an expense.
In some circumstances recognition as a revenue or an expense is delayed until the loan ends or is transferred.
Changes in the valuation of loans (excluding mutually agreed write-downs) are treated as an other economic flow.
ABS GFS
Timing recognition of Boosting Cash Flow for Employers
Expense recognition based on underlying economic activity that gives rise to the Cash Flow Boost payment
Recognised when the businesses receive payments after submitting their activity statements and having met all requirements.
AAS
Leases AASB 16 introduced a single lease accounting framework for lessees, which replaced the distinction between operating and finance leases. Right of use assets and lease liabilities are recognised on the balance sheets for leases that were previously accounted for as operating expense.
The distinction between operating leases and finance leases will be continued for lessees.
AAS
Concessional loans
Concessional elements are treated as an expense on initial recognition and unwound over the loan term.
Concessional elements are treated as an other economic flow.
AAS
Investment in other public sector entities
Valued at fair value in the balance sheet as long as it can be reliably measured, otherwise net assets is permissible.
Unlisted entities valued based on their net assets in the balance sheet.
AAS
Provision for restoration, decommissioning and make-good
Capitalised when the asset is acquired.
Capitalised when make-good activity takes place.
AAS
Renewable Energy Certificates (RECs)
The issuance and registration of RECs is considered to be an administrative function and does not result in the recognition of assets or liabilities and, consequently, no revenue or expenses are recognised.
The issuance and registration of RECs is considered to be government financial transactions resulting in the recognition of assets, liabilities, revenue and expenses.
AAS
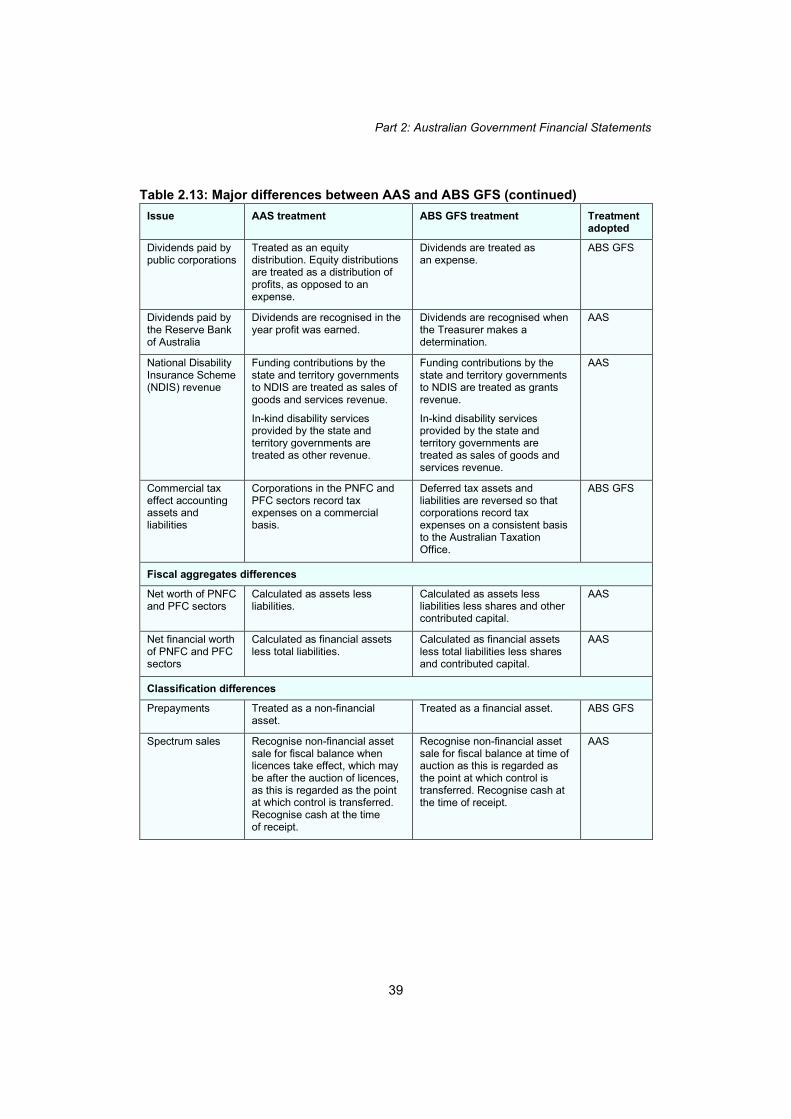
Part 2: Australian Government Financial Statements
39
Table 2.13: Major differences between AAS and ABS GFS (continued)
Issue AAS treatment ABS GFS treatment Treatment adopted
Dividends paid by public corporations
Treated as an equity distribution. Equity distributions are treated as a distribution of profits, as opposed to an expense.
Dividends are treated as an expense.
ABS GFS
Dividends paid by the Reserve Bank of Australia
Dividends are recognised in the year profit was earned.
Dividends are recognised when the Treasurer makes a determination.
AAS
National Disability Insurance Scheme (NDIS) revenue
Funding contributions by the state and territory governments to NDIS are treated as sales of goods and services revenue.
In-kind disability services provided by the state and territory governments are treated as other revenue.
Funding contributions by the state and territory governments to NDIS are treated as grants revenue.
In-kind disability services provided by the state and territory governments are treated as sales of goods and services revenue.
AAS
Commercial tax effect accounting assets and liabilities
Corporations in the PNFC and PFC sectors record tax expenses on a commercial basis.
Deferred tax assets and liabilities are reversed so that corporations record tax expenses on a consistent basis to the Australian Taxation Office.
ABS GFS
Fiscal aggregates differences
Net worth of PNFC and PFC sectors
Calculated as assets less liabilities.
Calculated as assets less liabilities less shares and other contributed capital.
AAS
Net financial worth of PNFC and PFC sectors
Calculated as financial assets less total liabilities.
Calculated as financial assets less total liabilities less shares and contributed capital.
AAS
Classification differences
Prepayments Treated as a non-financial asset.
Treated as a financial asset. ABS GFS
Spectrum sales Recognise non-financial asset sale for fiscal balance when licences take effect, which may be after the auction of licences, as this is regarded as the point at which control is transferred. Recognise cash at the time of receipt.
Recognise non-financial asset sale for fiscal balance at time of auction as this is regarded as the point at which control is transferred. Recognise cash at the time of receipt.
AAS

Final Budget Outcome 2020–21
40
Note 3: Taxation revenue by type 2020-21 2020-21 Change on
Estimate at Outcome 2021-22
2021-22 Budget
Budget
$m $m $m
Individuals and other withholding taxes
Gross income tax withholding 217,500 221,704 4,204
Gross other individuals 49,500 50,225 725
less: Refunds 36,000 36,265 265
Total individuals and other withholding taxation 231,000 235,664 4,664
Fringe benefits tax 4,040 3,501 -539
Company tax 94,300 99,148 4,848
Superannuation fund taxes 11,680 13,037 1,357
Petroleum resource rent tax 840 897 57
Income taxation revenue 341,860 352,246 10,386
Goods and services tax 71,080 74,688 3,608
Wine equalisation tax 1,070 1,101 31
Luxury car tax 800 900 100
Excise and customs duty
Petrol 5,850 5,995 145
Diesel 12,480 12,761 281
Other fuel products 1,560 1,582 22
Tobacco 15,080 14,264 -816
Beer 2,550 2,547 -3
Spirits 3,070 3,161 91
Other alcoholic beverages(a) 1,270 1,304 34
Other customs duty
Textiles, clothing and footwear 170 178 8
Passenger motor vehicles 340 372 32
Other imports 1,180 1,191 11
less: Refunds and drawbacks 790 729 -61
Total excise and customs duty 42,760 42,626 -134
Major bank levy 1,640 1,572 -68
Agricultural levies 509 534 25
Other taxes 6,052 6,555 502
Mirror taxes 583 610 28
less: Transfers to states in relation to mirror tax revenue 583 610 28
Mirror tax revenue 0 0 0
Indirect taxation revenue 123,911 127,975 4,064
Taxation revenue 465,771 480,221 14,450
Memorandum:
Total excise 23,930 24,503 573
Total customs duty 18,830 18,123 -707
(a) ‘Other alcoholic beverages’ are those not exceeding 10 per cent by volume of alcohol (excluding beer, brandy and wine).

Part 2: Australian Government Financial Statements
41
Note 3(a): Taxation revenue by source 2020-21 2020-21 Change on
Estimate at Outcome 2021-22
2021-22 Budget
Budget
$m $m $m
Taxes on income, profits and capital gains
Income and capital gains levied on individuals 235,040 239,169 4,129
Income and capital gains levied on enterprises 106,820 113,077 6,257
Total taxes on income, profits and capital gains 341,860 352,246 10,386
Taxes on employers’ payroll and labour force 1,350 1,683 333
Taxes on the provision of goods and services
Sales/goods and services tax 72,950 76,689 3,739
Excises and levies 24,439 25,037 598
Taxes on international trade 18,830 18,123 -707
Total taxes on the provision of goods and services 116,219 119,849 3,629
Taxes on the use of goods and performance of activities 6,342 6,444 101
Total taxation revenue 465,771 480,221 14,450
Note 4: Sales of goods and services revenue 2020-21 2020-21 Change on
Estimate at Outcome 2021-22
2021-22 Budget
Budget
$m $m $m
Sales of goods 1,352 1,332 -19
Rendering of services 12,668 12,534 -134
Lease rental 92 397 306
Fees from regulatory services 1,836 1,759 -77
Total sales of goods and services revenue 15,947 16,022 76

Final Budget Outcome 2020–21
42
Note 5: Interest and dividend and distribution revenue 2020-21 2020-21 Change on
Estimate at Outcome 2021-22
2021-22 Budget
Budget
$m $m $m
Interest from other governments
State and territory debt 15 16 2
Housing agreements 81 81 0
Total interest from other governments 96 97 2
Interest from other sources
Advances 1,019 1,074 55
Deposits 196 166 -30
Indexation of HELP receivable and other
student loans 280 364 85
Other 1,310 1,331 21
Total interest from other sources 2,805 2,935 130
Total interest 2,901 3,033 132
Dividends and distributions(a)
Dividends from other public sector entities 2,368 2,962 594
Other dividends and distributions 5,670 7,194 1,525
Total dividends and distributions 8,038 10,156 2,119
Total interest and dividend and distribution revenue 10,939 13,189 2,250
(b) ‘Dividends’ has been renamed to ‘dividends and distributions’ to more accurately reflect the transactions included in this item.
Note 6: Other sources of non-taxation revenue 2020-21 2020-21 Change on
Estimate at Outcome 2021-22
2021-22 Budget
Budget
$m $m $m
Industry contributions 170 199 29
Royalties 573 651 78
Seigniorage 69 87 18
Other 11,419 12,643 1,224
Total other sources of non-taxation revenue 12,231 13,580 1,349

Part 2: Australian Government Financial Statements
43
Note 7: Employee and superannuation expense 2020-21 2020-21 Change on
Estimate at Outcome 2021-22
2021-22 Budget
Budget
$m $m $m
Wages and salaries expenses 21,779 21,373 -406
Other operating expenses
Leave and other entitlements 2,988 2,542 -446
Separations and redundancies 69 178 109
Workers compensation premiums and claims 2,906 2,779 -127
Other 2,442 2,473 31
Total other operating expenses 8,405 7,972 -433
Superannuation expenses
Superannuation 12,387 12,256 -131
Superannuation interest cost 7,004 7,177 173
Total superannuation expenses 19,390 19,432 42
Total employee and superannuation expense 49,574 48,777 -797
Note 8: Depreciation and amortisation expense 2020-21 2020-21 Change on
Estimate at Outcome 2021-22
2021-22 Budget
Budget
$m $m $m
Depreciation
Specialist military equipment 4,749 4,244 -505
Buildings 3,808 4,124 316
Other infrastructure, plant and equipment 2,066 2,213 147
Heritage and cultural assets 76 75 -1
Other 7 4 -3
Total depreciation(a) 10,707 10,661 -46
Total amortisation 1,144 1,078 -66
Total depreciation and amortisation expense 11,851 11,738 -112
Memorandum:
Depreciation relating to right of use assets
Specialist military equipment 31 31 0
Buildings 2,247 2,507 260
Other infrastructure, plant and equipment 342 380 38
Other 7 4 -3
Total depreciation of right of use assets 2,627 2,922 295
(a) Includes depreciation of right of use (leased) assets, resulting from implementation of AASB 16.

Final Budget Outcome 2020–21
44
Note 9: Supply of goods and services expense 2020-21 2020-21 Change on
Estimate at Outcome 2021-22
2021-22 Budget
Budget
$m $m $m
Supply of goods and services 38,088 38,246 158
Lease expenses 158 158 0
Personal benefits – indirect 96,339 94,457 -1,882
Health care payments 6,013 5,248 -765
Other 4,002 3,513 -489
Total supply of goods and services expense 144,601 141,622 -2,979
Note 10: Interest expense 2020-21 2020-21 Change on
Estimate at Outcome 2021-22
2021-22 Budget
Budget
$m $m $m
Interest on debt
Government securities 17,041 17,041 0
Loans 2 3 1
Other 104 68 -36
Total interest on debt 17,148 17,113 -35
Interest on lease liabilities 356 352 -5
Other financing costs(a) 2,307 1,723 -585
Total interest expense 19,812 19,187 -625
(a) From the 2021-22 Budget, the value of debt not expected to be repaid (DNER) on initial recognition of income contingent concessional loans is reported as a mutually agreed write-down, which is a form of capital transfer. It was previously reported as other financing costs.

Part 2: Australian Government Financial Statements
45
Note 11: Current and capital grants expense 2020-21 2020-21 Change on
Estimate at Outcome 2021-22
2021-22 Budget
Budget
$m $m $m
Current grants expense
State and territory governments 128,663 131,265 2,603
Private sector 13,416 12,438 -979
Overseas 4,538 4,413 -125
Non-profit organisations 5,341 5,450 109
Multi-jurisdictional sector 12,411 12,175 -236
Other 2,742 1,225 -1,517
Total current grants expense 167,111 166,966 -145
Capital grants expense
Mutually agreed write-downs(a) 2,954 2,791 -163
Other capital grants
State and territory governments 12,199 11,207 -992
Local governments 1,590 1,509 -80
Non-profit organisations 580 428 -152
Private sector 96 63 -32
Overseas 0 60 60
Other 290 239 -51
Total capital grants expense 17,709 16,298 -1,411
Total grants expense 184,820 183,264 -1,556
(a) From the 2021-22 Budget, the value of debt not expected to be repaid (DNER) on initial recognition of income contingent concessional loans is reported as a mutually agreed write-down, which is a form of capital transfer. It was previously reported as other financing costs.
Note 12: Personal benefits expense 2020-21 2020-21 Change on
Estimate at Outcome 2021-22
2021-22 Budget
Budget
$m $m $m
Social welfare – assistance to the aged 53,538 53,378 -160
Assistance to veterans and dependants 4,945 4,907 -38
Assistance to people with disabilities 28,318 28,212 -106
Assistance to families with children 31,032 30,431 -600
Assistance to the unemployed 31,240 29,692 -1,547
Student assistance 4,643 4,597 -46
Other welfare programs 964 998 34
Financial and fiscal affairs 952 879 -73
Vocational and industry training 57 31 -26
Other 6,200 7,359 1,158
Total personal benefits expense 161,889 160,484 -1,405

Final Budget Outcome 2020–21
46
Note 13: Advances paid and other receivables 2020-21 2020-21 Change on
Estimate at Outcome 2021-22
2021-22 Budget
Budget
$m $m $m
Advances paid
Loans to state and territory governments 2,199 2,233 35
Student loans 54,830 55,485 655
Other 25,551 23,981 -1,570
less Impairment allowance 344 295 -49
Total advances paid 82,235 81,404 -832
Other receivables
Goods and services receivable 1,470 1,145 -325
Recoveries of benefit payments 5,779 5,581 -198
Taxes receivable 36,510 31,398 -5,113
Prepayments 4,157 4,208 51
Other 21,876 27,216 5,340
less Impairment allowance 2,727 2,692 -35
Total other receivables 67,065 66,855 -210
Note 14: Investments, loans and placements 2020-21 2020-21 Change on
Estimate at Outcome 2021-22
2021-22 Budget
Budget
$m $m $m
Investments – deposits(a) 5,870 7,611 1,741
IMF quota 12,686 12,474 -212
Other 163,160 168,729 5,569
Total investments, loans and placements 181,717 188,815 7,098
(a) In the 2021-22 Budget, Australian Office of Financial Management moved from primarily using term deposits to a cash management account for investing cash for short-term liquidity management. This resulted in a decrease in investments, loans and placements and an increase in cash and deposits.

Part 2: Australian Government Financial Statements
47
Note 15: Non-financial assets 2020-21 2020-21 Change on
Estimate at Outcome 2021-22
2021-22 Budget
Budget
$m $m $m
Land and buildings
Land 11,817 12,068 251
Buildings 43,970 43,314 -656
Total land and buildings 55,787 55,382 -405
Plant, equipment and infrastructure
Specialist military equipment 75,854 74,479 -1,375
Other plant, equipment and infrastructure 17,615 17,704 89
Total plant, equipment and infrastructure 93,468 92,183 -1,286
Inventories
Inventories held for sale 886 852 -33
Inventories not held for sale 10,824 9,753 -1,072
Total inventories 11,710 10,605 -1,105
Intangibles
Computer software 5,380 4,998 -383
Other 4,441 4,811 371
Total intangibles 9,821 9,809 -12
Total investment properties 210 191 -19
Total biological assets 28 35 7
Total heritage and cultural assets 11,979 11,860 -119
Total assets held for sale 250 589 340
Total other non-financial assets 37 40 3
Total non-financial assets(a) 183,290 180,694 -2,596
Memorandum:
Total relating to right of use assets
Land 154 146 -8
Buildings 17,193 16,665 -528
Specialist military equipment 260 260 0
Other plant, equipment and infrastructure 1,516 1,603 87
Total right of use assets 19,123 18,673 -450
(a) Include right of use (leased) assets, resulting from implementation of AASB 16.
Note 16: Loans 2020-21 2020-21 Change on
Estimate at Outcome 2021-22
2021-22 Budget
Budget
$m $m $m
Promissory notes 9,935 10,110 176
Special drawing rights 5,951 5,852 -99
Other 459 432 -27
Total loans 16,345 16,394 49

Final Budget Outcome 2020–21
48
Note 17: Employee and superannuation liabilities 2020-21 2020-21 Change on
Estimate at Outcome 2021-22
2021-22 Budget
Budget
$m $m $m
Total superannuation liability(a) 243,455 406,940 163,485
Other employee liabilities
Leave and other entitlements 9,583 9,508 -75
Accrued salaries and wages 498 551 52
Workers compensation claims 1,903 1,939 36
Military compensation 20,428 25,163 4,735
Other 711 618 -93
Total other employee liabilities 33,124 37,778 4,654
Total employee and superannuation liabilities 276,579 444,718 168,139
(a) For budget reporting purposes, a discount rate determined by actuaries is used to value the superannuation liability. This reflects the average annual rate estimated to apply over the term of the liability and it reduces the volatility in reported liabilities that would occur from year to year if the spot rates on long-term government bonds were used. Consistent with AAS, the superannuation liability for the 2020-21 FBO was calculated using the spot rates on long-term government bonds as at 30 June 2021 that best matched each individual scheme’s liability duration. These rates were between 1.6 and 2.3 per cent per annum.

Part 2: Australian Government Financial Statements
49
Note 18: Provisions and payables 2020-21 2020-21 Change on
Estimate at Outcome 2021-22
2021-22 Budget
Budget
$m $m $m
Suppliers payable
Trade creditors 5,863 7,031 1,168
Lease rental payable 0 1 1
Personal benefits payables – indirect 2,019 1,377 -641
Other creditors 625 1,485 859
Total suppliers payables 8,507 9,894 1,387
Total personal benefits payables – direct 3,137 3,015 -122
Total subsidies payable 1,090 989 -101
Grants payables
State and territory governments 42 3,906 3,864
Non-profit organisations 162 208 45
Private sector 450 307 -143
Overseas 1,995 2,057 62
Local governments 8 7 0
Other 1,675 314 -1,361
Total grants payables 4,332 6,800 2,467
Total other payables 3,302 4,782 1,480
Provisions
Provisions for tax refunds 3,105 3,191 87
Grants provisions 8,415 8,059 -356
Personal benefits provisions – direct 7,758 7,448 -309
Personal benefits provisions – indirect 3,596 3,206 -389
Provisions for subsidies 5,058 5,270 212
Other 26,629 30,730 4,101
Total provisions 54,560 57,904 3,344
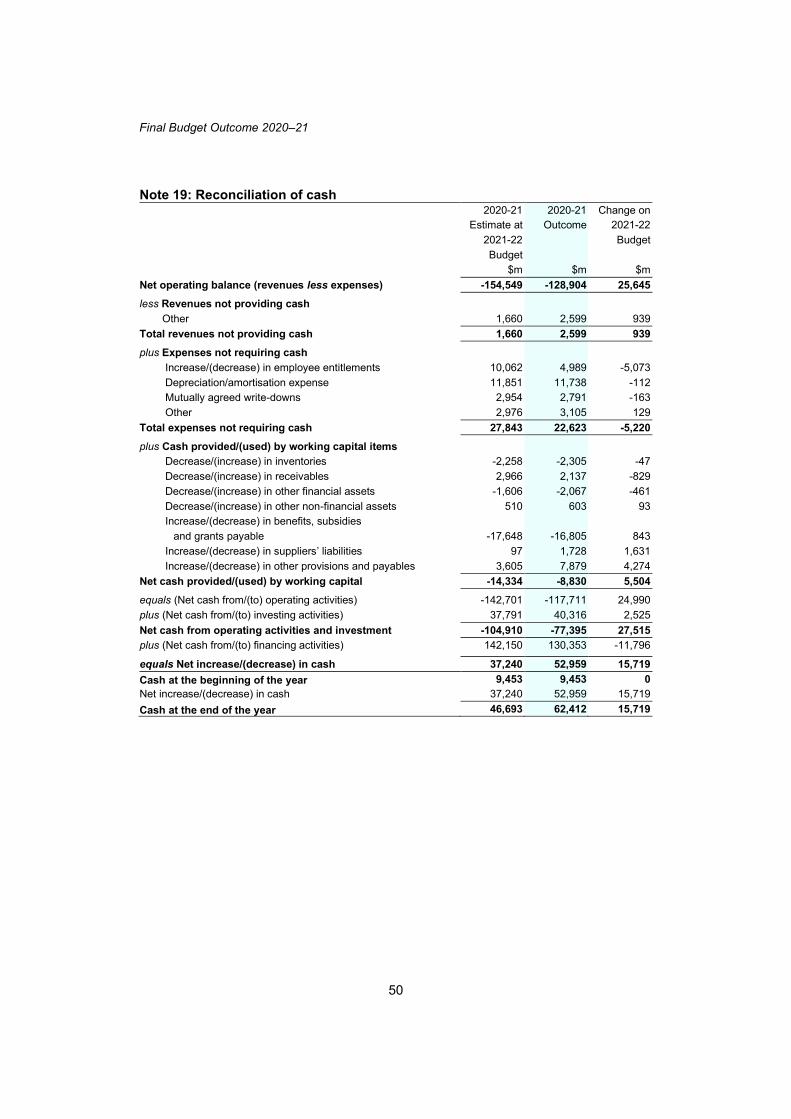
Final Budget Outcome 2020–21
50
Note 19: Reconciliation of cash 2020-21 2020-21 Change on
Estimate at Outcome 2021-22
2021-22 Budget
Budget
$m $m $m
Net operating balance (revenues less expenses) -154,549 -128,904 25,645
less Revenues not providing cash
Other 1,660 2,599 939
Total revenues not providing cash 1,660 2,599 939
plus Expenses not requiring cash
Increase/(decrease) in employee entitlements 10,062 4,989 -5,073
Depreciation/amortisation expense 11,851 11,738 -112
Mutually agreed write-downs 2,954 2,791 -163
Other 2,976 3,105 129
Total expenses not requiring cash 27,843 22,623 -5,220
plus Cash provided/(used) by working capital items
Decrease/(increase) in inventories -2,258 -2,305 -47
Decrease/(increase) in receivables 2,966 2,137 -829
Decrease/(increase) in other financial assets -1,606 -2,067 -461
Decrease/(increase) in other non-financial assets 510 603 93
Increase/(decrease) in benefits, subsidies
and grants payable -17,648 -16,805 843
Increase/(decrease) in suppliers’ liabilities 97 1,728 1,631
Increase/(decrease) in other provisions and payables 3,605 7,879 4,274
Net cash provided/(used) by working capital -14,334 -8,830 5,504
equals (Net cash from/(to) operating activities) -142,701 -117,711 24,990
plus (Net cash from/(to) investing activities) 37,791 40,316 2,525
Net cash from operating activities and investment -104,910 -77,395 27,515
plus (Net cash from/(to) financing activities) 142,150 130,353 -11,796
equals Net increase/(decrease) in cash 37,240 52,959 15,719
Cash at the beginning of the year 9,453 9,453 0
Net increase/(decrease) in cash 37,240 52,959 15,719
Cash at the end of the year 46,693 62,412 15,719

Part 2: Australian Government Financial Statements
51
Attachment A
Financial reporting standards and budget concepts
The Final Budget Outcome primarily focuses on the financial performance and position
of the general government sector (GGS). The GGS provides public services that are
mainly non-market in nature and for the collective consumption of the community, or
involve the transfer or redistribution of income. These services are largely financed
through taxes and other compulsory levies. AASB 1049 recognises the GGS as a
reporting entity.
AASB 1049 Conceptual framework
AASB 1049 seeks to ‘harmonise’ the ABS GFS and AAS.
The reporting framework for AASB 1049 requires the preparation of accrual-based
general purpose financial reports, showing government assets, liabilities, revenue,
expenses and cash flows. GGS reporting under AASB 1049 aims to provide users with
information about the stewardship of each government in relation to its GGS and
accountability for the resources entrusted to it; information about the financial position,
performance and cash flows of each government’s GGS; and information that facilitates
assessments of the macroeconomic impact. AASB 1049 also provides a basis for
whole-of-government reporting, including for the PNFC and PFC sectors.
AASB 1049 has adopted the AAS conceptual framework and principles for the
recognition of assets, liabilities, revenues and expenses and their presentation,
measurement and disclosure. In addition, AASB 1049 has broadly adopted the ABS GFS
conceptual framework for presenting government financial statements. In particular,
AASB 1049 requires the GGS to prepare a separate set of financial statements, overriding
AASB 10 Consolidated Financial Statements. AASB 1049 also follows the ABS GFS by
requiring changes in net worth to be split into either transactions or ‘other economic
flows’ and for this to be presented in a single operating statement. AASB 1049 is
therefore broadly consistent with international statistical standards and the
International Monetary Fund’s (IMF) Government Finance Statistics Manual 2014.1
All financial data presented in the financial statements are recorded as either stocks
(assets and liabilities) or flows (classified as either transactions or ‘other economic
flows’). Transactions result from a mutually agreed interaction between economic
entities. Despite their compulsory nature, taxes are transactions deemed to occur by
mutual agreement between the government and the taxpayer. Transactions that increase
1 Additional information on the Australian accrual GFS framework is available in the ABS
publication Australian System of Government Finance Statistics: Concepts, Sources and Methods, 2015 (cat. no. 5514.0).

Final Budget Outcome 2020–21
52
or decrease net worth (assets less liabilities) are reported as revenues and expenses
respectively in the operating statement.2
A change to the value or volume of an asset or liability that does not result from a
transaction is an ‘other economic flow’. This can include changes in values from market
prices, most actuarial valuations and exchange rates, and changes in volumes from
discoveries, depletion and destruction. All ‘other economic flows’ are reported in the
operating statement.
Consistent with the ABS GFS framework, and in general AAS, the financial statements
record flows in the period in which they occur. As a result, prior period outcomes may
be revised for classification changes relating to information that could reasonably have
been expected to be known in the past, is material in at least one of the affected periods
and can be reliably assigned to the relevant period(s).
Operating statement
The operating statement presents details of transactions in revenues, expenses, the net
acquisition of non-financial assets (net capital investment) and other economic flows for
an accounting period.
Revenues arise from transactions that increase net worth and expenses arise from
transactions that decrease net worth. Revenues less expenses gives the net operating
balance. The net operating balance is similar to the National Accounts concept of
government saving plus capital transfers.
The net acquisition of non-financial assets (net capital investment) equals gross fixed
capital formation, less depreciation, plus changes (investment) in inventories, plus other
transactions in non-financial assets.
‘Other economic flows’ are presented in the operating statement and outline changes in
net worth that are driven by economic flows other than revenues and expenses.
Revenues, expenses and ‘other economic flows’ sum to the total change in net worth
during a period. The majority of ‘other economic flows’ for the Australian Government
GGS arise from price movements in its assets and liabilities.
Net operating balance
The net operating balance is the excess of revenue from transactions over expenses from
transactions. The net operating balance excludes expenditure on the acquisition of
capital assets but includes non-cash costs such as accruing superannuation entitlements
and the consumption of capital (depreciation). By including all accruing costs, including
2 Not all transactions impact net worth. For example, transactions in financial assets and
liabilities do not impact net worth as they represent the swapping of assets and liabilities on the balance sheet.

Part 2: Australian Government Financial Statements
53
depreciation, the net operating balance encompasses the full current cost of providing
government services. This makes it a measure of the sustainability of the government’s
fiscal position over time and provides an indication of the sustainability of the existing
level of government services.
Fiscal balance
The fiscal balance (or net lending/borrowing) is the net operating balance less net capital
investment. The fiscal balance includes the impact of net expenditure (effectively
purchases less sales) on non-financial assets rather than consumption (depreciation) of
non-financial assets. 3
The fiscal balance measures the Australian Government’s investment saving balance. It
measures in accrual terms the gap between government savings plus net capital
transfers and investment in non-financial assets. As such, it approximates the
contribution of the Australian Government GGS to the balance on the current account
in the balance of payments.
Balance sheet
The balance sheet shows stocks of assets, liabilities and net worth. In accordance with
the UPF, net debt, net financial worth and net financial liabilities are also reported in the
balance sheet.
Net worth
The net worth of the GGS, PNFC and PFC sectors is defined as assets less liabilities. This
differs from the ABS GFS definition for the PNFC and PFC sectors where net worth is
defined as assets less liabilities less shares and other contributed capital. Net worth is an
economic measure of wealth, reflecting the Australian Government’s contribution to the
wealth of Australia.
Net financial worth
Net financial worth measures a government’s net holdings of financial assets. It is
calculated from the balance sheet as financial assets minus liabilities. This differs from
the ABS GFS definition of net financial worth for the PNFC and PFC sectors, defined as
financial assets, less liabilities, less shares and other contributed capital. Net financial
worth is a broader measure than net debt, in that it incorporates provisions made (such
as superannuation) as well as equity holdings. Net financial worth includes all classes
of financial assets and all liabilities, only some of which are included in net debt. As
non-financial assets are excluded from net financial worth, this is a narrower measure
3 The net operating balance includes consumption of non-financial assets because depreciation
is an expense. Depreciation is deducted in the calculation of net capital investment as the full investment in non-financial assets is included in the calculation of fiscal balance.

Final Budget Outcome 2020–21
54
than net worth. However, it avoids the concerns inherent with the net worth measure
relating to the valuation of non-financial assets and their availability to offset liabilities.
Net financial liabilities
Net financial liabilities comprises total liabilities less financial assets but excludes equity
investments in the other sectors of the jurisdiction. Net financial liabilities is a more
accurate indicator than net debt of a jurisdiction’s fiscal position as it includes
substantial non debt liabilities such as accrued superannuation and long service leave
entitlements. Excluding the net worth of other sectors of government results in a purer
measure of financial worth than net financial worth as, in general, the net worth of other
sectors of government, in particular the PNFC sector, is backed by physical assets.
Net debt
Net debt is the sum of interest bearing liabilities less the sum of selected financial assets
(cash and deposits, advances paid and investments, loans and placements). Financial
assets include the Future Fund’s investments in interest bearing securities and collective
investment vehicles (CIVs). CIVs enable investors to pool their money and invest the
pooled funds, rather than buying securities directly. Net debt does not include
superannuation related liabilities. Net debt is a common measure of the strength of a
government’s financial position. High levels of net debt impose a call on future revenue
flows to service that debt.
The 2015 ABS GFS Manual presents debt in a matrix format, with no single net debt
aggregate identified. The Australian Government continues to report net debt in
accordance with the UPF as described above.
Cash flow statement
The cash flow statement identifies how cash is generated and applied in a single
accounting period. The cash flow statement reflects a cash basis of recording (rather than
an accrual basis) where information is derived indirectly from underlying accrual
transactions and movements in balances. This, in effect, means that transactions are
captured when cash is received or when cash payments are made. Cash transactions are
specifically identified because cash management is considered an integral function of
accrual budgeting.
Underlying cash balance
The underlying cash balance is the cash counterpart of the fiscal balance, reflecting the
Australian Government’s cash investment-saving balance.
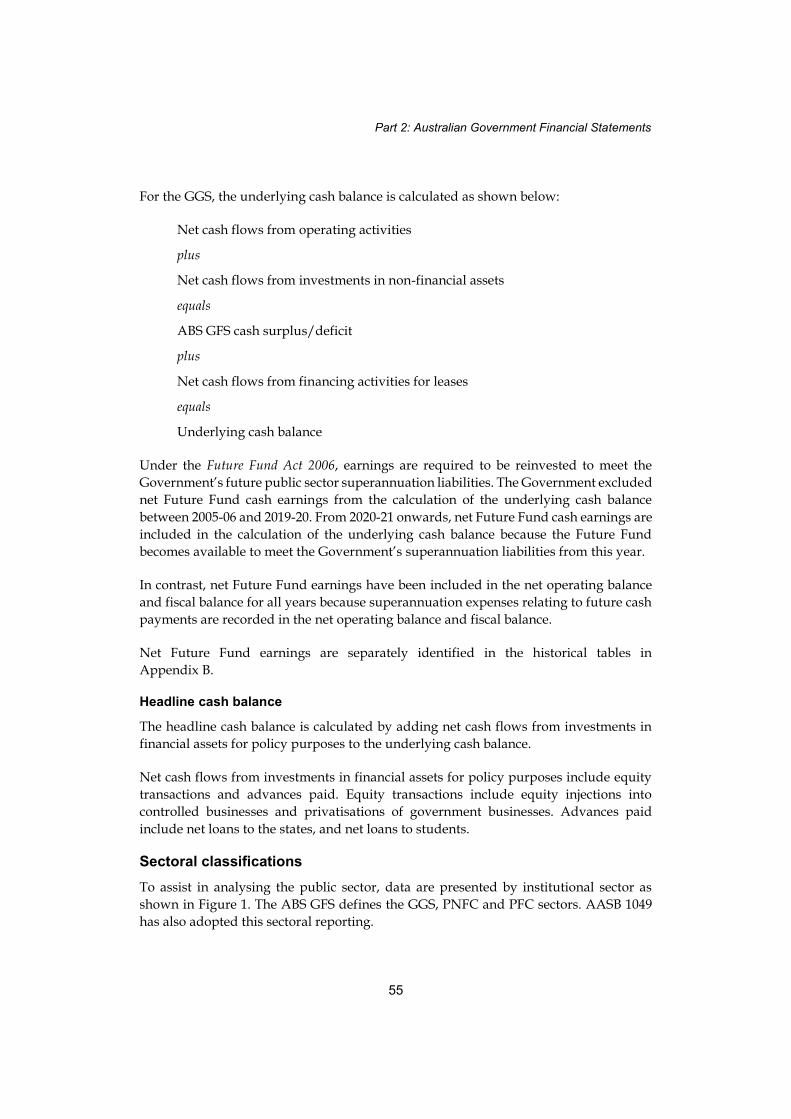
Part 2: Australian Government Financial Statements
55
For the GGS, the underlying cash balance is calculated as shown below:
Net cash flows from operating activities
plus
Net cash flows from investments in non-financial assets
equals
ABS GFS cash surplus/deficit
plus
Net cash flows from financing activities for leases
equals
Underlying cash balance
Under the Future Fund Act 2006, earnings are required to be reinvested to meet the
Government’s future public sector superannuation liabilities. The Government excluded
net Future Fund cash earnings from the calculation of the underlying cash balance
between 2005-06 and 2019-20. From 2020-21 onwards, net Future Fund cash earnings are
included in the calculation of the underlying cash balance because the Future Fund
becomes available to meet the Government’s superannuation liabilities from this year.
In contrast, net Future Fund earnings have been included in the net operating balance
and fiscal balance for all years because superannuation expenses relating to future cash
payments are recorded in the net operating balance and fiscal balance.
Net Future Fund earnings are separately identified in the historical tables in
Appendix B.
Headline cash balance
The headline cash balance is calculated by adding net cash flows from investments in
financial assets for policy purposes to the underlying cash balance.
Net cash flows from investments in financial assets for policy purposes include equity
transactions and advances paid. Equity transactions include equity injections into
controlled businesses and privatisations of government businesses. Advances paid
include net loans to the states, and net loans to students.
Sectoral classifications
To assist in analysing the public sector, data are presented by institutional sector as
shown in Figure 1. The ABS GFS defines the GGS, PNFC and PFC sectors. AASB 1049
has also adopted this sectoral reporting.

Final Budget Outcome 2020–21
56
Figure 2.1: Institutional structure of the public sector
Total public sector
Public financial corporations sector
Total non-financial
public sector
(Includes Reserve Bank of
Australia and other borrowing
authorities)
General government sector Public non-financial corporations sector
(Government departments and
agencies that provide
non-market public services, or
involve the transfer or
redistribution of income, and are
funded mainly through taxes)
(Provide goods and services to
consumers on a commercial
basis, are funded largely by the
sale of these goods and
services and are generally
legally distinguishable from the
governments that own them)
All entities are classified as GGS entities except for the following list of portfolio entities
that are classified as PFC or PNFC (Table 2.14).
A table which provides a full list of public sector principal entities under the current
portfolio structure is available on the Department of Finance website at:
https://www.finance.gov.au/government/managing-commonwealth-resources/stru
cture-australian-government-public-sector/pgpa-act-flipchart-and-list.

Part 2: Australian Government Financial Statements
57
Table 2.14: Entities outside of the general government sector – 2020-21
Public financial corporations
Attorney-General’s Portfolio
• Coal Mining Industry (Long Service Leave Funding) Corporation
Foreign Affairs and Trade Portfolio
• Export Finance and Insurance Corporation (also referred to as Export Finance Australia)
Industry, Science, Energy and Resources Portfolio
• CSIRO FollowOn Services Pty Ltd
• CSIRO FollowOn Services 2 Pty Ltd
• CSIRO General Partner Pty Ltd
• CSIRO General Partner 2 Pty Ltd
• CSIROGP Fund 2 Pty Ltd
Treasury Portfolio
• Australian Reinsurance Pool Corporation
• National Housing Finance and Investment Corporation*
• Reserve Bank of Australia

Final Budget Outcome 2020–21
58
Table 2.14: Entities outside of the general government sector – 2020-21 (continued)
Public non-financial corporations
Finance Portfolio
• ASC Pty Ltd
• Australian Naval Infrastructure Pty Ltd
Industry, Science, Energy and Resources Portfolio
• ANSTO Nuclear Medicine Pty Ltd
• Snowy Hydro Limited
Infrastructure, Transport, Regional Development and Communications Portfolio
• Airservices Australia
• Australian Postal Corporation (Australia Post)
• Australian Rail Track Corporation Limited
• Moorebank Intermodal Company Limited
• NBN Co Ltd
• WSA Co Ltd
Prime Minister and Cabinet Portfolio
• Voyages Indigenous Tourism Australia Pty Ltd
Social Services Portfolio
• Australian Hearing Services (Hearing Australia)
* The National Housing Finance and Investment Corporation (NHFIC), a corporate Commonwealth entity, operates an affordable housing bond aggregator to encourage greater private and institutional investment and provide cheaper and longer term finance to registered providers of affordable housing. The NHFIC bond aggregator is a PFC. NHFIC also administers the National Housing Infrastructure Facility (the Facility). The Facility is included in the GGS.
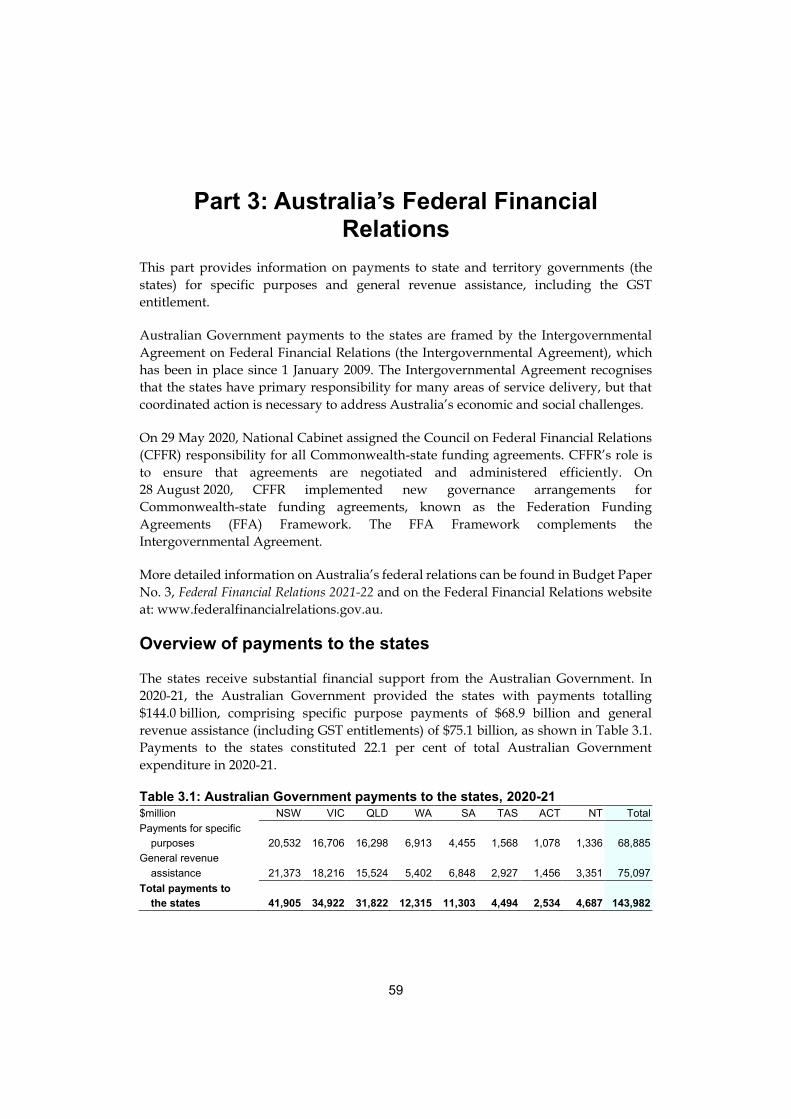
59
Part 3: Australia’s Federal Financial Relations
This part provides information on payments to state and territory governments (the
states) for specific purposes and general revenue assistance, including the GST
entitlement.
Australian Government payments to the states are framed by the Intergovernmental
Agreement on Federal Financial Relations (the Intergovernmental Agreement), which
has been in place since 1 January 2009. The Intergovernmental Agreement recognises
that the states have primary responsibility for many areas of service delivery, but that
coordinated action is necessary to address Australia’s economic and social challenges.
On 29 May 2020, National Cabinet assigned the Council on Federal Financial Relations
(CFFR) responsibility for all Commonwealth-state funding agreements. CFFR’s role is
to ensure that agreements are negotiated and administered efficiently. On
28 August 2020, CFFR implemented new governance arrangements for
Commonwealth-state funding agreements, known as the Federation Funding
Agreements (FFA) Framework. The FFA Framework complements the
Intergovernmental Agreement.
More detailed information on Australia’s federal relations can be found in Budget Paper
No. 3, Federal Financial Relations 2021-22 and on the Federal Financial Relations website
at: www.federalfinancialrelations.gov.au.
Overview of payments to the states
The states receive substantial financial support from the Australian Government. In
2020-21, the Australian Government provided the states with payments totalling
$144.0 billion, comprising specific purpose payments of $68.9 billion and general
revenue assistance (including GST entitlements) of $75.1 billion, as shown in Table 3.1.
Payments to the states constituted 22.1 per cent of total Australian Government
expenditure in 2020-21.
Table 3.1: Australian Government payments to the states, 2020-21 $million NSW VIC QLD WA SA TAS ACT NT Total
Payments for specific
purposes 20,532 16,706 16,298 6,913 4,455 1,568 1,078 1,336 68,885
General revenue
assistance 21,373 18,216 15,524 5,402 6,848 2,927 1,456 3,351 75,097
Total payments to
the states 41,905 34,922 31,822 12,315 11,303 4,494 2,534 4,687 143,982

Final Budget Outcome 2020–21
60
Payments for specific purposes
The Australian Government provides payments to the states for specific purposes in
policy areas administered by the states, including health, education, skills and
workforce development, community services, housing, Indigenous affairs,
infrastructure and the environment.
In 2020-21, the Australian Government provided the following types of specific purpose
payments to the states:
• National Specific Purpose Payments (National SPPs) in respect of skills and
workforce development
• National Health Reform funding for public hospitals and COVID-19 response
• Quality Schools funding for government and non-government schools
• National Housing and Homelessness funding
• National Partnership payments across a wide range of policy areas.
National SPPs, National Health Reform, Quality Schools and National Housing and Homelessness funding
In 2020-21, the Australian Government continued to provide funding for key service
delivery sectors through the National Skills and Workforce Development SPP, National
Health Reform funding, Quality Schools funding and National Housing and
Homelessness funding.
The states are required to spend each National SPP in the relevant sector. The National
SPPs are indexed each year by growth factors specified in the Intergovernmental
Agreement.
Payments made throughout the year for National SPPs were made in advance based on
Australian Government estimates of the relevant growth factors. A balancing
adjustment is made after the end of the financial year once final growth factor data is
available.
The National SPPs are distributed among the states in accordance with population
shares based on the Australian Statistician’s determination as at 31 December of that
year.
Payments made throughout the year for National Health Reform were made in advance
on the basis of advice from the Administrator of the National Health Funding Pool. This
funding is calculated by reference to growth in public hospital activity and the national

Part 3: Australia’s Federal Financial Relations
61
efficient price determined by the Independent Hospital Pricing Authority. The amounts
published are for payments made in respect of services delivered in 2020-21, and
previous years. The Treasurer will determine the final amount and state allocations for
2020-21 following the Administrator’s final reconciliation of activity data.
Quality Schools funding includes recurrent and capital funding for government and
non-government schools, funding for non-government representative bodies and other
prescribed purpose funding. Quality Schools funding is distributed among the states in
accordance with the Australian Education Act 2013 and agreements made under that Act.
Quality Schools is a needs-based funding model introduced in the 2017-18 Budget that
aims to improve the educational outcomes of Australian students. Funding is provided
to government and non-government schools in all states, which includes recurrent
funding, capital funding and special circumstances funding for non-government
schools, funding for non-government representative bodies and other prescribed
purpose funding.
Payments made throughout the year for National Housing and Homelessness were
made in advance based on Australian Government estimates of the relevant growth
factors. A balancing adjustment is made after the end of the financial year once final
growth factor data is available.
National Housing and Homelessness funding was introduced in 2018-19 and is made
up of a general funding component and a homelessness funding component which is
matched by the states. The general funding is allocated to the states in accordance with
population shares based on the Australian Statistician’s determination as at
31 December of that year. The homelessness funding is allocated in accordance with the
state’s share of total homelessness based on 2006 Australian Bureau of Statistics Census
homelessness estimates.
National Partnership payments
Under the Intergovernmental Agreement, National Partnership payments to the states
are the key vehicle to support the delivery of specified projects, facilitate reforms or
reward jurisdictions that deliver on nationally significant reforms.
National Partnerships are typically time limited, reflecting the nature of the project or
reform involved. National Partnership agreements are publicly available at:
www.federalfinancialrelations.gov.au.

Final Budget Outcome 2020–21
62
Total payments for specific purposes
In 2020-21, the states received $68.9 billion in payments for specific purposes, which
constituted 10.6 per cent of total Australian Government expenditure. Total payments
for specific purposes by category are shown in Table 3.2.
Table 3.2: Total payments for specific purposes by category, 2020-21 $million NSW VIC QLD WA SA TAS ACT NT Total
National Specific Purpose
Payments(a) 496 405 316 162 108 33 26 15 1,561
National Health Reform
funding(b) 7,623 6,633 5,510 2,591 1,559 511 462 357 25,245
Quality Schools funding(c) 6,741 5,632 4,938 2,193 1,408 522 360 367 22,161
National Housing and
Homelessness
funding(d) 490 412 328 171 111 35 27 20 1,595
National Partnership
payments(e) 5,182 3,624 5,207 1,796 1,269 467 202 577 18,324
Total payments for
specific purposes 20,532 16,706 16,298 6,913 4,455 1,568 1,078 1,336 68,885
(a) The 2020-21 National Skills and Workforce Development SPP funding outcome will be finalised following a Determination by the Assistant Treasurer.
(b) Entitlements for 2020-21 will be finalised following reconciliation of activity data by the Administrator of the National Health Funding Pool and a subsequent Determination by the Treasurer.
(c) The 2020-21 Quality Schools funding outcome will be finalised following a Determination by the Minister for Education.
(d) Entitlements for 2020-21 will be finalised after states report on their actual expenditure via statements of assurance and a subsequent Determination by the Treasurer.
(e) Includes financial assistance grants for local governments.
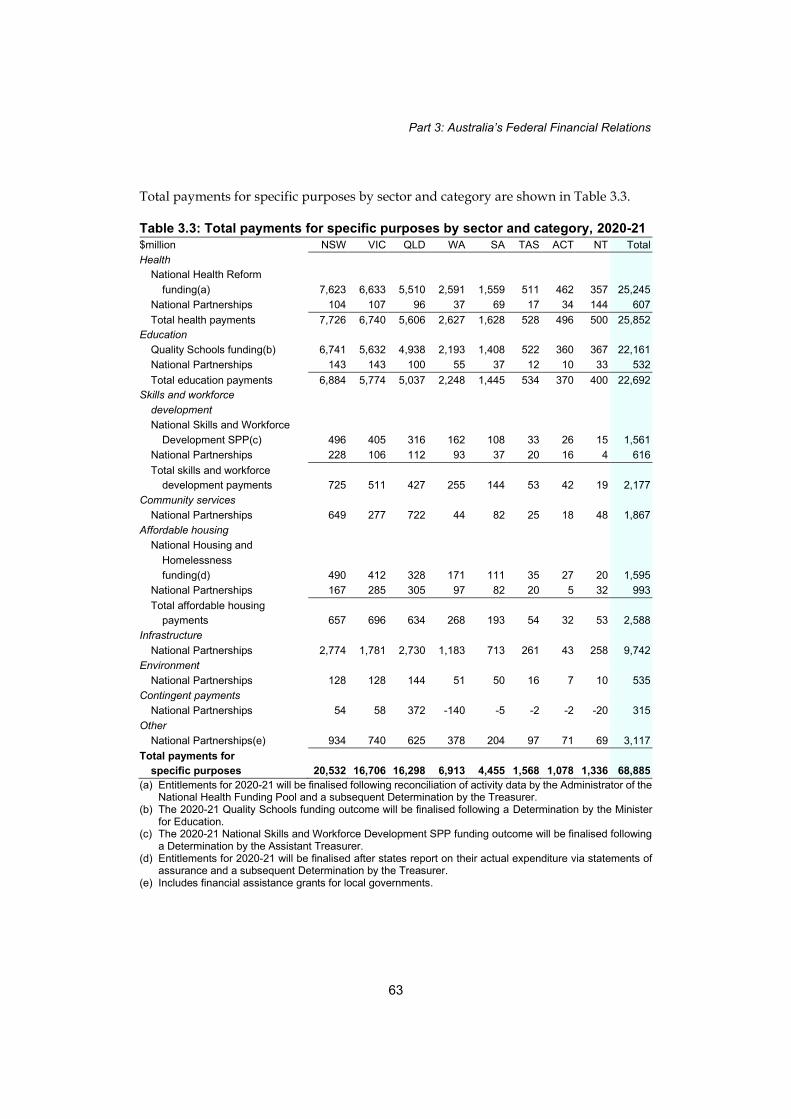
Part 3: Australia’s Federal Financial Relations
63
Total payments for specific purposes by sector and category are shown in Table 3.3.
Table 3.3: Total payments for specific purposes by sector and category, 2020-21 $million NSW VIC QLD WA SA TAS ACT NT Total
Health
National Health Reform
funding(a) 7,623 6,633 5,510 2,591 1,559 511 462 357 25,245
National Partnerships 104 107 96 37 69 17 34 144 607
Total health payments 7,726 6,740 5,606 2,627 1,628 528 496 500 25,852
Education
Quality Schools funding(b) 6,741 5,632 4,938 2,193 1,408 522 360 367 22,161
National Partnerships 143 143 100 55 37 12 10 33 532
Total education payments 6,884 5,774 5,037 2,248 1,445 534 370 400 22,692
Skills and workforce
development
National Skills and Workforce
Development SPP(c) 496 405 316 162 108 33 26 15 1,561
National Partnerships 228 106 112 93 37 20 16 4 616
Total skills and workforce
development payments 725 511 427 255 144 53 42 19 2,177
Community services
National Partnerships 649 277 722 44 82 25 18 48 1,867
Affordable housing
National Housing and
Homelessness
funding(d) 490 412 328 171 111 35 27 20 1,595
National Partnerships 167 285 305 97 82 20 5 32 993
Total affordable housing
payments 657 696 634 268 193 54 32 53 2,588
Infrastructure
National Partnerships 2,774 1,781 2,730 1,183 713 261 43 258 9,742
Environment
National Partnerships 128 128 144 51 50 16 7 10 535
Contingent payments
National Partnerships 54 58 372 -140 -5 -2 -2 -20 315
Other
National Partnerships(e) 934 740 625 378 204 97 71 69 3,117
Total payments for
specific purposes 20,532 16,706 16,298 6,913 4,455 1,568 1,078 1,336 68,885
(a) Entitlements for 2020-21 will be finalised following reconciliation of activity data by the Administrator of the National Health Funding Pool and a subsequent Determination by the Treasurer.
(b) The 2020-21 Quality Schools funding outcome will be finalised following a Determination by the Minister for Education.
(c) The 2020-21 National Skills and Workforce Development SPP funding outcome will be finalised following a Determination by the Assistant Treasurer.
(d) Entitlements for 2020-21 will be finalised after states report on their actual expenditure via statements of assurance and a subsequent Determination by the Treasurer.
(e) Includes financial assistance grants for local governments.

Final Budget Outcome 2020–21
64
The Disaster Recovery Funding Arrangements and the Natural Disaster Relief and Recovery Arrangements
The Australian Government provides funding under the Disaster Recovery Funding
Arrangements (DRFA) and the Natural Disaster Relief and Recovery Arrangements
(NDRRA) to assist the states in relief and recovery efforts following eligible disasters.
Table 3.4 shows total cash payments made in 2020-21.
Table 3.4: DRFA and NDRRA cash payments, 2020-21 $million NSW VIC QLD WA SA TAS ACT NT Total
DRFA and NDRRA 14.1 11.4 649.6 3.7 - 41.3 - 5.2 725.3
Total 14.1 11.4 649.6 3.7 - 41.3 - 5.2 725.3
For accounting purposes, the Australian Government recognises a liability equal to the
present value of future payments expected to be made to the states under the DRFA and
the NDRRA. This is regardless of whether a state has completed eligible disaster
reconstruction work or submitted an eligible claim. See Table 3.19 in Attachment A for
the expense outcome.
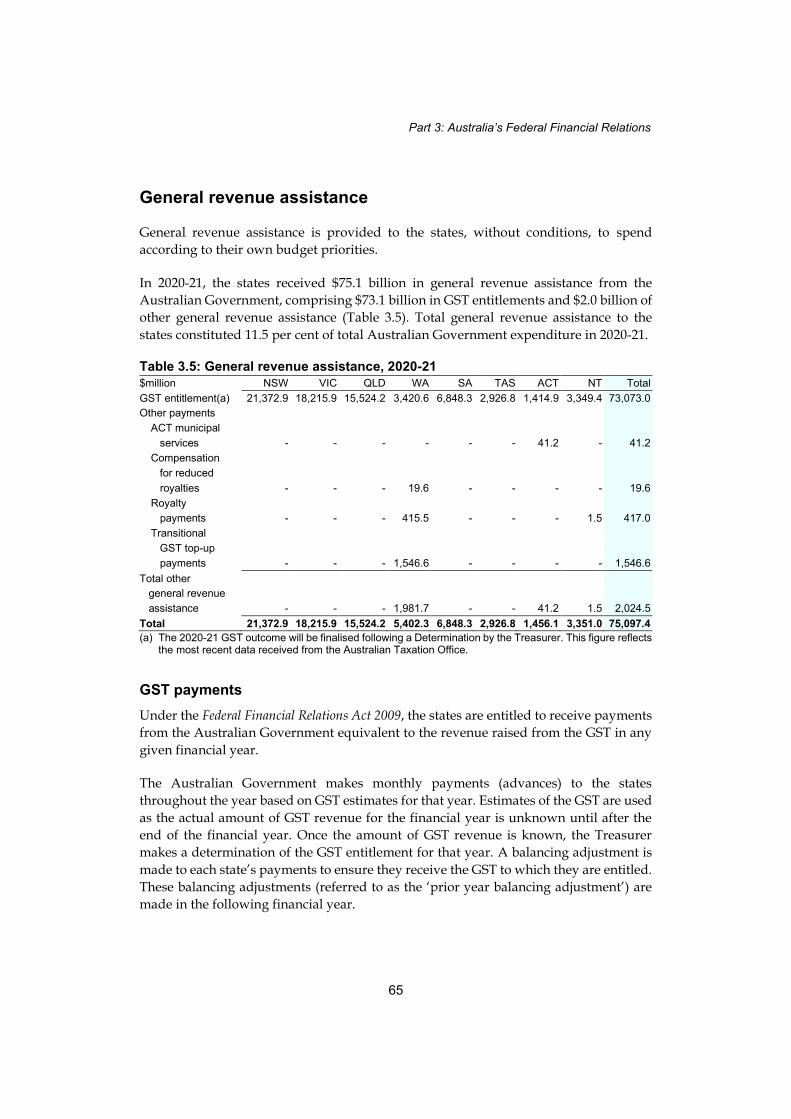
Part 3: Australia’s Federal Financial Relations
65
General revenue assistance
General revenue assistance is provided to the states, without conditions, to spend
according to their own budget priorities.
In 2020-21, the states received $75.1 billion in general revenue assistance from the
Australian Government, comprising $73.1 billion in GST entitlements and $2.0 billion of
other general revenue assistance (Table 3.5). Total general revenue assistance to the
states constituted 11.5 per cent of total Australian Government expenditure in 2020-21.
Table 3.5: General revenue assistance, 2020-21 $million NSW VIC QLD WA SA TAS ACT NT Total
GST entitlement(a) 21,372.9 18,215.9 15,524.2 3,420.6 6,848.3 2,926.8 1,414.9 3,349.4 73,073.0
Other payments
ACT municipal
services - - - - - - 41.2 - 41.2
Compensation
for reduced
royalties - - - 19.6 - - - - 19.6
Royalty
payments - - - 415.5 - - - 1.5 417.0
Transitional
GST top-up
payments - - - 1,546.6 - - - - 1,546.6
Total other
general revenue
assistance - - - 1,981.7 - - 41.2 1.5 2,024.5
Total 21,372.9 18,215.9 15,524.2 5,402.3 6,848.3 2,926.8 1,456.1 3,351.0 75,097.4
(a) The 2020-21 GST outcome will be finalised following a Determination by the Treasurer. This figure reflects the most recent data received from the Australian Taxation Office.
GST payments
Under the Federal Financial Relations Act 2009, the states are entitled to receive payments
from the Australian Government equivalent to the revenue raised from the GST in any
given financial year.
The Australian Government makes monthly payments (advances) to the states
throughout the year based on GST estimates for that year. Estimates of the GST are used
as the actual amount of GST revenue for the financial year is unknown until after the
end of the financial year. Once the amount of GST revenue is known, the Treasurer
makes a determination of the GST entitlement for that year. A balancing adjustment is
made to each state’s payments to ensure they receive the GST to which they are entitled.
These balancing adjustments (referred to as the ‘prior year balancing adjustment’) are
made in the following financial year.

Final Budget Outcome 2020–21
66
Adjustments and additions are made to GST revenue to calculate the amount of GST
paid to the states in any given year. In particular, adjustments are made to move from
GST revenue (an accrual concept) to GST (cash) receipts as GST receipts are the basis for
the GST paid to the states.
• Some GST revenue accrued during a financial year is not remitted to the Australian
Taxation Office (ATO) by 30 June of that year, because it is not due to be paid until
Business Activity Statements (BAS) are lodged the following financial year. For
taxpayers other than Australian Government agencies, this accrued amount is
included in GST revenue, but not in GST receipts.
• Penalties owed to the ATO, other than general interest charge (GIC) penalties, are
not included in the GST to be paid to the states, as defined in the Federal Financial
Relations Act 2009.
• Some GST collected by Australian Government agencies is not remitted to the ATO
by 30 June in each financial year because it is not due to be paid until the next BAS is
lodged. This amount is included in Australian Government receipts but is not
included in GST payments to the states until it is remitted to the ATO.
In 2020-21, GST revenue was $74.7 billion. A reconciliation of GST revenue and the
states’ GST entitlement is provided in Table 3.6.

Part 3: Australia’s Federal Financial Relations
67
Table 3.6: Reconciliation of GST revenue and the states’ GST entitlement, 2020-21 $million Total
GST revenue 74,688
less Change in GST receivables 1,756 GST receipts 72,932
less Non-GIC penalties collected 21
less Net GST collected by Commonwealth agencies but not yet remitted to the ATO -162
States' GST entitlement(a) 73,073
(a) The 2020-21 GST outcome will be finalised following a Determination by the Treasurer.
For 2020-21, the states’ GST entitlement is expected to be $73.1 billion. This is $3.3 billion
higher than the advances paid during 2020-21. Table 3.7 provides a reconciliation of the
states’ GST entitlement and GST advances.
Table 3.7: States’ GST entitlement and GST advances, 2020-21 $million Total
States' GST entitlement(a) 73,073.0
less Advances of GST made throughout 2020-21 69,760.9
equals Balancing adjustment 3,312.1
(a) The 2020-21 GST outcome will be finalised following a Determination by the Treasurer.
Distribution of the GST among the states
The Australian Government distributes the GST among the states based on the GST
revenue sharing relativities recommended by the Commonwealth Grants Commission.
Following consultation with the states, the Treasurer issued a Determination of the GST
revenue sharing relativities for 2020-21 in April 2020. The relativities for 2020-21 are
shown in Table 3.8.
Table 3.8: GST relativities, 2020-21 NSW VIC QLD WA SA TAS ACT NT
2020-21 0.91808 0.95992 1.04907 0.44970 1.35765 1.89742 1.15112 4.76893
The detailed calculation for the distribution of the GST entitlement in 2020-21 is shown
in Table 3.9. This method of calculation is prescribed in legislation in the Federal Financial
Relations Act 2009. The entitlements are allocated using the population as at
31 December 2020, as determined by the Australian Statistician.

Final Budget Outcome 2020–21
68
Table 3.9: Calculation of the 2020-21 GST entitlements(a) Population as at GST Adjusted Share of adjusted Share of
31 December revenue sharing population population GST pool
2020 relativities (1) x (2) (per cent) ($million)
(1) (2) (3) (4) (5)
NSW 8,172,505 0.91808 7,503,013 29.2 21,372.9
VIC 6,661,736 0.95992 6,394,734 24.9 18,215.9
QLD 5,194,879 1.04907 5,449,792 21.2 15,524.2
WA 2,670,241 0.44970 1,200,807 4.7 3,420.6
SA 1,770,790 1.35765 2,404,113 9.4 6,848.3
TAS 541,506 1.89742 1,027,464 4.0 2,926.8
ACT 431,484 1.15112 496,690 1.9 1,414.9
NT 246,561 4.76893 1,175,832 4.6 3,349.4
Total 25,689,702 na 25,652,445 100 73,073.0
(a) The 2020-21 GST outcome will be finalised following a Determination by the Treasurer.
Table 3.10 provides a summary of the advances made in 2020-21 against the states’
estimated final entitlements shown in Table 3.9. The variance between advances paid in
2020-21 and the states’ final entitlements will be included as an adjustment to payments
in the 2021-22 financial year.
Table 3.10: Summary of GST advances made in 2020-21 and distribution of the balancing adjustment across states(a) $million NSW VIC QLD WA SA TAS ACT NT Total
GST entitlement 21,372.9 18,215.9 15,524.2 3,420.6 6,848.3 2,926.8 1,414.9 3,349.4 73,073.0
20-21 advances 20,361.1 17,478.8 14,809.2 3,260.8 6,532.6 2,793.0 1,349.1 3,176.4 69,760.9
Balancing
adjustment 1,011.9 737.1 715.0 159.8 315.7 133.8 65.8 173.1 3,312.1
(a) The 2020-21 GST outcome will be finalised following a Determination by the Treasurer.
GST administration
States compensate the Australian Government for the agreed costs incurred by the ATO
in administering the GST, including costs incurred by the Department of Home Affairs,
as shown in Table 3.11.
Table 3.11: GST administration, 2020-21 $million Actual
2019-20 2020-21
Australian Taxation Office budget 646.6 621.5
less Prior year adjustment - -
equals State government administration payments 646.6 621.5
less Australian Taxation Office outcome 646.6 538.2
equals Commonwealth budget impact - 83.3
plus Prior year adjustment - -
equals Following year adjustment - 83.3

Part 3: Australia’s Federal Financial Relations
69
The estimated outcome for the 2020-21 GST administration expense is $538.2 million.
The decrease in costs when compared with the Australian Taxation Office budget of
$621.5 million, was primarily as a result of the diversion of resources to stimulus
measures focused on supporting the community in response to the
COVID-19 pandemic.

70
Attachment A
Payments to the states
This attachment provides information on Australian Government payments to the states
and local governments on an accruals basis. Details regarding Australian Government
advances (loans) to the states, including repayments of advances and interest on
advances, are provided in Table 3.23.
The following tables detail payments and other financial flows to the states for 2020-21:
Table 3.12 – health
Table 3.13 – education
Table 3.14 – skills and workforce development
Table 3.15 – community services
Table 3.16 – affordable housing
Table 3.17 – infrastructure
Table 3.18 – environment
Table 3.19 – contingent liabilities
Table 3.20 – other purposes
Table 3.21 – general revenue assistance
Table 3.22 – total payments, presented by function based on the International
Monetary Fund’s Classification of the Functions of Government
Table 3.23 – estimated advances, repayment of advances and interest payments.
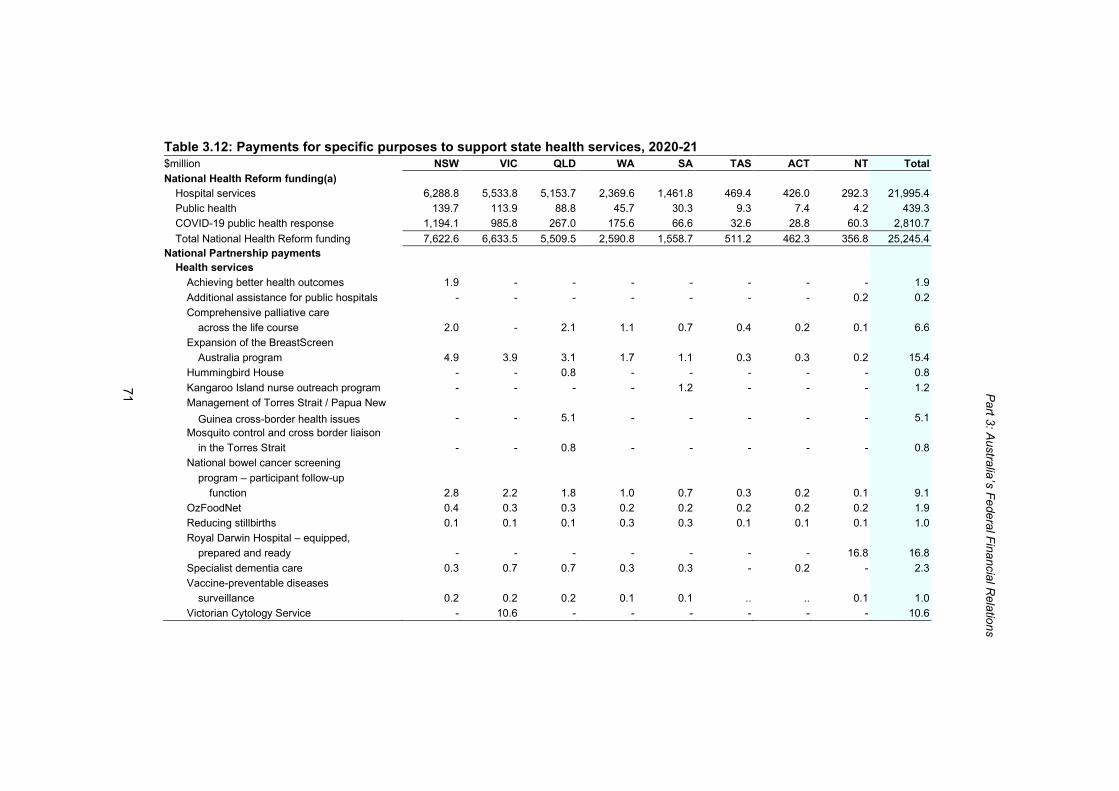
71
Pa
rt 3: A
ustra
lia’s
Fe
de
ral F
ina
ncia
l Rela
tion
s
Table 3.12: Payments for specific purposes to support state health services, 2020-21 $million NSW VIC QLD WA SA TAS ACT NT Total
National Health Reform funding(a)
Hospital services 6,288.8 5,533.8 5,153.7 2,369.6 1,461.8 469.4 426.0 292.3 21,995.4
Public health 139.7 113.9 88.8 45.7 30.3 9.3 7.4 4.2 439.3
COVID-19 public health response 1,194.1 985.8 267.0 175.6 66.6 32.6 28.8 60.3 2,810.7
Total National Health Reform funding 7,622.6 6,633.5 5,509.5 2,590.8 1,558.7 511.2 462.3 356.8 25,245.4
National Partnership payments
Health services
Achieving better health outcomes 1.9 - - - - - - - 1.9
Additional assistance for public hospitals - - - - - - - 0.2 0.2
Comprehensive palliative care
across the life course 2.0 - 2.1 1.1 0.7 0.4 0.2 0.1 6.6
Expansion of the BreastScreen
Australia program 4.9 3.9 3.1 1.7 1.1 0.3 0.3 0.2 15.4
Hummingbird House - - 0.8 - - - - - 0.8
Kangaroo Island nurse outreach program - - - - 1.2 - - - 1.2
Management of Torres Strait / Papua New
Guinea cross-border health issues - - 5.1 - - - - - 5.1
Mosquito control and cross border liaison
in the Torres Strait - - 0.8 - - - - - 0.8
National bowel cancer screening
program – participant follow-up function 2.8 2.2 1.8 1.0 0.7 0.3 0.2 0.1 9.1
OzFoodNet 0.4 0.3 0.3 0.2 0.2 0.2 0.2 0.2 1.9
Reducing stillbirths 0.1 0.1 0.1 0.3 0.3 0.1 0.1 0.1 1.0
Royal Darwin Hospital – equipped, prepared and ready - - - - - - - 16.8 16.8
Specialist dementia care 0.3 0.7 0.7 0.3 0.3 - 0.2 - 2.3
Vaccine-preventable diseases
surveillance 0.2 0.2 0.2 0.1 0.1 .. .. 0.1 1.0
Victorian Cytology Service - 10.6 - - - - - - 10.6

| Fin
al B
udg
et O
utc
om
e 2
020–
21
72
Fin
al B
ud
ge
t Ou
tco
me
202
0–21
Table 3.12: Payments for specific purposes to support state health services, 2020-21 (continued) $million NSW VIC QLD WA SA TAS ACT NT Total
Health Infrastructure
Community Health, Hospitals and
Infrastructure projects 32.8 20.2 35.5 12.5 3.0 5.5 15.0 29.1 153.6
Grace’s Place 2.0 - - - - - - - 2.0
Proton beam therapy facility - - - - 40.7 - - - 40.7
Redevelopment of Strathalbyn
residential aged care facility - - - - 0.7 - - - 0.7
Suicide prevention 1.3 0.8 - - - 0.5 - - 2.6
Veteran Wellbeing Centre Program - - 3.0 - 2.1 - - - 5.1
Indigenous health
Addressing blood borne viruses and
sexually transmitted infections
in the Torres Strait - - 1.1 - - - - - 1.1
Improving trachoma control services
for Indigenous Australians - - 0.3 1.7 1.4 - - 1.9 5.3
Northern Territory remote Aboriginal
Investment
Health component - - - - - - - 6.7 6.7
Rheumatic fever strategy - - 1.0 1.0 0.4 - - 1.0 3.3

73
Pa
rt 3: A
ustra
lia’s
Fe
de
ral F
ina
ncia
l Rela
tion
s
Table 3.12: Payments for specific purposes to support state health services, 2020-21 (continued) $million NSW VIC QLD WA SA TAS ACT NT Total
Other Health
Centre for National Resilience - - - - - - - 69.6 69.6
Encouraging more clinical trials in
Australia 0.3 0.2 0.3 0.2 0.1 0.1 0.2 0.1 1.5
Essential vaccines 3.7 3.9 3.4 1.7 1.4 0.6 0.6 0.5 15.9
Health Innovation Fund 15.9 36.0 10.1 5.2 5.1 1.1 16.3 15.5 105.2
Lymphoedema garments and allied health therapy program 0.6 0.5 0.4 0.2 0.1 .. .. .. 2.0
National Coronial Information System - 0.4 - - - - - - 0.4
Public dental services for adults 34.4 26.9 21.7 9.6 9.4 3.4 0.9 1.4 107.7
Quarantine arrangements in Tasmania - - - - - 4.0 - - 4.0
Queensland 2032 Olympic and
Paralympic Games Candidature - - 4.5 - - - - - 4.5
Total National Partnership payments 103.6 106.9 96.2 36.6 69.1 16.5 34.2 143.5 606.5
Total 7,726.2 6,740.4 5,605.7 2,627.4 1,627.8 527.7 496.4 500.3 25,852.0
(a) Entitlements for 2020-21 will be finalised following reconciliation of activity data by the Administrator of the National Health Funding Pool and a subsequent Determination by the Treasurer.

| Fin
al B
udg
et O
utc
om
e 2
020–
21
74
Fin
al B
ud
ge
t Ou
tco
me
202
0–21
Table 3.13: Payments for specific purposes to support state education services, 2020-21 $million NSW VIC QLD WA SA TAS ACT NT Total
Quality Schools funding(a)(b)(c) 6,741.4 5,631.7 4,937.9 2,192.8 1,407.9 522.0 359.8 367.1 22,160.5
National Partnership payments
National school chaplaincy program 11.3 12.5 18.4 7.7 7.6 2.2 0.6 0.5 60.7
Northern Territory Remote Aboriginal
Investment(a)
Children and schooling component - - - - - - - 27.5 27.5
School pathways program - - - 0.6 0.6 - - - 1.2
Universal access to early childhood
education 131.6 130.2 81.2 46.5 28.7 9.9 9.6 4.7 442.3
Total National Partnership payments 142.8 142.7 99.5 54.8 36.9 12.1 10.2 32.7 531.8
Total 6,884.2 5,774.4 5,037.4 2,247.6 1,444.8 534.1 370.0 399.8 22,692.3
Memorandum item – payments for non-government schools included in payments above Quality Schools funding(a)(b)(c) 3,931.5 3,544.7 2,887.7 1,267.8 800.4 300.7 228.6 145.4 13,106.6
Total 3,931.5 3,544.7 2,887.7 1,267.8 800.4 300.7 228.6 145.4 13,106.6
(a) Includes funding for non-government representative bodies. (b) The 2020-21 Quality Schools funding outcome will be finalised following a Determination by the Minister for Education. (c) Actual cash payments to non-government schools may be inclusive of GST. However, Final Budget Outcome figures are reported exclusive of GST.

75
Pa
rt 3: A
ustra
lia’s
Fe
de
ral F
ina
ncia
l Rela
tion
s
Table 3.14: Payments for specific purposes to support state skills and workforce development services, 2020-21 $million NSW VIC QLD WA SA TAS ACT NT Total
National Skills and Workforce
Development SPP(a) 496.5 404.7 315.6 162.2 107.6 32.9 26.2 15.0 1,560.6
National Partnership payments
Energising Tasmania - - - - - 4.6 - - 4.6
JobTrainer Fund 111.5 91.2 100.5 51.7 13.8 7.4 8.4 1.9 386.4
National Infection Control Training Fund 12.8 10.4 8.0 - - - - 0.4 31.6
Revitalising TAFE campuses across
Australia 5.0 4.8 3.2 2.0 2.0 2.0 2.0 - 21.0
Skilling Australians Fund 99.2 - - 38.9 21.1 6.3 5.2 2.0 172.7
Total National Partnership payments 228.5 106.4 111.7 92.6 36.9 20.3 15.5 4.3 616.2
Total 724.9 511.1 427.3 254.8 144.4 53.2 41.7 19.3 2,176.8
(a) The 2020-21 National Skills and Workforce Development SPP funding outcome will be finalised following a Determination by the Assistant Treasurer.

| Fin
al B
udg
et O
utc
om
e 2
020–
21
76
Fin
al B
ud
ge
t Ou
tco
me
202
0–21
Table 3.15: Payments for specific purposes to support state community services, 2020-21 $million NSW VIC QLD WA SA TAS ACT NT Total
National Partnership payments
COVID-19 Self-Isolation for Remote
Communities - - 0.6 0.4 0.1 - - 2.6 3.6
Family, Domestic and Sexual Violence
Responses 30.8 24.4 19.7 10.6 7.0 2.1 1.6 1.2 97.5
NDIS Strategic Investment in QLD - - 8.9 - - - - - 8.9
Northern Territory Remote Aboriginal
Investment Community safety implementation plan - - - - - - - 34.6 34.6
Pay equity for the social and community
services sector - - - 33.3 - - - - 33.3
Payments from the DisabilityCare Australia
Fund 618.0 252.5 693.0 - 75.2 23.3 16.8 10.0 1,688.9
Total 648.8 276.9 722.1 44.3 82.4 25.4 18.5 48.4 1,866.9

77
Pa
rt 3: A
ustra
lia’s
Fe
de
ral F
ina
ncia
l Rela
tion
s
Table 3.16: Payments for specific purposes to support state affordable housing services, 2020-21 $million NSW VIC QLD WA SA TAS ACT NT Total
National Housing and Homelessness Agreement(a) 489.9 411.8 328.1 171.3 111.4 34.6 27.2 20.4 1,594.5
National Partnership payments
HomeBuilder 167.4 284.6 205.4 96.5 81.4 19.9 5.1 5.4 865.7
Northern Territory Remote Aboriginal
Investment
Remote Australia strategies component - - - - - - - 3.7 3.7
Remote housing - - 100.0 - - - - 23.5 123.5
Social Impact Investments
Youth at risk of homelessness - - - - 0.5 - - - 0.5
Total National Partnership payments 167.4 284.6 305.4 96.5 81.9 19.9 5.1 32.5 993.3
Total 657.3 696.3 633.6 267.8 193.3 54.5 32.2 52.8 2,587.8
(a) Entitlements for 2020-21 will be finalised after states report on their actual expenditure via statements of assurance and a subsequent Determination by the Treasurer.

| Fin
al B
udg
et O
utc
om
e 2
020–
21
78
Fin
al B
ud
ge
t Ou
tco
me
202
0–21
Table 3.17: Payments for specific purposes to support state infrastructure services, 2020-21 $million NSW VIC QLD WA SA TAS ACT NT Total
National Partnership payments
Infrastructure Investment Program
Black Spot Projects 37.4 24.3 18.5 14.7 4.8 1.0 0.1 2.9 103.8
Bridges Renewal Program 19.8 4.6 14.4 1.4 2.7 1.8 - 1.9 46.6
Developing Northern Australia
Improving cattle supply chains - - 6.4 - - - - 0.4 6.9
Northern Australian Roads - - 39.2 15.8 - - - 18.0 73.0
Heavy Vehicle Safety and Productivity
Program 25.0 2.6 13.4 2.4 3.9 1.9 - 2.5 51.8
Major Projects Business Case Fund 6.8 3.8 11.3 7.8 - - - - 29.6
National Rail Program 6.3 - 45.7 61.5 - - - - 113.5
Rail investment component 244.4 628.5 0.4 32.3 20.7 38.0 - - 964.3
Road investment component(a) 1,154.8 709.3 2,148.3 577.4 407.3 94.5 18.3 97.5 5,207.5
Roads of Strategic Importance 56.3 8.5 49.8 87.8 10.1 71.7 - 45.6 329.9
Roads to Recovery 180.5 111.3 120.6 79.0 54.9 16.9 9.2 19.3 591.8
Urban Congestion Fund 21.0 83.1 29.7 135.9 115.0 3.9 - - 388.5
Infrastructure Growth Package
New Investments - - 1.5 0.4 2.5 - - 1.4 5.8
Western Sydney Infrastructure Plan 685.2 - - - - - - - 685.2

79
Pa
rt 3: A
ustra
lia’s
Fe
de
ral F
ina
ncia
l Rela
tion
s
Table 3.17: Payments for specific purposes to support state infrastructure services, 2020-21 (continued) $million NSW VIC QLD WA SA TAS ACT NT Total
Other payments
Adelaide City Deal - - - - 9.6 - - - 9.6
Albury Wodonga Regional Deal - 1.5 - - - - - - 1.5
Barkly Regional Deal - - - - - - - 3.8 3.8
Darwin City Deal - - - - - - - 45.0 45.0
Drought Communities Programme 37.1 8.3 14.7 23.8 14.5 3.3 - 1.6 103.3
Geelong City Deal - 10.1 - - - - - - 10.1
Hinkler Regional Deal - - 0.3 - - - - - 0.3
Launceston City Deal - - - - - 3.9 - - 3.9
Local Roads and Community
Infrastructure 239.5 185.0 176.0 110.7 67.0 24.1 15.4 17.6 835.2
Perth City Deal - - - 27.8 - - - - 27.8
Public Safety Mobile Broadband 8.0 - - - - - - - 8.0
Regional Recovery Partnerships 20.0 - 25.0 3.8 - - - - 48.8
Townsville City Deal - - 15.0 - - - - - 15.0
Western Sydney City Deal 23.7 - - - - - - - 23.7
WiFi and mobile coverage on trains 8.0 - - - - - - - 8.0
Total 2,773.8 1,780.8 2,730.4 1,182.6 712.9 261.0 43.1 257.6 9,742.2
Memorandum item – payments direct to local governments included in payments above
Infrastructure Investment Program
Roads to Recovery 179.0 111.3 120.6 79.0 48.4 16.9 9.2 10.3 574.8
Other payments
Drought Communities Program 37.1 8.3 14.7 23.8 14.5 3.3 - 1.6 103.3
Local Roads and Community Infrastructure 239.5 185.0 176.0 110.7 65.4 24.1 15.4 15.3 831.4
Total 455.6 304.6 311.3 213.4 128.3 44.3 24.7 27.2 1,509.4
(a) A portion of Australian Government funding for road infrastructure is sourced from the additional net revenue received from the reintroduction of biannual indexation excise and excise-equivalent customs duty for all fuels (except aviation fuels), as announced in the 2014-15 Budget.

| Fin
al B
udg
et O
utc
om
e 2
020–
21
80
Fin
al B
ud
ge
t Ou
tco
me
202
0–21
Table 3.18: Payments for specific purposes to support state environment services, 2020-21 $million NSW VIC QLD WA SA TAS ACT NT Total
National Partnership payments
Bilateral Energy and Emissions Reduction Agreements - - - 28.5 - - - - 28.5
COVID-19 World and National Heritage 3.4 3.4 6.1 5.1 5.7 7.5 - 1.6 32.7
Disaster risk reduction 5.4 3.3 4.8 2.5 1.7 1.0 1.0 1.0 20.9
Environmental assessment systems upgrade - - - 3.0 - - - - 3.0
Environmental management of the former
Rum Jungle Mine site - - - - - - - 1.3 1.3
Environment Restoration Fund - - - - 1.0 - - - 1.0
Fishing and Camping Facilities Program - 1.4 - 0.9 - 0.9 0.1 - 3.3
Forestry industries bushfire salvage
transport assistance 8.7 2.0 - - - - - - 10.7
Future Drought Fund
Farm business resilience 5.5 0.7 4.4 2.3 2.2 0.6 0.2 0.2 16.0
Regional drought resilience planning 1.9 1.9 1.8 1.3 1.2 0.8 0.3 0.6 9.9
Great Artesian Basin Sustainability
Initiative 0.4 - 1.6 - 0.8 - - .. 2.8
Horticulture Netting Trial Scheme - 4.7 2.2 2.2 14.6 - - - 23.6
Implementing water reform in the
Murray-Darling Basin 2.4 1.7 0.5 - 0.4 - 0.1 - 5.0
Lindenow Valley water security scheme - 7.4 - - - - - - 7.4
Management of established pest and
weeds 0.3 0.3 - 0.1 3.2 0.2 - 0.2 4.3
National Water Infrastructure Development
Fund
Capital 60.0 27.0 58.7 - - - - - 145.7
Feasibility studies 4.0 0.1 21.2 - - - - 0.4 25.7

81
Pa
rt 3: A
ustra
lia’s
Fe
de
ral F
ina
ncia
l Rela
tion
s
Table 3.18: Payments for specific purposes to support state environment services, 2020-21 (continued) $million NSW VIC QLD WA SA TAS ACT NT Total
On-farm emergency water infrastructure
rebate 2.0 - 3.0 4.0 1.0 0.2 0.1 0.8 11.1
Pest and disease preparedness and
response programs .. 0.1 32.1 0.5 - - - 3.5 36.2
Recycling Infrastructure - - - - - - 4.5 - 4.5
Regional fund for wildlife and habitat bushfire recovery 8.4 3.4 0.8 - 0.6 - - - 13.3
Securing Forestry Resources for Economic Security 4.5 0.9 - - - - - - 5.4
Sustainable rural water use and
infrastructure program 17.1 34.5 1.0 - 13.1 - 0.3 - 66.1
Water for Fodder Program - - - - 3.2 - - - 3.2
Water for the Environment Special Account
Implementation of constraints measures 3.3 - - - 0.7 - - - 4.0
Off-farm Efficiency Program - 35.0 - - - - - - 35.0
Water Efficiency Program 0.4 - - - 0.8 - 0.4 - 1.7
World Heritage Sites 0.8 - 3.1 0.4 0.1 5.1 - - 9.5
Yellow crazy ant control - - 3.0 - - - - - 3.0
Total 128.5 127.9 144.2 50.9 50.3 16.2 6.9 9.6 534.6

| Fin
al B
udg
et O
utc
om
e 2
020–
21
82
Fin
al B
ud
ge
t Ou
tco
me
202
0–21
Table 3.19: Payments for specific purposes to support contingent state services, 2020-21 $million NSW VIC QLD WA SA TAS ACT NT Total
National Partnership payments
Disaster Recovery Funding
and Natural Disaster Relief and
Recovery Arrangements(a) 54.0 58.3 372.2 -140.5 -4.8 -1.9 -2.4 -20.2 314.7
Total 54.0 58.3 372.2 -140.5 -4.8 -1.9 -2.4 -20.2 314.7
(a) Figures reflect the expense outcome, including adjustments to the provision for future payments arising from past events. Total cash payments made in 2020-21 are presented in Table 3.4.
Table 3.20: Payments for specific purposes to support other state services, 2020-21 $million NSW VIC QLD WA SA TAS ACT NT Total
National Partnership payments
Bushfire Response Package 3.3 1.0 0.9 - 0.6 - - - 5.8
COVID-19 Legal Assistance Funding 8.4 6.0 6.9 4.0 2.3 0.9 0.6 2.0 31.1
Family law information sharing 0.8 0.3 0.7 0.3 0.2 0.3 0.3 - 2.8
Financial assistance for police officers 0.9 - - - - - - - 0.9
Financial assistance to local governments 807.1 635.6 512.9 309.3 168.4 80.5 55.9 36.1 2,605.8
National Legal Assistance Partnership
Aboriginal and Torres Strait Islander
Legal Services 18.9 4.8 20.1 13.3 5.2 2.7 0.8 13.8 79.5
Community legal centres 14.0 11.1 9.1 5.9 4.1 1.6 1.1 1.6 48.5
Domestic Violence Units and Health Justice Partnerships 1.4 1.6 2.4 1.5 1.0 0.5 0.5 1.0 9.9
Family advocacy and support services 2.3 1.7 1.4 1.0 0.8 1.0 0.7 0.9 9.9
Legal aid commissions 70.5 53.9 47.6 27.0 17.4 6.5 5.2 6.3 234.3
Social and Community Services Sector supplementation 1.0 2.1 5.5 1.2 0.6 0.2 0.2 1.5 12.3
State and territory legal assistance
administration 0.6 0.6 0.6 0.6 0.5 0.4 0.4 0.4 3.9

83
Pa
rt 3: A
ustra
lia’s
Fe
de
ral F
ina
ncia
l Rela
tion
s
Table 3.20: Payments for specific purposes to support other state services, 2020-21 (continued) $million NSW VIC QLD WA SA TAS ACT NT Total
National Tourism Icons Package - - 5.7 1.0 - 0.7 - - 7.3
Provision of fire services 5.2 3.6 3.5 1.6 1.2 0.3 5.5 2.3 23.3
Sinking fund on state debt .. .. - - - - - - ..
Small business regulatory reform - 17.2 2.9 11.2 1.4 1.7 - 2.8 37.1
Townsville Stadium - - 5.0 - - - - - 5.0
Total 934.3 739.6 625.1 377.9 203.6 97.2 71.1 68.6 3,117.4
Table 3.21: General revenue assistance payments to the states, 2020-21 $million NSW VIC QLD WA SA TAS ACT NT Total
GST entitlement(a) 21,372.9 18,215.9 15,524.2 3,420.6 6,848.3 2,926.8 1,414.9 3,349.4 73,073.0
Other payments
ACT municipal services - - - - - - 41.2 - 41.2
Compensation for reduced royalties - - - 19.6 - - - - 19.6
Royalty payments - - - 415.5 - - - 1.5 417.0
Transitional GST top-up payments - - - 1,546.6 - - - - 1,546.6
Total other general revenue
assistance - - - 1,981.7 - - 41.2 1.5 2,024.5
Total 21,372.9 18,215.9 15,524.2 5,402.3 6,848.3 2,926.8 1,456.1 3,351.0 75,097.4
(a) The 2020-21 GST outcome will be finalised following a Determination by the Treasurer.

| Fin
al B
udg
et O
utc
om
e 2
020–
21
84
Fin
al B
ud
ge
t Ou
tco
me
202
0–21
Table 3.22: Total payments to the states by function, 2020-21 $million NSW VIC QLD WA SA TAS ACT NT Total
General public services - - - - - - - - -
Public order and safety 134.2 84.6 93.2 55.2 33.3 14.2 15.0 62.9 492.6
Education 7,596.4 6,275.1 5,456.6 2,502.4 1,589.2 587.2 411.8 415.1 24,833.9
Health 7,724.0 6,739.7 5,598.5 2,626.1 1,626.1 527.3 496.0 500.2 25,837.9
Social security and welfare 652.0 279.7 730.5 46.8 85.2 26.1 19.0 22.7 1,862.0
Housing and community amenities 820.1 753.5 786.1 334.3 225.9 75.3 37.8 103.8 3,136.9
Recreation and culture - 1.4 9.5 0.9 - 0.9 0.1 - 12.8
Fuel and energy - - - 28.5 - - - - 28.5
Agriculture, forestry and fishing 46.5 89.2 46.6 10.4 41.2 1.7 1.3 5.3 242.3
Mining, manufacturing and construction - - - - - - - - -
Transport and communication 2,445.5 1,575.9 2,499.3 1,016.5 621.9 229.8 27.7 189.7 8,606.3
Other economic affairs 12.8 27.6 16.5 12.2 1.4 2.4 - 3.2 76.0
Other purposes(a) 22,473.5 19,094.8 16,585.2 5,681.8 7,078.9 3,029.4 1,525.1 3,384.4 78,853.1
Total payments to the states 41,904.9 34,921.5 31,822.1 12,315.0 11,303.1 4,494.3 2,533.8 4,687.4 143,982.1
less payments ‘through’ the states 4,153.1 3,862.9 3,141.3 1,430.3 942.7 324.8 235.4 213.7 14,304.2
less financial assistance for local
governments 807.1 635.6 512.9 309.3 168.4 80.5 55.9 36.1 2,605.8
less payments direct to local
governments 455.6 304.6 311.3 213.4 128.3 44.3 24.7 27.2 1,509.4
equals total payments to the states for
own-purpose expenses 36,489.2 30,118.5 27,856.5 10,362.0 10,063.7 4,044.7 2,217.7 4,410.4 125,562.8
(a) Payments for ‘Other purposes’ includes general revenue assistance to the states.

85
Pa
rt 3: A
ustra
lia’s
Fe
de
ral F
ina
ncia
l Rela
tion
s
Table 3.23: Other financial flows – estimated advances, repayment of advances and interest payments, 2020-21 $million NSW VIC QLD WA SA TAS ACT NT Total
Advances
Natural disaster relief - - 4.9 - - - - - 4.9
Total Advances - - 4.9 - - - - - 4.9
Repayments
Agriculture
Drought Concessional Loans Scheme -29.2 -26.2 -37.6 -1.5 -1.6 -7.2 - - -103.3
Drought Recovery Loans Scheme -3.6 -5.3 -3.0 - - - - - -11.9
Farm Finance Concessional
Loans Scheme -9.9 -2.6 -4.2 -3.9 - -2.0 - -1.0 -23.5
Environment
Northern Territory – water and
sewerage assistance - - - - - - - -3.8 -3.8
Housing
Commonwealth-State Housing
Agreement loans -37.0 - -10.3 -9.9 -3.4 - - -1.0 -61.7
Housing for service personnel -2.1 - -1.2 -0.3 -0.1 - - - -3.7
Other housing - - - - - - -8.3 - -8.3
Loan to NSW to assist beneficiaries of the
Asbestos Injuries Compensation Fund - - - - - - - - -
Natural disaster relief -4.3 - -13.4 - - -0.4 - - -18.1
Other purposes
ACT debt repayments - - - - - - -1.7 - -1.7
Loan Council – housing nominations -11.2 - -4.1 -7.1 -4.7 - - -3.7 -30.8
Total Repayments -97.3 -34.0 -73.8 -22.7 -9.7 -9.7 -10.0 -9.5 -266.7

| Fin
al B
udg
et O
utc
om
e 2
020–
21
86
Fin
al B
ud
ge
t Ou
tco
me
202
0–21
Table 3.23: Other financial flows – estimated advances, repayment of advances and interest payments, 2020-21 (continued) $million NSW VIC QLD WA SA TAS ACT NT Total
Interest
Agriculture
Drought Concessional Loans Scheme -1.2 -2.6 -1.7 .. -0.2 -0.5 - - -6.1
Drought Recovery Loans Scheme -0.2 -0.4 -0.2 - -0.1 .. - - -0.9
Farm Finance Concessional
Loans Scheme -0.2 -0.1 -0.1 -0.2 - -0.1 - .. -0.6
Environment
Northern Territory – water and
sewerage assistance - - - - - - - -2.5 -2.5
Housing
Commonwealth-State Housing
Agreement loans -18.3 - -5.3 -5.1 -1.5 - - -1.0 -31.1
Housing for service personnel -1.5 - -0.8 -0.1 -0.1 - - - -2.5
Other housing - - - - - - -4.8 - -4.8
Loan to NSW to assist beneficiaries of the
Asbestos Injuries Compensation Fund -2.2 - - - - - - - -2.2
Natural disaster relief -0.1 - -0.2 - - .. - - -0.3
Other purposes
ACT debt repayments - - - - - - .. - ..
Loan Council – housing nominations -15.5 - -5.6 -9.5 -6.8 - - -5.5 -42.8
USC Moreton Bay Precinct Loan - - -3.6 - - - - - -3.6
Total Interest -39.1 -3.1 -17.5 -14.8 -8.6 -0.6 -4.8 -8.9 -97.4
Net Financial Flow -136.4 -37.1 -86.3 -37.5 -18.3 -10.3 -14.8 -18.5 -359.2

87
Appendix A: Expenses by Function and Sub-function
Table A.1 sets out Australian Government general government sector expenses by
function and sub-function for 2020-21.

Final Budget Outcome 2020–21
88
Table A.1: Australian Government general government sector expenses by function and sub-function 2019-20 2020-21 2020-21 Change on
Outcome Estimate at Outcome 2021-22
2021-22 Budget
Budget
$m $m $m $m
General public services
Legislative and executive affairs 1,366 1,446 1,371 -75
Financial and fiscal affairs 7,302 9,013 8,848 -165
Foreign affairs and economic aid 6,270 6,949 6,470 -479
General research 2,940 3,238 3,069 -169
General services 855 1,237 1,283 46
Government superannuation benefits 10,739 11,153 10,900 -253
Total general public services 29,472 33,037 31,942 -1,094
Defence 33,187 33,375 34,007 633
Public order and safety
Courts and legal services 1,416 1,529 1,527 -1
Other public order and safety 4,973 5,184 5,127 -56
Total public order and safety 6,388 6,712 6,655 -58
Education
Higher education 9,652 11,369 11,318 -51
Vocational and other education 1,713 2,224 2,145 -79
Schools 22,305 22,061 22,159 97
Non-government schools 13,918 13,010 13,107 97
Government schools 8,387 9,052 9,052 0
School education - specific funding 722 705 678 -27
Student assistance 5,271 5,953 5,757 -196
General administration 222 292 274 -18
Total education 39,885 42,604 42,331 -272
Health
Medical services and benefits 32,668 36,841 35,785 -1,055
Pharmaceutical benefits and services 14,175 14,762 15,199 437
Assistance to the states for public hospitals 22,560 22,646 22,508 -138
Hospital services 1,248 1,143 1,032 -111
Health services 11,888 14,130 13,286 -844
General administration 3,510 4,036 3,955 -81
Aboriginal and Torres Strait Islander health 973 975 975 0
Total health 87,023 94,533 92,740 -1,793
Social security and welfare
Assistance to the aged 71,855 78,100 77,009 -1,091
Assistance to veterans and dependants 7,711 8,050 7,853 -197
Assistance to people with disabilities 49,038 56,881 55,959 -923
Assistance to families with children 38,604 42,252 41,245 -1,007

Appendix A: Expenses by Function and Sub function
89
Table A.1: Australian Government general government sector expenses by function and sub-function (continued) 2019-20 2020-21 2020-21 Change on
Outcome Estimate at Outcome 2021-22
2021-22 Budget
Budget
$m $m $m $m
Social security and welfare
(continued)
Assistance to the unemployed and
the sick 20,128 31,266 29,718 -1,548
Other welfare programs 1,869 1,847 1,745 -101
Assistance for Indigenous Australians nec 2,388 2,431 2,334 -97
General administration 4,526 4,567 4,498 -69
Total social security and welfare 196,119 225,394 220,360 -5,034
Housing and community amenities
Housing 2,752 3,735 3,642 -93
Urban and regional development 1,292 1,476 1,176 -299
Environment protection 1,288 1,743 1,473 -270
Total housing and community
amenities 5,332 6,953 6,291 -662
Recreation and culture
Broadcasting 1,500 1,507 1,502 -6
Arts and cultural heritage 1,439 1,699 1,567 -133
Sport and recreation 544 615 541 -73
National estate and parks 487 584 487 -97
Total recreation and culture 3,971 4,405 4,096 -309
Fuel and energy 7,892 9,090 8,242 -848
Agriculture, forestry and fishing
Wool industry 58 50 50 0
Grains industry 199 204 185 -20
Dairy industry 55 53 54 1
Cattle, sheep and pig industry 230 244 230 -15
Fishing, horticulture and other agriculture 393 483 469 -14
General assistance not allocated to
specific industries 39 44 36 -8
Rural assistance 426 1,170 806 -364
Natural resources development 431 859 430 -429
General administration 754 906 906 0
Total agriculture, forestry and fishing 2,584 4,014 3,165 -849
Mining, manufacturing and construction 2,819 4,394 4,034 -360
Transport and communication
Communication 679 1,244 1,094 -150
Rail transport 555 1,376 1,328 -48
Air transport 935 2,732 2,185 -547
Road transport 4,499 7,765 7,554 -211
Sea transport 438 458 427 -31
Other transport and communication 216 253 216 -37
Total transport and communication 7,321 13,828 12,804
-1,025

Final Budget Outcome 2020–21
90
Table A.1: Australian Government general government sector expenses by function and sub-function (continued) 2019-20 2020-21 2020-21 Change on
Outcome Estimate at Outcome 2021-22
2021-22 Budget
Budget
$m $m $m $m
Other economic affairs
Tourism and area promotion 165 227 210 -16
Total labour and employment affairs 3,810 6,546 5,260 -1,286
Vocational and industry training 1,083 3,061 2,495 -566
Labour market assistance to job seekers
and industry 2,024 2,687 2,111 -576
Industrial relations 702 798 654 -144
Immigration 3,488 3,622 3,419 -204
Other economic affairs nec 58,030 73,424 73,179 -246
Total other economic affairs 65,494 83,819 82,067 -1,752
Other purposes
Public debt interest 16,923 17,123 17,123 0
Interest on Commonwealth
Government's behalf 16,923 17,123 17,123 0
Nominal superannuation interest 7,673 7,004 7,177 173
General purpose inter-government
transactions 64,603 75,250 78,538 3,288
General revenue assistance -
states and territories 62,027 71,729 75,097 3,368
Local government assistance 2,576 3,520 3,441 -79
Natural disaster relief 1,863 748 344 -404
Contingency reserve 0 -2,845 0 2,845
Total other purposes 91,062 97,279 103,182 5,902
Total expenses 578,549 659,437 651,916 -7,521

91
Appendix B: Historical Australian Government Data
This appendix reports historical data for the Australian Government fiscal aggregates
across the general government, public non-financial corporations and non-financial
public sectors.
Data sources
Data are sourced from Australian Government Final Budget Outcomes, the Australian
Bureau of Statistics (ABS), the Australian Office of Financial Management and
Australian Government Consolidated Financial Statements.
• Accrual data from 1996-97 onwards and cash data, net debt data, net financial worth
data and net worth data from 1999-2000 onwards are sourced from Australian
Government Final Budget Outcomes. Back-casting adjustments for accounting
classification changes and other revisions have been made from 1998-99 onwards
where applicable.
• Cash data prior to 1999-2000 are sourced from ABS data, which have been calculated
using methodology consistent with that used for later years in ABS cat. no. 5512.0
Government Finance Statistics.
• Net debt data prior to 1999-2000 are from ABS cat. no. 5512.0 Government Finance
Statistics 2003-04 in 1998-99, ABS cat. no. 5501.0 Government Financial Estimates
1999-2000 and ABS cat. no. 5513.0 Public Sector Financial Assets and Liabilities 1998
from 1987-88 to 1997-98, and Treasury estimates (see Treasury’s Economic Roundup,
Spring 1996, pages 97-103) prior to 1987-88.
Comparability of data across years
The data set contains a number of structural breaks owing to accounting classification
differences and changes to the structure of the budget which cannot be eliminated
through back-casting because of data limitations. These breaks can affect the
comparability of data across years, especially when the analysis is taken over a large
number of years. Specific factors causing structural breaks include:
• Most recent accounting classification changes that require revisions to the historical
series have been back-cast (where applicable) to 1998-99, ensuring that data are
consistent across the accrual period from 1998-99 onwards. However, because of data
limitations, these changes have not been back-cast to earlier years.

Final Budget Outcome 2020–21
92
• From 2019-20 onwards, as a result of the implementation of the accounting standard
AASB 16 Leases the distinction between operating and finance leases for lessees has
been removed. This has a number of implications for the budget aggregates, in
particular net debt and net financial worth. Due to data limitations, these changes
have not been back-cast to earlier years.
• From 2005-06 onwards, underlying Government Finance Statistics (GFS) data are
provided by agencies in accordance with Australian Accounting Standards (AAS),
which includes International Financial Reporting Standards (IFRS) as adopted in
Australia. Prior to 2005-06, underlying GFS data are based on data provided by
agencies applying AAS prior to the adoption of IFRS.
• Prior to 1999-2000, Australian Government general government sector debt
instruments are valued at historic cost, whereas from 1999-2000 onwards they are
valued at market prices (consistent with accrual GFS standards). This affects net debt
and net interest payments.
• Cash data up to and including 1997-98 are calculated under a cash accounting
framework, while cash data from 1998-99 onwards are derived from an accrual
accounting framework.4 Although the major methodological differences associated
with the move to the accrual framework have been eliminated through back-casting,
comparisons across the break may still be affected by changes to some data sources
and collection methodologies.
• Adjustments in the coverage of agencies are included in the accounts of the different
sectors. These include the reclassification of Central Banking Authorities from the
general government to the public financial corporations sector in 1998-99, and
subsequent back-casting to account for this change.
• Changes have been made in arrangements for transfer payments, where tax
concessions or rebates are replaced by payments through the social security system.
This has the effect of increasing both cash receipts and payments, as compared with
earlier periods, but not changing cash balances. Changes in the opposite direction
reduce both cash payments and receipts.
• Classification differences in the data relating to the period prior to 1976-77 mean that
earlier data may not be entirely consistent with data for 1976-77 onwards.
4 Prior to the 2008-09 Budget, cash data calculated under the cash accounting framework was
used up to and including 1998-99. In the 2008-09 Budget, cash data prior to 1998-99 have been replaced by ABS data derived from the accrual framework.

Appendix B: Historical Australian Government Data
93
Revisions to previously published data
Under the accrual GFS framework and generally under AAS, flows are recorded in the
period in which they occurred. As a result, prior period outcomes may be revised for
classification changes relating to information that could reasonably have been expected
to be known in the past, is material in at least one of the affected periods, and can be
reliably assigned to the relevant period(s).
There have been no material classification changes that have resulted in back-casting in
this update.

Final Budget Outcome 2020–21
94
Table B.1: Australian Government general government sector receipts, payments, net Future Fund earnings and underlying cash balance(a) Net Future Underlying
Fund cash
Receipts(b) Payments(c) earnings balance(d)
Per cent Per cent real Per cent Per cent $m of GDP $m growth(e) of GDP $m $m of GDP
1970-71 8,290 20.6 7,389 na 18.3 - 901 2.2
1971-72 9,135 20.5 8,249 4.1 18.5 - 886 2.0
1972-73 9,735 19.6 9,388 7.7 18.9 - 348 0.7
1973-74 12,228 20.3 11,078 4.2 18.4 - 1,150 1.9
1974-75 15,643 22.0 15,463 19.9 21.7 - 181 0.3
1975-76 18,727 22.5 20,225 15.7 24.3 - -1,499 -1.8
1976-77 21,890 22.8 23,157 0.6 24.1 - -1,266 -1.3
1977-78 24,019 22.9 26,057 2.7 24.8 - -2,037 -1.9
1978-79 26,129 22.0 28,272 0.3 23.8 - -2,142 -1.8
1979-80 30,321 22.6 31,642 1.5 23.5 - -1,322 -1.0
1980-81 35,993 23.7 36,176 4.6 23.8 - -184 -0.1
1981-82 41,499 23.6 41,151 2.9 23.4 - 348 0.2
1982-83 45,463 24.0 48,810 6.3 25.8 - -3,348 -1.8
1983-84 49,981 23.4 56,990 9.4 26.7 - -7,008 -3.3
1984-85 58,817 25.0 64,853 9.1 27.6 - -6,037 -2.6
1985-86 66,206 25.4 71,328 1.5 27.4 - -5,122 -2.0
1986-87 74,724 26.2 77,158 -1.1 27.0 - -2,434 -0.9
1987-88 83,491 25.8 82,039 -0.9 25.3 - 1,452 0.4
1988-89 90,748 24.7 85,326 -3.1 23.2 - 5,421 1.5
1989-90 98,625 24.4 92,684 0.6 22.9 - 5,942 1.5
1990-91 100,227 24.2 100,665 3.1 24.3 - -438 -0.1
1991-92 95,840 22.7 108,472 5.7 25.7 - -12,631 -3.0
1992-93 97,633 22.0 115,751 5.6 26.1 - -18,118 -4.1
1993-94 103,824 22.3 122,009 3.5 26.2 - -18,185 -3.9
1994-95 113,458 22.9 127,619 1.4 25.8 - -14,160 -2.9
1995-96 124,429 23.6 135,538 1.9 25.7 - -11,109 -2.1
1996-97 133,592 24.1 139,689 1.7 25.2 - -6,099 -1.1
1997-98 140,736 23.9 140,587 0.6 23.9 - 149 0.0
1998-99 152,063 24.5 148,175 4.1 23.9 - 3,889 0.6
1999-00 166,199 25.1 153,192 1.0 23.2 - 13,007 2.0
2000-01 182,996 26.0 177,123 9.1 25.1 - 5,872 0.8
2001-02 187,588 24.9 188,655 3.5 25.0 - -1,067 -0.1
2002-03 204,613 25.5 197,243 1.4 24.6 - 7,370 0.9
2003-04 217,775 25.3 209,785 3.9 24.4 - 7,990 0.9
2004-05 235,984 25.6 222,407 3.5 24.1 - 13,577 1.5
2005-06 255,943 25.7 240,136 4.6 24.1 51 15,757 1.6
2006-07 272,637 25.1 253,321 2.5 23.3 2,127 17,190 1.6
2007-08 294,917 25.0 271,843 3.8 23.1 3,319 19,754 1.7
2008-09 292,600 23.2 316,046 12.7 25.1 3,566 -27,013 -2.1
2009-10 284,662 21.9 336,900 4.2 25.9 2,256 -54,494 -4.2

Appendix B: Historical Australian Government Data
95
Table B.1: Australian Government general government sector receipts, payments, net Future Fund earnings and underlying cash balance(a) (continued) Net Future Underlying
Fund cash
Receipts(b) Payments(c) earnings balance(d)
Per cent Per cent real Per cent Per cent $m of GDP $m growth(e) of GDP $m $m of GDP
2010-11 302,024 21.3 346,102 -0.4 24.4 3,385 -47,463 -3.4
2011-12 329,874 22.0 371,032 4.8 24.7 2,203 -43,360 -2.9
2012-13 351,052 22.9 367,204 -3.2 23.9 2,682 -18,834 -1.2
2013-14 360,322 22.5 406,430 7.8 25.4 2,348 -48,456 -3.0
2014-15 378,301 23.3 412,079 -0.3 25.4 4,089 -37,867 -2.3
2015-16 386,924 23.3 423,328 1.3 25.5 3,202 -39,606 -2.4
2016-17 409,868 23.3 439,375 2.0 24.9 3,644 -33,151 -1.9
2017-18 446,905 24.2 452,742 1.1 24.5 4,305 -10,141 -0.5
2018-19 485,286 24.9 478,098 3.9 24.5 7,878 -690 0.0
2019-20 469,398 23.6 549,634 13.4 27.7 5,036 -85,272 -4.3
2020-21 519,913 25.1 654,084 17.1 31.6 6,619 -134,171 -6.5
(a) Data have been revised in the 2020-21 Final Budget Outcome to improve accuracy and comparability through time.
(b) Receipts are equal to cash receipts from operating activities and sales of non-financial assets. (c) Payments are equal to cash payments for operating activities, purchases of non-financial assets and net
cash flows from financing activities for leases. (d) Between 2005-06 and 2019-20, the underlying cash balance is equal to receipts less payments, less net
Future Fund earnings. In all other years, the underlying cash balance is equal to receipts less payments. (e) Real spending growth is calculated using the Consumer Price Index as the deflator.

Final Budget Outcome 2020–21
96
Table B.2: Australian Government general government sector net cash flows from investments in financial assets for policy purposes and headline cash balance(a) Net cash flows
from investments in Headline financial assets for cash Receipts Payments policy purposes(b) balance(c) Per cent Per cent
$m $m $m of GDP $m of GDP
1970-71 8,290 7,389 -851 -2.1 50 0.1
1971-72 9,135 8,249 -987 -2.2 -101 -0.2
1972-73 9,735 9,388 -977 -2.0 -629 -1.3
1973-74 12,228 11,078 -1,275 -2.1 -125 -0.2
1974-75 15,643 15,463 -2,648 -3.7 -2,467 -3.5
1975-76 18,727 20,225 -2,040 -2.5 -3,539 -4.3
1976-77 21,890 23,157 -1,530 -1.6 -2,796 -2.9
1977-78 24,019 26,057 -1,324 -1.3 -3,361 -3.2
1978-79 26,129 28,272 -1,074 -0.9 -3,216 -2.7
1979-80 30,321 31,642 -702 -0.5 -2,024 -1.5
1980-81 35,993 36,176 -962 -0.6 -1,146 -0.8
1981-82 41,499 41,151 -1,008 -0.6 -660 -0.4
1982-83 45,463 48,810 -1,363 -0.7 -4,711 -2.5
1983-84 49,981 56,990 -1,136 -0.5 -8,144 -3.8
1984-85 58,817 64,853 -922 -0.4 -6,959 -3.0
1985-86 66,206 71,328 -810 -0.3 -5,932 -2.3
1986-87 74,724 77,158 -545 -0.2 -2,979 -1.0
1987-88 83,491 82,039 657 0.2 2,109 0.7
1988-89 90,748 85,326 168 0.0 5,589 1.5
1989-90 98,625 92,684 1,217 0.3 7,159 1.8
1990-91 100,227 100,665 1,563 0.4 1,125 0.3
1991-92 95,840 108,472 2,156 0.5 -10,475 -2.5
1992-93 97,633 115,751 2,471 0.6 -15,647 -3.5
1993-94 103,824 122,009 3,447 0.7 -14,738 -3.2
1994-95 113,458 127,619 1,546 0.3 -12,614 -2.6
1995-96 124,429 135,538 5,188 1.0 -5,921 -1.1
1996-97 133,592 139,689 7,241 1.3 1,142 0.2
1997-98 140,736 140,587 15,154 2.6 15,303 2.6
1998-99 152,063 148,175 6,948 1.1 10,837 1.7
1999-00 166,199 153,192 9,500 1.4 22,507 3.4
2000-01 182,996 177,123 5,673 0.8 11,545 1.6
2001-02 187,588 188,655 3,422 0.5 2,355 0.3
2002-03 204,613 197,243 -229 0.0 7,141 0.9
2003-04 217,775 209,785 -452 -0.1 7,538 0.9
2004-05 235,984 222,407 -1,139 -0.1 12,438 1.3
2005-06 255,943 240,136 -1,647 -0.2 14,160 1.4
2006-07 272,637 253,321 7,403 0.7 26,720 2.5
2007-08 294,917 271,843 5,108 0.4 28,181 2.4
2008-09 292,600 316,046 -7,889 -0.6 -31,336 -2.5
2009-10 284,662 336,900 -4,278 -0.3 -56,516 -4.3

Appendix B: Historical Australian Government Data
97
Table B.2: Australian Government general government sector net cash flows from investments in financial assets for policy purposes and headline cash balance(a) (continued) Net cash flows
from investments in Headline financial assets for cash Receipts Payments policy purposes(b) balance(c) Per cent Per cent
$m $m $m of GDP $m of GDP
2010-11 302,024 346,102 -7,028 -0.5 -51,106 -3.6
2011-12 329,874 371,032 -5,866 -0.4 -47,023 -3.1
2012-13 351,052 367,204 -4,802 -0.3 -20,954 -1.4
2013-14 360,322 406,430 -6,371 -0.4 -52,479 -3.3
2014-15 378,301 412,079 -5,158 -0.3 -38,936 -2.4
2015-16 386,924 423,328 -12,684 -0.8 -49,088 -3.0
2016-17 409,868 439,375 -13,501 -0.8 -43,008 -2.4
2017-18 446,905 452,742 -20,041 -1.1 -25,878 -1.4
2018-19 485,286 478,098 -14,387 -0.7 -7,199 -0.4
2019-20 469,398 549,634 -13,632 -0.7 -93,868 -4.7
2020-21 519,913 654,084 -3,364 -0.2 -137,535 -6.7
(a) Data have been revised in the 2020-21 Final Budget Outcome to improve accuracy and comparability through time.
(b) Prior to 1999-2000, net cash flows from investments in financial assets for policy purposes were referred to as ‘net advances’. A negative number reflects a cash outflow, while a positive number reflects a cash inflow.
(c) Headline cash balance is equal to receipts less payments, plus net cash flows from investments in financial assets for policy purposes. Receipts and payments are identical to Table B.1.

Final Budget Outcome 2020–21
98
Table B.3: Australian Government general government sector taxation receipts, non-taxation receipts and total receipts(a) Taxation receipts Non-taxation receipts Total receipts(b)
Per cent Per cent Per cent $m of GDP $m of GDP $m of GDP
1970-71 7,193 17.8 1,097 2.7 8,290 20.6
1971-72 7,895 17.7 1,240 2.8 9,135 20.5
1972-73 8,411 16.9 1,324 2.7 9,735 19.6
1973-74 10,832 18.0 1,396 2.3 12,228 20.3
1974-75 14,141 19.9 1,502 2.1 15,643 22.0
1975-76 16,920 20.3 1,807 2.2 18,727 22.5
1976-77 19,714 20.5 2,176 2.3 21,890 22.8
1977-78 21,428 20.4 2,591 2.5 24,019 22.9
1978-79 23,409 19.7 2,720 2.3 26,129 22.0
1979-80 27,473 20.4 2,848 2.1 30,321 22.6
1980-81 32,641 21.5 3,352 2.2 35,993 23.7
1981-82 37,880 21.6 3,619 2.1 41,499 23.6
1982-83 41,025 21.7 4,438 2.3 45,463 24.0
1983-84 44,849 21.0 5,132 2.4 49,981 23.4
1984-85 52,970 22.5 5,847 2.5 58,817 25.0
1985-86 58,841 22.6 7,365 2.8 66,206 25.4
1986-87 66,467 23.3 8,257 2.9 74,724 26.2
1987-88 75,076 23.2 8,415 2.6 83,491 25.8
1988-89 83,452 22.7 7,296 2.0 90,748 24.7
1989-90 90,773 22.5 7,852 1.9 98,625 24.4
1990-91 92,739 22.4 7,488 1.8 100,227 24.2
1991-92 87,364 20.7 8,476 2.0 95,840 22.7
1992-93 88,760 20.0 8,873 2.0 97,633 22.0
1993-94 93,362 20.0 10,462 2.2 103,824 22.3
1994-95 104,921 21.2 8,537 1.7 113,458 22.9
1995-96 115,700 21.9 8,729 1.7 124,429 23.6
1996-97 124,559 22.4 9,033 1.6 133,592 24.1
1997-98 130,984 22.3 9,752 1.7 140,736 23.9
1998-99 138,420 22.3 13,643 2.2 152,063 24.5
1999-00 151,313 22.9 14,887 2.3 166,199 25.1
2000-01 170,354 24.2 12,641 1.8 182,996 26.0
2001-02 175,371 23.3 12,218 1.6 187,588 24.9
2002-03 192,391 24.0 12,222 1.5 204,613 25.5
2003-04 206,734 24.0 11,041 1.3 217,775 25.3
2004-05 223,986 24.3 11,999 1.3 235,984 25.6
2005-06 241,987 24.3 13,956 1.4 255,943 25.7
2006-07 258,252 23.8 14,385 1.3 272,637 25.1
2007-08 279,317 23.7 15,600 1.3 294,917 25.0
2008-09 273,674 21.7 18,926 1.5 292,600 23.2
2009-10 262,167 20.1 22,495 1.7 284,662 21.9

Appendix B: Historical Australian Government Data
99
Table B.3: Australian Government general government sector taxation receipts, non-taxation receipts and total receipts(a) (continued) Taxation receipts Non-taxation receipts Total receipts(b)
Per cent Per cent Per cent $m of GDP $m of GDP $m of GDP
2010-11 282,106 19.9 19,918 1.4 302,024 21.3
2011-12 311,269 20.8 18,606 1.2 329,874 22.0
2012-13 327,835 21.3 23,218 1.5 351,052 22.9
2013-14 340,283 21.3 20,038 1.3 360,322 22.5
2014-15 353,883 21.8 24,418 1.5 378,301 23.3
2015-16 362,387 21.8 24,537 1.5 386,924 23.3
2016-17 379,271 21.5 30,597 1.7 409,868 23.3
2017-18 418,053 22.6 28,853 1.6 446,905 24.2
2018-19 448,579 23.0 36,707 1.9 485,286 24.9
2019-20 431,775 21.7 37,623 1.9 469,398 23.6
2020-21 473,850 22.9 46,063 2.2 519,913 25.1
(a) Data have been revised in the 2020-21 Final Budget Outcome to improve accuracy and comparability through time.
(b) Receipts are equal to receipts from operating activities and sales of non-financial assets. Receipts are identical to Table B.1.
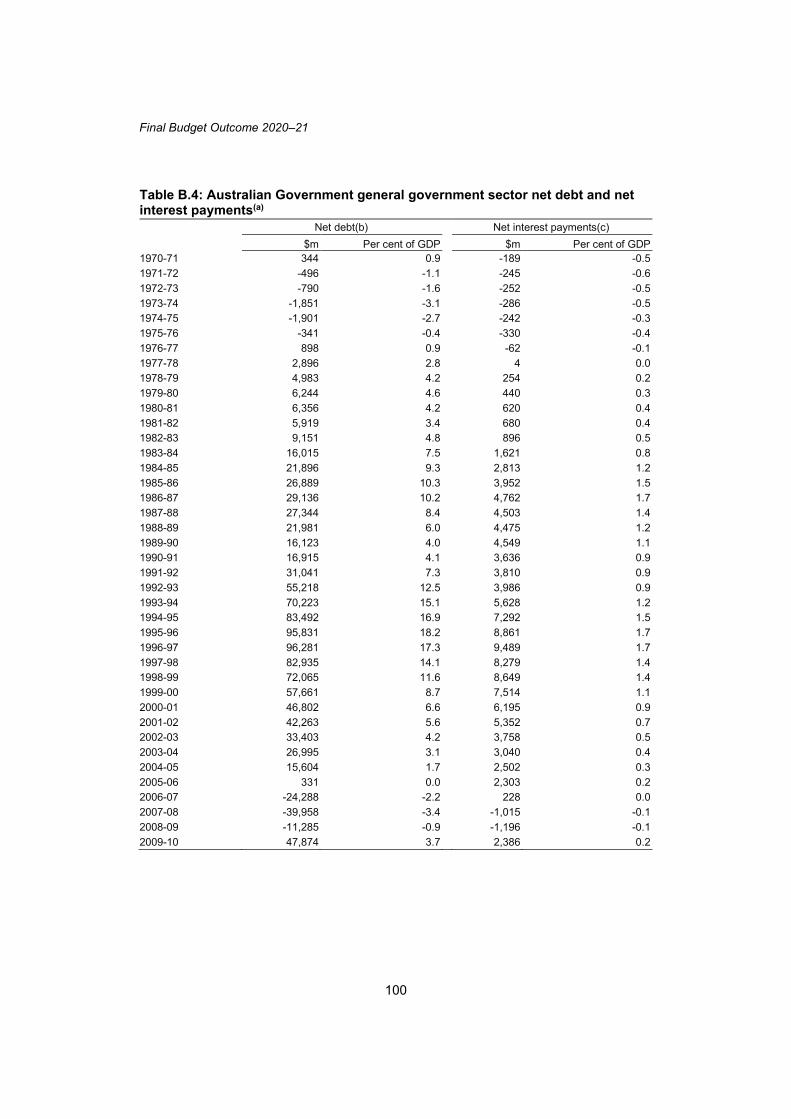
Final Budget Outcome 2020–21
100
Table B.4: Australian Government general government sector net debt and net interest payments(a) Net debt(b) Net interest payments(c)
$m Per cent of GDP $m Per cent of GDP
1970-71 344 0.9 -189 -0.5
1971-72 -496 -1.1 -245 -0.6
1972-73 -790 -1.6 -252 -0.5
1973-74 -1,851 -3.1 -286 -0.5
1974-75 -1,901 -2.7 -242 -0.3
1975-76 -341 -0.4 -330 -0.4
1976-77 898 0.9 -62 -0.1
1977-78 2,896 2.8 4 0.0
1978-79 4,983 4.2 254 0.2
1979-80 6,244 4.6 440 0.3
1980-81 6,356 4.2 620 0.4
1981-82 5,919 3.4 680 0.4
1982-83 9,151 4.8 896 0.5
1983-84 16,015 7.5 1,621 0.8
1984-85 21,896 9.3 2,813 1.2
1985-86 26,889 10.3 3,952 1.5
1986-87 29,136 10.2 4,762 1.7
1987-88 27,344 8.4 4,503 1.4
1988-89 21,981 6.0 4,475 1.2
1989-90 16,123 4.0 4,549 1.1
1990-91 16,915 4.1 3,636 0.9
1991-92 31,041 7.3 3,810 0.9
1992-93 55,218 12.5 3,986 0.9
1993-94 70,223 15.1 5,628 1.2
1994-95 83,492 16.9 7,292 1.5
1995-96 95,831 18.2 8,861 1.7
1996-97 96,281 17.3 9,489 1.7
1997-98 82,935 14.1 8,279 1.4
1998-99 72,065 11.6 8,649 1.4
1999-00 57,661 8.7 7,514 1.1
2000-01 46,802 6.6 6,195 0.9
2001-02 42,263 5.6 5,352 0.7
2002-03 33,403 4.2 3,758 0.5
2003-04 26,995 3.1 3,040 0.4
2004-05 15,604 1.7 2,502 0.3
2005-06 331 0.0 2,303 0.2
2006-07 -24,288 -2.2 228 0.0
2007-08 -39,958 -3.4 -1,015 -0.1
2008-09 -11,285 -0.9 -1,196 -0.1
2009-10 47,874 3.7 2,386 0.2

Appendix B: Historical Australian Government Data
101
Table B.4: Australian Government general government sector net debt and net interest payments(a) (continued) Net debt(b) Net interest payments(c)
$m Per cent of GDP $m Per cent of GDP
2010-11 90,660 6.4 4,608 0.3
2011-12 153,443 10.2 6,609 0.4
2012-13 159,594 10.4 8,285 0.5
2013-14 209,559 13.1 10,843 0.7
2014-15 245,817 15.1 10,868 0.7
2015-16 303,467 18.3 12,041 0.7
2016-17 322,320 18.3 12,365 0.7
2017-18 341,961 18.5 13,135 0.7
2018-19 373,566 19.1 15,149 0.8
2019-20 491,217 24.7 13,280 0.7
2020-21 592,221 28.6 14,290 0.7
(a) Data have been revised in the 2020-21 Final Budget Outcome to improve accuracy and comparability through time.
(b) Net debt is the sum of interest bearing liabilities less the sum of selected financial assets (cash and deposits, advances paid, and investments, loans and placements).
(c) Net interest payments are equal to the difference between interest paid and interest receipts.
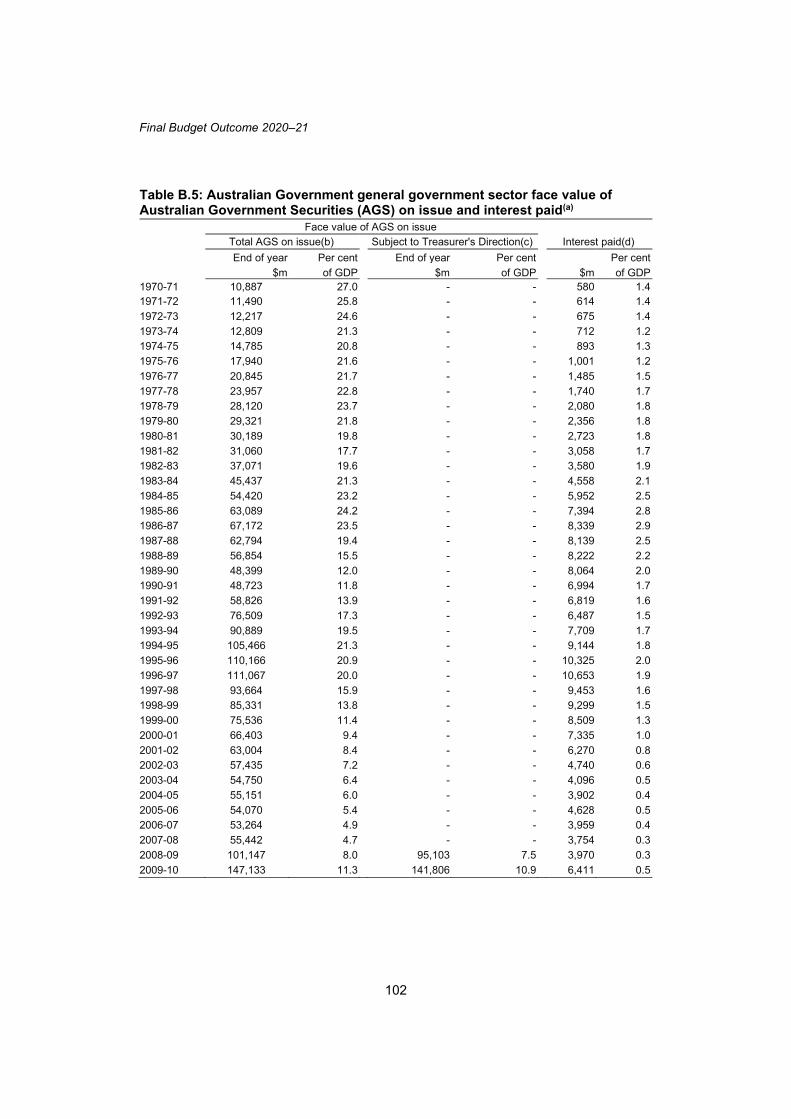
Final Budget Outcome 2020–21
102
Table B.5: Australian Government general government sector face value of Australian Government Securities (AGS) on issue and interest paid(a) Face value of AGS on issue
Total AGS on issue(b) Subject to Treasurer's Direction(c) Interest paid(d)
End of year Per cent End of year Per cent Per cent
$m of GDP $m of GDP $m of GDP
1970-71 10,887 27.0 - - 580 1.4
1971-72 11,490 25.8 - - 614 1.4
1972-73 12,217 24.6 - - 675 1.4
1973-74 12,809 21.3 - - 712 1.2
1974-75 14,785 20.8 - - 893 1.3
1975-76 17,940 21.6 - - 1,001 1.2
1976-77 20,845 21.7 - - 1,485 1.5
1977-78 23,957 22.8 - - 1,740 1.7
1978-79 28,120 23.7 - - 2,080 1.8
1979-80 29,321 21.8 - - 2,356 1.8
1980-81 30,189 19.8 - - 2,723 1.8
1981-82 31,060 17.7 - - 3,058 1.7
1982-83 37,071 19.6 - - 3,580 1.9
1983-84 45,437 21.3 - - 4,558 2.1
1984-85 54,420 23.2 - - 5,952 2.5
1985-86 63,089 24.2 - - 7,394 2.8
1986-87 67,172 23.5 - - 8,339 2.9
1987-88 62,794 19.4 - - 8,139 2.5
1988-89 56,854 15.5 - - 8,222 2.2
1989-90 48,399 12.0 - - 8,064 2.0
1990-91 48,723 11.8 - - 6,994 1.7
1991-92 58,826 13.9 - - 6,819 1.6
1992-93 76,509 17.3 - - 6,487 1.5
1993-94 90,889 19.5 - - 7,709 1.7
1994-95 105,466 21.3 - - 9,144 1.8
1995-96 110,166 20.9 - - 10,325 2.0
1996-97 111,067 20.0 - - 10,653 1.9
1997-98 93,664 15.9 - - 9,453 1.6
1998-99 85,331 13.8 - - 9,299 1.5
1999-00 75,536 11.4 - - 8,509 1.3
2000-01 66,403 9.4 - - 7,335 1.0
2001-02 63,004 8.4 - - 6,270 0.8
2002-03 57,435 7.2 - - 4,740 0.6
2003-04 54,750 6.4 - - 4,096 0.5
2004-05 55,151 6.0 - - 3,902 0.4
2005-06 54,070 5.4 - - 4,628 0.5
2006-07 53,264 4.9 - - 3,959 0.4
2007-08 55,442 4.7 - - 3,754 0.3
2008-09 101,147 8.0 95,103 7.5 3,970 0.3
2009-10 147,133 11.3 141,806 10.9 6,411 0.5

Appendix B: Historical Australian Government Data
103
Table B.5: Australian Government general government sector face value of Australian Government Securities (AGS) on issue and interest paid(a) (continued) Face value of AGS on issue
Total AGS on issue(b) Subject to Treasurer's Direction(c) Interest paid(d)
End of year Per cent End of year Per cent Per cent
$m of GDP $m of GDP $m of GDP
2010-11 191,292 13.5 186,704 13.2 9,551 0.7
2011-12 233,976 15.6 229,389 15.3 10,875 0.7
2012-13 257,378 16.8 252,791 16.5 11,846 0.8
2013-14 319,487 20.0 316,952 19.8 13,972 0.9
2014-15 368,738 22.7 366,202 22.5 13,924 0.9
2015-16 420,420 25.3 417,936 25.2 14,977 0.9
2016-17 500,979 28.4 498,510 28.3 15,290 0.9
2017-18 531,937 28.8 529,467 28.6 16,568 0.9
2018-19 541,992 27.8 541,986 27.8 18,951 1.0
2019-20 684,298 34.5 684,292 34.5 16,524 0.8
2020-21 816,991 39.5 816,985 39.5 17,102 0.8
(a) Data have been revised in the 2020-21 Final Budget Outcome to improve accuracy and comparability through time.
(b) Total AGS on issue includes AGS held on behalf of the states and the Northern Territory. (c) The face value of AGS subject to the Treasurer’s Direction excludes the stock and securities outlined in
subsection 51JA(2A) of the Commonwealth Inscribed Stock Act 1911. These are the same stock and securities that were excluded from the previous legislative debt limit. AGS on issue subject to the Treasurer’s Direction are not available prior to 2008-09 because the limit was first introduced in July 2008.
(d) Interest paid consists of all cash interest payments of the general government sector, including those relating to AGS on issue.

Fin
al B
ud
ge
t Ou
tco
me
202
0–21
104
Table B.6: Australian Government general government sector revenue, expenses, net operating balance, net capital investment and fiscal balance(a) Revenue Expenses Net operating balance(b) Net capital investment Fiscal balance(c)
Per cent Per cent Per cent Per cent Per cent
$m of GDP $m of GDP $m of GDP $m of GDP $m of GDP
1996-97 141,688 25.5 145,940 26.3 -4,252 -0.8 90 0.0 -4,342 -0.8
1997-98 146,820 25.0 148,788 25.3 -1,968 -0.3 147 0.0 -2,115 -0.4
1998-99 152,106 24.5 146,925 23.7 5,181 0.8 1,433 0.2 3,748 0.6
1999-00 167,304 25.3 155,728 23.6 11,576 1.8 -69 0.0 11,645 1.8
2000-01 186,106 26.4 180,277 25.6 5,829 0.8 8 0.0 5,820 0.8
2001-02 190,432 25.2 193,214 25.6 -2,782 -0.4 382 0.1 -3,164 -0.4
2002-03 206,778 25.8 201,402 25.1 5,376 0.7 287 0.0 5,088 0.6
2003-04 222,042 25.8 215,634 25.0 6,409 0.7 660 0.1 5,749 0.7
2004-05 242,354 26.3 229,427 24.9 12,926 1.4 1,034 0.1 11,892 1.3
2005-06 260,569 26.2 241,977 24.3 18,592 1.9 2,498 0.3 16,094 1.6
2006-07 277,895 25.6 259,197 23.9 18,698 1.7 2,333 0.2 16,365 1.5
2007-08 303,402 25.8 280,335 23.8 23,068 2.0 2,593 0.2 20,475 1.7
2008-09 298,508 23.7 324,889 25.8 -26,382 -2.1 4,064 0.3 -30,445 -2.4
2009-10 292,387 22.5 340,354 26.2 -47,967 -3.7 6,433 0.5 -54,400 -4.2
2010-11 309,204 21.8 356,710 25.2 -47,506 -3.4 5,297 0.4 -52,802 -3.7
2011-12 337,324 22.5 377,948 25.2 -40,624 -2.7 4,850 0.3 -45,474 -3.0
2012-13 359,496 23.4 383,351 25.0 -23,855 -1.6 987 0.1 -24,842 -1.6
2013-14 374,151 23.4 415,691 26.0 -41,540 -2.6 3,850 0.2 -45,390 -2.8
2014-15 379,455 23.4 418,956 25.8 -39,501 -2.4 2,706 0.2 -42,206 -2.6
2015-16 395,055 23.8 430,739 25.9 -35,684 -2.1 3,829 0.2 -39,513 -2.4

Ap
pe
ndix
B: H
isto
rica
l Au
stra
lian
Gove
rnm
en
t Data
105
Table B.6: Australian Government general government sector revenue, expenses, net operating balance, net capital investment and fiscal balance(a) (continued) Revenue Expenses Net operating balance(b) Net capital investment Fiscal balance(c)
Per cent Per cent Per cent Per cent Per cent
$m of GDP $m of GDP $m of GDP $m of GDP $m of GDP
2016-17 415,723 23.6 449,712 25.5 -33,989 -1.9 2,876 0.2 -36,865 -2.1
2017-18 456,280 24.7 461,490 25.0 -5,209 -0.3 1,284 0.1 -6,493 -0.4
2018-19 493,346 25.3 485,869 24.9 7,476 0.4 6,126 0.3 1,350 0.1
2019-20 486,278 24.5 578,117 29.1 -91,839 -4.6 4,005 0.2 -95,844 -4.8
2020-21 523,012 25.3 651,916 31.5 -128,904 -6.2 7,204 0.3 -136,108 -6.6
(a) Data have been revised in the 2020-21 Final Budget Outcome to improve accuracy and comparability through time. (b) Net operating balance is equal to revenue less expenses. (c) Fiscal balance is equal to revenue less expenses less net capital investment.

Final Budget Outcome 2020–21
106
Table B.7: Australian Government general government sector net worth and net financial worth(a) Net worth(b) Net financial worth(c)
Per cent Per cent
$m of GDP $m of GDP
1999-00 -10,424 -1.6 -70,414 -10.7
2000-01 -10,287 -1.5 -75,544 -10.7
2001-02 -15,330 -2.0 -81,707 -10.8
2002-03 -18,856 -2.4 -86,456 -10.8
2003-04 -4,740 -0.6 -75,976 -8.8
2004-05 11,066 1.2 -62,372 -6.8
2005-06 14,293 1.4 -63,442 -6.4
2006-07 42,677 3.9 -39,370 -3.6
2007-08 67,122 5.7 -18,428 -1.6
2008-09 15,452 1.2 -75,465 -6.0
2009-10 -50,383 -3.9 -148,930 -11.4
2010-11 -100,504 -7.1 -203,904 -14.4
2011-12 -252,046 -16.8 -360,672 -24.1
2012-13 -207,769 -13.5 -317,843 -20.7
2013-14 -261,596 -16.4 -375,882 -23.5
2014-15 -308,390 -19.0 -427,169 -26.3
2015-16 -423,674 -25.5 -548,028 -33.0
2016-17 -390,897 -22.2 -529,225 -30.0
2017-18 -418,135 -22.6 -562,183 -30.4
2018-19 -543,459 -27.8 -694,448 -35.6
2019-20 -664,892 -33.5 -840,557 -42.3
2020-21 -725,230 -35.1 -905,924 -43.8
(a) Data have been revised in the 2020-21 Final Budget Outcome to improve accuracy and comparability through time.
(b) Net worth is equal to total assets less total liabilities. (c) Net financial worth is equal to financial assets less total liabilities.
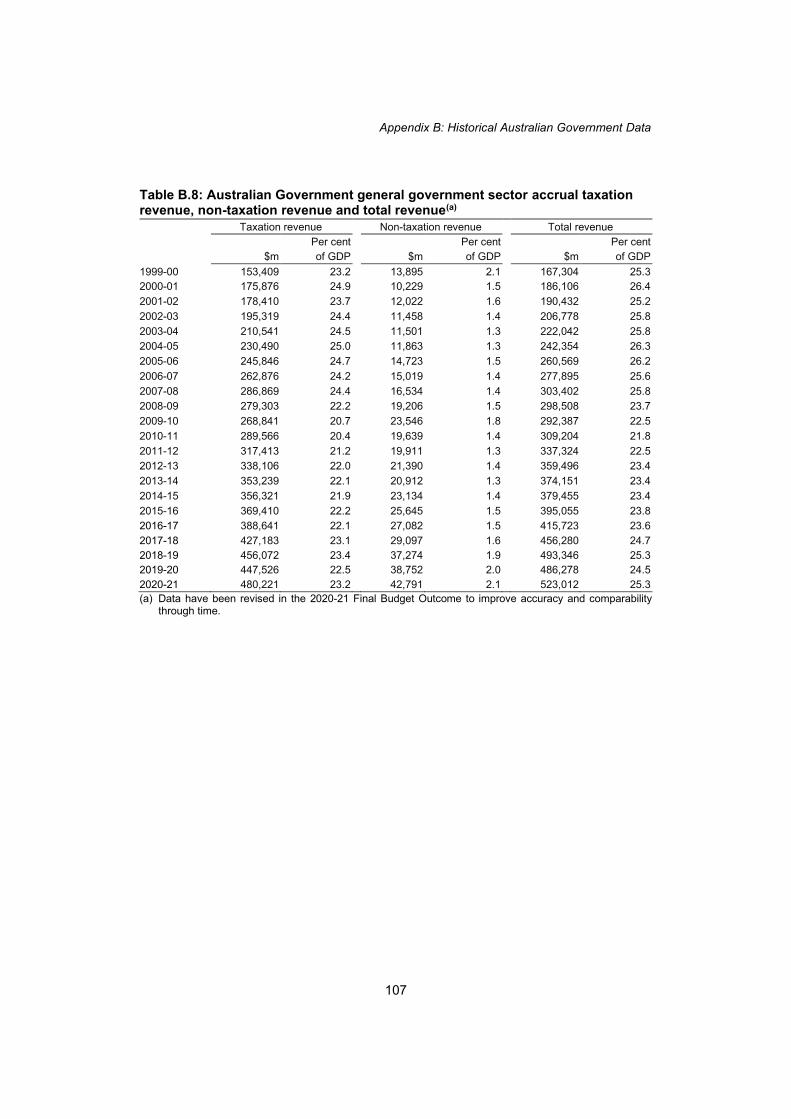
Appendix B: Historical Australian Government Data
107
Table B.8: Australian Government general government sector accrual taxation revenue, non-taxation revenue and total revenue(a) Taxation revenue Non-taxation revenue Total revenue
Per cent Per cent Per cent
$m of GDP $m of GDP $m of GDP
1999-00 153,409 23.2 13,895 2.1 167,304 25.3
2000-01 175,876 24.9 10,229 1.5 186,106 26.4
2001-02 178,410 23.7 12,022 1.6 190,432 25.2
2002-03 195,319 24.4 11,458 1.4 206,778 25.8
2003-04 210,541 24.5 11,501 1.3 222,042 25.8
2004-05 230,490 25.0 11,863 1.3 242,354 26.3
2005-06 245,846 24.7 14,723 1.5 260,569 26.2
2006-07 262,876 24.2 15,019 1.4 277,895 25.6
2007-08 286,869 24.4 16,534 1.4 303,402 25.8
2008-09 279,303 22.2 19,206 1.5 298,508 23.7
2009-10 268,841 20.7 23,546 1.8 292,387 22.5
2010-11 289,566 20.4 19,639 1.4 309,204 21.8
2011-12 317,413 21.2 19,911 1.3 337,324 22.5
2012-13 338,106 22.0 21,390 1.4 359,496 23.4
2013-14 353,239 22.1 20,912 1.3 374,151 23.4
2014-15 356,321 21.9 23,134 1.4 379,455 23.4
2015-16 369,410 22.2 25,645 1.5 395,055 23.8
2016-17 388,641 22.1 27,082 1.5 415,723 23.6
2017-18 427,183 23.1 29,097 1.6 456,280 24.7
2018-19 456,072 23.4 37,274 1.9 493,346 25.3
2019-20 447,526 22.5 38,752 2.0 486,278 24.5
2020-21 480,221 23.2 42,791 2.1 523,012 25.3
(a) Data have been revised in the 2020-21 Final Budget Outcome to improve accuracy and comparability through time.
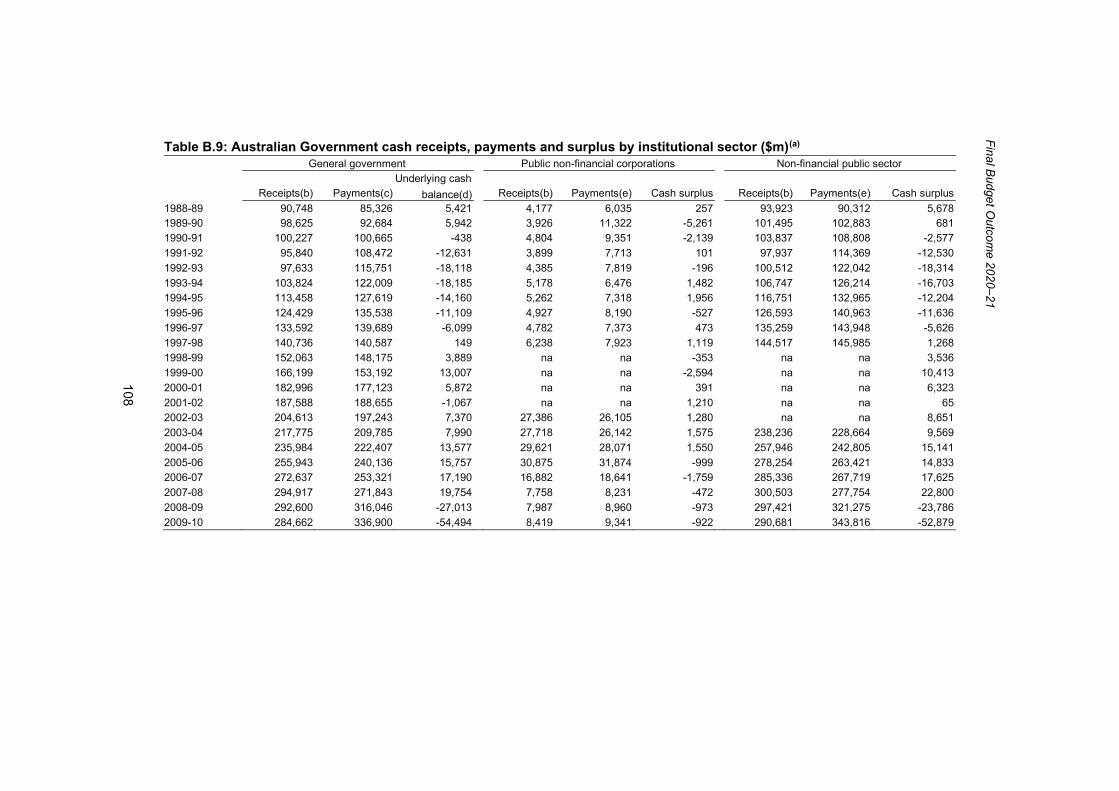
Fin
al B
ud
ge
t Ou
tco
me
202
0–21
108
Table B.9: Australian Government cash receipts, payments and surplus by institutional sector ($m)(a) General government Public non-financial corporations Non-financial public sector
Underlying cash
Receipts(b) Payments(c) balance(d) Receipts(b) Payments(e) Cash surplus Receipts(b) Payments(e) Cash surplus
1988-89 90,748 85,326 5,421 4,177 6,035 257 93,923 90,312 5,678
1989-90 98,625 92,684 5,942 3,926 11,322 -5,261 101,495 102,883 681
1990-91 100,227 100,665 -438 4,804 9,351 -2,139 103,837 108,808 -2,577
1991-92 95,840 108,472 -12,631 3,899 7,713 101 97,937 114,369 -12,530
1992-93 97,633 115,751 -18,118 4,385 7,819 -196 100,512 122,042 -18,314
1993-94 103,824 122,009 -18,185 5,178 6,476 1,482 106,747 126,214 -16,703
1994-95 113,458 127,619 -14,160 5,262 7,318 1,956 116,751 132,965 -12,204
1995-96 124,429 135,538 -11,109 4,927 8,190 -527 126,593 140,963 -11,636
1996-97 133,592 139,689 -6,099 4,782 7,373 473 135,259 143,948 -5,626
1997-98 140,736 140,587 149 6,238 7,923 1,119 144,517 145,985 1,268
1998-99 152,063 148,175 3,889 na na -353 na na 3,536
1999-00 166,199 153,192 13,007 na na -2,594 na na 10,413
2000-01 182,996 177,123 5,872 na na 391 na na 6,323
2001-02 187,588 188,655 -1,067 na na 1,210 na na 65
2002-03 204,613 197,243 7,370 27,386 26,105 1,280 na na 8,651
2003-04 217,775 209,785 7,990 27,718 26,142 1,575 238,236 228,664 9,569
2004-05 235,984 222,407 13,577 29,621 28,071 1,550 257,946 242,805 15,141
2005-06 255,943 240,136 15,757 30,875 31,874 -999 278,254 263,421 14,833
2006-07 272,637 253,321 17,190 16,882 18,641 -1,759 285,336 267,719 17,625
2007-08 294,917 271,843 19,754 7,758 8,231 -472 300,503 277,754 22,800
2008-09 292,600 316,046 -27,013 7,987 8,960 -973 297,421 321,275 -23,786
2009-10 284,662 336,900 -54,494 8,419 9,341 -922 290,681 343,816 -52,879
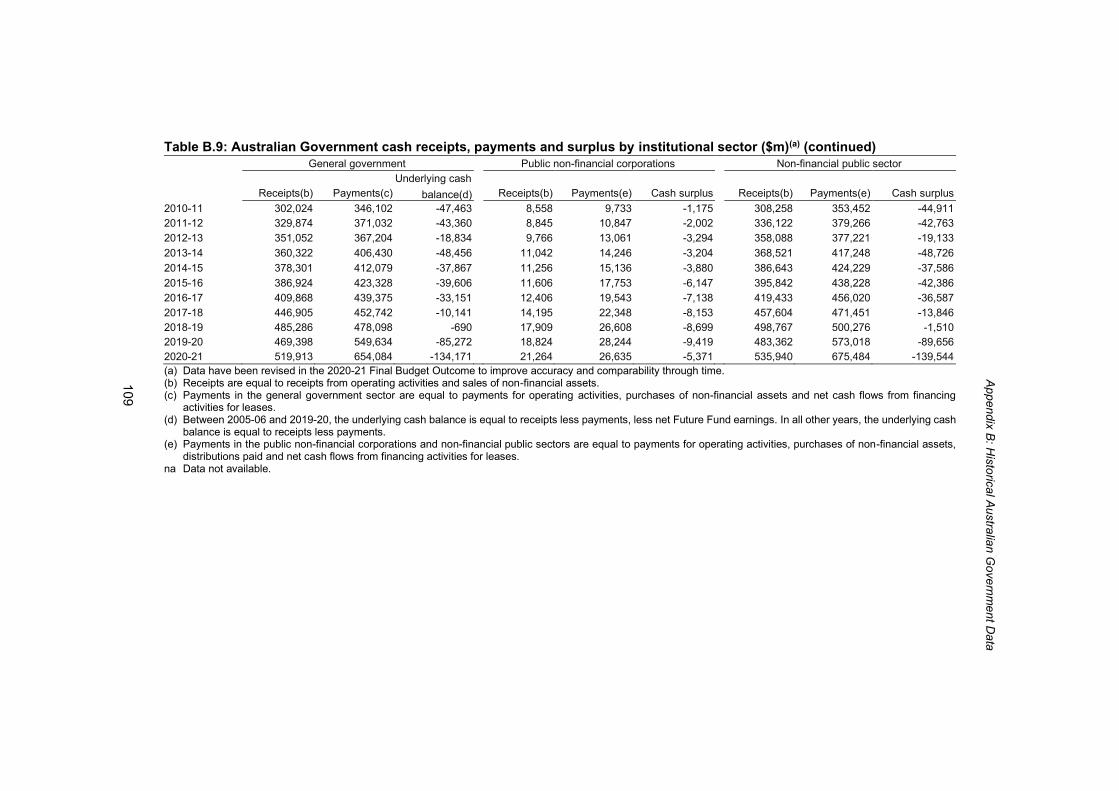
Ap
pe
ndix
B: H
isto
rica
l Au
stra
lian
Gove
rnm
en
t Data
109
Table B.9: Australian Government cash receipts, payments and surplus by institutional sector ($m)(a) (continued) General government Public non-financial corporations Non-financial public sector
Underlying cash
Receipts(b) Payments(c) balance(d) Receipts(b) Payments(e) Cash surplus Receipts(b) Payments(e) Cash surplus
2010-11 302,024 346,102 -47,463 8,558 9,733 -1,175 308,258 353,452 -44,911
2011-12 329,874 371,032 -43,360 8,845 10,847 -2,002 336,122 379,266 -42,763
2012-13 351,052 367,204 -18,834 9,766 13,061 -3,294 358,088 377,221 -19,133
2013-14 360,322 406,430 -48,456 11,042 14,246 -3,204 368,521 417,248 -48,726
2014-15 378,301 412,079 -37,867 11,256 15,136 -3,880 386,643 424,229 -37,586
2015-16 386,924 423,328 -39,606 11,606 17,753 -6,147 395,842 438,228 -42,386
2016-17 409,868 439,375 -33,151 12,406 19,543 -7,138 419,433 456,020 -36,587
2017-18 446,905 452,742 -10,141 14,195 22,348 -8,153 457,604 471,451 -13,846
2018-19 485,286 478,098 -690 17,909 26,608 -8,699 498,767 500,276 -1,510
2019-20 469,398 549,634 -85,272 18,824 28,244 -9,419 483,362 573,018 -89,656
2020-21 519,913 654,084 -134,171 21,264 26,635 -5,371 535,940 675,484 -139,544
(a) Data have been revised in the 2020-21 Final Budget Outcome to improve accuracy and comparability through time. (b) Receipts are equal to receipts from operating activities and sales of non-financial assets. (c) Payments in the general government sector are equal to payments for operating activities, purchases of non-financial assets and net cash flows from financing
activities for leases. (d) Between 2005-06 and 2019-20, the underlying cash balance is equal to receipts less payments, less net Future Fund earnings. In all other years, the underlying cash
balance is equal to receipts less payments. (e) Payments in the public non-financial corporations and non-financial public sectors are equal to payments for operating activities, purchases of non-financial assets,
distributions paid and net cash flows from financing activities for leases. na Data not available.

Fin
al B
ud
ge
t Ou
tco
me
202
0–21
110
Table B.10: Australian Government accrual revenue, expenses and fiscal balance by institutional sector ($m)(a) General government Public non-financial corporations Non-financial public sector
Fiscal Fiscal Fiscal
Revenue Expenses balance(b) Revenue Expenses balance(b) Revenue Expenses balance(b)
1996-97 141,688 145,940 -4,342 27,431 26,015 -331 na na -4,673
1997-98 146,820 148,788 -2,115 29,618 26,999 2,360 na na 251
1998-99 152,106 146,925 3,748 27,687 26,088 -816 175,891 169,111 2,932
1999-00 167,304 155,728 11,645 25,485 23,542 1,062 188,841 175,322 11,550
2000-01 186,106 180,277 5,820 25,869 24,762 -826 207,367 200,433 4,994
2001-02 190,432 193,214 -3,164 26,638 25,341 793 212,462 213,947 -2,371
2002-03 206,778 201,402 5,088 24,339 22,916 1,975 225,989 219,232 7,023
2003-04 222,042 215,634 5,749 25,449 23,444 2,143 241,746 233,333 7,892
2004-05 242,354 229,427 11,892 26,965 25,191 1,473 263,434 248,733 13,365
2005-06 260,569 241,977 16,094 28,143 29,531 -2,442 281,927 264,722 13,652
2006-07 277,895 259,197 16,365 15,443 16,360 -1,763 289,551 271,771 14,601
2007-08 303,402 280,335 20,475 6,854 6,686 -584 308,888 285,652 19,891
2008-09 298,508 324,889 -30,445 6,998 7,576 -1,495 303,309 330,268 -31,941
2009-10 292,387 340,354 -54,400 7,288 7,297 -1,079 298,033 346,008 -55,480
2010-11 309,204 356,710 -52,802 7,563 7,787 -1,446 315,001 362,732 -54,248
2011-12 337,324 377,948 -45,474 8,046 8,238 -2,158 343,722 384,538 -47,632
2012-13 359,496 383,351 -24,842 8,863 9,415 -4,189 366,642 391,048 -29,031
2013-14 374,151 415,691 -45,390 9,537 11,127 -6,070 381,971 425,102 -51,460
2014-15 379,455 418,956 -42,206 9,987 11,850 -4,856 387,719 429,083 -47,062
2015-16 395,055 430,739 -39,513 10,044 12,809 -7,486 403,868 442,318 -46,999

Ap
pe
ndix
B: H
isto
rica
l Au
stra
lian
Gove
rnm
en
t Data
111
Table B.10: Australian Government accrual revenue, expenses and fiscal balance by institutional sector ($m)(a) (continued) General government Public non-financial corporations Non-financial public sector
Fiscal Fiscal Fiscal
Revenue Expenses balance(b) Revenue Expenses balance(b) Revenue Expenses balance(b)
2016-17 415,723 449,712 -36,865 10,894 15,035 -9,918 425,114 463,243 -46,784
2017-18 456,280 461,490 -6,493 12,318 16,934 -10,055 466,661 476,403 -16,463
2018-19 493,346 485,869 1,350 15,836 20,899 -11,121 507,017 504,486 -9,655
2019-20 486,278 578,117 -95,844 17,029 23,174 -10,096 500,961 598,651 -105,637
2020-21 523,012 651,916 -136,108 19,166 22,941 -5,264 538,350 670,849 -141,187
(a) Data have been revised in the 2020-21 Final Budget Outcome to improve accuracy and comparability through time. (b) Fiscal balance is equal to revenue less expenses less net capital investment. Net capital investment is not shown in this table. na Data not available.

Final Budget Outcome 2020–21
112
Table B.11: Australian Government general government sector receipts, payments, underlying cash balance, net debt and net interest payments presented on a real per capita basis(a)(b) Taxation Non-taxation Total Underlying Net interest
receipts receipts receipts Payments cash balance Net debt payments
1970-71 5,494 838 6,331 5,643 688 263 -144
1971-72 5,524 868 6,391 5,771 620 -347 -171
1972-73 5,484 863 6,348 6,122 227 -515 -164
1973-74 6,138 791 6,930 6,278 652 -1,049 -162
1974-75 6,797 722 7,519 7,433 87 -914 -116
1975-76 7,125 761 7,886 8,516 -631 -144 -139
1976-77 7,212 796 8,008 8,471 -463 329 -23
1977-78 7,073 855 7,928 8,601 -672 956 1
1978-79 7,066 821 7,887 8,534 -647 1,504 77
1979-80 7,430 770 8,200 8,557 -358 1,689 119
1980-81 7,954 817 8,771 8,815 -45 1,549 151
1981-82 8,208 784 8,992 8,916 75 1,283 147
1982-83 7,861 850 8,712 9,353 -642 1,754 172
1983-84 7,956 910 8,866 10,110 -1,243 2,841 288
1984-85 8,889 981 9,870 10,883 -1,013 3,674 472
1985-86 8,978 1,124 10,102 10,883 -782 4,103 603
1986-87 9,131 1,134 10,265 10,600 -334 4,003 654
1987-88 9,453 1,060 10,512 10,329 183 3,443 567
1988-89 9,628 842 10,470 9,844 625 2,536 516
1989-90 9,555 827 10,382 9,756 625 1,697 479
1990-91 9,153 739 9,893 9,936 -43 1,670 359
1991-92 8,368 812 9,180 10,390 -1,210 2,973 365
1992-93 8,341 834 9,175 10,877 -1,703 5,189 375
1993-94 8,532 956 9,488 11,150 -1,662 6,417 514
1994-95 9,191 748 9,938 11,179 -1,240 7,314 639
1995-96 9,608 725 10,333 11,255 -922 7,958 736
1996-97 10,096 732 10,828 11,322 -494 7,804 769
1997-98 10,511 783 11,294 11,282 12 6,655 664
1998-99 10,852 1,070 11,922 11,617 305 5,650 678
1999-00 11,455 1,127 12,582 11,597 985 4,365 569
2000-01 12,010 891 12,901 12,487 414 3,299 437
2001-02 11,882 828 12,710 12,782 -72 2,863 363
2002-03 12,500 794 13,294 12,815 479 2,170 244
2003-04 12,983 693 13,677 13,175 502 1,695 191
2004-05 13,566 727 14,293 13,470 822 945 152
2005-06 14,012 808 14,820 13,904 912 19 133
2006-07 14,269 795 15,064 13,997 950 -1,342 13
2007-08 14,630 817 15,447 14,239 1,035 -2,093 -53
2008-09 13,618 942 14,559 15,726 -1,344 -562 -60
2009-10 12,552 1,077 13,629 16,131 -2,609 2,292 114

Appendix B: Historical Australian Government Data
113
Table B.11: Australian Government general government sector receipts, payments, underlying cash balance, net debt and net interest payments presented on a real per capita basis(a)(b) (continued) Taxation Non-taxation Total Underlying Net interest
receipts receipts receipts Payments cash balance Net debt payments
2010-11 12,919 912 13,831 15,849 -2,174 4,152 211
2011-12 13,692 818 14,511 16,321 -1,907 6,750 291
2012-13 13,859 982 14,841 15,524 -796 6,747 350
2013-14 13,798 813 14,611 16,480 -1,965 8,497 440
2014-15 13,906 960 14,866 16,193 -1,488 9,660 427
2015-16 13,829 936 14,765 16,154 -1,511 11,580 459
2016-17 13,992 1,129 15,121 16,210 -1,223 11,891 456
2017-18 14,900 1,028 15,929 16,137 -361 12,188 468
2018-19 15,492 1,268 16,759 16,511 -24 12,901 523
2019-20 14,527 1,266 15,793 18,493 -2,869 16,527 447
2020-21 15,667 1,523 17,190 21,626 -4,436 19,580 472
(a) Data have been revised in the 2020-21 Final Budget Outcome to improve accuracy and comparability through time.
(b) The real levels are derived using the Consumer Price Index (CPI). The current reference period for the CPI is 2011-12, which means the real levels per capita are reported in 2011-12 dollars.