FINAL BUDGET OUTCOME 2016 - Department of …. Contents PART 1 8 FINAL BUDGET OUTCOME BY FISCAL...
98
1. FINAL BUDGET OUTCOME 2016
Transcript of FINAL BUDGET OUTCOME 2016 - Department of …. Contents PART 1 8 FINAL BUDGET OUTCOME BY FISCAL...

1.
FINAL BUDGET OUTCOME
2016

2.
Acronyms ABG Autonomous Bougainville Government ADB Asian Development Bank BPNG Bank of Papua New Guinea CSA Commercial and Statutory Authority DNPM Department of National Planning and Monitoring DSIP District Support Improvement Program FAA Final Available Appropriation FBO Final Budget Outcome GDP Gross Domestic Product GFS Government Financial Statistics GoPNG Government of Papua New Guinea GST Goods & Services Tax ICT Information and Communications Technology IMF International Monetary Fund IFMS Integrated Financial Management System IPBC Independent Public Business Corporation IRC Internal Revenue Commission LNG Liquefied Natural Gas MTDP Medium Term Development Plan MTFS Medium Term Fiscal Strategy MYEFO Mid-Year Economic and Fiscal Outlook NEC National Executive Council NPCP National Petroleum Company of PNG NSL Nambawan Super Limited PE Personal Emoluments PIP Public Investment Program PNGDSP Papua New Guinea Development Strategic Plan RMF Results Monitoring Framework SIGTAS Standard Integrated Government Tax Administration
System SOE State Owned Enterprise UBSA Umbrella Benefits Sharing Agreement WPA Waigani Public Account

3.
Contents PART 1 .................................................................................................................................... 8
FINAL BUDGET OUTCOME BY FISCAL OPERATIONS ............................................................................ 8
1.1 Central Government Fiscal Operations .................................................................... 8
1.1.1 2016 Supplementary Budget ................................................................................. 9
1.2 Revenue ...................................................................................................................... 9
1.1.2 Total Revenue and Grants .................................................................................... 9
1.1.3 Tax Revenue ...................................................................................................... 10
1.1.4 Other Revenue ................................................................................................... 13
1.3 Expenditure And Net Lending ................................................................................. 13
1.4 Financing .................................................................................................................. 17
1.4.1 External Financing .............................................................................................. 17
1.4.2 Domestic Financing ............................................................................................ 18
1.4.3 Net Financing...................................................................................................... 19
1.4.4 Debt Service ....................................................................................................... 19
1.5 Public Debt ............................................................................................................... 20
1.6 Superannuation ....................................................................................................... 21
1.6.1 Automation Payments ......................................................................................... 21
1.6.2 Exit Payments ..................................................................................................... 21
1.7 Trust Accounts ........................................................................................................ 21
1.8 Government Finance Statistics ............................................................................... 24
1.8.1 Changes between the GFSM 1986 and GFSM 2014 .......................................... 24
1.8.2 Balancing items .................................................................................................. 24
1.8.3 General Government Debt .................................................................................. 26
FISCAL TABLES ................................................................................................................. 27
Table A: General Government Revenue Economic Classification ..................................... 27
Table B (i) General Budgetary Expenditure By Economic Classification ........................... 29
Table B (ii): General Budgetary Government Expenditure By Economic Classification ..... 30
Table C: Transactions In Assets And Liabilities For General Government......................... 32
Table D: Statement of Operations For The General Government Of Papua New Guinea . 33
Table E: Statement of Sources and Uses of Cash for the General Government of Papua New Guinea1 .......................................................................................................... 34
Table F: Stocks in General Government Debt ................................................................... 35
PART 2 ................................................................................................................................... 36
FINAL BUDGET OUTCOME BY AGENCY ........................................................................................... 36
2.1 Introduction .............................................................................................................. 36
4.
2.2 2016 Expenditure Outcome ..................................................................................... 36
2.3 Section 3 And Section 4 Transfers ......................................................................... 37
2.3.1 Section 3 Secretary’s Advance ........................................................................... 37
2.3.2 Section 4 ............................................................................................................. 37
2.4 Variance Of 2016 Budget Outcome......................................................................... 38
2.5 Detailed Expenditure ............................................................................................... 38

5.
TABLES TABLE 1 BUDGET BALANCE 2015 – 2016 (KINA MILLIONS) ...................................................................................................... 8
TABLE 2 TOTAL REVENUE AND GRANTS (KINA, MILLION) ........................................................................................................ 10
TABLE 3 TAXES ON INCOME, PROFIT AND CAPITAL GAINS (KINA, MILLION) ................................................................................ 10
TABLE 4 TAXES ON PAYROLL AND WORKFORCE (KINA, MILLION) .............................................................................................. 11
TABLE 5: TAXES ON GOODS AND SERVICES (KINA, MILLION) .................................................................................................... 11
TABLE 6: TAXES ON INTERNATIONAL TRADE AND TRANSACTIONS (KINA, MILLION) ....................................................................... 12
TABLE 7: GRANTS (KINA, MILLION)..................................................................................................................................... 12
TABLE 8: OTHER REVENUE (KINA, MILLION) ......................................................................................................................... 13
TABLE 9: EXPENDITURE BY FUNDING SOURCE 2015-16 (KINA MILLIONS) .................................................................................. 14
TABLE 10: EXPENDITURE BY AGENCY TYPE 2015-16 [EXCLUDING DEBT SERVICE COSTS, DONOR GRANTS, AND CONCESSIONAL LOANS]
(KINA MILLIONS) .................................................................................................................................................... 15
TABLE 11: GOPNG DOMESTIC FUNDING BY 2014 GFS FUNCTIONAL CLASSIFICATION OF EXPENSE BY ECONOMIC ITEM TYPE 2015-16
[EXCLUDING DEBT SERVICE COST, DONOR GRANTS, AND CONCESSIONAL LOANS] (KINA MILLIONS) ......................................... 16
TABLE 12: EXTERNAL BORROWING AND PRINCIPAL REPAYMENTS 2015 - 2016 (KINA, MILLIONS) ................................................. 18
TABLE 13: DOMESTIC BORROWING AND PRINCIPAL REPAYMENTS 2015 - 2016 (KINA, MILLIONS) ................................................ 18
TABLE 14:SUMMARY OF NET BORROWINGS 2016 (KINA, MILLIONS) ....................................................................................... 19
TABLE 15: INTEREST AND FEES (KINA, MILLIONS) .................................................................................................................. 19
TABLE 16:CENTRAL GOVERNMENT DEBT 2015 - 2016 (KINA, MILLIONS) ................................................................................ 20
TABLE 17: SOURCE OF FUNDS FOR BUDGET FUNDED TRUST ACCOUNTS: 2005 – 2016 ............................................................... 22
TABLE 18: APPROPRIATIONS FOR TRUST ACCOUNTS 2016 (KINA, MILLIONS) ............................................................................. 22
TABLE 19: GOPNG FUNDED EXPENDITURE BY SECTORS (KINA, MILLIONS) ................................................................................. 36
TABLE 20: SECTION 4 TRANSFERS BY SECTORS (KINA, MILLIONS) ............................................................................................. 37
TABLE 21: GOPNG FUNDED EXPENDITURE BY CATEGORY (KINA, MILLIONS) .............................................................................. 38
TABLE 22: ADMINISTRATION SECTOR .................................................................................................................................. 40
TABLE 23: COMMUNITY & CULTURE SECTOR ........................................................................................................................ 44
TABLE 24 DEBT INTEREST .................................................................................................................................................. 45
TABLE 25: ECONOMIC SECTOR ........................................................................................................................................... 46
TABLE 26: EDUCATION SECTOR .......................................................................................................................................... 50
TABLE 27: HEALTH SECTOR ............................................................................................................................................... 52
TABLE 28: LAW & JUSTICE SECTOR ..................................................................................................................................... 54
TABLE 29: MISCELLANEOUS EXPENSE .................................................................................................................................. 56
TABLE 30:PROVINCIAL SECTOR .......................................................................................................................................... 56
TABLE 31:TRANSPORT SECTOR ........................................................................................................................................... 59
TABLE 32:UTILITIES SECTOR .............................................................................................................................................. 61
TABLE 33:SECRETARY'S ADVANCE (SECTION 3) ..................................................................................................................... 62
TABLE 34: SECTION 4 (TRANSFERS) .................................................................................................................................... 64

6.
INTRODUCTION
The Final Budget Outcome (FBO) Report is released in accordance with the requirements of sections 13 – 16 of the Papua New Guinea Fiscal Responsibility Act, 2006. The Act requires the Treasurer to release and table a final budget outcome report for each financial year no later than three months after end of the financial year. The purpose of the FBO Report is to provide the final fiscal outcomes for the financial year. The 2016 FBO Report provides to Parliament and the public a summary of fiscal performance, together with a comparison and explanation of the major variations from the 2016 Budget estimates for total revenue and grants, total expenditure and net lending, and the budget balance. It also provides a summary of the National Government financing activities for the financial year and a summary of the National Government debt position, together with comparative figures for the previous financial year. The financial information presented in this report is based on the same reporting standards as used in the 2016 Volume 1 and Volume 2 Budget documents. Part 1 of this report, Final Budget Outcome by Fiscal Operations, is reported using the new GFS 2014 reporting framework as reported in the 2016 Budget Volume 1, Economic and Development Policies document. Part 2 of this report, Final Budget Outcome by Agency, is reported using the GFS 1986 reporting framework as reported in the 2016 Budget Volume 2 document. This is transitional for migration to the updated GFS 2014 framework of reporting. Generally, the information presented in this report follows the traditional cash reporting standards originally laid down in the GFS 1986 Manual.
The general government sector under GFSM 2014 consists of all government units, representing budgetary central government, provincial government, local government and extra budgetary accounts within the country that are controlled and largely financed by the National Government. In contrast, the coverage of the GFSM 1986 system was defined on a narrower functional basis to include all units performing government functions. The current GFS 2014 coverage includes Budgetary Fiscal Transactions of the Government. It is at its initial stage of roll-out and covers only the budgetary units but will eventually be extended to cover extra budgetary units such as statutory bodies and public corporations (SOEs). Work is underway to have Volume 2 of the Budget document reported in the GFS 2014 reporting framework. Once this is done, future FBO reports will fully reflect the GFS 2014 reporting framework. Section 1.8 of this report provides a clear explanation to the changes between GFSM 1986 and GFSM 2014. The information presented in this report may not reconcile fully with information published in the Public Accounts as some revenues and expenditures detailed in this report will be reported or classified differently in the Public Accounts. For example, transactions relating to debt are generally reported on a net basis and split into principal and interest components in this report, whereas they are reported on a gross basis in the Public Accounts and not split between principal and interest components.

7.
The information presented in this report is based on the same data used in the preparation of the Public Accounts; however, this report is compiled before that data has been subject to independent audit. This report will therefore not include the effects of any adjustments made to the underlying data arising from the audit process. In addition, there are some areas where updated figures will modify the actual outcomes, such as when reports are received from all donors on projects grants, and more reporting is provided on the Infrastructure Tax Credit (ITC).

8.
PART 1
FINAL BUDGET OUTCOME BY FISCAL OPERATIONS
1.1 Central Government Fiscal Operations
The Final Budget Outcome for 2016 is a Net Borrowing of K3,086.9 million which is 4.6 per cent of GDP. The increase in nominal terms from the 2015 deficit outcome of K2,532.6 million reflects the Government’s commitment in prioritizing expenditures in key development enablers to support continued economic growth despite tight economic conditions in 2016. The 2016 Net Borrowing outcome compared to the Original Budget estimate, is higher by K974.4 million. This is largely reflective of lower than expected total revenue and grants which was K2,164.6 million less than what was originally forecasted. The shortfall was attributed to the general slowdown in the economy as a result of low commodity prices and other domestic conditions. Foreign exchange imbalance also dampened business activities thus lower tax revenues. Despite these challenges, the Government managed to deliver most of its key priorities and policies including Tuition Fee Free (TFF) Education, Free Primary Health Care and Services Improvement Programs (SIPs) and maintained spending on the Medium Term Development Plan (MTDP) enablers of health, education, law and order and infrastructure. Major development priority projects were well progressed or completed. These projects include; supporting infrastructures for the 2018 APEC Summit, the District Health and Education Infrastructure Programs, the Land & Housing Program, as well as major priority roads and bridges across the country. Table 1 Budget Balance 2015 – 2016 (Kina Millions)
2015 Actuals
2016 Budget
2016 Supp. Budget
2016 Outcome
Revenue and Grants 10,963.5 12,650.1 11,722.1 10,485.5 Expenditure and Net Lending 13,496.1 14,762.6 13,834.6 13,572.4 Budget Balance - 2,532.6 - 2,112.5 - 2,112.5 -3,086.9 % of GDP -4.1% -3.1% -3.1% -4.6%
Source: Department of Treasury
Compared against the Supplementary Budget estimate of K11,722.1 million, Total Revenue and Grants is lower by K1,236.7 million or 10.5 per cent as a result of lower Other Revenue, particularly dividends and SWF Transfer from the proposed asset sale proceeds. While higher reported donor funded project grants have an equal and offsetting impact on both Total Expenditure and Net Lending and Total Revenue and Grants with no effect on the overall fiscal balance1. Total Expenditures and Net Lending is also lower. Compared against the 2016 Supplementary Budget estimate of K13,834.6 million, it is lower by K262.2 million or 1.9 per cent. This generally reflects underspending across Goods and Services offsetting overspending in Compensation of Employees by both National Departments and Provinces.
1 This is consistent with new 2014 GFS reporting framework.

9.
1.1.1 2016 Supplementary Budget After assessing the mid-year fiscal performance and outcomes, the Government introduced the 2016 Supplementary Budget in the third quarter of 2016. The 2016 Supplementary Budget comprised of adjustments that include both expenditure-saving measures of K928.0 million and additional revenue-raising measures of K958.0 million. Total Revenue and Grants estimates were revised down to K11,722.1 million, a downward revision of K928.0 million from the Original Budget forecast of K12,650.1 million. Additional revenue-raising measures were introduced to cushion significant decline in revenue which included, additional dividends from the State Owned Enterprises (SOEs) and proceeds from the proposed sale of the Government 4.27 per cent equity in the PNG LNG project. Total Expenditure and Net Lending estimates, on the other hand, were revised down to K13,834.6 million, an expenditure cut of K928.0 million. The revised Total Expenditure and Net Lending estimate reflects a deliberate intervention by the Government to limit expenditure on non-productive capital expenditure as much as possible while safeguarding expenditure on infrastructure maintenance and key policy platform priorities such as tuition fee free education, free primary health care, 2017 election and APEC preparation and statutory funding. The adjustments were necessary to restore the original 2016 Budgets’ fiscal anchors; (i) net borrowing of K2,112.5 million or 3.1 per cent of GDP and (ii) debt to GDP ratio of 28.9 per cent. 1.2 Revenue
1.1.2 Total Revenue and Grants Total Revenue and Grant outcome for 2016 is K10,485.5 million, lower than the 2016 Supplementary Budget estimate by K1,236.7 million or 10.5 per cent. Bulk of the shortfall is from the Other Revenue2 mainly dividends and equity sale which came lower by K1,127.7 million. Tax Revenue contributed a decline of K404.2 million to the overall shortfall. This is reflective of the continued slowdown in economic activity as a result of low commodity prices, latent effects of the drought, foreign exchange imbalance affecting business activity and the decline in Government spending in the economy. Bulk of the shortfall was from Taxes on Income, Profits and Capital Gains. Donor Grant was higher by K295.9 million. Compared to the Original Budget, Total Revenue and Grant is lower by K2,164.6 million or 17.1 per cent, reflective mainly of lower than anticipated Tax Revenue which came lower by K2,104.1 million.
2 Non Tax Revenues (dividends and departmental fees and charges)

10.
Table 2 Total Revenue and Grants (Kina, Million) 2015
Actuals 2016
Budget 2016 Supp.
Budget 2016
Outcome
Tax Revenue 8,804.6 10,525.6 8,825.8 8,421.6 Social Contributions 0.0 0.0 0.0 0.0 Grants 819.5 1,513.2 1,134.1 1,430.0 Other Revenue 1,339.4 611.3** 1,761.6 633.9 Total Revenue 10,963.5* 12,650.1 11,722.1 10,485.5
Source: Department of Treasury
*The 2015 Total Revenue of K10,963.5 million is reported under the 1986 GFS reporting to be in line with the 2015 Final Budget Outcome. It includes as Other Revenue ITC of K219.5 million, Recoveries of K93.9 million and Asset Sale of K0.005 million, while excluding GST transferred to Provinces of K353.0 million from Tax Revenue. **Initial 2016 Budget for Grants included SWF Transfer of K379.1 million. This has now been re-classified as transfers not elsewhere classified under Other Revenue.
Compared to 2015 actual, Total Revenue and Grant is lower by K478.0 million or 4.4 per cent, reflective mainly of lower Tax Revenue and Other Revenue which were lower by K383.1 million and K705.5 million respectively. Donor Grants was higher by K610.5 million. 1.1.3 Tax Revenue
Taxes on Income, Profits and Capital Gains Taxes on Income, Profits and Capital Gains amounted to K5,286.2 million, lower than the 2016 Supplementary Budget estimate by K371.6 million or 6.6 per cent. This is reflective of weaker than anticipated receipts from key tax revenue sources mainly Personal Income Tax, Company Income Tax and Dividend Withholding Tax (DWT). These taxes came lower by K233.1 million, K136.5 million and K18.3 million respectively. A total of K92.0 million was realised for Mining and Petroleum Tax (MPT), compared to the Supplementary Budget estimate of K177.6 million. The lower MPT outcome reflected weak commodity prices mainly the price of oil, copper and gold. Further, the lower MPT outcome also reflected the Ok Tedi mine meeting its remobilisation costs as a result of the shut-down in 2015. Against the Original Budget, Taxes on Income, Profits and Capital Gains were lower by K1,478.2 million. The prolonged effects of low commodity prices and the foreign exchange imbalance combined with weak consumer demand have affected businesses, households and government income, hence, contributing to the general slowdown in the economy and consequently low income and profit tax to the Government in 2016. Table 3 Taxes on Income, Profit and Capital Gains (Kina, Million)
2015 Actuals
2016 Budget
2016 Supp. Budget
2016 Outcome
Taxes on Income, Profits and Capital Gains 5,894.2 6,764.4 5,657.8 5,286.2 Personal Income Tax 3,037.1 3,511.7 3,077.4 2,844.3 Company Tax 2,374.8 2,793.2 2,230.3 2,093.8 Mining and Petroleum Taxes 195.4 129.9 88.8 92.0 Royalties & Management Tax 51.3 43.4 40.5 44.3 Dividend Withholding Tax Non Mining 168.9 232.7 151.0 132.6 Interest Withholding Tax 66.0 52.7 69.2 78.7 Tax Related Court Fines 0.0 0.0 0.0 0.0 Sundry IRC Taxes & Income 0.6 0.8 0.7 0.5
Source: Department of Treasury

11.
Compared to 2015 actual, Taxes on Income, Profits and Capital Gains were lower by K608.0 million or 10.3 per cent. Personal Income Tax was lower by K192.8 million, Company Income Tax lower by K281.0 million, MPT lower by K103.4 million and DWT lower by K36.3 million. Taxes on Payroll and Workforce Taxes on Payroll and Workforce, mainly Training Levy amounted to K14.4 million, a shortfall of K2.6 million or 15.3 per cent from the 2016 Supplementary Budget estimate. The lower than anticipated outcome is reflective of the general slowdown in the economy. Table 4 Taxes on Payroll and Workforce (Kina, Million)
Tax on Payroll & Workforce 2015 Actuals
2016 Budget
2016 Supp. Budget
2016 Outcome
Training Levy 18.0 17.0 17.0 14.4 Total 18.0 17.0 17.0 14.4
Source: Department of Treasury
Compared to the 2015 actual, Taxes on Payroll and Workforce was lower by K3.6 million or 20.0 per cent. Taxes on Goods and Services Taxes on Goods and Services amounted to K2,584.1 million, generally in line with the Supplementary Budget estimate of K2,583.8 million (Table 5). Goods and Services Tax (GST) collections totalled K1,442.6 million3 in line with the Supplementary Budget estimate. Excise Duty collections were higher by K33.9 million. Stamp Duty was lower by K36.6 million, while Other Taxes on Goods and Services were higher by K1.5 million. Compared to the Original Budget estimate, Taxes on Goods and Services have been revised down by K553.3 million reflective mainly of weaker than anticipated gross GST collections, Inland Excise and Import Excise. The weak income and demand in the economy has translated into low receipts for these taxes. These taxes were lower by K316.4 million, K131.0 million and K44.6 million respectively against the Original Budget estimate.
Table 5: Taxes on Goods and Services (Kina, Million)
2015
Actuals 2016
Budget 2016 Supp.
Budget 2016
Outcome
Taxes on Goods and Services 2,327.1 3,137.4 2,583.8 2,584.1
GST 1,214.0 1,759.0 1,430.3 1,442.6
Sales taxes 0.0 - 0.0 0.0
Bank Account Debit Fees 0.0 - 0.0 0.0
Stamp Duties 126.1 117.8 115.8 79.2
Excise Duty 503.3 734.8 569.8 603.7
Import Excise 298.7 316.7 272.9 272.2
Bookmakers' Turnover Tax 9.4 14.9 10.3 7.8
Gaming Machine Turnover Tax 162.1 176.5 168.2 163.5
Departure Tax 6.2 6.8 6.8 4.4
Motor Vehicle Tax 5.7 7.2 7.2 6.8
3 The Gross GST of K1,442.6 million includes GST to provinces of K353.1 million. Net GST to WPA was K1,089.5 million.

12.
Other taxes on use of goods and on permission to use goods or perform activities
1.1 0.9 0.9 0.8
Other taxes on goods and services 0.4 2.9 1.6 3.1 Source: Department of Treasury The 2015 GST outcome of K1,214.0 million excludes GST Transfers to Provinces of K353.0 million.
Taxes on International Trade and Transactions Taxes on International Trade and Transactions amounted to K536.8 million, lower than the 2016 Supplementary estimate by K30.3 million or 5.3 per cent (Table 6). The shortfall is reflective mainly of lower than anticipated receipts for Export Tax due to lower volumes of log exports. Import Duty amounted to K242.9 million generally in line with the Supplementary Budget estimate and 2015 actual. Against the Original Budget estimate, Import Duty has been revised down by K85.4 million to reflect weak imports. Table 6: Taxes on International Trade and Transactions (Kina, Million)
2015 Actuals
2016 Budget
2016 Supp. Budget
2016 Outcome
Taxes on Int’l Trade & Transactions 565.2 606.8 567.1 536.8 Import Duty 243.4 328.3 238.2 242.9 Other Import Taxes 5.7 4.1 2.2 0.0 Export Tax 316.2 274.5 326.8 294.0
Source: Department of Treasury
Compared to 2015 actual, Taxes on International Trade and Transactions were lower by K28.4 million or 5.0 per cent due mainly to weak receipts for Export Duty. 1.2.3. Grants Donor Grants amounted to K1,430.0 million. This is higher than the 2016 Supplementary Budget and Original Budget estimate by K295.9 million or 26.1 per cent (Table 7). Donor Grants excludes SWF Transfers. Table 7: Grants (Kina, Million)
2015
Actuals 2016
Budget 2016 Supp.
Budget 2016
Outcome
GRANTS 819.5 1,134.1 1,134.1 1,430.0
From Foreign Governments 778.8 998.8 998.8 1,261.3
Current 505.0 549.8 549.8 1,207.1
Cash 0.0 12.4 12.4 0.0
In-Kind 505.0 537.3 537.3 0.0
Capital 273.8 449.0 449.0 54.3
Cash - 25.1 25.1 0.0
In-Kind 273.8 423.9 423.9 54.3
From International Organizations 40.7 135.3 135.3 168.7
Current 22.4 124.5 124.5 147.0
Cash 0.9 53.1 53.1 0.0
In-Kind 21.5 71.5 71.5 147.0
Capital 18.3 10.8 10.8 21.7
Cash 18.3 0 0.0 0.0
In-Kind - 10.8 10.8 21.7 Source: Department of Treasury

13.
Compared to 2015 actual, Donor Grants turned out to be higher by K610.5 million or 74.5 per cent. 1.1.4 Other Revenue Collections of Other Revenue amounted to K633.9 million in 2016. This is lower than the 2016 Supplementary Budget estimate by K1,127.7 million or 64.0 per cent (Table 8). The shortfall in Other Revenue primarily reflects lower than anticipated receipts from Transfers not elsewhere classified, mainly the unrealised K725.0 million equity sale. The shortfall is also due to lower than anticipated dividends from State entities which were lower by K287.5 million. The dividends paid in 2016 amounted to K528.9 million compared to the Supplementary Budget estimate of K816.4 million. Of the K528.9 million dividends paid in 2016, the Kumul Petroleum Holdings Ltd (KPHL) paid K200.0 million, the Bank of PNG (BPNG) (K190.0 million4), Ok Tedi Mine (K100.5 million), National Fisheries Authority (K25.0 million), National Gaming and Control Board (K10.0 million) and K3.4 million from other SOEs. The dividend payments from BPNG and National Gaming Board included 2015’s dividend payments of K90.0 million and K10.0 million, respectively, received in 2016. Table 8: Other Revenue (Kina, Million)
2015
Actuals 2016
Budget 2016 Supp.
Budget 2016
Outcome OTHER REVENUE 1,339.4* 990.4** 1,761.6 633.9
Property Income 943.1 516.9 853.3 551.3 Interest 0.0 4.0 4.0 0.0 Dividends 911.4 480.0 816.4 528.9 Mining Petroleum and Gas Dividends 456.4 300.0 500.0 300.5 Dividends from Statutory Authorities 85.0 45.0 178.0 225.0 Dividends from State Owned Enterprises 370.0 135.0 138.4 0.0 Other Dividends 0.0 0.0 0.0 3.4 Rent 31.7 32.9 32.9 22.4
Sales of goods and services 65.6 85.4 85.4 63.5 Administrative fees 25.3 31.1 31.1 28.7 Incidental sales by nonmarket establishments 40.3 54.3 54.3 34.9 Fines, penalties, and forfeits 2.8 0.8 0.8 1.8 Transfers not elsewhere classified 14.4 387.3 822.1 17.2 Current transfers not elsewhere classified 14.4 8.2 822.1 17.2
Source: Department of Treasury
*The 2015 Other Revenue outcome of K1,339.4 million includes ITC, Recoveries and Asset Sales.
**SWF Transfer of K379.1m initially recorded under Grants in 2016 Budget is now re-classified as transfer not elsewhere classified.
1.3 Expenditure And Net Lending
Total Expenditure and Net Lending in 2016 was K13,572.4 million.
Compared to the 2015 expenditure actual of K13,496.1 million, the 2016 Total Expenditure and
Net Lending was higher by K76.3 million or 0.6 per cent. This increase was a result of increased drawdowns of Concessional Loans and Donor Support Grants, compared to the 2015 final
4 Inclusive of K90 million 2015 dividend paid in 2016.

14.
outturn. This implies that nominal level of the Total Expenditure and Net Lending in 2016 remained relatively unchanged compared the 2015 final outturn. Compared to the 2016 Original Budget estimate of K14,762.6 million, it is K1,190.2 million or 8.1 per cent lower and against the 2016 Supplementary Budget estimate of K13,834.6 million, it is K262.2 million or 1.9 per cent lower. This is mainly reflective of Government’s prudent fiscal management supported by strong administrative efforts in expenditure control, including stringent measures employed during close of account exercise. Table 9: Expenditure by Funding Source 2015-16 (Kina Millions)
Sources of Funding 2015 Actuals
2016 Budget
2016 Supp. Budget
2016 Outcome
Domestic Funding 11,972.4 12,698.4 11,770.4 11,148.6 Operational1 8,406.1 9,666.7 9,424.3 9,099.0 Capital Investment2 3,566.3 3,031.7 2,346.0 2,049.6
Project Support Grants 819.5 1,134.1 1,134.1 1,430.0 Concessional Loans 707.3 930.1 930.1 993.8
Total Expenditure and Net Lending 13,496.1 14,762.6 13,834.6 13,572.4 Source: Department of Treasury
1Inclusive of GST and Book makers Turn over tax to provinces except for 2015 actuals incompliance with the 1986 GFS reporting requirement. 2As part of change with the introduction of GFS 2014 reporting framework and to be consistent with 2015 FBO aggregate actuals.
ITC is reflected in the 2015 actual under capital Investment`
Total Government funded expenditure was K11,148.6 million, K621.8 million or 5.3 per cent lower than the 2016 supplementary appropriation of K11,770.4 million. In fact, Government’s spending in goods and services recorded a massive underspending of K1,102.7 million, or 14.0 per cent against the supplementary appropriation. This reflects government’s prudent fiscal management supported by strong administrative efforts in expenditure control, including stringent measures employed during close of account exercise. This, however, was significantly reduced by overruns in personnel emoluments (PE) of K471.7 million, or 12.0 per cent to K621.8 million, or 5.3 per cent savings. Total operational expenditure was K9,099.0 million, K325.3 million lower than to the 2016 Supplementary Budget estimate of K9,424.3 million. Low expenditure reflects careful prioritisation expenditures in line with low revenue. Total capital investment expenditure, including domestic, concessional loan and donor funded, was K4,473.4 million, K63.2 million more than the 2016 Supplementary Budget estimate of K4,410.2 million. The domestic funded investment underspending of K296.4 million was more than offset by overspent in concessional loan funded investments (K63.7 million) and donor funded investments (K295.9 million). Compared to 2015 actual, total capital investment declined by K463.4 million, taking into account new GFS reporting framework (GFS 2014), which excludes Tax Credit under expenditure in 2016 outcome. Higher capital investment in 2015 was largely driven by 2015 South Pacific Games preparation. Domestic funded capital investment final outturn was K2,049.6 million, a K296.4 million reduction against the supplementary budget. This reduction or saving stems from careful prioritisation and implementation of the key national infrastructure projects, refocusing capital investment on projects with high implementation and disbursement rates and limiting expenditure on non-productive capital expenditure.

15.
The concessional loan funded capital investment final outturn was K993.8 million, K63.7 million higher than the 2016 Supplementary Budget of K930.1 million. Unlike in previous years, improved project implementation led to actual drawdowns being higher than the original projections for current year. Compared to previous years, this was a high drawdown rate which indicates improvements in project implementation (Refer to section 1.4 for detail). Project Support Grant expenditure shows an outcome of K1,430.0 million, which is K295.9 million higher than the 2016 Supplementary estimate of K1,134.1 million. The higher reported figure is partly due to exchange rate movements against the respective currencies of the Development Partners and partly due to the implementation issues as stated above. With the newly introduced reporting process, the reporting of actual expenditure of grants is more accurate and detailed than in previous years. Table 10: Expenditure by Agency Type 2015-16 [excluding Debt Service Costs, Donor Grants, and Concessional Loans] (Kina Millions)
Agency Type 2015
Actuals 2016
Budget 2016 Supp.
Budget 2016
Outcome
National Departments 6,557.1* 6,445.0 5,735.1 5,390.3 Provincial Government1 3,437.7 3,748.2 3,709.2 3,658.4 Autonomous Bougainville Govt. 232.3 248.0 206.4 211.0 Commercial & Statutory Authority 667.5 777.6 640.1 624.6 Interest Payment 1,074.7 1,479.6 1,479.6 1,264.3
Grand Total 11,969.3 12,698.4 11,770.4 11,148.6 Source: Department of Treasury
1Inclusive of GST and Book makers Turn over tax to provinces except for 2015 actuals incompliance with the 1986 GFS reporting requirement. *Infrastructure tax Credit is reflected.
The expenditure outcome of 2016 Budget against the supplementary budget for domestic funds was significantly low for National Departments by K344.9 million, Provincial Governments by K50.8 million and for Commercial and Statutory Authorities by K15.5 million. This reflects under-expenditure in Goods and Services and over-expenditure in Compensation of Employees. Compared against the 2015 actuals, expenditure outcome in 2016 for domestic funds have decreased significantly for National Departments by K1,166.8 million, Commercial and Statutory Authorities by K42.9 million and Autonomous Bougainville Administration (ABG) by K21.3 million. Except for Provincial Governments, which saw an increase of K220.7 million. This reflects over expenditure in Salaries for Teachers in the provinces. Total expenditure outcome for the Autonomous Bougainville Government (ABG) was K211.0 million. Compared against the 2016 Supplementary Budget, ABG incurred above the appropriation by K4.7 million or 0.5 per cent due to over expenditure in Compensation of Employees. Total Interest Payments and Fees in 2016 was K1,264.3 million this is K189.6 million or 17.6 per cent higher than the 2015 actual, primarily as a result of the sharp increase in the level of domestic debt. Compared against the Supplementary Budget estimate, total interest payments and fees in 2016 was K215.3 million or 14.6 per cent lower.
16.
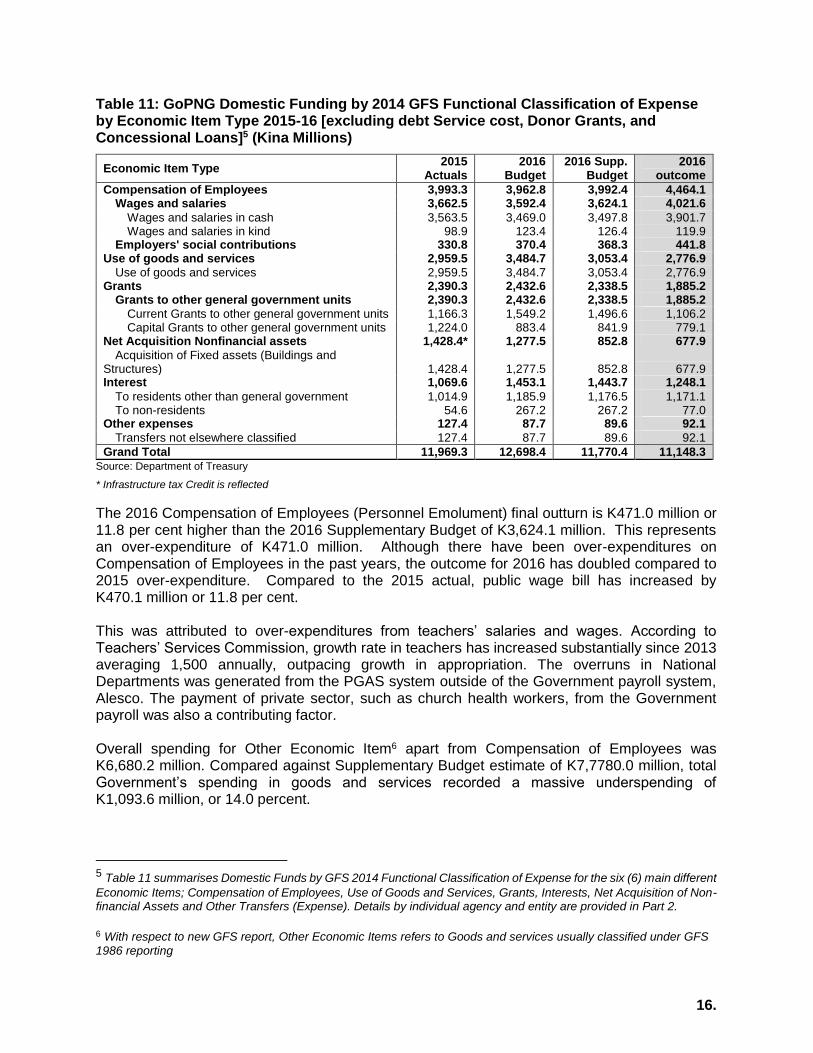
Table 11: GoPNG Domestic Funding by 2014 GFS Functional Classification of Expense by Economic Item Type 2015-16 [excluding debt Service cost, Donor Grants, and Concessional Loans]5 (Kina Millions)
Economic Item Type 2015
Actuals 2016
Budget 2016 Supp.
Budget 2016
outcome
Compensation of Employees 3,993.3 3,962.8 3,992.4 4,464.1 Wages and salaries 3,662.5 3,592.4 3,624.1 4,021.6
Wages and salaries in cash 3,563.5 3,469.0 3,497.8 3,901.7 Wages and salaries in kind 98.9 123.4 126.4 119.9
Employers' social contributions 330.8 370.4 368.3 441.8 Use of goods and services 2,959.5 3,484.7 3,053.4 2,776.9
Use of goods and services 2,959.5 3,484.7 3,053.4 2,776.9 Grants 2,390.3 2,432.6 2,338.5 1,885.2
Grants to other general government units 2,390.3 2,432.6 2,338.5 1,885.2
Current Grants to other general government units 1,166.3 1,549.2 1,496.6 1,106.2 Capital Grants to other general government units 1,224.0 883.4 841.9 779.1
Net Acquisition Nonfinancial assets 1,428.4* 1,277.5 852.8 677.9
Acquisition of Fixed assets (Buildings and Structures) 1,428.4 1,277.5 852.8 677.9 Interest 1,069.6 1,453.1 1,443.7 1,248.1
To residents other than general government 1,014.9 1,185.9 1,176.5 1,171.1 To non-residents 54.6 267.2 267.2 77.0
Other expenses 127.4 87.7 89.6 92.1
Transfers not elsewhere classified 127.4 87.7 89.6 92.1
Grand Total 11,969.3 12,698.4 11,770.4 11,148.3 Source: Department of Treasury
* Infrastructure tax Credit is reflected
The 2016 Compensation of Employees (Personnel Emolument) final outturn is K471.0 million or 11.8 per cent higher than the 2016 Supplementary Budget of K3,624.1 million. This represents an over-expenditure of K471.0 million. Although there have been over-expenditures on Compensation of Employees in the past years, the outcome for 2016 has doubled compared to 2015 over-expenditure. Compared to the 2015 actual, public wage bill has increased by K470.1 million or 11.8 per cent. This was attributed to over-expenditures from teachers’ salaries and wages. According to Teachers’ Services Commission, growth rate in teachers has increased substantially since 2013 averaging 1,500 annually, outpacing growth in appropriation. The overruns in National Departments was generated from the PGAS system outside of the Government payroll system, Alesco. The payment of private sector, such as church health workers, from the Government payroll was also a contributing factor. Overall spending for Other Economic Item6 apart from Compensation of Employees was K6,680.2 million. Compared against Supplementary Budget estimate of K7,7780.0 million, total Government’s spending in goods and services recorded a massive underspending of K1,093.6 million, or 14.0 percent.
5 Table 11 summarises Domestic Funds by GFS 2014 Functional Classification of Expense for the six (6) main different
Economic Items; Compensation of Employees, Use of Goods and Services, Grants, Interests, Net Acquisition of Non-financial Assets and Other Transfers (Expense). Details by individual agency and entity are provided in Part 2. 6 With respect to new GFS report, Other Economic Items refers to Goods and services usually classified under GFS
1986 reporting

17.
The final outturn on the Use of Goods and Services expenditure was K2,776.9 million, K276.5 million or 9.1 per cent lower than the supplementary budget estimates. This is K182.8 million or 6.2 per cent lower than the 2015 actual. Compared with, total expenditure on Goods and Services was lower. Actual Expenditure for Grants7 in 2016 was K1,885.2 million. This is K505.1 million or 21.1 per cent lower than the 2015 actual. Compared against the Supplementary Budget estimate, total Grants was K453.2 million or 19.4 per cent lower. The lower expenditure for Grants is reflective of the fall in revenue. Net Acquisition of Nonfinancial Assets outcome in 2016 was K677.9 million. This is K750.1 million (52.5 per cent) lower than the 2015 actual. Compared with the Supplementary Budget estimate, Net Acquisition of Nonfinancial Assets was K174.9 million or 20.5 per cent lower. The outcome for 2016 on Other Expenses was K92.1 million. This is K254.8 million or 73.5 per cent lower than the 2015 actual. Compared with the Supplementary Budget estimate, Other Expenses was K2.5 million or 2.8 per cent higher. The higher spending against Supplementary Budget estimate was primarily reflective of adjustment mostly to operational/current transfers. Further data on expenditure on Goods and Services and Personnel Emoluments for all agencies is reflected in Part 2 of this document using GFS 1986 classification. 1.4 Financing
The Net Borrowing (deficit) outcome for 2016 was K3,086.9 million, which is about 4.6 per cent of GDP. Actual financing for 2016 is K3,943.9 million, a difference of K857.0 million comprising of 2015 Cheque Floats and Transfers. This was financed by a combination of both domestic and external sources of funding.
1.4.1 External Financing
As at 31st December 2016, the total external drawdowns stands at K1,680.7 million, which is K2,049.4 million below the 2016 Original Budget estimate of K3,730.1 million or 54.9 per cent of Original Budget. This is a result of non-issuance of Sovereign Bond and delay in disbursement of second tranche of Credit Suisse (Syndicated) Loan, however, the drawings from concessional loans performed better than previous years. The increasing rate of disbursements are from existing loan projects from bilateral and multilateral sources under concessional financing. The increased disbursement from bilateral and multilateral loans reflects the high rate of implementation for some of these projects which includes but not limited to EXIM Bank of China funded loan – NCDC Road Project; Japanese Government (JICA) funded loan – Port Moresby Sewerage Project and Asian Development Bank (ADB) funded loan – Civil Aviation Development Investment Program (CADIP).
7 Given the incorrect classification of Economic item codes to its description in IFMS, significant amount of Grants
are classified under the Use of Goods and Services.

18.
Table 12: External Borrowing and Principal Repayments 2015 - 2016 (Kina, Millions) 2015 Actuals 2016 Budget 2016 Supp.
Budget 2016
Outcome
New External Borrowing 707.3 3,730.1 4,123.0 1,680.7 Concessional Financing 707.3 930.1 930.1 993.8 Commercial Financing 0.0 0.0 1,616.6 686.8 Exceptional Financing 0.0 2,800.0 1,576.3 0.0
Repayment of Principal 186.3 198.5 231.6 231.7 Net External Borrowing 521.0 3,531.6 3,891.4 1,448.9
Source: Department of Treasury
The total actual external principal repayment at the end of 2016 was K231.7 million, an increase of K33.2 million or about 16.7 per cent compared to the Original Budget estimate of K198.5 million. The increase in principal repayment is attributed to the depreciation of the Kina against major loan trading currencies, particularly against the US Dollar, Yen and Euro resulting in an overall net external financing of K1,448.9 million.
1.4.2 Domestic Financing The domestic borrowing for 2016 totalled K14,117.7 million comprising of K13,092.9 million issued under Treasury Bills and K1,024.8 million issued under Inscribed Stocks issuances. This represented an overall increase of K5,967.7 million from the 2016 Original Budget estimate of K8,150.0 million or 73.2 per cent. The substantial increase in domestic borrowing was largely driven by; lower than projected revenues as a result of decline in global commodity prices, proposed asset sales revenue of K725.0 million not materialising, 2015 cheque float expenditure being financed in the first half of 2016, balance of the Sovereign Bond not being issued after unfavourable markets conditions, delay in the drawing down of second tranche of the Credit Suisse budgetary support loan, and increased demand for shorter termed debt instruments which increases the frequency of refinancing. Table 13: Domestic Borrowing and Principal Repayments 2015 - 2016 (Kina, Millions)
2015
Actuals 2016
Budget 2016 Supp.
Budget 2016 Outcome
New Domestic Borrowing 10,970.2 8,150.0 9,679.6 14,117.7 Treasury Bills Financing 9,473.8 7,250.0 8,779.6 13,092.9 Inscribed Stocks Financing 1,496.4 900.0 900.0 1,024.8
Repayment of Principal 8,889.3 9,652.0 11,458.5 11,622.8 Treasury Bills Maturities 8,398.3 9,188.0 10,994.5 11,158.8 Inscribed Stocks Maturities 491.1 464.0 464.0 464.0
Net Domestic Borrowing 2,080.8 -1,502.0 1,778.9 2,494.9 Source: Department of Treasury
Actual total domestic debt repayment in 2016 was K11,622.8 million, which comprised of K11,158.8 million in Treasury Bills and K464.0 million in Inscribed Stock; an overall increase of 20.4 per cent from Original Budget estimate. The increase is attributed to the increased issuance of shorter term Treasury Bills in the first half of 2016 which consequently matured in the second half of the year. This resulted in a Net Domestic Financing of K2,494.9 million for 2016.

19.
1.4.3 Net Financing
With net domestic borrowing of K2,494.9 million and net foreign borrowing of K1,448.9 million, the total net borrowing at the end of 2016 was K3,943.9 million.
Table 14:Summary of Net Borrowings 2016 (Kina, Millions)
2016
Outcome
FINANCING
Net Domestic Borrowing 2,494.9 Net External Borrowing 1,448.9 Total Net Borrowing 3,943.9
Source: Department of Treasury
1.4.4 Debt Service
Total Debt Service comprises repayments of principals, interests and other fees and charges related to public debt. At the end of 2016, the repayment of principal totalled K11,854.5 million, comprising of K231.7 million in external repayments and K11,622.8 million in domestic repayment. Total interest and fees paid in 2016 was K1,264.3 million which is K189.6 million higher than the 2015 actual of K1,074.7 million. This represents an increase of 17.6 per cent in total financing costs in 2016. The increase in the interest and related costs resulted mainly from slight increase in domestic interest rates and yields as well as increase in the frequency of refinancing or roll-over of Treasury Bills whose maturities are six months or less throughout 2016. Table 15: Interest and Fees (Kina, Millions)
2015 Actuals
2016 Outcome
Domestic Interest and other fees paid 1,020.5 1,195.9 Adjustments:
Interest accrued on issuance1 -31.1 -17.6 Net discount/premium on issuance2 1.5 5.0
Total Domestic 991.0 1,183.3 External Interest External Borrowing related charges
76.1 7.6
72.2 8.8
Total External 112.8 81.0
Total Interest and Charges 1,074.7 1,264.3 Source: Department of Treasury
1. Inscribed Stock is a bond instrument that pays semi-annual coupons. Investors who purchase Inscribed Stock are
entitled to receive a full coupon on the next coupon date, despite not holding the bond for the full 6 month coupon
period. In recognition of this, an element of the proceeds received on issuance is for the interest that has accrued
on the bond up to the date of issuance. The proceeds for accrued interest are treated as an interest offset to reflect
the true interest cost on the bond.
2. The difference between the proceeds received on issuance and the bond’s face value plus accrued interest.

20.
1.5 Public Debt
The level of Total Central Government Debt at the end of 2016 stood at K21,944.0 million or 32.6 per cent of GDP. This is a K3,977.1 million or 22.1 per cent increase in debt level from 2015 to 2016. The final outcome of the 2016 Total Central Government Debt was K2,198.7 million higher than 2016 Original Budget estimate of K19,745.3 million. In the domestic portfolio, total debt level was K16,436.9 million at the end of 2016; That is K2,494.2 million above the 2015 level of K13,942.0 million and K4,075.4 million higher than Original Budget estimate of K12,361.5 million. This increase in domestic debt levels was mainly due to higher than anticipated Treasury Bills and Inscribed Stock issuance to finance the 2016 budget deficit including challenges to finance the budget amidst general fall in revenue throughout the year; unfavourable market condition for issuing Sovereign Bond and delay in the drawing down of the second tranche of Credit Suisse loan. External Debt increased to K5,507.1 million from 2015 debt level of K4,058.1 million. This is due to an increase in net external borrowings that resulted from less principal repayment against larger disbursements drawn from multilateral and bilateral sources as well as Credit Suisse.
Table 16:Central Government Debt 2015 - 2016 (Kina, Millions)
2015
Actuals 2016
Budget 2016 Supp.
Budget 2016
Outcome
Domestic 13,942.0 12,361.5 12,129.8 16,436.9 Securities
Treasury Bills
6,729.4
4,729.2
4,481.2
8,663.5 Inscribed Stock 7,212.6 7,632.3 7,648.6 7,773.4 Loans 0.0 0.0 0.0
Domestic Debt as a % of GDP 22.4% 18.3% 18.0% 24.4% External 4,058.1 7,383.7 7,949.5 5,507.1
Securities Bonds Loans International Agencies
4,058.1
2,800
4.583.7
1,576.3
4,756.6
0.0
4,820.3
Commercial Loans 0.0 0.0 1,616.6 686.8 Others 0.0 0.0 0.0 0.0
External Debt as a % of GDP 6.5% 11.0% 11.8% 8.2%
Total Public Debt Outstanding 18,000.1 19,745.3 20,079.4 21,944.0 As % of GDP 29.0% 29.3% 29.8% 32.6% Source: Department of Treasury

21.
1.6 Superannuation The Government as the employer of the public servants, has the legal responsibility to facilitate payments of its superannuation obligation to the Nambawan Super Limited (NSL) for its employer superannuation contribution. As stipulated under the Superannuation (General Provision) Act 2000, the State is obliged to contribute 8.4 per cent of the base salary of each contributing employee as its employer superannuation contribution to NSL. The payment of State’s superannuation contribution has been split into two components, the automation and the exit payments. The two appropriations have separate line items in the Budget under Miscellaneous Vote 207.
1.6.1 Automation Payments
Since April 2012, the Government has automated its employer superannuation contribution. The automation process transfers superannuation contributions electronically through the government payroll systems to NSL on a fortnightly basis. The Automation Process remits the State share of superannuation contributions allocated in a fiscal year while its superannuation liabilities (mostly exit reimbursements) are paid manually according to the invoices provided by NSL. In 2016, the Government remitted the full appropriation of K182.0 million through the automation process which was paid directly to NSL’s nominated Account. Similarly, the State has appropriated another K182.0 million for the automation in 2017. This process has significantly improved the financial certainty for both public servants and NSL, and reduced related financial and economic costs.
1.6.2 Exit Payments In addition to paying the full 8.4 per cent of employer contribution through the automation process, the Government also appropriates money annually to make exit payments to members who are owed payments prior to 2009 where the State has not fully met its superannuation obligations as provided under the Act. Due to the fall in revenues as a result of low commodity prices, the Government has underfunded its superannuation obligations in recent years. In 2016, only K18.0 million was budgeted, however, the Government sourced an additional K57.0 million to make a total payment of K75.0 million to NSL as re-imbursement for part of the payment they made to exiting members in 2015. This year’s budget for the exit payments is K90.0 million. This amount will be insufficient to pay the arrears incurred in 2016 and 2017 exit payments. The Government considers the outstanding exit payments as a priority and will take proactive measures to address this issue including identifying and committing additional funds this year where necessary to settle the arrears in 2017 so that the burden is less in 2018.
1.7 Trust Accounts Since 2005, a total of K10,354.7 million has been appropriated (before the revision of the Special Intervention Fund (SIF)) and deposited into the Budget Funded Trust Accounts for the implementation of expenditure programs. The Trust Accounts have largely been funded from additional mineral revenue in supplementary budgets and from annual budgets. The purpose of holding funds in trusts is to give time to agencies to properly plan and implement projects.

22.
Table 17 shows a summary of the movement of funds in and out of Budget Funded Trust Accounts from 2005 to 2016.
Table 17: Source of Funds for Budget Funded Trust Accounts: 2005 – 2016
Year
Deposits from Supplementary Budget
& Additional Priority Expenditure
Deposits from Annual Budgets
& Interest
Spending from Trust Accounts
Net Savings (Deposits less
Spending)
2005 400.0 0.0 0.0 400.0
2006 568.4 0.0 0.0 568.4
2007 1,283.0 0.0 76.0 1,207.0
2008 1,501.4 36.5 480.5 1,057.4
2009 0.0 627.2 2,365.9 -1,738.7
2010 0.0 887.2 818.3 68.9
2011 628.5 598.2 1,426.3 -199.6
2012 398.0 428.0 1,095.0 -269.0
2013 247.6 450.0 537.1 160.5
2014 250.0 209.2 827.9 -368.7
2015 0.0 1,019.5 1,345.5 -326.0
2016 0.0 90.0 769.8 -679.8
Total (2005-2016)
5,276.9 4,345.8 9,742.3 -119.6
Source: Department of Treasury and Department of Finance
*Deposits reported against year appropriated, spending reported by calendar year.
The opening balance for Budget Trust Accounts at 1st January 2016 was K318.8 million. Total receipts for the period (1st January to 31st December 2016) were largely from deposits from the 2016 Budget of K621.0 million in total. The closing balance of Budget Funded Trust Accounts as at 31st December 2016 was K169.9 million. Appendix 1 lists these Trust Accounts. A total of K190.0 million8 was appropriated for Trust Accounts in the 2016 Budget. However, this was revised down to K120.0 million. Table 18 below shows the appropriations for these Trust Accounts and the amounts transferred.
Table 18: Appropriations for Trust Accounts 2016 (Kina, Millions)
Expenditure Programs Appropriation
for Trust Account
Revised Appropriation for Trust Accounts
Payments into Trust Account
2016 Budget
Infrastructure Development Grant (UBSA) 120.0 90.0 60.0
Special Interventions Program (ABG) 70.0 30.0 30.0
TOTAL 190.0 120.0 90.0 Source: Department of Treasury and Department of Finance
*Payments into Trust Account reported against year appropriated.
Following is a summary of expenditure for Budget Funded Trust Accounts for the period 1st January – 31st December 2016 where more than K5.0 million was expended. Appendix 1 shows the movements in these Budget Funded Trust Accounts for the period 1st January – 31st December 2016.
8 As per the Appropriation Bill, only K190.0 million was appropriated for Trust Accounts in the 2016 Budget; K120.0 million for Infrastructure Development Grants (UBSA) and K70.0 million for Special Intervention Program (ABG)

23.
K51.1 million was spent from the ABG Special Intervention Fund Trust Account during this period.
K20.6 million was spent from the ABG Restoration and Development Grant Trust during this period in relation to impact projects associated with the ABG Restoration and Development program in the Autonomous Region of Bougainville.
K18.9 million was Transferred from the 89 District Service Improvement Program Subsidiary Trust Account into the new DSIP Operating Accounts for the 89 districts with the corresponding balances for the respective 89 DSIP Subsidiary Trust Accounts.
K9.3 million was spent from the Transport Sector Infrastructure Rehabilitation trust for various expenditures.
K7.9 million was spent from the Rehabilitation of Houses for Police Trust Account for the police housing projects around the country.
K5.2 million was spent from the Madang Marine Park Development Trust during this period in relation to the Pacific Marine Industrial Zone project.
District Services Improvement Program (DSIP) Trust Accounts Prior to 2012, a total of K1,789.0 million was appropriated for the DSIP and paid into 89 DSIP Trust Accounts. Since 2013, all districts have been funded their DSIP directly through the Budget to their District Treasury Operating Accounts. As at 31st December 2016, the total DSIP balance stands at zero, which reflects the transfer of all funds into the new accounts which were previously held in the subsidiary trust accounts. Appendix 2 shows the movements of funds for the period 1st January to 31st December 2016 for each of the 89 DSIP subsidiary Bank Accounts.

24.
1.8 Government Finance Statistics Information contained herein is derived from the International Monetary Fund’s Government Finance Statistics Manual 2014 (GFSM 2014). This is to inform the public that the Government has already adopted the updated Government Finance Statistics (GFS 2014) reporting framework in the 2016 National Budget.
The GFS 2014 framework is a macroeconomic statistical system designed to support fiscal analysis. The GFS 2014 framework incorporates economic and accounting principles that can be used when compiling government budgets and presenting fiscal statistics.
In the 2016 Budget, the Government undertook a major reform to improve the reporting of its finances by moving to the updated international standard of reporting in GFS 2014. This has resulted in some re-categorisation of revenues and expenditures.
1.8.1 Changes between the GFSM 1986 and GFSM 2014
In the 2013 Budget the Government announced that it would be moving from an International Monetary Fund (IMF) GFSM 1986 framework of Budget reporting to an updated GFSM 2001 framework. The IMF in 2015 released an updated version of the GFSM 2001, the GFSM 2014.
The updated framework allows for harmonisation with other macroeconomic frameworks, such as the System of National Accounts, Monetary Statistics and Trade Statistics, and also allows for cross-country comparisons. The GFSM 2014 is being used for the first time in Papua New Guinea in Volume 1 of the 2016 Budget. It represents a significant modernisation and expansion of the coverage of the previously used GFSM 1986.
The GFSM 2014 better defines the public sector and in particular the general government sector, as it is based on the concept of institutional unit coverage. The general government sector consists of all government units, representing budgetary central government, provincial government, local government and extra-budgetary accounts within the country that are controlled and largely financed by the government. In contrast, the coverage of the GFSM 1986 system was defined on a narrower functional basis to include all units carrying out a function of government.
Due to its broader and more extensive coverage of economic units, the GFSM 2014 allows for greater understanding of where and how the government is spending its money, and therefore supports better decision making, economically as well as functionally.
Three new tables were introduced to Volume 1 of the 2016 Budget: The Statement of Sources and Uses of Cash, the Statement of Operations, and the Classification of Functions of Government (COFOG). It also includes a new reporting approach to the pre-existing Revenue and Expense (previously Expenditure) Tables, the Transactions in Financial Asset and Liabilities Table (replacing the Central Government Financing Table), and a revised General Government Debt table.
1.8.2 Balancing items Two important balances are derived from GFSM 2014 and used in the Volume 1 Tables. Revenue minus expenses (other than the consumption of fixed capital) equals the Gross Operating Balance and is set out in the Statement of Operations. The Gross Operating Balance is therefore,

25.
a reflection of the total change in net worth of the general government sector due to transactions and is a measure of the sustainability of government operations. The Gross Operating Balance minus the Net Acquisition of Non-Financial Assets gives Net Lending/Net Borrowing. Net Lending/Borrowing is also equal to Net Acquisition of Financial Assets minus Net Incurrence of Liabilities. In essence, Net Lending/Borrowing measures the extent to which the government is either putting financial resources at the disposal of other sectors in the economy and non-residents (Net Lending) or utilising the financial resources generated by other sectors and non-residents (Net Borrowing). This balance can therefore be seen as an indicator of the financial impact of government activity on the rest of the economy and non-residents. It is the equivalent of the overall deficit/surplus in the GFSM 1986, but determined using the accrual basis of recording.
Net Lending/Borrowing is similar to a surplus/deficit under GFSM 1986; however, there are two major differences:
(1) Net Lending/Borrowing does not include any financing transactions, whereas the overall deficit/surplus included lending for policy purposes; and
(2) Net Lending/Borrowing is an accrual concept, while the overall deficit/surplus is a cash concept.
The Statement of Sources and Uses of Cash may assist in assessing the liquidity of the general government. The statement reflects the total amount of cash generated or absorbed by current operating activities, transactions in non-financial assets (fixed assets, property, plant and equipment), and transactions involving financial assets and liabilities other than the financial asset currency (cash) itself. The net change in the stock of cash is the sum of the net cash received/used from these operating activities, transactions in non-financial assets and transactions involving financial assets (other than cash) and liabilities. As a ‘cash’ statement it excludes in-kind related flows/transactions.
The Statement of Operations presents details of transactions in revenue and expense, as well as the net investment in non-financial assets, the net acquisition of financial assets, and the net incurrence of liabilities. The Statement of Operations is intended to be compiled using the accrual basis of recording transactions. With the exception of consumption of fixed capital, in-kind and imputed transactions, and other accounts receivable/payable, all of the line items in the Statement of Operations can be applied to both cash and accrual data. In the case the Government of PNG a modified cash-basis approach is taken where some accrual-like information is available.
Under the GFSM 2014 methodology, Revenue transactions are recorded on a gross basis and in the Government of PNG context, non-payable Infrastructure Tax Credits (ITC), revenue from asset sales and recoveries of previous years will be excluded. Goods and Services Tax (GST) collections and bookmakers’ licence fees collected and to be transferred to provinces will not be offset in revenue but the corresponding amounts will be reflected as items in expense per economic and functional classification in the Expense Table. Under the GFSM 2014 methodology, sales of assets are deducted from the total non-financial assets to reflect the net investment in non-financial assets. New borrowing acquired and received by the Government is regarded as an incurrence of a liability and is therefore registered as a transaction in assets and liabilities. The GFSM 2014 now includes all in-kind related receipts where data is available.
The classification of Expense by economic type under GFSM 2014 is broadly similar to the corresponding classification in the GFSM 1986. The primary exception is that acquisitions of

26.
non-financial assets are not considered an expense and repayment of borrowing is regarded as transactions in assets in liabilities under GFSM 2014. Other differences include: Consumption of fixed capital which is an expense under GFSM 2014 was not included under the GFSM 1986 as it is a non-cash expense. Transfer payments are classified by type of payment under GFSM 2014. Under the GFSM 1986 they were classified by the sector receiving the payment. The major types of transfer payments are subsidies, grants, and social benefits. The GFSM 2014 now includes all in-kind related payments where data is available.
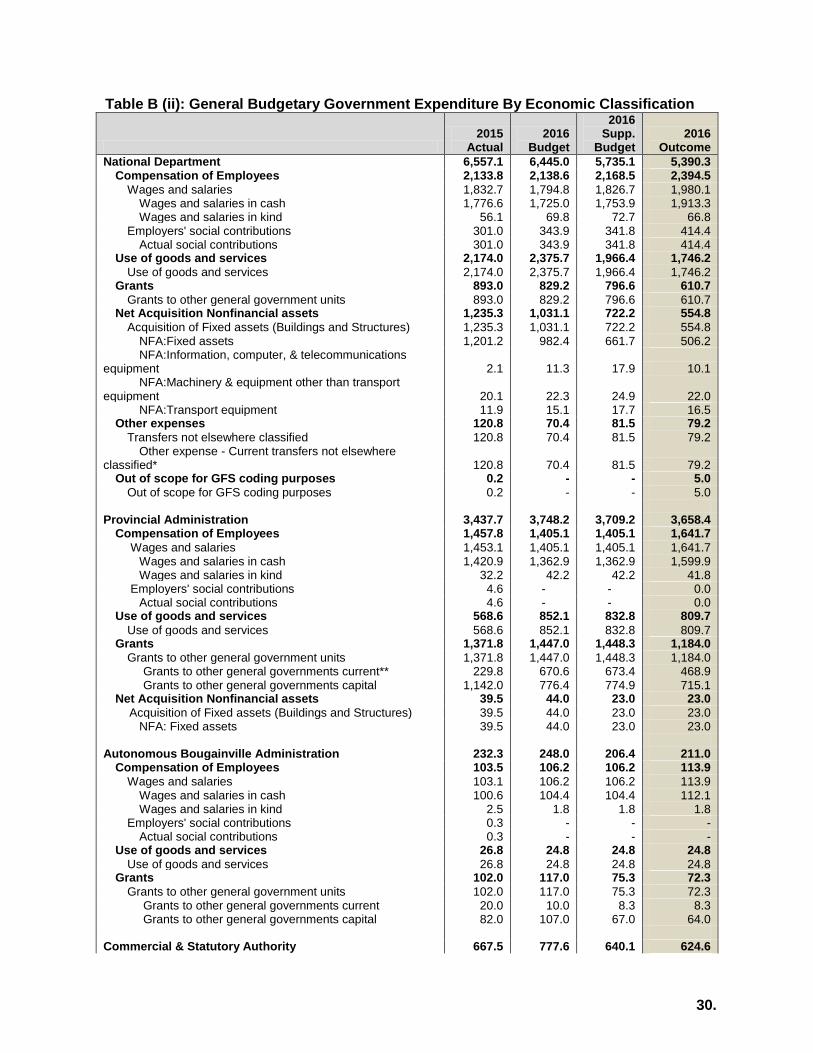
Table B (i) details the General Government Expense Economic Classification. This table provides for a summary of expense per economic classification and Table B (ii) provides final output expenditure for the National Government, Provincial Governments, Autonomous Bougainville Government and Commercial and Statutory Authorities.
1.8.3 General Government Debt
Table C details the General Government’s Transactions in Financial Assets and Liabilities.
Table F summarises the General Government’s Stock of Debt at the end of the reporting period.
The new Classification of Functions of Government (COFOG) shows the cross-economic functional classification of expenditure for the general government, detailing where government expenditure is directed by function. COFOG provides meaningful information that may be used to study the effectiveness of government programs in areas like health, education, economic affairs, social protection and general public services. There are ten major functions. It is an internationally standardised table that allows cross-country comparisons of government priorities.
27.
FISCAL TABLES
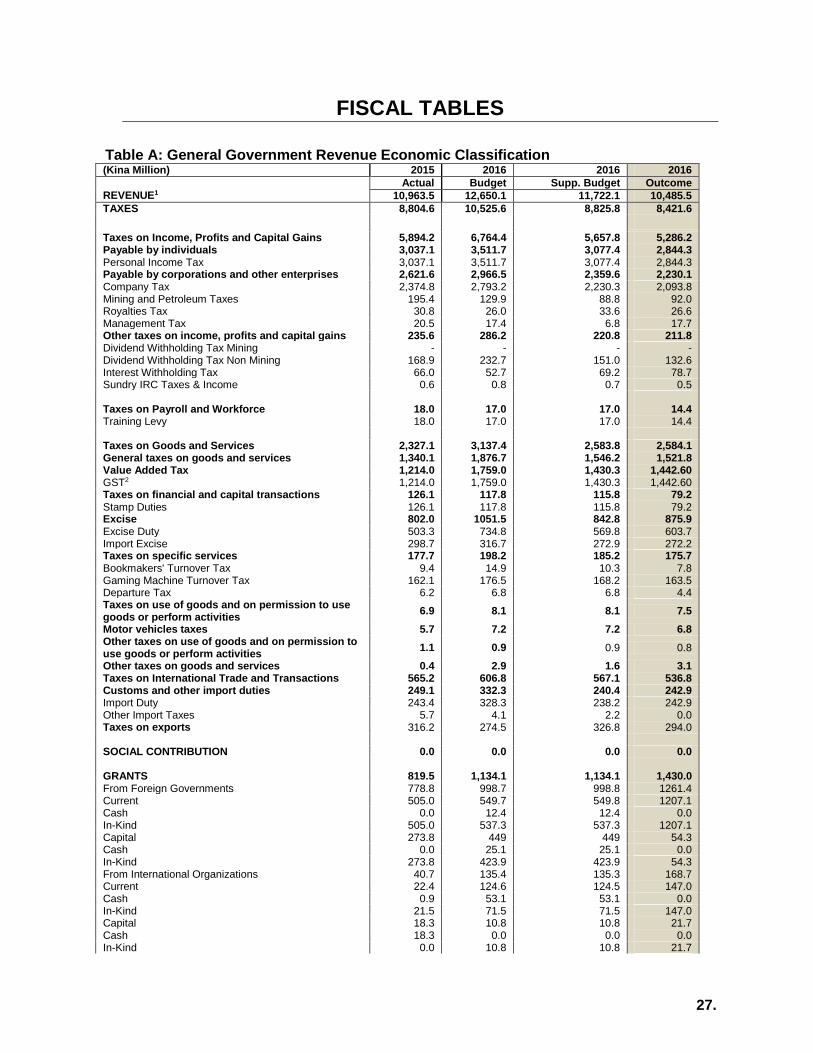
Table A: General Government Revenue Economic Classification
(Kina Million) 2015 2016 2016 2016
REVENUE1
Actual Budget Supp. Budget Outcome
10,963.5 12,650.1 11,722.1 10,485.5
TAXES 8,804.6 10,525.6 8,825.8 8,421.6
Taxes on Income, Profits and Capital Gains 5,894.2 6,764.4 5,657.8 5,286.2 Payable by individuals 3,037.1 3,511.7 3,077.4 2,844.3 Personal Income Tax 3,037.1 3,511.7 3,077.4 2,844.3 Payable by corporations and other enterprises 2,621.6 2,966.5 2,359.6 2,230.1 Company Tax 2,374.8 2,793.2 2,230.3 2,093.8 Mining and Petroleum Taxes 195.4 129.9 88.8 92.0 Royalties Tax 30.8 26.0 33.6 26.6 Management Tax 20.5 17.4 6.8 17.7 Other taxes on income, profits and capital gains 235.6 286.2 220.8 211.8 Dividend Withholding Tax Mining - - - - Dividend Withholding Tax Non Mining 168.9 232.7 151.0 132.6 Interest Withholding Tax 66.0 52.7 69.2 78.7 Sundry IRC Taxes & Income 0.6 0.8 0.7 0.5 Taxes on Payroll and Workforce 18.0 17.0 17.0 14.4 Training Levy 18.0 17.0 17.0 14.4 Taxes on Goods and Services 2,327.1 3,137.4 2,583.8 2,584.1 General taxes on goods and services 1,340.1 1,876.7 1,546.2 1,521.8 Value Added Tax 1,214.0 1,759.0 1,430.3 1,442.60 GST2 1,214.0 1,759.0 1,430.3 1,442.60 Taxes on financial and capital transactions 126.1 117.8 115.8 79.2 Stamp Duties 126.1 117.8 115.8 79.2 Excise 802.0 1051.5 842.8 875.9 Excise Duty 503.3 734.8 569.8 603.7 Import Excise 298.7 316.7 272.9 272.2 Taxes on specific services 177.7 198.2 185.2 175.7 Bookmakers' Turnover Tax 9.4 14.9 10.3 7.8 Gaming Machine Turnover Tax 162.1 176.5 168.2 163.5 Departure Tax 6.2 6.8 6.8 4.4 Taxes on use of goods and on permission to use goods or perform activities
6.9 8.1 8.1 7.5
Motor vehicles taxes 5.7 7.2 7.2 6.8 Other taxes on use of goods and on permission to use goods or perform activities
1.1 0.9 0.9 0.8
Other taxes on goods and services 0.4 2.9 1.6 3.1 Taxes on International Trade and Transactions 565.2 606.8 567.1 536.8 Customs and other import duties 249.1 332.3 240.4 242.9 Import Duty 243.4 328.3 238.2 242.9 Other Import Taxes 5.7 4.1 2.2 0.0 Taxes on exports 316.2 274.5 326.8 294.0 SOCIAL CONTRIBUTION 0.0 0.0 0.0 0.0 GRANTS 819.5 1,134.1 1,134.1 1,430.0 From Foreign Governments 778.8 998.7 998.8 1261.4 Current 505.0 549.7 549.8 1207.1 Cash 0.0 12.4 12.4 0.0 In-Kind 505.0 537.3 537.3 1207.1 Capital 273.8 449 449 54.3 Cash 0.0 25.1 25.1 0.0 In-Kind 273.8 423.9 423.9 54.3 From International Organizations 40.7 135.4 135.3 168.7 Current 22.4 124.6 124.5 147.0 Cash 0.9 53.1 53.1 0.0 In-Kind 21.5 71.5 71.5 147.0 Capital 18.3 10.8 10.8 21.7 Cash 18.3 0.0 0.0 0.0 In-Kind 0.0 10.8 10.8 21.7

28.
OTHER REVENUE 1,339.4 990.4 1,761.6 633.9 Property Income 943.1 516.9 853.3 551.3 Interest 0.0 4.0 4.0 0.0 Interest from non-residents 0.0 0.0 0.0 0.0 Interest from residents other than general government 0.0 4.0 4.0 0.0 Dividends 911.4 480.0 816.4 528.9 Mining Petroleum and Gas Dividends 456.4 - 500.0 300.5 Dividends from Statutory Authorities 85.0 70.0 178.0 225.0 Shares in Private Enterprise 0.0 0.0 0.0 0.0 Dividends from State Owned Enterprises 370 110.0 138.4 0.0 Other Dividends 0.0 300.0 0.0 3.4 Rent 31.7 32.9 32.9 22.4 Sales of goods and services 65.6 85.4 85.4 63.5 Sales by market establishments 0.0 0.0 0.0 0.0 Administrative fees 25.3 31.1 31.1 28.7 Incidental sales by nonmarket establishments 40.3 54.3 54.3 34.9 Fines, penalties, and forfeits 2.8 0.8 0.8 1.8 Transfers not elsewhere classified 14.4 387.3 822.1 17.2 Current transfers not elsewhere classified 14.4 387.3 822.1 17.2 Subsidies 0.0 0.0 0.0 0.0 Other current transfers 14.4 387.3 822.1 17.2 Recovery of Utility Charges 0.3 0.0 0.0 0.0 Payroll Commission 11 7.2 7.2 15.1 Sundry/(Other) Income 3.1 0.9 0.9 2.1 SWF 0.0 379.1 813.9 0.0 Capital transfers not elsewhere classified 0.0 0.0 0.0 0.0
Source: Department of Treasury 1. Under the GFS 2014 methodology, non-payable infrastructure tax credits, revenue on asset sales, recoveries and trust
accounts are excluded. GST includes the Gross Collections net of Refunds 2. The 2016 Figures are reported in the 2014 GFS. GST represents the total of collections by Provinces, PNG Ports and
Refunds. *2015 Revenue is in 1986 GFS reporting to be in line with the 2015 Final Budget Outcome. Total for Other Revenues included ITC (K219.5m) & Recoveries (K93.9m) **SWF Transfer initially captured under Grant has been reclassified as Transfer not elsewhere classified

29.
Table B (i) General Budgetary Expenditure By Economic Classification
2015
Actual 2016
Budget 2016 Supp.
Budget 2016
Outcome
2 Expense 13,496.1 14,762.6 13,834.6 13,572.4 Compensation of Employees 3,993.3 3,962.8 3,992.4 4,463.4
Wages and salaries 3,662.5 3,592.4 3,624.1 4,021.6 Wages and Salaries 3,229.9 1,807.9 1,775.4 1,949.6 Wages and salaries in cash 333.7 1,661.0 1,722.3 1,952.1 Wages and salaries in kind 98.9 123.4 126.4 119.9
Employers' social contributions 330.8 370.4 368.3 441.8 Actual social contributions 330.8 370.4 368.3 441.8
Use of goods and services 3,989.8 4,560.0 4,128.7 4,166.3 Use of goods and services 3,989.8 4,560.0 4,128.7 4,166.3
Use of goods and services 3,989.8 4,560.0 4,128.7 4,166.3 Grants 2,393.9 2,441.9 2,347.8 1,885.2
Grants to other general government units 2,393.9 2,441.9 2,347.8 1,885.2 Grants to other general governments current 1,169.9 1,558.5 1,505.9 1,106.2 Grants to other general governments capital 1,224.0 883.4 841.9 779.1
Interest 1,074.7 1,453.1 1,443.7 1,264.3 To non-residents 1,009.3 267.2 267.2 77.0
Interest to Non residents 65.5 267.2 267.2 77.0 To residents other than general government 65.5 1,185.9 1,176.5 51.8
Interest to residents other than general governments
65.5 1,185.9 1,176.5 51.8
Other expenses 127.4 408.7 410.6 87.2 Transfers not elsewhere classified 127.4 408.7 410.6 87.2
Other expense - Current transfers not elsewhere classified
127.4 408.7 410.6 87.2
3 Net Acquisition of Nonfinancial assets 1,916.7 1,936.1 1,511.4 1,701.1 Acquisition of Fixed assets (Buildings and Structures)
1,916.7 1,936.1 1,511.4 1,701.1
NFA:Fixed assets 1,916.7 1,874.2 1,438.3 1,701.1 NFA:Information, computer, & telecommunications equipment
24.2 20.8 27.3 12.7
NFA:Machinery & equipment other than transport equipment
22.7 24.7 27.2 24.2
NFA:Transport equipment 14.2 16.4 18.5 17.1 Out of scope for GFS coding purposes 0.2 - - 5.0
Out of scope for GFS coding purposes 0.2 - - 5.0 Out of scope for GFS coding purposes 0.2 - - 5.0
Source: Department of Treasury
30.
Table B (ii): General Budgetary Government Expenditure By Economic Classification
2015
Actual 2016
Budget
2016 Supp.
Budget 2016
Outcome
National Department 6,557.1 6,445.0 5,735.1 5,390.3 Compensation of Employees 2,133.8 2,138.6 2,168.5 2,394.5
Wages and salaries 1,832.7 1,794.8 1,826.7 1,980.1 Wages and salaries in cash 1,776.6 1,725.0 1,753.9 1,913.3 Wages and salaries in kind 56.1 69.8 72.7 66.8
Employers' social contributions 301.0 343.9 341.8 414.4 Actual social contributions 301.0 343.9 341.8 414.4
Use of goods and services 2,174.0 2,375.7 1,966.4 1,746.2
Use of goods and services 2,174.0 2,375.7 1,966.4 1,746.2 Grants 893.0 829.2 796.6 610.7
Grants to other general government units 893.0 829.2 796.6 610.7 Net Acquisition Nonfinancial assets 1,235.3 1,031.1 722.2 554.8
Acquisition of Fixed assets (Buildings and Structures) 1,235.3 1,031.1 722.2 554.8 NFA:Fixed assets 1,201.2 982.4 661.7 506.2 NFA:Information, computer, & telecommunications
equipment 2.1 11.3 17.9 10.1 NFA:Machinery & equipment other than transport
equipment 20.1 22.3 24.9 22.0 NFA:Transport equipment 11.9 15.1 17.7 16.5
Other expenses 120.8 70.4 81.5 79.2
Transfers not elsewhere classified 120.8 70.4 81.5 79.2 Other expense - Current transfers not elsewhere
classified* 120.8 70.4 81.5 79.2 Out of scope for GFS coding purposes 0.2 - - 5.0
Out of scope for GFS coding purposes 0.2 - - 5.0 Provincial Administration 3,437.7 3,748.2 3,709.2 3,658.4
Compensation of Employees 1,457.8 1,405.1 1,405.1 1,641.7
Wages and salaries 1,453.1 1,405.1 1,405.1 1,641.7 Wages and salaries in cash 1,420.9 1,362.9 1,362.9 1,599.9 Wages and salaries in kind 32.2 42.2 42.2 41.8
Employers' social contributions 4.6 - - 0.0 Actual social contributions 4.6 - - 0.0
Use of goods and services 568.6 852.1 832.8 809.7
Use of goods and services 568.6 852.1 832.8 809.7 Grants 1,371.8 1,447.0 1,448.3 1,184.0
Grants to other general government units 1,371.8 1,447.0 1,448.3 1,184.0 Grants to other general governments current** 229.8 670.6 673.4 468.9 Grants to other general governments capital 1,142.0 776.4 774.9 715.1
Net Acquisition Nonfinancial assets 39.5 44.0 23.0 23.0
Acquisition of Fixed assets (Buildings and Structures) 39.5 44.0 23.0 23.0 NFA: Fixed assets 39.5 44.0 23.0 23.0
Autonomous Bougainville Administration 232.3 248.0 206.4 211.0
Compensation of Employees 103.5 106.2 106.2 113.9
Wages and salaries 103.1 106.2 106.2 113.9 Wages and salaries in cash 100.6 104.4 104.4 112.1 Wages and salaries in kind 2.5 1.8 1.8 1.8
Employers' social contributions 0.3 - - - Actual social contributions 0.3 - - -
Use of goods and services 26.8 24.8 24.8 24.8
Use of goods and services 26.8 24.8 24.8 24.8 Grants 102.0 117.0 75.3 72.3
Grants to other general government units 102.0 117.0 75.3 72.3 Grants to other general governments current 20.0 10.0 8.3 8.3 Grants to other general governments capital 82.0 107.0 67.0 64.0
Commercial & Statutory Authority 667.5 777.6 640.1 624.6

31.
Compensation of Employees 298.2 312.8 312.6 313.2
Wages and salaries 273.5 286.3 286.1 285.9 Wages and salaries in cash 265.4 276.7 276.5 276.4 Wages and salaries in kind 8.1 9.6 9.6 9.5
Employers' social contributions 24.8 26.5 26.5 27.3 Actual social contributions 24.8 26.5 26.5 27.3
Use of goods and services 185.3 205.7 193.6 185.0
Use of goods and services 185.3 205.7 193.6 185.0 Grants 23.5 39.4 18.2 18.2
Grants to other general government units 23.5 39.4 18.2 18.2 Net Acquisition Nonfinancial assets 153.8 202.4 107.6 100.2
Acquisition of Fixed assets (Buildings and Structures) 153.8 202.4 107.6 100.2 NFA:Fixed assets 140.3 198.7 104.5 97.3 NFA:Machinery & equipment other than transport
equipment 2.6 2.3 2.3 2.2 NFA:Transport equipment 2.3 1.3 0.7 0.7 Information, computer, and telecommunications (ICT)
equipment 8.6 - - - Other expenses 6.7 17.3 8.1 8.0
Transfers not elsewhere classified 6.7 17.3 8.1 8.0 Other expense - Current transfers not elsewhere
classified 6.7 17.3 8.1 8.0 Interest Payment 1,074.7 1,479.6 1,479.6 1,264.3
Use of goods and services 4.8 26.5 35.9 16.2
Use of goods and services 4.8 26.5 35.9 16.2 Interest 1,069.9 1,453.1 1,443.7 1,248.1
To residents other than general government 1,069.9 1,185.9 1,176.5 1,171.1 Interest to residents other than general governments 65.5 1,185.9 1,176.5 1,171.1
To non-residents - 267.2 267.2 77.0 Interest to non-residents - 267.2 267.2 77.0
Grand Total (GoPNG) 11,969.3 12,698.4 11,770.4 11,148.6
Concessional Loans 707.3 930.1 930.1 993.8 Donor Support Grants 819.5 1,134.2 1,134.2 1,430.0
Total Expenditure and Net Lending 13,496.1 14,762.6 13,834.6 13,572.4
Source: Department of Treasury **2014 GFS Expenditure Inclusive of GST & Bookmakers Turnover tax to Provinces.
2015 Expenditure is in 1986 GFS reporting to be in line with the 2015 Final Budget Outcome.1986 GFS captures only the GST component to WPA.
The ITC and Recoveries are captured in Other Expense for 2015

32.
Table C: Transactions In Assets And Liabilities For General Government
(Kina in ,Millions otherwise stated)
2015 Actuals
2016 Budget
2016 Supp. Budget
2016 Outcome
Net acquisition of financial assets -348.9 -1,847.2 -1,847.2 0.0 Domestic -348.9 -1,847.2 -1,847.2 0.0
Monetary gold and special drawing rights (SDR's)
Currency and deposits -292.8 -1,784.6 -1,784.6
Debt securities
Loans
Equity and investment fund shares 0.0 0.0 0.0 0.0
Insurance, pension, and standardized guarantee schemes
Financial derivatives and employee stock options
Other accounts receivable -56.1 -62.6 -62.6 0.0 External 0.0 0.0 0.0 0.0
Monetary gold and special drawing rights (SDR's)
Currency and deposits
Debt securities
Loans
Other accounts receivable
Net incurrence of liabilities 2,601.8 2,029.6 2,029.6 3,943.9 Domestic 2,080.8 -1,502.0 -1,502.0 2,494.9
Monetary gold and special drawing rights (SDR's)
Currency and deposits
Debt securities 2,080.8 -1,502.0 -1,502.0 2,494.9 New instruments 10,970.2 8,150.0 8,150.0 14,117.7 Amortisation 8,889.3 9,652.0 9,652.0 11,622.8 Treasury Bills 1,075.5 -1,938.0 -1,938.0 1,934.2 New instruments 9,473.8 7,250.0 7,250.0 13,092.9 Amortisation 8,398.3 9,188.0 9,188.0 11,158.8 Treasury Bonds 1,005.3 436.0 436.0 560.8 New instruments 1,496.4 900.0 900.0 1,024.8 Amortisation 491.1 464.0 464.0 464.0 Other accounts payable 0.0 0.0 0.0 0.0 External 521.0 3,531.6 3,531.6 1,448.9 Monetary gold and special drawing rights (SDR's) 0.0 0.0 0.0 0.0 Currency and deposits 0.0 0.0 0.0 0.0 Debt securities 0.0 2,800.0 2,800.0 0.0 New instruments 0.0 2,800.0 2,800.0 0.0 Amortisation 0.0 0.0 0.0 0.0 Concessional financing 0.0 0.0 0.0 0.0 New instruments 0.0 0.0 0.0 0.0 Amortisation 0.0 0.0 0.0 0.0 Commercial financing 0.0 0.0 0.0 0.0 New instruments 0.0 0.0 0.0 0.0 Amortisation 0.0 0.0 0.0 0.0 Extraordinary financing 0.0 2,800.0 2,800.0 0.0 New instruments 0.0 2,800.0 2,800.0 0.0 Amortisation 0.0 0.0 0.0 0.0 Loans 521.0 731.6 731.6 1,448.9 New borrowing 707.3 930.1 930.1 1,680.7 Amortisation 186.3 198.5 198.5 231.7 Concessional financing 567.7 765.5 765.5 803.6 New borrowing 707.3 930.1 930.1 993.8 Amortisation 139.6 164.6 164.6 190.2 Commercial financing 0.0 0.0 0.0 686.8 New borrowing 0.0 0.0 0.0 686.8 Amortisation 0.0 0.0 0.0 0.0 Extraordinary financing -46.7 -33.9 -33.9 -41.5 New borrowing 0.0 0.0 0.0 0.0 Amortisation 46.7 33.9 33.9 41.5
Insurance, pension, and standardized guarantee schemes 0.0 0.0 0.0 0.0 Financial derivatives and employee stock options 0.0 0.0 0.0 0.0 Other accounts payable 0.0 0.0 0.0 0.0
Source: Department of Treasury
1. Central government representing National, Provincial and Local Level Governments, Autonomous Bougainville Government and Commercial and Statutory Authorities
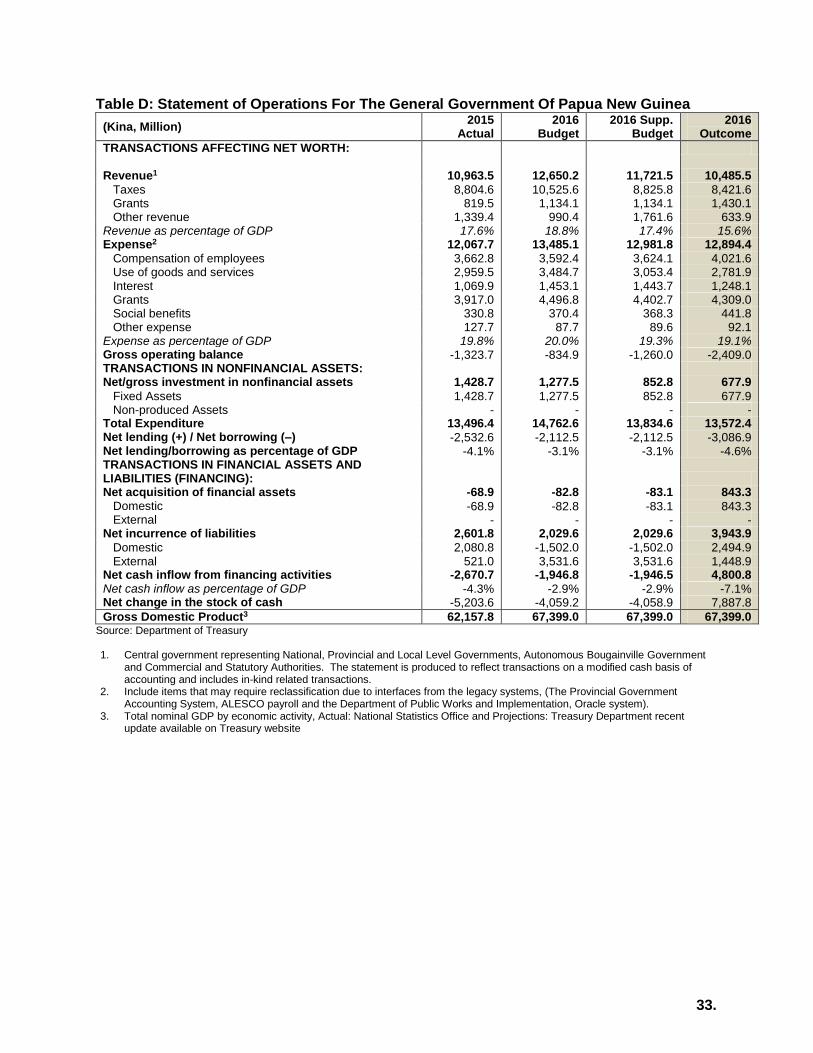
33.
Table D: Statement of Operations For The General Government Of Papua New Guinea
(Kina, Million) 2015
Actual 2016
Budget 2016 Supp.
Budget 2016
Outcome
TRANSACTIONS AFFECTING NET WORTH: Revenue1
10,963.5 12,650.2 11,721.5 10,485.5
Taxes 8,804.6 10,525.6 8,825.8 8,421.6 Grants 819.5 1,134.1 1,134.1 1,430.1 Other revenue 1,339.4 990.4 1,761.6 633.9 Revenue as percentage of GDP 17.6% 18.8% 17.4% 15.6% Expense2 12,067.7 13,485.1 12,981.8 12,894.4
Compensation of employees 3,662.8 3,592.4 3,624.1 4,021.6 Use of goods and services 2,959.5 3,484.7 3,053.4 2,781.9 Interest 1,069.9 1,453.1 1,443.7 1,248.1 Grants 3,917.0 4,496.8 4,402.7 4,309.0 Social benefits 330.8 370.4 368.3 441.8 Other expense 127.7 87.7 89.6 92.1 Expense as percentage of GDP 19.8% 20.0% 19.3% 19.1% Gross operating balance -1,323.7 -834.9 -1,260.0 -2,409.0 TRANSACTIONS IN NONFINANCIAL ASSETS: Net/gross investment in nonfinancial assets 1,428.7 1,277.5 852.8 677.9
Fixed Assets 1,428.7 1,277.5 852.8 677.9 Non-produced Assets - - - - Total Expenditure 13,496.4 14,762.6 13,834.6 13,572.4 Net lending (+) / Net borrowing (–) -2,532.6 -2,112.5 -2,112.5 -3,086.9 Net lending/borrowing as percentage of GDP -4.1% -3.1% -3.1% -4.6% TRANSACTIONS IN FINANCIAL ASSETS AND LIABILITIES (FINANCING):
Net acquisition of financial assets -68.9 -82.8 -83.1 843.3 Domestic -68.9 -82.8 -83.1 843.3 External - - - - Net incurrence of liabilities 2,601.8 2,029.6 2,029.6 3,943.9
Domestic 2,080.8 -1,502.0 -1,502.0 2,494.9 External 521.0 3,531.6 3,531.6 1,448.9 Net cash inflow from financing activities -2,670.7 -1,946.8 -1,946.5 4,800.8 Net cash inflow as percentage of GDP -4.3% -2.9% -2.9% -7.1% Net change in the stock of cash -5,203.6 -4,059.2 -4,058.9 7,887.8
Gross Domestic Product3 62,157.8 67,399.0 67,399.0 67,399.0 Source: Department of Treasury 1. Central government representing National, Provincial and Local Level Governments, Autonomous Bougainville Government
and Commercial and Statutory Authorities. The statement is produced to reflect transactions on a modified cash basis of accounting and includes in-kind related transactions.
2. Include items that may require reclassification due to interfaces from the legacy systems, (The Provincial Government Accounting System, ALESCO payroll and the Department of Public Works and Implementation, Oracle system).
3. Total nominal GDP by economic activity, Actual: National Statistics Office and Projections: Treasury Department recent update available on Treasury website

34.
Table E: Statement of Sources and Uses of Cash for the General Government of Papua New Guinea1
(Kina Million) 2015
Actuals 2016
Budget 2016 Supp.
Budget 2016
Outcome
CASH FLOWS FROM OPERATING ACTIVITIES: Revenue cash flows 10,069.2 11,606.7 10,678.9 9,055.4
Taxes 8,898.5 10,525.6 8,826.1 8,421.6 Grants 19.2 90.6 90.5 0.0 Other Revenue 1,245.5 990.4 1,761.9 633.9 Revenue as percentage of GDP 16.2% 17.2% 15.8% 13.4% Expense cash flows2 10,858.4 11,947.8 11,443.6 10,902.7
Compensation of employees 3,563.9 3,469.0 3,497.8 3,901.7 Use of goods and services 2,959.5 3,484.7 3,053.4 2,781.9 Interest 1,069.9 1,453.1 1,443.7 1,248.1 Grants 3,137.4 3,453.3 3,359.1 2,878.9 Social benefits Other payments 127.7 87.7 89.6 92.1 Expense as percentage of GDP -1.4% -0.5% -1.1% -2.7% Net cash inflow from operating activities -789.2 -341.2 -765.1 -1,847.4 CASH FLOWS FROM TRANSACTIONS IN NONFINANCIAL ASSETS:
Net cash outflow from investment in nonfinancial assets
1,428.7 1,277.5 852.8 677.9
Fixed assets 1,428.7 1,277.5 852.8 677.9 Inventories - - - - Expenditure cash flows 12,287.0 13,225.3 12,296.4 11,580.6 Cash surplus (+) / Cash deficit (–) -2,103.2 -1,618.6 -1,617.8 -2,525.3 Surplus/Deficit as percentage of GDP -3.4% -2.4% -2.4% -3.7% CASH FLOWS FROM TRANSACTIONS IN FINANCIAL ASSETS AND LIABILITIES (FINANCING):
Net acquisition of financial assets other than cash 68.9 -82.8 -83.2 857.0 Domestic 68.9 -82.8 -83.2 857.0 External - - - Net incurrence of liabilities 2,601.8 2,029.6 2,029.6 3,943.9 Domestic 2,080.8 -1,502.0 -1,502.0 2,494.9 External 521.0 3,531.6 3,531.6 1,448.9 Net cash inflow from financing activities -2,532.6 -2,112.5 -2,112.5 -3,086.9 Net cash inflow as percentage of GDP -4.1% -3.1% -3.1% -4.6% Net change in the stock of cash -4,636.1 -3,731.1 -3,730.6 -5,612.2
Gross Domestic Product3 62,157.8 67,399.0 67,399.0 67,399.0 Source: Department of Treasury
1. Central government representing National, Provincial and Local Level Governments, Autonomous Bougainville
Government and Commercial and Statutory Authorities. The statement is produced to reflect transactions on a modified cash basis of accounting and includes in-kind related transactions.
2. Include items that may require reclassification due to interfaces from the legacy systems, (The Provincial Government Accounting System, ALESCO payroll and the Department of Public Works and Implementation, Oracle system).
3. Total nominal GDP by economic activity, Actual: National Statistics Office and Projections: Treasury Department.

35.
Table F: Stocks in General Government Debt
(Kina, Million, unless otherwise stated) 2015
Actuals 2016
Budget 2016 Supp.
Budget 2016
Outcome
Domestic 13,942.0 12,361.5 12,129.8 16,436.9
Debt securities 13,942.0 12,361.5 12,129.8 16,436.9 Treasury Bills 6,729.4 4,729.2 4,481.2 8,663.5 Treasury Bonds 7,212.6 7,632.3 7,648.6 7,773.4
Loans 0.0 0.0 0.0 0.0 External 4,058.1 7,383.7 7,949.5 5,507.1
Debt securities 0.0 2,800.0 1,576.3 0.0 Concessional financing 0.0 0.0 0.0 0.0 Commercial financing 0.0 0.0 0.0 0.0 Extraordinary financing 0.0 2,800.0 1,576.3 0.0
Loans 4,058.1 4,583.7 4,756.6 5,507.1 Concessional financing 4,058.1 4,583.7 1,616.6 4,861.7 Commercial financing 0.0 0.0 0.0 686.8 Extraordinary financing 0.0 0.0 0.0 -41.5
Total Central Government Debt 18,000.1 19,745.2 20,079.3 21,944.0 Total debt as percentage of GDP 29.0% 29.3% 29.3% 32.6%
Gross Domestic Product1 62,157.8 67,399.0 67,399.0 67,399.0
Source: Department of Treasury 1. Total nominal GDP by economic activity, Actual: National Statistics Office and Projections: Treasury Department recent
update available on Treasury website.

36.
PART 2
FINAL BUDGET OUTCOME BY AGENCY
2.1 Introduction This section of the FBO summarises agencies’ final expenditure for the 2016 Financial Year. The 2016 FBO reports expenditure as an integrated Budget. That is, the Operational and the Capital expenditures combined. Data reported in this part, Part 2, is sourced from the Integrated Financial Management System (IFMS) using GFS 1986 standard so to be consistent with the 2016 Appropriation Bill.
The total 2016 Original Budget was K14,208.8 million. This was reduced by K928.0 million to K13,280.8 million through the Supplementary Budget. Both the 2016 Original and Supplementary Budgets are inclusive of Interest Payments but does not factor in the allocation for Amortisation under Debt Interest. All discussions in this section is based on the Supplementary Budget in particular the GoPNG funded component.
The total revised GoPNG funded appropriation in 2016 was K11,216.6 million. The total actual expenditure outcome in 2016 was K10,795.5 million which translates to a total underspending of K421.2 million against the total revised appropriation. This is a 3.8 per cent decrease from the 2015 FBO which was K582.3 million.
2.2 2016 Expenditure Outcome The 2016 Budget funded a total of 141 government agencies that were subsumed into nine (9) sectors. However, for budgeting and accounting purposes, Debt Interest and Miscellaneous items are included to show the total expenditure as depicted in Table 19. Table 19: GoPNG Funded Expenditure by Sectors (Kina, Millions)
Sectors 2016
Budget 2016
Reduction
2016 Supp.
Budget SA Section 4 Total Exp
Expense Variance
Administration 1,097.9 (153.5) 1,151.3 72.7 (66.0) 1,055.1 96.1
Community & Culture
95.4 (10.3) 88.5 1.7 4.5 75.6 12.9
Debt Interest9 1,479.6 0.0 1,479.6 0.0 0.0 1,264.3 215.3
Economic 485.6 (166.4) 339.1 3.9 22.1 324.6 14.6
Education 1,211.7 (69.3) 622.2 0.0 832.2 555.3 66.9
Health 1,227.5 (27.7) 1,195.7 0.0 42.5 1,064.3 131.4
Law & Justice 1,186.9 (23.0) 1,212.9 11.8 40.6 1,282.7 (69.8)
Miscellaneous 1,051.6 (142.3) 1,131.8 8.6 (960.8) 1,047.5 84.3
Provinces 3,442.5 (90.2) 3,361.8 1.2 62.0 3,516.3 (154.5)
Transport 782.8 (235.9) 576.9 0.0 23.0 558.2 18.7
Utilities 83.3 (9.5) 56.8 0.0 0.0 51.6 5.2
Grand Total 12,144.6 (928.0) 11,216.6 100.0 0.0 10,795.5 421.2
Source: IFMS
9 Information sourced from IFMS and Treasury. It includes interest payments as well as other fees and charges related to debt.

37.
Of the nine sectors, the Provinces sector was the highest spender with K3,516.3 million or 32.6 per cent of the total expenditure. The Law and Justice Sector was the second highest with K1,282.7 million or 11.9 per cent followed by Health Sector with K1,064.3 million or 9.9 per cent of the total expenditure. The two least spending sectors were, Community and Culture and Utilities sectors. Tables 21 to 31 provide detailed expenditures of each sector. The ‘Expense Variance’ column in Table 19 depicts a sector’s ‘Expenditure/Outcome’ as at 31 December 2016 against its revised Appropriation and Transfers. It provides critical information on the magnitude of over or underspending against the appropriation for each sector. Section 2.3 below provides further elaboration on the Transfers.
2.3 Section 3 And Section 4 Transfers Section 3 (Secretary’s Advance) and Section 4 of the Appropriation Act allows agencies to transfer funding when required for any critical unforeseen funding as shown above in Table 18. Section 3 and Section 4 Transfers can occur from one agency to another or from one budget item to another within an agency. Detailed transfers are presented in Tables 33 and 34.
2.3.1 Section 3 Secretary’s Advance
In 2016, a total of K100.0 million was allocated for Section 3 movements under the Secretary’s Advance. Overall, K19.0 million or 19.0 per cent of the Secretary’s Advance was expended in the first quarter of 2016. By the end of the second quarter K48.2 million or 48.2 per cent was expended. The months of March, April and May recorded the highest amount of transfers with K12.3 million or 12.3 per cent, K26.5 million or 26.5 per cent and K16.0 million or 16 per cent respectively. Funding to support agencies operations was by far the largest item committed at K62.0 million or 62.0 per cent, followed by funding of unforeseen capital investment at K16.3 million or 16.3 per cent and funding to meet Ministerial Commitments of K5.5 million or 6.0 per cent.
2.3.2 Section 4
A total of K1,309.8 million was transferred between and within sectors last year. The highest transfers were recorded under Miscellaneous then followed by the Education Sector. The Miscellaneous transfers covered important government initiatives such as TFF Education, outstanding utilities bills, funding for Electoral Commission for preparation of 2017 General Election, Law and Order matters, Superannuation obligations and transfer between GS and PE and others. In 2016, there had been significant amount of funds transferred between GS and PE to cater for shortfalls in PE. Agencies and provinces are working closely with the relevant central agencies to rectify this matter. Table 20 provides a summary of the Section 4 transfers. Table 20: Section 4 Transfers by Sectors (Kina, Millions)
Transfer In Amount In Transfer Out Amount Out Net Transfers (Sectors) (Sector)
Administration 132.9 Administration (198.8) (66.0)
Community & Culture 4.5 Community &Culture 0.0 4.5
Economic 22.1 Economic 0.0 22.1
Education 832.5 Education (0.3) 832.2
Health 42.5 Health 0.0 42.5
Law & Justice 40.7 Law & Justice (0.1) 40.6
Miscellaneous 149.7 Miscellaneous (1,110.5) (960.8)

38.
Provinces 62.0 Provinces 0.0 62.0
Transport 23.0 Transport 0.0 23.0
Grand Total 1,309.8 Grand Total (1,309.8) 0.0
Source: IFMS
2.4 Variance Of 2016 Budget Outcome In 2016, there was a total underspending of K892.1 million (Goods and Services - K676.8 million, and Debt repayment - K215.3 million). However, this was reduced by K471.0 million overspending in PE budget. As a result, the total variance in 2016 was K421.2 million. Table 21: GoPNG Funded Expenditure by Category (Kina, Millions)
Expenditure by Cat & Type 2016 Budget 2016 Supp.
Budget Total Exp
Expense Variance
Personnel Emoluments 3,962.8 3,992.4 4,463.4 (471.0)
Provinces 1,511.3 1,511.3 1,745.0 (233.7)
Nat. Depts & Statutory Authorities 2,451.4 2,481.1 2,718.3 (237.3)
Goods & Services 6,702.3 5,744.6 5,067.8 676.8
Acquisition of Existing Assets 19.5 7.3 7.3 0.0
Capital Formation 1,264.9 850.4 675.3 175.2
Capital Transfers 883.4 841.9 779.1 62.9
Goods & Services 2,071.3 1,659.9 1,450.3 209.7
Grants Subsidies and Transfers 1,704.2 1,655.2 1,452.1 203.1
Utilities, Rentals and Property Costs 758.9 729.9 698.9 30.9
Write Offs and Depreciation 0.0 0.0 4.9 (4.9)
Debt Interest 1,479.6 1,479.6 1,264.3 215.3
Debt Interest 1,479.6 1,479.6 1,264.3 215.3
Grand Total 12,144.6 11,216.6 10,795.5 421.2
Source: IFMS
Pressure exerted from the PE budget keeps increasing every year and this is a real concern. Relative to the 2015 FBO, the PE overspending has increased by K319.4 million or 210.0 per cent (from K151.6 million to K471.0 million). To address this issue, all levels of Government are required to co-operate with the work undertaken by the Central Agencies through the Organisational Staffing and Personal Emolument Audit Committee (OSPEACs).
2.5 Detailed Expenditure In total there are 17 expenditure tables. To appreciate each of them, a brief summary is provided below for clarity purposes.
Table 22 to 32 shows the details of the expenditures incurred by the eleven (11) government funded Sectors. It mainly captures individual agencies Operational expenditure (PE and G&S) under each Sector as well as the Section 3 and 4 Transfers resulting from the 2016 Supplementary Budget reductions. Tables 33 and 34 summarises the transactions that occurred in 2016 under the Secretary’s Advance and Transfers.

39.
Attachment A-C shows the detailed Operational Expenditure (PE and G&S) for individual agencies that are classified under the three different types of government agencies.
Attachment D shows individual Provinces Operational expenditure (PE and G&S) using their Grants.

40.
Table 22: Administration Sector
Agency & Expenditure Category 2016 Initial
Appropriation Supplementary
Reductions Revised
Appropriation Section3 (SA) Section 4 (Net)
Total Expenditure
Variance
201 - National Parliament 147,488,350 -2,194,793 145,293,557 144,605,300 688,257
Supplementary Budget -2,194,793 -
Personnel Emoluments 105,512,750 105,512,750 105,512,650 100
Goods & Services 41,975,600 39,780,807 39,092,650 688,157
202 - Office of Governor-General
5,229,011 -157,013 5,501,998 -430,000 5,279,318 222,680
Transfers -430,000 -
Supplementary Budget -157,013 -
Personnel Emoluments 2,522,311 2,573,811 2,351,131 222,680
Goods & Services 2,706,700 2,928,187 2,928,186 1
203 - Department of Prime Minister & NEC
108,339,623 -36,526,098 146,113,525 1,200,000 -135,100,000 117,676,512 28,437,012
Transfers -135,100,000 -
Supplementary Budget -36,526,098 -
Secretary's Advance - 1,200,000 -
Personnel Emoluments 53,142,023 53,142,023 55,066,829 -1,924,806
Goods & Services 55,197,600 92,971,502 62,609,683 30,361,818
204 - National Statistical Office 10,401,908 -432,830 9,969,078 1,100,000 -1,100,000 11,710,089 -1,741,011
Transfers -1,100,000 -
Supplementary Budget -432,830 -
Secretary's Advance - 1,100,000 -
Personnel Emoluments 4,899,408 4,899,408 6,794,141 -1,894,733
Goods & Services 5,502,500 5,069,670 4,915,948 153,722
205 - Office of Bougainville Affairs
3,388,028 -234,715 3,153,313 3,958,832 -805,519
Supplementary Budget -234,715 -
Personnel Emoluments 1,933,428 2,013,428 2,904,355 -890,927
Goods & Services 1,454,600 1,139,885 1,054,476 85,408
206 - Department of Finance 49,376,145 -5,136,730 53,636,316 250,000 -17,163,800 52,900,120 736,196
Transfers -17,163,800 -
Supplementary Budget -5,136,730 -
Secretary's Advance - 250,000 -
Personnel Emoluments 20,597,349 20,837,249 22,960,532 -2,123,283
Goods & Services 28,778,796 32,799,067 29,939,588 2,859,479
208 - Department of Treasury 150,375,303 -41,510,061 180,918,642 45,949,900 11,230,900 138,527,516 42,391,126
Transfers 11,230,900 -
Supplementary Budget -41,510,061 -
Secretary's Advance - 45,949,900 -
Personnel Emoluments 20,954,903 20,732,903 13,900,350 6,832,553
Goods & Services 129,420,400 160,185,739 124,627,165 35,558,573
209 - Registrar For Political Parties
7,753,832 -388,528 7,365,304 7,648,541 -283,237

41.
Agency & Expenditure Category 2016 Initial
Appropriation Supplementary
Reductions Revised
Appropriation Section3 (SA) Section 4 (Net)
Total Expenditure
Variance
Supplementary Budget -388,528 -
Personnel Emoluments 5,084,532 4,599,232 4,904,738 -305,506
Goods & Services 2,669,300 2,766,072 2,743,803 22,269
211 - PNG Customs Service 59,631,721 -7,187,729 52,443,992 36,890,236 15,553,756
Supplementary Budget -7,187,729 -
Personnel Emoluments 29,023,521 29,635,521 30,597,141 -961,620
Goods & Services 30,608,200 22,808,471 6,293,095 16,515,376
212 - Information Technology Division
18,340,042 -1,548,894 16,756,148 2,993,800 15,827,107 929,041
Transfers 2,993,800 -
Supplementary Budget -1,548,894 -
Personnel Emoluments 5,888,617 5,853,617 2,851,817 3,001,800
Goods & Services 12,451,425 10,902,531 12,975,290 -2,072,759
213 - Fire Services 29,015,004 -12,561,250 16,453,754 20,758,398 -4,304,644
Supplementary Budget -12,561,250 -
Personnel Emoluments 11,398,104 11,698,104 17,108,395 -5,410,291
Goods & Services 17,616,900 4,755,650 3,650,003 1,105,647
215 - PNG Immigration and Citizenship Services
10,016,508 10,016,508 12,555,519 -2,539,011
Personnel Emoluments 10,016,508 10,016,508 12,555,519 -2,539,011
216 - Internal Revenue Commission
74,992,480 -2,940,841 72,051,640 65,475,446 6,576,194
Supplementary Budget -2,940,841 -
Personnel Emoluments 33,841,780 33,957,780 36,451,747 -2,493,967
Goods & Services 41,150,700 38,093,860 29,023,699 9,070,160
217 - Department of Foreign Affairs and Trade
59,931,794 -2,560,080 59,427,414 1,000,000 13,453,600 47,883,358 11,544,056
Transfers 13,453,600 -
Supplementary Budget -2,560,080 -
Secretary's Advance - 1,000,000 -
Personnel Emoluments 33,061,425 36,561,425 25,527,868 11,033,557
Goods & Services 26,870,369 22,865,989 22,355,490 510,499
219 - PNG Institute of Public Administration
10,162,631 -1,036,287 9,126,345 9,774,197 -647,853
Supplementary Budget -1,036,287 -
Personnel Emoluments 5,242,831 5,242,831 5,959,095 -716,264
Goods & Services 4,919,800 3,883,514 3,815,102 68,412
220 - Department of Personnel Management
22,077,797 -1,273,830 21,734,282 1,860,629 19,170,685 2,563,597
Transfers 1,860,629 -
Supplementary Budget -1,273,830 -
Personnel Emoluments 16,349,297 15,582,612 13,110,156 2,472,456
Goods & Services 5,728,500 6,151,670 6,060,529 91,141

42.
Agency & Expenditure Category 2016 Initial
Appropriation Supplementary
Reductions Revised
Appropriation Section3 (SA) Section 4 (Net)
Total Expenditure
Variance
221 - Public Service Commission
6,435,483 -285,066 6,150,417 80,000 80,000 5,881,243 269,174
Transfers 80,000 -
Supplementary Budget -285,066 -
Secretary's Advance - 80,000 -
Personnel Emoluments 5,261,083 5,161,083 4,895,006 266,077
Goods & Services 1,174,400 989,334 986,237 3,097
227 - Provincial Treasuries 45,153,661 -3,113,093 42,040,568 46,436,789 -4,396,221
Supplementary Budget -3,113,093 -
Personnel Emoluments 35,689,679 35,689,679 41,233,790 -5,544,111
Goods & Services 9,463,982 6,350,889 5,202,999 1,147,890
229 - Department of National Planning and Monitoring
102,085,979 -17,568,771 84,517,208 -1,200,000 84,252,346 264,862
Transfers -1,200,000 -
Supplementary Budget -17,568,771 -
Personnel Emoluments 11,084,167 11,084,167 11,519,904 -435,737
Goods & Services 91,001,812 73,433,041 72,732,442 700,599
230 - Electoral Commission 21,741,378 -5,076,805 47,164,573 20,500,000 28,000,000 48,538,290 -1,373,717
Transfers 28,000,000 -
Supplementary Budget -5,076,805 -
Secretary's Advance - 20,500,000 -
Personnel Emoluments 6,712,279 7,364,498 6,277,625 1,086,873
Goods & Services 15,029,099 39,800,075 42,260,665 -2,460,590
232 - Provincial and Local Government Affairs
18,226,881 -3,099,605 29,127,276 28,360,000 28,921,114 206,162
Transfers 28,360,000 -
Supplementary Budget -3,099,605 -
Personnel Emoluments 9,690,184 23,220,184 23,161,093 59,091
Goods & Services 8,536,697 5,907,092 5,760,021 147,071
262 - Department of Industrial Relations
33,431,144 -5,210,071 28,457,074 1,144,600 29,294,306 -837,233
Supplementary Budget -5,210,071 -
Secretary's Advance 1,144,600 -
Personnel Emoluments 14,308,898 14,308,898 14,892,453 -583,555
Goods & Services 19,122,246 14,148,176 14,401,853 -253,678
263 - National Tripartite Consultative Council
862,859 -59,439 803,420 630,338 173,082
Supplementary Budget -59,439 -
Personnel Emoluments 519,953 519,953 359,972 159,981
Goods & Services 342,906 283,467 270,366 13,101
267 - Department of Implementation and Rural Development
65,629,697 -669,522 66,460,175 3,000,000 64,826,054 1,634,121
Transfers 3,000,000 -
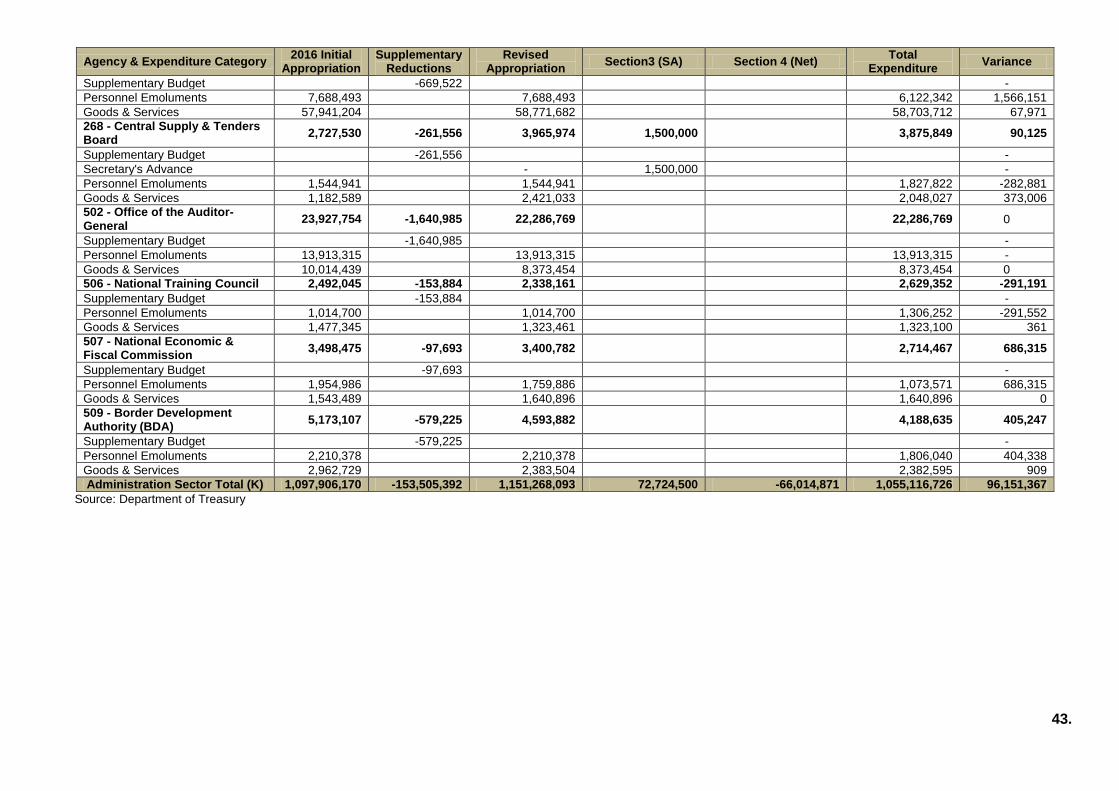
43.
Agency & Expenditure Category 2016 Initial
Appropriation Supplementary
Reductions Revised
Appropriation Section3 (SA) Section 4 (Net)
Total Expenditure
Variance
Supplementary Budget -669,522 -
Personnel Emoluments 7,688,493 7,688,493 6,122,342 1,566,151
Goods & Services 57,941,204 58,771,682 58,703,712 67,971
268 - Central Supply & Tenders Board
2,727,530 -261,556 3,965,974 1,500,000 3,875,849 90,125
Supplementary Budget -261,556 -
Secretary's Advance - 1,500,000 -
Personnel Emoluments 1,544,941 1,544,941 1,827,822 -282,881
Goods & Services 1,182,589 2,421,033 2,048,027 373,006
502 - Office of the Auditor-General
23,927,754 -1,640,985 22,286,769 22,286,769 0
Supplementary Budget -1,640,985 -
Personnel Emoluments 13,913,315 13,913,315 13,913,315 -
Goods & Services 10,014,439 8,373,454 8,373,454 0
506 - National Training Council 2,492,045 -153,884 2,338,161 2,629,352 -291,191
Supplementary Budget -153,884 -
Personnel Emoluments 1,014,700 1,014,700 1,306,252 -291,552
Goods & Services 1,477,345 1,323,461 1,323,100 361
507 - National Economic & Fiscal Commission
3,498,475 -97,693 3,400,782 2,714,467 686,315
Supplementary Budget -97,693 -
Personnel Emoluments 1,954,986 1,759,886 1,073,571 686,315
Goods & Services 1,543,489 1,640,896 1,640,896 0
509 - Border Development Authority (BDA)
5,173,107 -579,225 4,593,882 4,188,635 405,247
Supplementary Budget -579,225 -
Personnel Emoluments 2,210,378 2,210,378 1,806,040 404,338
Goods & Services 2,962,729 2,383,504 2,382,595 909
Administration Sector Total (K) 1,097,906,170 -153,505,392 1,151,268,093 72,724,500 -66,014,871 1,055,116,726 96,151,367
Source: Department of Treasury

44.
Table 23: Community & Culture Sector
Agency & Expenditure Category 2016 Initial
Appropriation Supplementary
Reductions Revised
Appropriation Section3
(SA) Section 4
(Net) Total
Expenditure Variance
233 - Office of Censorship 3,675,840 (261,813) 3,414,027 3,065,945 348,082
Supplementary Budget (261,813) -
Personnel Emoluments 2,675,840 2,675,840 2,338,226 337,614
Goods & Services 1,000,000 738,187 727,719 10,468
237 - PNG National Commission for UNESCO 3,062,017 (218,970) 2,521,474 321,574 860,200 1,661,273
Transfers 321,574 -
Supplementary Budget (218,970) -
Personnel Emoluments 2,194,355 2,116,355 860,200 1,256,155
Goods & Services 867,662 405,119 - 405,119
242 - Department of Community Development 13,928,930 (470,397) 16,058,533 500,000 4,200,000 14,506,475 1,552,058
Transfers 4,200,000 -
Supplementary Budget (470,397) -
Secretary's Advance - 500,000 -
Personnel Emoluments 9,958,030 8,638,030 7,102,842 1,535,188
Goods & Services 3,970,900 7,420,503 7,403,633 16,870
243 - National Volunteer Services 1,882,502 (3,437) 2,039,065 160,000 1,680,661 358,404
Supplementary Budget (3,437) -
Secretary's Advance - 160,000 -
Personnel Emoluments 1,584,878 1,584,878 1,306,474 278,404
Goods & Services 297,624 454,187 374,187 80,000
246 - Office of Urbanization 1,753,723 (55,582) 1,698,141 2,360,837 (662,696)
Supplementary Budget (55,582) -
Personnel Emoluments 1,501,704 1,501,704 2,168,491 (666,787)
Goods & Services 252,019 196,437 192,345 4,092
516 - Papua New Guinea Sports Foundation 50,511,550 (8,792,814) 41,718,736 39,355,226 2,363,509
Supplementary Budget (8,792,814) -
Personnel Emoluments 6,813,461 6,813,461 4,449,951 2,363,510
Goods & Services 43,698,089 34,905,275 34,905,275 (0)
521 - National Youth Commission 4,137,142 (251,612) 3,885,530 3,924,028 (38,498)
Supplementary Budget (251,612) -
Personnel Emoluments 1,818,242 1,818,242 1,856,740 (38,498)
Goods & Services 2,318,900 2,067,288 2,067,288 0

45.
Table 23: Community & Culture Sector
Agency & Expenditure Category 2016 Initial
Appropriation Supplementary
Reductions Revised
Appropriation Section3
(SA) Section 4
(Net) Total
Expenditure Variance
539 - National Museum and Art Gallery 11,773,964 (191,985) 11,581,979 4,543,655 7,038,325
Supplementary Budget (191,985) -
Personnel Emoluments 3,512,400 3,512,400 2,714,416 797,984
Goods & Services 8,261,564 8,069,579 1,829,239 6,240,341
542 - National Cultural Commission 4,669,020 (76,251) 5,592,769 1,000,000 5,329,394 263,375
Supplementary Budget (76,251) -
Secretary's Advance - 1,000,000 -
Personnel Emoluments 3,183,070 3,183,070 2,919,695 263,375
Goods & Services 1,485,950 2,409,699 2,409,699 1
Community & Culture Sector Total (K) 95,394,688 (10,322,860) 88,510,254 1,660,000 4,521,574 75,626,422 12,883,833
Source: Department of Treasury
Table 24 Debt Interest
Agency & Expenditure Category 2016 Initial
Appropriation Supplementary
Reductions Revised
Appropriation Section3
(SA) Section 4
(Net) Total
Expenditure Variance
299 - Treasury and Finance - Public Debt Charges
1,479,565,158 1,479,565,158 1,264,280,813.74 215,284,344
Debt Interest 1,479,565,158 1,479,565,158 1,264,280,813.74 215,284,344
Debt Interest Total (K) 1,479,565,158 1,479,565,158 1,264,280,813.74 215,284,344

46.
Table 25: Economic Sector
Agency & Expenditure Category 2016 Initial
Appropriation Supplementary
Reductions Revised
Appropriation Section3
(SA) Section 4
(Net) Total
Expenditure Variance
245 - Conservation and Environment Protection Authority
16,532,507 ( 1,011,492) 15,521,015 15,188,469 332,546
Supplementary Budget ( 1,011,492) -
Personnel Emoluments 6,626,748 6,626,748 7,175,062 ( 548,314)
Goods & Services 9,905,759 8,894,267 8,013,406 880,861
247 - Department of Agriculture and Livestock 17,815,575 ( 599,905) 18,215,671 1,000,000 14,128,445 4,087,225
Transfers 1,000,000 -
Supplementary Budget ( 599,905) -
Personnel Emoluments 12,889,643 12,889,643 9,630,462 3,259,181
Goods & Services 4,925,932 5,326,028 4,497,983 828,044
252 - Department of Lands and Physical Planning
39,596,665 ( 9,292,588) 30,304,077 29,577,839 726,237
Supplementary Budget ( 9,292,588) -
Personnel Emoluments 16,618,962 16,618,962 16,087,893 531,069
Goods & Services 22,977,703 13,685,115 13,489,946 195,169
254 - Department of Mineral Policy and Geohazards Management
11,695,800 ( 3,491,027) 10,204,773 2,000,000 9,961,383 243,390
Supplementary Budget ( 3,491,027) -
Secretary's Advance - 2,000,000 -
Personnel Emoluments 5,522,668 5,522,668 5,317,304 205,364
Goods & Services 6,173,132 4,682,105 4,644,079 38,027
255 - Department of Petroleum and Energy 47,537,026 ( 17,420,116) 38,476,910 8,360,000 30,494,286 7,982,625
Transfers 8,360,000 -
Supplementary Budget ( 17,420,116) -
Personnel Emoluments 11,426,447 11,026,447 9,717,133 1,309,314
Goods & Services 36,110,579 27,450,463 20,777,153 6,673,311
261 - Department of Commerce and Industry 26,143,883 ( 4,327,493) 21,816,390 17,904,720 3,911,670
Supplementary Budget ( 4,327,493) -
Personnel Emoluments 9,201,650 9,201,650 6,840,463 2,361,187
Goods & Services 16,942,233 12,614,740 11,064,257 1,550,483
269 - Office of Tourism Arts and Culture 51,843,913 ( 45,088,603) 6,755,311 6,479,836 275,475
Supplementary Budget ( 45,088,603) -
Personnel Emoluments 889,225 889,225 717,464 171,761

47.
Table 25: Economic Sector
Agency & Expenditure Category 2016 Initial
Appropriation Supplementary
Reductions Revised
Appropriation Section3
(SA) Section 4
(Net) Total
Expenditure Variance
Goods & Services 50,954,688 5,866,086 5,762,372 103,714
501 - Konebada Petroleum Park Authority 6,447,100 ( 54,576) 6,392,525 6,392,524 1
Supplementary Budget ( 54,576) -
Personnel Emoluments 3,800,000 3,800,000 3,800,000 -
Goods & Services 2,647,100 2,592,525 2,592,524 1
511 - Papua New Guinea Climate Change Authority
9,532,618 ( 993,109) 8,539,509 9,523,231 ( 983,722)
Supplementary Budget ( 993,109) -
Personnel Emoluments 3,036,433 3,036,433 4,020,156 ( 983,723)
Goods & Services 6,496,185 5,503,076 5,503,075 1
530 - Investment Promotion Authority 2,969,471 2,969,471 2,969,471 -
Personnel Emoluments 1,627,958 1,627,958 1,627,958 -
Goods & Services 1,341,513 1,341,513 1,341,513 -
531 - Small Business Development Corporation 4,632,404 ( 11,606) 4,620,798 4,620,798 -
Supplementary Budget ( 11,606) -
Personnel Emoluments 3,026,166 3,026,166 3,026,166 -
Goods & Services 1,606,238 1,594,632 1,594,632 -
532 - National Institute of Standards & Industrial Technology
3,466,677 ( 172,936) 3,293,741 3,526,276 ( 232,536)
Supplementary Budget ( 172,936) -
Personnel Emoluments 2,073,600 2,073,600 2,306,135 ( 232,535)
Goods & Services 1,393,077 1,220,141 1,220,141 ( 0)
533 - Industrial Centers Development Corporation
2,572,994 2,572,994 2,572,994 -
Personnel Emoluments 2,349,987 2,349,987 2,349,987 -
Goods & Services 223,007 223,007 223,007 -
535 - Mineral Resources Authority 22,750,000 ( 15,100,000) 8,050,000 400,000 5,650,000 2,400,000
Supplementary Budget ( 15,100,000) -
Secretary's Advance - 400,000 -
Goods & Services 22,750,000 8,050,000 5,650,000 2,400,000
536 - Kokonas Indastry Kopration 6,542,732 ( 59,463) 6,983,269 500,000 6,983,269 0
Transfers 500,000 -
Supplementary Budget ( 59,463) -
Personnel Emoluments 358,708 358,708 358,708 -
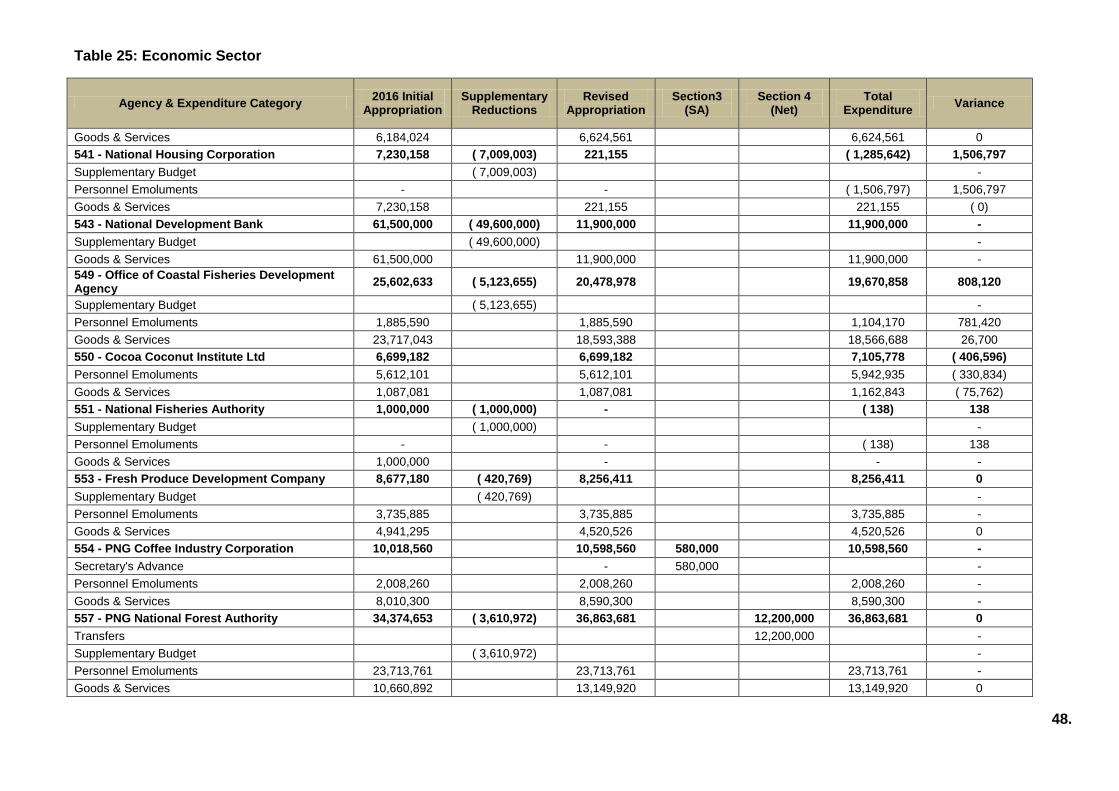
48.
Table 25: Economic Sector
Agency & Expenditure Category 2016 Initial
Appropriation Supplementary
Reductions Revised
Appropriation Section3
(SA) Section 4
(Net) Total
Expenditure Variance
Goods & Services 6,184,024 6,624,561 6,624,561 0
541 - National Housing Corporation 7,230,158 ( 7,009,003) 221,155 ( 1,285,642) 1,506,797
Supplementary Budget ( 7,009,003) -
Personnel Emoluments - - ( 1,506,797) 1,506,797
Goods & Services 7,230,158 221,155 221,155 ( 0)
543 - National Development Bank 61,500,000 ( 49,600,000) 11,900,000 11,900,000 -
Supplementary Budget ( 49,600,000) -
Goods & Services 61,500,000 11,900,000 11,900,000 -
549 - Office of Coastal Fisheries Development Agency
25,602,633 ( 5,123,655) 20,478,978 19,670,858 808,120
Supplementary Budget ( 5,123,655) -
Personnel Emoluments 1,885,590 1,885,590 1,104,170 781,420
Goods & Services 23,717,043 18,593,388 18,566,688 26,700
550 - Cocoa Coconut Institute Ltd 6,699,182 6,699,182 7,105,778 ( 406,596)
Personnel Emoluments 5,612,101 5,612,101 5,942,935 ( 330,834)
Goods & Services 1,087,081 1,087,081 1,162,843 ( 75,762)
551 - National Fisheries Authority 1,000,000 ( 1,000,000) - ( 138) 138
Supplementary Budget ( 1,000,000) -
Personnel Emoluments - - ( 138) 138
Goods & Services 1,000,000 - - -
553 - Fresh Produce Development Company 8,677,180 ( 420,769) 8,256,411 8,256,411 0
Supplementary Budget ( 420,769) -
Personnel Emoluments 3,735,885 3,735,885 3,735,885 -
Goods & Services 4,941,295 4,520,526 4,520,526 0
554 - PNG Coffee Industry Corporation 10,018,560 10,598,560 580,000 10,598,560 -
Secretary's Advance - 580,000 -
Personnel Emoluments 2,008,260 2,008,260 2,008,260 -
Goods & Services 8,010,300 8,590,300 8,590,300 -
557 - PNG National Forest Authority 34,374,653 ( 3,610,972) 36,863,681 12,200,000 36,863,681 0
Transfers 12,200,000 -
Supplementary Budget ( 3,610,972) -
Personnel Emoluments 23,713,761 23,713,761 23,713,761 -
Goods & Services 10,660,892 13,149,920 13,149,920 0

49.
Table 25: Economic Sector
Agency & Expenditure Category 2016 Initial
Appropriation Supplementary
Reductions Revised
Appropriation Section3
(SA) Section 4
(Net) Total
Expenditure Variance
558 - Tourism Promotion Authority 9,841,089 ( 31,307) 10,809,782 1,000,000 10,308,008 501,774
Supplementary Budget ( 31,307) -
Secretary's Advance - 1,000,000 -
Personnel Emoluments 2,132,589 2,132,589 2,132,589 -
Goods & Services 7,708,500 8,677,193 8,175,419 501,774
562 - National Agriculture Research Institute 13,498,610 ( 213,986) 13,284,624 13,284,624 0
Supplementary Budget ( 213,986) -
Personnel Emoluments 9,444,511 9,444,511 9,444,511 -
Goods & Services 4,054,099 3,840,113 3,840,113 0
563 - National Agriculture Quarantine & Inspection Authority
10,413,662 ( 1,500,000) 8,913,662 15,493,881 ( 6,580,219)
Supplementary Budget ( 1,500,000) -
Personnel Emoluments 8,413,662 8,413,662 14,993,881 ( 6,580,219)
Goods & Services 2,000,000 500,000 500,000 -
566 - Cocoa Board 16,847,866 ( 51,573) 16,796,293 16,796,293 ( 0)
Supplementary Budget ( 51,573) -
Personnel Emoluments 3,929,866 3,929,866 3,929,866 -
Goods & Services 12,918,000 12,866,427 12,866,427 ( 0)
569 - Independent Consumer and Competition Commission
9,772,191 ( 184,966) 9,587,225 9,587,225 0
Supplementary Budget ( 184,966) -
Personnel Emoluments 6,493,073 6,493,073 6,493,073 -
Goods & Services 3,279,118 3,094,152 3,094,152 0
Economic Sector Total (K) 485,555,149 ( 166,369,144) 339,126,006 3,980,000 22,060,000 324,553,080 14,572,926
Source: Department of Treasury

50.
Table 26: Education Sector
Agency & Expenditure Category 2016 Initial
Appropriation Supplementary
Reductions Revised
Appropriation Section3
(SA) Section 4
(Net) Total
Expenditure Variance
235 - Department of Education 852,555,017 -10,607,599 316,268,992 826,678,426 246,599,432 69,669,560
Transfers 826,678,426 -
Supplementary Budget -10,607,599 -
Personnel Emoluments 145,072,305 144,789,305 152,296,555 -7,507,250
Goods & Services 707,482,712 171,479,687 94,302,876 77,176,810
236 - Department of Higher Education Research Science & Technology
137,248,390 -26,396,472 116,351,918 5,500,000 121,554,779 -5,202,861
Transfers 5,500,000 -
Supplementary Budget -26,396,472 -
Personnel Emoluments 6,127,235 6,127,235 4,194,296 1,932,939
Goods & Services 131,121,155 110,224,683 117,360,482 -7,135,799
251 - PNG Science & Technology Secretariat
4,220,146 -221,483 3,998,663 3,075,821 922,842
Supplementary Budget -221,483 -
Personnel Emoluments 2,458,146 2,458,146 1,728,021 730125
Goods & Services 1,762,000 1,540,517 1,347,800 192,717
505 - National Research Institute 7,160,541 -34,490 7,126,051 7,126,051 -
Supplementary Budget -34,490 -
Personnel Emoluments 3,596,211 3,596,211 3,596,211 -
Goods & Services 3,564,330 3,529,840 3,529,840 -
512 - University of Papua New Guinea 77,469,169 -15,000,000 62,469,169 60,969,168 1,500,001
Supplementary Budget -15,000,000 -
Personnel Emoluments 44,960,314 44,960,314 44,960,313 1
Goods & Services 32,508,855 17,508,855 16,008,855 1,500,000
513 - University of Technology 65,247,257 -3,170,996 62,076,261 62,076,261 -
Supplementary Budget -3,170,996 -
Personnel Emoluments 35,392,114 35,392,114 35,392,114 -
Goods & Services 29,855,143 26,684,147 26,684,147 -
514 - University of Goroka 34,399,327 -12,082,867 22,316,460 22,316,460 0
Supplementary Budget -12,082,867 -
Personnel Emoluments 17,709,286 17,709,286 17,709,286 -

51.
Goods & Services 16,690,041 4,607,174 4,607,174 0
515 - University of Environment & Natural Resources
28,565,756 -1,761,966 26,803,790 26,803,790 0
Supplementary Budget -1,761,966 -
Personnel Emoluments 17,010,083 17,010,083 17,010,083 -
Goods & Services 11,555,673 9,793,707 9,793,707 0
518 - PNG Maritime College 4,803,502 4,803,502 4,803,502 -
Personnel Emoluments 4,440,502 4,440,502 4,440,502 -
Goods & Services 363,000 363,000 363,000 -
Education Sector Total (K) 1,211,669,105 -69,275,873 622,214,806 832,178,426 555,325,264 66,889,542
Source: Department of Treasury

52.
Table 27: Health Sector
Agency & Expenditure Category 2016 Initial Appropriation
Supplementary Reductions
Revised Appropriation
Section3 (SA)
Section 4 (Net)
Total Expenditure
Variance
238 - Milne Bay Provincial Health Authority 29,820,252 (476,113) 30,811,939 24,714,768 6,097,170
Supplementary Budget (476,113) -
Personnel Emoluments 23,775,440 24,581,240 18,724,616 5,856,624
Goods & Services 6,044,812 6,230,699 5,990,152 240,547
239 - Western Highlands Provincial Health Authority 32,735,052 (75,329) 34,361,023 34,745,256 (384,233)
Supplementary Budget (75,329) -
Personnel Emoluments 25,974,366 26,997,666 27,382,651 (384,985)
Goods & Services 6,760,686 7,363,357 7,362,605 752
240 - Department of Health 320,651,064 (4,626,148) 337,188,516 5,000,000 312,320,826 24,867,690
Transfers 5,000,000 -
Supplementary Budget (4,626,148) -
Personnel Emoluments 78,456,060 79,119,660 98,519,546 (19,399,886)
Goods & Services 242,195,004 258,068,856 213,801,281 44,267,575
241 - Hospital Management Services 677,538,040 (21,294,008) 622,899,070 37,490,524 571,944,461 50,954,609
Transfers 37,490,524 -
Supplementary Budget (21,294,008) -
Personnel Emoluments 275,321,280 308,839,184 407,628,084 (98,788,900)
Goods & Services 402,216,760 314,059,886 164,316,376
149,743,509
244 - Eastern Highlands Provincial Health Auhtority 34,991,681 (208,416) 36,325,365 15,068,975 21,256,390
Supplementary Budget (208,416) -
Personnel Emoluments 28,675,281 29,755,381 8,591,388 21,163,993
Goods & Services 6,316,400 6,569,984 6,477,587 92,397
253 - West New Britain Provincial Health Authority 36,159,272 (130,352) 37,060,620 23,333,246 13,727,374
Supplementary Budget (130,352) -
Personnel Emoluments 28,767,112 29,285,812 15,564,517 13,721,295
Goods & Services 7,392,160 7,774,808 7,768,729 6,079
256 - Manus Provincial Health Authoriy 17,730,297 (202,447) 17,769,750 15,291,283 2,478,467
Supplementary Budget (202,447) -
Personnel Emoluments 11,923,451 12,090,451 9,612,689 2,477,762
Goods & Services 5,806,846 5,679,299 5,678,594 705
260 - Enga Provincial Health Authority 29,659,749 (382,794) 30,527,156 31,997,015 (1,469,860)
Supplementary Budget (382,794) -

53.
Table 27: Health Sector
Agency & Expenditure Category 2016 Initial Appropriation
Supplementary Reductions
Revised Appropriation
Section3 (SA)
Section 4 (Net)
Total Expenditure
Variance
Personnel Emoluments 23,438,681 24,086,881 25,562,688 (1,475,807)
Goods & Services 6,221,068 6,440,275 6,434,327 5,948
266 - Sandaun Provincial Health Authority 26,953,372 (257,975) 27,553,598 13,693,057 13,860,541
Supplementary Budget (257,975) -
Personnel Emoluments 19,865,952 20,304,152 6,462,998 13,841,154
Goods & Services 7,087,420 7,249,446 7,230,059 19,387
519 - National Aids Council Secretariat 8,926,734 (40,019) 8,886,715 8,885,635 1,080
Supplementary Budget (40,019) -
Personnel Emoluments 7,362,403 7,362,403 7,362,403 -
Goods & Services 1,564,331 1,524,312 1,523,232 1,080
520 - Institute of Medical Research 12,355,782 (29,691) 12,326,091 12,326,091 (0)
Supplementary Budget (29,691) -
Personnel Emoluments 9,708,178 9,708,178 9,708,178 -
Goods & Services 2,647,604 2,617,913 2,617,913 (0)
Health Sector Total (K) 1,227,521,295 (27,723,293) 1,195,709,840 42,490,524 1,064,320,613 131,389,227
Source: Department of Treasury

54.
Table 28: Law & Justice Sector
Agency & Expenditure Category 2016 Initial Appropriation
Supplementary Reductions
Revised Appropriation
Section3 (SA)
Section 4 (Net)
Total Expenditure
Variance
218 - Office of the Public Prosecutor 7,393,762 (50,269) 7,923,493 300,000 120,000 9,016,401 (1,092,908)
Transfers 120,000 -
Supplementary Budget (50,269) -
Secretary's Advance - 300,000 -
Personnel Emoluments 5,343,962 5,343,962 6,432,264 (1,088,302)
Goods & Services 2,049,800 2,579,531 2,584,138 (4,607)
222 - Office of the Public Solicitor 12,559,548 (253,100) 12,306,448 12,173,708 132,740
Supplementary Budget (253,100) -
Personnel Emoluments 8,821,948 8,821,948 8,690,605 131,343
Goods & Services 3,737,600 3,484,500 3,483,103 1,397
223 - Judiciary Services 227,328,200 237,328,200 10,000,000 232,301,553 5,026,648
Secretary's Advance - 10,000,000 -
Personnel Emoluments 69,003,800 69,003,800 63,977,153 5,026,648
Goods & Services 158,324,400 168,324,400 168,324,400 -
224 - Magisterial Services 38,317,365 (337,062) 37,980,303 32,776,452 5,203,851
Supplementary Budget (337,062) -
Personnel Emoluments 31,637,965 31,637,965 26,434,114 5,203,851
Goods & Services 6,679,400 6,342,338 6,342,338 0
225 - Department of Attorney-General 105,500,000 (1,375,415) 113,924,585 9,800,000 129,261,428 (15,336,843)
Transfers 9,800,000 -
Supplementary Budget (1,375,415) -
Personnel Emoluments 73,725,641 73,725,641 90,783,261 (17,057,620)
Goods & Services 31,774,359 40,198,944 38,478,166 1,720,778
226 - Department of Corrective Institutional Services 139,699,381 (1,274,343) 138,425,039 138,051,225 373,814
Supplementary Budget (1,274,343) -
Personnel Emoluments 87,188,381 81,938,381 82,067,494 (129,113)
Goods & Services 52,511,000 56,486,658 55,983,731 502,927
228 - Department of Police 361,294,687 (3,228,511) 388,416,176 1,500,000
28,850,000 444,736,937 (56,320,762)
Transfers
28,850,000 -
Supplementary Budget (3,228,511) -
Secretary's Advance - 1,500,000 -

55.
Table 28: Law & Justice Sector
Agency & Expenditure Category 2016 Initial Appropriation
Supplementary Reductions
Revised Appropriation
Section3 (SA)
Section 4 (Net)
Total Expenditure
Variance
Personnel Emoluments 196,518,462 196,518,462 259,285,692 (62,767,230)
Goods & Services 164,776,225 191,897,714 185,451,245 6,446,469
231 - National Intelligence Organisation 4,669,962 (20,160) 4,649,802 4,900,774 (250,972)
Supplementary Budget (20,160) -
Personnel Emoluments 2,602,262 2,519,262 2,878,785 (359,523)
Goods & Services 2,067,700 2,130,540 2,021,989 108,551
234 - Department of Defence 256,474,765 (15,071,605) 239,676,860 1,800,000 249,072,688 (9,395,827)
Transfers 1,800,000 -
Supplementary Budget (15,071,605) -
Personnel Emoluments 115,102,765 115,176,465 154,706,537 (39,530,072)
Goods & Services 141,372,000 124,500,395 94,366,150 30,134,245
503 - Ombudsman Commission 20,350,185 (1,192,391) 19,157,794 18,600,995 556,799
Supplementary Budget (1,192,391) -
Personnel Emoluments 12,087,321 12,087,321 12,087,321 -
Goods & Services 8,262,864 7,070,473 6,513,674 556,799
510 - Legal Training Institute 4,865,372 (28,743) 4,836,629 4,632,343 204,286
Supplementary Budget (28,743) -
Personnel Emoluments 1,657,096 1,657,096 1,452,810 204,286
Goods & Services 3,208,276 3,179,533 3,179,533 (0)
517 - National Narcotics Bureau 4,376,599 (143,446) 4,233,153 4,752,709 (519,557)
Supplementary Budget (143,446) -
Personnel Emoluments 2,319,774 2,319,774 4,752,709 (2,432,935)
Goods & Services 2,056,825 1,913,379 - 1,913,379
522 - Constitutional and Law Reform Commission 4,094,390 (40,583) 4,053,807 2,451,970 1,601,837
Supplementary Budget (40,583) -
Personnel Emoluments 2,319,516 2,319,516 717,679 1,601,837
Goods & Services 1,774,874 1,734,291 1,734,291 (0)
Law & Justice Sector Total (K) 1,186,924,216 (23,015,628) 1,212,912,288 11,800,000 40,570,000 1,282,729,182 (69,816,894)
Source: Department of Treasury

56.
Table 29: Miscellaneous Expense
Agency & Expenditure Category 2016 Initial Appropriation
Supplementary Reductions
Revised Appropriation
Section3 (SA)
Section 4 (Net)
Total Expenditure
Expense Variance
207 - Treasury and Finance - Miscellaneous 1,051,550,900 -142,259,686 1,131,803,162 8,635,500 -960,805,653 1,047,455,584 84,347,578
Transfers -960,805,653 -
Supplementary Budget -142,259,686 -
Secretary's Advance - 8,635,500 -
Personnel Emoluments 266,700,900 251,238,396 305,453,397 -54,215,001
Goods & Services 784,850,000 880,564,766 742,002,187 138,562,578
Miscellaneous Expense Total (K) 1,051,550,900 -142,259,686 1,131,803,162 8,635,500 960,805,653 1,047,455,584 84,347,578 Source: Department of Treasury
Table 30:Provincial Sector
Agency & Expenditure Category 2016 Initial
Appropriation Supplementary
Reductions Revised
Appropriation Section3
(SA) Section 4
(Net) Total
Expenditure Variance
571 - Fly River Provincial Administration 113,973,400
(2,500,000) 111,984,000
126,012,747
(14,028,747)
Supplementary Budget (2,500,000) -
Personnel Emoluments 51,873,500 51,873,500 65,902,247 (14,028,747)
Goods & Services 62,099,900 60,110,500 60,110,500 -
572 - Gulf Provincial Administration 95,116,200 (300,000) 95,155,400 88,103,509 7,051,891
Supplementary Budget (300,000) -
Personnel Emoluments 33,916,600 33,916,600 31,607,809 2,308,791
Goods & Services 61,199,600 61,238,800 56,495,700 4,743,100
573 - Central Provincial Administration 145,215,600
(350,000) 145,381,800
166,116,792
(20,734,992)
Supplementary Budget (350,000) -
Personnel Emoluments 60,888,700 60,888,700 81,859,892 (20,971,192)
Goods & Services 84,326,900 84,493,100 84,256,900 236,200
574 - National Capital District 66,425,000 66,666,600 66,621,452 45,148
Personnel Emoluments - - (12,148) 12,148
Goods & Services 66,425,000 66,666,600 66,633,600 33,000
575 - Milne Bay Provincial Administration 153,421,300
153,421,300
155,116,189
(1,694,889)
Personnel Emoluments 66,788,600 66,788,600 71,418,589 (4,629,989)
Goods & Services 86,632,700 86,632,700 83,697,600 2,935,100
576 - Oro Provincial Administration 87,890,402 88,257,302 95,630,059 (7,372,757)
Personnel Emoluments 34,082,102 34,082,102 41,454,859 (7,372,757)
Goods & Services 53,808,300 54,175,200 54,175,200 -
577 - Southern Highlands Provincial Administration 174,105,484
(2,000,000) 172,685,884
20,000,000
206,476,631
(33,790,747)

57.
Table 30:Provincial Sector
Agency & Expenditure Category 2016 Initial
Appropriation Supplementary
Reductions Revised
Appropriation Section3
(SA) Section 4
(Net) Total
Expenditure Variance
Transfers 20,000,000
-
Supplementary Budget (2,000,000) -
Personnel Emoluments 89,041,270 89,041,270 128,392,517
(39,351,247)
Goods & Services 85,064,214 83,644,614 78,084,114 5,560,500
578 - Enga Provincial Administration 149,183,828
149,183,828
175,527,706
(26,343,878)
Personnel Emoluments 55,991,526 55,991,526 90,254,104 (34,262,578)
Goods & Services 93,192,302 93,192,302 85,273,602 7,918,700
579 - Western Highlands Provincial Administration 169,662,590
(3,000,000) 166,662,590
180,421,234
(13,758,644)
Supplementary Budget (3,000,000) -
Personnel Emoluments 82,602,200 82,602,200 102,260,844
(19,658,644)
Goods & Services 87,060,390 84,060,390 78,160,390 5,900,000
580 - Simbu Provincial Administration 183,155,290
183,796,590
198,480,130
(14,683,540)
Personnel Emoluments 72,901,000 72,901,000 92,484,540 (19,583,540)
Goods & Services 110,254,290
110,895,590
105,995,590
4,900,000
581 - Eastern Highlands Provincial Administration 233,768,704
233,768,704
238,627,140
(4,858,436)
Personnel Emoluments 91,818,500 91,818,500 106,576,936
(14,758,436)
Goods & Services 141,950,204
141,950,204
132,050,204
9,900,000
582 - Morobe Provincial Administration 298,451,300
299,345,700
295,381,606
3,964,094
Personnel Emoluments 179,869,700
179,869,700
182,385,777
(2,516,077)
Goods & Services 118,581,600
119,476,000
112,995,829
6,480,171
583 - Madang Provincial Administration 228,278,600
228,937,600
235,116,593
(6,178,993)
Personnel Emoluments 108,053,500
108,053,500
122,132,493
(14,078,993)
Goods & Services 120,225,100
120,884,100
112,984,100
7,900,000
584 - East Sepik Provincial Administration 209,816,710
211,582,310
1,200,000 232,635,882
(21,053,572)
Secretary's Advance - 1,200,000 -

58.
Table 30:Provincial Sector
Agency & Expenditure Category 2016 Initial
Appropriation Supplementary
Reductions Revised
Appropriation Section3
(SA) Section 4
(Net) Total
Expenditure Variance
Personnel Emoluments 74,035,010 74,035,010 100,988,582
(26,953,572)
Goods & Services 135,781,700
137,547,300
131,647,300
5,900,000
585 - Sandaun Provincial Administration 175,730,200
(10,000,000) 166,730,200
2,000,000 148,795,416
17,934,784
Transfers 2,000,000 -
Supplementary Budget (10,000,000) -
Personnel Emoluments 69,100,200 69,100,200 59,776,716 9,323,484
Goods & Services 106,630,000
97,630,000 89,018,700 8,611,300
586 - Manus Provincial Administration 72,512,000 72,512,000 65,080,128 7,431,872
Personnel Emoluments 37,205,700 37,205,700 30,273,828 6,931,872
Goods & Services 35,306,300 35,306,300 34,806,300 500,000
587 - New Ireland Provincial Administration 115,754,500
(1,500,000) 114,693,700
98,282,306 16,411,394
Supplementary Budget (1,500,000) -
Personnel Emoluments 75,441,600 75,441,600 60,030,206 15,411,394
Goods & Services 40,312,900 39,252,100 38,252,100 1,000,000
588 - East New Britain Provincial Administration 167,317,100
168,041,100
183,138,767
(15,097,667)
Personnel Emoluments 89,124,600 89,124,600 104,222,267
(15,097,667)
Goods & Services 78,192,500 78,916,500 78,916,500 -
589 - West New Britain Provincial Administration 120,504,900
120,504,900
123,361,866
(2,856,966)
Personnel Emoluments 66,766,200 66,766,200 69,623,166 (2,856,966)
Goods & Services 53,738,700 53,738,700 53,738,700 -
590 - Autonomous Bougainville Administration 248,007,500
(42,000,000) 206,357,100
211,020,873
(4,663,773)
Supplementary Budget (42,000,000) -
Personnel Emoluments 106,239,800
106,239,800
113,903,573
(7,663,773)
Goods & Services 141,767,700
100,117,300
97,117,300 3,000,000
591 - Hela Provincial Administration 133,444,974
(28,500,000) 105,152,774
108,336,828
(3,184,054)
Supplementary Budget (28,500,000) -
Personnel Emoluments 31,775,263 31,775,263 44,359,317 (12,584,054)
Goods & Services 101,669,711
73,377,511 63,977,511 9,400,000

59.
Table 30:Provincial Sector
Agency & Expenditure Category 2016 Initial
Appropriation Supplementary
Reductions Revised
Appropriation Section3
(SA) Section 4
(Net) Total
Expenditure Variance
592 - Jiwaka Provincial Administration 100,719,013
100,988,413
40,000,000
117,998,617
(17,010,204)
Transfers 40,000,000
-
Personnel Emoluments 33,805,008 33,805,008 55,715,212 (21,910,204)
Goods & Services 66,914,005 67,183,405 62,283,405 4,900,000
Provincial Sector Total (K) 3,442,454,595 (90,150,000) 3,361,809,795 1,200,000 62,000,000 3,516,282,471 (154,472,676)
Source: Department of Treasury
Table 31:Transport Sector
Agency & Expenditure Category 2016 Initial
Appropriation Supplementary
Reductions Revised
Appropriation Section3
(SA) Section 4
(Net) Total
Expenditure Variance
259 - Department of Transport 24,704,857 (20,035,431) 21,669,426 21,009,677 659,750
Supplementary Budget (20,035,431) -
Personnel Emoluments 12,900,004 12,900,004 12,817,219 82,785
Goods & Services 11,804,853 8,769,422 8,192,458 576,964
264 - Department of Works and Implementation 701,898,081 (208,486,070) 493,412,011 477,045,262 16,366,748
Supplementary Budget (208,486,070) -
Personnel Emoluments 61,669,412 57,964,412 62,994,665 (5,030,253)
Goods & Services 640,228,669 435,447,599 414,050,597 21,397,001
523 - Papua New Guinea Accidents Investigation Commission
5,585,403 (80,745) 5,504,658 5,504,658 -
Supplementary Budget (80,745) -
Personnel Emoluments 5,122,076 5,122,076 5,122,076 -
Goods & Services 463,327 382,582 382,582 -
526 - National Maritime Safety Authority 4,302,911 (200,000) 4,102,911 3,996,271 106,640
Supplementary Budget (200,000) -
Personnel Emoluments 1,700,000 1,700,000 1,593,360 106,640
Goods & Services 2,602,911 2,402,911 2,402,911 -
537 - National Airports Corporation 20,000,000 (6,000,000) 14,000,000 14,000,000 -
Supplementary Budget (6,000,000) -
Goods & Services 20,000,000 14,000,000 14,000,000 -
538 - Papua New Guinea Air Services Limited - 10,000,000 20,000,000 10,000,000 -
Transfers 20,000,000 -
Goods & Services - 10,000,000 10,000,000 -

60.
Table 31:Transport Sector
Agency & Expenditure Category 2016 Initial
Appropriation Supplementary
Reductions Revised
Appropriation Section3
(SA) Section 4
(Net) Total
Expenditure Variance
545 - Rural Airstrip Authority 4,500,000 4,500,000 4,500,000 -
Goods & Services 4,500,000 4,500,000 4,500,000 -
565 - Civil Aviation Safety Authority 12,275,341 (111,243) 15,164,098 3,000,000 15,228,381 (64,283)
Transfers 3,000,000 -
Supplementary Budget (111,243) -
Personnel Emoluments 11,302,116 11,302,116 11,366,399 (64,283)
Goods & Services 973,225 3,861,982 3,861,982 0
567 - National Road Authority 9,500,000 (996,978) 8,503,023 6,872,373 1,630,650
Supplementary Budget (996,978) -
Personnel Emoluments 2,000,000 2,000,000 369,352 1,630,648
Goods & Services 7,500,000 6,503,023 6,503,021 2
Transport Sector Total (K) 782,766,593 (235,910,466) 576,856,127 D 23,000,000 558,156,622 18,699,505
Source: Department of Treasury

61.
Table 32:Utilities Sector
Agency & Expenditure Category 2016 Initial Appropriation
Supplementary Reductions
Revised Appropriation
Section3 (SA)
Section 4 (Net)
Total Expenditure Expense Variance
257 - Department of Public Enterprises 7,777,378 (1,052,450) 6,724,928 4,807,080 1,917,848
Supplementary Budget (1,052,450) -
Personnel Emoluments 2,712,778 2,712,778 1,955,810 756,968
Goods & Services 5,064,600 4,012,150 2,851,270 1,160,880
258 - Department of Information and Communication
7,274,803 (3,173,785) 4,101,018 3,799,831 301,187
Supplementary Budget (3,173,785) -
Personnel Emoluments 1,785,497 1,785,497 1,671,056 114,441
Goods & Services 5,489,306 2,315,521 2,128,775 186,746
524 - Independent Public Business Corporation
9,000,000 (4,150,000) 4,850,000 4,850,000 -
Supplementary Budget (4,150,000) -
Goods & Services 9,000,000 4,850,000 4,850,000 -
525 - National Broadcasting Commission 25,240,268 (76,425) 25,163,843 25,163,843 0
Supplementary Budget (76,425) -
Personnel Emoluments 16,061,300 16,061,300 16,061,300 -
Goods & Services 9,178,968 9,102,543 9,102,543 0
546 - PNG Power Limited 34,000,000 (1,015,000) 15,985,000 12,985,000 3,000,000
Supplementary Budget (1,015,000) -
Goods & Services 34,000,000 15,985,000 12,985,000 3,000,000
Utilities Sector Total 83,292,449 (9,467,660) 56,824,789 51,605,753 5,219,036
Grand Total 12,144,600,318 (928,000,001) 11,216,600,318 100,000,000 - 10,795,452,531
421,147,788
Source: Department of Treasury

62.
Table 33:Secretary's Advance (Section 3)
Date Agency Name Particulars/Description Section 3 Secretary's
Advance Balance Plus (+) Minus (-)
100,000,000
17/02/2016 Department of Treasury To settle bills for Javati/Twivey Lawyer 1,608,400 98,391,600
19/02/2016 Department of Treasury Transfer to offset K5m used under IDG Vote 5,000,000 93,391,600
7/03/2016 Treasury and Finance - Miscellaneous To cater for PNG EITI 3,700,000 89,691,600
11/03/2016 Central Supply & Tenders Board To cater for Office Refurbishment & Partition. 1,500,000 88,191,600
18/03/2016 Department of Community Development
O/s payments to an IT Firm for service 500,000 87,691,600
24/03/2016 Electoral Commission To cater for Samarai Mura By-Election. 2,500,000 85,191,600
24/03/2016 Department of Treasury To settle o/s legal bills 2,148,000 83,043,600
31/03/2016 Department of Treasury To cater for Minister's Commitment (Huon Gulf) 2,000,000 81,043,600
6/04/2016 East Sepik Provincial Administration To cater for 80th Birth-day Celebrations for M.T. Somare
1,200,000 79,843,600
6/04/2016 Department of Treasury To cater for Travel, Consultancy & Meetings 2,300,000 77,543,600
26/04/2016 Department of Treasury Reimbursement for Mt Hagen City Authority 5,000,000 72,543,600
27/04/2016 Electoral Commission Washington Embassy 18,000,000 54,543,600
6/05/2016 Judiciary Services Budget readjustments as per PM's direction 10,000,000 44,543,600
13/05/2016 Department of Treasury Middle Sepik High School 5,000,000 39,543,600
16/05/2016 National Cultural Commission Cater for Pacific festival of Arts in Guam 1,000,000 38,543,600
15/06/2016 Department of Treasury Grant payment to Petromin Holdings LTD 2,500,000 36,043,600
17/06/2016 Treasury and Finance - Miscellaneous To cater for HRM & Payroll Project for Government
2,935,500 33,108,100
24/06/2016 Department of Finance To cater for Finance Internal Audit Com 250,000 32,858,100
1/07/2016 Department of Treasury To pay for national power grid purpose 5,000,000 27,858,100
11/07/2016 Department of Treasury ICT bills to Treasury bills 3,600,000 24,258,100
26/07/2016 Department of Police Additional K1.5m for Police ethics 1,500,000 22,758,100
26/07/2016 Department of Foreign Affairs and Trade
To cater for Tokyo Office Rentals 1,000,000 21,758,100
26/07/2016 Department of Mineral Policy and Geohazards Management
To cater for Mining Projects Funding 2,000,000 19,758,100
29/07/2016 Department of Treasury K3m transfer to launch Hayfield Airport 3,000,000 16,758,100
18/08/2016 Treasury and Finance - Miscellaneous To cater for Special Parliament Committee 2,000,000 14,758,100
23/08/2016 Department of Prime Minister & NEC To cater for operational expenses 500,000 14,258,100

63.
Table 33:Secretary's Advance (Section 3)
Date Agency Name Particulars/Description Section 3 Secretary's
Advance Balance Plus (+) Minus (-)
6/09/2016 Office of the Public Prosecutor To cater for court circuits 300,000 13,958,100
7/09/2016 Department of Industrial Relations Transfer to balance activities 1,144,600 12,813,500
8/09/2016 Department of Treasury Suain Primary School 1,000,000 11,813,500
12/09/2016 Department of Treasury To cater for Minister's commitments. 3,500,000 8,313,500
13/09/2016 Department of Treasury To cater for Hayfield Airport 3,000,000 5,313,500
29/09/2016 National Statistical Office IMF/WB & Finance Minister's meeting 1,100,000 4,213,500
4/10/2016 Tourism Promotion Authority To cater for TPA's outstanding debts. 1,000,000 3,213,500
24/10/2016 Department of Treasury Printing of Budget Book & Other Logistic 479,750 2,733,750
28/10/2016 National Volunteer Services To cater for NVS outstanding allowances 160,000 2,573,750
16/11/2016 PNG Coffee Industry Corporation For Aiyura Research Stations Operations 580,000 1,993,750
17/11/2016 Department of Prime Minister & NEC To cater for PM's trip to Cuba 700,000 1,293,750
18/11/2016 Mineral Resources Authority Frieda Project Development Forum 400,000 893,750
25/11/2016 Public Service Commission For Rabaul Queen Shipping Court Hearing 80,000 813,750
9/12/2016 Department of Treasury Transferred in Section 4 to cater for fuel, rent and utility bills
813,750 -
Total 100,000,000
Source: Department of Treasury

64.
Table 34: Section 4 (Transfers)
BR45
Transfer Out Transfer In
Date Agency Name Description Div1
Dept1
Amt Out Div2 Dept2
Amt In Action Officer
7/11/2016 207-Treasury and Finance - Miscellaneous To cover GG's medical expenses to Australia 202 202 -430,000 207 207 430,000 GOPNG
1/02/2016 207-Treasury and Finance - Miscellaneous Transfer from Disaster to PMs as request 203 203 -10,000,000 207 207 10,000,000 GOPNG
26/02/2016 207-Treasury and Finance - Miscellaneous Transfer from 207 to appropriate vote 203 203 -20,000,000 207 207 20,000,000 GOPNG
1/03/2016 207-Treasury and Finance - Miscellaneous To cater for Fiji Disaster Relief 203 203 -11,000,000 207 207 11,000,000 GOPNG
16/03/2016 207-Treasury and Finance - Miscellaneous To settle o/s bills for using helicopter 203 203 -10,000,000 207 207 10,000,000 GOPNG
17/03/2016 207-Treasury and Finance - Miscellaneous Cancelled transfer 203 203 -10,000,000 207 207 10,000,000 GOPNG
2/04/2016 207-Treasury and Finance - Miscellaneous Transfered to APEC and PM&NEC 203 203 -4,000,000 207 207 4,000,000 GOPNG
13/05/2016 207-Treasury and Finance - Miscellaneous To cater for ACP meetings. 203 203 -10,000,000 207 207 10,000,000 GOPNG
26/05/2016 207-Treasury and Finance - Miscellaneous To cater for ACP & APEC REC 203 203 -10,000,000 207 207 10,000,000 GOPNG
2/06/2016 207-Treasury and Finance - Miscellaneous To cater for ACP Endowment Fund. 203 203 -2,000,000 207 207 2,000,000 GOPNG
16/06/2016 207-Treasury and Finance - Miscellaneous PM's Commitment to Ramu Nickle LOs 203 203 -6,000,000 207 207 6,000,000 GOPNG
29/07/2016 207-Treasury and Finance - Miscellaneous For Apec Authority & APEC Secretariat 203 203 -11,000,000 207 207 11,000,000 GOPNG
20/10/2016 207-Treasury and Finance - Miscellaneous To settle delayed operational cost 203 203 -5,000,000 207 207 5,000,000 GOPNG
18/11/2016 207-Treasury and Finance - Miscellaneous To pay PM's bodyguards overtime 203 203 -1,100,000 207 207 1,100,000 GOPNG
29/11/2016 207-Treasury and Finance - Miscellaneous To cater for late Ganasi's funeral 203 203 -500,000 207 207 500,000 GOPNG
12/12/2016 207-Treasury and Finance - Miscellaneous To cater for OS for 41st Ind. & Remembra 203 203 -3,000,000 207 207 3,000,000 GOPNG
12/12/2016 207-Treasury and Finance - Miscellaneous Transfer of Bal, in 207 to APEC (PM&NEC) 203 203 -21,500,000 207 207 21,500,000 GOPNG
30/09/2016 208-Department of Treasury Contra entry of doc # 00234628 204 204 -1,100,000 208 208 1,100,000 GOPNG
29/06/2016 212-Information Technology Division To fund shortfalls in various activities 206 206 -2,993,800 212 212 2,993,800 GOPNG
24/08/2016 207-Treasury and Finance - Miscellaneous Transfer to within to cater for o/standing 206 206 -13,000,000 207 207 13,000,000 GOPNG
18/11/2016 207-Treasury and Finance - Miscellaneous Office fit-outs, security and audits 206 206 -1,170,000 207 207 1,170,000 GOPNG
22/01/2016 235-Department of Education To cater for tuition fee free subsidy 207 207 -150,000,000 235 235 150,000,000 GOPNG
22/02/2016 538-Papua New Guinea Air Services Limited Funds transferred for PAMAS project 207 207 -20,000,000 538 538 20,000,000 GOPNG
18/03/2016 230-Electoral Commission To cater for 2016 Election Preparations 207 207 -20,000,000 230 230 20,000,000 GOPNG
21/03/2016 235-Department of Education To cater for Tuition Fee Free payments 207 207 -150,000,000 235 235 150,000,000 GOPNG
7/04/2016 585-Sandaun Provincial Administration K1m from Disaster vote to Telefomin Disa 207 207 -2,000,000 585 585 2,000,000 GOPNG
11/05/2016 235-Department of Education Transfer of TFF to misc for payment 207 207 -151,200,000 235 235 151,200,000 GOPNG
16/05/2016 241-Hospital Management Services Funds to go directly to POMGEN 207 207 -11,556,400 241 241 11,556,400 GOPNG

65.
BR45
Transfer Out Transfer In
Date Agency Name Description Div1
Dept1
Amt Out Div2 Dept2
Amt In Action Officer
30/05/2016 557-PNG National Forest Authority Transfer of SGS Log Funds to PNGFA 207 207 -12,200,000 557 557 12,200,000 GOPNG
14/06/2016 232-Provincial and Local Government Affairs Payment to LLG officials 207 207 -14,000,000 232 232 14,000,000 GOPNG
17/06/2016 220-Department of Personnel Management To replace stale cheques to Provinces 207 207 -1,600,000 220 220 1,600,000 GOPNG
21/06/2016 208-Department of Treasury To cater for outstanding bills 207 207 -10,000,000 208 208 10,000,000 GOPNG
24/06/2016 267-Department of Implementation and Rural Development
To cater for DSIP monitoring & coordinat 207 207 -3,000,000 267 267 3,000,000 GOPNG
27/06/2016 235-Department of Education Transfer of TFF to Misc for payment 207 207 -150,800,000 235 235 150,800,000 GOPNG
29/06/2016 241-Hospital Management Services Funds to go to 207 207 207 -24,734,124 241 241 24,734,124 GOPNG
11/07/2016 208-Department of Treasury ICT bills to Treasury 207 207 -24,000,000 208 208 24,000,000 GOPNG
11/07/2016 240-Department of Health Cater for purchase of insecticidal nets 207 207 -5,000,000 240 240 5,000,000 GOPNG
11/07/2016 242-Department of Community Development Outstanding bills/rental for Com Dev 207 207 -4,200,000 242 242 4,200,000 GOPNG
26/07/2016 220-Department of Personnel Management To cater for 5 Unesco officers on rettre 207 207 -260,629 220 220 260,629 GOPNG
23/08/2016 592-Jiwaka Provincial Administration Cater release of free health care funds 207 207 -40,000,000 592 592 40,000,000 GOPNG
24/08/2016 217-Department of Foreign Affairs and Trade Correction to SA # 2444 207 207 -13,453,600 217 217 13,453,600 GOPNG
25/08/2016 208-Department of Treasury For OSPEAC PE data collection activity 207 207 -427,000 208 208 427,000 GOPNG
9/09/2016 236-Department of Higher Education Research Science & Technology
Transfer to DHERST for TESAS 207 207 -5,000,000 236 236 5,000,000 GOPNG
20/09/2016 235-Department of Education To cater for Education Fee Free Subsidy 207 207 -75,000,000 235 235 75,000,000 GOPNG
21/09/2016 230-Electoral Commission To cater for Election Preparations 207 207 -8,000,000 230 230 8,000,000 GOPNG
27/09/2016 235-Department of Education TFF 207 207 -75,000,000 235 235 75,000,000 GOPNG
28/09/2016 225-Department of Attorney-General To cater outstanding legal bills 207 207 -3,000,000 225 225 3,000,000 GOPNG
18/10/2016 255-Departmentof Petroleum and Energy Transfer to assist GPCO thru DPE 207 207 -1,000,000 255 255 1,000,000 GOPNG
19/10/2016 208-Department of Treasury To cater for o/s commitments see attachm 207 207 -4,619,900 208 208 4,619,900 GOPNG
25/10/2016 228-Department of Police Transfer to cater for Women's FIFA 207 207 -5,000,000 228 228 5,000,000 GOPNG
28/10/2016 225-Department of Attorney-General To cater for outstanding legal bills 207 207 -2,500,000 225 225 2,500,000 GOPNG
28/10/2016 235-Department of Education Transfer to Finance Fee free Subsidy 207 207 -75,000,000 235 235 75,000,000 GOPNG
4/11/2016 247-Department of Agriculture and Livestock Transfer to DAL to settle OS State Liabi 207 207 -1,000,000 247 247 1,000,000 GOPNG
16/11/2016 565-Civil Aviation Safety Authority Transfer to CASA for ICAO Audit 207 207 -3,000,000 565 565 3,000,000 GOPNG
17/11/2016 228-Department of Police Settle o/s bill- Island Mobile Hire Cars 207 207 -3,200,000 228 228 3,200,000 GOPNG
23/11/2016 228-Department of Police Transfer to cater for electiion/APEC ops 207 207 -20,000,000 228 228 20,000,000 GOPNG
25/11/2016 228-Department of Police For Rabaul Queen Shipping Trial. 207 207 -650,000 228 228 650,000 GOPNG

66.
BR45
Transfer Out Transfer In
Date Agency Name Description Div1
Dept1
Amt Out Div2 Dept2
Amt In Action Officer
30/11/2016 218-Office of the Public Prosecutor To cater for rental and court circuits 207 207 -200,000 218 218 200,000 GOPNG
2/12/2016 236-Department of Higher Education Research Science & Technology
For ministeral administrative support 207 207 -500,000 236 236 500,000 GOPNG
5/12/2016 232-Provincial and Local Government Affairs LLG officials allowances 207 207 -7,000,000 232 232 7,000,000 GOPNG
9/12/2016 208-Department of Treasury To cater for fuel, rent, utility bills 207 207 -7,604,000 208 208 7,604,000 GOPNG
9/12/2016 536-Kokonas Indastry Kopration Funds for FER as per NEC Decision 207 207 -500,000 536 536 500,000 GOPNG
11/12/2016 225-Department of Attorney-General Transfer to DJAG for Legal Bill Payments 207 207 -4,300,000 225 225 4,300,000 GOPNG
31/03/2016 577-Southern Highlands Provincial Administration
To cater for SHP Project Managment Unit 208 208 -10,000,000 577 577 10,000,000 GOPNG
1/04/2016 232-Provincial and Local Government Affairs Kokopo UBSA Outstanding 208 208 -14,720,000 232 232 14,720,000 GOPNG
18/04/2016 577-Southern Highlands Provincial Administration
Reversal of funds back to Trsy for pmnt. 208 208 -10,000,000 577 577 10,000,000 GOPNG
8/12/2016 234-Department of Defence Pay to IRC for NCS/Defence tax debt 208 208 -1,800,000 234 234 1,800,000 GOPNG
25/11/2016 221-Public Service Commission Rectify oversight error. 218 218 -80,000 221 221 80,000 GOPNG
13/04/2016 241-Hospital Management Services To offset the over expenditure 229 229 -1,200,000 241 241 1,200,000 GOPNG
3/11/2016 255-Departmentof Petroleum and Energy Transfer from DPLGA to DPE per C/Order 232 232 -7,360,000 255 255 7,360,000 GOPNG
4/11/2016 237-PNG National Commission for UNESCO Cater for normal operations in Division 235 235 235 -321,574 237 237 321,574 GOPNG
TOTAL (K) -
1,309,781,027
1,309,781,027
Source: Department of Treasury

67.
3.0 Attachments and Appendices (overleaf)
Attachment A Commercial & Statutory Authorities - 2016 Personnel Emoluments and Goods and Services Expenditure
Agency 2016 Initial Appropriation
Revised Appropriation
Total Expenditure Variance
201 - National Parliament 147,488,350 145,293,557 144,605,300 688,257
Personnel Emoluments 105,512,750 105,512,750 105,512,650 100
Goods & Services 41,975,600 39,780,807 39,092,650 688,157
215 - PNG Immigration and Citizenship Services 10,016,508 10,016,508 12,555,519 (2,539,011)
Personnel Emoluments 10,016,508 10,016,508 12,555,519 (2,539,011)
216 - Internal Revenue Commission 74,992,480 72,051,640 65,475,446 6,576,194
Personnel Emoluments 33,841,780 33,957,780 36,451,747 (2,493,967)
Goods & Services 41,150,700 38,093,860 29,023,699 9,070,160
223 - Judiciary Services 227,328,200 237,328,200 232,301,553 5,026,648
Personnel Emoluments 69,003,800 69,003,800 63,977,153 5,026,648
Goods & Services 158,324,400 168,324,400 168,324,400 -
224 - Magisterial Services 38,317,365 37,980,303 32,776,452 5,203,851
Personnel Emoluments 31,637,965 31,637,965 26,434,114 5,203,851
Goods & Services 6,679,400 6,342,338 6,342,338 0
238 - Milne Bay Provincial Health Authority 29,820,252 30,811,939 24,714,768 6,097,170
Personnel Emoluments 23,775,440 24,581,240 18,724,616 5,856,624
Goods & Services 6,044,812 6,230,699 5,990,152 240,547
239 - Western Highlands Provincial Health Authority 32,735,052 34,361,023 34,745,256 (384,233)
Personnel Emoluments 25,974,366 26,997,666 27,382,651 (384,985)
Goods & Services 6,760,686 7,363,357 7,362,605 752
243 - National Volunteer Services 1,882,502 2,039,065 1,680,661 358,404
Personnel Emoluments 1,584,878 1,584,878 1,306,474 278,404
Goods & Services 297,624 454,187 374,187 80,000
244 - Eastern Highlands Provincial Health Authority 34,991,681 36,325,365 15,068,975 21,256,390
Personnel Emoluments 28,675,281 29,755,381 8,591,388 21,163,993
Goods & Services 6,316,400 6,569,984 6,477,587 92,397
251 - PNG Science & Technology Secretariat 4,220,146 3,998,663 3,075,821 922,842
Personnel Emoluments 2,458,146 2,458,146 1,728,021 730,125
Goods & Services 1,762,000 1,540,517 1,347,800 192,717
253 - West New Britain Provincial Health Authority 36,159,272 37,060,620 23,333,246 13,727,374
Personnel Emoluments 28,767,112 29,285,812 15,564,517 13,721,295

68.
Attachment A Commercial & Statutory Authorities - 2016 Personnel Emoluments and Goods and Services Expenditure
Agency 2016 Initial Appropriation
Revised Appropriation
Total Expenditure Variance
Goods & Services 7,392,160 7,774,808 7,768,729 6,079
256 - Manus Provincial Health Authority 17,730,297 17,769,750 15,291,283 2,478,467
Personnel Emoluments 11,923,451 12,090,451 9,612,689 2,477,762
Goods & Services 5,806,846 5,679,299 5,678,594 705
260 - Enga Provincial Health Authority 29,659,749 30,527,156 31,997,015 (1,469,860)
Personnel Emoluments 23,438,681 24,086,881 25,562,688 (1,475,807)
Goods & Services 6,221,068 6,440,275 6,434,327 5,948
266 - Sandaun Provincial Health Authority 26,953,372 27,553,598 13,693,057 13,860,541
Personnel Emoluments 19,865,952 20,304,152 6,462,998 13,841,154
Goods & Services 7,087,420 7,249,446 7,230,059 19,387
269 - Office of Tourism Arts and Culture 51,843,913 6,755,311 6,479,836 275,475
Personnel Emoluments 889,225 889,225 717,464 171,761
Goods & Services 50,954,688 5,866,086 5,762,372 103,714
501 - Konebada Petroleum Park Authority 6,447,100 6,392,525 6,392,524 1
Personnel Emoluments 3,800,000 3,800,000 3,800,000 -
Goods & Services 2,647,100 2,592,525 2,592,524 1
502 - Office of the Auditor-General 23,927,754 22,286,769 22,286,769 0
Personnel Emoluments 13,913,315 13,913,315 13,913,315 -
Goods & Services 10,014,439 8,373,454 8,373,454 0
503 - Ombudsman Commission 20,350,185 19,157,794 18,600,995 556,799
Personnel Emoluments 12,087,321 12,087,321 12,087,321 -
Goods & Services 8,262,864 7,070,473 6,513,674 556,799
505 - National Research Institute 7,160,541 7,126,051 7,126,051 -
Personnel Emoluments 3,596,211 3,596,211 3,596,211 -
Goods & Services 3,564,330 3,529,840 3,529,840 -
506 - National Training Council 2,492,045 2,338,161 2,629,352 (291,191)
Personnel Emoluments 1,014,700 1,014,700 1,306,252 (291,552)
Goods & Services 1,477,345 1,323,461 1,323,100 361
507 - National Economic & Fiscal Commission 3,498,475 3,400,782 2,714,467 686,315
Personnel Emoluments 1,954,986 1,759,886 1,073,571 686,315
Goods & Services 1,543,489 1,640,896 1,640,896 (0)
509 - Border Development Authority (BDA) 5,173,107 4,593,882 4,188,635 405,247

69.
Attachment A Commercial & Statutory Authorities - 2016 Personnel Emoluments and Goods and Services Expenditure
Agency 2016 Initial Appropriation
Revised Appropriation
Total Expenditure Variance
Personnel Emoluments 2,210,378 2,210,378 1,806,040 404,338
Goods & Services 2,962,729 2,383,504 2,382,595 909
510 - Legal Training Institute 4,865,372 4,836,629 4,632,343 204,286
Personnel Emoluments 1,657,096 1,657,096 1,452,810 204,286
Goods & Services 3,208,276 3,179,533 3,179,533 (0)
511 - Papua New Guinea Climate Change Authority 9,532,618 8,539,509 9,523,231 (983,722)
Personnel Emoluments 3,036,433 3,036,433 4,020,156 (983,723)
Goods & Services 6,496,185 5,503,076 5,503,075 1
512 - University of Papua New Guinea 77,469,169 62,469,169 60,969,168 1,500,001
Personnel Emoluments 44,960,314 44,960,314 44,960,313 1
Goods & Services 32,508,855 17,508,855 16,008,855 1,500,000
513 - University of Technology 65,247,257 62,076,261 62,076,261 -
Personnel Emoluments 35,392,114 35,392,114 35,392,114 -
Goods & Services 29,855,143 26,684,147 26,684,147 -
514 - University of Goroka 34,399,327 22,316,460 22,316,460 (0)
Personnel Emoluments 17,709,286 17,709,286 17,709,286 -
Goods & Services 16,690,041 4,607,174 4,607,174 (0)
515 - University of Environment & Natural Resources 28,565,756 26,803,790 26,803,790 0
Personnel Emoluments 17,010,083 17,010,083 17,010,083 -
Goods & Services 11,555,673 9,793,707 9,793,707 0
516 - Papua New Guinea Sports Foundation 50,511,550 41,718,736 39,355,226 2,363,509
Personnel Emoluments 6,813,461 6,813,461 4,449,951 2,363,510
Goods & Services 43,698,089 34,905,275 34,905,275 (0)
517 - National Narcotics Bureau 4,376,599 4,233,153 4,752,709 (519,557)
Personnel Emoluments 2,319,774 2,319,774 4,752,709 (2,432,935)
Goods & Services 2,056,825 1,913,379 - 1,913,379
518 - PNG Maritime College 4,803,502 4,803,502 4,803,502 -
Personnel Emoluments 4,440,502 4,440,502 4,440,502 -
Goods & Services 363,000 363,000 363,000 -
519 - National Aids Council Secretariat 8,926,734 8,886,715 8,885,635 1,080
Personnel Emoluments 7,362,403 7,362,403 7,362,403 -
Goods & Services 1,564,331 1,524,312 1,523,232 1,080

70.
Attachment A Commercial & Statutory Authorities - 2016 Personnel Emoluments and Goods and Services Expenditure
Agency 2016 Initial Appropriation
Revised Appropriation
Total Expenditure Variance
520 - Institute ofMedical Research 12,355,782 12,326,091 12,326,091 (0)
Personnel Emoluments 9,708,178 9,708,178 9,708,178 -
Goods & Services 2,647,604 2,617,913 2,617,913 (0)
521 - National Youth Commission 4,137,142 3,885,530 3,924,028 (38,498)
Personnel Emoluments 1,818,242 1,818,242 1,856,740 (38,498)
Goods & Services 2,318,900 2,067,288 2,067,288 0
522 - Constitutional and Law Reform Commission 4,094,390 4,053,807 2,451,970 1,601,837
Personnel Emoluments 2,319,516 2,319,516 717,679 1,601,837
Goods & Services 1,774,874 1,734,291 1,734,291 (0)
523 - Papua New Guinea Accidents Investigation Commission 5,585,403 5,504,658 5,504,658 -
Personnel Emoluments 5,122,076 5,122,076 5,122,076 -
Goods & Services 463,327 382,582 382,582 -
524 - Independent Public Business Corporation 9,000,000 4,850,000 4,850,000 -
Goods & Services 9,000,000 4,850,000 4,850,000 -
525 - National Broadcasting Commission 25,240,268 25,163,843 25,163,843 0
Personnel Emoluments 16,061,300 16,061,300 16,061,300 -
Goods & Services 9,178,968 9,102,543 9,102,543 0
526 - National Maritime Safety Authority 4,302,911 4,102,911 3,996,271 106,640
Personnel Emoluments 1,700,000 1,700,000 1,593,360 106,640
Goods & Services 2,602,911 2,402,911 2,402,911 -
530 - Investment Promotion Authority 2,969,471 2,969,471 2,969,471 -
Personnel Emoluments 1,627,958 1,627,958 1,627,958 -
Goods & Services 1,341,513 1,341,513 1,341,513 -
531 - Small Business Development Corporation 4,632,404 4,620,798 4,620,798 -
Personnel Emoluments 3,026,166 3,026,166 3,026,166 -
Goods & Services 1,606,238 1,594,632 1,594,632 -
532 - National Institute of Standards & Industrial Technology 3,466,677 3,293,741 3,526,276 (232,536)
Personnel Emoluments 2,073,600 2,073,600 2,306,135 (232,535)
Goods & Services 1,393,077 1,220,141 1,220,141 (0)
533 - Industrial Centers Development Corporation 2,572,994 2,572,994 2,572,994 -
Personnel Emoluments 2,349,987 2,349,987 2,349,987 -
Goods & Services 223,007 223,007 223,007 -

71.
Attachment A Commercial & Statutory Authorities - 2016 Personnel Emoluments and Goods and Services Expenditure
Agency 2016 Initial Appropriation
Revised Appropriation
Total Expenditure Variance
535 - Mineral Resources Authority 22,750,000 8,050,000 5,650,000 2,400,000
Goods & Services 22,750,000 8,050,000 5,650,000 2,400,000
536 - Kokonas Indastry Kopration 6,542,732 6,983,269 6,983,269 0
Personnel Emoluments 358,708 358,708 358,708 -
Goods & Services 6,184,024 6,624,561 6,624,561 0
537 - National Airports Corporation 20,000,000 14,000,000 14,000,000 -
Goods & Services 20,000,000 14,000,000 14,000,000 -
538 - Papua New Guinea Air Services Limited - 10,000,000 10,000,000 -
Goods & Services - 10,000,000 10,000,000 -
539 - National Museum and Art Gallery 11,773,964 11,581,979 4,543,655 7,038,325
Personnel Emoluments 3,512,400 3,512,400 2,714,416 797,984
Goods & Services 8,261,564 8,069,579 1,829,239 6,240,341
541 - National Housing Corporation 7,230,158 221,155 (1,285,642) 1,506,797
Personnel Emoluments - - (1,506,797) 1,506,797
Goods & Services 7,230,158 221,155 221,155 (0)
542 - National Cultural Commission 4,669,020 5,592,769 5,329,394 263,375
Personnel Emoluments 3,183,070 3,183,070 2,919,695 263,375
Goods & Services 1,485,950 2,409,699 2,409,699 1
543 - National Development Bank 61,500,000 11,900,000 11,900,000 -
Goods & Services 61,500,000 11,900,000 11,900,000 -
545 - Rural Airstrip Authority 4,500,000 4,500,000 4,500,000 -
Goods & Services 4,500,000 4,500,000 4,500,000 -
546 - PNG Power Limited 34,000,000 15,985,000 12,985,000 3,000,000
Goods & Services 34,000,000 15,985,000 12,985,000 3,000,000
549 - Office of Coastal Fisheries Development Agency 25,602,633 20,478,978 19,670,858 808,120
Personnel Emoluments 1,885,590 1,885,590 1,104,170 781,420
Goods & Services 23,717,043 18,593,388 18,566,688 26,700
550 - Cocoa Coconut Institute Ltd 6,699,182 6,699,182 7,105,778 (406,596)
Personnel Emoluments 5,612,101 5,612,101 5,942,935 (330,834)
Goods & Services 1,087,081 1,087,081 1,162,843 (75,762)
551 - National Fisheries Authority 1,000,000 - (138) 138
Personnel Emoluments - - (138) 138

72.
Attachment A Commercial & Statutory Authorities - 2016 Personnel Emoluments and Goods and Services Expenditure
Agency 2016 Initial Appropriation
Revised Appropriation
Total Expenditure Variance
Goods & Services 1,000,000 - - -
553 - Fresh Produce Development Company 8,677,180 8,256,411 8,256,411 0
Personnel Emoluments 3,735,885 3,735,885 3,735,885 -
Goods & Services 4,941,295 4,520,526 4,520,526 0
554 - PNG Coffee Industry Corporation 10,018,560 10,598,560 10,598,560 -
Personnel Emoluments 2,008,260 2,008,260 2,008,260 -
Goods & Services 8,010,300 8,590,300 8,590,300 -
557 - PNG National Forest Authority 34,374,653 36,863,681 36,863,681 0
Personnel Emoluments 23,713,761 23,713,761 23,713,761 -
Goods & Services 10,660,892 13,149,920 13,149,920 0
558 - Tourism Promotion Authority 9,841,089 10,809,782 10,308,008 501,774
Personnel Emoluments 2,132,589 2,132,589 2,132,589 -
Goods & Services 7,708,500 8,677,193 8,175,419 501,774
562 - National Agriculture Research Institute 13,498,610 13,284,624 13,284,624 0
Personnel Emoluments 9,444,511 9,444,511 9,444,511 -
Goods & Services 4,054,099 3,840,113 3,840,113 0
563 - National Agriculture Quarantine & Inspection Authority 10,413,662 8,913,662 15,493,881 (6,580,219)
Personnel Emoluments 8,413,662 8,413,662 14,993,881 (6,580,219)
Goods & Services 2,000,000 500,000 500,000 -
565 - Civil Aviation Safety Authority 12,275,341 15,164,098 15,228,381 (64,283)
Personnel Emoluments 11,302,116 11,302,116 11,366,399 (64,283)
Goods & Services 973,225 3,861,982 3,861,982 0
566 - Cocoa Board 16,847,866 16,796,293 16,796,293 (0)
Personnel Emoluments 3,929,866 3,929,866 3,929,866 -
Goods & Services 12,918,000 12,866,427 12,866,427 (0)
567 - National Road Authority 9,500,000 8,503,023 6,872,373 1,630,650
Personnel Emoluments 2,000,000 2,000,000 369,352 1,630,648
Goods & Services 7,500,000 6,503,023 6,503,021 2
569 - Independent Consumer and Competition Commission 9,772,191 9,587,225 9,587,225 0
Personnel Emoluments 6,493,073 6,493,073 6,493,073 -
Goods & Services 3,279,118 3,094,152 3,094,152 0
Grand Total 1,541,730,513 1,369,966,117 1,282,429,317 87,536,800

73.
Attachment B National Departments - 2016 Personnel Emoluments and Goods and Services Expenditure
Agency 2016 Initial
Appropriation Revised Appropriation Total Expenditure Variance
202 - Office of Governor-General 5,229,011 5,501,998 5,279,318 222,680
Personnel Emoluments 2,522,311 2,573,811 2,351,131 222,680
Goods & Services 2,706,700 2,928,187 2,928,186 1
203 - Department of Prime Minister & NEC 108,339,623 146,113,525 117,676,512 28,437,012
Personnel Emoluments 53,142,023 53,142,023 55,066,829 (1,924,806)
Goods & Services 55,197,600 92,971,502 62,609,683 30,361,818
204 - National Statistical Office 10,401,908 9,969,078 11,710,089 (1,741,011)
Personnel Emoluments 4,899,408 4,899,408 6,794,141 (1,894,733)
Goods & Services 5,502,500 5,069,670 4,915,948 153,722
205 - Office of Bougainville Affairs 3,388,028 3,153,313 3,958,832 (805,519)
Personnel Emoluments 1,933,428 2,013,428 2,904,355 (890,927)
Goods & Services 1,454,600 1,139,885 1,054,476 85,408
206 - Department of Finance 49,376,145 53,636,316 52,900,120 736,196
Personnel Emoluments 20,597,349 20,837,249 22,960,532 (2,123,283)
Goods & Services 28,778,796 32,799,067 29,939,588 2,859,479
208 - Department of Treasury 150,375,303 180,918,642 138,527,516 42,391,126
Personnel Emoluments 20,954,903 20,732,903 13,900,350 6,832,553
Goods & Services 129,420,400 160,185,739 124,627,165 35,558,573
209 - Registrar For Political Parties 7,753,832 7,365,304 7,648,541 (283,237)
Personnel Emoluments 5,084,532 4,599,232 4,904,738 (305,506)
Goods & Services 2,669,300 2,766,072 2,743,803 22,269
211 - PNG Customs Service 59,631,721 52,443,992 36,890,236 15,553,756
Personnel Emoluments 29,023,521 29,635,521 30,597,141 (961,620)
Goods & Services 30,608,200 22,808,471 6,293,095 16,515,376
212 - Information Technology Division 18,340,042 16,756,148 15,827,107 929,041
Personnel Emoluments 5,888,617 5,853,617 2,851,817 3,001,800
Goods & Services 12,451,425 10,902,531 12,975,290 (2,072,759)
213 - Fire Services 29,015,004 16,453,754 20,758,398 (4,304,644)
Personnel Emoluments 11,398,104 11,698,104 17,108,395 (5,410,291)
Goods & Services 17,616,900 4,755,650 3,650,003 1,105,647
217 - Department of Foreign Affairs and Trade 59,931,794 59,427,414 47,883,358 11,544,056

74.
Attachment B National Departments - 2016 Personnel Emoluments and Goods and Services Expenditure
Agency 2016 Initial
Appropriation Revised Appropriation Total Expenditure Variance
Personnel Emoluments 33,061,425 36,561,425 25,527,868 11,033,557
Goods & Services 26,870,369 22,865,989 22,355,490 510,499
218 - Office of the Public Prosecutor 7,393,762 7,923,493 9,016,401 (1,092,908)
Personnel Emoluments 5,343,962 5,343,962 6,432,264 (1,088,302)
Goods & Services 2,049,800 2,579,531 2,584,138 (4,607)
219 - PNG Institute of Public Administration 10,162,631 9,126,345 9,774,197 (647,853)
Personnel Emoluments 5,242,831 5,242,831 5,959,095 (716,264)
Goods & Services 4,919,800 3,883,514 3,815,102 68,412
220 - Department of Personnel Management 22,077,797 21,734,282 19,170,685 2,563,597
Personnel Emoluments 16,349,297 15,582,612 13,110,156 2,472,456
Goods & Services 5,728,500 6,151,670 6,060,529 91,141
221 - Public Service Commission 6,435,483 6,150,417 5,881,243 269,174
Personnel Emoluments 5,261,083 5,161,083 4,895,006 266,077
Goods & Services 1,174,400 989,334 986,237 3,097
222 - Office of the Public Solicitor 12,559,548 12,306,448 12,173,708 132,740
Personnel Emoluments 8,821,948 8,821,948 8,690,605 131,343
Goods & Services 3,737,600 3,484,500 3,483,103 1,397
225 - Department of Attorney-General 105,500,000 113,924,585 129,261,428 (15,336,843)
Personnel Emoluments 73,725,641 73,725,641 90,783,261 (17,057,620)
Goods & Services 31,774,359 40,198,944 38,478,166 1,720,778
226 - Department of Corrective Institutional Services 139,699,381 138,425,039 138,051,225 373,814
Personnel Emoluments 87,188,381 81,938,381 82,067,494 (129,113)
Goods & Services 52,511,000 56,486,658 55,983,731 502,927
227 - Provincial Treasuries 45,153,661 42,040,568 46,436,789 (4,396,221)
Personnel Emoluments 35,689,679 35,689,679 41,233,790 (5,544,111)
Goods & Services 9,463,982 6,350,889 5,202,999 1,147,890
228 - Department of Police 361,294,687 388,416,176 444,736,937 (56,320,762)
Personnel Emoluments 196,518,462 196,518,462 259,285,692 (62,767,230)
Goods & Services 164,776,225 191,897,714 185,451,245 6,446,469
229 - Department of National Planning and Monitoring 102,085,979 84,517,208 84,252,346 264,862
Personnel Emoluments 11,084,167 11,084,167 11,519,904 (435,737)
Goods & Services 91,001,812 73,433,041 72,732,442 700,599

75.
Attachment B National Departments - 2016 Personnel Emoluments and Goods and Services Expenditure
Agency 2016 Initial
Appropriation Revised Appropriation Total Expenditure Variance
230 - Electoral Commission 21,741,378 47,164,573 48,538,290 (1,373,717)
Personnel Emoluments 6,712,279 7,364,498 6,277,625 1,086,873
Goods & Services 15,029,099 39,800,075 42,260,665 (2,460,590)
231 - National Intelligence Organisation 4,669,962 4,649,802 4,900,774 (250,972)
Personnel Emoluments 2,602,262 2,519,262 2,878,785 (359,523)
Goods & Services 2,067,700 2,130,540 2,021,989 108,551
232 - Provincial and Local Government Affairs 18,226,881 29,127,276 28,921,114 206,162
Personnel Emoluments 9,690,184 23,220,184 23,161,093 59,091
Goods & Services 8,536,697 5,907,092 5,760,021 147,071
233 - Office of Censorship 3,675,840 3,414,027 3,065,945 348,082
Personnel Emoluments 2,675,840 2,675,840 2,338,226 337,614
Goods & Services 1,000,000 738,187 727,719 10,468
234 - Department of Defence 256,474,765 239,676,860 249,072,688 (9,395,827)
Personnel Emoluments 115,102,765 115,176,465 154,706,537 (39,530,072)
Goods & Services 141,372,000 124,500,395 94,366,150 30,134,245
235 - Department of Education 852,555,017 316,268,992 246,599,432 69,669,560
Personnel Emoluments 145,072,305 144,789,305 152,296,555 (7,507,250)
Goods & Services 707,482,712 171,479,687 94,302,876 77,176,810
236 - Department of Higher Education Research Science & Technology 137,248,390 116,351,918 121,554,779 (5,202,861)
Personnel Emoluments 6,127,235 6,127,235 4,194,296 1,932,939
Goods & Services 131,121,155 110,224,683 117,360,482 (7,135,799)
237 - PNG National Commission for UNESCO 3,062,017 2,521,474 860,200 1,661,273
Personnel Emoluments 2,194,355 2,116,355 860,200 1,256,155
Goods & Services 867,662 405,119 - 405,119
240 - Department of Health 320,651,064 337,188,516 312,320,826 24,867,690
Personnel Emoluments 78,456,060 79,119,660 98,519,546 (19,399,886)
Goods & Services 242,195,004 258,068,856 213,801,281 44,267,575
241 - Hospital Management Services 677,538,040 622,899,070 571,944,461 50,954,609
Personnel Emoluments 275,321,280 308,839,184 407,628,084 (98,788,900)
Goods & Services 402,216,760 314,059,886 164,316,376 149,743,509
242 - Department of Community Development 13,928,930 16,058,533 14,506,475 1,552,058
Personnel Emoluments 9,958,030 8,638,030 7,102,842 1,535,188

76.
Attachment B National Departments - 2016 Personnel Emoluments and Goods and Services Expenditure
Agency 2016 Initial
Appropriation Revised Appropriation Total Expenditure Variance
Goods & Services 3,970,900 7,420,503 7,403,633 16,870
245 - Conservation and Environment Protection Authority 16,532,507 15,521,015 15,188,469 332,546
Personnel Emoluments 6,626,748 6,626,748 7,175,062 (548,314)
Goods & Services 9,905,759 8,894,267 8,013,406 880,861
246 - Office of Urbanization 1,753,723 1,698,141 2,360,837 (662,696)
Personnel Emoluments 1,501,704 1,501,704 2,168,491 (666,787)
Goods & Services 252,019 196,437 192,345 4,092
247 - Department of Agriculture and Livestock 17,815,575 18,215,671 14,128,445 4,087,225
Personnel Emoluments 12,889,643 12,889,643 9,630,462 3,259,181
Goods & Services 4,925,932 5,326,028 4,497,983 828,044
252 - Department of Lands and Physical Planning 39,596,665 30,304,077 29,577,839 726,237
Personnel Emoluments 16,618,962 16,618,962 16,087,893 531,069
Goods & Services 22,977,703 13,685,115 13,489,946 195,169
254 - Department of Mineral Policy and Geohazards Management 11,695,800 10,204,773 9,961,383 243,390
Personnel Emoluments 5,522,668 5,522,668 5,317,304 205,364
Goods & Services 6,173,132 4,682,105 4,644,079 38,027
255 - Department of Petroleum and Energy 47,537,026 38,476,910 30,494,286 7,982,625
Personnel Emoluments 11,426,447 11,026,447 9,717,133 1,309,314
Goods & Services 36,110,579 27,450,463 20,777,153 6,673,311
257 - Department of Public Enterprises 7,777,378 6,724,928 4,807,080 1,917,848
Personnel Emoluments 2,712,778 2,712,778 1,955,810 756,968
Goods & Services 5,064,600 4,012,150 2,851,270 1,160,880
258 - Department of Information and Communication 7,274,803 4,101,018 3,799,831 301,187
Personnel Emoluments 1,785,497 1,785,497 1,671,056 114,441
Goods & Services 5,489,306 2,315,521 2,128,775 186,746
259 - Department of Transport 24,704,857 21,669,426 21,009,677 659,750
Personnel Emoluments 12,900,004 12,900,004 12,817,219 82,785
Goods & Services 11,804,853 8,769,422 8,192,458 576,964
261 - Department of Commerce and Industry 26,143,883 21,816,390 17,904,720 3,911,670
Personnel Emoluments 9,201,650 9,201,650 6,840,463 2,361,187
Goods & Services 16,942,233 12,614,740 11,064,257 1,550,483
262 - Department of Industrial Relations 33,431,144 28,457,074 29,294,306 (837,233)

77.
Attachment B National Departments - 2016 Personnel Emoluments and Goods and Services Expenditure
Agency 2016 Initial
Appropriation Revised Appropriation Total Expenditure Variance
Personnel Emoluments 14,308,898 14,308,898 14,892,453 (583,555)
Goods & Services 19,122,246 14,148,176 14,401,853 (253,678)
263 - National Tripartite Consultative Council 862,859 803,420 630,338 173,082
Personnel Emoluments 519,953 519,953 359,972 159,981
Goods & Services 342,906 283,467 270,366 13,101
264 - Department of Works and Implementation 701,898,081 493,412,011 477,045,262 16,366,748
Personnel Emoluments 61,669,412 57,964,412 62,994,665 (5,030,253)
Goods & Services 640,228,669 435,447,599 414,050,597 21,397,001
267 - Department of Implementation and Rural Development 65,629,697 66,460,175 64,826,054 1,634,121
Personnel Emoluments 7,688,493 7,688,493 6,122,342 1,566,151
Goods & Services 57,941,204 58,771,682 58,703,712 67,971
268 - Central Supply & Tenders Board 2,727,530 3,965,974 3,875,849 90,125
Personnel Emoluments 1,544,941 1,544,941 1,827,822 (282,881)
Goods & Services 1,182,589 2,421,033 2,048,027 373,006
Grand Total 4,629,299,152 3,873,456,086 3,685,004,345 188,451,741
Source: Department of Treasury

78.
Attachment C Provinces - 2016 Personnel Emoluments and Goods and Services Expenditure
Agency 2016 Initial
Appropriation Revised Appropriation Total Expenditure Variance
571 - Fly River Provincial Administration 113,973,400 111,984,000 126,012,747 (14,028,747)
Personnel Emoluments 51,873,500 51,873,500 65,902,247 (14,028,747)
Goods & Services 62,099,900 60,110,500 60,110,500 -
572 - Gulf Provincial Administration 95,116,200 95,155,400 88,103,509 7,051,891
Personnel Emoluments 33,916,600 33,916,600 31,607,809 2,308,791
Goods & Services 61,199,600 61,238,800 56,495,700 4,743,100
573 - Central Provincial Administration 145,215,600 145,381,800 166,116,792 (20,734,992)
Personnel Emoluments 60,888,700 60,888,700 81,859,892 (20,971,192)
Goods & Services 84,326,900 84,493,100 84,256,900 236,200
574 - National Capital District 66,425,000 66,666,600 66,621,452 45,148
Personnel Emoluments - - (12,148) 12,148
Goods & Services 66,425,000 66,666,600 66,633,600 33,000
575 - Milne Bay Provincial Administration 153,421,300 153,421,300 155,116,189 (1,694,889)
Personnel Emoluments 66,788,600 66,788,600 71,418,589 (4,629,989)
Goods & Services 86,632,700 86,632,700 83,697,600 2,935,100
576 - Oro Provincial Administration 87,890,402 88,257,302 95,630,059 (7,372,757)
Personnel Emoluments 34,082,102 34,082,102 41,454,859 (7,372,757)
Goods & Services 53,808,300 54,175,200 54,175,200 -
577 - Southern Highlands Provincial Administration 174,105,484 172,685,884 206,476,631 (33,790,747)
Personnel Emoluments 89,041,270 89,041,270 128,392,517 (39,351,247)
Goods & Services 85,064,214 83,644,614 78,084,114 5,560,500
578 - Enga Provincial Administration 149,183,828 149,183,828 175,527,706 (26,343,878)
Personnel Emoluments 55,991,526 55,991,526 90,254,104 (34,262,578)
Goods & Services 93,192,302 93,192,302 85,273,602 7,918,700
579 - Western Highlands Provincial Administration 169,662,590 166,662,590 180,421,234 (13,758,644)
Personnel Emoluments 82,602,200 82,602,200 102,260,844 (19,658,644)
Goods & Services 87,060,390 84,060,390 78,160,390 5,900,000
580 - Simbu Provincial Administration 183,155,290 183,796,590 198,480,130 (14,683,540)
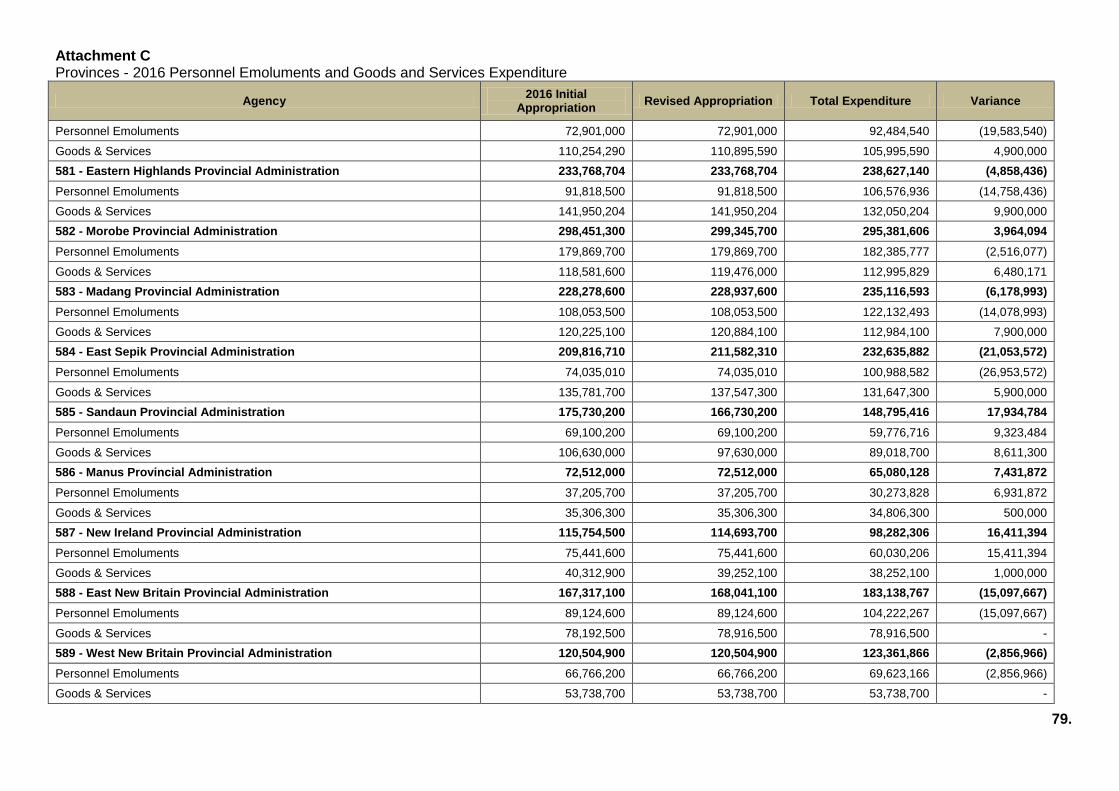
79.
Attachment C Provinces - 2016 Personnel Emoluments and Goods and Services Expenditure
Agency 2016 Initial
Appropriation Revised Appropriation Total Expenditure Variance
Personnel Emoluments 72,901,000 72,901,000 92,484,540 (19,583,540)
Goods & Services 110,254,290 110,895,590 105,995,590 4,900,000
581 - Eastern Highlands Provincial Administration 233,768,704 233,768,704 238,627,140 (4,858,436)
Personnel Emoluments 91,818,500 91,818,500 106,576,936 (14,758,436)
Goods & Services 141,950,204 141,950,204 132,050,204 9,900,000
582 - Morobe Provincial Administration 298,451,300 299,345,700 295,381,606 3,964,094
Personnel Emoluments 179,869,700 179,869,700 182,385,777 (2,516,077)
Goods & Services 118,581,600 119,476,000 112,995,829 6,480,171
583 - Madang Provincial Administration 228,278,600 228,937,600 235,116,593 (6,178,993)
Personnel Emoluments 108,053,500 108,053,500 122,132,493 (14,078,993)
Goods & Services 120,225,100 120,884,100 112,984,100 7,900,000
584 - East Sepik Provincial Administration 209,816,710 211,582,310 232,635,882 (21,053,572)
Personnel Emoluments 74,035,010 74,035,010 100,988,582 (26,953,572)
Goods & Services 135,781,700 137,547,300 131,647,300 5,900,000
585 - Sandaun Provincial Administration 175,730,200 166,730,200 148,795,416 17,934,784
Personnel Emoluments 69,100,200 69,100,200 59,776,716 9,323,484
Goods & Services 106,630,000 97,630,000 89,018,700 8,611,300
586 - Manus Provincial Administration 72,512,000 72,512,000 65,080,128 7,431,872
Personnel Emoluments 37,205,700 37,205,700 30,273,828 6,931,872
Goods & Services 35,306,300 35,306,300 34,806,300 500,000
587 - New Ireland Provincial Administration 115,754,500 114,693,700 98,282,306 16,411,394
Personnel Emoluments 75,441,600 75,441,600 60,030,206 15,411,394
Goods & Services 40,312,900 39,252,100 38,252,100 1,000,000
588 - East New Britain Provincial Administration 167,317,100 168,041,100 183,138,767 (15,097,667)
Personnel Emoluments 89,124,600 89,124,600 104,222,267 (15,097,667)
Goods & Services 78,192,500 78,916,500 78,916,500 -
589 - West New Britain Provincial Administration 120,504,900 120,504,900 123,361,866 (2,856,966)
Personnel Emoluments 66,766,200 66,766,200 69,623,166 (2,856,966)
Goods & Services 53,738,700 53,738,700 53,738,700 -

80.
Attachment C Provinces - 2016 Personnel Emoluments and Goods and Services Expenditure
Agency 2016 Initial
Appropriation Revised Appropriation Total Expenditure Variance
590 - Autonomous Bougainville Administration 248,007,500 206,357,100 211,020,873 (4,663,773)
Personnel Emoluments 106,239,800 106,239,800 113,903,573 (7,663,773)
Goods & Services 141,767,700 100,117,300 97,117,300 3,000,000
591 - Hela Provincial Administration 133,444,974 105,152,774 108,336,828 (3,184,054)
Personnel Emoluments 31,775,263 31,775,263 44,359,317 (12,584,054)
Goods & Services 101,669,711 73,377,511 63,977,511 9,400,000
592 - Jiwaka Provincial Administration 100,719,013 100,988,413 117,998,617 (17,010,204)
Personnel Emoluments 33,805,008 33,805,008 55,715,212 (21,910,204)
Goods & Services 66,914,005 67,183,405 62,283,405 4,900,000
Grand Total 3,442,454,595 3,361,809,795 3,516,282,471 (154,472,676)
Source: Department of Treasury

81.
Attachment D: 2016 Personnel Emoluments and Goods and Services Expenditure under Provincial Government Grants & Subsidies Transfers
Agency 2016 Initial Appropriation Revised Appropriation Total Expenditure Variance
571 - Fly River Provincial Administration 113,973,400 111,984,000 126,012,747 (14,028,747)
Personnel Emoluments 51,873,500 51,873,500 65,902,247 (14,028,747)
PS Leave Fare 2,106,000 2,106,000 2,106,000 -
Retirement - - - -
Sal & Allow - - - -
Staffing Grants 20,482,800 20,482,800 14,109,473 6,373,327
Teach Leave 3,571,000 3,571,000 3,571,000 -
Teacher Sal Gr 25,713,700 25,713,700 46,115,774 (20,402,074)
Goods & Services 62,099,900 60,110,500 60,110,500 -
Admin Grant 161,500 161,500 161,500 -
C/Gr-SA & PA 33,500,000 31,510,600 25,510,600 6,000,000
Ed Function Gr 2,980,000 2,980,000 2,980,000 -
Health Funct Gr 3,814,300 3,814,300 3,814,300 -
Infrast. Grant 4,434,000 4,434,000 4,434,000 -
Land Mediation 75,800 75,800 75,800 -
LLG Vill Ser Gr 3,782,000 3,782,000 3,782,000 -
Op Exp (NP) 11,400,000 11,400,000 11,400,000 -
Prim Prod Gr 1,216,300 1,216,300 1,216,300 -
Serv Del Gr 561,800 561,800 561,800 -
SSG - - 6,000,000 (6,000,000)
Vill Courts Gr 174,200 174,200 174,200 -
572 - Gulf Provincial Administration 95,116,200 95,155,400 88,103,509 7,051,891
Personnel Emoluments 33,916,600 33,916,600 31,607,809 2,308,791
PS Leave Fare 500,000 500,000 411,400 88,600
Retirement - - - -
Sal & Allow - - - -
Staffing Grants 14,897,400 14,897,400 12,216,219 2,681,181
Teach Leave 800,000 800,000 626,700 173,300
Teacher Sal Gr 17,719,200 17,719,200 18,353,490 (634,290)
Goods & Services 61,199,600 61,238,800 56,495,700 4,743,100
Admin Grant 2,410,800 2,410,800 1,983,500 427,300
C/Gr-SA & PA 1,000,000 1,039,200 926,900 112,300
Ed Function Gr 4,844,600 4,844,600 3,985,800 858,800
Health Funct Gr 6,115,100 6,115,100 5,031,100 1,084,000
Infrast. Grant 7,199,800 7,199,800 5,923,500 1,276,300
Land Mediation 75,700 75,700 62,300 13,400
LLG Vill Ser Gr 3,075,700 3,075,700 3,075,700 -
Op Exp (NP) 22,000,000 22,000,000 22,000,000 -
Prim Prod Gr 2,461,100 2,461,100 2,024,800 436,300
Serv Del Gr 2,613,400 2,613,400 2,150,200 463,200

82.
Agency 2016 Initial Appropriation Revised Appropriation Total Expenditure Variance
Trf to Govt 9,000,000 9,000,000 9,000,000 -
Vill Courts Gr 403,400 403,400 331,900 71,500
573 - Central Provincial Administration 145,215,600 145,381,800 166,116,792 (20,734,992)
Personnel Emoluments 60,888,700 60,888,700 81,859,892 (20,971,192)
Overtime - - - -
PS Leave Fare 422,900 422,900 422,900 -
Retirement - - - -
Sal & Allow - - - -
Staffing Grants 16,962,800 16,962,800 17,217,431 (254,631)
Teach Leave 2,316,800 2,316,800 2,316,800 -
Teacher Sal Gr 41,186,200 41,186,200 61,902,761 (20,716,561)
Goods & Services 84,326,900 84,493,100 84,256,900 236,200
Admin Grant 1,917,500 1,917,500 1,917,500 -
C/Gr-SA & PA 350,000 516,200 516,200 -
Ed Function Gr 6,289,000 6,289,000 6,289,000 -
Health Funct Gr 6,073,200 6,073,200 6,073,200 -
Infrast. Grant 10,695,500 10,695,500 10,695,500 -
Land Mediation 65,000 65,000 65,000 -
LLG Vill Ser Gr 2,063,700 2,063,700 1,827,500 236,200
Op Exp (NP) 51,300,000 51,300,000 51,300,000 -
Prim Prod Gr 2,031,300 2,031,300 2,031,300 -
Serv Del Gr 3,137,700 3,137,700 3,137,700 -
Vill Courts Gr 404,000 404,000 404,000 -
574 - National Capital District 66,425,000 66,666,600 66,621,452 45,148
Personnel Emoluments - - (12,148) 12,148
Payroll Cost - - (12,148) 12,148
Goods & Services 66,425,000 66,666,600 66,633,600 33,000
C/Gr-SA & PA 40,000,000 40,241,600 40,241,600 -
CRI 20,000,000 20,000,000 20,000,000 -
Land Mediation 25,000 25,000 25,000 -
Op Exp (NP) 100,000 100,000 67,000 33,000
Town/Urban Serv 3,300,000 3,300,000 3,300,000 -
Training 3,000,000 3,000,000 3,000,000 -
575 - Milne Bay Provincial Administration 153,421,300 153,421,300 155,116,189 (1,694,889)
Personnel Emoluments 66,788,600 66,788,600 71,418,589 (4,629,989)
Payroll Cost - - - -
PS Leave Fare 400,000 400,000 400,000 -
Retirement - - - -
Sal & Allow - - - -
Staffing Grants 10,597,500 10,597,500 8,732,937 1,864,563
Teach Leave 1,500,000 1,500,000 1,500,000 -
Teacher Sal Gr 54,291,100 54,291,100 60,785,652 (6,494,552)
Goods & Services 86,632,700 86,632,700 83,697,600 2,935,100
Admin Grant 1,913,500 1,913,500 1,913,500 -
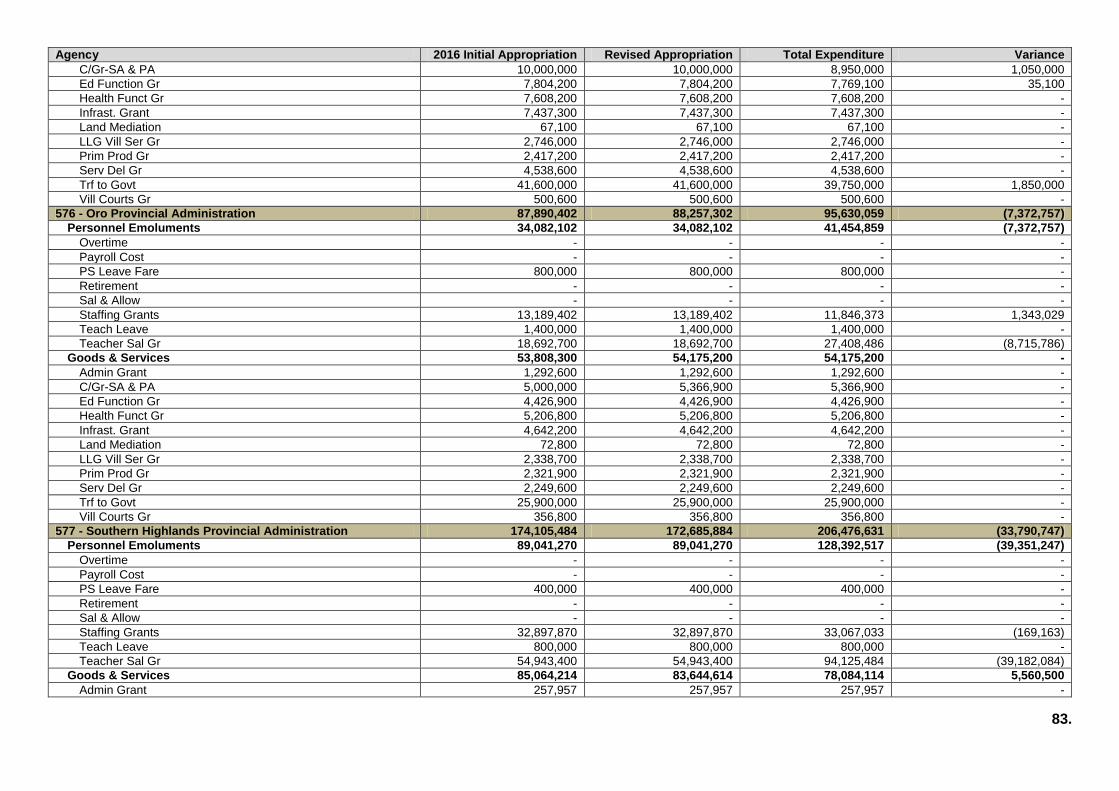
83.
Agency 2016 Initial Appropriation Revised Appropriation Total Expenditure Variance
C/Gr-SA & PA 10,000,000 10,000,000 8,950,000 1,050,000
Ed Function Gr 7,804,200 7,804,200 7,769,100 35,100
Health Funct Gr 7,608,200 7,608,200 7,608,200 -
Infrast. Grant 7,437,300 7,437,300 7,437,300 -
Land Mediation 67,100 67,100 67,100 -
LLG Vill Ser Gr 2,746,000 2,746,000 2,746,000 -
Prim Prod Gr 2,417,200 2,417,200 2,417,200 -
Serv Del Gr 4,538,600 4,538,600 4,538,600 -
Trf to Govt 41,600,000 41,600,000 39,750,000 1,850,000
Vill Courts Gr 500,600 500,600 500,600 -
576 - Oro Provincial Administration 87,890,402 88,257,302 95,630,059 (7,372,757)
Personnel Emoluments 34,082,102 34,082,102 41,454,859 (7,372,757)
Overtime - - - -
Payroll Cost - - - -
PS Leave Fare 800,000 800,000 800,000 -
Retirement - - - -
Sal & Allow - - - -
Staffing Grants 13,189,402 13,189,402 11,846,373 1,343,029
Teach Leave 1,400,000 1,400,000 1,400,000 -
Teacher Sal Gr 18,692,700 18,692,700 27,408,486 (8,715,786)
Goods & Services 53,808,300 54,175,200 54,175,200 -
Admin Grant 1,292,600 1,292,600 1,292,600 -
C/Gr-SA & PA 5,000,000 5,366,900 5,366,900 -
Ed Function Gr 4,426,900 4,426,900 4,426,900 -
Health Funct Gr 5,206,800 5,206,800 5,206,800 -
Infrast. Grant 4,642,200 4,642,200 4,642,200 -
Land Mediation 72,800 72,800 72,800 -
LLG Vill Ser Gr 2,338,700 2,338,700 2,338,700 -
Prim Prod Gr 2,321,900 2,321,900 2,321,900 -
Serv Del Gr 2,249,600 2,249,600 2,249,600 -
Trf to Govt 25,900,000 25,900,000 25,900,000 -
Vill Courts Gr 356,800 356,800 356,800 -
577 - Southern Highlands Provincial Administration 174,105,484 172,685,884 206,476,631 (33,790,747)
Personnel Emoluments 89,041,270 89,041,270 128,392,517 (39,351,247)
Overtime - - - -
Payroll Cost - - - -
PS Leave Fare 400,000 400,000 400,000 -
Retirement - - - -
Sal & Allow - - - -
Staffing Grants 32,897,870 32,897,870 33,067,033 (169,163)
Teach Leave 800,000 800,000 800,000 -
Teacher Sal Gr 54,943,400 54,943,400 94,125,484 (39,182,084)
Goods & Services 85,064,214 83,644,614 78,084,114 5,560,500
Admin Grant 257,957 257,957 257,957 -

84.
Agency 2016 Initial Appropriation Revised Appropriation Total Expenditure Variance
C/Gr-SA & PA 9,500,000 8,080,400 7,419,900 660,500
Ed Function Gr 3,414,054 3,414,054 3,414,054 -
Health Funct Gr 3,926,304 3,926,304 3,926,304 -
Infrast. Grant 3,050,101 3,050,101 3,050,101 -
Land Mediation 65,000 65,000 65,000 -
LLG Vill Ser Gr 3,182,410 3,182,410 3,182,410 -
Op Exp (NP) 50,000,000 50,000,000 50,000,000 -
Prim Prod Gr 634,722 634,722 634,722 -
Serv Del Gr 720,141 720,141 720,141 -
Trf to Govt 10,000,000 10,000,000 5,100,000 4,900,000
Vill Courts Gr 313,525 313,525 313,525 -
578 - Enga Provincial Administration 149,183,828 149,183,828 175,527,706 (26,343,878)
Personnel Emoluments 55,991,526 55,991,526 90,254,104 (34,262,578)
Overtime - - - -
Payroll Cost - - - -
PS Leave Fare 200,000 200,000 200,000 -
Retirement - - - -
Sal & Allow - - - -
Staffing Grants 19,596,198 19,596,198 13,028,371 6,567,827
Teach Leave 900,000 900,000 900,000 -
Teacher Sal Gr 35,295,328 35,295,328 76,125,733 (40,830,405)
Goods & Services 93,192,302 93,192,302 85,273,602 7,918,700
Admin Grant 1,868,806 1,868,806 1,868,806 -
C/Gr-SA & PA 2,000,000 2,000,000 2,000,000 -
Ed Function Gr 5,231,842 5,231,842 5,231,842 -
Health Funct Gr 4,999,961 4,999,961 4,999,961 -
Infrast. Grant 10,572,402 10,572,402 10,572,402 -
Land Mediation 65,565 65,565 65,565 -
LLG Vill Ser Gr 2,338,753 2,338,753 2,320,053 18,700
Op Exp (NP) 9,000,000 9,000,000 7,500,000 1,500,000
Prim Prod Gr 1,189,368 1,189,368 1,189,368 -
Serv Del Gr 3,036,263 3,036,263 3,036,263 -
Trf to Govt 52,500,000 52,500,000 46,100,000 6,400,000
Vill Courts Gr 389,342 389,342 389,342 -
579 - Western Highlands Provincial Administration 169,662,590 166,662,590 180,421,234 (13,758,644)
Personnel Emoluments 82,602,200 82,602,200 102,260,844 (19,658,644)
Overtime - - - -
Payroll Cost - - - -
PS Leave Fare 400,000 400,000 400,000 -
Retirement - - - -
Sal & Allow - - - -
Staffing Grants 10,630,400 10,630,400 12,963,774 (2,333,374)
Teach Leave 1,100,000 1,100,000 1,100,000 -
Teacher Sal Gr 70,471,800 70,471,800 87,797,070 (17,325,270)

85.
Agency 2016 Initial Appropriation Revised Appropriation Total Expenditure Variance
Goods & Services 87,060,390 84,060,390 78,160,390 5,900,000
Admin Grant 967,859 967,859 967,859 -
Ed Function Gr 6,092,884 6,092,884 6,092,884 -
Health Funct Gr 4,467,280 4,467,280 4,467,280 -
Infrast. Grant 8,700,953 8,700,953 8,700,953 -
Land Mediation 78,782 78,782 78,782 -
LLG Vill Ser Gr 2,180,399 2,180,399 2,180,399 -
Op Exp (NP) 16,000,000 13,000,000 11,000,000 2,000,000
Prim Prod Gr 1,325,241 1,325,241 1,325,241 -
Serv Del Gr 1,946,212 1,946,212 1,946,212 -
Trf to Govt 44,900,000 44,900,000 41,000,000 3,900,000
Vill Courts Gr 400,780 400,780 400,780 -
580 - Simbu Provincial Administration 183,155,290 183,796,590 198,480,130 (14,683,540)
Personnel Emoluments 72,901,000 72,901,000 92,484,540 (19,583,540)
Overtime - - - -
Payroll Cost - - - -
PS Leave Fare 200,000 200,000 200,000 -
Sal & Allow - - - -
Staffing Grants 16,435,000 16,435,000 21,578,261 (5,143,261)
Teach Leave 800,000 800,000 800,000 -
Teacher Sal Gr 55,466,000 55,466,000 69,906,279 (14,440,279)
Goods & Services 110,254,290 110,895,590 105,995,590 4,900,000
Admin Grant 2,848,216 2,848,216 2,848,216 -
C/Gr-SA & PA - 641,300 641,300 -
Ed Function Gr 9,362,153 9,362,153 9,362,153 -
Health Funct Gr 7,680,875 7,680,875 7,680,875 -
Infrast. Grant 10,576,015 10,576,015 10,576,015 -
Land Mediation 75,208 75,208 75,208 -
LLG Vill Ser Gr 1,724,500 1,724,500 1,724,500 -
Op Exp (NP) 11,000,000 11,000,000 10,000,000 1,000,000
Prim Prod Gr 1,882,581 1,882,581 1,882,581 -
Serv Del Gr 3,416,466 3,416,466 3,416,466 -
Trf to Govt 61,000,000 61,000,000 57,100,000 3,900,000
Vill Courts Gr 688,276 688,276 688,276 -
581 - Eastern Highlands Provincial Administration 233,768,704 233,768,704 238,627,140 (4,858,436)
Personnel Emoluments 91,818,500 91,818,500 106,576,936 (14,758,436)
Payroll Cost - - - -
PS Leave Fare 700,000 700,000 700,000 -
Retirement - - - -
Sal & Allow - - - -
Staffing Grants 16,587,700 16,587,700 9,625,967 6,961,733
Teach Leave 1,000,000 1,000,000 1,000,000 -
Teacher Sal Gr 73,530,800 73,530,800 95,250,969 (21,720,169)
Goods & Services 141,950,204 141,950,204 132,050,204 9,900,000

86.
Agency 2016 Initial Appropriation Revised Appropriation Total Expenditure Variance
Admin Grant 3,166,154 3,166,154 3,166,154 -
Ed Function Gr 10,811,446 10,811,446 10,811,446 -
Health Funct Gr 7,594,914 7,594,914 7,594,914 -
Infrast. Grant 17,590,320 17,590,320 17,590,320 -
Land Mediation 75,213 75,213 75,213 -
LLG Vill Ser Gr 2,737,361 2,737,361 2,737,361 -
Op Exp (NP) 12,200,000 12,200,000 9,200,000 3,000,000
Prim Prod Gr 2,865,759 2,865,759 2,865,759 -
Serv Del Gr 4,055,583 4,055,583 4,055,583 -
Trf to Govt 80,200,000 80,200,000 73,300,000 6,900,000
Vill Courts Gr 653,454 653,454 653,454 -
582 - Morobe Provincial Administration 298,451,300 299,345,700 295,381,606 3,964,094
Personnel Emoluments 179,869,700 179,869,700 182,385,777 (2,516,077)
Overtime - - - -
Payroll Cost - - - -
PS Leave Fare 1,400,000 1,400,000 1,400,000 -
Retirement - - - -
Sal & Allow - - - -
Staffing Grants 43,919,100 43,919,100 33,785,535 10,133,565
Teach Leave 5,000,000 5,000,000 5,000,000 -
Teacher Sal Gr 129,550,600 129,550,600 142,200,241 (12,649,641)
Goods & Services 118,581,600 119,476,000 112,995,829 6,480,171
Admin Grant 585,300 585,300 585,300 -
C/Gr-SA & PA 500,000 1,394,400 894,400 500,000
Ed Function Gr 2,000,000 2,000,000 2,000,000 -
Health Funct Gr 1,275,800 1,275,800 1,275,800 -
Infrast. Grant 2,266,300 2,266,300 2,266,300 -
Land Mediation 65,000 65,000 65,000 -
LLG Vill Ser Gr 6,999,400 6,999,400 6,919,229 80,171
Op Exp (NP) 17,300,000 17,300,000 17,300,000 -
Prim Prod Gr 465,300 465,300 465,300 -
Serv Del Gr 967,500 967,500 967,500 -
Trf to Govt 86,000,000 86,000,000 80,100,000 5,900,000
Vill Courts Gr 157,000 157,000 157,000 -
583 - Madang Provincial Administration 228,278,600 228,937,600 235,116,593 (6,178,993)
Personnel Emoluments 108,053,500 108,053,500 122,132,493 (14,078,993)
Payroll Cost - - - -
PS Leave Fare 800,000 800,000 800,000 -
Retirement - - - -
Sal & Allow - - - -
Staffing Grants 33,232,100 33,232,100 26,017,288 7,214,812
Teach Leave 1,700,000 1,700,000 1,700,000 -
Teacher Sal Gr 72,321,400 72,321,400 93,615,204 (21,293,804)
Goods & Services 120,225,100 120,884,100 112,984,100 7,900,000
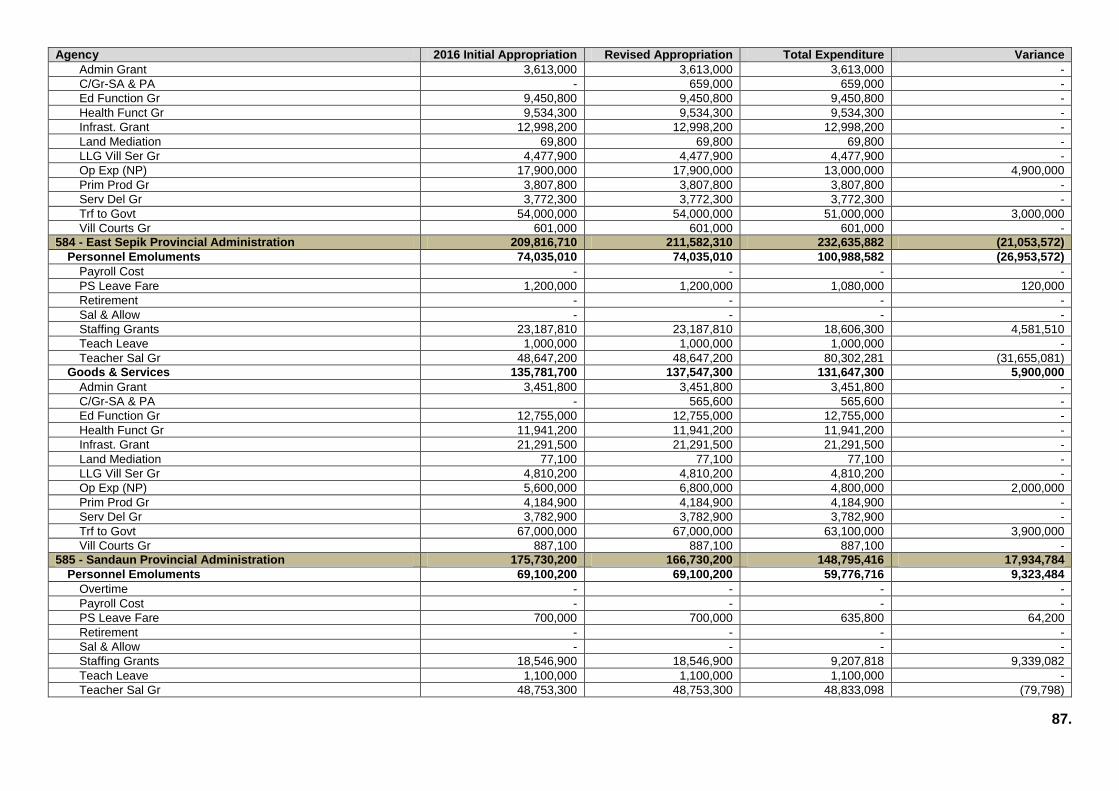
87.
Agency 2016 Initial Appropriation Revised Appropriation Total Expenditure Variance
Admin Grant 3,613,000 3,613,000 3,613,000 -
C/Gr-SA & PA - 659,000 659,000 -
Ed Function Gr 9,450,800 9,450,800 9,450,800 -
Health Funct Gr 9,534,300 9,534,300 9,534,300 -
Infrast. Grant 12,998,200 12,998,200 12,998,200 -
Land Mediation 69,800 69,800 69,800 -
LLG Vill Ser Gr 4,477,900 4,477,900 4,477,900 -
Op Exp (NP) 17,900,000 17,900,000 13,000,000 4,900,000
Prim Prod Gr 3,807,800 3,807,800 3,807,800 -
Serv Del Gr 3,772,300 3,772,300 3,772,300 -
Trf to Govt 54,000,000 54,000,000 51,000,000 3,000,000
Vill Courts Gr 601,000 601,000 601,000 -
584 - East Sepik Provincial Administration 209,816,710 211,582,310 232,635,882 (21,053,572)
Personnel Emoluments 74,035,010 74,035,010 100,988,582 (26,953,572)
Payroll Cost - - - -
PS Leave Fare 1,200,000 1,200,000 1,080,000 120,000
Retirement - - - -
Sal & Allow - - - -
Staffing Grants 23,187,810 23,187,810 18,606,300 4,581,510
Teach Leave 1,000,000 1,000,000 1,000,000 -
Teacher Sal Gr 48,647,200 48,647,200 80,302,281 (31,655,081)
Goods & Services 135,781,700 137,547,300 131,647,300 5,900,000
Admin Grant 3,451,800 3,451,800 3,451,800 -
C/Gr-SA & PA - 565,600 565,600 -
Ed Function Gr 12,755,000 12,755,000 12,755,000 -
Health Funct Gr 11,941,200 11,941,200 11,941,200 -
Infrast. Grant 21,291,500 21,291,500 21,291,500 -
Land Mediation 77,100 77,100 77,100 -
LLG Vill Ser Gr 4,810,200 4,810,200 4,810,200 -
Op Exp (NP) 5,600,000 6,800,000 4,800,000 2,000,000
Prim Prod Gr 4,184,900 4,184,900 4,184,900 -
Serv Del Gr 3,782,900 3,782,900 3,782,900 -
Trf to Govt 67,000,000 67,000,000 63,100,000 3,900,000
Vill Courts Gr 887,100 887,100 887,100 -
585 - Sandaun Provincial Administration 175,730,200 166,730,200 148,795,416 17,934,784
Personnel Emoluments 69,100,200 69,100,200 59,776,716 9,323,484
Overtime - - - -
Payroll Cost - - - -
PS Leave Fare 700,000 700,000 635,800 64,200
Retirement - - - -
Sal & Allow - - - -
Staffing Grants 18,546,900 18,546,900 9,207,818 9,339,082
Teach Leave 1,100,000 1,100,000 1,100,000 -
Teacher Sal Gr 48,753,300 48,753,300 48,833,098 (79,798)

88.
Agency 2016 Initial Appropriation Revised Appropriation Total Expenditure Variance
Goods & Services 106,630,000 97,630,000 89,018,700 8,611,300
Admin Grant 3,871,300 3,871,300 3,516,400 354,900
C/Gr-SA & PA 6,000,000 7,000,000 7,000,000 -
CRI 9,000,000 - - -
Ed Function Gr 10,061,800 10,061,800 9,139,500 922,300
Health Funct Gr 10,696,000 10,696,000 9,715,500 980,500
Infrast. Grant 8,392,500 8,392,500 7,623,200 769,300
Land Mediation 72,400 72,400 65,800 6,600
LLG Vill Ser Gr 4,443,100 4,443,100 4,443,100 -
Op Exp (NP) 1,000,000 - - -
Prim Prod Gr 4,073,600 4,073,600 3,700,200 373,400
Serv Del Gr 2,914,600 2,914,600 2,647,400 267,200
Trf to Govt 45,700,000 45,700,000 40,800,000 4,900,000
Vill Courts Gr 404,700 404,700 367,600 37,100
586 - Manus Provincial Administration 72,512,000 72,512,000 65,080,128 7,431,872
Personnel Emoluments 37,205,700 37,205,700 30,273,828 6,931,872
PS Leave Fare 500,000 500,000 500,000 -
Retirement - - - -
Sal & Allow - - - -
Staffing Grants 14,323,300 14,323,300 8,111,189 6,212,111
Teach Leave 550,000 550,000 550,000 -
Teacher Sal Gr 21,832,400 21,832,400 21,112,639 719,761
Goods & Services 35,306,300 35,306,300 34,806,300 500,000
Admin Grant 1,066,100 1,066,100 1,066,100 -
Ed Function Gr 2,977,900 2,977,900 2,977,900 -
Health Funct Gr 2,492,700 2,492,700 2,492,700 -
Infrast. Grant 4,059,000 4,059,000 4,059,000 -
Land Mediation 65,000 65,000 65,000 -
LLG Vill Ser Gr 746,200 746,200 746,200 -
Op Exp (NP) 1,700,000 1,700,000 1,700,000 -
Prim Prod Gr 998,600 998,600 998,600 -
Serv Del Gr 1,419,100 1,419,100 1,419,100 -
Trf to Govt 19,500,000 19,500,000 19,000,000 500,000
Vill Courts Gr 281,700 281,700 281,700 -
587 - New Ireland Provincial Administration 115,754,500 114,693,700 98,282,306 16,411,394
Personnel Emoluments 75,441,600 75,441,600 60,030,206 15,411,394
Overtime - - - -
Payroll Cost - - - -
PS Leave Fare 350,000 350,000 350,000 -
Retirement - - - -
Sal & Allow - - - -
Staffing Grants 25,179,600 25,179,600 14,869,985 10,309,615
Teach Leave 850,000 850,000 850,000 -
Teacher Sal Gr 49,062,000 49,062,000 43,960,221 5,101,779

89.
Agency 2016 Initial Appropriation Revised Appropriation Total Expenditure Variance
Goods & Services 40,312,900 39,252,100 38,252,100 1,000,000
Admin Grant 203,600 203,600 203,600 -
C/Gr-SA & PA 1,500,000 1,939,200 1,939,200 -
Ed Function Gr 965,500 965,500 965,500 -
Health Funct Gr 1,051,100 1,051,100 1,051,100 -
Infrast. Grant 1,013,200 1,013,200 1,013,200 -
Land Mediation 73,900 73,900 73,900 -
LLG Vill Ser Gr 1,395,000 1,395,000 1,395,000 -
Op Exp (NP) 5,300,000 5,300,000 5,300,000 -
Prim Prod Gr 453,700 453,700 453,700 -
Serv Del Gr 211,400 211,400 211,400 -
Trf to Govt 28,100,000 26,600,000 25,600,000 1,000,000
Vill Courts Gr 45,500 45,500 45,500 -
588 - East New Britain Provincial Administration 167,317,100 168,041,100 183,138,767 (15,097,667)
Personnel Emoluments 89,124,600 89,124,600 104,222,267 (15,097,667)
Payroll Cost - - - -
PS Leave Fare 500,000 500,000 500,000 -
Retirement - - - -
Sal & Allow - - - -
Staffing Grants 24,442,200 24,442,200 20,876,083 3,566,117
Teach Leave 1,100,000 1,100,000 1,100,000 -
Teacher Sal Gr 63,082,400 63,082,400 81,746,184 (18,663,784)
Goods & Services 78,192,500 78,916,500 78,916,500 -
Admin Grant 504,100 504,100 504,100 -
C/Gr-SA & PA - 724,000 724,000 -
Ed Function Gr 6,567,700 6,567,700 6,567,700 -
Health Funct Gr 4,290,200 4,290,200 4,290,200 -
Infrast. Grant 6,129,800 6,129,800 6,129,800 -
Land Mediation 74,800 74,800 74,800 -
LLG Vill Ser Gr 3,475,000 3,475,000 3,475,000 -
Op Exp (NP) 6,000,000 6,000,000 6,000,000 -
Prim Prod Gr 1,897,500 1,897,500 1,897,500 -
Serv Del Gr 3,217,600 3,217,600 3,217,600 -
Trf to Govt 45,800,000 45,800,000 45,800,000 -
Vill Courts Gr 235,800 235,800 235,800 -
589 - West New Britain Provincial Administration 120,504,900 120,504,900 123,361,866 (2,856,966)
Personnel Emoluments 66,766,200 66,766,200 69,623,166 (2,856,966)
Overtime - - - -
Payroll Cost - - (15,597) 15,597
PS Leave Fare 1,250,000 1,250,000 1,250,000 -
Retirement - - 18,397 (18,397)
Sal & Allow - - (2,800) 2,800
Staffing Grants 17,808,200 17,808,200 11,965,757 5,842,443
Teach Leave 3,000,000 3,000,000 3,000,000 -

90.
Agency 2016 Initial Appropriation Revised Appropriation Total Expenditure Variance
Teacher Sal Gr 44,708,000 44,708,000 53,407,409 (8,699,409)
Goods & Services 53,738,700 53,738,700 53,738,700 -
Admin Grant 963,700 963,700 963,700 -
Ed Function Gr 5,868,100 5,868,100 5,868,100 -
Health Funct Gr 4,794,100 4,794,100 4,794,100 -
Infrast. Grant 3,829,800 3,829,800 3,829,800 -
Land Mediation 77,900 77,900 77,900 -
LLG Vill Ser Gr 2,074,600 2,074,600 2,074,600 -
Op Exp (NP) 1,100,000 1,100,000 1,100,000 -
Prim Prod Gr 2,854,600 2,854,600 2,854,600 -
Serv Del Gr 1,822,600 1,822,600 1,822,600 -
Trf to Govt 30,000,000 30,000,000 30,000,000 -
Vill Courts Gr 353,300 353,300 353,300 -
590 - Autonomous Bougainville Administration 248,007,500 206,357,100 211,020,873 (4,663,773)
Personnel Emoluments 106,239,800 106,239,800 113,903,573 (7,663,773)
ABG Community A 1,500,000 1,500,000 1,500,000 -
ABG Electoral C 1,700,000 1,700,000 1,700,000 -
Overtime - - - -
Parlimentary Se 9,000,000 9,000,000 9,000,000 -
PS Leave Fare 300,000 300,000 300,000 -
Retirement - - - -
Sal & Allow - - - -
Staffing Grants 40,269,600 40,269,600 33,232,087 7,037,513
Teach Leave 1,500,000 1,500,000 1,500,000 -
Teacher Sal Gr 51,970,200 51,970,200 66,671,486 (14,701,286)
Goods & Services 141,767,700 100,117,300 97,117,300 3,000,000
ABG Chief Tax C 2,500,000 2,500,000 2,500,000 -
C/Gr-SA & PA 10,000,000 8,349,600 8,349,600 -
Funct/Pwrs 400,000 400,000 400,000 -
G&S Gr-ABG 15,000,000 15,000,000 15,000,000 -
Land Mediation 65,000 65,000 65,000 -
Op Exp (NP) 3,000,000 3,000,000 3,000,000 -
P&S Gr-ABG 3,802,700 3,802,700 3,802,700 -
Trf to Govt 107,000,000 67,000,000 64,000,000 3,000,000
591 - Hela Provincial Administration 133,444,974 105,152,774 108,336,828 (3,184,054)
Personnel Emoluments 31,775,263 31,775,263 44,359,317 (12,584,054)
Payroll Cost - - - -
PS Leave Fare 150,000 150,000 150,000 -
Sal & Allow - - - -
Staffing Grants 11,919,373 11,919,373 16,776,039 (4,856,666)
Teach Leave 250,000 250,000 250,000 -
Teacher Sal Gr 19,455,890 19,455,890 27,183,278 (7,727,388)
Goods & Services 101,669,711 73,377,511 63,977,511 9,400,000
Admin Grant 1,567,772 1,567,772 1,567,772 -

91.
Agency 2016 Initial Appropriation Revised Appropriation Total Expenditure Variance
C/Gr-SA & PA 4,500,000 4,707,800 3,207,800 1,500,000
CRI 15,000,000 3,000,000 3,000,000 -
Ed Function Gr 2,673,257 2,673,257 2,673,257 -
Health Funct Gr 4,387,311 4,387,311 4,387,311 -
Infrast. Grant 2,912,142 2,912,142 2,912,142 -
Land Mediation 73,295 73,295 73,295 -
LLG Vill Ser Gr 2,312,900 2,312,900 2,312,900 -
Op Exp (NP) 28,600,000 12,100,000 12,100,000 -
Prim Prod Gr 1,125,359 1,125,359 1,125,359 -
Serv Del Gr 1,319,722 1,319,722 1,319,722 -
Trf to Govt 37,000,000 37,000,000 29,100,000 7,900,000
Vill Courts Gr 197,953 197,953 197,953 -
592 - Jiwaka Provincial Administration 100,719,013 100,988,413 117,998,617 (17,010,204)
Personnel Emoluments 33,805,008 33,805,008 55,715,212 (21,910,204)
Payroll Cost - - - -
PS Leave Fare 100,000 100,000 100,000 -
Retirement - - - -
Sal & Allow - - 10,582,489 (10,582,489)
Staffing Grants 6,711,908 6,711,908 562,746 6,149,162
Teach Leave 400,000 400,000 400,000 -
Teacher Sal Gr 26,593,100 26,593,100 44,069,977 (17,476,877)
Goods & Services 66,914,005 67,183,405 62,283,405 4,900,000
Admin Grant 1,872,548 1,872,548 1,872,548 -
C/Gr-SA & PA 3,000,000 3,269,400 3,269,400 -
Ed Function Gr 5,622,905 5,622,905 5,622,905 -
Health Funct Gr 4,568,531 4,568,531 4,568,531 -
Infrast. Grant 9,317,776 9,317,776 9,317,776 -
Land Mediation 75,330 75,330 75,330 -
LLG Vill Ser Gr 875,040 875,040 875,040 -
Prim Prod Gr 1,135,693 1,135,693 1,135,693 -
Serv Del Gr 1,893,152 1,893,152 1,893,152 -
Trf to Govt 38,200,000 38,200,000 33,300,000 4,900,000
Vill Courts Gr 353,030 353,030 353,030 -
Grand Total 3,442,454,595 3,361,809,795 3,516,282,471 (154,472,676)
Source: Department of Treasury

92.
Appendix 1 – Movements of Funds in Trust Accounts 2016 Table A1: Movement of funds in Trust Accounts 1st January to 31st December 2016 (Kina, millions)
Description Balance
as at 1-Jan-16
Debit (Receipt)
Credit (Payment)
Balance as at
31-Dec-16
Outstanding Special Support Grants 0.1 0.0 0.0 0.1
Education Sector Infrastructure Rehabilitation 0.3 0.0 0.3 0.0
Higher Education Sector Infrastructure Rehabilitation 20.1 4.2 0.0 24.2
National Parliament Infrastructure Rehabilitation 0.0 0.0 0.0 0.0
Transport Sector Infrastructure Rehabilitation 9.3 0.0 9.3 0.0
Resettlement of Rabaul Volcano Victims 0.2 0.0 -0.0 0.2
Hospital and Healthcare Centre Rehabilitation 0.3 0.0 0.0 0.3
Rehabilitation of Housing for Nurses 0.2 0.0 0.2 0.0
Rehabilitation of Housing for Police 7.9 0.0 7.9 0.0
Highlands Highway Rehabilitation 0.0 0.0 0.0 0.0
District Services Improvement Program 18.9 0.0 18.9 0.0
Urbanisation Pilot 0.1 0.0 -0.0 0.1
Housing Development Pilot 0.0 0.0 0.0 0.0
National Aids Council Secretariat 1.6 0.0 1.3 0.3
Lae City Roads Rehabilitation 0.0 0.0 0.0 0.0
Madang Marine Park Development 3.2 0.0 0.1 3.1
Konebada Petroleum Park 0.0 0.0 0.0 0.0
Central City 34.9 0.0 0.9 34.0
Petroleum Outstanding Commitments 0.0 0.0 0.0 0.0
Infrastructure Development Grants 50.5 0.0 0.0 50.5
Coastal Vessels 0.1 0.0 0.0 0.1
PNG LNG High Impact Infrastructure 0.7 0.0 0.0 0.7
Port Moresby Roads 0.0 0.0 0.0 0.0
District Offices Rehabilitation 0.4 0.0 0.4 0.0
Rural District Roads Support 2.1 0.0 2.1 0.0
Mining Legal Costs 0.1 0.0 -0.0 0.1
Variarata National Park Rehabilitation 0.0 0.0 0.0 0.0
REDD Program 0.0 0.0 -0.0 0.0
Provincial Government Members entitlement 0.0 0.0 0.0 0.0
Outstanding MOA Liabilities 0.0 0.0 0.0 0.0
Kokopau to Arawa Road Upgrading 0.0 0.0 0.0 0.0
Coastal Fisheries Development Program 0.1 0.0 0.1 0.0
National High School Renovation and Upgrading 0.0 0.0 0.0 0.0
Trans East-West New Britain Highway 0.1 0.0 0.0 0.1
Central Malalaua Highway 0.0 0.0 0.0 0.0
Tuition Fee Free Education 72.1 601.9 655.3 18.7
2015 Pacific Games 11.1 0.0 -0.0 11.1
Port Moresby General Hospital Infrastructure and Improvement 0.0 0.0 0.0 0.0
Defence Barracks Maintenance and Improvement 0.0 0.0 0.0 0.0
LNG Project Development Cost 0.0 0.8 0.0 0.8
2010 National Census 0.0 0.0 0.0 0.0
PNG LNG Additional Equity 0.7 0.0 -0.0 0.7
Public Service Audit Program 1.1 0.0 0.4 0.8
Regional, Provincial Treasury and District Admin Office 0.2 0.0 0.2 0.0
PNG Fire Service Infrastructure Rehab 1.7 0.0 0.0 1.7
ABG Mining 0.4 0.0 0.0 0.4
PNG Customs Technology 8.5 0.0 0.0 8.5
Restoration and Development Grant (ABG) 30.7 0.0 20.6 10.1
Trade Skills Scholarships 2.7 0.0 0.6 2.0
Rural Airstrip Rehabilitation & Maintenance Prog 1.3 0.0 -0.0 1.3
Special Intervention Fund 37.2 14.0 51.1 0.0
TOTAL 318.8 621.0 769.8 169.9 Source: Department of Finance

93.
Appendix 2 – Movements of Funds for DSIP Trust Accounts Table A2 below shows the movements of funds for each of the 89 DSIP subsidiary Trust Accounts Table 2: Movement of funds in DSIP Trust Accounts 1st January to 31st December, 2016 (Kina, millions)
District Balance as at
1-Jan-16 DSIP Debits
(Receipts) Non DSIP Deposits
Credits (Payments)
Balance as at 31-Dec-16
Abau 0.0 0.0 0.0 0.0 0.0
Goilala 2,610.5 0.0 0.0 2,610.5 0.0
Kairuku Hiri 34,603.2 0.0 0.0 34,603.2 0.0
Rigo 1,262.1 0.0 0.0 1,262.1 0.0
Gazelle 26,005.7 0.0 0.0 26,005.7 0.0
Kokopo 13,939.8 0.0 0.0 13,939.8 0.0
Pomio 7,694.4 0.0 0.0 7,694.4 0.0
Rabaul 108.4 0.0 0.0 108.4 0.0
Ambunti-Drekikir 26,840.0 0.0 0.0 26,840.0 0.0
Angoram 2,275,573.8 0.0 0.0 2,275,573.8 0.0
Maprik 409,075.1 0.0 0.0 409,075.1 0.0
Wewak 1,906,835.6 0.0 0.0 1,906,835.6 0.0
Wosera-Gawi 69,743.8 0.0 0.0 69,743.8 0.0
Yangogoru-Saussia 0.0 0.0 0.0 0.0 0.0
Daulo 35,263.0 0.0 0.0 35,263.0 0.0
Goroka 57,265.7 0.0 0.0 57,265.7 0.0
Henganofi 4,795.0 0.0 0.0 4,795.0 0.0
Kainantu 943.6 0.0 0.0 943.6 0.0
Lufa 14,066.8 0.0 0.0 14,066.8 0.0
Obura-Wonenara 0.0 0.0 0.0 0.0 0.0
Okapa 4,867.5 0.0 0.0 4,867.5 0.0
Unggai-Bena 0.0 0.0 0.0 0.0 0.0
Kandep 13,108.3 0.0 0.0 13,108.3 0.0
Kompiam-Ambum 6,500.6 0.0 0.0 6,500.6 0.0
Lagaip-Porgera 1,524.3 0.0 0.0 1,524.3 0.0
Wabag 26,705.4 0.0 0.0 26,705.4 0.0
Wapenamanda 0.0 0.0 0.0 0.0 0.0
Kerema 12,549.0 0.0 0.0 12,549.0 0.0
Kikori 3,812.0 0.0 0.0 3,812.0 0.0
Bogia 292,244.4 0.0 0.0 292,244.4 0.0
Madang 233,291.6 0.0 0.0 233,291.6 0.0
Middle Ramu 1,960.5 0.0 0.0 1,960.5 0.0
Raikos 1,729.9 0.0 0.0 1,729.9 0.0
Sumkar 0.0 0.0 0.0 0.0 0.0
Usino-Bundi 72,982.9 0.0 0.0 72,982.9 0.0
Manus 5,005,730.2 0.0 0.0 5,005,730.2 0.0
Alotau / Rabaraba 16,501.0 0.0 0.0 16,501.0 0.0
Esa'ala 351,169.6 0.0 0.0 351,169.6 0.0
Kiriwina 209,911.5 0.0 0.0 209,911.5 0.0
Samarai Murua 3,606.1 0.0 0.0 3,606.1 0.0
Bulolo 21,343.6 0.0 0.0 21,343.6 0.0
Finschaffen 975.0 0.0 0.0 975.0 0.0
Huon Gulf 51,348.2 0.0 0.0 51,348.2 0.0
Kabwum 0.0 0.0 0.0 0.0 0.0
Lae 279.4 0.0 0.0 279.4 0.0
Markham 534,561.9 0.0 0.0 534,561.9 0.0
Menyamya 12,304.7 0.0 0.0 12,304.7 0.0
Nawaeb 136,379.3 0.0 0.0 136,379.3 0.0
Tewa-Siasi 879,259.2 0.0 0.0 879,259.2 0.0
Moresby North 120,941.9 0.0 0.0 120,941.9 0.0
Moresby North West 0.0 0.0 0.0 0.0 0.0
Moresby South 32,367.2 0.0 0.0 32,367.2 0.0
Kavieng 295,301.3 0.0 0.0 295,301.3 0.0
Namatanai 853,736.0 0.0 0.0 853,736.0 0.0
Central Bougainville 10,132.2 0.0 0.0 10,132.2 0.0
North Bougainville 7,990.4 0.0 0.0 7,990.4 0.0
South Bougainville 96,530.8 0.0 0.0 96,530.8 0.0
Ijivitari 3,340.3 0.0 0.0 3,340.3 0.0
Sohe 24,202.0 0.0 0.0 24,202.0 0.0

94.
District Balance as at
1-Jan-16 DSIP Debits
(Receipts) Non DSIP Deposits
Credits (Payments)
Balance as at 31-Dec-16
Aitape-Lumi 28,823.1 0.0 0.0 28,823.1 0.0
Nuku 0.0 0.0 0.0 0.0 0.0
Telefomin 0.0 0.0 0.0 0.0 0.0
Vanimo-Green 3,826,243.2 0.0 0.0 3,826,243.2 0.0
Chuave 12,875.2 0.0 0.0 12,875.2 0.0
Gumine 0.0 0.0 0.0 0.0 0.0
Karamui-Nomane 31,861.8 0.0 0.0 31,861.8 0.0
Kerowagi 1,009.4 0.0 0.0 1,009.4 0.0
Kundiawa-Gembogl 21,871.1 0.0 0.0 21,871.1 0.0
Sinasina-Yongumugl 0.0 0.0 0.0 0.0 0.0
Ialibu-Pangia 1,548.6 0.0 0.0 1,548.6 0.0
Imbongu -10.6 0.0 0.0 -10.6 0.0
Kagua-Erave 74,255.4 0.0 0.0 74,255.4 0.0
Komo-Magarima 0.0 0.0 0.0 0.0 0.0
Koroba-L/Kopiago 28,371.1 0.0 0.0 28,371.1 0.0
Mendi 0.0 0.0 0.0 0.0 0.0
Nipa-Kutubu 8,321.4 0.0 0.0 8,321.4 0.0
Tari-Pori 29,346.8 0.0 0.0 29,346.8 0.0
Kandrian 0.0 0.0 0.0 0.0 0.0
Talasea 2,366.4 0.0 0.0 2,366.4 0.0
Middle Fly 168,014.0 0.0 0.0 168,014.0 0.0
North Fly 19,562.0 0.0 0.0 19,562.0 0.0
South Fly 1,135.1 0.0 0.0 1,135.1 0.0
Dei 251,484.9 0.0 0.0 251,484.9 0.0
Hagen 11,539.2 0.0 0.0 11,539.2 0.0
Jimi 0.0 0.0 0.0 0.0 0.0
Mul/Bayer 124,515.4 0.0 0.0 124,515.4 0.0
North Waghi 550.6 0.0 0.0 550.6 0.0
South Waghi 0.0 0.0 0.0 0.0 0.0
Tambul-Nebiler 1,376.8 0.0 0.0 1,376.8 0.0
Total 18,870,875.6 0.0 0.0 18,870,875.6 0.0
Source: Department of Finance

95.
Appendix 3 Table A3 below presents a status update on the major Public Investment Program projects of 2016. Many projects have seen significant progress in 2016 and thus contributed to establishing the enablers of growth and development. For more detailed and comprehensive information on the progress of all major commitments of the government, the reader is kindly referred to the National Government Critical Activity Matrix Report, and the 2016 Annual PIP report, published by the Department of National Planning. Table A3: Actual Expenditure and Project Status of major Public Investment Program Projects (Kina Millions)
PROJECTS 2016
Budget 2016 Supp.
Budget 2016
Warrants 2016
Outcome % complete
PROJECT STATUS
Provincial Hospitals Infrastructure 225.0 160.0 23.0 23.0 70% Coverage of 70% Provincial Hospitals infrastructures and hospital housing renovation are completed and are operating in its standards.
Infrastructure Development Grant 120.0 90.0 90.0 60.0 80% Funds have been released to projects, however recipient provinces need to provide acquittals for the use of these funds.
Highlands Highway - Lae - Komo Upgrading & Sealing
100.0 75.0 75.0 75.0 0.0% At the Tender Stages
Court House Design and Maintenance 80.0 80.0 80.0 80.0 15% Fully funded in 2016. Contract awarded and construction in progress Hagen and Waigani Court house is now into its finishing stage.
Special Interventions Program -Bougainville 70.0 30.0 30.0 30.0 65% Programs has been tender and procurement initial stages project in progress
Tourism Infrastructure Program 50.0 5.0 5.0 5.0 45% Contracts awarded and Development to Regional Cities
Lae-Nadzab Road (4Lane) 45.0 45.0 45.0 45.0 75% Along the Lae to Nazab 65% of the road 4mile to 9mile development complete to standards it has come to a halt due to Land disputes.
Agriculture and SME Funding 35.0 7.3 7.3 7.3 75% Recapitalization of the Agriculture SME lending portfolios are ongoing where most PNGeans has buy into and has seen 100% impact in informal sector. Though there were cuts in budgets.
Additional MOAs 27.7 11.7 11.7 5.1 55% Fix commitment and a ongoing government obligation disbursing funds to impact resource provinces.
Identity Card (with Biometrics) 20.0 20.0 20.0 19.7 15% The project is in progress. The project coverage has rolled out to 11 provinces the PSC has been established and need more clarity with reporting.
National Land and Housing Program 20.0 20.0 20.0 20.0 15% Work at Gerehu Stage 3B is progressing in development contracts has been award to Chinese Rail Road contractor for service development.
Port Moresby City Roads 20.0 20.0 20.0 20.0 100% Since contracts awarded back in 2013 have seen that all the major road construction have been completed *Gerehu – Hanuabada 100%, Hubert Murray Highway100%, 2-mile

96.
PROJECTS 2016
Budget 2016 Supp.
Budget 2016
Warrants 2016
Outcome % complete
PROJECT STATUS
Badili completed 100%, Kookaburra Flyover 100%, 9mile – Gerehu 100%
Port Moresby General Hospital Rehabilitation 20.0 20.0 20.0 20.0 70% POMGEN has been renovated and its now into its finishing stage. According to the report its now at its General Hospital Standards.
Wharves and Jetties Rehabilitation and Construction
20.0 14.9 14.9 14.9 75% Construction is currently in progress on selected Wharves and Jetties, completed coast line of NGI and other Coastal provinces. Number of infrastructure has to be reported
Rd Maint and Rehab. Project (RMRP) Phase 2-Additional Fundin
20.0 11.0 11.0 11.0 80% Road seal from Hiritano Highway (Malalaua – Epo – Gulf Profvince 56km completed.
Transport Sector Support Program Phase 2 20.0 11.0 11.0 6.4 35% Construction is currently in progress for specific selected projects has per the implementation agencies. Report is still required to verify the selected complete roads.
UPNG Science IV Building 20.0 7.0 7.0 7.0 20% Construction was in progress for land scaping development but came to a held due to Student Political unrest
New Central Provincial Hospital Development 20.0 6.0 6.0 5.0 15% First Stage of the project is completed and land development in progress.
Stret Pasin Retail Incubation Program 20.0 2.3 2.3 2.3 10% PSC and PMU has already established keeping track of the program. More information is still required by the Committees.
Financial Management Project 16.0 13.0 13.0 11.1 75% IFMS has achieve most of the core functions in most government departments but in slow pace since establishment. Now its roll out to provinces.
West Pacific University 15.0 15.0 15.0 15 10% First Payments has already made for Land acquisition stage.
National Highway - Magi 15.0 10.0 10.0 5.4 65% Most of the Road works and Bridges builded connecting the Central districts along has been completed
High Performance Center 15.0 7.2 7.2 7.2 0.0% Funds disbursed to implementing agency
Pacific Adventist University Infrastructure Development
15.0 3.0 3.0 3.0 75% Two Student dormitories 100% and School of Business Building 100% also Lands Scape for additional infrastructure Building 35%.
FIFA Womens Under 21 World Cup 10.0 14.0 14.0 14.0 63% Gerehu High School sporting facilities 45% Bava Sporting Facilities 65% Sir John Gaius Stadium 75% PNGIPA Sporting facilities 65%
CS Infrastructure 10.0 10.0 10.0 10.0 35% Land Capping Construction and Land acquisition – project in progress
Hiri Lai Road 10.0 10.0 10.0 100 50% Construction – ground works and land scaping and 36km road construction completed.
PNG Church State Partnership Program 10.0 10.0 10.0 9.9 90% Since establishment of programs has been implemented completely thou there has been funding disbursement due to revenue inflow 100 per cent completed.
RASII Project: Replacement of Ageing Tax Collection System
10.0 9.5 9.5 9.5 65% The Admin Smith International Consultants has installed a Tax system in a slow pace since establishment – SIGTAS required to improve the Tax collection.

97.
PROJECTS 2016
Budget 2016 Supp.
Budget 2016
Warrants 2016
Outcome % complete
PROJECT STATUS
Sustainable Development Program 10.0 9.0 9.0 9.0 35% PSC and PMU has been established – reporting of status is required
Trade Skills Scholarship 10.0 9.0 9.7 9.7 75% Total number of 810 PNG school leavers and non-school leavers has benefited since 2012. In 2016 additional double figure the beneficiaries.
ADB Bridge Replacement & Improve Rural Access Project
10.0 8.8 8.8 7.8 45% 27 bridges along the priority corridors has have been awarded. Completed bridges have been completed along Magi and Hiritano High way.
UNRE Infrastructure Development 10.0 8.5 8.5 8.5 65% Project at its finishing stage and administration keeping track of project implementation when it come to a halt in 2015.
Revenue Raising Initiatives 10.0 8.5 8.5 5.4 55% PSC and PMU established monitoring the progressive implementation
Restoration and Development Grant 10.0 8.0 8.0 8.0 20% Funds disbursed to implementing agency as ongoing
UPNG Law School Building 10.0 8.0 6.5 6.5 68% Land Scaping and work in progress Stage for the Project came to halt because of the Student political unrest.
Highlands Region Roads Improvement Program (HRRIIP II )
10.0 7.5 7.5 7.5 100% A total of 127km roads was maintained and upgraded from various districts in Highlands 60km in Laiagam – Pogera, 50km in Mendi
Lae City Roads-(GoPNG) 10.0 7.0 7.0 5.4 30% Construction is currently in progress in a slow pace for the Roads within the Lae city
National Highway - Sepik 10.0 7.0 7.0 6.5 0.0% Funds disbursed to implementing agency no road works done yet
Angau Memorial Hospital Redevelopment 10.0 6.0 6.0 5.8 60% Most of the renovation stage within the General Hospital is completed.
Library Extension 10.0 6.0 6.0 6.0 0.0% Project on hold – Student unrest in 2016
Mess Extension 10.0 6.0 6.0 6.0 0.0% Project on hold – Student unrest in 2016
Sports Enhancement Program for Districts & Provinces
10.0 5.2 5.2 5.2 45% Sporting Facilities is 35% complete so the PNG – Games is been twice defer from 2016 – 2017.
Hela Township & Growth Centers (HIP) 10.0 5.0 5.0 5.0 0.0% Funding disbursed to implementing agency
Jackson's Airport Upgrade and Rehabilitation 10.0 5.0 5.0 5.0 100% Major roads constructions have been 100%. Major extension of the Terminals in 100% done
TIPA Administration Relocation (HIP) Component
10.0 3.0 3.0 3.0 0.0% Funds disbursed to implementing agency
Divine Word University Infrastructure Development
10.0 2.0 3.0 3.0 45% Project at the initial stage land scaping and project design.
Hulia Agro Center (HIP) 10.0 2.0 2.0 2.0 0.0% Funds disbursed to implementing agency.
Nursing College Infra. Rehabilitation 10.0 2.0 3.0 3.0 10% Funds disbursed to implementing agency
Teacher's College Infra Rehabilitation 10.0 2.0 3.0 3.0 10% Funds disbursed to implementing agency
Technical and Business College Infra. Rehabilitation
10.0 2.0 3.0 3.0 10% Funds disbursed to implementing agency
Source: Department of National Planning and Monitoring

98.