Final Budget Outcome 2014-15 · PDF fileFinal Budget Outcome 2014-15 September 2015 ... 11...
114
Final Budget Outcome 2014-15 September 2015 Statement by The Honourable J. B. Hockey MP Treasurer of the Commonwealth of Australia and Senator the Honourable Mathias Cormann Minister for Finance of the Commonwealth of Australia For the information of honourable members
Transcript of Final Budget Outcome 2014-15 · PDF fileFinal Budget Outcome 2014-15 September 2015 ... 11...

Final Budget Outcome 2014-15
September 2015
Statement by
The Honourable J. B. Hockey MP Treasurer of the Commonwealth of Australia
and Senator the Honourable Mathias Cormann
Minister for Finance of the Commonwealth of Australia
For the information of honourable members

© Commonwealth of Australia 2015
ISSN: 2205-6750 (Print) 2205-6769 (Online)
This publication is available for your use under a Creative Commons BY Attribution 3.0 Australia licence, with the exception of the Commonwealth Coat of Arms, third party content and where otherwise stated. The full licence terms are available from http://creativecommons.org/licenses/by/3.0/au/legalcode.
Use of Commonwealth of Australia material under a Creative Commons BY Attribution 3.0 Australia licence requires you to attribute the work (but not in any way that suggests that the Commonwealth of Australia endorses you or your use of the work).
Commonwealth of Australia material used ‘as supplied’.
Provided you have not modified or transformed Commonwealth of Australia material in any way including, for example, by changing the Commonwealth of Australia text; calculating percentage changes; graphing or charting data; or deriving new statistics from published Commonwealth of Australia statistics — then Commonwealth of Australia prefers the following attribution:
Source: The Commonwealth of Australia.
Derivative material
If you have modified or transformed Commonwealth of Australia material, or derived new material from those of the Commonwealth of Australia in any way, then Commonwealth of Australia prefers the following attribution:
Based on Commonwealth of Australia data.
Use of the Coat of Arms
The terms under which the Coat of Arms can be used are set out on the It’s an Honour website (see www.itsanhonour.gov.au).
Other uses
Enquiries regarding this licence and any other use of this document are welcome at: Manager Media Unit The Treasury Langton Crescent Parkes ACT 2600 Email: [email protected]
Internet A copy of this document is available on the central Budget website at: www.budget.gov.au.
Printed by Instant Colour Press.

iii
FOREWORD The Final Budget Outcome 2014-15 has been prepared in a manner consistent with the Charter of Budget Honesty Act 1998 (the Charter). The Charter requires that, inter alia, the Government provide a final budget outcome report no later than three months after the end of the financial year. Consistent with these requirements, this report encompasses Australian Government general government sector fiscal outcomes for the 2014-15 financial year and is based on external reporting standards.
• Part 1 provides the general government sector budget aggregates for 2014-15 together with an analysis of the 2014-15 Final Budget Outcome. This includes summary analysis of cash flows, revenue, expenses, net capital investment and the balance sheet (net debt, net financial worth and net worth).
• Part 2 presents the Australian Government financial statements for 2014-15 with the Australian Bureau of Statistics’ (ABS) Government Finance Statistics (GFS) as the basis for accounting policy, except for where the Government has decided to depart because Australian Accounting Standards provide a better conceptual treatment for presenting information of relevance to users of public sector financial reports. This data covers the general government sector as well as the Australian Government public corporations sectors.
• Part 3 provides details for 2014-15 on Australia’s Federal Relations, updated from that contained in the 2015-16 Budget Paper No. 3, Federal Financial Relations.
Appendix A contains expenses data on a functional and sub-functional basis. Historical Australian Government data are presented in Appendix B.


v
CONTENTS
FOREWORD ....................................................................................................................... III
PART 1: AUSTRALIAN GOVERNMENT BUDGET OUTCOME ....................................................... 1 Overview ......................................................................................................................... 1 Underlying cash balance ................................................................................................. 2 Fiscal balance ................................................................................................................. 7 Headline cash balance estimates ................................................................................. 13 Net debt, net financial worth and net worth ................................................................... 13
PART 2: AUSTRALIAN GOVERNMENT FINANCIAL STATEMENTS .......................................... 15 Australian Government financial statements ................................................................ 16 Financial reporting standards and budget concepts ..................................................... 45 Australian Loan Council Allocation ................................................................................ 52
PART 3: AUSTRALIA’S FEDERAL RELATIONS .................................................................... 55 Overview of payments to the states .............................................................................. 55 Payments for specific purposes .................................................................................... 55 General revenue assistance ......................................................................................... 60 GST payments .............................................................................................................. 61 Payments to the states .................................................................................................. 65
APPENDIX A: EXPENSES BY FUNCTION AND SUB-FUNCTION ............................................... 79
APPENDIX B: HISTORICAL AUSTRALIAN GOVERNMENT DATA ............................................ 83

Contents
vi
LIST OF TABLES
Part 1 Table 1: Australian Government general government sector budget
aggregates .................................................................................................. 2
Table 2: Summary of Australian Government general government sector cash flows ................................................................................................... 3
Table 3: Australian Government general government sector (cash) receipts ....................................................................................................... 5
Table 4: Australian Government general government sector (accrual) revenue ....................................................................................................... 9
Table 5: Australian Government general government sector expenses by function ..................................................................................................... 11
Table 6: Australian Government general government sector net capital investment by function .............................................................................. 12
Table 7: Australian Government general government sector purchases of non-financial assets by function ............................................................... 12
Table 8: Details of the Australian Government general government sector items between the underlying and headline cash balance ....................... 13
Table 9: Australian Government general government sector net worth, net financial worth, net debt and net interest payments ........................... 14
Table 10: Australian Government general government sector operating statement .................................................................................................. 16
Table 11: Australian Government general government sector balance sheet ......................................................................................................... 18
Table 12: Australian Government general government sector cash flow statement .................................................................................................. 20
Table 13: Australian Government public non-financial corporations sector operating statement .................................................................................. 22
Table 14: Australian Government public non-financial corporations sector balance sheet ........................................................................................... 23
Table 15: Australian Government public non-financial corporations sector cash flow statement .................................................................................. 24
Table 16: Australian Government total non-financial public sector operating statement .................................................................................. 25
Table 17: Australian Government total non-financial public sector balance sheet ......................................................................................................... 26
Table 18: Australian Government total non-financial public sector cash flow statement ........................................................................................... 27
Table 19: Australian Government public financial corporations sector operating statement .................................................................................. 28
Contents
vii
Table 20: Australian Government public financial corporations sector balance sheet ........................................................................................... 29
Table 21: Australian Government public financial corporations sector cash flow statement ........................................................................................... 30
Table 22: Major differences between AAS and ABS GFS ....................................... 34
Table 23: Entities outside of the general government sector ................................... 51
Table 24: Australian Government Loan Council Allocation ...................................... 53
Table 25: Commonwealth payments to the states, 2014-15 .................................... 55
Table 26: Total payments for specific purposes by category, 2014-15 .................... 57
Table 27: Total payments for specific purposes by sector, 2014-15 ........................ 58
Table 28: Total payments for specific purposes by sector and category, 2014-15 ..................................................................................................... 59
Table 29: NDRRA cash payments, 2014-15 ............................................................ 60
Table 30: General revenue assistance, 2014-15 ...................................................... 60
Table 31: GST revenue and GST entitlement to the states, 2014-15 ...................... 61
Table 32: GST entitlement and GST advances to the states, 2014-15 .................... 62
Table 33: GST relativities, 2014-15 .......................................................................... 62
Table 34: Calculation of the 2014-15 GST entitlements ........................................... 63
Table 35: Summary of advances made in 2014-15 and distribution of following year adjustment across states ................................................... 63
Table 36: GST administration, 2014-15 .................................................................... 63
Table 37: Payments for specific purposes to support state health services, 2014-15 ..................................................................................................... 66
Table 38: Payments for specific purposes to support state education services, 2014-15 ..................................................................................... 69
Table 39: Payments for specific purposes to support state skills and workforce development services, 2014-15 ............................................... 70
Table 40: Payments for specific purposes to support state community services, 2014-15 ..................................................................................... 71
Table 41: Payments for specific purposes to support state affordable housing services, 2014-15 ........................................................................ 72
Table 42: Payments for specific purposes to support state infrastructure services, 2014-15 ..................................................................................... 73
Table 43: Payments for specific purposes to support state environment services, 2014-15 ..................................................................................... 75
Table 44: Payments for specific purposes to support contingent state services, 2014-15 ..................................................................................... 76

Contents
viii
Table 45: Payments for specific purposes to support other state services, 2014-15 ..................................................................................................... 77
Table 46: General revenue assistance payments to the states, 2014-15 ................ 77
Table 47: Total payments to the states by GFS function, 2014-15 .......................... 78
Table A1: Australian Government general government sector expenses by function and sub-function ......................................................................... 79
Table B1: Australian Government general government sector receipts, payments, net Future Fund earnings and underlying cash balance ..................................................................................................... 85
Table B2: Australian Government general government sector net cash flows from investments in financial assets for policy purposes and headline cash balance ....................................................................... 87
Table B3: Australian Government general government sector call on resources .................................................................................................. 89
Table B4: Australian Government general government sector taxation receipts, non-taxation receipts and total receipts ..................................... 91
Table B5: Australian Government general government sector net debt and net interest payments ............................................................................... 93
Table B6: Australian Government general government sector face value of Commonwealth Government Securities (CGS) on issue and interest paid .............................................................................................. 95
Table B7: Australian Government general government sector revenue, expenses, net capital investment and fiscal balance ............................... 97
Table B8: Australian Government general government sector net worth and net financial worth .............................................................................. 98
Table B9: Australian Government general government sector accrual taxation revenue, non-taxation revenue and total revenue ...................... 99
Table B10: Australian Government cash receipts, payments and surplus by institutional sector ($m) ........................................................................... 100
Table B11: Australian Government accrual revenue, expenses and fiscal balance by institutional sector ($m) ........................................................ 101

Contents
ix
Notes (a) The following definitions are used in this Budget Paper:
– ‘real’ means adjusted for the effect of inflation;
– real growth in expenses and payments is calculated using the Consumer Price Index (CPI) as the deflator; and
– one billion is equal to one thousand million.
(b) Figures in tables and generally in the text have been rounded. Discrepancies in tables between totals and sums of components are due to rounding:
– estimates under $100,000 are rounded to the nearest thousand;
– estimates $100,000 and over are generally rounded to the nearest tenth of a million;
– estimates midway between rounding points are rounded up; and
– the percentage changes in statistical tables are calculated using unrounded data.
(c) For the budget balance, a negative sign indicates a deficit while no sign indicates a surplus.
(d) The following notations are used:
- nil
na not applicable (unless otherwise specified)
$m millions of dollars
$b billions of dollars
nfp not for publication
(e) estimates (unless otherwise specified)
(p) projections (unless otherwise specified)
NEC/nec not elsewhere classified

Contents
x
(e) The Australian Capital Territory and the Northern Territory are referred to as ‘the territories’. References to the ‘states’ or ‘each state’ include the territories. The following abbreviations are used for the names of the states, where appropriate:
NSW New South Wales
VIC Victoria
QLD Queensland
WA Western Australia
SA South Australia
TAS Tasmania
ACT Australian Capital Territory
NT Northern Territory
(f) In this paper the term Commonwealth refers to the Commonwealth of Australia.
The term is used when referring to the legal entity of the Commonwealth of Australia.
The term Australian Government is used when referring to the Government and the decisions and activities made by the Government on behalf of the Commonwealth of Australia.

1
PART 1: AUSTRALIAN GOVERNMENT BUDGET OUTCOME OVERVIEW
In 2014-15, the Australian Government general government sector recorded an underlying cash deficit of $37.9 billion (2.4 per cent of gross domestic product (GDP)). The fiscal balance was in deficit by $39.9 billion (2.5 per cent of GDP).
In cash terms, the Final Budget Outcome for 2014-15 was a $3.3 billion improvement compared with the underlying cash deficit estimated at the time of the 2015-16 Budget. Total payments were $2.9 billion lower than expected and total receipts were $1.0 billion higher than expected. Net Future Fund earnings were $660 million higher than expected at the time of the 2015-16 Budget.
In fiscal balance terms, the Final Budget Outcome for 2014-15 deteriorated by $0.5 billion compared with the fiscal balance deficit estimated at the time of the 2015-16 Budget, with revenue $3.4 billion lower, expenses $2.4 billion lower, and net capital investment $433 million lower than expected at the time of the 2015-16 Budget.
Real GDP growth in 2014-15 was in line with the 2015-16 Budget forecast of 2½ per cent. With the resources sector transitioning from the investment to production phase, mining exports grew strongly while mining-related investment detracted from growth in line with expectations. Housing construction grew at its fastest rate in 12 years, contributing significantly to growth. Although the fall in the terms of trade was lower than expected at the time of the 2015-16 Budget, it was the largest annual fall in over fifty years. The lower-than-expected decline in the terms of trade was due to both lower-than-expected prices for imports and higher-than-expected prices for agricultural exports. Nominal GDP growth in 2014-15 was slightly higher than the 2015-16 Budget forecast, but well below its long-term average, reflecting the decline in the terms of trade and subdued domestic price growth.
Tax receipts for 2014-15 were $351.7 billion, $222 million (0.1 per cent) higher than forecast at the 2015-16 Budget.
Australian Government general government sector net debt was $238.7 billion (14.8 per cent of GDP), which is $11.5 billion lower than estimated at the time of the 2015-16 Budget. The decline in net debt was primarily driven by a decline in the market value of the existing stock of Commonwealth Government Securities (CGS) on issue, owing to higher-than-expected yields. Australian Government general government sector net financial worth was -$421.1 billion and net worth was -$302.3 billion at the end of 2014-15.

Part 1: Australian Government Budget Outcome
2
Table 1: Australian Government general government sector budget aggregates 2013-14 2014-15 2014-15 Change on
Outcome Estimate at Outcome 2015-162015-16 BudgetBudget
$b $b $b $bReceipts 360.3 377.3 378.3 1.0Per cent of GDP 22.8 23.5 23.5Payments(a) 406.4 415.0 412.1 -2.9Per cent of GDP 25.7 25.9 25.6
Net Future Fund earnings 2.3 3.4 4.1 0.7
Underlying cash balance(b) -48.5 -41.1 -37.9 3.3Per cent of GDP -3.1 -2.6 -2.4
Revenue 373.9 384.1 380.7 -3.4Per cent of GDP 23.6 23.9 23.6
Expenses 413.8 420.3 417.9 -2.4Per cent of GDP 26.2 26.2 25.9
Net operating balance -39.9 -36.2 -37.2 -0.9Net capital investment 3.8 3.1 2.7 -0.4
Fiscal balance -43.7 -39.4 -39.9 -0.5Per cent of GDP -2.8 -2.5 -2.5
Memorandum item:Headline cash balance -52.5 -43.2 -38.9 4.3
(a) Equivalent to cash payments for operating activities, purchases of non-financial assets and net acquisition of assets under finance leases.
(b) Excludes net Future Fund earnings.
UNDERLYING CASH BALANCE
The 2014-15 underlying cash deficit was $37.9 billion, an improvement of $3.3 billion compared with the estimate at the time of the 2015-16 Budget. This was the result of lower payments of $2.9 billion and higher receipts of $1.0 billion, partly offset by higher net Future Fund earnings of $660 million.

Part 1: Australian Government Budget Outcome
3
Table 2: Summary of Australian Government general government sector cash flows
2014-15 2014-15 Change onEstimate at Outcome 2015-16
2015-16 BudgetBudget
$b $b $bCash receipts
Operating cash receipts 375.1 376.0 0.9Capital cash receipts(a) 2.2 2.3 0.1
Total cash receipts 377.3 378.3 1.0
Cash paymentsOperating cash payments 403.2 400.7 -2.5Capital cash payments(b) 11.8 11.3 -0.5
Total cash payments 415.0 412.0 -3.0
Finance leases and similar arrangements(c) 0.0 0.1 0.1
GFS cash surplus(+)/deficit(-) -37.7 -33.8 3.9Per cent of GDP -2.3 -2.1
less Net Future Fund earnings 3.4 4.1 0.7
Underlying cash balance(d) -41.1 -37.9 3.3Per cent of GDP -2.6 -2.4
Memorandum items:Net cash flows from investments in financial
assets for policy purposes -5.5 -5.2 0.3
plus Net Future Fund earnings 3.4 4.1 0.7
Headline cash balance -43.2 -38.9 4.3 (a) Equivalent to cash receipts from the sale of non-financial assets in the cash flow statement. (b) Equivalent to cash payments for purchases of non-financial assets in the cash flow statement. (c) The acquisition of assets under finance leases decreases the underlying cash balance. The disposal of
assets previously held under finance leases increases the underlying cash balance. (d) Excludes net Future Fund earnings.

Part 1: Australian Government Budget Outcome
4
Receipts Total tax receipts for 2014-15 were $351.7 billion, $222 million (0.1 per cent) higher than expected in the 2015-16 Budget. Excluding GST, tax receipts were broadly in-line with 2015-16 Budget estimates.
Compared with the 2015-16 Budget, higher-than-expected individual and other withholding tax, GST, excise and customs duty receipts were partially offset by lower-than-expected company and superannuation fund tax receipts.
• Receipts from total individuals and other withholding taxes were $1.3 billion (0.7 per cent) above the 2015-16 Budget estimate. This was primarily attributable to stronger-than-expected payments on assessment and lower-than-expected refunds related to 2013-14 income year returns lodged in May and June, reflecting in part stronger-than-expected capital gains tax liabilities.
• Total excise and customs duty receipts were $768 million (2.3 per cent) above the 2015-16 Budget estimate. This primarily reflected higher-than-anticipated receipts for tobacco excise and customs duty.
• Receipts from the GST were $257 million (0.5 per cent) above the 2015-16 Budget estimate, consistent with stronger-than-expected dwelling investment. Higher-than-expected GST receipts will be reflected in higher payments to the states.
• Company tax receipts were $1.8 billion (2.7 per cent) below the 2015-16 Budget estimate. This was primarily caused by lower-than-expected monthly instalments in the mining sector.
• Receipts from superannuation fund taxes were $267 million (4.4 per cent) below the 2015-16 Budget estimate.

Part 1: Australian Government Budget Outcome
5
Table 3: Australian Government general government sector (cash) receipts 2014-15 2014-15 Change on
Estimate at Outcome 2015-162015-16 Budget Budget
$m $m $mIndividuals and other withholding taxes
25253,661003,661gnidlohhtiw xat emocni ssorG149145,83006,73slaudividni rehto ssorG
less: 762-330,72003,72sdnufeR062,1068,771006,671xat gnidlohhtiw rehto dna slaudividni latoT3-743,4053,4xat stifeneb egnirF628,1-471,66000,86xat ynapmoC762-378,5041,6sexat dnuf noitaunnarepuS00606)a(xat tner ecruoser slareniM01018,1008,1xat tner ecruoser muelorteP528-521,652059,652stpiecer noitaxat emocnI752245,45582,45xat secivres dna sdooG21297087xat noitasilauqe eniW02025005xat rac yruxuL
Excise and customs duty 53530,6000,6lorteP801809,8008,8leseiD57-588,2069,2stcudorp leuf rehtO865848,8082,8occaboT03-013,2043,2reeB61699,1089,1stiripS11-998019)b(segareveb cilohocla rehtO
Other customs duty5-546056raewtoof dna gnihtolc ,selitxeT23237007selcihev rotom regnessaP46466,1006,1stropmi rehtO
less: 46-653024skcabward dna sdnufeR867865,43008,33ytud smotsuc dna esicxe latoT
3-726,1036,1msinahcem gnicirp nobraC
42515294seivel larutlucirgA03-689,2610,3sexat rehtO840,1055,59205,49stpiecer noitaxat tceridnI222576,153254,153stpiecer noitaxaT

Part 1: Australian Government Budget Outcome
6
Table 3: Australian Government general government sector (cash) receipts (continued)
2014-15 2014-15 Change onEstimate at Outcome 2015-16
2015-16 Budget Budget
$m $m $mSales of goods and services 9,218 8,922 -297Interest received 3,131 3,056 -75Dividends 4,121 4,745 624Other non-taxation receipts 9,386 9,904 517Non-taxation receipts 25,856 26,626 769Total receipts 377,309 378,301 992Memorandum:
Total excise 24,050 23,663 -387Total customs duty 9,750 10,905 1,155Medicare and DisabilityCare Australia levy 14,050 14,640 590
(a) The MRRT applied until 30 September 2014. (b) Other alcoholic beverages are those not exceeding 10 per cent by volume of alcohol (excluding beer,
brandy and wine). Non-tax receipts (excluding Future Fund receipts) were $22.0 billion in 2014-15, $256 million higher than estimated at the time of the 2015-16 Budget. This increase largely relates to greater than expected returns of unclaimed monies and receipts under health programmes which were higher than estimated at the time of the 2015-16 Budget.
Payments Total cash payments were $412.1 billion in 2014-15, $2.9 billion lower than estimated at the time of the 2015-16 Budget. Total payments (excluding Future Fund payments) were $411.5 billion, $2.8 billion lower than estimated at the time of the 2015-16 Budget. The outcome reflects decreases in:
• payments associated with onshore immigration detention, largely reflecting occupancy levels lower than estimated, and payments in lower cost forms of immigration detention ($389 million);
• demand and costs for a range of demand-driven health programmes, including private health insurance and pharmaceutical related programmes ($372 million);
• payments related to Department of Defence (including Defence Materiel Organisation) operations, largely due to lower than expected payments for sustainment contract services, purchase of land, buildings, plant and equipment, construction support charges and estate maintenance ($345 million);
• Family Tax Benefit payments, which largely reflects a lower than expected number of reconciliation payments and the timing of these payments ($331 million);

Part 1: Australian Government Budget Outcome
7
• payments for Natural Disaster Relief, largely reflecting decreased funding under the Natural Disaster Relief and Recovery Arrangements (NDRRA) determination and the outcome of the audit on existing projects for non-Queensland jurisdictions which reduced eligibility for some projects ($252 million);
• payments for a range of education and training related programmes under the Building Skills and Capability programme, largely reflecting lower than expected take up ($224 million);
• payments for the Interest on Overpayment and Early Payment of Tax programme, largely reflecting the Australian Taxation Office’s strategy to reduce the time taken to settle disputed cases ($150 million);
• payments under a range of national partnership agreements, including housing ($133 million) largely reflecting delays in the achievement of project milestones; and
• average payment rates under the Income Support for Seniors programme, as a result of stronger than anticipated increases in asset values held by recipients of the Age Pension ($129 million).
These and other decreases were partially offset by the extinguishment of the provision for underspends in the Contingency Reserve.
Net Future Fund Earnings The underlying cash balance excludes net Future Fund earnings. Net Future Fund earnings were $4.1 billion in 2014-15, $660 million higher than estimated at the time of the 2015-16 Budget, largely reflecting higher-than-estimated receipts from investment returns.
FISCAL BALANCE
The 2014-15 fiscal balance deficit was $39.9 billion, a $0.5 billion deterioration on the deficit of $39.4 billion estimated at the time of the 2015-16 Budget. The cash receipt and payment variations outlined previously have a similar impact on revenue and expenses since fiscal and cash variances are typically driven by the same factors. However, the deterioration in the fiscal balance of $0.5 billion, compared with the improvement in the underlying cash balance of $3.3 billion, is the result of additional factors, as outlined below.
Revenue Total revenue was $380.7 billion in 2014-15, $3.4 billion lower than estimated at the time of the 2015-16 Budget. In comparison, total cash receipts were $378.3 billion in 2014-15, $1.0 billion higher than estimated at the time of the 2015-16 Budget.
Taxation revenue was $355.4 billion in 2014-15, $3.8 billion lower than the estimate at the 2015-16 Budget.

Part 1: Australian Government Budget Outcome
8
The shortfall in taxation revenue was mostly driven by lower-than-expected company tax revenue. The company tax revenue shortfall totalled $3.6 billion and comprised lower-than-expected company cash receipts collected in 2014-15 and a reduction in revenue from the settlement of disputed amounts.
Total non-tax revenue was $25.4 billion in 2014-15, $408 million higher than estimated at the 2015-16 Budget. Non-tax receipts were $26.6 billion, $769 million higher than estimated at Budget.
The $361 million difference in outcomes for non-tax revenue and non-tax receipts is largely a result of increases in non-tax receipts, which did not have a corresponding non-tax revenue impact in 2014-15. This includes higher dividends from the Reserve Bank of Australia than estimated at the time of the 2015-16 Budget, partially offset by lower than estimated interest revenue items with non-cash impacts.
Part 1: Australian Government Budget Outcome
9
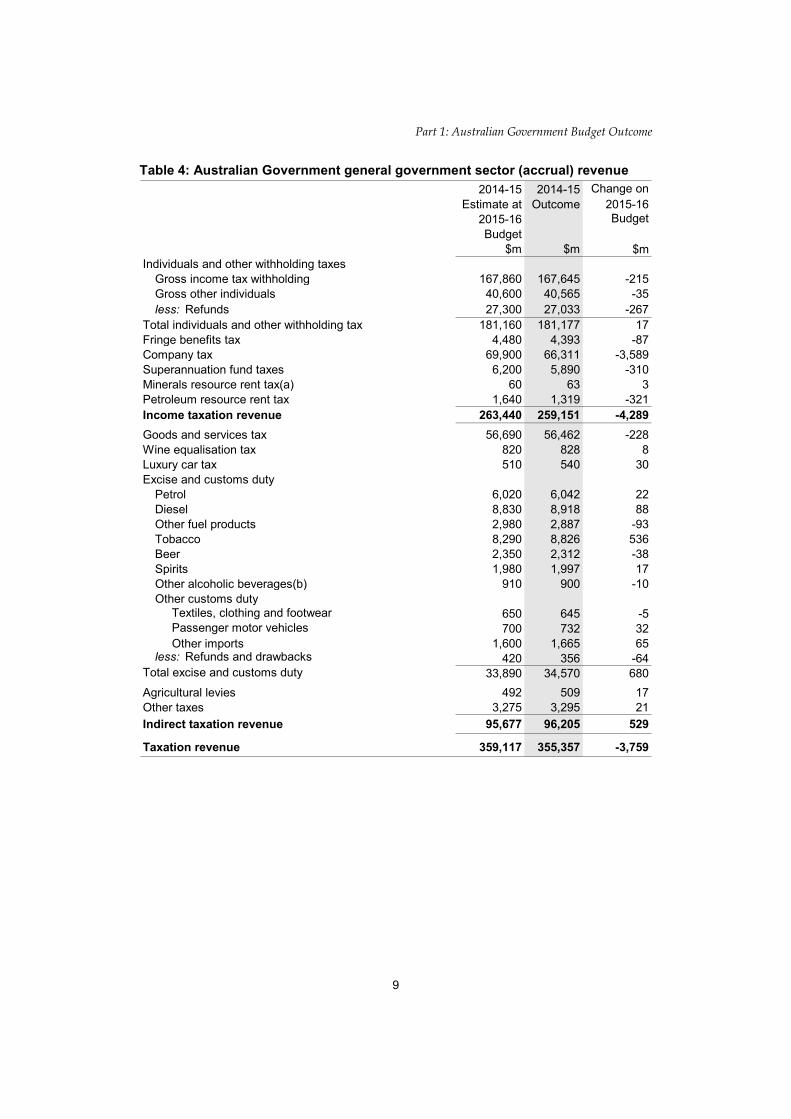
Table 4: Australian Government general government sector (accrual) revenue 2014-15 2014-15 Change on
Estimate at Outcome 2015-162015-16 BudgetBudget
$m $m $mIndividuals and other withholding taxes
Gross income tax withholding 167,860 167,645 -215Gross other individuals 40,600 40,565 -35less: Refunds 27,300 27,033 -267
Total individuals and other withholding tax 181,160 181,177 17Fringe benefits tax 4,480 4,393 -87Company tax 69,900 66,311 -3,589Superannuation fund taxes 6,200 5,890 -310Minerals resource rent tax(a) 60 63 3Petroleum resource rent tax 1,640 1,319 -321Income taxation revenue 263,440 259,151 -4,289Goods and services tax 56,690 56,462 -228Wine equalisation tax 820 828 8Luxury car tax 510 540 30Excise and customs duty
Petrol 6,020 6,042 22Diesel 8,830 8,918 88Other fuel products 2,980 2,887 -93Tobacco 8,290 8,826 536Beer 2,350 2,312 -38Spirits 1,980 1,997 17Other alcoholic beverages(b) 910 900 -10Other customs duty Textiles, clothing and footwear 650 645 -5 Passenger motor vehicles 700 732 32 Other imports 1,600 1,665 65less: Refunds and drawbacks 420 356 -64
Total excise and customs duty 33,890 34,570 680Agricultural levies 492 509 17Other taxes 3,275 3,295 21Indirect taxation revenue 95,677 96,205 529
Taxation revenue 359,117 355,357 -3,759

Part 1: Australian Government Budget Outcome
10
Table 4: Australian Government general government sector (accrual) revenue (continued)
2014-15 2014-15 Change onEstimate at Outcome 2015-16
2015-16 BudgetBudget
$m $m $mSales of goods and services 9,277 9,058 -219Interest 3,653 3,147 -506Dividends 4,796 6,178 1,382Other non-taxation revenue 7,255 7,006 -249Non-taxation revenue 24,981 25,389 408Total revenue 384,098 380,746 -3,351Memorandum: Total excise 24,140 23,687 -453 Total customs duty 9,750 10,884 1,134 Medicare and DisabilityCare Australia levy (c) 14,050 14,640 590
(a) The MRRT applied until 30 September 2014. (b) Other alcoholic beverages are those not exceeding 10 per cent by volume of alcohol (excluding beer,
brandy and wine). (c) From the 2014-15 Budget, Medicare and DisabilityCare Australia levy revenue is based on when
collections relating to the levy are received.
Expenses and net capital investment Total expenses were $417.9 billion in 2014-15, $2.4 billion lower than estimated at the time of the 2015-16 Budget. Total net capital investment for 2014-15 was $2.7 billion, $433 million lower than the estimate of $3.1 billion. This results in a lower than estimated net outcome for expenses and net capital investment of $2.8 billion.
In comparison, cash payments were $412.1 billion in 2014-15, $2.9 billion lower than estimated at the 2015-16 Budget.
The difference of $51 million between the lower than estimated net outcome for expenses and net capital investment of $2.8 billion and the lower than estimated outcome for cash payments of $2.9 billion largely relates to the timing difference between when payments are made and expenses are accrued. This includes the provision of GST to the States and Territories, and timing differences between expenses and payments related to the Department of Defence (including Defence Materiel Organisation).
Further information on expenses by function and sub-function are provided in Appendix A.

Part 1: Australian Government Budget Outcome
11
Table 5: Australian Government general government sector expenses by function
2014-15 2014-15 Change onEstimate at Outcome 2015-16
2015-16 BudgetBudget
$m $m $mGeneral public services
Legislative and executive affairs 1,165 1,124 -42Financial and fiscal affairs 7,763 7,145 -618Foreign affairs and economic aid 6,324 6,393 69General research 2,847 2,766 -81General services 860 720 -140Government superannuation benefits 6,208 6,457 249
Defence 24,612 23,790 -822Public order and safety 4,580 4,443 -138Education 31,202 31,101 -101Health 67,037 65,696 -1,341Social security and welfare 149,107 147,787 -1,320Housing and community amenities 4,940 4,835 -105Recreation and culture 3,520 3,534 14Fuel and energy 6,986 6,799 -187Agriculture, forestry and fishing 2,731 2,411 -321Mining, manufacturing and construction 3,218 3,550 332Transport and communication 6,504 6,433 -71Other economic affairs
Tourism and area promotion 172 186 14Total labour and employment affairs 3,903 3,673 -231Immigration 4,459 4,036 -422Other economic affairs nec 2,146 2,151 5
Other purposesPublic debt interest 14,468 14,491 23Nominal superannuation interest 8,989 8,999 10General purpose inter-governmental transactions 57,467 58,859 1,392Natural disaster relief 36 522 486Contingency reserve -911 0 911
Total expenses 420,335 417,898 -2,437

Part 1: Australian Government Budget Outcome
12
Table 6: Australian Government general government sector net capital investment by function
2014-15 2014-15 Change onEstimate at Outcome 2015-16
2015-16 BudgetBudget
$m $m $mGeneral public services 792 523 -269Defence 3,752 3,967 215Public order and safety 123 68 -55Education -16 -9 7Health -17 1 18Social security and welfare 21 7 -14Housing and community amenities 107 -33 -140Recreation and culture 71 -28 -99Fuel and energy 2 -1 -3Agriculture, forestry and fishing 67 129 62Mining, manufacturing and construction -6 -8 -2Transport and communication -2,145 -2,144 1Other economic affairs 369 233 -136Other purposes 17 0 -17Total net capital investment 3,138 2,706 -433
Table 7: Australian Government general government sector purchases of non-financial assets by function
2014-15 2014-15 Change onEstimate at Outcome 2015-16
2015-16 BudgetBudget
$m $m $mGeneral public services 1,435 1,505 70Defence 7,882 7,818 -64Public order and safety 507 470 -37Education 13 21 8Health 81 79 -2Social security and welfare 357 382 26Housing and community amenities 51 56 5Recreation and culture 318 309 -10Fuel and energy 4 4 0Agriculture, forestry and fishing 102 158 55Mining, manufacturing and construction 8 6 -1Transport and communication 57 46 -11Other economic affairs 791 698 -93Other purposes 17 0 -17Total Government puchases of non-financial assets 11,622 11,553 -70

Part 1: Australian Government Budget Outcome
13
HEADLINE CASH BALANCE ESTIMATES
The headline cash balance consists of the underlying cash balance, net cash flows from investments in financial assets for policy purposes (for example, the equity funding of NBN Co), and net Future Fund earnings.
Table 8 provides further detail between the underlying and headline cash balance estimates of the Australian Government general government sector in 2014-15.
At the end of 2014-15, the headline cash balance was $38.9 billion, a $4.3 billion improvement from the estimate at the time of the 2015-16 Budget. The improvement in the headline cash balance was primarily driven by the change in the underlying cash balance and net Future Fund earnings.
Table 8: Details of the Australian Government general government sector items between the underlying and headline cash balance
2014-15 2014-15 Change onEstimate at Outcome 2015-16
2015-16 BudgetBudget
$m $m $m2014-15 Outcome underlying cash balance(a) -41,121 -37,867 3,253plus Net cash flows from investments in financial assetsfor policy purpose
Students loans -6,381 -6,330 51NBN investment -4,917 -4,767 150Sale of Medibank Private 5,679 5,688 10Residential mortgage backed securities 1,980 1,755 -225Trade support loans -72 -70 1Asbestos removal in the ACT - Mr Fluffy loose fill asbestos remediation -750 -750 0Net other -1,039 -684 355Total net cash flows from investments in financial assetsfor policy purposes -5,500 -5,158 342
plus Net Future Fund earnings 3,429 4,089 6602014-15 Outcome headline cash balance -43,191 -38,936 4,255 (a) Excludes net Future Fund earnings.
NET DEBT, NET FINANCIAL WORTH AND NET WORTH
At the end of 2014-15, the level of Australian Government net debt was $238.7 billion (14.8 per cent of GDP), $11.5 billion lower than estimated at the time of the 2015-16 Budget.
The decline in net debt compared with the level expected at the 2015-16 Budget was primarily driven by a decline in the market value of the existing stock of Commonwealth Government Securities (CGS) on issue, owing to higher-than-expected yields. CGS are reported in the general government sector balance sheet in market value terms, consistent with the Australian Accounting Standards.

Part 1: Australian Government Budget Outcome
14
A lower-than-expected underlying cash deficit also contributed to the decline in net debt compared with the level expected at Budget.
Net financial worth was -$421.1 billion at the end of 2014-15, compared with -$350.1 billion estimated at the 2015-16 Budget.
Net worth was -$302.3 billion at the end of 2014-15, compared with -$231.3 billion estimated at the 2015-16 Budget.
The change in the market value of CGS described above improves net financial worth and net worth. In addition to this, changes in net financial worth and net worth since the Budget reflect a significant increase in the Government’s reported superannuation liability. This is the result of a large difference between the long-term discount rate used in the Budget (6.0 per cent per annum) and the actual bond rate as at 30 June 2015 (3.7 per cent per annum) used to value the superannuation liability. The use of two different discount rates is the usual practice, applied in previous Budgets and Final Budget Outcomes.
Table 9: Australian Government general government sector net worth, net financial worth, net debt and net interest payments
2014-15 2014-15 Change onEstimate at Outcome 2015-16
2015-16 BudgetBudget
$b $b $bFinancial assets 309.9 315.6 5.8Non-financial assets 118.8 118.8 0.0Total assets 428.7 434.4 5.8Total liabilities 660.0 736.8 76.8Net worth -231.3 -302.3 -71.0Net financial worth(a) -350.1 -421.1 -71.0Per cent of GDP -21.8 -26.1
Net debt(b) 250.2 238.7 -11.5Per cent of GDP 15.6 14.8
Net interest payments 10.9 10.9 0.0Per cent of GDP 0.7 0.7 (a) Net financial worth equals total financial assets minus total liabilities. (b) Net debt equals the sum of deposits held, government securities, loans and other borrowing, minus the
sum of cash and deposits, advances paid and investments, loans and placements.

15
PART 2: AUSTRALIAN GOVERNMENT FINANCIAL STATEMENTS
Consistent with the Charter of Budget Honesty Act 1998 (the Charter), the Government has produced a single set of financial statements for the Australian Government general government sector (GGS), the public non-financial corporations (PNFC) sector, the total non-financial public sector (NFPS) and the public financial corporations (PFC). The financial statements comply with both Australian Bureau of Statistics’ (ABS) accrual Government Finance Statistics (GFS) and Australian Accounting Standards (AAS), with departures disclosed. These statements are:
• an operating statement, including other economic flows, which shows net operating balance and net lending/borrowing (fiscal balance);
• a balance sheet, which also shows net worth, net financial worth, net financial liabilities and net debt; and
• a cash flow statement, which includes the calculation of the underlying cash balance.
In addition to these general purpose statements, notes to the financial statements are required. These notes include a summary of accounting policies, disaggregated information and other disclosures required by AAS.
The financial statements for the Final Budget Outcome 2014-15 have been prepared on a basis consistent with the 2015-16 Budget. This enables comparison of the 2014-15 revised estimates published at the 2015-16 Budget and the outcome.
The statements reflect the policy that ABS GFS remains the basis of budget accounting policy, except where the Government applies AAS because it provides a better conceptual basis for presenting information of relevance to users of public sector financial reports.
The Australian, state and territory governments have an agreed framework — the Uniform Presentation Framework (UPF) — for the presentation of government financial information on a basis broadly consistent with the Australian Accounting Standards Board standard AASB 1049. The financial statements are consistent with the requirements of the UPF.
In accordance with the UPF requirements, this part also contains an update of the Australian Loan Council Allocation.

Part 2: Australian Government Financial Statements
16
AUSTRALIAN GOVERNMENT FINANCIAL STATEMENTS
Table 10: Australian Government general government sector operating statement
2014-15 Month of 2014-15 Change onEstimate at June 2015(d) Outcome 2015-16
2015-16 BudgetBudget
Note $m $m $m $mRevenueTaxation revenue 3 359,117 26,379 355,357 -3,759Sales of goods and services 4 9,277 750 9,058 -219Interest income 5 3,653 0 3,147 -506Dividend income 5 4,796 2,295 6,178 1,382Other 6 7,255 841 7,006 -249Total revenue 384,098 30,265 380,746 -3,351ExpensesGross operating expenses
Wages and salaries(a) 7 18,939 1,446 18,357 -582Superannuation 7 6,803 1,047 6,927 124Depreciation and amortisation 8 6,804 446 6,805 1Supply of goods and services 9 80,474 8,035 79,454 -1,020Other operating expenses(a) 7 5,502 628 5,746 244
Total gross operating expenses 118,522 11,602 117,289 -1,233Superannuation interest expense 7 8,989 770 8,999 10Interest expenses 10 15,915 1,509 16,022 107Current transfers
Current grants 11 124,435 15,006 124,636 201Subsidy expenses 12,522 1,522 12,506 -16Personal benefits 12 130,663 9,954 129,190 -1,474
Total current transfers 267,620 26,482 266,332 -1,288Capital transfers 11
Mutually agreed write-downs 2,124 -151 1,857 -268Other capital grants 7,164 1,183 7,398 234
Total capital transfers 9,288 1,032 9,255 -34Total expenses 420,335 41,395 417,898 -2,437Net operating balance -36,237 -11,129 -37,151 -914Other economic flows - included in operating result
Net write-downs of assets (including bad and doubtful debts) -6,878 -1,803 -7,171 -292Assets recognised for the first time 319 32 327 8Liabilities recognised for the first time 0 0 0 0Actuarial revaluations 0 0 0 0Net foreign exchange gains -247 90 -2,335 -2,088Net swap interest received -799 26 -943 -144Market valuation of debt -14,521 5,963 -7,499 7,022Other gains/(losses) 20,826 -549 24,757 3,930
Total other economic flows - included in operating result -1,300 3,759 7,135 8,435

Part 2: Australian Government Financial Statements
17
Table 10: Australian Government general government sector operating statement (continued)
2014-15 Month of 2014-15 Change onEstimate at June 2015(d) Outcome 2015-16
2015-16 BudgetBudget
$m $m $m $mOperating result(b) -37,537 -7,370 -30,016 7,521Non-owner movements in equity
Revaluation of equity investments 2,681 4,374 3,206 525Actuarial revaluations -3,383 -1,916 -1,916 1,467Other economic revaluations -3,554 1,298 -1,714 1,839
Total other economic flows - included in equity -4,256 3,757 -424 3,831
Comprehensive result - Total change in net worth -41,793 -3,613 -30,440 11,353
Net operating balance -36,237 -11,129 -37,151 -914Net acquisition of non-financial assetsPurchases of non-financial assets 11,622 3,075 11,553 -70less Sales of non-financial assets 2,348 118 2,423 74less Depreciation 6,804 446 6,805 1plus Change in inventories 494 205 581 87plus Other movements in non-financial assets 174 9 -201 -374Total net acquisition of non-financial assets 3,138 2,725 2,706 -433Fiscal balance (Net lending/borrowing)(c) -39,375 -13,854 -39,857 -481 (a) Consistent with ABS GFS classification, other employee related expenses are reported under other
operating expenses. Total employee expenses equal wages and salaries plus other operating expenses. (b) Operating result under AAS. (c) The term fiscal balance is not used by the ABS. (d) The month of June is derived by deducting May year-to-date published data from the annual outcome.
Statistically, June movements in some series relate to earlier published months that are not reissued; this can result in negative movements.
Part 2: Australian Government Financial Statements
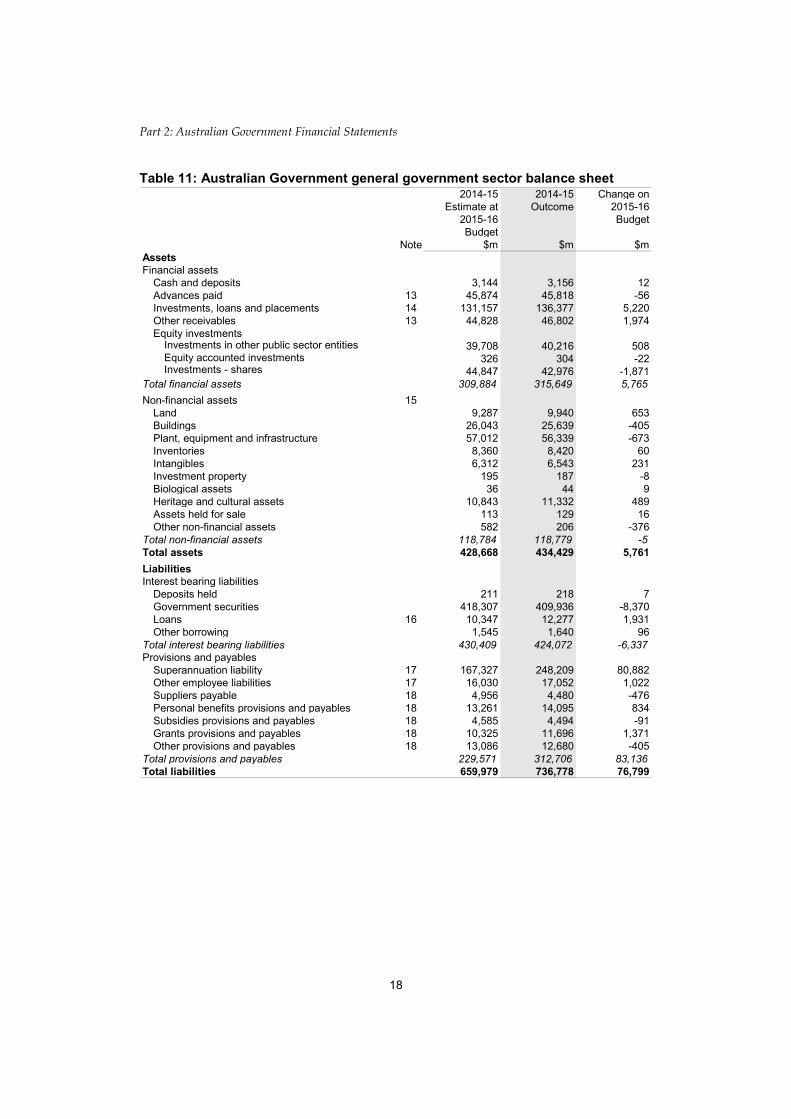
18
Table 11: Australian Government general government sector balance sheet 2014-15 2014-15 Change on
Estimate at Outcome 2015-162015-16 BudgetBudget
Note $m $m $mAssetsFinancial assets
Cash and deposits 3,144 3,156 12Advances paid 13 45,874 45,818 -56Investments, loans and placements 14 131,157 136,377 5,220Other receivables 13 44,828 46,802 1,974Equity investments
Investments in other public sector entities 39,708 40,216 508Equity accounted investments 326 304 -22Investments - shares 44,847 42,976 -1,871
Total financial assets 309,884 315,649 5,765Non-financial assets 15
Land 9,287 9,940 653Buildings 26,043 25,639 -405Plant, equipment and infrastructure 57,012 56,339 -673Inventories 8,360 8,420 60Intangibles 6,312 6,543 231Investment property 195 187 -8Biological assets 36 44 9Heritage and cultural assets 10,843 11,332 489Assets held for sale 113 129 16Other non-financial assets 582 206 -376
Total non-financial assets 118,784 118,779 -5Total assets 428,668 434,429 5,761LiabilitiesInterest bearing liabilities
Deposits held 211 218 7Government securities 418,307 409,936 -8,370Loans 16 10,347 12,277 1,931Other borrowing 1,545 1,640 96
Total interest bearing liabilities 430,409 424,072 -6,337Provisions and payables
Superannuation liability 17 167,327 248,209 80,882Other employee liabilities 17 16,030 17,052 1,022Suppliers payable 18 4,956 4,480 -476Personal benefits provisions and payables 18 13,261 14,095 834Subsidies provisions and payables 18 4,585 4,494 -91Grants provisions and payables 18 10,325 11,696 1,371Other provisions and payables 18 13,086 12,680 -405
Total provisions and payables 229,571 312,706 83,136Total liabilities 659,979 736,778 76,799

Part 2: Australian Government Financial Statements
19
Table 11: Australian Government general government sector balance sheet (continued)
2014-15 2014-15 Change onEstimate at Outcome 2015-16
2015-16 BudgetBudget
$m $m $mNet worth(a) -231,311 -302,350 -71,038Net financial worth(b) -350,096 -421,129 -71,034Net financial liabilities(c) 389,804 461,345 71,541Net debt(d) 250,234 238,721 -11,513 (a) Net worth is calculated as total assets minus total liabilities. (b) Net financial worth equals total financial assets minus total liabilities. (c) Net financial liabilities equals total liabilities less financial assets other than investments in other public
sector entities. (d) Net debt equals the sum of deposits held, government securities, loans and other borrowing, minus the
sum of cash and deposits, advances paid and investments, loans and placements.

Part 2: Australian Government Financial Statements
20
Table 12: Australian Government general government sector cash flow statement(a)
2014-15 Month of 2014-15 Change onEstimate at June 2015(d) Outcome 2015-16
2015-16 BudgetBudget
$m $m $m $mCash receipts from operating activitiesTaxes received 351,452 32,188 351,675 222Receipts from sales of goods and services 9,218 850 8,922 -297Interest receipts 3,131 589 3,056 -75Dividends and income tax equivalents 4,121 182 4,745 624Other receipts 7,164 1,203 7,598 435Total operating receipts 375,087 35,012 375,995 909Cash payments for operating activitiesPayments for employees -26,061 -1,976 -25,775 286Payments for goods and services -80,293 -8,276 -80,336 -43Grants and subsidies paid -146,048 -16,506 -144,512 1,535Interest paid -14,037 -637 -13,924 113Personal benefit payments -131,520 -9,995 -130,891 629Other payments -5,247 -822 -5,289 -42Total operating payments -403,206 -38,213 -400,727 2,479Net cash flows from operating activities -28,119 -3,201 -24,731 3,388Cash flows from investments in
non-financial assetsSales of non-financial assets 2,222 155 2,305 83Purchases of non-financial assets -11,795 -3,143 -11,280 514Net cash flows from investments in
non-financial assets -9,572 -2,988 -8,975 597Net cash flows from investments in
financial assets for policy purposes -5,500 -941 -5,158 342Cash flows from investments in
financial assets for liquidity purposesIncrease in investments -9,021 1,091 -11,957 -2,936Net cash flows from investments in
financial assets for liquidity purposes -9,021 1,091 -11,957 -2,936Cash receipts from financing activities Borrowing 53,695 6,102 52,381 -1,314Other financing 48 -2 -1 -49Total cash receipts from financing activities 53,743 6,100 52,380 -1,363Cash payments for financing activitiesBorrowing 0 0 0 0Other financing -2,231 -77 -2,247 -16Total cash payments for financing activities -2,231 -77 -2,247 -16Net cash flows from financing activities 51,512 6,023 50,133 -1,379Net increase/(decrease) in cash held -701 -16 -689 12

Part 2: Australian Government Financial Statements
21
Table 12: Australian Government general government sector cash flow statement (continued)(a)
2014-15 Month of 2014-15 Change onEstimate at June 2015(d) Outcome 2015-16
2015-16 BudgetBudget
$m $m $m $mNet cash flows from operating activities and investments in non-financial assets (Surplus(+)/deficit(-)) -37,691 -6,189 -33,706 3,985Finance leases and similar arrangements(b) 0 -15 -72 -72GFS cash surplus(+)/deficit(-) -37,691 -6,204 -33,778 3,913less Net Future Fund earnings 3,429 205 4,089 660Equals underlying cash balance(c) -41,121 -6,409 -37,867 3,253plus Net cash flows from investments in
financial assets for policy purposes -5,500 -941 -5,158 342plus Net Future Fund earnings 3,429 205 4,089 660Equals headline cash balance -43,191 -7,145 -38,936 4,255 (a) A positive number denotes a cash inflow; a negative number denotes a cash outflow. (b) The acquisition of assets under finance leases decreases the underlying cash balance. The disposal of
assets previously held under finance leases increases the underlying cash balance. (c) The term underlying cash balance is not used by the ABS. (d) The month of June is derived by deducting May year-to-date published data from the annual outcome.
Statistically, June movements in some series relate to earlier published months that are not reissued; this can result in negative movements.

Part 2: Australian Government Financial Statements
22
Table 13: Australian Government public non-financial corporations sector operating statement
2014-15 2014-15 Change onEstimate at Outcome 2015-16
2015-16 BudgetBudget
$m $m $mRevenueCurrent grants and subsidies 73 54 -19Sales of goods and services 9,640 9,840 200Interest income 41 44 3Other 10 49 39Total revenue 9,764 9,987 223ExpensesGross operating expenses
Wages and salaries(a) 3,793 3,764 -29Superannuation 381 354 -27Depreciation and amortisation 1,256 1,191 -65Supply of goods and services 5,271 5,189 -82Other operating expenses(a) 543 806 262
Total gross operating expenses 11,244 11,304 60Interest expenses 445 420 -25Other property expenses 65 94 28Current transfers
Tax expenses 70 32 -38Total current transfers 70 32 -38Total expenses 11,825 11,850 25Net operating balance -2,061 -1,863 198Other economic flows -410 285 694Comprehensive result - Total change in net worth -2,471 -1,578 892excluding contribution from ownersNet acquisition of non-financial assetsPurchases of non-financial assets 2,678 4,233 1,555less Sales of non-financial assets 77 75 -2less Depreciation 1,256 1,191 -65plus Change in inventories 7 8 2plus Other movements in non-financial assets 1,200 18 -1,182Total net acquisition of non-financial assets 2,552 2,993 441Fiscal balance (Net lending/borrowing)(b) -4,613 -4,856 -243
(a) Consistent with ABS GFS classification, other employee related expenses are reported under other operating expenses. Total employee expenses equal wages and salaries plus other operating expenses.
(b) The term fiscal balance is not used by the ABS.

Part 2: Australian Government Financial Statements
23
Table 14: Australian Government public non-financial corporations sector balance sheet
2014-15 2014-15 Change onEstimate at Outcome 2015-16
2015-16 BudgetBudget
$m $m $mAssetsFinancial assets
Cash and deposits 1,703 2,042 340Investments, loans and placements 106 1,137 1,030Other receivables 1,681 1,459 -222Equity investments 3 3 0
Total financial assets 3,492 4,640 1,148Non-financial assets
Land and other fixed assets 18,773 21,744 2,970Other non-financial assets(a) 3,626 236 -3,390
Total non-financial assets 22,400 21,979 -420Total assets 25,892 26,620 728LiabilitiesInterest bearing liabilities Advances received 319 337 18
Loans 2,242 2,330 88Other borrowing 3,766 3,834 68
Total interest bearing liabilities 6,327 6,501 174Provisions and payables
Superannuation liability 5 5 1Other employee liabilities 1,463 1,588 126Other provisions and payables(a) 3,510 3,365 -145
Total provisions and payables 4,977 4,959 -18Total liabilities 11,304 11,460 156Shares and other contributed capital 14,588 15,159 572Net worth(b) 14,588 15,159 572Net financial worth(c) -7,812 -6,820 992Net debt(d) 4,518 3,322 -1,196
(a) Excludes the impact of commercial taxation adjustments. (b) Under AASB 1049, net worth is calculated as total assets minus total liabilities. Under ABS GFS, net
worth is calculated as total assets minus total liabilities minus shares and other contributed capital. The AASB 1049 method is used in this table.
(c) Under AASB 1049, net financial worth equals total financial assets minus total liabilities. Under ABS GFS, net financial worth equals total financial assets minus total liabilities, minus shares and other contributed capital. The AASB 1049 method is used in this table.
(d) Net debt equals the sum of interest bearing liabilities (deposits held, advances received, loans and other borrowing), minus the sum of cash and deposits and investments, loans and placements.

Part 2: Australian Government Financial Statements
24
Table 15: Australian Government public non-financial corporations sector cash flow statement(a)
2014-15 2014-15 Change onEstimate at Outcome 2015-16
2015-16 BudgetBudget
$m $m $mCash receipts from operating activitiesReceipts from sales of goods and services 10,257 10,732 475Grants and subsidies received 0 23 23GST input credit receipts 428 370 -58Other receipts 65 56 -9Total operating receipts 10,750 11,181 431Cash payments for operating activitiesPayments to employees -4,510 -4,667 -158Payment for goods and services -7,016 -6,154 863Interest paid -67 -57 10GST payments to taxation authority -43 -317 -274Other payments -48 -44 4Total operating payments -11,683 -11,238 445Net cash flows from operating activities -933 -57 876Cash flows from investments in non-financial assetsSales of non-financial assets 71 75 4Purchases of non-financial assets -3,851 -3,801 50Net cash flows from investments in non-financial assets -3,781 -3,726 55Net cash flows from investments in financial assets
for policy purposes 0 0 0Cash flows from investments in financial assets
for liquidity purposesIncrease in investments 72 -46 -118Net cash flows from investments in financial assets
for liquidity purposes 72 -46 -118Net cash flows from financing activitiesBorrowing (net) -86 105 191Other financing (net) 5,150 4,483 -667Distributions paid (net) -100 -96 4Net cash flows from financing activities 4,965 4,492 -473Net increase/(decrease) in cash held 323 662 340Cash at the beginning of the year 1,380 1,380 0Cash at the end of the year 1,703 2,042 340Net cash from operating activities and investments in
non-financial assets -4,714 -3,784 931Distributions paid -100 -96 4Equals surplus(+)/deficit(-) -4,814 -3,880 934Finance leases and similar arrangements(b) 0 -408 -408GFS cash surplus(+)/deficit(-) -4,814 -4,288 526
(a) A positive number denotes a cash inflow; a negative number denotes a cash outflow. (b) The acquisition of assets under finance leases decreases the surplus or increases the deficit. The
disposal of assets previously held under finance leases increases the surplus or decreases the deficit.

Part 2: Australian Government Financial Statements
25
Table 16: Australian Government total non-financial public sector operating statement
2014-15 2014-15 Change onEstimate at Outcome 2015-16
2015-16 BudgetBudget
$m $m $mRevenueTaxation revenue 359,046 355,325 -3,721Sales of goods and services 17,533 17,373 -159Interest income 3,676 3,173 -502Dividend income 4,731 6,084 1,353Other 7,265 7,055 -210Total revenue 392,250 389,011 -3,240ExpensesGross operating expenses
Wages and salaries(a) 22,732 22,121 -611Superannuation 7,184 7,281 97Depreciation and amortisation 8,060 7,996 -64Supply of goods and services 84,362 83,119 -1,243Other operating expenses(a) 6,045 6,552 507
Total gross operating expenses 128,382 127,068 -1,314Superannuation interest expense 8,989 8,999 10Interest expenses 16,341 16,424 83Current transfers
Current grants 124,435 124,636 201Subsidy expenses 12,449 12,452 3Personal benefits 130,663 129,190 -1,474
Total current transfers 267,547 266,278 -1,269Capital transfers 9,288 9,255 -34Total expenses 430,548 428,025 -2,524Net operating balance -38,298 -39,014 -716Other economic flows -3,775 9,520 13,295Comprehensive result - Total change in net worth -42,073 -29,494 12,579Net acquisition of non-financial assets Purchases of non-financial assets 14,300 15,785 1,485less Sales of non-financial assets 2,425 2,497 72less Depreciation 8,060 7,996 -64plus Change in inventories 501 590 88plus Other movements in non-financial assets 1,373 -183 -1,557Total net acquisition of non-financial assets 5,690 5,699 8Fiscal balance (Net lending/borrowing)(b) -43,988 -44,713 -724
(a) Consistent with ABS GFS classification, other employee related expenses are reported under other operating expenses. Total employee expenses equal wages and salaries plus other operating expenses.
(b) The term fiscal balance is not used by the ABS.

Part 2: Australian Government Financial Statements
26
Table 17: Australian Government total non-financial public sector balance sheet 2014-15 2014-15 Change on
Estimate at Outcome 2015-162015-16 BudgetBudget
$m $m $mAssetsFinancial assets
Cash and deposits 4,846 5,198 352Advances paid 45,555 45,481 -74Investments, loans and placements 131,263 137,176 5,913Other receivables 46,360 47,234 874Equity investments 69,487 68,756 -731
Total financial assets 297,512 303,846 6,334Non-financial assets
Land and other fixed assets 130,319 133,414 3,094Other non-financial assets 10,864 7,345 -3,519
Total non-financial assets 141,184 140,759 -425Total assets 438,696 444,605 5,909LiabilitiesInterest bearing liabilities
Deposits held 211 218 7Advances received 0 0 0Government securities 418,307 409,936 -8,370Loans 12,589 14,270 1,681Other borrowing 5,311 5,475 164
Total interest bearing liabilities 436,417 429,899 -6,518Provisions and payables
Superannuation liability 167,332 248,214 80,883Other employee liabilities 17,493 18,640 1,147Other provisions and payables 49,575 49,784 208
Total provisions and payables 234,400 316,639 82,239Total liabilities 670,817 746,538 75,720Shares and other contributed capital 14,588 15,159 572Net worth(a) -232,121 -301,933 -69,812Net financial worth(b) -373,305 -442,692 -69,387Net debt(c) 254,752 242,043 -12,709 (a) Under AASB 1049, net worth is calculated as total assets minus total liabilities. Under ABS GFS, net
worth is calculated as total assets minus total liabilities minus shares and other contributed capital. The AASB 1049 method is used in this table.
(b) Under AASB 1049, net financial worth equals total financial assets minus total liabilities. Under ABS GFS, net financial worth equals total financial assets minus total liabilities, minus shares and other contributed capital. The AASB 1049 method is used in this table.
(c) Net debt equals the sum of deposits held, advances received, government securities, loans and other borrowing, minus the sum of cash and deposits, advances paid and investments, loans and placements.

Part 2: Australian Government Financial Statements
27
Table 18: Australian Government total non-financial public sector cash flow statement(a)
2014-15 2014-15 Change onEstimate at Outcome 2015-16
2015-16 BudgetBudget
$m $m $mCash receipts from operating activitiesTaxes received 351,409 351,700 292Receipts from sales of goods and services 17,913 17,222 -691Interest receipts 3,151 3,082 -69Dividends and income tax equivalents 4,021 4,649 628Other receipts 7,190 7,610 419Total operating receipts 383,684 384,263 578Cash payments for operating activitiesPayments to employees -30,571 -30,443 128Payments for goods and services -85,362 -84,072 1,289Grants and subsidies paid -146,048 -144,490 1,558Interest paid -14,085 -13,963 123Personal benefit payments -131,520 -130,891 629Other payments -5,251 -5,289 -38Total operating payments -412,836 -409,147 3,689Net cash flows from operating activities -29,152 -24,885 4,268Cash flows from investments in non-financial assetsSales of non-financial assets 2,293 2,380 87Purchases of non-financial assets -15,646 -15,082 564Net cash flows from investments in non-financial assets -13,353 -12,701 652Net cash flows from investments in financial assets
for policy purposes -362 -341 21Cash flows from investments in financial assets
for liquidity purposesIncrease in investments -8,949 -12,003 -3,054Net cash flows from investments in financial assets
for liquidity purposes -8,949 -12,003 -3,054Net cash flows from financing activitiesBorrowing (net) 53,609 52,486 -1,123Other financing (net) -2,171 -2,583 -412Net cash flows from financing activities 51,439 49,903 -1,535Net increase/(decrease) in cash held -378 -27 352Cash at the beginning of the year 5,225 5,225 0Cash at the end of the year 4,846 5,198 352Net cash from operating activities and investments
in non-financial assets -42,505 -37,586 4,919Distributions paid 0 0 0Equals surplus(+)/deficit(-) -42,505 -37,586 4,919Finance leases and similar arrangements(b) 0 -481 -481GFS cash surplus(+)/deficit(-) -42,505 -38,067 4,439 (a) A positive number denotes a cash inflow; a negative number denotes a cash outflow. (b) The acquisition of assets under finance leases decreases the surplus or increases the deficit. The
disposal of assets previously held under finance leases increases the surplus or decreases the deficit.

Part 2: Australian Government Financial Statements
28
Table 19: Australian Government public financial corporations sector operating statement
2014-15 2014-15 Change onEstimate at Outcome 2015-16
2015-16 BudgetBudget
$m $m $mRevenueCurrent grants and subsidies 150 159 9Sales of goods and services 3,233 3,257 24Interest income 2,290 2,272 -18Other 99 88 -10Total revenue 5,772 5,776 4ExpensesGross operating expenses
Wages and salaries(a) 269 286 18Superannuation 67 66 -1Depreciation and amortisation 44 57 12Supply of goods and services(b) 2,818 2,776 -43Other operating expenses(a)(b) 425 248 -176
Total gross operating expenses 3,623 3,433 -190Interest expenses 1,331 1,313 -18Other property expenses 1,478 2,198 720Current transfers
Tax expenses 47 41 -7Total current transfers 47 41 -7Total expenses 6,479 6,984 505Net operating balance -707 -1,208 -501Other economic flows 3,983 5,435 1,452Comprehensive result - Total change in net worth 3,276 4,227 951excluding contribution from ownersNet acquisition of non-financial assets Purchases of non-financial assets 11 53 43less Sales of non-financial assets 80 0 -80less Depreciation 44 57 12plus Change in inventories -11 -2 9plus Other movements in non-financial assets -2 -11 -9Total net acquisition of non-financial assets -127 -17 111Fiscal balance (Net lending/borrowing)(c) -579 -1,192 -612
(a) Consistent with ABS GFS classification and PNFC presentation, from 2015-16 Budget, other employee related expenses, such as employee entitlements, are reclassified from wages and salaries to other operating expenses. Total employee expenses equal wages and salaries plus other operating expenses.
(b) Consistent with ABS GFS classification and PNFC presentation, from 2015-16 Budget, supply of goods and services has been separated from other operating expenses.
(c) The term fiscal balance is not used by the ABS.

Part 2: Australian Government Financial Statements
29
Table 20: Australian Government public financial corporations sector balance sheet
2014-15 2014-15 Change onEstimate at Outcome 2015-16
2015-16 BudgetBudget
$m $m $mAssetsFinancial assets
Cash and deposits 369 480 111Investments, loans and placements 160,736 160,350 -386Other receivables 324 255 -70Equity investments 376 401 25
Total financial assets 161,805 161,485 -320Non-financial assets
Land and other fixed assets 615 651 36Other non-financial assets(a) 41 32 -9
Total non-financial assets 656 683 27Total assets 162,461 162,168 -293LiabilitiesInterest bearing liabilities
Deposits held 121,805 125,968 4,163Borrowing 12,821 6,968 -5,853
Total interest bearing liabilities 134,626 132,936 -1,690Provisions and payables
Superannuation liability 197 64 -133Other employee liabilities 1,547 1,379 -168Other provisions and payables(a) 1,978 2,726 748
Total provisions and payables 3,722 4,169 447Total liabilities 138,348 137,105 -1,243Shares and other contributed capital 24,113 25,064 951Net worth(b) 24,113 25,064 951Net financial worth(c) 23,457 24,381 924Net debt(d) -26,479 -27,894 -1,415
(a) Excludes the impact of commercial taxation adjustments. (b) Under AASB 1049, net worth is calculated as total assets minus total liabilities. Under ABS GFS, net
worth is calculated as total assets minus total liabilities minus shares and other contributed capital. The AASB 1049 method is used in this table.
(c) Under AASB 1049, net financial worth equals total financial assets minus total liabilities. Under ABS GFS, net financial worth equals total financial assets minus total liabilities minus shares and other contributed capital. The AASB 1049 method is used in this table.
(d) Net debt equals the sum of deposits held, advances received and borrowing, minus the sum of cash and deposits, advances paid and investments, loans and placements.

Part 2: Australian Government Financial Statements
30
Table 21: Australian Government public financial corporations sector cash flow statement(a)
2014-15 2014-15 Change onEstimate at Outcome 2015-16
2015-16 BudgetBudget
$m $m $mCash receipts from operating activitiesReceipts from sales of goods and services 2,939 3,104 164Grants and subsidies received 0 159 159GST input credit receipts 15 18 3Interest receipts 1,719 2,327 608Other receipts 410 109 -301Total operating receipts 5,083 5,717 633Cash payments for operating activitiesPayments to employees -513 -408 105Payment for goods and services -2,714 -2,766 -51Interest paid -1,021 -1,366 -345GST payments to taxation authority 0 0 0Other payments(b) -40 -201 -161Total operating payments -4,289 -4,741 -452Net cash flows from operating activities 794 976 182Cash flows from investments in non-financial assetsSales of non-financial assets 80 0 -80Purchases of non-financial assets -18 -53 -34Net cash flows from investments in non-financial assets 62 -52 -114Net cash flows from investments in financial assets
for policy purposes 0 -63 -63Cash flows from investments in financial assets
for liquidity purposesIncrease in investments(b) -7,592 -12,315 -4,724Net cash flows from investments in financial assets
for liquidity purposes -7,592 -12,315 -4,724Net cash flows from financing activitiesAdvances received (net) 0 0 0Borrowing (net) 2,438 6,381 3,943Deposits received (net) 0 0 0Other financing (net) 4,569 5,456 888Distributions paid (net) -932 -932 0
Net cash flows from financing activities 6,075 10,905 4,830Net increase/(decrease) in cash held -661 -550 111Cash at the beginning of the year 1,030 1,030 0Cash at the end of the year 369 480 111

Part 2: Australian Government Financial Statements
31
Table 21: Australian Government public financial corporations sector cash flow statement (continued)(a)
2014-15 2014-15 Change onEstimate at Outcome 2015-16
2015-16 BudgetBudget
$m $m $mNet cash from operating activities and investments in
non-financial assets 856 923 68Distributions paid -932 -932 0Equals surplus(+)/deficit(-) -76 -9 68Finance leases and similar arrangements(c) 0 0 0GFS cash surplus(+)/deficit(-) -76 -9 68 (a) A positive number denotes a cash inflow; a negative number denotes a cash outflow. (b) In accordance with AASB1049, the estimate for other payments has been reclassified from operating to
investing to provide consistency in treatment of transactions in investments with the actual outcome and with the other sectors.
(c) The acquisition of assets under finance leases decreases the surplus or increases the deficit. The disposal of assets previously held under finance leases increases the surplus or decreases the deficit.

Part 2: Australian Government Financial Statements
32
Notes to the general government sector financial statements Note 1: External reporting standards and accounting policies
The Charter of Budget Honesty Act 1998 (the Charter) requires that the final budget outcome be based on external reporting standards and that departures from applicable external reporting standards be identified.
The external standards used for final budget outcome reporting purposes are:
• the Australian Bureau of Statistics’ (ABS) accrual Government Finance Statistics (GFS) publication, Australian System of Government Finance Statistics: Concepts, Sources and Methods 2005, (cat. no. 5514.0), which in turn is based on the International Monetary Fund (IMF) accrual GFS framework; and
• the Australian Accounting Standards (AAS), issued by the Australian Accounting Standards Board (AASB), which includes International Financial Reporting Standards (IFRS) as adopted in Australia and the public sector specific standard AASB 1049 Whole of Government and General Government Sector Financial Reporting.
The financial statements have been prepared on an accrual basis that complies with both ABS GFS and AAS, except for departures disclosed at Note 2. A more detailed description of the AAS and ABS GFS frameworks, in addition to definitions of key terms used in these frameworks, can be found in Attachment A. Detailed accounting policies, as well as a set of notes and other disclosures, as required by AAS, are disclosed in the annual Consolidated Financial Statements.
Fiscal reporting focuses on the general government sector (GGS). The GGS provides public services that are mainly non-market in nature and for the collective consumption of the community, or involve the transfer or redistribution of income. These services are largely financed through taxes and other compulsory levies, user charging and external funding. This sector comprises all government departments, offices and some other bodies. In preparing financial statements for the GGS, all material transactions and balances between entities within the GGS have been eliminated. The statements for the GGS are based on audit cleared financial statements for material agencies.
The Government’s key fiscal aggregates are based on ABS GFS concepts and definitions, including the ABS GFS cash surplus/deficit and the derivation of the underlying cash balance and net financial worth. AASB 1049 requires the disclosure of other ABS GFS fiscal aggregates, including net operating balance, net lending/borrowing (fiscal balance) and net worth. In addition to these ABS GFS aggregates, the Uniform Presentation Framework (UPF) requires disclosure of net debt, net financial worth and net financial liabilities.

Part 2: Australian Government Financial Statements
33
AASB 1049 and the UPF also provide a basis for reporting of the public non-financial corporations (PNFC) and public financial corporations (PFC) sectors and the total non-financial public sector (NFPS).
AASB 1049 requires disaggregated information, by ABS GFS function, for expenses and total assets to be disclosed where they are reliably attributable. ABS GFS does not require total assets to be attributed to functions. In accordance with ABS GFS, disaggregated information for expenses and net acquisition of non-financial assets by function is disclosed in Part 1. In accordance with the UPF, purchases of non-financial assets by function are also disclosed in Part 1.
AASB 1049 also requires the Final Budget Outcome (FBO) and Consolidated Financial Statements (CFS) to be released at the same time. The Charter requires the FBO to be released before the end of three months after the end of the financial year, whereas the CFS is not released until it is audit cleared, generally around November each year.
AASB 1055 requires major variances between original budget estimates and outcomes to be explained in the financial statements. Explanations of major variances in fiscal balance, revenue, expenses, net capital investment, cash flows, net debt, net financial worth and net worth for the 2014-15 year from the 2014-15 Budget to the 2014-15 Mid-Year Economic and Fiscal Outlook (MYEFO) are discussed in Part 3 of the 2014-15 MYEFO. Explanations of variances for the 2014-15 year from MYEFO to the 2015-16 Budget are disclosed in Statement 3 of 2015-16 Budget Paper No. 1, Budget Strategy and Outlook. Explanations of variances from the 2015-16 Budget to the Final Budget Outcome 2014-15 are disclosed in Part 1.
Note 2: Departures from external reporting standards
The Charter requires that departures from applicable external reporting standards be identified. The major differences between AAS and the ABS GFS treatments of transactions are outlined in Table 22.
AASB 1049 requires AAS measurement of items to be disclosed on the face of the financial statements with reconciliation to ABS GFS measurement of key fiscal aggregates, where different, in notes to the financial statements. Differences from the AAS measurement of items outline above and reconciliation have not been included as they would effectively create different measures of the same aggregate.
Further information on the differences between the two systems is provided in the ABS publication Australian System of Government Finance Statistics: Concepts, Sources and Methods, 2005 (cat. no. 5514.0).

Part 2: Australian Government Financial Statements
34
Table 22: Major differences between AAS and ABS GFS
Issue AAS treatment ABS GFS treatment Treatment adopted
Acquisition of defence weapons platforms (DWP)
AASB 1049 requires cost to be used where fair value of assets cannot be reliably measured.
ABS record DWP on a market value basis using the perpetual inventory method.
AAS
Circulating coins — seigniorage
The profit between the cost and sale of circulating coins (seigniorage) is treated as revenue.
Circulating coins are treated as a liability, and the cost of producing the coins is treated as an expense.
AAS
Provisions for bad and doubtful debts
Reported in the balance sheet as an offset to assets. Under AASB 1049, it is included in the operating statement as other economic flows.
Creating provisions for bad and doubtful debts is not considered an economic event and therefore not considered to be an expense or reflected in the balance sheet.
AAS
Advances to the International Development Association and Asian Development Fund
Recorded at fair value in the balance sheet.
Recorded at nominal value in balance sheet.
ABS GFS
Concessional loans
Discounts concessional loans by a market rate of a similar instrument.
Does not discount concessional loans as no secondary market is considered to exist.
AAS
Investment in other public sector entities
Valued at fair value in the balance sheet as long as it can be reliably measured, otherwise net assets is permissible.
Unlisted entities valued based on their net assets in the balance sheet.
AAS
Provision for restoration, decommissioning and makegood
Included in the fiscal balance capital adjustment.
Excluded from the calculation of net lending capital adjustment.
AAS
Renewable Energy Certificates (RECs)
The issuance and registration of RECs is considered to be an administrative function and does not result in the recognition of assets or liabilities and, consequently, no revenues or expenses are recognised.
The issuance and registration of RECs is considered to be government financial transactions resulting in the recognition of assets, liabilities, revenue and expenses.
AAS
Dividends paid by public corporations
Treated as an equity distribution. Equity distributions are treated as a distribution of profits, as opposed to an expense.
Dividends are treated as an expense.
ABS GFS

Part 2: Australian Government Financial Statements
35
Table 22: Major differences between AAS and ABS GFS (continued)
Issue AAS treatment ABS GFS treatment Treatment adopted
Commercial tax effect accounting assets and liabilities
Corporations in the PNFC and PFC sectors record tax expenses on a commercial basis.
Deferred tax assets and liabilities are reversed so that corporations record tax expenses on a consistent basis to the Australian Taxation Office.
ABS GFS
Fiscal aggregates differences
Finance leases
Does not deduct finance leases in the derivation of the cash surplus/deficit.
Deducts finance leases in the derivation of the cash surplus/deficit.
Both are disclosed
Net worth of PNFC and PFC sectors
Calculated as assets less liabilities. Calculated as assets less liabilities less shares and other contributed capital.
AAS
Net financial worth of PNFC and PFC
Calculated as financial assets less total liabilities.
Calculated as financial assets less total liabilities less shares and contributed capital.
AAS
Classification difference
Prepayments Treated as a non-financial asset. Treated as a financial asset. ABS GFS
Spectrum sales
Recognise non-financial asset sales for fiscal balance when payment is made and the licences take effect, which may be after the auction of licences, as this is regarded as the point control is transferred. Recognise cash at the time of receipt.
Recognise non-financial asset sales for fiscal balance at time of auction as this is regarded as the point control is transferred. Recognise cash at the time of receipt.
AAS

Part 2: Australian Government Financial Statements
36
Note 3: Taxation revenue by type 2014-15 2014-15 Change on
Estimate at Outcome 2015-162015-16 BudgetBudget
$m $m $mIndividuals and other withholding taxes
Gross income tax withholding 167,860 167,645 -215Gross other individuals 40,600 40,565 -35less Refunds 27,300 27,033 -267
Total individuals and other withholding taxation 181,160 181,177 17Fringe benefits tax 4,480 4,393 -87Company tax 69,900 66,311 -3,589Superannuation fund taxes 6,200 5,890 -310Minerals resource rent tax(a) 60 63 3Petroleum resource rent tax 1,640 1,319 -321Income taxation revenue 263,440 259,151 -4,289Goods and services tax 56,690 56,462 -228Wine equalisation tax 820 828 8Luxury car tax 510 540 30Excise and customs duty
Petrol 6,020 6,042 22Diesel 8,830 8,918 88Other fuel products 2,980 2,887 -93Tobacco 8,290 8,826 536Beer 2,350 2,312 -38Spirits 1,980 1,997 17Other alcoholic beverages(b) 910 900 -10Other customs duty Textiles, clothing and footwear 650 645 -5 Passenger motor vehicles 700 732 32 Other imports 1,600 1,665 65less Refunds and drawbacks 420 356 -64
Total excise and customs duty 33,890 34,570 680Agricultural levies 492 509 17Other taxes 3,275 3,295 21
Mirror taxes 509 503 -6less Transfers to States in relation to mirror tax revenue 509 503 -6
Mirror tax revenue 0 0 0
Indirect taxation revenue 95,677 96,205 529Taxation revenue 359,117 355,357 -3,759Memorandum: Total excise 24,140 23,687 -453 Total customs duty 9,750 10,884 1,134 Medicare and DisabilityCare Australia levy (c) 14,050 14,640 590 (a) The MRRT applied until 30 September 2014. (b) Other alcoholic beverages are those not exceeding 10 per cent by volume of alcohol (excluding beer,
brandy and wine). (c) From the 2014-15 Budget, Medicare and DisabilityCare Australia levy revenue is based on when
collections relating to the levy are received.

Part 2: Australian Government Financial Statements
37
Note 3(a): Taxation revenue by source 2014-15 2014-15 Change on
Estimate at Outcome 2015-162015-16 BudgetBudget
$m $m $mTaxes on income, profits and capital gains
Income and capital gains levied on individuals 185,660 185,578 -82Income and capital gains levied on enterprises 77,780 73,573 -4,207
Total taxes on income, profits and capital gains 263,440 259,151 -4,289Taxes on employers' payroll and labour force 738 735 -3Taxes on the provision of goods and services
Sales/goods and services tax 58,020 57,830 -190Excises and levies 24,632 24,196 -436Taxes on international trade 9,750 10,884 1,134
Total taxes on the provision of goods and services 92,402 92,910 508Other sale of goods and services 2,537 2,561 24
Total taxation revenue 359,117 355,357 -3,759Memorandum:
Medicare and DisabilityCare Australia levy 14,050 14,640 590
Note 4: Sales of goods and services revenue 2014-15 2014-15 Change on
Estimate at Outcome 2015-162015-16 BudgetBudget
$m $m $mSales of goods 1,620 1,547 -73Rendering of services 4,060 3,767 -293Operating lease rental 66 44 -22Fees from regulatory services 3,531 3,700 169Total sales of goods and services revenue 9,277 9,058 -219

Part 2: Australian Government Financial Statements
38
Note 5: Interest and dividend revenue 2014-15 2014-15 Change on
Estimate at Outcome 2015-162015-16 BudgetBudget
$m $m $mInterest from other governments
State and Territory debt 18 21 3Housing agreements 134 116 -18
Total interest from other governments 152 138 -14Interest from other sources
Advances 46 47 1Deposits 85 104 19Bank deposits 160 178 18Indexation of HELP receivable and other student loans 538 567 29Other 2,671 2,112 -559
Total interest from other sources 3,501 3,009 -492Total interest 3,653 3,147 -506Dividends
Dividends from other public sector entities 1,581 2,324 743Other dividends 3,215 3,854 639
Total dividends 4,796 6,178 1,382Total interest and dividend revenue 8,449 9,325 876
Note 6: Other sources of non-taxation revenue 2014-15 2014-15 Change on
Estimate at Outcome 2015-162015-16 BudgetBudget
$m $m $mIndustry contributions 56 90 34Royalties 1,496 1,402 -94Seigniorage 110 111 1Other 5,593 5,404 -190Total other sources of non-taxation revenue 7,255 7,006 -249

Part 2: Australian Government Financial Statements
39
Note 7: Employee and superannuation expense 2014-15 2014-15 Change on
Estimate at Outcome 2015-162015-16 BudgetBudget
$m $m $mWages and salaries expenses 18,939 18,357 -582Other operating expenses
Leave and other entitlements 2,351 2,530 179Separations and redundancies 255 372 117Workers compensation premiums and claims 783 754 -29Other 2,112 2,090 -22
Total other operating expenses 5,502 5,746 244Superannuation expenses
Superannuation 6,803 6,927 124Superannuation interest cost 8,989 8,999 10
Total superannuation expenses 15,792 15,927 134Total employee and superannuation expense 40,233 40,029 -204
Note 8: Depreciation and amortisation expense 2014-15 2014-15 Change on
Estimate at Outcome 2015-162015-16 BudgetBudget
$m $m $mDepreciation
Specialist military equipment 3,053 2,872 -181Buildings 1,365 1,462 97Other infrastructure, plant and equipment 1,433 1,450 17Heritage and cultural assets 38 73 36
Total depreciation 5,889 5,858 -32Total amortisation 915 947 33Total depreciation and amortisation expense 6,804 6,805 1
Note 9: Supply of goods and services expense 2014-15 2014-15 Change on
Estimate at Outcome 2015-162015-16 BudgetBudget
$m $m $mSupply of goods and services 25,852 25,348 -504Operating lease rental expenses 2,494 2,555 61Personal benefits - indirect 44,666 44,028 -638Health care payments 5,307 5,080 -227Other 2,155 2,443 287Total payment for supply of goods and services 80,474 79,454 -1,020

Part 2: Australian Government Financial Statements
40
Note 10: Interest expense 2014-15 2014-15 Change on
Estimate at Outcome 2015-162015-16 BudgetBudget
$m $m $mInterest on debt
Government securities 14,450 14,473 23Loans 9 10 1Other 368 260 -108
Total interest on debt 14,827 14,743 -84Other financing costs 1,088 1,279 191Total interest expense 15,915 16,022 107
Note 11: Current and capital grants expense 2014-15 2014-15 Change on
Estimate at Outcome 2015-162015-16 BudgetBudget
$m $m $mCurrent grants expense
State and Territory governments 95,095 96,418 1,323Local governments 6 0 -6Private sector(a) 1,176 1,611 434Overseas 4,622 4,622 0Non-profit organisations(a)(b) 2,480 4,967 2,487Multi-jurisdictional sector 10,076 9,985 -91Other(b) 10,981 7,033 -3,948
Total current grants expense 124,435 124,636 201Capital grants expense
Mutually agreed write-downs 2,124 1,857 -268Other capital grants
State and Territory governments 6,162 6,594 432Local governments 445 410 -35Private sector 0 0 0Multi-jurisdictional sector 102 101 -1Other 455 293 -162
Total capital grants expense 9,288 9,255 -34Total grants expense 133,723 133,891 168 (a) Includes reallocation of some programs between grants to private sector and grants to non-profit
organisations since 2015-16 Budget. (b) Includes reallocation of some programs between grants to non-profit organisations and grants to other
since 2015-16 Budget.

Part 2: Australian Government Financial Statements
41
Note 12: Personal benefits expense 2014-15 2014-15 Change on
Estimate at Outcome 2015-162015-16 BudgetBudget
$m $m $mSocial welfare - assistance to the aged 42,416 42,353 -63Assistance to veterans and dependants 6,008 5,920 -89Assistance to people with disabilities 24,243 24,118 -124Assistance to families with children 34,199 33,610 -589Assistance to the unemployed 10,810 10,728 -83Student assistance 3,570 3,539 -31Other welfare programmes 1,155 1,139 -16Financial and fiscal affairs 477 344 -133Vocational and industry training 140 99 -41Other 7,645 7,339 -306Total personal benefit expense 130,663 129,190 -1,474
Note 13: Advances paid and other receivables 2014-15 2014-15 Change on
Estimate at Outcome 2015-162015-16 BudgetBudget
$m $m $mAdvances paid
Loans to State and Territory governments 3,160 3,146 -14Higher Education Loan Program 30,220 30,445 224Student Financial Supplement Scheme 553 531 -22Other 12,169 11,932 -238less Provision for doubtful debts 228 235 7
Total advances paid 45,874 45,818 -56Other receivables
Goods and services receivable 784 895 111Recoveries of benefit payments 3,818 4,206 388Taxes receivable 19,859 18,710 -1,149Prepayments 3,063 4,364 1,301Other 18,770 20,133 1,363less Provision for doubtful debts 1,465 1,505 40
Total other receivables 44,828 46,802 1,974

Part 2: Australian Government Financial Statements
42
Note 14: Investments, loans and placements 2014-15 2014-15 Change on
Estimate at Outcome 2015-162015-16 BudgetBudget
$m $m $mInvestments - deposits 39,805 42,556 2,751IMF quota 5,520 5,913 394Other 85,832 87,907 2,075Total investments, loans and placements 131,157 136,377 5,220
Note 15: Non-financial assets 2014-15 2014-15 Change on
Estimate at Outcome 2015-162015-16 BudgetBudget
$m $m $mLand and buildings
Land 9,287 9,940 653Buildings 26,043 25,639 -405
Total land and buildings 35,331 35,579 248Plant, equipment and infrastructure
Specialist military equipment 43,646 42,716 -930Other 13,366 13,623 257
Total plant, equipment and infrastructure 57,012 56,339 -673Inventories
Inventories held for sale 1,447 1,380 -67Inventories not held for sale 6,913 7,040 127
Total inventories 8,360 8,420 60Intangibles
Computer software 3,637 3,689 52Other 2,675 2,854 179
Total intangibles 6,312 6,543 231Total investment properties 195 187 -8Total biological assets 36 44 9Total heritage and cultural assets 10,843 11,332 489
Total assets held for sale 113 129 16
Total other non-financial assets 582 206 -376Total non-financial assets 118,784 118,779 -5
Note 16: Loans 2014-15 2014-15 Change on
Estimate at Outcome 2015-162015-16 BudgetBudget
$m $m $mPromissory notes 4,250 4,825 575Special drawing rights 5,258 5,633 375Other 838 1,819 981Total loans 10,347 12,277 1,931

Part 2: Australian Government Financial Statements
43
Note 17: Employee and superannuation liabilities 2014-15 2014-15 Change on
Estimate at Outcome 2015-162015-16 BudgetBudget
$m $m $mTotal superannuation liability(a) 167,327 248,209 80,882Other employee liabilities
Leave and other entitlements 7,389 7,263 -126Accrued salaries and wages 718 785 68Workers compensation claims 3,363 3,225 -138Other 4,561 5,778 1,218
Total other employee liabilities 16,030 17,052 1,022Total employee and superannuation liabilities 183,357 265,261 81,904 (a) For budget reporting purposes, a discount rate applied by actuaries in preparing Long-Term Cost
Reports is used to value the superannuation liability. This reduces the volatility in reported liabilities that would occur from year to year if the long-term government bond rate were used. Consistent with AAS, the long-term government bond rate as at 30 June is used to calculate the superannuation liability for the purpose of actuals reporting.
Note 18: Provisions and payables 2014-15 2014-15 Change on
Estimate at Outcome 2015-162015-16 BudgetBudget
$m $m $mSuppliers payable
Trade creditors 4,003 3,525 -479Operating lease rental payable 293 325 33Other creditors 660 630 -30
Total suppliers payable 4,956 4,480 -476Total personal benefits provisions and payables 13,261 14,095 834Total subsidies provisions and payables 4,585 4,494 -91Grants provisions and payables
State and Territory governments 107 630 523Non-profit organisations 62 180 118Private sector 237 33 -204Overseas 1,424 1,483 59Local governments 2 3 1Other 8,494 9,368 874
Total grants provisions and payables 10,325 11,696 1,371Other provisions and payables
Provisions for tax refunds 2,174 2,117 -57Other 10,912 10,564 -348
Total other provisions and payables 13,086 12,681 -405

Part 2: Australian Government Financial Statements
44
Note 19: Reconciliation of cash 2014-15 2014-15 Change on
Estimate at Outcome 2015-162015-16 BudgetBudget
$m $m $mOperating balance (revenues less expenses) -36,237 -37,151 -914less Revenues not providing cash
Other 1,585 745 -841Total revenues not providing cash 1,585 745 -841
plus Expenses not requiring cash Increase/(decrease) in employee entitlements 8,826 8,382 -444 Depreciation/amortisation expense 6,804 6,805 1 Mutually agreed write-downs 2,124 1,857 -268 Other 1,264 1,949 684
Total expenses not requiring cash 19,018 18,992 -26plus Cash provided / (used) by working capital items
Decrease / (increase) in inventories -272 -472 -199 Decrease / (increase) in receivables -5,611 -5,267 344 Decrease / (increase) in other financial assets 1,828 1,322 -505 Decrease / (increase) in other non-financial assets -119 -1,391 -1,272 Increase / (decrease) in benefits, subsidies and grants payable -3,463 502 3,965 Increase / (decrease) in suppliers' liabilities 670 2,284 1,614 Increase / (decrease) in other provisions and payables -2,348 -2,807 -459
Net cash provided / (used) by working capital -9,315 -5,827 3,487equals (Net cash from/(to) operating activities) -28,119 -24,731 3,388plus (Net cash from/(to) investing activities) -24,093 -26,090 -1,997Net cash from operating activities and investment -52,213 -50,822 1,391plus (Net cash from/(to) financing activities) 51,512 50,133 -1,379equals Net increase/(decrease) in cash -701 -689 12Cash at the beginning of the year 3,844 3,844 0Net increase/(decrease) in cash -701 -689 12Cash at the end of the year 3,144 3,156 12

Part 2: Australian Government Financial Statements
45
Attachment A
FINANCIAL REPORTING STANDARDS AND BUDGET CONCEPTS
The Final Budget Outcome primarily focuses on the financial performance and position of the general government sector (GGS). The ABS defines the GGS as providing public services which are mainly non-market in nature, mainly for the collective consumption of the community, involving the transfer or redistribution of income and financed mainly through taxes and other compulsory levies. AASB 1049 recognises the GGS as a reporting entity.
AASB 1049 History and conceptual framework The Australian Accounting Standards Board (AASB) released AASB 1049 for application from the 2008-09 financial year. AASB 1049 seeks to ‘harmonise’ ABS GFS and AAS.
The reporting framework for AASB 1049 requires the preparation of accrual-based general purpose financial reports, showing government assets, liabilities, revenue, expenses and cash flows. GGS reporting under AASB 1049 aims to provide users with information about the stewardship of each government in relation to its GGS and accountability for the resources entrusted to it; information about the financial position, performance and cash flows of each government’s GGS; and information that facilitates assessments of the macroeconomic impact. While AASB 1049 provides a basis for whole-of-government (including the PNFC and PFC sectors) and GGS outcome reporting, budget reporting and budget outcome reporting focuses on the GGS.
AASB 1049 has adopted the AAS conceptual framework and principles for the recognition of assets, liabilities, revenues and expenses and their presentation, measurement and disclosure. In addition, AASB 1049 has broadly adopted the ABS GFS conceptual framework for presenting government financial statements. In particular, AASB 1049 requires the GGS to prepare a separate set of financial statements, overriding AASB 10 Consolidated Financial Statements. AASB 1049 also follows ABS GFS by requiring changes in net worth to be split into either transactions or ‘other economic flows’ and for this to be presented in a single operating statement. AASB 1049 is therefore broadly consistent with international statistical standards and the International Monetary Fund’s (IMF) Government Finance Statistics Manual 2014.1
1 Additional information on the Australian accrual GFS framework is available in the ABS publication Australian System of Government Finance Statistics: Concepts, Sources and Methods, 2005 (cat. no. 5514.0).

Part 2: Australian Government Financial Statements
46
All financial data presented in the financial statements are recorded as either stocks (assets and liabilities) or flows (classified as either transactions or other economic flows). Transactions result from a mutually agreed interaction between economic entities. Despite their compulsory nature, taxes are transactions deemed to occur by mutual agreement between the government and the taxpayer. Transactions that increase or decrease net worth (assets less liabilities) are reported as revenues and expenses respectively in the operating statement.2
A change to the value or volume of an asset or liability that does not result from a transaction is an ‘other economic flow’. This can include changes in values from market prices, most actuarial valuations and exchange rates, and changes in volumes from discoveries, depletion and destruction. All ‘other economic flows’ are reported in the operating statement.
Consistent with the ABS GFS framework, and in general AAS, the financial statements record flows in the period in which they occur. As a result, prior period outcomes may be revised for classification changes relating to information that could reasonably have been expected to be known in the past, is material in at least one of the affected periods and can be reliably assigned to the relevant period(s).
Operating statement The operating statement presents details of transactions in revenues, expenses, the net acquisition of non-financial assets (net capital investment) and other economic flows for an accounting period.
Revenues arise from transactions that increase net worth and expenses arise from transactions that decrease net worth. Revenues less expenses gives the net operating balance. The net operating balance is similar to the National Accounts concept of government saving plus capital transfers.
The net acquisition of non-financial assets (net capital investment) equals gross fixed capital formation, less depreciation, plus changes (investment) in inventories, plus other transactions in non-financial assets. This measures the net effect of purchases, sales and consumption (for example, depreciation of fixed assets and use of inventory) of non-financial assets during an accounting period.
Other economic flows are presented in the operating statement and outline changes in net worth that are driven by economic flows other than revenues and expenses. Revenues, expenses and other economic flows sum to the total change in net worth during a period. The majority of other economic flows for the Australian Government GGS arise from price movements in its assets and liabilities.
2 Not all transactions impact on net worth. For example, transactions in financial assets and liabilities do not impact on net worth as they represent the swapping of assets and liabilities on the balance sheet.

Part 2: Australian Government Financial Statements
47
Fiscal balance The fiscal balance (or net lending/borrowing) is the net operating balance less net capital investment. Thus, the fiscal balance includes the impact of net expenditure (effectively purchases less sales) on non-financial assets rather than consumption (depreciation) of non-financial assets.3
The fiscal balance measures the Australian Government’s investment-saving balance. It measures in accrual terms the gap between government savings plus net capital transfers, and investment in non-financial assets. As such, it approximates the contribution of the Australian Government GGS to the balance on the current account in the balance of payments.
Balance sheet The balance sheet shows stocks of assets, liabilities and net worth. In accordance with the UPF, net debt, net financial worth and net financial liabilities are also reported in the balance sheet.
Net worth The net worth of the GGS, PNFC and PFC sectors is defined as assets less liabilities. This differs from the ABS GFS definition for the PNFC and PFC sectors where net worth is defined as assets less liabilities less shares and other contributed capital. Net worth is an economic measure of wealth, reflecting the Australian Government’s contribution to the wealth of Australia.
Net financial worth Net financial worth measures a government’s net holdings of financial assets. It is calculated from the balance sheet as financial assets minus liabilities. This differs from the ABS GFS definition of net financial worth for the PNFC and PFC sectors, defined as financial assets, less liabilities, less shares and other contributed capital. Net financial worth is a broader measure than net debt, in that it incorporates provisions made (such as superannuation) as well as holdings of equity. Net financial worth includes all classes of financial assets and all liabilities, only some of which are included in net debt. As non-financial assets are excluded from net financial worth, this is a narrower measure than net worth. However, it avoids the concerns inherent with the net worth measure relating to the valuation of non-financial assets and their availability to offset liabilities.
3 The net operating balance includes consumption of non-financial assets because depreciation is an expense. Depreciation also forms part of net capital investment, which (in the calculation of fiscal balance) offsets the inclusion of depreciation in the net operating balance.

Part 2: Australian Government Financial Statements
48
Net financial liabilities Net financial liabilities comprises total liabilities less financial assets but excludes equity investments in the other sectors of the jurisdiction. Net financial liabilities is a more accurate indicator than net debt of a jurisdiction’s fiscal position as it includes substantial non-debt liabilities such as accrued superannuation and long service leave entitlements. Excluding the net worth of other sectors of government results in a purer measure of financial worth than net financial worth, as, in general, the net worth of other sectors of government, in particular the PNFC sector, is backed up by physical assets.
Net debt Net debt is the sum of selected financial liabilities (deposits held, advances received, government securities, loans and other borrowing) less the sum of selected financial assets4 (cash and deposits, advances paid, and investments, loans and placements). This includes financial assets held by the Future Fund which are invested in these asset classes, including term deposits and investments in collective investment vehicles. Net debt does not include superannuation related liabilities. Net debt is a common measure of the strength of a government’s financial position. High levels of net debt impose a call on future revenue flows to service that debt.
Cash flow statement The cash flow statement identifies how cash is generated and applied in a single accounting period. The cash flow statement reflects a cash basis of recording (rather than an accrual basis) where information is derived indirectly from underlying accrual transactions and movements in balances. This, in effect, means that transactions are captured when cash is received or when cash payments are made. Cash transactions are specifically identified because cash management is considered an integral function of accrual budgeting.
Underlying cash balance The underlying cash balance plus net Future Fund earnings (ABS GFS cash surplus/deficit) is the cash counterpart of the fiscal balance, reflecting the Australian Government’s cash investment-saving balance.
4 Financial assets are defined as cash, an equity instrument of another entity, a contractual right to receive cash or financial asset, and a contract that will or may be settled in the entity’s own equity instruments.

Part 2: Australian Government Financial Statements
49
For the GGS, the underlying cash balance is calculated as shown below:
Net cash flows from operating activities
plus
Net cash flows from investments in non-financial assets
less
Net acquisitions of assets acquired under finance leases and similar arrangements5
equals
ABS GFS cash surplus/deficit
less
Net Future Fund earnings
equals
Underlying cash balance
The Government has excluded net Future Fund earnings from the calculations of the underlying cash balance. Prior to the 2012-13 MYEFO, the underlying cash balance only excluded the gross earnings of the Future Fund. Under the Future Fund Act 2006, earnings are required to be reinvested to meet the Government’s future public sector superannuation liabilities. The Future Fund becomes available to meet the Government’s superannuation liabilities from 2020.
In contrast, net Future Fund earnings are included in the fiscal balance because superannuation expenses relating to future cash payments are recorded in the fiscal balance.
Net Future Fund earnings are separately identified in the Australian Government GGS cash flow statement in Table 12 of this statement and the historical tables in Appendix B.
Headline cash balance
The headline cash balance is calculated by adding net cash flows from investments in financial assets for policy purposes and Future Fund earnings to the underlying cash balance.
5 The underlying cash balance treats the acquisition and disposal of non-financial assets in the same manner regardless of whether they occur by purchase/sale or finance lease — acquisitions reduce the underlying cash balance and disposals increase the underlying cash balance. However, finance leases do not generate cash flows at the time of acquisition or disposal equivalent to the value of the asset. As such, net acquisitions of assets under finance leases are not shown in the body of the cash flow statement but are reported as a supplementary item for the calculation of the underlying cash balance.

Part 2: Australian Government Financial Statements
50
Cash flows from investments in financial assets for policy purposes include equity transactions and net advances.6 Equity transactions include equity injections into controlled businesses and privatisations of government businesses. Net advances include net loans to the states, net loans to students under the Higher Education Loan Program (HELP), and contributions to international organisations that increase the Australian Government’s financial assets.
Sectoral classifications To assist in analysing the public sector, data is presented by institutional sector as shown in Figure 1. ABS GFS defines the general government sector (GGS) and the public non-financial corporations (PNFC) and public financial corporations (PFC) sectors. AASB 1049 has also adopted this sectoral reporting.
Figure 1: Institutional structure of the public sector
All entities are classified as GGS entities except for the following list of portfolio entities that are classified as PFC or PNFC (Table 23).
A table which provides a full list of public sector principal entities is available on the Department of Finance website at www.finance.gov.au/sites/default/files/list-ggs-pnfc-pfc-pgpa.pdf?v=1.
6 Cash flows from investments in financial assets for policy purposes are often referred to as net advances.
Total public sector
Public financial corporations sector
Public non-financial corporations sector General government sector
Total non-financial public sector
(Includes Reserve Bank of Australia and other borrowing authorities)
(Government departments and agencies that provide non-market public services or involve the transfer or redistribution of income and are funded mainly through taxes)
(Provide goods and services to consumers on a commercial basis, are funded largely by the sale of these goods and services and are generally legally distinguishable from the governments that own them)

Part 2: Australian Government Financial Statements
51
Table 23: Entities outside of the general government sector Public financial corporations
Employment Portfolio Coal Mining Industry (Long Service Leave Funding) Corporation
Finance Portfolio Medibank Private Ltd*
Foreign Affairs and Trade Portfolio Export Finance and Insurance Corporation
Treasury Portfolio Australian Reinsurance Pool Corporation, Reserve Bank of Australia
Public non-financial corporations
Attorney General’s Portfolio Australian Government Solicitor* Communications Portfolio Australian Postal Corporation, NBN Co Ltd
Finance Portfolio Albury-Wodonga Development Corporation*, ASC Pty Ltd, Australian River Co. Ltd*
Industry and Science Portfolio ANSTO Nuclear Medicine Pty Ltd
Infrastructure and Regional Development Portfolio Airservices Australia, Australian Rail Track Corporation Ltd, Moorebank Intermodal Company Ltd
Prime Minister and Cabinet Portfolio Voyages Indigenous Tourism Australia Pty Ltd
Social Services Portfolio Australian Hearing Services
*Medibank Private Ltd, Australian Government Solicitor, Albury-Wodonga Development Corporation and Australian River Co. Ltd have ceased operations as separate Commonwealth entities on or by 1 July 2015.

52
Attachment B
AUSTRALIAN LOAN COUNCIL ALLOCATION
Under Loan Council arrangements, every year the Commonwealth and each state and territory government nominates a Loan Council Allocation (LCA). A jurisdiction’s LCA incorporates:
• the estimated non-financial public sector ABS GFS cash surplus/deficit (made up from the balances of the general government and public non-financial corporations sectors and total non-financial public sector acquisitions under finance leases and similar arrangements);
• net cash flows from investments in financial assets for policy purposes; and
• memorandum items, which involve transactions that are not formally borrowings but nevertheless have many of the characteristics of borrowings.
LCA nominations are considered by the Loan Council, having regard to each jurisdiction’s fiscal position and infrastructure requirements, as well as the macroeconomic implications of the aggregate figure.
As set out in Table 24, the Commonwealth’s 2014-15 LCA final budget outcome is a $43.2 billion deficit. This compares with the Australian Government’s 2014-15 LCA Budget estimate of a $37.4 billion deficit.
A tolerance limit of 2 per cent of non-financial public sector receipts applies between the LCA Budget estimate and the outcome. Tolerance limits recognise that LCAs are nominated at an early stage of the Budget process and may change as a result of policy and parameter changes. The Australian Government’s 2014-15 LCA final budget outcome does not exceed the 2 per cent tolerance limit.

Part 2: Australian Government Financial Statements
53
Table 24: Australian Government Loan Council Allocation 2014-15 Budget 2014-15
Estimate Outcome$m $m
GGS cash surplus(-)/deficit(+) 26,705 33,706PNFC sector cash surplus(-)/deficit(+) 5,162 3,880NFPS cash surplus(-)/deficit(+)(a) 31,867 37,586
plus Acquisitions under finance leases and similar arrangements 0 481equals ABS GFS cash surplus(-)/deficit(+) 31,867 38,067minus Net cash flows from investments
in financial assets for policy purposes(b) -6,819 -5,158plus Memorandum items(c) -1,239 -47
Loan Council Allocation 37,447 43,178 (a) May not directly equate to the sum of the GGS and the PNFC sector due to intersectoral transfers which
are netted out. (b) Net cash flows from investments in financial assets for policy purposes are displayed with the same sign
as they are reported in cash flow statements. Such transactions involve the transfer or exchange of a financial asset and are not included within the cash surplus/deficit. However, the cash flow from investments in financial assets for policy purposes has implications for a government’s call on financial markets.
(c) For the Commonwealth’s LCA outcome, memorandum items include the change in net present value (NPV) of operating leases (with NPV greater than $5 million), the over-funding of superannuation and the net financing requirement of the Australian National University.


55
PART 3: AUSTRALIA’S FEDERAL RELATIONS This part provides information on payments for specific purposes and general revenue assistance, including the GST entitlement, provided to the states and territories (the states).
Commonwealth payments to the states are framed by the Intergovernmental Agreement on Federal Financial Relations (the Intergovernmental Agreement), which has been in place since 1 January 2009.
More detailed information on Australia’s Federal Relations is provided in Budget Paper No. 3, Federal Financial Relations 2015-16, and on the Federal Financial Relations website at: www.federalfinancialrelations.gov.au.
OVERVIEW OF PAYMENTS TO THE STATES
The states receive substantial financial support from the Commonwealth. In 2014-15, the Commonwealth provided the states with payments totalling $103.4 billion, comprising specific purpose payments of $48.0 billion and general revenue assistance (including GST entitlements) of $55.4 billion, as shown in Table 25. Total payments to the states as a proportion of total Commonwealth expenditure was 24.7 per cent in 2014-15.
Table 25: Commonwealth payments to the states, 2014-15 $million NSW VIC QLD WA SA TAS ACT NT TotalPayments for specific
purposes 14,705 11,167 10,082 5,906 3,158 1,046 815 1,117 47,997General revenue
assistance 17,065 12,013 11,824 3,216 5,027 1,944 1,143 3,193 55,425Total payments to
the states 31,770 23,181 21,907 9,122 8,185 2,990 1,959 4,310 103,423
PAYMENTS FOR SPECIFIC PURPOSES
In 2014-15, the Commonwealth provided payments to the states for specific purposes in areas administered by the states. These payments cover most functional areas of state and local government activity including health, education, skills and workforce development, community services, housing, Indigenous affairs, infrastructure and the environment.

Part 3: Australia’s Federal Relations
56
The Commonwealth provided the following types of specific purpose payments to the states:
• National Specific Purpose Payments (National SPPs) in respect of key service delivery sectors;
• National Health Reform funding;
• Students First funding; and
• National Partnership payments.
National SPPs, National Health Reform and Students First funding In 2014-15, the Commonwealth continued to provide funding for key service delivery sectors though National SPPs, as well as National Health Reform funding and Students First funding. The National SPPs are as follows:
• the National Skills and Workforce Development SPP;
• the National Disability SPP; and
• the National Affordable Housing SPP.
The states are required to spend each National SPP in the relevant sector.
The National SPPs are indexed each year by growth factors specified in the Intergovernmental Agreement.
Payments made throughout the year for National SPPs and Students First were made in advance, based on Commonwealth estimates of the respective growth factors. A balancing adjustment is made after the end of the financial year (or calendar year, for Students First) once final growth factor data become available.
The National SPPs are distributed among the states in accordance with population shares based on the Australian Statistician’s determination as at 31 December of that year. An equal per capita distribution was phased in over five years from 2009-10.
Students First funding includes recurrent and capital funding for government and non-government schools, funding for non-government representative bodies, and other prescribed purpose funding. Students First funding is distributed among the states in accordance with the Australian Education Act 2013 and relevant agreements made under that Act.
Payments throughout the year for National Health Reform were made in advance, on the basis of advice of the Administrator of the National Health Funding Pool. This funding is calculated by reference to the level of estimated efficient growth in hospital activity in each state. The amounts published are for payments made in respect of 2014-15 services. The Treasurer will determine the final amount and state allocations for 2014-15, following the Administrator’s reconciliation of activity data.

Part 3: Australia’s Federal Relations
57
National Partnership payments Under the Intergovernmental Agreement, National Partnership payments to the states are the key vehicle to support the delivery of specified projects, facilitate reforms, or reward those jurisdictions that deliver on nationally significant reforms.
National Partnerships are typically time-limited, reflecting the nature of the project or reform involved. National Partnership agreements are publicly available at: www.federalfinancialrelations.gov.au.
Total payments for specific purposes In 2014-15, the states received $48.0 billion in payments for specific purposes. Payments to the states for specific purposes constituted 11.5 per cent of total Commonwealth expenditure in 2014-15.
Total payments for specific purposes, including National SPPs, National Health Reform funding, Students First funding and National Partnership payments are shown in Table 26.
Table 26: Total payments for specific purposes by category, 2014-15 $million NSW VIC QLD WA SA TAS ACT NT TotalNational Specific Purpose
Payments(a)(b) 1,324 1,030 840 452 296 90 68 43 4,143National Health Reform 4,878 3,851 3,061 1,755 1,125 334 305 158 15,466
funding(a)(c)Students First funding(d) 4,538 3,674 3,068 1,483 1,077 352 252 263 14,707National Partnership
payments(e) 3,965 2,612 3,113 2,216 661 270 190 653 13,681Total payments for
specific purposes 14,705 11,167 10,082 5,906 3,158 1,046 815 1,117 47,997 (a) The 2014-15 outcomes for the National SPPs and National Health Reform funding will be finalised
following a Determination by the Treasurer. (b) Includes residual payments made under the former National Schools SPP to reflect revisions to some
states’ entitlements from the 2013-14 financial year. (c) National Health Reform funding amounts are for payments made in respect of 2014-15 services. These
amounts will be finalised following reconciliation of activity data by the Administrator of the National Health Funding Pool.
(d) The 2014-15 outcomes for Students First funding will be finalised following a Determination by the Minister for Education.
(e) Includes financial assistance grants for local government.
Total payments for specific purposes by sector, including National SPPs, National Health Reform funding, Students First funding and National Partnership payments, are shown in Table 27.

Part 3: Australia’s Federal Relations
58
Table 27: Total payments for specific purposes by sector, 2014-15 $million NSW VIC QLD WA SA TAS ACT NT TotalHealth 5,363 4,153 3,275 1,882 1,188 370 318 254 16,804Education 4,802 3,818 3,198 1,548 1,123 366 266 337 15,458Skills and workforce
development 583 460 368 197 133 40 30 19 1,830Community services 458 789 341 432 115 48 27 94 2,303Affordable housing 515 351 440 305 130 34 23 146 1,944Infrastructure 1,750 473 1,199 1,090 139 53 62 108 4,874Environment 92 263 51 5 81 17 6 16 531Contingent 5 3 423 3 .. .. - 87 522Other(a) 1,137 857 787 444 249 118 83 57 3,732Total payments for
specific purposes 14,705 11,167 10,082 5,906 3,158 1,046 815 1,117 47,997 (a) Includes financial assistance grants for local government.
Total payments for specific purposes by sector and category, including National SPPs, National Health Reform funding, Students First funding and National Partnership payments, are shown in Table 28.

Part 3: Australia’s Federal Relations
59
Table 28: Total payments for specific purposes by sector and category, 2014-15 $million NSW VIC QLD WA SA TAS ACT NT TotalHealth
National Health Reformfunding(a)(b) 4,878 3,851 3,061 1,755 1,125 334 305 158 15,466
National Partnerships 486 302 214 127 64 36 14 96 1,338Total health payments 5,363 4,153 3,275 1,882 1,188 370 318 254 16,804
EducationNational Schools SPP(c) .. .. .. .. - - .. .. ..Students First funding(d) 4,538 3,674 3,068 1,483 1,077 352 252 263 14,707National Partnerships 263 144 129 65 46 14 14 75 750Total education payments 4,802 3,818 3,198 1,548 1,123 366 266 337 15,458
Skills and workforcedevelopmentNational Skills and Workforce
Development SPP(a) 460 358 289 157 103 31 24 15 1,435National Partnerships 123 102 80 40 30 9 6 4 395Total skills and workforce
development payments 583 460 368 197 133 40 30 19 1,830Community services
National Disability SPP(a)(e) 446 347 289 152 100 30 23 14 1,402National Partnerships 12 442 53 279 15 17 4 80 902Total community services
payments 458 789 341 432 115 48 27 94 2,303Affordable housing
National AffordableHousing SPP(a) 418 325 263 143 94 28 21 14 1,306
National Partnerships 96 26 178 162 37 6 2 132 638Total affordable housing
payments 515 351 440 305 130 34 23 146 1,944Infrastructure
National Partnerships 1,750 473 1,199 1,090 139 53 62 108 4,874Environment
National Partnerships 92 263 51 5 81 17 6 16 531Contingent payments
National Partnerships 5 3 423 3 .. .. - 87 522Other
National Partnerships(f) 1,137 857 787 444 249 118 83 57 3,732Total payments for
specific purposes 14,705 11,167 10,082 5,906 3,158 1,046 815 1,117 47,997 (a) The 2014-15 outcomes for the National SPPs and National Health Reform funding will be finalised
following a Determination by the Treasurer. (b) National Health Reform funding amounts are for payments made in respect of 2014-15 services. These
amounts will be finalised following reconciliation of activity data by the Administrator of the National Health Funding Pool.
(c) Residual payments were made under the former National Schools SPP to reflect revisions to some states’ entitlements from the 2013-14 financial year.
(d) The 2014-15 outcomes for Students First funding will be finalised following a Determination by the Minister for Education.
(e) Includes an adjustment to achieve budget neutrality for 2012-13 activity; see footnote to Table 40 in Attachment A for details.
(f) Includes financial assistance grants for local government.

Part 3: Australia’s Federal Relations
60
Natural Disaster Relief and Recovery Arrangements The Commonwealth provides funding under the Natural Disaster Relief and Recovery Arrangements (NDRRA) to assist the states with relief and recovery assistance following eligible natural disasters.
For accounting purposes, the Commonwealth recognises a liability equal to the present value of future payments expected to be made to the states under the NDRRA. This is regardless of whether a state has completed eligible disaster reconstruction work or submitted an eligible claim under the NDRRA. Total cash payments in 2014-15 are presented in Table 29 below; see Table 44 in Attachment A for the expense outcome.
Table 29: NDRRA cash payments, 2014-15 $'000 NSW VIC QLD WA SA TAS ACT NT TotalNDRRA - - 1,162,592 - - - - - 1,162,592Total - - 1,162,592 - - - - - 1,162,592
GENERAL REVENUE ASSISTANCE
General revenue assistance is a broad category of payments, including the GST entitlement, which is provided to the states without conditions, to spend according to their own budget priorities.
In 2014-15, the states received $55.4 billion in general revenue assistance from the Commonwealth, comprising $54.3 billion in GST entitlements and $1.1 billion of other general revenue assistance, as shown in Table 30. In 2014-15, total general revenue assistance to the states represented 13.3 per cent of total Commonwealth expenditure.
Table 30: General revenue assistance, 2014-15 $million NSW VIC QLD WA SA TAS ACT NT TotalGST entitlement(a) 17,020 11,990 11,824 2,241 5,027 1,944 1,106 3,190 54,342Other general revenue
assistanceACT municipal
services - - - - - - 38 - 38Reduced royalties - - - 46 - - - - 46Royalties - - - 929 - - - 3 932Snowy Hydro Ltd tax
compensation 45 23 - - - - - - 68Total other general
revenue assistance 45 23 - 975 - - 38 3 1,083Total general revenue
assistance 17,065 12,013 11,824 3,216 5,027 1,944 1,143 3,193 55,425 (a) The 2014-15 GST outcome will be finalised following a Determination by the Treasurer.

Part 3: Australia’s Federal Relations
61
GST PAYMENTS
Reconciling GST revenue and GST payments to the states Under the Intergovernmental Agreement, the states are entitled to receive payments from the Commonwealth equivalent to the revenue received from the GST.
However, GST revenue for a financial year varies from the amount of GST paid to the states for that year because of:
• GST revenue which is recognised on a Commonwealth whole-of-government basis, but not remitted to the Australian Taxation Office (ATO) by 30 June of each financial year, as the revenue will not be remitted until the following financial year;
• penalties, other than general interest charge (GIC) penalties, which are not included in the definition in the Federal Financial Relations Act 2009 of GST to be paid to the states;
• the GST component of sales by Commonwealth agencies which has been collected by those agencies but which, as at 30 June in each year, has not been remitted to the ATO, because it is not due to be paid until the next Business Activity Statement is lodged; and
• adjustments to account for any variation in the previous financial year between the Treasurer’s final outcome Determination, and GST payment advances made during that financial year.
In 2014-15, GST revenue was $56.5 billion. A reconciliation of GST revenue and GST entitlement to the states is provided in Table 31.
Table 31: GST revenue and GST entitlement to the states, 2014-15 $million TotalGST revenue 56,462
less Change in GST receivables 1,921
GST receipts 54,542less Non-GIC penalties collected 237less Net GST collected by Commonwealth agencies but
not yet remitted to the ATO -37
GST entitlement to the states(a) 54,342 (a) The 2014-15 GST outcome will be finalised following a Determination by the Treasurer. Advances of GST entitlements were provided to the states throughout the 2014-15 financial year based on the Commonwealth’s estimate of GST entitlements as updated at the 2015-16 Budget. The GST entitlement to the states is expected to be $342 million higher than the advances paid during 2014-15. A balancing adjustment will be made following a Determination by the Treasurer. Table 32 provides a reconciliation of the GST entitlement and GST advances to the states.

Part 3: Australia’s Federal Relations
62
Table 32: GST entitlement and GST advances to the states, 2014-15 $million TotalGST entitlement to the states(a) 54,342less Advances of GST made throughout 2014-15 54,000equals Following year balancing adjustment 342
(a) The 2014-15 GST outcome will be finalised following a Determination by the Treasurer.
Distribution of the GST entitlement among the states The Commonwealth distributes GST among the states in accordance with the principle of horizontal fiscal equalisation and having regard to the recommendations of the Commonwealth Grants Commission (the Commission).
GST relativities
The Commission recommends GST revenue sharing relativities to be used in calculating each state’s entitlement of the GST pool. The relativities determine how much GST each state receives compared with an equal per capita share and are determined such that, if each state made the same effort to raise revenue from its own sources and operated at the same level of efficiency, each state would have the capacity to provide services and the associated infrastructure at the same standard.
This does not necessarily result in the same standard of government services — rather, it equalises each state’s capacity to provide the same standard of services. In calculating GST relativities, the Commission takes into account differences in the states’ capacities to raise revenues and differences in the costs the states would incur in providing the same standard of government services, including through acquiring the infrastructure used to deliver those services.
A Determination on the GST revenue sharing relativities for 2014-15 was made in March 2014. The relativities for 2014-15 are shown in Table 33.
Table 33: GST relativities, 2014-15 NSW VIC QLD WA SA TAS ACT NT
2014-15 0.97500 0.88282 1.07876 0.37627 1.28803 1.63485 1.23600 5.66061 Applying the GST relativities to the GST pool
The GST relativities were applied to estimated state populations to determine an adjusted population for each state. The entitlements are allocated using the population as at 31 December 2014 as determined by the Australian Statistician. Each state received its adjusted population share of the GST entitlement as shown in Table 34.

Part 3: Australia’s Federal Relations
63
Table 34: Calculation of the 2014-15 GST entitlements(a) Share of
Population as at GST Adjusted adjusted Share of31 December revenue sharing population population GST pool
2014 relativities (1) x (2) per cent $million(1) (2) (3) (4) (5)
NSW 7,565,497 0.97500 7,376,360 31.3 17,019.8VIC 5,886,436 0.88282 5,196,663 22.1 11,990.5QLD 4,750,513 1.07876 5,124,663 21.8 11,824.3WA 2,581,250 0.37627 971,247 4.1 2,241.0SA 1,691,503 1.28803 2,178,707 9.3 5,027.0TAS 515,235 1.63485 842,332 3.6 1,943.5ACT 387,640 1.23600 479,123 2.0 1,105.5NT 244,265 5.66061 1,382,689 5.9 3,190.3Total 23,622,339 N/A 23,551,784 100.0 54,342.0
(a) The 2014-15 GST outcome will be finalised following a Determination by the Treasurer. Table 35 provides a summary of advances made in 2014-15 against the states’ estimated final entitlements shown in Table 34 above. The variance between advances paid in 2014-15 and the states’ final entitlements will be paid in the 2015-16 financial year.
Table 35: Summary of advances made in 2014-15 and distribution of following year adjustment across states $million NSW VIC QLD WA SA TAS ACT NT TotalGST entitlement 17,019.8 11,990.5 11,824.3 2,241.0 5,027.0 1,943.5 1,105.5 3,190.3 54,342.014-15 advances 16,897.2 11,902.2 11,746.4 2,242.9 4,986.3 1,928.0 1,098.3 3,198.7 54,000.0Following year
adjustment(a) 122.6 88.2 78.0 -1.9 40.7 15.5 7.2 -8.4 342.0 (a) The 2014-15 GST outcome will be finalised following a Determination by the Treasurer.
GST administration costs The Commissioner of Taxation administers the GST law and the states compensate the Commonwealth for the costs incurred by the ATO in administering the GST, including costs incurred by the former Australian Customs and Border Protection Service, as shown in Table 36.
Table 36: GST administration, 2014-15 $million
2013-14 2014-15Australian Taxation Office budget 698.6 688.5less Prior year adjustment -11.0 8.2
equals State government administration payments 709.6 680.3less Australian Taxation Office outcome(a) 690.4 681.1
equals Commonwealth budget impact 19.1 -0.8plus Prior year adjustment -11.0 8.2
equals Following year adjustment 8.2 7.4
Actual
(a) Estimated outcome for 2014-15 pending confirmation by the Australian National Audit Office.

Part 3: Australia’s Federal Relations
64
The estimated outcome for the 2014-15 GST administration expenses of $681.1 million differs from the amount paid by the states and the prior year adjustment by $7.4 million. Once the outcome for GST administration costs in 2014-15 is audited and confirmed by the Australian National Audit Office, any adjustment required will be incorporated into the states’ administration costs for 2015-16.

Part 3: Australia’s Federal Relations
65
Attachment A
PAYMENTS TO THE STATES
This attachment provides information on Commonwealth payments to the states and local governments on an accruals basis. Details regarding Commonwealth advances (loans) to the states, including repayments of advances and interest on advances, are available online at www.budget.gov.au (table 48 refers). Most of these advances were funded from borrowings made on behalf of the states under previous Australian Loan Council arrangements.
The following tables detail payments to the states for 2014-15:
Table 37 — health;
Table 38 — education;
Table 39 — skills and workforce development;
Table 40 — community services;
Table 41 — affordable housing;
Table 42 — infrastructure;
Table 43 — environment;
Table 44 — contingent liabilities;
Table 45 — other purposes;
Table 46 — general revenue assistance; and
Table 47 — payments presented on the Australian Bureau of Statistics Government Finance Statistics (GFS) functional basis.

Part 3: Australia’s Federal Relations
66
Table 37: Payments for specific purposes to support state health services, 2014-15 $'000 NSW VIC QLD WA SA TAS ACT NT TotalNational Health Reform funding(a)(b)
Hospital services 4,769,584 3,767,018 2,993,300 1,718,444 1,100,548 326,343 299,072 154,466 15,128,775Public health 107,994 84,025 67,810 36,846 24,145 7,355 5,533 3,487 337,195
National Partnership paymentsHealth Infrastructure
Health and Hospitals FundHospital infrastructure and other
projects of national significance - - 15,000 50,000 - 1,000 - 400 66,400National cancer system - 69,500 34,406 1,050 400 3,849 - 600 109,805Regional priority round 310,750 53,633 51,050 10,520 27,798 - 234 29,290 483,275
Bright Hospital — feasibility study - 100 - - - - - - 100Cancer Support Clinic in Katherine - - - - - - - 400 400Construction of Palmerston Hospital - - - - - - - 20,000 20,000Oncology Day Treatment Centre at
Frankston Hospital - 650 - - - - - - 650Redevelopment of the Royal
Victorian Eye and Ear Hospital - 50,000 - - - - - - 50,000Upgrade of Ballina Hospital 1,000 - - - - - - - 1,000Upgrade of the Casino and District
Memorial Hospital 3,000 - - - - - - - 3,000Warrnambool Integrated Cancer Care
Centre - 10,000 - - - - - - 10,000

Part 3: Australia’s Federal Relations
67
Table 37: Payments for specific purposes to support state health services, 2014-15 (continued) $'000 NSW VIC QLD WA SA TAS ACT NT Total
Health servicesCanberra Hospital — dedicated
paediatric emergency care - - - - - - 5,000 - 5,000Expansion of the BreastScreen
Australia programme 3,890 3,257 1,876 1,685 1,056 370 167 60 12,361Health care grants for the Torres Strait - - 4,519 - - - - - 4,519Hummingbird House - - 1,500 - - - - - 1,500Improving Health Services in Tasmania
Better access to community basedpalliative care services - - - - - 1,700 - - 1,700
Improving patient pathways throughclinical and system redesign - - - - - 5,340 - - 5,340
Innovative flexible funding formental health - - - - - 1,025 - - 1,025
Reducing elective surgery waiting lists in Tasmania - - - - - 9,702 - - 9,702
National Bowel Cancer Screening Programme — participant follow-up
function - 612 492 252 197 126 102 85 1,866National Perinatal Depression Initiative 2,484 2,213 1,632 1,327 558 254 323 320 9,111OzFoodNet 338 250 250 196 196 183 137 143 1,693Royal Darwin Hospital — equipped,
prepared and ready - - - - - - - 15,308 15,308Torres Strait health protection strategy
— mosquito control - - 958 - - - - - 958Vaccine-preventable diseases
surveillance 197 186 161 81 78 32 33 46 814Victorian cytology service - 8,888 - - - - - - 8,888

68
Part 3: Australia’s Federal Relations
Table 37: Payments for specific purposes to support state health services, 2014-15 (continued) $'000 NSW VIC QLD WA SA TAS ACT NT Total
Indigenous healthImproving trachoma control services for
Indigenous Australians 117 - - 1,340 952 - - 1,528 3,937Indigenous early childhood development
— antenatal and reproductive health 8,340 1,490 8,006 6,121 1,654 1,147 262 4,434 31,454Renal dialysis services in Central
Australia - - - - - - - 1,700 1,700Renal infrastructure in the Northern
Territory - - - - - - - 4,000 4,000Rheumatic fever strategy - - 870 870 414 - - 870 3,024Stronger Futures in the Northern Territory
Health components - - - - - - - 9,429 9,429Other
Essential vaccines 66,219 59,505 37,384 23,945 13,176 5,510 4,129 3,363 213,231Improving Public Hospital Services
National elective surgery target —reward funding 8,538 - - 904 4,145 - 670 214 14,471
National emergency access target —reward funding 28,558 - 16,690 - - - - - 45,248
National Coronial Information System - 441 - - - - - - 441Supporting National Mental Health
Reform 13,559 9,474 15,624 6,376 3,378 1,642 620 887 51,560Treating more public dental patients 38,540 31,941 23,398 21,963 9,630 4,269 1,904 3,009 134,654
Total 5,363,108 4,153,183 3,274,926 1,881,920 1,188,325 369,847 318,186 254,039 16,803,534 (a) The 2014-15 outcomes for National Health Reform funding will be finalised following a Determination by the Treasurer. (b) Amounts for the hospital services component of National Health Reform are for payments made in respect of 2014-15 services. These amounts will be finalised
following reconciliation of activity data by the Administrator of the National Health Funding Pool.

Part 3: Australia’s Federal Relations
69
Table 38: Payments for specific purposes to support state education services, 2014-15 $'000 NSW VIC QLD WA SA TAS ACT NT TotalNational Schools SPP(a) 25 43 12 17 - - 27 14 138Students First funding(b) 4,538,462 3,674,073 3,068,305 1,482,821 1,076,798 351,746 252,444 262,754 14,707,403National Partnership payments
Independent Public Schools 9,750 - 5,520 3,450 1,580 600 260 460 21,620MoneySmart Teaching 249 235 189 128 122 - - 105 1,028More support for students with disabilities 18,419 13,998 12,100 5,932 4,268 1,357 996 656 57,726National quality agenda for early
childhood education and care 12,711 6,942 2,202 1,321 3,445 420 318 1,260 28,619National School Chaplaincy Programme 11,113 12,614 18,102 7,627 7,489 2,192 966 483 60,586School Pathways Programme - - - 540 747 - - - 1,287Stronger Futures in the Northern
TerritorySchooling components(c) - - - - - - - 50,108 50,108
Trade training centres in schools 32,581 24,693 26,231 7,146 4,487 1,774 4,039 14,629 115,580Universal access to early childhood
education 178,473 85,857 65,019 38,756 23,890 7,856 7,040 6,920 413,811Total 4,801,783 3,818,455 3,197,680 1,547,738 1,122,826 365,945 266,090 337,389 15,457,906Memorandum item — payments for non-government schools included in payments above(d)
National Schools SPP(a) 25 43 12 17 - - 27 14 138Students First funding(b) 2,924,929 2,438,774 1,937,982 976,082 702,346 195,324 175,446 122,751 9,473,634National Partnership payments
More support for students withdisabilities 3,921 2,909 2,069 1,333 668 200 194 75 11,369
Trade training centres in schools 10,864 16,393 7,537 1,814 3,838 - 1,158 4,035 45,639Total 2,939,739 2,458,119 1,947,600 979,246 706,852 195,524 176,825 126,875 9,530,780 (a) Although National Schools SPP funding ceased in December 2013, payments were made during the 2014-15 financial year to reflect revisions to some states’
entitlements from the 2013-14 financial year. (b) Students First funding includes funding for non-government representative bodies and other prescribed purpose funding. The 2014-15 Students First funding
outcome will be finalised following a Determination by the Minister for Education. (c) Includes government and non-government schools; however, payments to non-government schools are not shown in the Memorandum item. (d) Actual cash payments to non-government schools may be inclusive of GST; however, Final Budget Outcome figures are reported exclusive of GST.

70
Part 3: Australia’s Federal Relations
Table 39: Payments for specific purposes to support state skills and workforce development services, 2014-15 $'000 NSW VIC QLD WA SA TAS ACT NT TotalNational Skills and Workforce
Development SPP(a) 459,642 357,631 288,618 156,824 102,767 31,303 23,551 14,840 1,435,176National Partnership payments
Building Australia's Future Workforce —skills reform 121,208 93,853 77,023 39,340 27,401 8,439 6,046 3,900 377,210
Industry and Indigenous Skills Centres - - - - - 76 - - 76Joint group training programme - 5,622 - - 919 - 234 172 6,947TAFE fee waivers for childcare
qualifications(b) 2,084 2,562 2,750 1,133 1,815 303 137 -46 10,738Total 582,934 459,668 368,391 197,297 132,902 40,121 29,968 18,866 1,830,147 (a) The 2014-15 National SPPs outcome will be finalised following a Determination by the Treasurer. (b) The 2014-15 TAFE fee waivers for childcare qualifications outcome will be finalised once final enrolment figures for all jurisdictions are available.

Part 3: Australia’s Federal Relations
71
Table 40: Payments for specific purposes to support state community services, 2014-15 $'000 NSW VIC QLD WA SA TAS ACT NT TotalNational Disability SPP(a) 446,242 347,203 280,202 152,251 99,771 30,390 22,864 14,408 1,393,331Changed roles and responsibilities —
adjustment to achieve budget neutrality(b) - - 8,397 - - - - - 8,397
National Partnership paymentsTransitioning responsibilities for aged care
and disability services — Specialistdisability services(c) - - 17,570 - - - - - 17,570
Assisting preparation towards the trial ofthe National Disability Insurance Scheme - - - - - 616 3,700 - 4,316
Home and Community Care - 404,896 - 174,802 - - - - 579,698Municipal and essential services transition
fund - 12,500 - 90,000 15,000 13,371 - - 130,871National Occasional Care Programme - 1,149 - - 313 - - - 1,462Pay equity for the social and community
services sector 11,789 23,450 35,132 2,029 - 3,204 - - 75,604Stronger Futures in the Northern Territory
Community services components - - - - - - - 79,552 79,552Trial of My Way sites - - - 12,489 - - - - 12,489
Total 458,031 789,198 341,301 431,571 115,084 47,581 26,564 93,960 2,303,290 (a) The 2014-15 National SPPs outcome will be finalised following a Determination by the Treasurer. (b) The Commonwealth makes an adjustment to the National Disability SPP to ensure that the changes to Commonwealth and state roles and responsibilities for aged
care and disability services are budget neutral. This adjustment relates to 2012-13 activity. (c) Funding related to 2012-13 activity.

72
Part 3: Australia’s Federal Relations
Table 41: Payments for specific purposes to support state affordable housing services, 2014-15 $'000 NSW VIC QLD WA SA TAS ACT NT TotalNational Affordable Housing SPP(a) 418,197 325,384 262,594 142,684 93,501 28,481 21,428 13,502 1,305,771National Partnership payments
First Home Owners Boost(b) 56 301 4 133 14 - 7 - 515Homelessness 35,720 22,790 34,074 14,970 8,870 3,400 1,520 5,320 126,664Remote Indigenous Housing 60,654 2,500 143,478 146,906 27,762 2,464 - 70,980 454,744Stronger Futures in the Northern Territory
Housing components - - - - - - - 55,873 55,873Total 514,627 350,975 440,150 304,693 130,147 34,345 22,955 145,675 1,943,567 (a) The 2014-15 National SPPs outcome will be finalised following a Determination by the Treasurer. (b) This reflects total payments to the states for the First Home Owners Boost. Total recoveries from the states under the First Home Owners Boost were $1.3 million.

Part 3: Australia’s Federal Relations
73
Table 42: Payments for specific purposes to support state infrastructure services, 2014-15 $'000 NSW VIC QLD WA SA TAS ACT NT TotalNational Partnership payments
Infrastructure Investment ProgrammeBlack spot projects 16,276 14,047 7,933 5,591 7,150 1,355 1,109 - 53,461Heavy vehicle safety and productivity - - 109 15 225 - 32 150 531Improving the national network(a) - - - - 50 - - - 50Investment
Rail 250,932 383 248,000 - - 4,624 - - 503,939Road 1,225,947 215,900 864,233 539,227 81,392 35,614 568 88,161 3,051,042Supplementary(a) - - - 2 - - - - 2
Roads to Recovery 97,332 68,506 55,528 43,228 28,849 11,148 8,641 8,650 321,882Infrastructure Growth Package —
Asset Recycling FundAsset Recycling Initiative - - - - - - 7,913 - 7,913New Investments - - - - 12,000 200 - 10,570 22,770Western Sydney Infrastructure Plan 120,440 - - - - - - - 120,440
Bathurst 200 Commemorative Flagstaff 250 - - - - - - - 250Building Australia Fund
Rail - 143,500 - - - - - - 143,500Road - - - - - - 41,180 - 41,180
Centenary of Canberra 2013 —a gift to the national capital - - - - - - 2,000 - 2,000
Interstate road transport 33,944 19,751 6,993 2,923 8,900 368 368 368 73,615Latrobe Valley economic diversification - 2,400 - - - - - - 2,400Managed motorways 200 - 9,416 - - - - - 9,616Murray-Darling Basin regional economic
diversification programme 5,000 8,321 6,549 - - - - - 19,870Western Australia infrastructure projects - - - 499,057 - - - - 499,057
Total 1,750,321 472,808 1,198,761 1,090,043 138,566 53,309 61,811 107,899 4,873,518

74
Part 3: Australia’s Federal Relations
Table 42: Payments for specific purposes to support state infrastructure services, 2014-15 (continued) $'000 NSW VIC QLD WA SA TAS ACT NT TotalMemorandum item — payments direct to local governments included in payments above
Infrastructure Investment ProgrammeInvestment
Road - - 104,000 - - - - - 104,000Supplementary(a) - - - 2 - - - - 2
Roads to Recovery 96,486 68,418 55,528 43,228 25,948 11,148 - 3,934 304,690Bathurst 200 Commemorative Flagstaff 250 - - - - - - - 250Latrobe Valley economic diversification - 1,100 - - - - - - 1,100
Total 96,736 69,518 159,528 43,230 25,948 11,148 - 3,934 410,042 (a) Figures represent expenses incurred against prepayments made to the states in prior years.

Part 3: Australia’s Federal Relations
75
Table 43: Payments for specific purposes to support state environment services, 2014-15 $'000 NSW VIC QLD WA SA TAS ACT NT TotalNational Partnership payments
Assistance for water infrastructure andpest management in drought-affected
areas 900 - 8,100 250 750 - - - 10,000Assistance to farm businesses for
water-related infrastructure 7,000 - - - - - - - 7,000Bushfire mitigation 762 914 305 305 457 457 305 305 3,810Environmental management of the
former Rum Jungle Mine site - - - - - - - 3,910 3,910Great Artesian Basin Sustainability
Initiative 240 - - - 626 - - - 866Implementation of the National Insurance
Affordability Initiative - - 5,020 - - - - - 5,020Implementing water reform in the
Murray-Darling Basin 9,402 6,800 1,985 - 1,486 - 327 - 20,000National Urban Water and Desalination
Plan - 1,550 - - - - - - 1,550National Water Security Plan for Cities
and Towns 9,500 - 200 - - - - - 9,700Natural disaster resilience 6,786 4,176 6,003 3,132 1,044 1,305 1,305 1,958 25,709Pest and disease preparedness and
response programmes 188 1,686 10,170 - 105 - - 8,960 21,109South Australian River Murray
Sustainability ProgrammeIrrigation efficiency and water
purchase - - - - 29,000 - - - 29,000Irrigation industry assistance - - - - 15,000 - - - 15,000Regional economic development - - - - 4,500 - - - 4,500
Sustainable Australia — Sustainable regional development 40 - - - 40 40 - - 120

76
Part 3: Australia’s Federal Relations
Table 43: Payments for specific purposes to support state environment services, 2014-15 (continued) $'000 NSW VIC QLD WA SA TAS ACT NT TotalNational Partnership payments
Sustainable Rural Water Use andInfrastructure Programme 57,522 247,738 19,195 1,329 27,482 13,833 4,451 510 372,060
Tasmanian Wilderness World HeritageArea - - - - - 1,547 - - 1,547
Water Reform — Constraint measures - - - - 420 - - - 420Whale and dolphin entanglements - 33 40 - 28 35 - 34 170
Total 92,340 262,897 51,018 5,016 80,938 17,217 6,388 15,677 531,491Memorandum item — payments direct to local governments included in payments above
Sustainable Australia — Sustainable regional development 40 - - - 40 40 - - 120
Total 40 - - - 40 40 - - 120
Table 44: Payments for specific purposes to support contingent state services, 2014-15 $'000 NSW VIC QLD WA SA TAS ACT NT TotalNational Partnership payments
Hepatitis C settlement fund 5 - - - - - - - 5Natural Disaster Relief and Recovery
Arrangements(a) 5,206 3,384 422,777 3,323 482 3 - 86,658 521,833Total 5,211 3,384 422,777 3,323 482 3 - 86,658 521,838 (a) Figures in the table above reflect the expense outcome. Total cash payments made in 2014-15 are presented in Table 29.

Part 3: Australia’s Federal Relations
77
Table 45: Payments for specific purposes to support other state services, 2014-15 $'000 NSW VIC QLD WA SA TAS ACT NT TotalNational Partnership payments
2014 G20 leaders' summit security - - 65,000 - - - - - 65,000Developing demand-driver infrastructure
for the tourism industry - - 361 900 1,019 799 749 799 4,627Financial assistance to local governments
— Financial Assistance Grantprogramme 1,067,967 808,108 676,116 420,753 229,164 108,373 72,974 49,560 3,433,015
Legal assistance services 64,639 45,798 42,481 20,548 17,894 6,774 4,553 4,025 206,712Port Arthur Penitentiary restoration - - - - - 1,500 - - 1,500Provision of fire services 4,120 2,902 2,923 1,304 973 255 4,940 1,578 18,995Remote Indigenous public internet access 155 - 370 735 155 - - 735 2,150Sinking fund on state debt 20 .. - - - - - - 20
Total 1,136,901 856,808 787,251 444,240 249,205 117,701 83,216 56,697 3,732,019
Table 46: General revenue assistance payments to the states, 2014-15 $'000 NSW VIC QLD WA SA TAS ACT NT TotalGST entitlement(a) 17,019,782 11,990,478 11,824,349 2,240,998 5,027,020 1,943,548 1,105,501 3,190,336 54,342,012Other payments
ACT Municipal Services - - - - - - 37,983 - 37,983Reduced royalties - - - 45,703 - - - - 45,703Royalties - - - 929,256 - - - 2,567 931,823Snowy Hydro Ltd tax compensation 45,313 22,657 - - - - - - 67,970
Total 17,065,095 12,013,135 11,824,349 3,215,957 5,027,020 1,943,548 1,143,484 3,192,903 55,425,491 (a) The 2014-15 GST outcome will be finalised following a Determination by the Treasurer.
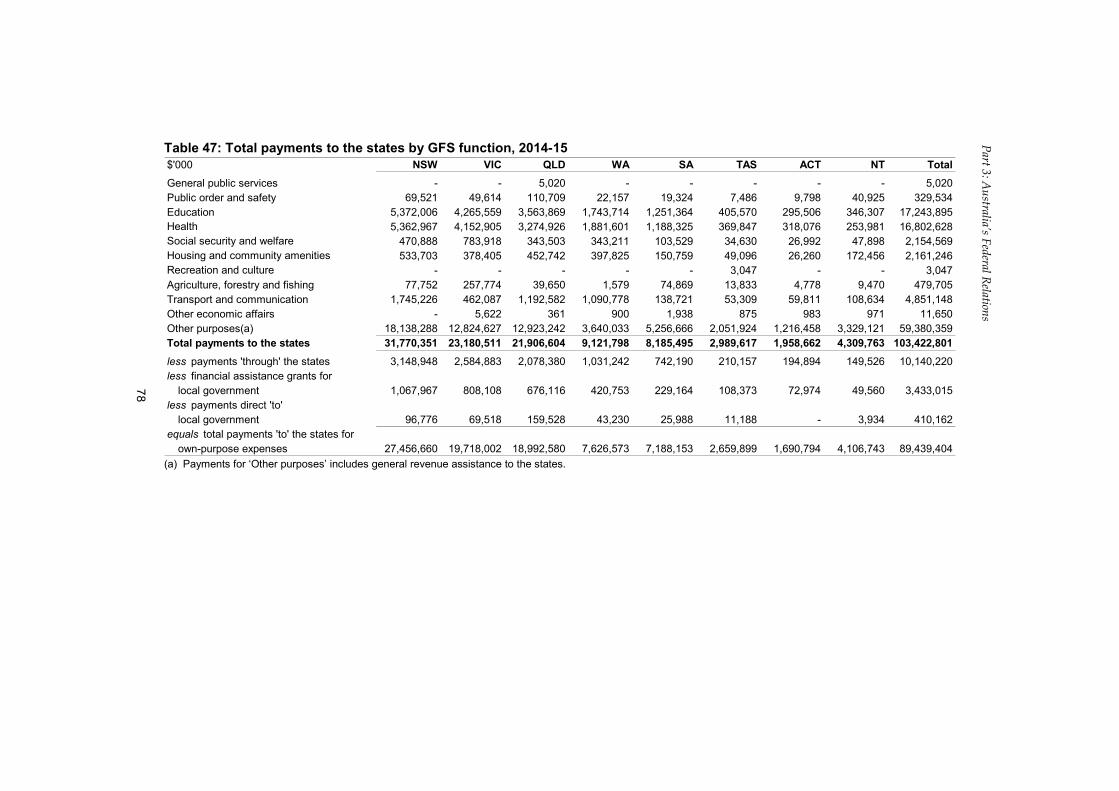
78
Part 3: Australia’s Federal Relations
Table 47: Total payments to the states by GFS function, 2014-15 $'000 NSW VIC QLD WA SA TAS ACT NT TotalGeneral public services - - 5,020 - - - - - 5,020Public order and safety 69,521 49,614 110,709 22,157 19,324 7,486 9,798 40,925 329,534Education 5,372,006 4,265,559 3,563,869 1,743,714 1,251,364 405,570 295,506 346,307 17,243,895Health 5,362,967 4,152,905 3,274,926 1,881,601 1,188,325 369,847 318,076 253,981 16,802,628Social security and welfare 470,888 783,918 343,503 343,211 103,529 34,630 26,992 47,898 2,154,569Housing and community amenities 533,703 378,405 452,742 397,825 150,759 49,096 26,260 172,456 2,161,246Recreation and culture - - - - - 3,047 - - 3,047Agriculture, forestry and fishing 77,752 257,774 39,650 1,579 74,869 13,833 4,778 9,470 479,705Transport and communication 1,745,226 462,087 1,192,582 1,090,778 138,721 53,309 59,811 108,634 4,851,148Other economic affairs - 5,622 361 900 1,938 875 983 971 11,650Other purposes(a) 18,138,288 12,824,627 12,923,242 3,640,033 5,256,666 2,051,924 1,216,458 3,329,121 59,380,359Total payments to the states 31,770,351 23,180,511 21,906,604 9,121,798 8,185,495 2,989,617 1,958,662 4,309,763 103,422,801less payments 'through' the states 3,148,948 2,584,883 2,078,380 1,031,242 742,190 210,157 194,894 149,526 10,140,220less financial assistance grants for
local government 1,067,967 808,108 676,116 420,753 229,164 108,373 72,974 49,560 3,433,015less payments direct 'to'
local government 96,776 69,518 159,528 43,230 25,988 11,188 - 3,934 410,162equals total payments 'to' the states for
own-purpose expenses 27,456,660 19,718,002 18,992,580 7,626,573 7,188,153 2,659,899 1,690,794 4,106,743 89,439,404 (a) Payments for ‘Other purposes’ includes general revenue assistance to the states.

79
APPENDIX A: EXPENSES BY FUNCTION AND SUB-FUNCTION
Table A1 sets out Australian Government general government sector expenses by function and sub-function for 2014-15.
Table A1: Australian Government general government sector expenses by function and sub-function
2013-14 2014-15 2014-15 Change onOutcome Estimate at Outcome 2015-16
2015-16 BudgetBudget
$m $m $m $mGeneral public servicesLegislative and executive affairs 1,401 1,165 1,124 -42Financial and fiscal affairs 16,995 7,763 7,145 -618Foreign affairs and economic aid 6,011 6,324 6,393 69General research 2,717 2,847 2,766 -81General services 684 860 720 -140Government superannuation benefits 5,834 6,208 6,457 249Total general public services 33,642 25,169 24,605 -564Defence 22,113 24,612 23,790 -822Public order and safetyCourts and legal services 1,089 1,063 1,021 -42Other public order and safety 3,280 3,518 3,422 -96Total public order and safety 4,368 4,580 4,443 -138EducationHigher education 8,970 9,133 9,078 -55Vocational and other education 1,760 1,823 1,823 0Schools 13,531 14,664 14,706 42
Non-government schools 8,741 9,417 9,474 57Government schools 4,790 5,247 5,232 -15
School education - specific funding 965 928 886 -42Student assistance 4,157 4,403 4,372 -30General administration 286 251 235 -16Total education 29,669 31,202 31,101 -101HealthMedical services and benefits 26,360 28,195 27,768 -427Pharmaceutical benefits and services 10,351 10,607 10,322 -286Assistance to the States for public hospitals 13,841 15,459 15,466 7Hospital services 3,004 2,019 2,007 -12Health services 6,571 6,796 6,335 -461General administration 3,100 3,220 3,103 -117Aboriginal and Torres Strait Islander health 756 740 695 -45Total health 63,983 67,037 65,696 -1,341

Appendix A: Expenses by function and sub-function
80
Table A1: Australian Government general government sector expenses by function and sub-function (continued)
2013-14 2014-15 2014-15 Change onOutcome Estimate at Outcome 2015-16
2015-16 BudgetBudget
$m $m $m $mSocial security and welfareAssistance to the aged 54,587 57,637 57,506 -131Assistance to veterans and dependants 6,950 6,790 6,865 75Assistance to people with disabilities 25,839 27,724 27,465 -259Assistance to families with children 36,352 38,808 38,080 -728Assistance to the unemployed and
the sick 10,050 10,810 10,728 -83Other welfare programmes 1,190 1,527 1,441 -86Assistance for Indigenous Australians nec 1,691 2,148 2,102 -46General administration 3,907 3,662 3,601 -62Total social security and welfare 140,566 149,107 147,787 -1,320Housing and community amenitiesHousing 3,221 3,348 3,269 -79Urban and regional development 620 734 679 -55Environment protection 4,515 858 887 30Total housing and community
amenities 8,355 4,940 4,835 -105Recreation and cultureBroadcasting 1,526 1,538 1,555 18Arts and cultural heritage 1,236 1,187 1,175 -13Sport and recreation 511 404 401 -3National estate and parks 476 390 402 12Total recreation and culture 3,749 3,520 3,534 14
Fuel and energy 6,749 6,986 6,799 -187Agriculture, forestry and fishingWool industry 56 55 61 5Grains industry 164 219 197 -22Dairy industry 53 55 57 2Cattle, sheep and pig industry 194 200 205 5Fishing, horticulture and other agriculture 261 298 276 -22General assistance not allocated to
specific industries 26 26 27 1Rural assistance 127 199 142 -57Natural resources development 869 1,011 848 -162General administration 634 669 599 -70Total agriculture, forestry and fishing 2,385 2,731 2,411 -321Mining, manufacturing and construction 3,451 3,218 3,550 332Transport and communicationCommunication 701 643 636 -8Rail transport 1,648 740 724 -16Air transport 208 210 205 -5Road transport 5,305 4,214 4,207 -6Sea transport 335 351 345 -6Other transport and communication 211 345 315 -30Total transport and communication 8,407 6,504 6,433 -71

Appendix A: Expenses by function and sub-function
81
Table A1: Australian Government general government sector expenses by function and sub-function (continued)
2013-14 2014-15 2014-15 Change onOutcome Estimate at Outcome 2015-16
2015-16 BudgetBudget
$m $m $m $mOther economic affairsTourism and area promotion 188 172 186 14Total labour and employment affairs 3,879 3,903 3,673 -231
Vocational and industry training 1,625 1,446 1,288 -159Labour market assistance to job seekers
and industry 1,568 1,694 1,573 -121Industrial relations 686 763 811 49
Immigration 4,404 4,459 4,036 -422Other economic affairs nec 2,367 2,146 2,151 5Total other economic affairs 10,838 10,680 10,046 -634
Other purposesPublic debt interest 13,414 14,468 14,491 23
Interest on Australian Government's behalf 13,414 14,468 14,491 23Nominal superannuation interest 8,214 8,989 8,999 10General purpose inter-government
transactions 53,563 57,467 58,859 1,392General revenue assistance -
States and Territories 52,391 55,178 55,425 247Local government assistance 1,173 2,289 3,433 1,144
Natural disaster relief 377 36 522 486Contingency reserve 0 -911 0 911Total other purposes 75,568 80,049 82,871 2,821Total expenses 413,845 420,335 417,898 -2,437


83
APPENDIX B: HISTORICAL AUSTRALIAN GOVERNMENT DATA
This appendix reports historical data for the Australian Government fiscal aggregates across the general government, public non-financial corporations and non-financial public sectors.
DATA SOURCES
Data are sourced from Australian Government Final Budget Outcomes, the Australian Bureau of Statistics (ABS), the Australian Office of Financial Management (AOFM) and Australian Government Consolidated Financial Statements.
• Accrual data from 1996-97 onwards and cash data, net debt data, net financial worth data and net worth data from 1999-2000 onwards are sourced from Australian Government Final Budget Outcomes. Back-casting adjustments for accounting classification changes and other revisions have been made from 1998-99 onwards where applicable.
• Cash data prior to 1999-2000 are sourced from ABS data, which have been calculated using methodology consistent with that used for later years in ABS cat. no. 5512.0 Government Finance Statistics.
• Net debt data prior to 1999-2000 are from ABS cat. no. 5512.0 Government Finance Statistics 2003-04 in 1998-99, ABS cat. no. 5501.0 Government Financial Estimates 1999-2000 and ABS cat. no. 5513.0 Public Sector Financial Assets and Liabilities 1998 in 1987-88 to 1997-98, and Treasury estimates (see Treasury’s Economic Roundup, Spring 1996, pages 97-103) prior to 1987-88.
COMPARABILITY OF DATA ACROSS YEARS
The data set contains a number of structural breaks owing to accounting classification differences and changes to the structure of the budget which cannot be eliminated through back-casting because of data limitations. These breaks can affect the comparability of data across years, especially when the analysis is taken over a large number of years. Specific factors causing structural breaks include:
• from 2005-06 onwards, underlying Government Finance Statistics (GFS) data are provided by agencies in accordance with Australian Accounting Standards (AAS) which includes International Financial Reporting Standards (IFRS) as adopted in Australia. Prior to 2005-06, underlying GFS data are based on data provided by agencies applying AAS prior to the adoption of IFRS;

Appendix B: Historical Australian Government Data
84
• most recent accounting classification changes that require revisions to the historical series have been back-cast (where applicable) to 1998-99, ensuring that data are consistent across the accrual period from 1998-99 onwards. However, because of data limitations, these changes have not been back-cast to earlier years;
• prior to 1999-2000, Australian Government general government sector debt instruments are valued at historic cost, whereas from 1999-2000 onwards they are valued at market prices (consistent with accrual GFS standards). This affects net debt and net interest payments;
• cash data up to and including 1997-98 are calculated under a cash accounting framework, while cash data from 1998-99 onwards are derived from an accrual accounting framework.1 Although the major methodological differences associated with the move to the accrual framework have been eliminated through back-casting, comparisons across the break may still be affected by changes to some data sources and collection methodologies;
• adjustments in the coverage of agencies included in the accounts of the different sectors. These include the reclassification of Central Banking Authorities from the general government to the public financial corporations sector in 1998-99, and subsequent back-casting to account for this change;
• changes in arrangements for transfer payments, where tax concessions or rebates have been replaced by payments through the social security system. This has the effect of increasing both cash receipts and payments, as compared with earlier periods, but not changing cash balances. Changes in the opposite direction (tax expenditures replacing payments) reduce both cash payments and receipts; and
• classification differences in the data relating to the period prior to 1976-77 (which means that earlier data may not be entirely consistent with data for 1976-77 onwards).
REVISIONS TO PREVIOUSLY PUBLISHED DATA
Under the accrual GFS framework and generally under AAS, flows are recorded in the period in which they occurred. As a result, prior period outcomes may be revised for classification changes relating to information that could reasonably have been expected to be known in the past, is material in at least one of the affected periods, and can be reliably assigned to the relevant period(s).
1 Prior to the 2008-09 Budget, cash data calculated under the cash accounting framework were used up to and including 1998-99. In the 2008-09 Budget, cash data prior to 1998-99 have been replaced by ABS data derived from the accrual framework.

Appendix B: Historical Australian Government Data
85
Table B1: Australian Government general government sector receipts, payments, net Future Fund earnings and underlying cash balance(a)
Net FutureFund
earningsPer cent
Per cent real growthPer cent real growth (NFGDP Per cent Per cent
$m of GDP $m (CPI) deflator)(e) of GDP $m $m of GDP1970-71 8,290 20.6 7,389 na na 18.3 - 901 2.21971-72 9,135 20.5 8,249 4.1 4.7 18.6 - 886 2.01972-73 9,735 19.6 9,388 7.7 7.8 18.9 - 348 0.71973-74 12,228 20.3 11,078 4.2 3.6 18.4 - 1,150 1.91974-75 15,643 22.0 15,463 19.9 14.6 21.7 - 181 0.31975-76 18,727 22.5 20,225 15.7 13.5 24.3 - -1,499 -1.81976-77 21,890 22.8 23,157 0.6 1.9 24.1 - -1,266 -1.31977-78 24,019 22.9 26,057 2.7 3.3 24.9 - -2,037 -1.91978-79 26,129 22.1 28,272 0.3 2.7 23.9 - -2,142 -1.81979-80 30,321 22.6 31,642 1.5 2.1 23.6 - -1,322 -1.01980-81 35,993 23.7 36,176 4.6 3.6 23.8 - -184 -0.11981-82 41,499 23.6 41,151 2.9 0.5 23.4 - 348 0.21982-83 45,463 24.0 48,810 6.3 6.2 25.8 - -3,348 -1.81983-84 49,981 23.4 56,990 9.4 9.6 26.7 - -7,008 -3.31984-85 58,817 25.0 64,853 9.1 9.0 27.6 - -6,037 -2.61985-86 66,206 25.4 71,328 1.5 3.6 27.4 - -5,122 -2.01986-87 74,724 26.1 77,158 -1.1 0.7 27.0 - -2,434 -0.91987-88 83,491 25.8 82,039 -0.9 0.1 25.3 - 1,452 0.41988-89 90,748 24.7 85,326 -3.1 -4.4 23.2 - 5,421 1.51989-90 98,625 24.4 92,684 0.6 1.7 22.9 - 5,942 1.51990-91 100,227 24.2 100,665 3.1 3.7 24.3 - -438 -0.11991-92 95,840 22.7 108,472 5.7 5.9 25.6 - -12,631 -3.01992-93 97,633 22.0 115,751 5.6 5.9 26.1 - -18,118 -4.11993-94 103,824 22.2 122,009 3.5 4.4 26.1 - -18,185 -3.91994-95 113,458 22.9 127,619 1.4 2.5 25.7 - -14,160 -2.91995-96 124,429 23.5 135,538 1.9 3.2 25.6 - -11,109 -2.11996-97 133,592 24.0 139,689 1.7 1.5 25.1 - -6,099 -1.11997-98 140,736 23.9 140,587 0.6 -0.7 23.9 - 149 0.01998-99 152,063 24.5 148,175 4.1 4.9 23.9 - 3,889 0.61999-00 166,199 25.2 153,192 1.0 0.8 23.2 - 13,007 2.02000-01 182,996 25.9 177,123 9.1 10.8 25.1 - 5,872 0.82001-02 187,588 24.9 188,655 3.5 4.1 25.0 - -1,067 -0.12002-03 204,613 25.5 197,243 1.4 1.4 24.6 - 7,370 0.92003-04 217,775 25.3 209,785 3.9 2.6 24.3 - 7,990 0.92004-05 235,984 25.6 222,407 3.5 2.0 24.1 - 13,577 1.52005-06 255,943 25.6 240,136 4.6 2.6 24.1 51 15,757 1.62006-07 272,637 25.1 253,321 2.5 0.5 23.3 2,127 17,190 1.62007-08 294,917 25.0 271,843 3.8 2.7 23.1 3,319 19,754 1.72008-09 292,600 23.3 316,046 12.7 10.4 25.1 3,566 -27,013 -2.12009-10 284,662 22.0 336,900 4.2 5.5 26.0 2,256 -54,494 -4.2
Underlyingcash
balance(d)Receipts(b) Payments(c)

Appendix B: Historical Australian Government Data
86
Table B1: Australian Government general government sector receipts, payments, net Future Fund earnings and underlying cash balance(a) (continued)
Net FutureFund
earningsPer cent
Per cent real growthPer cent real growth (NFGDP Per cent Per cent
$m of GDP $m (CPI) deflator)(e) of GDP $m $m of GDP2010-11 302,024 21.5 346,102 -0.4 -3.2 24.6 3,385 -47,463 -3.42011-12 329,874 22.2 371,032 4.8 5.2 24.9 2,203 -43,360 -2.92012-13 351,052 23.1 367,204 -3.2 -0.6 24.1 2,682 -18,834 -1.22013-14 360,322 22.8 406,430 7.8 9.1 25.7 2,348 -48,456 -3.12014-15 378,301 23.5 412,079 -0.3 2.0 25.6 4,089 -37,867 -2.4
Receipts(b) Payments(c) balance(d)
Underlyingcash
(a) Data have been revised in the 2014-15 Final Budget Outcome to improve accuracy and comparability
through time. (b) Receipts are equal to cash receipts from operating activities and sales of non-financial assets. (c) Payments are equal to cash payments for operating activities, purchases of non-financial assets and net
acquisition of assets under finance leases. (d) Underlying cash balance is equal to receipts less payments, less net Future Fund earnings. For the
purposes of consistent comparison with years prior to 2005-06, net Future Fund earnings should be added back to the underlying cash balance.
(e) Real spending growth is calculated using the Consumer Price Index as the deflator. Real spending growth using non-farm GDP deflator is included for comparative purposes only.

Appendix B: Historical Australian Government Data
87
Table B2: Australian Government general government sector net cash flows from investments in financial assets for policy purposes and headline cash balance(a)
Receipts PaymentsPer cent Per cent
$m $m $m of GDP $m of GDP1970-71 8,290 7,389 -851 -2.1 50 0.11971-72 9,135 8,249 -987 -2.2 -101 -0.21972-73 9,735 9,388 -977 -2.0 -629 -1.31973-74 12,228 11,078 -1,275 -2.1 -125 -0.21974-75 15,643 15,463 -2,648 -3.7 -2,467 -3.51975-76 18,727 20,225 -2,040 -2.5 -3,539 -4.31976-77 21,890 23,157 -1,530 -1.6 -2,796 -2.91977-78 24,019 26,057 -1,324 -1.3 -3,361 -3.21978-79 26,129 28,272 -1,074 -0.9 -3,216 -2.71979-80 30,321 31,642 -702 -0.5 -2,024 -1.51980-81 35,993 36,176 -962 -0.6 -1,146 -0.81981-82 41,499 41,151 -1,008 -0.6 -660 -0.41982-83 45,463 48,810 -1,363 -0.7 -4,711 -2.51983-84 49,981 56,990 -1,136 -0.5 -8,144 -3.81984-85 58,817 64,853 -922 -0.4 -6,959 -3.01985-86 66,206 71,328 -810 -0.3 -5,932 -2.31986-87 74,724 77,158 -545 -0.2 -2,979 -1.01987-88 83,491 82,039 657 0.2 2,109 0.71988-89 90,748 85,326 168 0.0 5,589 1.51989-90 98,625 92,684 1,217 0.3 7,159 1.81990-91 100,227 100,665 1,563 0.4 1,125 0.31991-92 95,840 108,472 2,156 0.5 -10,475 -2.51992-93 97,633 115,751 2,471 0.6 -15,647 -3.51993-94 103,824 122,009 3,447 0.7 -14,738 -3.21994-95 113,458 127,619 1,546 0.3 -12,614 -2.51995-96 124,429 135,538 5,188 1.0 -5,921 -1.11996-97 133,592 139,689 7,241 1.3 1,142 0.21997-98 140,736 140,587 15,154 2.6 15,303 2.61998-99 152,063 148,175 6,948 1.1 10,837 1.71999-00 166,199 153,192 9,500 1.4 22,507 3.42000-01 182,996 177,123 5,673 0.8 11,545 1.62001-02 187,588 188,655 3,422 0.5 2,355 0.32002-03 204,613 197,243 -229 0.0 7,141 0.92003-04 217,775 209,785 -452 -0.1 7,538 0.92004-05 235,984 222,407 -1,139 -0.1 12,438 1.32005-06 255,943 240,136 -1,647 -0.2 14,160 1.42006-07 272,637 253,321 7,403 0.7 26,720 2.52007-08 294,917 271,843 5,108 0.4 28,181 2.42008-09 292,600 316,046 -7,889 -0.6 -31,336 -2.52009-10 284,662 336,900 -4,278 -0.3 -56,516 -4.4
Net cash flowsfrom investments in
balance(c)cash financial assets for
policy purposes(b)
Headline

Appendix B: Historical Australian Government Data
88
Table B2: Australian Government general government sector net cash flows from investments in financial assets for policy purposes and headline cash balance(a) (continued)
Receipts PaymentsPer cent Per cent
$m $m $m of GDP $m of GDP2010-11 302,024 346,102 -7,028 -0.5 -51,106 -3.62011-12 329,874 371,032 -5,866 -0.4 -47,023 -3.22012-13 351,052 367,204 -4,802 -0.3 -20,954 -1.42013-14 360,322 406,430 -6,371 -0.4 -52,479 -3.32014-15 378,301 412,079 -5,158 -0.3 -38,936 -2.4
policy purposes(b) balance(c)
Net cash flowsfrom investments in Headline financial assets for cash
(a) Data have been revised in the 2014-15 Final Budget Outcome to improve accuracy and comparability
through time. (b) Prior to 1999-2000, net cash flows from investments in financial assets for policy purposes were referred
to as ‘net advances’. A negative number reflects a cash outflow, while a positive number reflects a cash inflow.
(c) Headline cash balance is equal to receipts less payments, plus net cash flows from investments in financial assets for policy purposes. Receipts and payments are identical to Table B1.

Appendix B: Historical Australian Government Data
89
Table B3: Australian Government general government sector call on resources(a)
Per cent Per cent Per cent$m of GDP $m of GDP $m of GDP
1970-71 8,290 20.6 50 0.1 8,240 20.41971-72 9,135 20.5 -101 -0.2 9,236 20.81972-73 9,735 19.6 -629 -1.3 10,364 20.81973-74 12,228 20.3 -125 -0.2 12,353 20.51974-75 15,643 22.0 -2,467 -3.5 18,110 25.51975-76 18,727 22.5 -3,539 -4.3 22,266 26.81976-77 21,890 22.8 -2,796 -2.9 24,686 25.71977-78 24,019 22.9 -3,361 -3.2 27,380 26.11978-79 26,129 22.1 -3,216 -2.7 29,345 24.81979-80 30,321 22.6 -2,024 -1.5 32,345 24.11980-81 35,993 23.7 -1,146 -0.8 37,139 24.41981-82 41,499 23.6 -660 -0.4 42,159 24.01982-83 45,463 24.0 -4,711 -2.5 50,174 26.51983-84 49,981 23.4 -8,144 -3.8 58,125 27.21984-85 58,817 25.0 -6,959 -3.0 65,776 28.01985-86 66,206 25.4 -5,932 -2.3 72,138 27.71986-87 74,724 26.1 -2,979 -1.0 77,703 27.21987-88 83,491 25.8 2,109 0.7 81,382 25.11988-89 90,748 24.7 5,589 1.5 85,159 23.21989-90 98,625 24.4 7,159 1.8 91,466 22.61990-91 100,227 24.2 1,125 0.3 99,102 23.91991-92 95,840 22.7 -10,475 -2.5 106,315 25.11992-93 97,633 22.0 -15,647 -3.5 113,280 25.51993-94 103,824 22.2 -14,738 -3.2 118,562 25.41994-95 113,458 22.9 -12,614 -2.5 126,072 25.41995-96 124,429 23.5 -5,921 -1.1 130,350 24.61996-97 133,592 24.0 1,142 0.2 132,450 23.81997-98 140,736 23.9 15,303 2.6 125,433 21.31998-99 152,063 24.5 10,837 1.7 141,226 22.81999-00 166,199 25.2 22,507 3.4 143,692 21.72000-01 182,996 25.9 11,545 1.6 171,451 24.32001-02 187,588 24.9 2,355 0.3 185,233 24.62002-03 204,613 25.5 7,141 0.9 197,472 24.72003-04 217,775 25.3 7,538 0.9 210,237 24.42004-05 235,984 25.6 12,438 1.3 223,546 24.22005-06 255,943 25.6 14,160 1.4 241,783 24.22006-07 272,637 25.1 26,720 2.5 245,918 22.62007-08 294,917 25.0 28,181 2.4 266,735 22.62008-09 292,600 23.3 -31,336 -2.5 323,935 25.72009-10 284,662 22.0 -56,516 -4.4 341,178 26.3
Receipts(b) balance(c) resources(d)
Headlinecash Call on

Appendix B: Historical Australian Government Data
90
Table B3: Australian Government general government sector call on resources(a) (continued)
Per cent Per cent Per cent$m of GDP $m of GDP $m of GDP
2010-11 302,024 21.5 -51,106 -3.6 353,130 25.12011-12 329,874 22.2 -47,023 -3.2 376,898 25.32012-13 351,052 23.1 -20,954 -1.4 372,006 24.52013-14 360,322 22.8 -52,479 -3.3 412,801 26.12014-15 378,301 23.5 -38,936 -2.4 417,237 25.9
Receipts(b) balance(c) resources(d)
Headlinecash Call on
(a) Data have been revised in the 2014-15 Final Budget Outcome to improve accuracy and comparability
through time. (b) Receipts are identical to those in Table B1. (c) Headline cash balance is equal to receipts less payments, plus net cash flows from investments in
financial assets for policy purposes. Headline cash balance is identical to those in Table B2. (d) Call on resources is equal to receipts less headline cash balance. The call on resources series provides
a measure of the aggregate level of receipts (both tax and non-tax) and borrowings required to fund government activities.

Appendix B: Historical Australian Government Data
91
Table B4: Australian Government general government sector taxation receipts, non-taxation receipts and total receipts(a)
Per cent Per cent Per cent$m of GDP $m of GDP $m of GDP
1970-71 7,193 17.9 1,097 2.7 8,290 20.61971-72 7,895 17.8 1,240 2.8 9,135 20.51972-73 8,411 16.9 1,324 2.7 9,735 19.61973-74 10,832 18.0 1,396 2.3 12,228 20.31974-75 14,141 19.9 1,502 2.1 15,643 22.01975-76 16,920 20.3 1,807 2.2 18,727 22.51976-77 19,714 20.5 2,176 2.3 21,890 22.81977-78 21,428 20.4 2,591 2.5 24,019 22.91978-79 23,409 19.8 2,720 2.3 26,129 22.11979-80 27,473 20.5 2,848 2.1 30,321 22.61980-81 32,641 21.5 3,352 2.2 35,993 23.71981-82 37,880 21.6 3,619 2.1 41,499 23.61982-83 41,025 21.7 4,438 2.3 45,463 24.01983-84 44,849 21.0 5,132 2.4 49,981 23.41984-85 52,970 22.5 5,847 2.5 58,817 25.01985-86 58,841 22.6 7,365 2.8 66,206 25.41986-87 66,467 23.3 8,257 2.9 74,724 26.11987-88 75,076 23.2 8,415 2.6 83,491 25.81988-89 83,452 22.7 7,296 2.0 90,748 24.71989-90 90,773 22.5 7,852 1.9 98,625 24.41990-91 92,739 22.4 7,488 1.8 100,227 24.21991-92 87,364 20.7 8,476 2.0 95,840 22.71992-93 88,760 20.0 8,873 2.0 97,633 22.01993-94 93,362 20.0 10,462 2.2 103,824 22.21994-95 104,921 21.2 8,537 1.7 113,458 22.91995-96 115,700 21.9 8,729 1.6 124,429 23.51996-97 124,559 22.4 9,033 1.6 133,592 24.01997-98 130,984 22.2 9,752 1.7 140,736 23.91998-99 138,420 22.3 13,643 2.2 152,063 24.51999-00 151,313 22.9 14,887 2.3 166,199 25.22000-01 170,354 24.2 12,641 1.8 182,996 25.92001-02 175,108 23.2 12,481 1.7 187,588 24.92002-03 192,131 24.0 12,482 1.6 204,613 25.52003-04 206,091 23.9 11,683 1.4 217,775 25.32004-05 223,314 24.2 12,669 1.4 235,984 25.62005-06 241,215 24.2 14,728 1.5 255,943 25.62006-07 257,392 23.7 15,245 1.4 272,637 25.12007-08 278,376 23.6 16,540 1.4 294,917 25.02008-09 272,627 21.7 19,973 1.6 292,600 23.32009-10 260,973 20.1 23,689 1.8 284,662 22.0
Taxation receipts Non-taxation receipts Total receipts(b)

Appendix B: Historical Australian Government Data
92
Table B4: Australian Government general government sector taxation receipts, non-taxation receipts and total receipts(a) (continued)
Per cent Per cent Per cent$m of GDP $m of GDP $m of GDP
2010-11 280,839 19.9 21,185 1.5 302,024 21.52011-12 309,943 20.8 19,931 1.3 329,874 22.22012-13 326,426 21.5 24,627 1.6 351,052 23.12013-14 338,368 21.4 21,954 1.4 360,322 22.82014-15 351,675 21.8 26,626 1.7 378,301 23.5
Taxation receipts Non-taxation receipts Total receipts(b)
(a) Data have been revised in the 2014-15 Final Budget Outcome to improve accuracy and comparability
through time. (b) Receipts are equal to cash receipts from operating activities and sales of non-financial assets. Receipts
are identical to Table B1.

Appendix B: Historical Australian Government Data
93
Table B5: Australian Government general government sector net debt and net interest payments(a)
Per cent Per cent$m of GDP $m of GDP
1970-71 344 0.9 -189 -0.51971-72 -496 -1.1 -245 -0.61972-73 -790 -1.6 -252 -0.51973-74 -1,851 -3.1 -286 -0.51974-75 -1,901 -2.7 -242 -0.31975-76 -341 -0.4 -330 -0.41976-77 898 0.9 -62 -0.11977-78 2,896 2.8 4 0.01978-79 4,983 4.2 254 0.21979-80 6,244 4.6 440 0.31980-81 6,356 4.2 620 0.41981-82 5,919 3.4 680 0.41982-83 9,151 4.8 896 0.51983-84 16,015 7.5 1,621 0.81984-85 21,896 9.3 2,813 1.21985-86 26,889 10.3 3,952 1.51986-87 29,136 10.2 4,762 1.71987-88 27,344 8.4 4,503 1.41988-89 21,981 6.0 4,475 1.21989-90 16,123 4.0 4,549 1.11990-91 16,915 4.1 3,636 0.91991-92 31,041 7.3 3,810 0.91992-93 55,218 12.4 3,986 0.91993-94 70,223 15.0 5,628 1.21994-95 83,492 16.8 7,292 1.51995-96 95,831 18.1 8,861 1.71996-97 96,281 17.3 9,489 1.71997-98 82,935 14.1 8,279 1.41998-99 72,065 11.6 8,649 1.41999-00 53,869 8.2 7,514 1.12000-01 42,719 6.1 6,195 0.92001-02 38,180 5.1 5,352 0.72002-03 29,047 3.6 3,758 0.52003-04 22,639 2.6 3,040 0.42004-05 10,741 1.2 2,502 0.32005-06 -4,531 -0.5 2,303 0.22006-07 -29,150 -2.7 228 0.02007-08 -44,820 -3.8 -1,015 -0.12008-09 -16,148 -1.3 -1,196 -0.12009-10 42,283 3.3 2,386 0.2
Net debt(b) Net interest payments(c)

Appendix B: Historical Australian Government Data
94
Table B5: Australian Government general government sector net debt and net interest payments(a) (continued)
Per cent Per cent$m of GDP $m of GDP
2010-11 84,551 6.0 4,608 0.32011-12 147,334 9.9 6,609 0.42012-13 152,982 10.1 8,285 0.52013-14 202,463 12.8 10,843 0.72014-15 238,721 14.8 10,868 0.7
Net debt(b) Net interest payments(c)
(a) Data have been revised in the 2014-15 Final Budget Outcome to improve accuracy and comparability
through time. (b) Net debt is equal to the sum of deposits held, government securities, loans and other borrowing,
minus the sum of cash and deposits, advances paid and investments, loans and placements. (c) Net interest payments are equal to the difference between interest paid and interest receipts.

Appendix B: Historical Australian Government Data
95
Table B6: Australian Government general government sector face value of Commonwealth Government Securities (CGS) on issue and interest paid(a)
End of year Per cent End of year Per cent Per cent$m of GDP $m of GDP $m of GDP
1970-71 10,887 27.0 - - 580 1.41971-72 11,490 25.8 - - 614 1.41972-73 12,217 24.6 - - 675 1.41973-74 12,809 21.3 - - 712 1.21974-75 14,785 20.8 - - 893 1.31975-76 17,940 21.6 - - 1,001 1.21976-77 20,845 21.7 - - 1,485 1.51977-78 23,957 22.9 - - 1,740 1.71978-79 28,120 23.7 - - 2,080 1.81979-80 29,321 21.8 - - 2,356 1.81980-81 30,189 19.9 - - 2,723 1.81981-82 31,060 17.7 - - 3,058 1.71982-83 37,071 19.6 - - 3,580 1.91983-84 45,437 21.3 - - 4,558 2.11984-85 54,420 23.2 - - 5,952 2.51985-86 63,089 24.2 - - 7,394 2.81986-87 67,172 23.5 - - 8,339 2.91987-88 62,794 19.4 - - 8,139 2.51988-89 56,854 15.5 - - 8,222 2.21989-90 48,399 12.0 - - 8,064 2.01990-91 48,723 11.7 - - 6,994 1.71991-92 58,826 13.9 - - 6,819 1.61992-93 76,509 17.2 - - 6,487 1.51993-94 90,889 19.5 - - 7,709 1.71994-95 105,466 21.3 - - 9,144 1.81995-96 110,166 20.8 - - 10,325 2.01996-97 111,067 20.0 - - 10,653 1.91997-98 93,664 15.9 - - 9,453 1.61998-99 85,331 13.8 - - 9,299 1.51999-00 75,536 11.4 - - 8,509 1.32000-01 66,403 9.4 - - 7,335 1.02001-02 63,004 8.4 - - 6,270 0.82002-03 57,435 7.2 - - 4,740 0.62003-04 54,750 6.4 - - 4,096 0.52004-05 55,151 6.0 - - 3,902 0.42005-06 54,070 5.4 - - 4,628 0.52006-07 53,264 4.9 - - 3,959 0.42007-08 55,442 4.7 - - 3,754 0.32008-09 101,147 8.0 95,103 7.6 3,970 0.32009-10 147,133 11.4 141,806 10.9 6,411 0.5
Total CGS on issue(b) Interest paid(d)Face value of CGS on issue
Subject to Treasurer's direction(c)

Appendix B: Historical Australian Government Data
96
Table B6: Australian Government general government sector face value of Commonwealth Government Securities (CGS) on issue and interest paid(a) (continued)
End of year Per cent End of year Per cent Per cent$m of GDP $m of GDP $m of GDP
2010-11 191,292 13.6 186,704 13.3 9,551 0.72011-12 233,976 15.7 229,389 15.4 10,875 0.72012-13 257,378 16.9 252,791 16.6 11,846 0.82013-14 319,481 20.2 316,952 20.0 13,972 0.92014-15 368,738 22.9 366,202 22.7 13,924 0.9
Face value of CGS on issueTotal CGS on issue(b) Subject to Treasurer's direction(c) Interest paid(d)
(a) Data have been revised in the 2014-15 Final Budget Outcome to improve accuracy and comparability
through time. (b) Total CGS on issue includes CGS held on behalf of the States and the Northern Territory, but excludes
Commonwealth holdings of CGS. (c) The face value of CGS subject to the Treasurer’s Direction excludes the stock and securities outlined in
subsection 51JA(2A) of the Commonwealth Inscribed Stock Act 1911. These are the same stock and securities that were excluded from the previous legislative debt limit. CGS on issue subject to the Treasurer’s Direction are not available prior to 2008-09 because the limit was first introduced in July 2008.
(d) Interest paid consists of all cash interest payments of the general government sector, including those relating to CGS on issue.

97
Appendix B: H
istorical Australian G
overnment D
ata
Table B7: Australian Government general government sector revenue, expenses, net capital investment and fiscal balance(a)
Per cent Per cent Per cent Per cent $m of GDP $m of GDP $m of GDP $m of GDP
1996-97 141,688 25.5 145,821 26.2 90 0.0 -4,223 -0.81997-98 146,820 24.9 148,652 25.2 147 0.0 -1,979 -0.31998-99 152,106 24.5 146,772 23.7 1,433 0.2 3,901 0.61999-00 167,304 25.3 155,558 23.5 -69 0.0 11,815 1.82000-01 186,106 26.4 180,090 25.5 8 0.0 6,007 0.92001-02 190,432 25.3 192,984 25.6 382 0.1 -2,935 -0.42002-03 206,778 25.8 201,113 25.1 287 0.0 5,377 0.72003-04 222,042 25.8 215,235 25.0 660 0.1 6,148 0.72004-05 242,354 26.3 229,092 24.8 1,034 0.1 12,228 1.32005-06 260,569 26.1 241,665 24.2 2,498 0.3 16,406 1.62006-07 277,895 25.6 258,761 23.8 2,333 0.2 16,801 1.52007-08 303,402 25.7 279,862 23.7 2,593 0.2 20,948 1.82008-09 298,508 23.7 324,188 25.8 4,064 0.3 -29,743 -2.42009-10 292,387 22.6 339,829 26.2 6,433 0.5 -53,875 -4.22010-11 309,204 22.0 355,667 25.3 5,297 0.4 -51,760 -3.72011-12 337,324 22.7 377,220 25.4 4,850 0.3 -44,746 -3.02012-13 359,496 23.6 381,980 25.1 987 0.1 -23,472 -1.52013-14 374,151 23.7 414,047 26.2 3,850 0.2 -43,746 -2.82014-15 380,746 23.6 417,898 25.9 2,706 0.2 -39,857 -2.5
Revenue Expenses Net capital investment Fiscal balance(b)
(a) Data have been revised in the 2014-15 Final Budget Outcome to improve accuracy and comparability through time. (b) Fiscal balance is equal to revenue less expenses less net capital investment.

Appendix B: Historical Australian Government Data
98
Table B8: Australian Government general government sector net worth and net financial worth(a)
Per cent Per cent $m of GDP $m of GDP
1999-00 -7,046 -1.1 -67,036 -10.12000-01 -6,618 -0.9 -71,876 -10.22001-02 -11,655 -1.5 -78,032 -10.42002-03 -15,330 -1.9 -82,931 -10.42003-04 -1,152 -0.1 -72,389 -8.42004-05 14,556 1.6 -58,882 -6.42005-06 17,971 1.8 -59,763 -6.02006-07 46,351 4.3 -35,696 -3.32007-08 70,859 6.0 -14,690 -1.22008-09 19,427 1.5 -71,490 -5.72009-10 -45,938 -3.5 -144,485 -11.22010-11 -95,386 -6.8 -198,787 -14.12011-12 -247,208 -16.6 -355,834 -23.92012-13 -202,650 -13.3 -312,724 -20.62013-14 -256,045 -16.2 -370,331 -23.42014-15 -302,350 -18.8 -421,129 -26.1
Net financial worth(c)Net worth(b)
(a) Data have been revised in the 2014-15 Final Budget Outcome to improve accuracy and comparability
through time. (b) Net worth is equal to total assets less total liabilities. (c) Net financial worth is equal to financial assets less total liabilities.
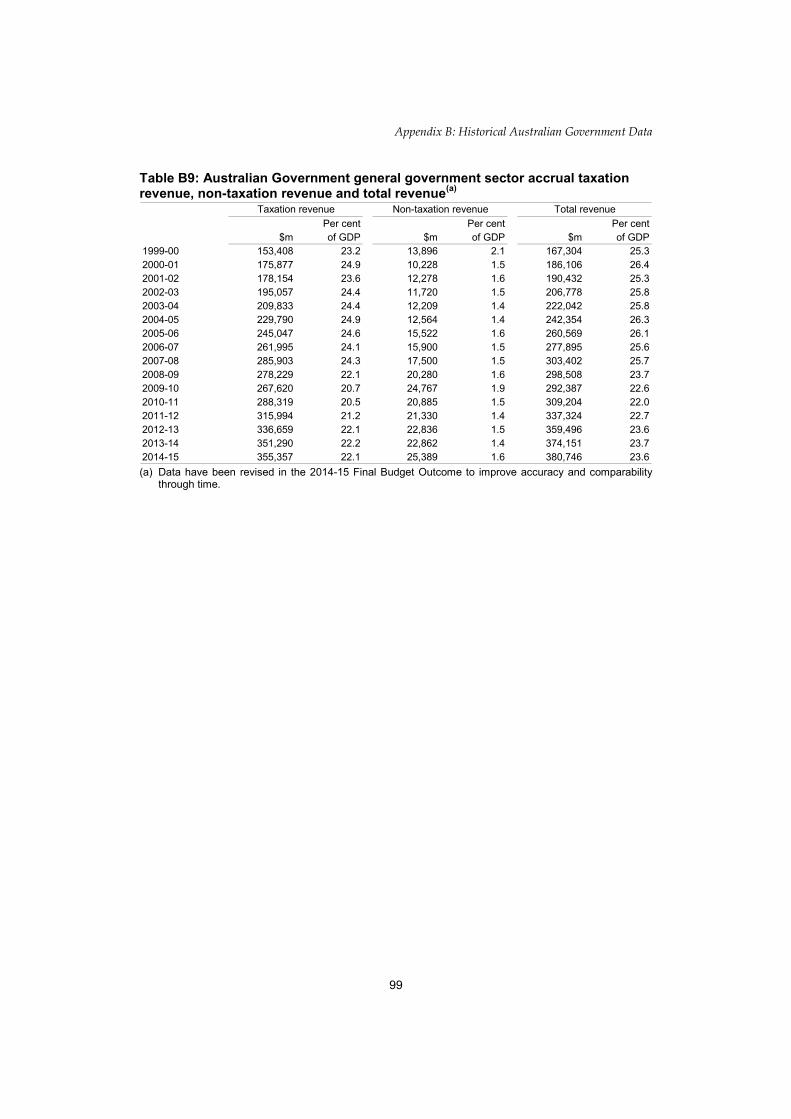
Appendix B: Historical Australian Government Data
99
Table B9: Australian Government general government sector accrual taxation revenue, non-taxation revenue and total revenue(a)
Per cent Per cent Per cent$m of GDP $m of GDP $m of GDP
1999-00 153,408 23.2 13,896 2.1 167,304 25.32000-01 175,877 24.9 10,228 1.5 186,106 26.42001-02 178,154 23.6 12,278 1.6 190,432 25.32002-03 195,057 24.4 11,720 1.5 206,778 25.82003-04 209,833 24.4 12,209 1.4 222,042 25.82004-05 229,790 24.9 12,564 1.4 242,354 26.32005-06 245,047 24.6 15,522 1.6 260,569 26.12006-07 261,995 24.1 15,900 1.5 277,895 25.62007-08 285,903 24.3 17,500 1.5 303,402 25.72008-09 278,229 22.1 20,280 1.6 298,508 23.72009-10 267,620 20.7 24,767 1.9 292,387 22.62010-11 288,319 20.5 20,885 1.5 309,204 22.02011-12 315,994 21.2 21,330 1.4 337,324 22.72012-13 336,659 22.1 22,836 1.5 359,496 23.62013-14 351,290 22.2 22,862 1.4 374,151 23.72014-15 355,357 22.1 25,389 1.6 380,746 23.6
Taxation revenue Non-taxation revenue Total revenue
(a) Data have been revised in the 2014-15 Final Budget Outcome to improve accuracy and comparability
through time.

100
Appendix B: H
istorical Australian G
overnment D
ata
Table B10: Australian Government cash receipts, payments and surplus by institutional sector ($m)(a)
Underlying cash Underlying cashReceipts(b) Payments(c) balance(d) Receipts(b) Payments(c) Cash surplus(d) Receipts(b) Payments(c) balance(d)
1988-89 90,748 85,326 5,421 4,177 6,035 257 93,923 90,312 5,6781989-90 98,625 92,684 5,942 3,926 11,322 -5,261 101,495 102,883 6811990-91 100,227 100,665 -438 4,804 9,351 -2,139 103,837 108,808 -2,5771991-92 95,840 108,472 -12,631 3,899 7,713 101 97,937 114,369 -12,5301992-93 97,633 115,751 -18,118 4,385 7,819 -196 100,512 122,042 -18,3141993-94 103,824 122,009 -18,185 5,178 6,476 1,482 106,747 126,214 -16,7031994-95 113,458 127,619 -14,160 5,262 7,318 1,956 116,751 132,965 -12,2041995-96 124,429 135,538 -11,109 4,927 8,190 -527 126,593 140,963 -11,6361996-97 133,592 139,689 -6,099 4,782 7,373 473 135,259 143,948 -5,6261997-98 140,736 140,587 149 6,238 7,923 1,119 144,517 145,985 1,2681998-99 152,063 148,175 3,889 na na -353 na na 3,5361999-00 166,199 153,192 13,007 na na -2,594 na na 10,4132000-01 182,996 177,123 5,872 na na 391 na na 6,2642001-02 187,588 188,655 -1,067 na na 1,210 na na 1432002-03 204,613 197,243 7,370 27,386 26,105 1,280 na na 8,6502003-04 217,775 209,785 7,990 27,718 26,142 1,575 238,236 228,669 9,5642004-05 235,984 222,407 13,577 29,621 28,071 1,550 257,946 242,818 15,1282005-06 255,943 240,136 15,757 30,875 31,874 -999 278,254 263,445 14,7592006-07 272,637 253,321 17,190 16,882 18,641 -1,759 285,336 267,778 15,4312007-08 294,917 271,843 19,754 7,758 8,232 -473 300,503 277,903 19,2812008-09 292,600 316,046 -27,013 7,987 8,960 -973 297,421 321,841 -27,9862009-10 284,662 336,900 -54,494 8,419 9,341 -922 290,681 343,841 -55,4162010-11 302,024 346,102 -47,463 8,558 9,733 -1,175 308,258 353,511 -48,6382011-12 329,874 371,032 -43,360 8,845 10,847 -2,002 336,122 379,282 -45,3622012-13 351,052 367,204 -18,834 9,766 14,135 -4,369 358,088 378,609 -23,2032013-14 360,322 406,430 -48,456 11,042 16,322 -5,280 368,521 419,910 -53,7372014-15 378,301 412,079 -37,867 11,256 15,544 -4,288 386,643 424,709 -42,156
General government Public non-financial corporations Non-financial public sector
(a) Data have been revised in the 2014-15 Final Budget Outcome to improve accuracy and comparability through time. (b) Receipts are equal to receipts from operating activities and sales of non-financial assets. (c) Payments are equal to payments for operating activities, purchases of non-financial assets and net acquisition of assets under finance leases. (d) These items exclude net Future Fund earnings from 2005-06 onwards. Net Future Fund earnings are shown in Table B1. na Data not available.

101
Appendix B: H
istorical Australian G
overnment D
ata
Table B11: Australian Government accrual revenue, expenses and fiscal balance by institutional sector ($m)(a)
Fiscal Fiscal FiscalRevenue Expenses balance(b) Revenue Expenses balance(b) Revenue Expenses balance(b)
1996-97 141,688 145,821 -4,223 27,431 26,015 -331 na na -4,5541997-98 146,820 148,652 -1,979 29,618 26,999 2,360 na na 3871998-99 152,106 146,772 3,901 27,687 26,088 -816 175,891 168,958 3,0851999-00 167,304 155,558 11,815 25,485 23,542 1,062 188,841 175,152 11,7212000-01 186,106 180,090 6,007 25,869 24,762 -826 207,367 200,246 5,1812001-02 190,432 192,984 -2,935 26,638 25,341 793 212,462 213,718 -2,1422002-03 206,778 201,113 5,377 24,339 22,916 1,975 225,989 218,944 7,3112003-04 222,042 215,235 6,148 25,449 23,444 2,143 241,746 232,934 8,2912004-05 242,354 229,092 12,228 26,965 25,191 1,473 263,434 248,398 13,7002005-06 260,569 241,665 16,406 28,143 29,531 -2,442 281,927 264,410 13,9642006-07 277,895 258,761 16,801 15,443 16,360 -1,763 289,551 271,335 15,0382007-08 303,402 279,862 20,948 6,854 6,686 -584 308,888 285,179 20,3642008-09 298,508 324,188 -29,743 6,998 7,576 -1,495 303,309 329,566 -31,2382009-10 292,387 339,829 -53,875 7,288 7,297 -1,079 298,033 345,483 -54,9542010-11 309,204 355,667 -51,760 7,563 7,787 -1,446 315,001 361,689 -53,2052011-12 337,324 377,220 -44,746 8,046 8,238 -2,158 343,722 383,810 -46,9042012-13 359,496 381,980 -23,472 8,863 9,415 -4,189 366,642 389,678 -27,6612013-14 374,151 414,047 -43,746 9,537 11,127 -6,070 381,971 423,457 -49,8162014-15 380,746 417,898 -39,857 9,987 11,850 -4,856 389,011 428,025 -44,713
General government Public non-financial corporations Non-financial public sector
(a) Data have been revised in the 2014-15 Final Budget Outcome to improve accuracy and comparability through time. (b) Fiscal balance is equal to revenue less expenses less net capital investment. Net capital investment is not shown in this table. na Data not available


Attachm
ent B, Part 3: Australia's Federal R
elations Table 48: Other financial flows — estimated advances, repayment of advances and interest payments, 2014-15 $'000 NSW VIC QLD WA SA TAS ACT NT TotalAdvancesAsbestos Removal in the ACT - - - - - - 750,000 - 750,000Contingent liabilities
Natural disaster relief - - 7,037 - - - - - 7,037RepaymentsContingent liabilities
Natural disaster relief -21 - -8,233 - - - - - -8,254Environment
Northern Territory — water and sewerage assistance - - - - - - - -136 -136
HousingCommonwealth-State Housing
Agreement loans -37,096 - -9,920 -9,424 -2,463 -5,028 - -792 -64,723Housing for service personnel -1,503 - -915 -248 -52 - - - -2,718Other housing - - - - - - -7,755 -2,702 -10,457Payments to debt sinking funds -101 -1 - - - - - - -102
InfrastructureRailway projects - - - -1,251 - - - - -1,251Sewerage -7,703 - -1,919 - -1,037 - - - -10,659
Other purposesAustralian Capital Territory debt
repayments - - - - - - -555 - -555Loan Council — housing nominations -8,580 - -3,157 -5,473 -3,590 -2,301 - -2,856 -25,957

Attachm
ent B, Part 3: Australia's Federal R
elations Table 48: Other financial flows — estimated advances, repayment of advances and interest payments, 2014-15 (continued) $'000 NSW VIC QLD WA SA TAS ACT NT TotalInterestAsbestos Removal in the ACT - - - - - - -8,190 - -8,190Contingent liabilities
Loan to NSW to assist beneficiaries of theAsbestos Injuries Compensation Fund -1,943 - - - - - - - -1,943
Natural disaster relief -1,463 - -4,609 - - - - - -6,072Environment
Northern Territory — water and sewerage assistance - - - - - - - -555 -555
HousingCommonwealth-State Housing
Agreement loans -28,423 -2 -7,957 -7,583 -2,415 -3,856 - -1,188 -51,424Housing for service personnel -1,947 - -1,087 -200 -88 - - - -3,322Other housing - - - - - - -6,969 -2,918 -9,887
InfrastructureRailway projects - - - -77 - - - - -77Sewerage -534 - -157 - -185 - - - -876
Other purposesAustralian Capital Territory debt
repayments - - - - - - -836 - -836Loan Council — housing nominations -18,173 - -6,520 -11,137 -7,896 -4,808 - -6,362 -54,896
Net Financial Flow -107,487 -3 -37,437 -35,393 -17,726 -15,993 725,695 -17,509 494,147